an assessment of mexico’s payment for environmental...
TRANSCRIPT

An Assessment of Mexico’sPayment for Environmental Services Program
byJennifer Alix-Garcia, Alain de Janvry, Elisabeth Sadoulet
University of California at Berkeleyand
Juan Manuel Torres, CIDEwith the assistance of
Josefina Braña Varela and Maria Zorilla Ramos
Photo: Jaime Sáinz, 2005
August 2005

ii
This document was prepared for Randy Stringer, at the Comparative Studies ServiceAgricultural and Development Economics Division, United Nations Food and AgricultureOrganization (FAO). The work was coordinated by Alain de Janvry and Elisabeth Sadoulet,professors at the Department of Agricultural and Resource Economics, University of Californiaat Berkeley and by Juan M. Torres professor at Centre for Research and Teaching of Economics,Mexico. Most of the research was done by Jennifer Alix-Garcia at UC Berkeley. The PoliticalEconomy Section is largely based on the contribution by Josefina Braña Varela and MariaZorilla Ramos. Field work for the study cases was coordinated by Jaime Sainz, Adán Martínezand Josefina Braña.

An Assessment of Mexico’s Payment for Environmental Services Program
i
CURRENCY AND EQUIVALENTS
All amounts are expressed in US dollars
(Base year 2004)
ACRONYMS AND ABREVIATIONS
CCT Conditional Cash TransferCIDE Centre for Research and Education in EconomicsCNA National Commission on WaterCO2 Carbon dioxideCOLPOS Postgraduate CollegeCONAFOR National Forestry CommissionCONANP National Commission of Protected AreasCONAPO National Population CouncilENNAF National Survey of Forest CommunitiesFFM Mexican Forest FundFIA International Automotive FederationGIS Geographical Information SystemIMTA Mexican Institute of Water TechnologyINE National Ecology InstituteINEGI National Institute of Geography, Statistics and Information SystemsNAFTA North American Free Trade AgreementNGO Non Government OrganizationPAN National Action Party (political party)PEA Department of Policy and Environmental Economics (INE)PES Payments for Environmental ServicesPET Program for Temporal EmploymentPMSEM Program for the Sustainable Management of Mountain EcosystemsPROCAMPO Program for the support of the CountrysidePROCEDE Program for the Certification of Ejido Land Property RightsPROCYMAF Program for Sustainable Forest Conservation and ManagementPRODEFOR Program for Forest DevelopmentPRODEPLAN Program for the Development of Commercial Forest PlantationsPRONARE National Program of ReforestationSEDESOL Secretariat of Social DevelopmentSEMARNAP Secretariat for the Environment, Natural Resources, and Fisheries
(1995-2000)SEMARNAT Secretariat for the Environment, Natural ResourcesSHCP Secretariat of Hacienda and Public CreditUC University of CaliforniaUCF Cooperation and Financing UnitUIA Iberoamerican UniversityWDR World Development Report

An Assessment of Mexico’s Payment for Environmental Services Program
ii
Table of contents
Page
I. Introduction ................................................................................................................. 1
II. Deforestation in Mexico and the environmental services crisis ....................................... 3
a. Forests and deforestation in Mexico........................................................................... 3
b. Priority environmental services provided by forests .................................................... 9
c. Putting PES in context ........................................................................................... 12
i. Liberating “win-win” solutions ............................................................................ 12
ii. Local markets for environmental services ............................................................ 14
d. Summary................................................................................................................ 15
III. The evolution of Mexico’s PES program for hydrological services .............................. 17
a. December 2000 – February 2002 ............................................................................. 18
b. March 2003 – September 2003 ............................................................................... 21
c. October 2003 to the present ................................................................................... 25
d. Summary................................................................................................................ 30
IV. Results of implementation, 2003-2004 ..................................................................... 32
a. Summary statistics for participating communities..................................................... 32
b. Case Studies ........................................................................................................... 42
i. Descriptives......................................................................................................... 43
ii. Forest activities before and after receiving payments............................................ 45
iii. Payment distribution and changes in community dynamics ................................. 49
iv. Other case study findings ................................................................................... 53
v. Summary of the case studies ................................................................................ 54
V. Putting the Mexican Experience into Perspective: A Conceptual Framework ............... 56
a. Policymaker-Intermediate Service Provider Relations................................................ 58
b. Intermediate-Final Service Provider Relations .......................................................... 59
c. Client-Service Provider............................................................................................ 62
d. Relationships within Final Service Providing Groups............................................... 63
e. Summary ................................................................................................................ 64
VI. Learning from the Mexican Experience .................................................................... 65

An Assessment of Mexico’s Payment for Environmental Services Program
iii
a. Lessons in political economy .................................................................................. 65
i. Lessons at the policymaker level .......................................................................... 65
ii. Choice of Implementing Agency......................................................................... 66
iii. Intermediate provider service-provider contracts ................................................ 67
iv. Within community contracts.............................................................................. 68
v. Give voice to water service providers................................................................... 69
b. Financing lessons.................................................................................................... 70
i. Sustainability of the funding source...................................................................... 70
ii. Guarantee long-term funding ............................................................................. 70
iii. Use bankable certificates .................................................................................... 71
c. Targeting lessons .................................................................................................... 72
i. Target public goods important within national boundaries ..................................... 72
ii. Take into account risk of service loss .................................................................. 72
iii. Avoid fragmentation .......................................................................................... 74
iv. Allow for payments outside of forest conservation .............................................. 74
VI. Concluding remarks.................................................................................................. 75
VII. References .............................................................................................................. 78

An Assessment of Mexico’s Payment for Environmental Services Program
iv
TablesPage
Table 1. Change in forest cover by forest type from 1993-2000 ................................. 4
Table 2. Contrasting ejidos with and without extractive permits................................. 7
Table 3. Changes in the Targeting Strategy.............................................................. 29
Table 4. Evolution of the PES Program. .................................................................. 31
Table 5. Distribution of PES contracts by state, 2003............................................... 32
Table 6. Physical characteristics of participating ejidos............................................ 34
Table 7. Distribution of payment recipients by aquifer type, 2003 and 2004 ............ 35
Table 8. Comparison of forest types enrolled in PES, 2003 and 2004....................... 36
Table 9. Sources of pressure on forests in participating communities. ...................... 37
Table 10. Distribution of deforestation risk in participant communities...................... 37
Table 11. Description of participants ......................................................................... 38
Table 12. Marginalization and PES payments............................................................ 39
Table 13. Description of participating ejidos in case studies ...................................... 44
Table 14. Summary of results from case studies ........................................................ 46
Table 15. Effects of Payments on Participation and Collective Decision Making ....... 50
FiguresPage
Figure 1. Mexican forest cover, 2000. ......................................................................... 3
Figure 2. Deforestation in Ejidos and Comunidades, 1994-2000. ................................ 6
Figure 3. Major aquifers and cloud forests in Mexico................................................ 10
Figure 4. Forested areas and overexploited aquifers. ................................................. 11
Figure 5. Chain of events from 2001-2002. ............................................................... 21
Figure 6. Distribution of ejidos receiving PES payments, 2003. ................................ 33
Figure 7. Marginality and PES payments, 2003......................................................... 40
Figure 8. Basic accountability schematics ................................................................. 56
Figure 9. Accountability schematic for PES, Mexico. ............................................... 57

An Assessment of Mexico’s Payment for Environmental Services Program
I. Introduction
Programs of payments for environmental services (PES) are becoming, throughout the
world, an increasingly popular way of creating, conserving, and restoring natural resources that
provide public benefits. These programs encompass a variety of strategies, including payments
for the continued existence of a forest, for the planting of native species on fallowed land, or for
working-lands projects that include agroforestry components. Though the term “payments for
environmental services” is relatively new, such programs have been in existence for quite some
time. The Nature Conservancy pioneered one types of PES strategy, having purchased 116
million acres around the world since 1951 (Nature Conservancy, 2003). In the United States, the
water supply of New York City is partially guaranteed by the subsidized conservation efforts of
working farmers in the watershed which feeds the metropolis, an effort which began in the
1980s.
In recent years, such programs have increasingly been introduced by developing
countries, with one of the earliest efforts occurring in Costa Rica in 1997, and pilot programs
mushrooming throughout Latin America and Asia (World Bank, 2005). In 2002, more than 300
such schemes were inventoried (Mayrand and Paquin, 2004). Despite the increasing number of
such projects, there is a scarcity of rigorous studies analyzing their effectiveness in providing
environmental services and their impacts on the people and communities receiving the
payments. This report intends to partially address this gap by presenting an analysis of the first
two years of the Mexican PES program for hydrological services, which began in 2003, where
payments are made to individuals and communities as incentives to preserve existing forests.
Although the program has not been in place long enough to truly assess results in terms of
forest conserved, sufficient time has passed to extract various lessons from both the political
process which led to the program as well as the impact of the payments on recipient
communities, and, to some extent, on their forest management behavior.
The following pages will outline the evolution of the Mexican PES program from the
original proposal through the first two years of the program’s implementation. The first section
will provide background information on deforestation and potential environmental services in
Mexico. Section 2 presents a political economy analysis of the tortuous path the program
traveled through Mexico’s legislative and administrative structures. The third section focuses on

An Assessment of Mexico’s Payment for Environmental Services Program
2
the recipients of the pilot program, including results from a survey of participants as well as in-
depth community case studies. Section 4 which puts the Mexican PES experience in a
conceptual framework focused on accountability mechanisms between different actors in the
process of the provision of environmental services. Based upon this framework, we then extract
in section 5 lessons from the Mexican experience, including possible alternative program designs
to address some of the problems encountered in its implementation.

An Assessment of Mexico’s Payment for Environmental Services Program
3
II. Deforestation in Mexico and the environmental services crisis
a. Forests and deforestation in Mexico
According to the National Forest Commission (CONAFOR), forests and areas with
natural vegetation (including arid and semi-arid environments) cover 72% of the Mexican
territory (CONAFOR, 2001). Mexico is among the most biologically diverse countries in the
world, with first place in reptilian diversity, third in bird, and fourth in mammal diversity. Its
plant diversity exceeds that of the United States and Canada combined. The area in temperate
and tropical forests (covering over 50% of the country), as measured by the 2000 Forest
Inventory, is shown in Figure 1. It demonstrates that forests are widely distributed across the
Mexican territory, and thus an issue of concern for a large number of municipalities.
Figure 1. Mexican forest cover, 2000.
Source: National Forest Inventory, SEMARNAT

An Assessment of Mexico’s Payment for Environmental Services Program
4
These biological riches and the hydrological services associated with forests are threatened
by deforestation which has reduced the extension of forests by fifty percent over the past five
decades. Velásquez et al. (2003) estimate the overall deforestation rate at 1.3 percent per year, a
rate which, if it continues, would eliminate all forests in the country within a century. This
deforestation is not uniformly distributed across forest types or geographic regions. Table 1
shows the distribution of deforestation across forest types between 1994 and 2000, with an
overall average annual rate of 1.2%. The category of temperate forest includes pine, oak, and
cloud forests, while tropical forests include a variety of rainforest and dry tropical forest types.
Clearly, deforestation in tropical forests is progressing at a much faster rate, 2.4 % per year, than
in temperate forests, 1.2 % per year, and in scrub forests, 0.6% per year (Table 1).
Table 1. Change in forest cover by forest type from 1993-2000
Forest type Km2 in 1994 Km2 in 2000Average annual rate of
changeTemperate forests 352,969 328,471 -1.2Tropical forests 356,228 308,001 -2.4Scrub forests 578,841 558,077 -0.6All forests 1,288,038 1,194,549 -1.2
Source: Velásquez et al, 2003.
About 5 percent of Mexico’s remaining forest is located in the National System of
Protected Areas (SINAP). Durán Medina, Velásquez, and Mas (2004) show that some of these
forests in fact exhibit higher deforestation rates than those managed for wood extraction.
According to these authors, forest loss on this land is at least partially due to the fact that SINAP
is underfunded.
Private owners control around 15 to 20 percent of the forest, depending on the estimate.
Although some quantity of forest conversion clearly results from forest fires and pest damage, as
in the large fires of 1998, the main cause of deforestation is the economic return from
agricultural, pastoral, and extractive activities relative to that of conservation and sustainable
harvesting of forest stocks. As forest cover decreased between 1994 and 2000, pasture lands
increased at a rate of 4.6% per year, while agricultural lands increased by 2%. A study by Muñoz
et al. (2004) showed that the main correlates for deforestation nationwide were proximity to
cities and rural population centers, low slope, and soils appropriate for agriculture. This suggests
that the driving force behind deforestation is the relative profitability of agricultural and pastoral
activities versus forest.
An Assessment of Mexico’s Payment for Environmental Services Program
5
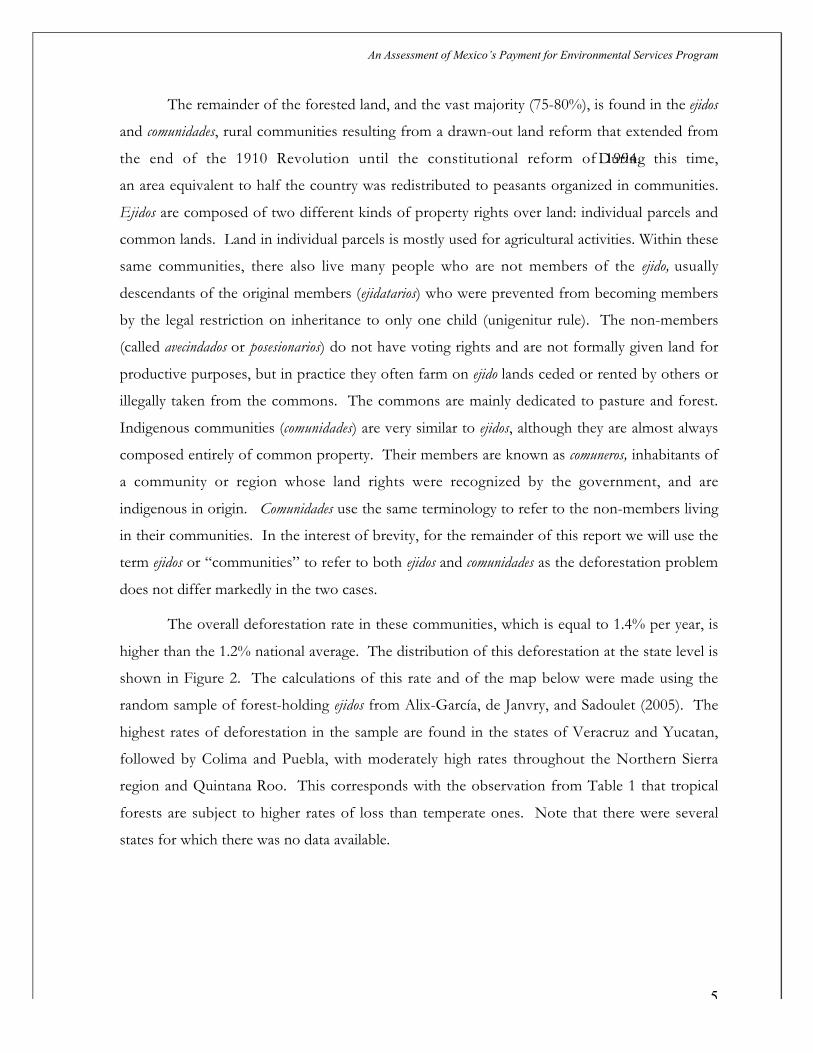
The remainder of the forested land, and the vast majority (75-80%), is found in the ejidos
and comunidades, rural communities resulting from a drawn-out land reform that extended from
the end of the 1910 Revolution until the constitutional reform of 1994. During this time,
an area equivalent to half the country was redistributed to peasants organized in communities.
Ejidos are composed of two different kinds of property rights over land: individual parcels and
common lands. Land in individual parcels is mostly used for agricultural activities. Within these
same communities, there also live many people who are not members of the ejido, usually
descendants of the original members (ejidatarios) who were prevented from becoming members
by the legal restriction on inheritance to only one child (unigenitur rule). The non-members
(called avecindados or posesionarios) do not have voting rights and are not formally given land for
productive purposes, but in practice they often farm on ejido lands ceded or rented by others or
illegally taken from the commons. The commons are mainly dedicated to pasture and forest.
Indigenous communities (comunidades) are very similar to ejidos, although they are almost always
composed entirely of common property. Their members are known as comuneros, inhabitants of
a community or region whose land rights were recognized by the government, and are
indigenous in origin. Comunidades use the same terminology to refer to the non-members living
in their communities. In the interest of brevity, for the remainder of this report we will use the
term ejidos or “communities” to refer to both ejidos and comunidades as the deforestation problem
does not differ markedly in the two cases.
The overall deforestation rate in these communities, which is equal to 1.4% per year, is
higher than the 1.2% national average. The distribution of this deforestation at the state level is
shown in Figure 2. The calculations of this rate and of the map below were made using the
random sample of forest-holding ejidos from Alix-García, de Janvry, and Sadoulet (2005). The
highest rates of deforestation in the sample are found in the states of Veracruz and Yucatan,
followed by Colima and Puebla, with moderately high rates throughout the Northern Sierra
region and Quintana Roo. This corresponds with the observation from Table 1 that tropical
forests are subject to higher rates of loss than temperate ones. Note that there were several
states for which there was no data available.

An Assessment of Mexico’s Payment for Environmental Services Program
6
Figure 2. Deforestation in Ejidos and Comunidades, 1994-2000.
Source: National Forestry Inventories and ENNAF 2002
Although the deforestation decision in ejidos is clearly affected by the correlates mentioned
above, the common property element creates additional complications in their deforestation
dynamics. In a recent study of forest loss based on a random sample of 450 ejidos, Alix-García,
de Janvry and Sadoulet (2005) found that there are two different types of community behaviors
that lead to deforestation within these communities. This is due to the fact that only a small
subset of the ejidos, between 25 and 30% of those with forest, hold permits which allow them to
extract wood for sale. Table 2 shows a surprising difference between these two types of ejidos –
those with permits have much higher overall deforestation as well as much higher deforestation
per member than those without permit where deforestation is unregulated. This statistic is
important because it gives us insight into the causes of deforestation across communities.
Although ejidos with extractive permits make up only 16 percent of the sample in the study, they
account for 34 percent of the overall forest loss over the period. This suggests two conclusions.

An Assessment of Mexico’s Payment for Environmental Services Program
7
First, special efforts need to be made to address excessive forest loss in communities whose
forest is managed under the permit system; and second, policies for permit versus non-permit
forest communities need to be differentiated as the causes of deforestation are quite different.
Table 2. Contrasting ejidos with and without extractive permits.
DeforestationWithoutpermits
Withpermits
Forest loss in 1993-2000 (ha)
Forest loss per ejido member in 1990 (ha)
Share of total deforestation (%)
253
3.8
66
920
6.6
34
Source: 2002 survey of forest ejidos, Alix-Garcia et al. (2005).
For ejidos that choose not to have forestry exploitation, deforestation is largely related to
the ability of the community to induce as large a group of households as possible to cooperate in
not encroaching on the forest. The members of that coalition are more likely to be younger
households with sufficient private land, but not having exercised a leadership position. The
coalition is also larger in small ejidos with experienced leaders. Alix-García (2005) shows
suggestive evidence that use of the common property forest in these types of communities is
also associated with household members having larger cattle herds. Conversations with farmers
reveal that cattle are often used as an insurance policy, and statistically, larger cattle herds are
associated with households with secondary education and those receiving remittances – both
possible sources of outside income. This suggests that access to alternative savings and
insurance mechanisms might reduce the incentives to convert forest to pasture land.
When ejidos with non-members present in the community choose to extract wood under
the permit system, the main determinant of their deforestation rate is their choice of how to
divide up profits between dividends and public goods. Holding all else constant, a larger
investment in public goods helps reward non-members for not encroaching on the forest and
decreases forest loss per member. Simulations show that the incorporation of some of these
non-members as new members can help decrease deforestation.
In addition, the study shows that while communities that extract wood for profit would
deforest more even if they did not engage in this activity, were the non-extractive communities

An Assessment of Mexico’s Payment for Environmental Services Program
8
to begin such projects, they would have significantly higher deforestation per member. This
implies that forestry projects, as they now exist in Mexico, are contributing to the deforestation
problem because they are not sufficiently profitable relative to land use in agriculture and
pasture. Durán Medina et al. (2004) emphasize this issue, pointing out that even in communities
that are very interested in sustainable management of their forests, lack of access to good
technical assistance and poor administration of existing resources can lead to excessive
deforestation.
Work by Torres-Rojo et al. (2005) suggests a refinement of this analysis. The authors
find that among ejidos possessing permits, the rate of deforestation varies according to the extent
to which the forestry business is vertically integrated. Ejidos which are more integrated – that is
to say, sell already cut wood or own sawmills – have considerably lower deforestation rates than
those who sell standing trees and allow contractors to come into the community to harvest
them. This result is logical, as one would expect that communities that have made larger
investments in the business of extractive forestry would be more concerned with the
sustainability of their most important input.
Finally, 20% of the ejidos and comunidades surveyed in 2002 complained of the clandestine
removal of trees from their properties (Alix-Garcia, de Janvry and Sadoulet, 2004). This is
clearly a problem that combines the facts that the existing law is not being enforced (allowing a
market for such wood) with the lack of incentives and capacity of forest holding communities to
effectively monitor their land.

An Assessment of Mexico’s Payment for Environmental Services Program
9
b. Priority environmental services provided by forests
Where and what are the environmental services provided by Mexican forests? It is
important to assess this potential, as this provides part of the benchmark by which we can
measure the effectiveness of the program. Forests provide a wide variety of ecosystem services,
including some which are attractive on the international market, like biodiversity maintenance
and carbon sequestration capacity. In designing its hydrological PES program, the Mexican
government has chosen to focus on a service which the forests provide strictly within its
national boundaries, which is broadly consistent with the idea that recipients of the services
should provide the source of funding for them. In particular, government officials are
concerned with the growing scarcity of water. According to the National Water Commission,
66% of the most important aquifers in Mexico are overexploited, with an average extraction
190% above the replacement rate (Muñoz et al, 2005). Although the relationship between forest
cover and water flows is highly debated, there is clearly a positive effect of forests on water
quality, if not always on quantity. For this reason, the original proposal for the PES program
focused on the watersheds defined as overexploited, as well as on cloud forests which are
thought to have a particularly strong relationship with water quantity (García Coll, I., 2002).
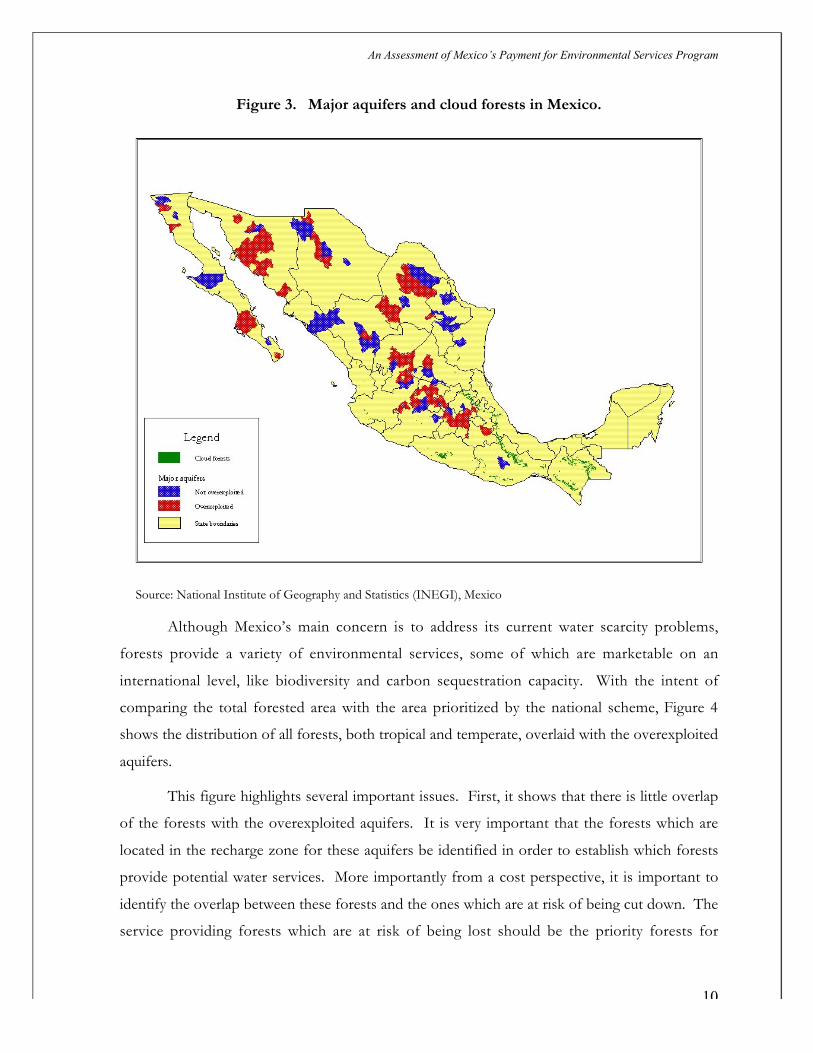
It is estimated that 18.69% of the area of Mexico is covered by the aquifers that have
been categorized as overexploited. However, of the population that lives in these areas, 28.7% is
located in .09% of the aquifer area defined as very high or extremely high overexploitation.
Around 17,000 hectares of cloud forest, or about 3 percent of the total forest, are found in
Mexico, all of them in the central and southern zones of the country. As Figure 3 shows, the
distribution of these areas is highly regionalized, with major concentrations of overexploited
watersheds in the central and northern areas of the country and the bulk of cloud forests in the
states of Oaxaca and Chiapas.
An Assessment of Mexico’s Payment for Environmental Services Program
10
Figure 3. Major aquifers and cloud forests in Mexico.
Source: National Institute of Geography and Statistics (INEGI), Mexico
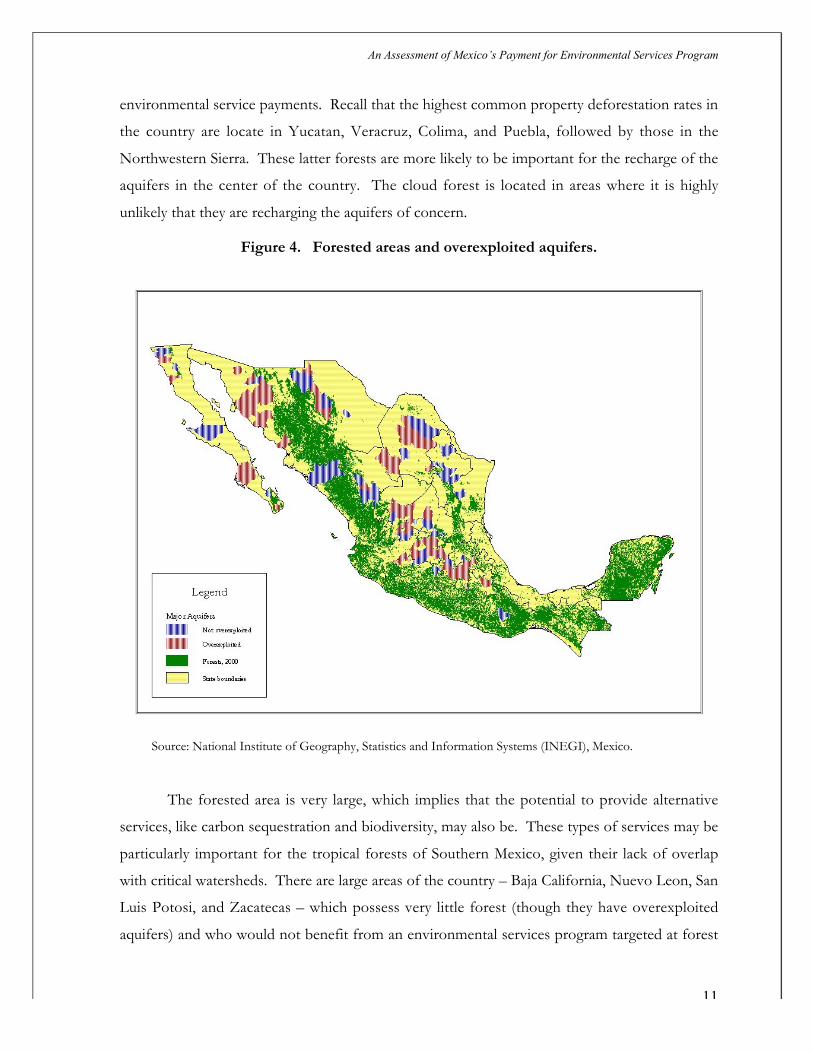
Although Mexico’s main concern is to address its current water scarcity problems,
forests provide a variety of environmental services, some of which are marketable on an
international level, like biodiversity and carbon sequestration capacity. With the intent of
comparing the total forested area with the area prioritized by the national scheme, Figure 4
shows the distribution of all forests, both tropical and temperate, overlaid with the overexploited
aquifers.
This figure highlights several important issues. First, it shows that there is little overlap
of the forests with the overexploited aquifers. It is very important that the forests which are
located in the recharge zone for these aquifers be identified in order to establish which forests
provide potential water services. More importantly from a cost perspective, it is important to
identify the overlap between these forests and the ones which are at risk of being cut down. The
service providing forests which are at risk of being lost should be the priority forests for
An Assessment of Mexico’s Payment for Environmental Services Program
11
environmental service payments. Recall that the highest common property deforestation rates in
the country are locate in Yucatan, Veracruz, Colima, and Puebla, followed by those in the
Northwestern Sierra. These latter forests are more likely to be important for the recharge of the
aquifers in the center of the country. The cloud forest is located in areas where it is highly
unlikely that they are recharging the aquifers of concern.
Figure 4. Forested areas and overexploited aquifers.
Source: National Institute of Geography, Statistics and Information Systems (INEGI), Mexico.
The forested area is very large, which implies that the potential to provide alternative
services, like carbon sequestration and biodiversity, may also be. These types of services may be
particularly important for the tropical forests of Southern Mexico, given their lack of overlap
with critical watersheds. There are large areas of the country – Baja California, Nuevo Leon, San
Luis Potosi, and Zacatecas – which possess very little forest (though they have overexploited
aquifers) and who would not benefit from an environmental services program targeted at forest

An Assessment of Mexico’s Payment for Environmental Services Program
12
conservation, a fact which may eventually be important if funding is to continue being allocated
to forest service programs from the federal budget. It seems that the current water-focused
priority of the environmental services program in Mexico can only justify payments to very
specific, and perhaps not very large, tracts of forest. It is also possible that such payments may
not in fact be the most efficient way to affect these threatened aquifers. However, the large
tracts of remaining forest may still house benefits for which it is worth paying, including
improving local water quality, reducing soil erosion, maintaining biodiversity, and improving air
quality.
c. Putting PES in context
Whichever environmental services are being considered, there is a clear consensus on a
national and international level that the rate of deforestation in Mexico is too high relative to the
“social optimum” and that this deforestation results in the loss of important environmental
services related to forest cover. The current policy of choice is a national level program of
payment for environmental services financed through Federal fiscal revenues, and this program
is the subject of this report. However, there is a sense in which this should be the last step in a
series of policies to conserve environmental services. In the interest of providing a context for
the current program, we briefly turn our attention to two less expensive interim policies that
could be effective initial steps in addressing deforestation: liberating “win-win” solutions and
local environmental services agreements.
i. Liberating “win-win” solutions
Liberating “win-wins” implies addressing existing inefficiencies within the agencies
responsible for forest regulation and within other agencies whose policies may indirectly
encourage forest misuse. They are “win-wins” because they encourage forest conservation and
are aligned with private incentives. This requires analyzing current policies and assessing
whether they help or hinder deforestation. For example, is the forest permit system so unwieldy
that it creates an inordinately high transactions cost, pushing forest owners into illegality? For
example, in the state of Oaxaca, only 27 percent of the communities with forestry potential

An Assessment of Mexico’s Payment for Environmental Services Program
13
possess permits to extract and sell trees (Antinori et al, 2004). Why is it that so few of these
communities have actually obtained permits?
Although it is difficult to clearly identify all of the sources of forest loss, particularly
illegal ones, as was mentioned earlier, about 20% of the forest-holding ejidos sampled in 2002
stated that they had experienced theft of trees from their land. An effective policy to address
this activity could do much to slow down deforestation in Mexico. It is also important to keep
in mind that tree-stealing is a symptom of some larger incentive problem, usually associated with
ill defined and inadequately enforced property rights, a problem that still affects many ejidos in
spite of efforts at clarifying property rights through the PROCEDE1 program.
Even within the realm of legal forest management, it would appear that there is room for
improvement. In ejidos that extract wood for profit, around 36% do not actively reforest after
logging in spite of the investment made in obtaining a permit. Among those that reforest, the
average survival rate of hectares reforested is only around 58%. In many cases, natural
regeneration is sufficient to replace the harvested trees. However, the correlation between lack
of reforestation effort and deforestation at the ejido level is –0.05, suggesting that higher
deforestation is associated with not reforesting post-harvest. On the other hand, the correlation
between hectares successfully reforested and deforestation is also negative (-0.09), which implies
that improvements in the quality of the reforestation effort are also necessary to reduce net
deforestation. It is important to note that these correlations may also reflect the forest
management skills or the ability of the community to cooperate rather than the actual impact of
reforestation activities on forest loss. If this is the case, there may be a large return to offering
forest management training services to these communities.
We currently have no way of telling if forestry ejidos are exceeding their permit levels,
although there is anecdotal evidence that permits are, indeed, enforced. In fact, Antinori et al.
(2004) find that 67% of the ejidos with permits for forest extraction do not extract even up to
their permit level. We also do not know if permits issued correspond to the optimal policy for
managing a forest. What we can tell is that the process of forest management within the permit
system is far from systematic and that technicians in some regions are insufficiently engaged in
that process. We can thus conclude that introducing more uniformity in technical assistance and
1 The PROCEDE (Programa de Certificación de Derechos Ejidales) program was designed to clarify and recordcommunity’s land property rights.

An Assessment of Mexico’s Payment for Environmental Services Program
14
rules for forest management, monitoring harvest and post-harvest activities, and enforcing
measures to avoid illegal wood sales could do much to reduce forest loss, expectedly at a lower
cost than compensating through PES for ill-devised or ill-applied policies.
ii. Local markets for environmental services
The second option to reducing deforestation without a federally funded PES program is
to look for self-sustaining markets for environmental services at the local level. There is at least
one case of this type of exchange in Mexico related to forestry: in the coastal state of Veracruz,
lowland communities are paying those higher up in the watershed to conserve the remaining
forest cover (SEMARNAT, 2003). There are surely more opportunities for this sort of local
trade, particularly through the existing regional water districts. Many environmental externalities,
especially water-related ones, are highly localized within specific watersheds. Unless
coordination problems across states are extremely difficult, it makes sense to have a watershed-
specific transfer to pay for these services. Payments for well-defined local services are also easier
to administer than a nationwide program and less exposed to discontinuities in the federal policy
process.
Another small-scale environmental services market that is quite active in some places is
international. Many environmentalists in industrialized countries perceive and are willing to pay
for the international negative externalities of the loss of carbon sequestration capacity and
biodiversity. The Nature Conservancy has long been a purchaser of lands for environmental
services in other countries, and even Formula One race car events in the US are now buying
amounts of forest corresponding to the quantity that would be needed to mitigate the CO2
emissions of their activities (FIA, 2003).
Once all of the ‘win-wins’ are taken advantage of and the localized environmental
services markets are active, there remain two options for conserving the environmental services
still at risk: coercion and incentives. A nationwide PES program falls in the latter category.
Mandating conservation by law (and enforcing that mandate) can be just as effective as a
payment scheme for forest conservation. However, the legality of coercion depends on property
rights, and it may be quite costly to enforce both monetarily and politically. When services are
An Assessment of Mexico’s Payment for Environmental Services Program
15
provided freely by legal owners of the resource, putting into place a payments system based on
fiscal revenues can be effective.
The remainder of this report focuses on this final option, first describing the origins and
evolution of the policy through the Mexican political process, then using case studies and
summary statistics to describe the experiences of recipient communities, and finally extracting
lessons that might be applied to PES programs in similar contexts. We end this section with a
brief summary before beginning the political story.
d. Summary
This section has given an overview of the distribution of potential environmental
services provided by forests in Mexico as well as providing some background on the risk that
these services might be compromised by deforestation. More than answering questions, this
section has served to highlight many areas where further information is required. In particular,
the forests providing key water services that are at risk of being lost need to be identified. If we
follow through the logic of a federal program being the last step in a series of policy options, one
could further reduce the need to give payments to these forests at risk by reforming the forest
service to reduce illegal harvesting and increase the quality of technical assistance given to those
communities already operating extractive forestry operations. In addition, one need not give
payments for forests where downstream beneficiaries can clearly be identified and contracts
easily made between the beneficiaries and forest holders.
When we consider the spatial distribution of forests, cloud forests, and priority
watersheds, it appears that the cloud forests do not have much overlap with important aquifer
recharge zones, and that there may be a considerable amount of forest that would not qualify as
“essential” for the provision of hydrological services. This does not mean, however, that these
forests provide no environmental services. Clearly, forests provide a range of environmental
services. In Mexico, the forests at highest risk of being lost – those located in tropical
ecosystems – provide important biodiversity preservation and carbon sequestration functions.
Biodiversity conservation is a service which can be valuable at a local and national level through
ecotourism, while carbon sequestration is valuable at the federal and global levels. Opening up
the discussion to different environmental services points the way to various sources of funding

An Assessment of Mexico’s Payment for Environmental Services Program
16
for forest conservation. However, for as long as the current PES program is aimed at preserving
and improving the provision of hydrological services, the low overlay between cloud forests,
other existing forests, and priority watersheds should be an issue of concern in assessing the
efficiency of the program.

An Assessment of Mexico’s Payment for Environmental Services Program
17
III. The evolution of Mexico’s PES program for hydrological services2
This section details the evolution of the PES program from the beginning of Vicente
Fox’s presidency in 2000 to the present, after two years of payments. The idea of payments for
environmental services did not begin in 2000, although the Fox administration was the first in
Mexico to propose a national level payment plan. Throughout the 1990s, small environmental
services projects cropped up in various parts of Mexico, ranging from the sale of carbon from
forests in Chiapas, to the certification of forestry projects in Oaxaca for water services, to
reforestation projects around Mexico City. In addition to these projects, several attempts were
made to link water services from forests to nearby cities, including proposed projects in
Durango and Puebla. Although these never came to fruition, they demonstrate a growing
awareness of the idea of environmental services throughout the early 90s.
Between 1995 and 2000, the federal government, in the context of international
agreements to contain global climate change, formed a working group composed of
representatives from various environmentally-related ministries in order to discuss issues related
to climate change. The participants in this group were all key actors in the environmental policy
arena, and much of their discussion surrounding water services and forest conservation during
this period set the scene for the current payment program. Subsequent to the meetings of this
group, the formation of an Environmental Services Unit within the Secretariat of the
Environment was proposed but never realized. The most tangible result of this early activity
around environmental services is a project which continues to support sustainable community
silviculture, known as PROCYMAF, a program designed by the World Bank and the Forestry
Division of SEMARNAP.
The pre-2000 environmental services activities set the stage for the program that is the
focus of this study. The political history of this program is told in three phases corresponding to
different stages of advancement (design versus implementation) and institutional roles (the
transfer of responsibility from research to implementation organizations).
2 This section is a summary of the analysis conducted by Josefina Braña Varela and María Zorilla Ramos.

An Assessment of Mexico’s Payment for Environmental Services Program
18
a. December 2000 – February 2002
As it assumed power, the Fox administration introduced substantial reforms to the
environmental policy-making arena. First, the responsibility for fisheries policy was removed
from the Secretariat for the Environment, Natural Resources, and Fisheries (SEMARNAP) and
transferred to the Secretariat of Agriculture. Within the new environmental secretariat
(SEMARNAT), a commission dedicated to unifying forestry and soil management policy was
created: the National Forestry Commission (CONAFOR). This Commission is responsible
from projects like PROCYMAF and others which provide support to commercially harvested
forests3. Alberto Cárdenas Jiménez, whose previous positions include municipal president of
Ciudad Guzman in the state of Jalisco and governor of that state, was named by Fox as the
general director of CONAFOR.
One of the first concrete accomplishments of CONAFOR was to create an
implementation plan for 2000-2006 under the umbrella of the Strategic Forestry Program, which
was first outlined in 2000 in a document resulting from an agreement between SEMARNAP, the
Inter-American Development Bank, and the Finnish government. The new version was entitled
“Strategic Forestry Program for Mexico 2025”. It is within this document that environmental
services were placed squarely on CONAFOR’s agenda, despite the fact that it did not yet have
any projects related to PES.
Victor Lichtinger, a non-partisan environmentalist and consultant who at one time was
the Mexican representative to the North American Commission for Environmental
Cooperation, headed SEMARNAT during this tumultuous period. Simultaneously, the
National Ecology Institute (INE) in SEMARNAT underwent an important restructuring which
eliminated its management functions and converted it into a research institute. Even though
CONAFOR had positioned itself to be a player in the environmental services game, the mandate
for developing a PES program was given directly to the Department of Policy and
Environmental Economics (PEA) of INE and to academics from the Iberoamerican University
(UIA).
3 The average annual investment for these programs (PROCYMAF, PRODEFOR, PRODEPLAN, PET andPRONARE) in the last 3 years has been close to US$52 Million.

An Assessment of Mexico’s Payment for Environmental Services Program
19
The early stages of the PES program were characterized by the direct control of the
proposal by SEMARNAT through PEA at INE. The initial idea was to target payments
towards areas of the country defined as “high” or “very high marginality” according to a
municipal marginality indicator based on information from the population census (CONAPO).
This poverty-environment approach in part reflected the sympathy of the of PEA’s director for
anti-poverty projects. In addition, and perhaps more importantly, this approach would allow to
involve in the program a more diverse set of funding agencies. Specifically, INE sought a
partnership with the Secretariat of Social Development (SEDESOL). However, this relationship
never came to fruition due to lack of interest on the part of SEDESOL. The INE also intended
to begin with a pilot program, which it hoped to have administered by an NGO or an academic
institution, before launching into a larger, nationwide payment scheme.
At this point, INE began research upon which they hoped to base the program. In
particular, they focused on previous experiences within Mexico, on programs in other countries,
and on a series of case studies conducted by INE together with the Iberoamerican University,
the Centre for Research and Education in Economics (CIDE), and the University of California
at Berkeley, which would provide an assessment of the possibility of establishing a PES program
in Mexico.
In October of 2002, the proposed pilot project was intended to last for two years and
was slated to begin in the spring of 2002 with the following features:
• The pilot would be the responsibility of a Subsecretariat of SEMARNAT.
• The project would be focused on water services, partly because SEMARNAT
had recently made great efforts to promote the conservation of forests and water
at the federal level and thought that it would be the environmental service for
which it would be the easiest to develop local markets. Hydrological services
were thought to be easy to finance at the municipal level, since fees could be
attached to existing water bills.
• The beneficiaries would be ejidos and comunidades with forests in “priority
watersheds”, meaning those which are both overexploited and serving as the
main water source for large population centers.

An Assessment of Mexico’s Payment for Environmental Services Program
20
• The selection of participants would take into account forest cover density, clear
property rights, different ecosystems, and relative levels of marginality.
In addition, INE would undertake a baseline survey detailing social, economic, and
environmental conditions that could later provide a reference point for the monitoring and
evaluation of the project, which would be the responsibility of the Mexican Institute of Water
Technology (IMTA) and CONAFOR, both in SEMARNAT. The pilot project was to include
100 ejidos with a proposed annual payment of $20 per hectare.
This proposal was presented to a Subsecretariat of SEMARNAT, entitled “Fomento y
Normatividad”, the directors of which initially allocated 2 million US$ intended to last two years
beginning in 2002. However, confronted with a budget cut to the Secretariat, the program
ended up without a budget for the following year. The lack of defense of the program may have
occurred for three reasons. First, the project was an initiative of INE, not of the Subsecretariat,
which was promoting its own very similar program – “Green PROCAMPO” – which would
subsidize farmers to take land out of production and implement soil conservation or
reforestation activities. Second, the US$2 million allocation was only for one year, which
implied that continuation of the program would require re-submission of the project and further
debate in order to renew its budget. Finally, the final project would not be the responsibility of
the Subsecretariat, which would only manage the pilot project. This gave the Subsecretariat very
little incentive to adopt the project as its own.
Given this lack of support, Secretary Lichtinger presented the project to Alberto
Cárdenas Jiménez, president of CONAFOR, who agreed to take responsibility for it and
operationalize it through CONAFOR’s Cooperation and Financing Unit (UCF). Cárdenas saw
the program as the fulfillment of CONAFOR’s objective of including environmental services in
its operations, very much in line with the involvement that the Commission already had in
several local environmental services initiatives. In addition, INE’s proposal targeted non-
commercial forests, a group which could allow CONAFOR to expand its sphere of influence
outside of its traditional constituency. Finally, it gave CONAFOR the opportunity to develop a
new program, rather than just managing programs created by the previous administration, and
there was certainly an expectation that the program would translate into an increase in the
organization’s budget. The sequence of events of this first stage are summarized in Figure 5
below:

An Assessment of Mexico’s Payment for Environmental Services Program
21
Figure 5. Chain of events from 2001-2002.
b. March 2003 – September 2003
This period begins with CONAFOR’s adoption of the PES program and ends with the
publication of the rules of operation in the Federal Registry, rules that govern the program
which is currently in process of implementation. Cárdenas immediately began to look for a way
to finance the proposal. INE, with technical support from UIA, CIDE, and UC Berkeley,
proposed to link the financing of the program directly to the services obtained, which, given the
focus on hydrological services, implied an additional payment on water use. The team
responsible for the program design proposed designating 2.5% of the annual water fees, which
for 2002 were around 200 million pesos ($20 Million), to finance projects in priority watersheds.
Water fees in Mexico are collected at the municipality level, even if the service provider is a
private company. Because the water is officially property of the nation state, the fees collected
are sent to the federal government, who then returns them back to the municipalities to invest in
infrastructure. The final objective of the program was to calculate a budget by watershed in

An Assessment of Mexico’s Payment for Environmental Services Program
22
order to link the benefits more closely to the costs. Unfortunately, this was impossible to do
with the existing data.
As part of the federal government, CONAFOR and SEMARNAT had to present their
proposed PES program to the Secretariat of Hacienda and Public Credit (SHCP). The head of
the department to whom the proposal was presented opposed the idea of using water fees to pay
for the program, arguing that SHCP had an informal agreement with the municipalities to
devolve 100% of their water fees in order that they invest it in infrastructure projects. It is likely
that part of the opposition came from SHCP’s desire to give the municipalities full incentive to
collect and pay their water fees, which have notoriously low collection rates in Mexico. Having
encountered resistance in SHCP, Cárdenas decided to present the proposal directly to the
National Congress through the PAN party. Both the Congress and its Environmental
Commission accepted the proposal. SHCP attempted once again to block it in the Finance
Commission, but only succeeded in getting rid of the 2.5% levy on water fees and converting the
financing into a fixed amount equivalent to 200 million pesos ($20 Million) per year taken from
the water fees collected. This eliminated the possibility for the program to benefit from future
increases in water fee revenues. It has been estimated that, had the 2.5% levy remained in place,
the program would have tripled its budget by 2005.
At this point, several changes occurred in the original proposal. First of all, the idea of
targeting marginalized communities was removed from the discussion, partly due to
SEDESOL’s lack of interest. The other reason was related to the fact that the funding for the
program was slated to pass through the Mexican Forest Fund, a financial instrument created
under the umbrella of the General Law for Sustainable Forest Development to funnel funds
from various sources into projects related to forest conservation and restoration. In the
discussion surrounding the creation of the Fund, it was argued that budgeted projects should be
“profitable in the short term” which, in the eyes of CONAFOR, shifted the focus away from
poor communities. However, the marginalization criterion was subsequently reinserted into the
program during the revision of the rules of operation for 2004. The second important change
was that the program would no longer to be targeted toward overexploited watersheds, but
instead implemented nationwide. The justification for this change was, as described before, that
the tax revenues could not be divided up by watershed.

An Assessment of Mexico’s Payment for Environmental Services Program
23
Finally, the pilot project was cancelled. The idea of a pilot was first weakened as the
proposal passed through the Subsecretariat of SEMARNAT initially chosen to support a pilot,
and CONAFOR did not insist upon it. Although CONAFOR was aware that the budget
allocated for the program was not sufficient to finance the project at a national level, the
progress of the political calendar made it risky for the agency to run the pilot and then advocate
for a national level program. This was because the pilot, if begun in 2003, would end in 2005,
which would leave less than two years in the presidential term to begin the project at a national
scale. In addition, a practical reason to eliminate the pilot was that the program’s negotiation did
not specify a pilot, but rather that payments would be made to forest owners in general, which
limited the ability of CONAFOR to specify only particular regions for receipt of the payments.
Soon after, CONAFOR initiated a national tour to promote the program, even though at
this point it was unclear exactly what the shape of the program would be. This premature
promotion was undertaken because the responsible parties at CONAFOR were worried that the
program would fail due to lack of demand for the budgetary resources, given that the target
audience might never have heard of environmental services. Unfortunately, this strategy created
more problems than it solved. The promotion failed to adequately convey the concept of
environmental services, but was very successful in generating false expectations. Given that the
policy had yet to be well defined, many of the vague concepts described by the CONAFOR
representatives were not incorporated in the final program. The most important problem
stemmed from the idea that the Mexican Forestry Fund would open the program nationally, and
that any state government could create a state-level trust fund through which payments could be
funneled to forest owners. As a result of the tour, municipalities scrambled to create their own
trust funds so as not to be left out of the program.
Meanwhile, SHCP classified the new program as a subsidy instead of a payment for
service. Given the direct link between the payments and water fees, the program is really a fee
for service rather than a subsidy. Furthermore, this seemingly bureaucratic definition had an
enormous impact on the shape of the program, since it implied that it had to submit “rules of
operation” in lieu of criteria, and these rules would have to be debated in a public forum. In
addition, within the government, this gave the impression that the program would be yet another
case where “money was given away for no purpose”, which did little to create support for it
within SHCP. Finally, this implied that the money could no longer be distributed in a

An Assessment of Mexico’s Payment for Environmental Services Program
24
decentralized manner through the trust funds which had already been created by CONAFOR in
each state.
In April/May 2003, internal negotiations over the rules of operation began in earnest,
with CONAFOR taking the draft prepared by INE and submitting it for discussion by its staff.
The two main changes which took place at this time were as follows. First, wanting to avoid the
technical problem of measuring forest density, the payment schedule changed from three
payments (40 $/ha for high density cloud forests, 30 for medium density cloud forests and other
forests of high density, and 20 for forests of medium density) to only two payments (40 $/ha for
cloud forest and 30 for others). The monitoring scheme originally built into the rules of
operation was also eliminated, again due to the fact that CONAFOR did not have the technical
or operative capacity to continuously monitor recipient communities.
Political events also influenced the definition of the program. 2003 was the date set for
the liberalization of most of the agricultural products under NAFTA, and with it an organization
composed of various rural opposition groups gained strength under the umbrella of the
movement “El Campo No Aguanta Más” – translated as “the countryside can’t take it any
more”. After several weeks of negotiations, President Fox signed the National Agreement for
the Countryside, through which, among other things, he gave the right to a commission of
representatives to review and discuss all of government programs having to do with the rural
sector. Although the majority of these programs were subsidies to agriculture or coffee
production, rural interest groups linked the production of environmental services with some
semi-perennial and perennial crops making the payments for environmental services on the list
of negotiable programs. This meant that CONAFOR was forced to submit the rules of
operation of the program to negotiation with “El Campo No Aguanta Más” and other rural
interest groups as well.
The negotiation process was exhausting, with the principal demands of the organizations
being:
• Direct the program to poor producers; distribute funds to benefit the greatest
number of producers
• Include agroforestry and coffee production in the definition of environmental
services

An Assessment of Mexico’s Payment for Environmental Services Program
25
• Create an Operations Committee in the National Forest Council that would include
an equal number of producers and governmental representatives. The Committee
would have the responsibility of defining the selection criteria for the program,
authorizing local trust funds for the operation of the program, and authorizing
payments to beneficiaries.
• Modify the payments to 500, 400, and 300 pesos ($50, $40 and $30 respectively) per
hectare according to a classification determined by the Committee.
• Distribute 90% of the resources to ejidos and 10% to private land owners.
• Include in the program ejidos with productive forestry projects.
CONAFOR was at a major disadvantage in the negotiations as a result of the fact that it
could not meet with SHCP and the rural organizations separately. Once at the table, the two
created an alliance which forced CONAFOR to make concessions on several points. They
agreed to target the most needed producers and to create a “Technical Committee”, but left the
definition of the committee vague, so as not to have to include representatives of the
organizations. In addition, they agreed to include lands under management for timber harvest,
although they limited the number of allowable hectares to 200 per beneficiary. The SHCP/rural
organization alliance may have resulted from the fact that the program was passed in Congress
despite SHCP’s opposition or also because SHCP had an enormous number of programs to
negotiate with the organizations and decided to “sacrifice” the PES program in order to create
goodwill for the negotiation of much larger and more costly programs.
At the end of the negotiations, the rules were sent to the Federal Commission of
Regulation, and were finally published in the Federal Registry on October 3, 2003.
c. October 2003 to the present
At this date, implementation of the program began under the responsibility of
CONAFOR. We include this section within the story of the development of the program since
substantial changes occurred during the implementation phase. The fact that the rules of
operation were published in October created some problems for CONAFOR, which, due to the
rigidity of the governmental fiscal year, had to spend 4 million pesos in less than three months.

An Assessment of Mexico’s Payment for Environmental Services Program
26
Normally, funds allocated to federal programs must be spent within the fiscal year, but the
managers of the PES program wanted to use the 2003 budget allocation to guarantee payments
to participant communities for five consecutive years. Fortunately, the Mexican Forest Fund
(FFM) facilitated this process by allowing to set aside the remaining $16 million from the
program’s annual budget to cover the next four years. Although the existence of the FFM was a
great advantage, allocating a budget of this size in such a short period of time is a difficult task,
and it was complicated by a lack of personnel for program implementation – in October, only 3
staff members of CONAFOR had been assigned to promote the program and review requests
for payments.
Application for the program was very simple – all it required was to fill out a two pages
form and present proof of legal ownership. For ejidos, an “Acta de Asamblea” was required, a
document verifying that a general assembly had been called in the participating community and
that a vote had taken place. At this point, the program contracts gave payments for a specified
area of forest within each community’s boundaries. The aforementioned dual pricing system
was maintained, with prices per hectare ser at $40 for cloud forest and $30 for other types. To
avoid slippage, in most cases the contract specified that removal of trees from the community’s
entire forested area (even outside of the area for which payments were being made) constituted a
contract violation and subsequent non-payments, but not in all cases. Contracts were assessed
and renewed on a yearly basis. The official criteria for selecting properties were as follows:
• Properties with forests with more than 80% density (i.e., hectares with more than
80% tree cover),
• Located in overexploited aquifers,
• With nearby population centers greater than 5,000 inhabitants.
The third criterion was introduced based on the justification that markets can only be
“created” where there is a sufficiently large population to demand the water which is linked to
the conservation of nearby forests.
CONAFOR, after lobbying its internal budget committee, hired supplemental workers
to assist in the promotion of applications and the selection of recipients. Unfortunately, by the
time the hiring and training process was over, there was only one month left for these activities.

An Assessment of Mexico’s Payment for Environmental Services Program
27
As a result, the promotion of the program was only done to CONAFOR’s traditional
constituency– ejidos and private land owners with wood extraction projects supported by its
other programs.
Despite the limited time for promotional activities, but perhaps due to the earlier
national tour, CONAFOR received many more demands than it could finance. With only 3
employees to review, catalogue, and evaluate 900 proposals, several changes were made in the
program targeting in order to facilitate the process. First, a combination of misinterpretation of
the rules and the fact that there was only one geographical technician to analyze the satellite
images resulted in the elimination of the criteria of forest density in favor of forest coverage,
meaning that only properties that were more than 80% covered with forest were selected. This
resulted in the selection of much larger properties, and with lower population density and
probably a lower probability of deforestation than if the 80% forest density criterion had been
used.
In addition, CONAFOR had considered monitoring the program through high
resolution satellite images. However, insufficient time and staff meant that satellite images of
potential properties were not purchased, with the result that properties located in regions where
images had not been purchased were not allowed in the program. In a related problem, if the
properties were not already georeferenced, a task requiring significant work and technical
support, they could not receive payments since placing them on a satellite image would be
impossible. Finally, in the communities with forest extraction activities, it was often impossible
to determine if the area chosen for environmental payments overlapped with area earmarked for
tree harvests.
The time constraint resulted in one final exercise in financial acrobatics – the contracts
were designed to make payments after a full year of conserving the forest cover. However,
given that one fifth of the budget had to be spent before the end of the fiscal year, 2003
payments were given for forest conserved during 2002 – that is, before the owners knew that
they would be participating in a program. The following year, the forest cover was assessed and
the 2004 payments were given for forest conserved during 2003. It is, however, unclear whether
recipients understood that these were the terms of the contract, given that it was not stated in
these terms in the contracts that they signed.

An Assessment of Mexico’s Payment for Environmental Services Program
28
In the 2003 round, the 900 applications encompassed more than 600,000 hectares of
land from 25 different states. From these, 271 were accepted, covering 127,000 hectares of
forest from 15 states.
At the beginning of 2004, program operations were switched internally within
CONAFOR from the Cooperation and Financing Unit (UCF) to the Production and
Productivity Department within the Office of Silviculture and Management, the office in charge
of managing most of the forest conservation enhancement programs at CONAFOR4. One of
the Department’s first actions was to organize the Technical Committee described in the 2003
rules of operation, which had never been constituted. The Committee was headed by the
director of CONAFOR and composed of a representative from the National Commission of
Protected Areas (CONANP), one from INE, one from the National Commission on Water
(CNA), and two from the National Forestry Council (CONAF, with one representative from the
social and one from the private sector). There were various changes to the program through the
Committee, which saw the program as a way of supporting the National Protected Areas. The
Committee began with the definition of clear eligibility criteria for the program and opened the
program to public scrutiny through meetings with different sectors and actors from civil society.
Two important new selection criteria were added: a piece of land could be in a National
Protected Area or in a “Priority Mountain” and receive the same priority as a property in an
overexploited watershed. The Priority Mountain criterion was justified by the objectives of the
Program for the Sustainable Management of Mountain Ecosystems (PMSEM), which focuses
the protection of the water-production, carbon capture, and biodiversity capacity of the 60 most
important mountains scattered throughout Mexico. This program, also administered by
CONAFOR, began in 2002 as a derivative of the UN’s Agenda 21 and the subsequent
denomination of 2002 as “the year of the mountain”. Like the PES program, the PMSEM is a
new program for the agency, with a slightly smaller budget of around $1.7 million per year.
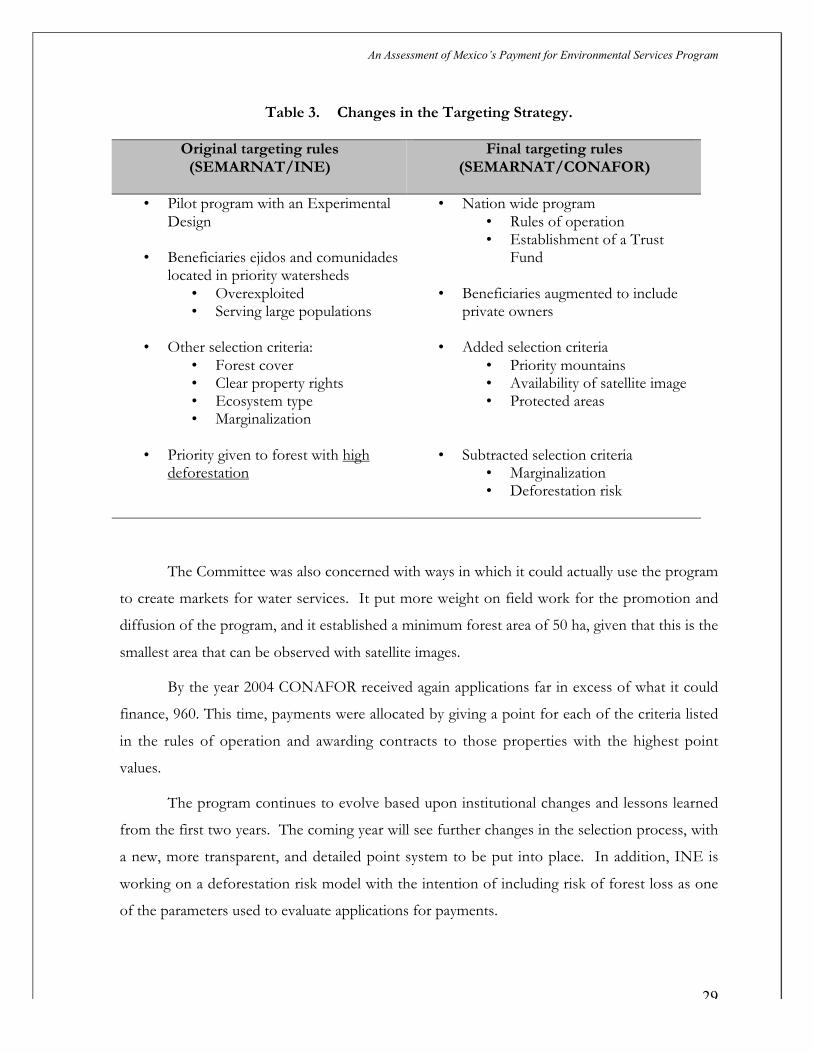
Table 3 summarizes the overall changes in the targeting criteria from the original proposal to the
program’s 2003 implementation.
4 These programs are: Program for the Sustainable Management of mountain ecosystems and the Program forpayments on Carbon sequestration, biodiversity services and agro forestry systems establishment.
An Assessment of Mexico’s Payment for Environmental Services Program
29
Table 3. Changes in the Targeting Strategy.
Original targeting rules(SEMARNAT/INE)
Final targeting rules(SEMARNAT/CONAFOR)
• Pilot program with an ExperimentalDesign
• Beneficiaries ejidos and comunidadeslocated in priority watersheds
• Overexploited• Serving large populations
• Other selection criteria:• Forest cover• Clear property rights• Ecosystem type• Marginalization
• Priority given to forest with highdeforestation
• Nation wide program• Rules of operation• Establishment of a Trust
Fund
• Beneficiaries augmented to includeprivate owners
• Added selection criteria• Priority mountains• Availability of satellite image• Protected areas
• Subtracted selection criteria• Marginalization• Deforestation risk
The Committee was also concerned with ways in which it could actually use the program
to create markets for water services. It put more weight on field work for the promotion and
diffusion of the program, and it established a minimum forest area of 50 ha, given that this is the
smallest area that can be observed with satellite images.
By the year 2004 CONAFOR received again applications far in excess of what it could
finance, 960. This time, payments were allocated by giving a point for each of the criteria listed
in the rules of operation and awarding contracts to those properties with the highest point
values.
The program continues to evolve based upon institutional changes and lessons learned
from the first two years. The coming year will see further changes in the selection process, with
a new, more transparent, and detailed point system to be put into place. In addition, INE is
working on a deforestation risk model with the intention of including risk of forest loss as one
of the parameters used to evaluate applications for payments.

An Assessment of Mexico’s Payment for Environmental Services Program
30
The future will clearly see large changes in the program design. As part of CONAFOR’s
strategy to support local payment mechanisms, it received $100 million in financing from the
World Bank. This funding is intended to help support research into the effectiveness of
environmental services programs, as well as to promote and manage private environmental
service contracts for water, biodiversity, and ecotourism. The project was approved in July 2004
and is intended to last for 20 years. Its long duration is expected to have a significant impact on
the evolution of PES programs in Mexico.
d. Summary
The design of Mexico’s PES program was strongly influenced by the political process.
Although the program’s stated objective was never modified – the preservation of hydrological
services through payments to forest-holders – the nature of the contracts and the targeted
population changed considerably between the day Secretary Lichtinger delegated the job of
designing the policy to INE in 2000 and the first payments made by CONAFOR in 2003. The
most substantial changes – the removal of the pilot program, the elimination of the focus on
marginalized communities, the inclusion of commercial forests and private properties, and the
decision to give payments based on percentage of forest rather than on forest density – all
occurred with the transfer of responsibility from INE to CONAFOR. The reason for many of
these changes and for some of the significant barriers to implementation originated in SHCP’s
early decision to categorize the program as a subsidy. This seemingly bureaucratic modification
forced CONAFOR to spend considerable time drawing up rules of operation and negotiating
them with rural organizations. This later constrained the Commission to squeeze the promotion
of the program, the selection of communities, and the allocation of payments into a very short
three months period. Instead of allowing CONAFOR to expand its constituency, the time crush
encouraged the agency to use its existing relationships with commercial forest communities to
distribute the payments. In addition, the rush to implementation led to a lack of transparency in
the selection process in 2003, some of which was corrected in 2004. The 2005 process appears
to now be moving towards more systematic and clear selection rules. Table 4 provides a
summary of the evolution of the program.

An Assessment of Mexico’s Payment for Environmental Services Program
31
Table 4. Evolution of the PES Program.
Stage 1 Stage 2 Stage 3
Political Force Victor Lichtinger,Secretary of theEnvironment
Alberto Cárdenas J.Director of CONAFOR
Alberto Cárdenas J.Director ofCONAFOR
Design INE with academicsupport
INE/CONAFOR CONAFOR andTechnical Committee
ResponsibleAgency
Subsecretariat ofSEMARNAT is suggested
CONAFOR-Cooperation and FinanceUnit
CONAFOR –Production andProductivityDepartment
Other relevantactors
UIA, CIDE, UC Berkeley El campo no aguantamás.
World Bank
Civil society
Financing 2 Million from water fees 20 Million from waterfees
30 million beginning in2005
Beneficiaries Marginalized or verymarginalized ejidos andcomunidades
Private property isincluded. Marginality isremoved as a criterion.
Ejidos, comunidades andprivate properties inforested areas.
Selection Common property areasof ejidos and comunidadeswith forests of lowcommercial value and highdeforestation risk, not toexceed 2,000 hectaresunder contract.
80 % density.
Fallow areas ofproperties with extractiveforestry can be included.
Limit is extended to4,000 hectares.
The 80% criterion isinterpreted by puttingtogether small plots offorest throughout theejido.
Region Priority watersheds areproposed.
The convocation isopened nationally withthe following criteria:
Properties are inoverexploitedwatersheds, water scarceareas or areas subject tohydrological disaster(flooding, etc).
Targeted regions areexpanded to includeareas at risk forhydrological disasters.
Additional possiblecriteria: properties arein a Natural ProtectedArea or “prioritymountain”
Contracts Beneficiaries commit to nochange in the forest cover
Same Same

An Assessment of Mexico’s Payment for Environmental Services Program
32
IV. Results of implementation, 2003-2004
a. Summary statistics for participating communities
This section describes the recipients of the initial payments made by the program. The
data used to characterize the participants come from an evaluation of the program conducted by
the Colegio de Posgraduados (COLPOS, 2004) and a survey conducted by INE (INE, 2004).
The Colegio de Posgraduados survey was comprised of over 300 randomly selected participants
(community members, and private owners), while the INE survey covered 27 participant ejidos
selected to reflect the mean characteristics of the ejidos participating in the PES program in
2003. Except where otherwise noted, the statistics presented come from the INE survey.
The program was supposed to be operated nationwide. Although applications were
received from 25 states, only 15 actually received PES contracts. Table 5 shows the distribution
of payments by state.
Table 5. Distribution of PES contracts by state, 2003.
State Number ofcontracts†
Hectaresenrolled†
HectaresForested††
Percentageenrolled
Payments†††
Baja California Sur 2 2,231 442,874 0.50 63,749
Coahuila 29 7,188 514,771 1.40 205,368
Chihuahua 8 11,279 7,702,586 0.15 322,269
Distrito Federal 4 5,058 38,301 13.21 144,507
Durango 16 15,224 5,870,668 0.26 434,959
Estado de México 2 709 740,205 0.10 20,271
Jalisco 24 11,801 4,407,937 0.27 337,175
Michoacán 10 8,633 3,510,806 0.25 254,317
Nayarit 9 3,222 1,731,879 0.19 96,721
Nuevo León 1 1,450 571,327 0.25 41,424
Oaxaca 20 28,469 6,392,049 0.45 813,396
Puebla 19 5,655 1,599,605 0.35 168,641
Querétaro 45 4,664 419,098 1.11 143,792
San Luis Potosí 7 9,874 857,912 1.15 282,121
Veracruz 75 11,361 1,135,089 1.00 328,434
TOTAL 271 126,818 35,935,107 0.35 3,657,143† CONAFOR 2004 www.conafor.gob.mx†† Estimate for year 2000 (SEMARNAT, 2002)††† US dollars. Data from CONAFOR 2004 www.conafor.gob.mx

An Assessment of Mexico’s Payment for Environmental Services Program
33
Observe that a few states – Oaxaca, Durango, and Veracruz – got a large share of the
budget (43%). The states with the smallest number of hectares enrolled were the Distrito
Federal, Nuevo León, Baja California Sur, and Nayarit.
For the first year of operation ejidos and comunidades accounted for 47% of the contracts
and for 93% of the area contracted. The geographical distribution of the communities receiving
payments is shown in Figure 6.
Figure 6. Distribution of ejidos receiving PES payments, 2003.
Most of the rejected applications were from ejidos or communities, but there was also a
relatively high proportion coming from private properties. High ejido participation is due the
high incidence of common property forests in the country. Transactions costs for ejidos are
estimated in $237 per application compared to the reported transaction cost for private owners
of $304 (COLPOS, 2004). In both cases, these costs are small relative to the magnitude of the
payments received.

An Assessment of Mexico’s Payment for Environmental Services Program
34
In spite of the fact that extremely large ejidos were selected in 2003, the average size of
participant ejidos was 3,961 hectares, almost 500 hectares lower than the national average for
forest ejidos with timber harvest permits. The mean number of hectares enrolled in the program
is 466, with 2.8% of the total hectares in the sample being cloud forests. On average, 75% of
the land in participating ejidos is considered common property, while the rest is parceled, mainly
dedicated to housing and agricultural activities. The survey shows that nearly 26% of the ejidos
have parceled a small proportion of their forest land (formerly in the commons) which, in
general, is not used for timber harvest. Out of a sample of 23 common properties receiving
payments, 15 (65%) had experienced deforestation over the 1994-2000 period. The average
yearly rate of forest loss amongst those with positive deforestation was 1.5 percent.
It is estimated that nearly 63% of the participants harvest wood for sale. Within these
ejidos, as much as 74% have reported illegal logging in their properties, mainly performed by
people from outside the ejido. In some of these ejidos, the legal harvest volumes exceed 32,000
cubic meters, far beyond the national average of 4,546 cubic meters a year. In 61%, the logging
operations are performed by the ejido members, indicating greater vertical integration, while in
the rest they are performed by contractors who change every year. These figures also contrast
with nation wide average where almost 50% of ejidos sell standing trees. Table 6 shows the main
characteristics of participating communities.
Table 6. Physical characteristics of participating ejidos
Characteristics Estimate
Average size of forested area, in hectares
Average hectares enrolled in the program
Total hectares of cloud forest in the sample
Total hectares of temperate forest in the sample
Total hectares enrolled in sample
Percentage of participants with cloud forest (from total)
Average annual forest loss in hectares, 1994-2000
Percentage of participants harvesting wood for sale
3,961
466
1,830
55,280
12,680
2.9
38
63
Source: Own estimates with data from INE (INE, 2004)

An Assessment of Mexico’s Payment for Environmental Services Program
35
Given the program’s focus on water services, it is useful to consider the distribution of
payments according to overexploited watersheds. Table 7 details this distribution, where the
population is all the participants in the program, not a sample. Clearly, the payments have not
been going to areas where the aquifers are overexploited. Essentially zero percent of the
hectares under PES are forests in aquifers qualifying as extremely or strongly overexploited. 78
and 85% of the PES hectares, in 2003 and 2004 respectively, are in aquifers which are not over-
exploited, with the remainder of the hectares under PES in aquifers that qualify as moderately
overexploited.
Table 7. Distribution of payment recipients by aquifer type, 2003 and 2004
Aquifer type Total area(%)
Populationliving in area
(%)
Hectares inPES, 2003
(%)
Hectares inPES, 2004
(%)
Extremelyoverexploited
(+100% a +800%)0.05 9.2 0.02 0.00
Strongly overexploited(+50% a +100%)
0.04 19.5 0.00 0.00
Moderatelyoverexploited
(+5% a +50%)18.6 14.5 13.3 9.6
In equilibrium(- 5% a +5%) 2.9 11.3 0.01 0.00
Not overexploited(< - 5%) 65.1 45.4 78.7 85.0
No data 13.4 0.1 8.0 5.3
TOTAL 100 100 100 100
Source: Muñoz et al, 2005
Table 8 shows the distribution of PES hectares according to forest type. Recall that
cloud forests are given a slightly higher payment per hectare under the current scheme, with the
hope that a proportionately higher number of cloud forest hectares be enrolled. This is indeed
what happened. Again, these results are based on a census, not a sample, of the payment
recipients. The effort to enroll a larger proportion of cloud forests was successful; in 2003, 6.8
% of the enrolled hectares were cloud forests and, in 2004, 16.3 %, relative to the overall

An Assessment of Mexico’s Payment for Environmental Services Program
36
percentage of 3.4 and the eligible area of 6.6 percent. The temperate forest categories of Pine,
Oak, and Fir are over-represented as a group, both relative to the eligible areas and the national
distribution. This may be because there are more commercial forests in these ecosystems, and
the owners of these forests are likely to have a closer relationship with CONAFOR through
other programs administered by the Commission. It is impossible to tell whether this bias
results from greater promotional efforts by CONAFOR with these types of forest holders or is
simply the result of self-selection.
Table 8. Comparison of forest types enrolled in PES, 2003 and 2004.
Forest Type
Distributionat the
nationallevel(%)
Hectaresenrolled in PES,
2003(%)
Hectaresenrolled inPES, 2004
(%)
“Eligible”area†
CONAFOR2004 (%)
Pine and oak-pine Forests 37.8 60.1 43.9 46.4Oak-fir forests 23.0 17.2 24.9 18.0Cloud forests 3.4 6.8 16.3 6.6Low tropical forests 25.0 3.0 4.9 2.4Medium and high tropicalForests
10.8 12.9 10.426.6
TOTAL 100 100 100 100
Source: Muñoz et al, 2005† In 2004, CONAFOR used three criteria to define eligibility: overexploited aquifers, priority mountains, andprotected areas. This definition does not include the other criteria detailed in the rules of operation, but it was usedas a guide in the selection process for this year.
The sources of deforestation pressures on forests held by PES recipients, detailed in
Table 9, are not different from the deforestation pressures at a national level: agriculture and
pastures, domestic use, and in some cases over extraction are the main causes. 25% of ejidos
declared using forest clearings for subsistence agriculture while almost 65% of the ejidos use the
forest for grazing of livestock. Nearly 15% of the ejidos stated that the incursion of cattle from
outsiders is a greater source of pressure than that from ejido members’ own cattle, while 50% of
participants reported loss of forest to fire or pests. Almost 85% of the ejidos harvest logs for
domestic uses such as housing, fencing, or road rehabilitations. Firewood is still a cause of
extraction in more than 85% of the ejidos. Interestingly, even prior to receiving payments from
the program, all of the ejidos in the sample declared performing forest conservation activities.
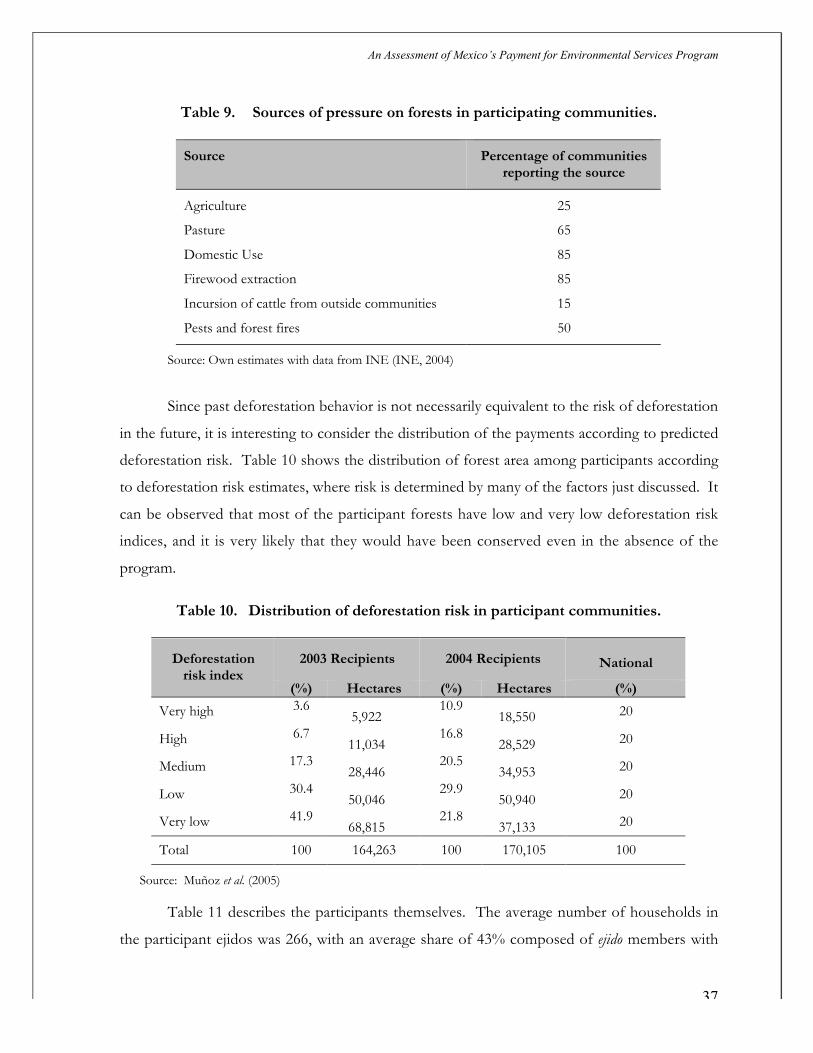
An Assessment of Mexico’s Payment for Environmental Services Program
37
Table 9. Sources of pressure on forests in participating communities.
Source Percentage of communitiesreporting the source
Agriculture
Pasture
Domestic Use
Firewood extraction
Incursion of cattle from outside communities
Pests and forest fires
25
65
85
85
15
50
Source: Own estimates with data from INE (INE, 2004)
Since past deforestation behavior is not necessarily equivalent to the risk of deforestation
in the future, it is interesting to consider the distribution of the payments according to predicted
deforestation risk. Table 10 shows the distribution of forest area among participants according
to deforestation risk estimates, where risk is determined by many of the factors just discussed. It
can be observed that most of the participant forests have low and very low deforestation risk
indices, and it is very likely that they would have been conserved even in the absence of the
program.
Table 10. Distribution of deforestation risk in participant communities.
2003 Recipients 2004 Recipients NationalDeforestationrisk index
(%) Hectares (%) Hectares (%)
Very high 3.65,922
10.918,550 20
High 6.711,034
16.828,529 20
Medium 17.328,446
20.534,953 20
Low 30.450,046
29.950,940 20
Very low 41.968,815
21.837,133 20
Total 100 164,263 100 170,105 100
Source: Muñoz et al. (2005)
Table 11 describes the participants themselves. The average number of households in
the participant ejidos was 266, with an average share of 43% composed of ejido members with

An Assessment of Mexico’s Payment for Environmental Services Program
38
legal property rights. In most of these ejidos there are no indigenous people: the statistics show
that only 1.5% of the population speaks an indigenous language. Most of the selected ejidos
have good communication services. The average distance to the closest town is 23 kilometers.
In addition, all of them have elementary schools and 85% have a high school; no technical
schools or colleges are available within these small communities. This is considerably higher
than the national average for secondary school availability. Almost 82% of the participant ejidos
have access to phone services and 71% have health clinics as well. The basic public services of
electricity and water are available in all the sampled ejidos although only 55% of them pay for the
water they consume. Sewage systems are available in 48% of the sampled ejidos. All of these
services seem to be more available in participant communities than one would expect from the
average ejido, which implies that the payments are being made to relatively wealthier
communities.
The Colegio de Posgraduados (COLPOS, 2004) data show that, while the average daily
income level in the participant communities is $5.54, the range is quite wide. Nearly 56% of the
participants from ejidos and comunidades have a daily income of less than $3.82, while 86% have a
daily income of less than $7.55. These contrast with the incomes from private owners (who
control close to 35% of the participating forest area) where nearly 43% have a daily income
greater than $ 30.30. The INE survey shows that 31% of the participant households are
classified below the poverty line. In general, forest ejidos have a higher concentration of
extremely poor people, and this result provides further evidence that the program did not reach
the poorest people in forest areas.
Table 11. Description of participants
Characteristic Estimate
Average number of membersAverage populationAverage daily incomePercentage of participant communities with: Primary school Secondary school Health clinic Sewage system
114266
$5.54
100857148
Source: Own estimates with data from INE (INE, 2004)

An Assessment of Mexico’s Payment for Environmental Services Program
39
Table 12 describes the distribution of PES hectares according to the level of
marginalization of the participanting communities. The definition of marginal is given by
Mexico’s National Population Council (CONAPO, 2000) and is based upon a combination of
nine indicators encompassing literacy, education, employment, and quality of dwelling.
Interestingly, even though marginality was removed from the program as a selection criterion,
the majority of the enrolled hectares – 71.9% in 2003 and 82.9% in 2004 – are located in areas
with high or very high marginality. It is important to emphasis that the correspondence between
payments and poverty is purely coincidental, reflecting the fact that a 80% of the forest in
Mexico is held by ejidos and comunidades, and that within this group, 86.3 percent of the forest
is located in communities with high or very high marginality. There does, however seem to exist
some bias towards including areas of high, rather than very high, marginality. One explanation
for this is that the former communities are less likely to have commercial forests (and hence
contact with CONAFOR), and are probably more remote and therefore difficult to reach.
Table 12. Marginalization and PES payments
PES 2003 PES 2004
Proportion inejidos with >
100 ha offorests
Nationaldistribution
acrossforests
Level ofMarginalization
Ha (%) Ha (%) (%) (%)Very high 41,282 25.0 36,567 21.5 69.1 31.2High 77,339 46.9 104,362 61.4 17.2 16.3Medium 29,924 18.1 13,521 7.9 8.6 22.2Low 13,018 7.9 9,741 5.7 3.3 10.1Very low 3,386 2.1 5,839 3.4 1.8 20.3
Total 164,948 100 170,030 100 100 100
Source: Muñoz et al. ( 2005) and own estimates with data from CONAPO (2000).
Figure 7 shows the distribution of common properties receiving payments overlaid on a
map showing the level of marginality by municipality. This is the visual representation of Table
12 – it is clear from this that the PES recipients are located in the more marginalized
municipalities.

An Assessment of Mexico’s Payment for Environmental Services Program
40
Figure 7. Marginality and PES payments, 2003.
Source: INEGI, 2000, and CONAFOR, 2004
It is also interesting to consider how payments received were distributed within
communities. This is because the payments must provide an incentive for individuals within a
community to cease their deforestation activities or, in cases where deforestation pressures come
from outside the communities, to increase conservation activities like forest monitoring for
encroachment. These changes must either come through an income effect that is large enough
to remove the need to extract goods from the forest, or through a price effect in the form of a
transfer – be it in cash or kind – conditional on ceasing extraction or participating in
conservation. The PES program belongs in the category of a conditional cash transfer (CCT)
that creates a price effect on forest conservation. Per unit of payment received, a CCT should
have a larger incentive effect on forest conservation than a non-conditional payment would
have.5
5 See by analogy the discussion on incentive effects from cash transfers vs. CCT for education under Progresa (deJanvry and Sadoulet, 2005).

An Assessment of Mexico’s Payment for Environmental Services Program
41
The use of the 2003 payments varied from distributing 100% equally between all
members, to the investing all the money into public goods for the community, with many
intermediate cases where the allocation included a combination of direct distribution of
payments, payment for guarding the forest and fire prevention, and investment in local public
goods. The survey shows that 18% of the ejidos decided to distribute all payments directly
among ejido members, 22% invested the entirety in forest activities related to conservation, 18%
allocated the full amount to public goods not related to forestry, while the remaining 43%
adopted a combination of the three strategies.
In 87% of the communities surveyed, participants declared that they had respected the
contract, while 26% stated that they had deforested over the past two years. Note that
deforestation is not necessarily a breach of contract, given that most contracts are not specified
to be inclusive of all the forested area. In most cases, the activities implemented as a result of
the program included increasing the surveillance of forest lands and revising the rules on
individual members regarding the extraction of forest resources. In no cases were new activities
introduced as a result of the program. Payments had not been withheld from any of the survey
participants, suggesting that either compliance is very good or the monitoring system is not very
effective.
Around 17% of the participant ejidos state that they are not happy with the program. The
two main sources of their discontent are: 1) they perceive the payment to be too low and 2) they
are unhappy with the way the payment is distributed inside the community. 78% of the
participants stated that they would be willing to continue in the program. What is interesting
about this is that nearly 59% of these ejidos would have been willing to accept the program with a
payment of $23 per hectare per year. On the contrary, the ejidos not willing to continue the
program (22%) ask for a payment as high as $71 per hectare per year to continue in it. The
survey conducted by COLPOS reported that 27% of the sample complained about the
constraints on timber harvest imposed by the program on the non-contracted areas.
Monitoring of the contract after the first year of operation was performed randomly in
28 ejidos (22%) in November 2004. All monitored ejidos met contract requirements. The
annual cost of operation and monitoring for the first year of operation is estimated at $714,285,
which yields an average cost of $5.6 per hectare, which is totally absorbed by CONAFOR.
Compared to payments of $30/hectare, this indicates administrative costs that represent 19% of
An Assessment of Mexico’s Payment for Environmental Services Program
42
the PES budget. In addition, there is an annual evaluation of program objectives, processes and
expenses made by an external institution. For the first year, this evaluation amounted $98,214.
b. Case Studies
In the winter of 2004-2005, case studies of communities receiving the pilot payments
were undertaken in the states of Michoacan, Puebla, Veracruz, Durango, Chihuahua, and
Coahuila. Although it is quite early in the process to be able to measure the impact of the
program on forest cover, one can still analyze some behavioral effects of the program in terms
of forest management activities. In addition, the distribution of payments within the
communities can give some insight into whether distinct groups within the communities are
differentially affected by the program. Finally, it is also important to evaluate recipients’
understanding of the program, since the program’s ultimate intention is that communities ‘sell’
their forest services to outside populations. The intention of these studies was to detail the
experience of the recipient communities, with a focus on the following questions:
• How were communities managing their forests before the PES program?
• Did this behavior change with the receipt of payments?
• Has receipt of the payments affected the internal dynamics of the communities?
Eleven communities were chosen and teams of two investigators were sent to each,
where they conducted group interviews with available ejido members, as well as individual
interviews with different parties of interest. Given that the majority of participants in the
program are from ejidos and communities, rather than private landowners, and that we are
particularly concerned with how payments might affect community dynamics, all case studies
were conducted in these types of properties. This section summarizes the overall findings6.
6 The studies were conducted by Adán Martínez Cruz, Josefina Braña Varela, and Jaime Sainz Santamaría.

An Assessment of Mexico’s Payment for Environmental Services Program
43
i. Descriptives
Table 13 describes the case study participants. The studies cover a variety of
communities with varying membership and size in different institutional situations. The
membership size varies from 40 to 225, while the area variation is from 493 to over 10,000
hectares. The forest area enrolled in the PES program in each community also varies widely,
ranging from 73 to 1,400 hectares. In none of the cases is the total area enrolled equal to the
total forested area in the ejido. Under the column labeled population, there are various terms
which require further definition. “Ejidatario” refers to a member of the ejido, meaning a person
who has rights to use the ejido land, vote in community assemblies, and can pass this right on to
one family member. “Posesionario” refers to those who have permission to work on the ejidal
lands, usually in the commons area, while “avecindados” have their homes located within the
ejido, but are not entitled to use of land for agricultural or pastoral purposes. The total
population refers to anyone living in the villages located within the ejido boundaries. This
number usually includes relatives of the ejidatarios, a number which grows with time as a result
of the fact that rights to the ejido can be passed on to only one family member.
Four ejidos (A, B, I, and J) include areas of forest that are organized for wood extraction
under the permit system. Forests without permits are not legally allowed to sell wood. The
communities located in Veracruz (C, D, and E) are found in the Biosphere Reserve las Tuxtlas,
which constitutes a unique institutional context within Mexico, as there are rules specifying
limitations on certain extractive uses. In fact, one of the three participating ejidos from this area
had undertaken extractive forestry before its land was declared part of the reserve. The
managers of the reserve see participation in the PES program as another way to help support the
change in behavior from extraction to conservation.

An Assessment of Mexico’s Payment for Environmental Services Program
44
Table 13. Description of participating ejidos in case studies
Ejido State % forestloss
1994-2000
Totalarea(ha)
Areaenrolled
Population Woodextraction?
A
B
C
D
E
F
G
H
I
J
K
Puebla
Puebla
Veracruz
Veracruz
Veracruz
Michoacan
Mexico
Michoacan
Durango
Chihuahua
Coahuila
-2.8
-7.6
-7.1
16.5
0
0.04
n.a.
0
12.1
6.6
12.4
1,232
724
493
1,026
2,268
1,446
1,801
1,364
10,573
9,340
3,580
356
113.5
73
499.25
1,114
1,400.18
572.24
109.90
415.13
581
845
81 ejidatarios11 posesionarios1000 total
57 ejidatarios43 posesionarios40 avecindados2000 total
84 ejidatarios80 avecindados2000 total
46 ejidatarios25 avecindados350 total
219 ejidatarios
40 comuneros13 avecindados
225 ejidatarios129 posesionarios
46 ejidatarios40 posesionarios
102 ejidatarios200 avecindados1200 total
105 ejidatarios140 posesionarios55 avecindados1500 total
38 ejidatarios20 posesionario400 total
Yes
Yes
No
No(used to)
No
No
Yes
No
Yes
Yes
No
An Assessment of Mexico’s Payment for Environmental Services Program
45
This table already gives an initial indication of how effective the program might be in
these communities. Only 5 of the 11 ejidos was actually deforesting in the period previous to
receiving payments. Although one cannot definitively say that an ejido which was not being
deforested during the 1994-2000 period remains at low risk of deforestation, it does indicate that
there is less scope for the PES policy to actually change behavior in these places. As was
suggested by the statistics on deforestation risk of PES hectares at a national level presented in
the previous section, the case study statistics imply that a significant proportion of the budget
may be being paid to people who were not planning to cut down the forest in the first place.
This is most certainly the case for forests in a Biosphere Reserve where extraction is forbidden
by law.
ii. Forest activities before and after receiving payments
One way to assess the impact of the payments is to consider how activities undertaken in
the forest may have changed as a result of the program. A summary of these results is contained
in table 14. In many of the cases considered, the main sources of pressure on the forest were
stated to be from outside the ejido – either from unidentified individuals stealing trees to sell, or
from the incursion of cattle from neighboring owners into the forested areas. In two cases, that
of ejidos A and B, both in the state of Puebla, the forest is used as a source of firewood, which is
then sold both inside and outside the communities. This exerts some pressure on the forest
resources, although the rising popularity of gas for cooking in the Mexican countryside
guarantees that this pressure is decreasing over time, which may be one explanation for the
increase in forest cover observed in these communities over the 1994-2000 period.
In the state of Michoacan, where ejidos F and H are located, there is very little pressure
on the forest from within the ejido. There are two basic reasons for this. First of all, Michoacan
is one of the main sources of migrants to the United States, which means that these
communities both receive a considerable amount of remittances and also have a smaller
population of younger people likely to make productive use of the forested areas. The second
reason is that these communities are located near the Lago de Patzcuaro, a popular tourist
destination for Mexicans and foreigners alike, and a considerable source of outside employment
for these communities.
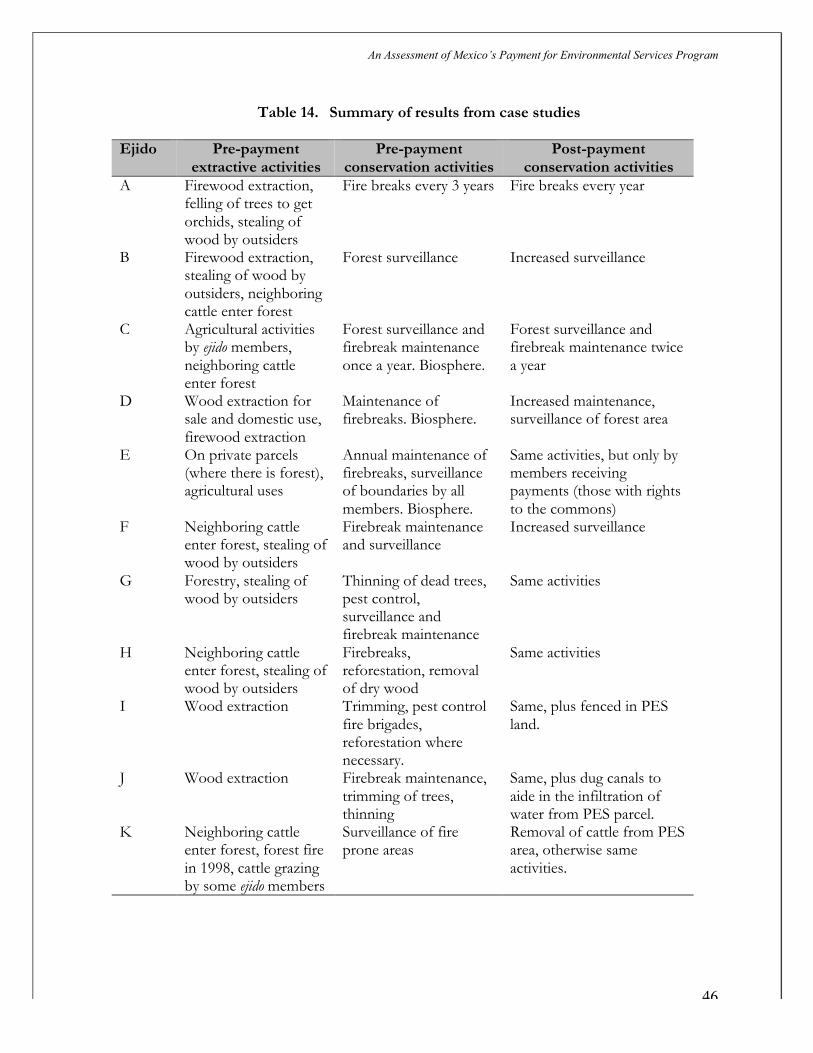
An Assessment of Mexico’s Payment for Environmental Services Program
46
Table 14. Summary of results from case studies
Ejido Pre-paymentextractive activities
Pre-paymentconservation activities
Post-paymentconservation activities
A Firewood extraction,felling of trees to getorchids, stealing ofwood by outsiders
Fire breaks every 3 years Fire breaks every year
B Firewood extraction,stealing of wood byoutsiders, neighboringcattle enter forest
Forest surveillance Increased surveillance
C Agricultural activitiesby ejido members,neighboring cattleenter forest
Forest surveillance andfirebreak maintenanceonce a year. Biosphere.
Forest surveillance andfirebreak maintenance twicea year
D Wood extraction forsale and domestic use,firewood extraction
Maintenance offirebreaks. Biosphere.
Increased maintenance,surveillance of forest area
E On private parcels(where there is forest),agricultural uses
Annual maintenance offirebreaks, surveillanceof boundaries by allmembers. Biosphere.
Same activities, but only bymembers receivingpayments (those with rightsto the commons)
F Neighboring cattleenter forest, stealing ofwood by outsiders
Firebreak maintenanceand surveillance
Increased surveillance
G Forestry, stealing ofwood by outsiders
Thinning of dead trees,pest control,surveillance andfirebreak maintenance
Same activities
H Neighboring cattleenter forest, stealing ofwood by outsiders
Firebreaks,reforestation, removalof dry wood
Same activities
I Wood extraction Trimming, pest controlfire brigades,reforestation wherenecessary.
Same, plus fenced in PESland.
J Wood extraction Firebreak maintenance,trimming of trees,thinning
Same, plus dug canals toaide in the infiltration ofwater from PES parcel.
K Neighboring cattleenter forest, forest firein 1998, cattle grazingby some ejido members
Surveillance of fireprone areas
Removal of cattle from PESarea, otherwise sameactivities.

An Assessment of Mexico’s Payment for Environmental Services Program
47
In two of the three ejidos located in the Biosphere Reserve of Veracruz, C and E,
agricultural activities exert some pressure on the forest, but the source of pressure in ejido D --
what Reserve managers refer to as a “red light” for deforestation --, comes from the sale of
wood and extraction of fire wood from the forest. The latter activity was not acknowledged by
ejido members, but reserve managers indicate that the sale of wood without an official permit is
an important pressure on forests in ejido D.
In the ejidos from Durango and Chihuahua, the main use of the forest is extractive
forestry under a management plan designed by a forest technician from outside the community.
These communities exhibited high deforestation rates over the period prior to the
implementation of the scheme. However, their extractive activities began between 1994 and
2000, and the ejidos practice a rotation-style of forestry that involves harvesting a parcel and then
allowing it to rest for ten years. It is unclear whether the initial 12% forest loss came from the
first phase of the forestry process or whether it is the result of an unsustainable deforestation
path. In addition to the extraction itself, there is some pressure on these forests originating in
the expansion of the urban area of these communities. Subsistence agriculture is an important
use of the commons in ejido J, although it is unclear if this presents a significant pressure on the
forest. Two years ago, this community also lost several hectares of forest to a pest infestation.
In the final case, that of ejido K in Coahuila, the forest loss is mainly the result of a forest
fire that occurred in 1998. Much of the area that is recovering from the fire is currently being
included in the program. The other activity taking place within the forest is the grazing of a
small cattle herd whose owners reside within the ejido.
All of the ejidos interviewed were already engaged in some form of conservation activity
before implementation of the program. This suggests a selection bias in the program design - it
is highly likely that communities with some experience in conservation would volunteer to
participate in a program requiring conservation activities. In most cases, communities stated
that they had intensified their conservation efforts by increasing their frequency. These facts
were not corroborated by outside sources, and in some instances the case study teams perceived
that community members had trouble locating fire breaks and forest roads that they claimed to
be maintaining.
The forestry ejidos of the Northern states all participate in “conservation” activities which
are actually part of their forest management plan. With implementation of the payment scheme,

An Assessment of Mexico’s Payment for Environmental Services Program
48
they continue to manage their forests for extraction, and in fact see the program as a way of
subsidizing their forestry project – the hectares of land integrated in the program are in fact
hectares which are part of a ten year rotation and happen to be in fallow at the moment. In the
case of ejido I, the PES land is located in what is considered a sensitive area for water
conservation, and it has therefore been fenced in and is monitored to ensure that no one enters
into the area. This ejido does not intend to put this particular piece of land back into production.
Ejido K is the only one within the group that has experienced significant loss of forest to
fire. As a result of this, they are trying to recuperate the forested area and have created wildfire
monitoring brigades. This community used the PES as a way to induce the cattle-owners to
move the small herd away from the recuperating land, which constitutes an important change
from a conservation perspective. It is unclear in this study whether or not these animals were
moved elsewhere in the commons or if they were placed on private parcels.
The results of this section point out that, in many communities, there was not truly a
possibility of major behavior change induced by forest conservation payments, mostly because
these communities were already preserving the forest. In only 5 of the 11 cases was there net
forest loss in the ejido and in all cases communities were already undertaking at least some
conservation activities.
One might hope, however, that the PES program induced the introduction of new
conservation activities, or a measurable increase in the existing ones. Why do we not see this
change? It is true that, in some cases, it was possible to verify that forest maintenance activities
had been improved by the introduction of the payment scheme, but in most cases it was not
possible to detect true changes. The main reason for this is clearly that no change in behavior
was really required – there was no pressure to cut down the forest, and current forest
conservation activities seem to be sufficient to preserve the currently forested areas. However, it
does seem that in many cases the payments were being used to provide a sustained incentive for
mandated conservation activities – for example, the ejidos located in the Biosphere Reserve were
forbidden to continue extractive projects in their forests, and the communities practicing
commercial forestry are mandated to have “reserve” and fallow areas within their forests. The
provision of payments to these communities is thus used to replace the command and control
approach which is difficult to enforce and seen as unfair by forest owners.

An Assessment of Mexico’s Payment for Environmental Services Program
49
In addition, it is important to note that, with the exception of the two cases in Northern
Mexico, these forestry communities received no technical assistance in the design of their
implementation schemes for the PES program, and in fact were not even aware of the
contractual requirements of such a scheme. It is unreasonable to expect communities without
technical assistance or experience in forest management to be able to create an effective
management plan. One final possibility is that in many cases, the amount of money received by
the communities was not sufficient to induce any sort of behavioral change. We will reserve a
more detailed discussion of the adequacy of the monetary incentives for the next section.
iii. Payment distribution and changes in community dynamics
This section considers both the levels of payments made and the distribution of these
payments within the participating ejidos. Table 15 lists the total payment amounts, the average
payment per member (were it to be divided in such a way), the allocation of these payments
within the community, and changes in intra-community dynamics, if there were any.
The total annual payments vary widely, from $2,200 up to nearly $45,000, as do the ways
in which communities decided to divide up this money. In over half of the cases, the majority of
the allocation was divided up and given to individual ejido members. Per capita payments, under
the assumption that the allocation was equally divided between all ejido members, vary from $60
per member to $1,100. Given that GDP per capita in Mexico in 2003 was around $6,000, these
amounts very from totally insignificant to substantial, with the majority falling on the low end
(CIA, 2005).

An Assessment of Mexico’s Payment for Environmental Services Program
50
Table 15. Effects of Payments on Participation and Collective Decision Making
Ejido Effects on participationand decision-making
Paymentamount in
US$
Distribution of payments to
A None 14,240(176 permember)
70% to bank account in president’s name30% radio communication system
B None 3,400(60 permember)
100% in purchase of truck forsurveillance activities
C None 2,190(26 permember)
75% divided equally between memberswith commons rights (50); remainder tocommon fund
D Those with forest in theirparcels threaten to cut downtrees if aren’t given paymentsproportional to their forestedareas.
14,978(57 permember)
100% equally divided amongst members;money invested in cattle. Proposedformation of microbank with the secondpayment.
E Decreased participation inconservation activities - onlythose receiving paymentsparticipate. Non-recipientswith forest in their parcelsthreaten to cut it down if notgiven payments in future.
33,420(153 permember)
3% to fund for forest maintenance, 97%divided between those with commonsrights; for next payments, each recipientwill give ~10% of payment to microbank
F Increased participation inconservation activities
44,805(1,120 permember)
8% to road maintenance, 92% dividedamongst ejido members according to theirlevel of participation in forestmaintenance activities.
G None 17,167(76 permember)
Divided equally between three sections ofejido. Each used the money to improvelocal schools.
H None 3,297(72 permember)
100% distributed equally among ejidomembers
I Adjustments in forestmanagement plan – movedextraction from PES parcel toanother area
12,454(122 permember)
18% to conservation activities and 82%divided up between ejido members.
J Increase in participation inconservation of PES area
17,430(166 permember)
First payment, 7% in salaries to thoseundertaking conservation activities, 93%distributed equally among ejido members.For next payment, 100% distributedamong ejido members.
K Small cattle herd moved out ofPES hectares onto differentland within ejido
25,350(667 permember)
15% for conservation of forest area, 85%distributed equally among ejido members.

An Assessment of Mexico’s Payment for Environmental Services Program
51
In only one case was 100% of the money distributed equally among all ejido members. In
all of the other communities, a percentage ranging from 3 to 100 was invested in some kind of
public good, where public goods in this case go from equipment used to monitor the forest
commons (radios, trucks) to infrastructure like school classrooms and road maintenance. There
are several reasons why ejidos might choose to invest the majority of the payments in public
goods. First, it is possible that there are returns to scale in these investments. That is, giving a
transfer of 75 dollars per year may not be as valuable to a family as using the same money to
build new classrooms for the school where the family sends its children to study. Second, these
goods can be enjoyed by non-members of the community who would not normally have rights
to cash transfers from ejido funds. As we have seen, many communities have large numbers of
non-members, including many from the family who did not qualify as members due to the
unigenitur rule, with whom members are under pressure to share benefits received. Finally,
there is evidence of sharing norms present in the ejidos and comunidades of Mexico, and it may
simply be that it is preferable for them to distribute this money in a more egalitarian fashion
through investment in public goods.
One very interesting development in two of the communities studied is the proposal to
form local microbanks using the PES money as seed capital. These two ejidos both participated
in the same PES workshop where this possibility was promoted, and it will be worth watching
whether the banks founded with this money are able to help satisfy their communities’ needs for
credit and savings services. As was mentioned in the section on sources of deforestation, a lack
of savings and insurance mechanisms may lead to overgrazing and deforestation as community
members use cattle for these purposes. The development of these microbanks could help
remove this incentive for forest conversion.
Although in many cases there was clearly no change in the social dynamics within the
ejido, in two cases we did observe changes in the relative power of different groups within the
communities that affected the distribution of payments. In both of these cases, forests were
located in what the community had defined as parceled areas within the ejido boundaries. This is
somewhat surprising, given that Mexican law prohibits the parceling of forested areas within the
ejidos. However, the ejido members were able to show that the parceling had been done legally
through the PROCEDE program, through which they had obtained individual land owning
certificates. The outcome of this division was that it gave the owners of these forests the ability

An Assessment of Mexico’s Payment for Environmental Services Program
52
to make a credible threat to cut them down if their demands were not met. In the case of ejido
D, the forest holders were receiving payments but requested that they be adjusted to reflect the
proportion of forest located in their parcels. This proposal was voted upon and accepted by the
assembly and will be put into effect in the next round of payments.
In ejido E, a similar dynamic occurred, though in this case the members with forested
parcels were not receiving payments and threatened to cut down their forest if they did not
receive some proportional compensation in the next round. Part of this dynamic resulted from
the fact that these forest-holding individuals had solicited payments for their parcels
independently from the ejido’s application. Whether it applied to the individual holdings or to
the commons was unclear when the final payment was awarded. An additional result of the
program in this community was that participation in conservation activities was reduced. This
phenomenon was a direct consequence of the way in which the payments were divided up –
only those with rights to the commons received them. It is somewhat unusual that only a small
part of the membership of an ejido would have rights to the commons. In this case, the decision
had been made to give commons rights to those with very small private parcels. Prior to the
program, all ejido members had participated in forest surveillance and maintenance. Once the
payments were received, non-recipients withdrew from these activities. In two happy cases,
ejidos F and J, we observe that the allocation of the PES funds resulted in an increased
environmental awareness and participation of a greater number of community members in
conservation activities. Although the authors of the cases noted that community F clearly had
higher levels of social capital than some of the other participating ejidos, it also received a much
larger payment, both in total and on a per capita basis. In addition, the payments were not
divided up equally among members, but rather were distributed according to the level of
participation in the activities they deemed necessary to fulfill the program requirements. In
community J, members stated that they felt that, in addition to providing a source of
employment for some of the able-bodied men in the village, the program had also improved the
quality of the water available to them.
Finally, in ejido K, although one might expect that the owners of the cattle grazing in the
PES area would have been paid additionally for displacing their activity toward other lands
within the ejido, conversations with community members revealed that the social pressure from
other ejido members was sufficient to induce this change without compensation.
An Assessment of Mexico’s Payment for Environmental Services Program
53
iv. Other case study findings
a. Misunderstanding of the program
One of the most discouraging finding was that in none of the communities visited were
the objectives and rules of the program clear to the members. This was not surprising given the
time restrictions on program promotion. Interestingly, the majority of ejidos were able to identify
the cities that benefited from the hydrological services provided by conservation of their forests,
exhibiting an understanding of the links between forests and the services they deliver. On the
other hand, none of them realized that the payments they were receiving were meant to be in
compensation for these services. In several cases, interviewees stated that they thought the
payments were a poverty-alleviation mechanism somehow linked with forests.
It is likely that part of the lack of behavioral adjustment thus resulted from not
understanding that the program was intended to support conservation activities. Clearly, the
lack of technical assistance in the elaboration of implementation programs exacerbated this
problem. In addition, the premature promotion of the program that we discussed in the political
economy section may have helped to generate some of the misinformation regarding program
objectives rampant among participants.
b. Corruption
Another unsettling finding was that, in at least one case, the intermediary responsible for
helping the communities fill out the paperwork for the program covered a ‘fee’ equivalent to
some percentage of the final payment. This sort of corruption is exactly the reason why so
many of the people interviewed were hesitant to participate in a government-initiated payment
program.

An Assessment of Mexico’s Payment for Environmental Services Program
54
c. Slippage
The term slippage, coined by Wu (2000) in his study of the Conservation Reserve
Program in the United States, refers to the bringing into production other land as a result of
removing land from production and putting it into a conservation program. Although in most
of our cases this was not a risk, given that the forest integrated into the program was not slated
for any use by the ejidos in the first place, we did observe slippage in two cases in the ejidos in
Northern Mexico. In the case of ejido K, cattle were removed from the forest to be entered into
the program and placed in another area not previously used for grazing, although it is not clear if
this area was forested or not and whether it was located in the commons or in a private parcel.
In another instance, ejido I, the community put in the program forested land that they had
programmed for harvest, and instead harvested another area of the forest.
Another phenomenon which is related to slippage is the use of the program as a way of
receiving payments for land which the ejido intends to use productively in the future. We saw
this in several of the forestry cases in the North, where ejidos decided to enroll into the program
hectares that are part of their ten year harvesting rotation. With permission of the forestry
authorities, these ejidos then modified their forestry plan to put different hectares into
production. This is clearly at odds with the intent of the program, which is to protect the forests
in sensitive areas from any risk of future production.
v. Summary of the case studies
The 11 case studies undertaken over the winter of 2004-2005 took place in a variety of
communities participating in the PES program: those practicing forestry and those living from
other activities, ejidos with few hectares and others with many, as well as ejidos with varying
membership size. In many of these cases, communities were not deforesting and in all cases
were practicing some kind of forest conservation measures before receiving payments from the
program. In some cases, payments induced an increase in conservation activities and, in two
instances, greater participation of community members in these activities. Payments to
communities located in protected areas that mandate zero impact on the forest, or to forestry

An Assessment of Mexico’s Payment for Environmental Services Program
55
communities required to have ecological reserves, were used to provide incentives for forest
conservation beyond the existing command and control approach.
In two instances, payments resulted in a shifting of extractive activities from PES land to
other land within the ejido. In two other cases, the receipt of payments changed the bargaining
power of particular groups within the communities – ejido members with forest on their parcels
threatened to cut it down if they were not given larger shares of the payments in the coming
year. Overall, the effect of the payments on the internal dynamics of the communities has not
been very large, perhaps because in many cases the magnitude of the payments is quite small.
An additional reason for the apparent small impact of the program may be that its goals and
mechanisms were not well understood by recipients, and technical assistance that might facilitate
this understanding had been entirely absent.

An Assessment of Mexico’s Payment for Environmental Services Program
56
V. Putting the Mexican Experience into Perspective: A Conceptual Framework
The World Bank’s 2004 World Development Report (WDR) entitled Making Services
Work for Poor People presents a conceptual framework that highlights the importance of
accountability in the provision of public services as a condition for greater efficiency as an
instrument for greater program efficiency. We use an adapted version of this framework in our
analysis. The WDR 2004 emphasizes how breakdowns in the relationships between the key
actors – policymakers, service providers, and clients (in the case of the WDR, the poor) – can
result in the failure to provide key services to the poor. Figure 1 shows a schematic for these
relationships. Clients can hold service providers accountable through two channels. The short
route to accountability is obtained through direct pressure on providers: the exercise of client
power. This results in downward accountability of providers to clients. The long route to
accountability is trough policymakers. Clients can use lobbying and voting to influence national
and/or local policymakers, who in turn exercise pressures on service providers through
contractual relations and in policy implementation. This is the long route to accountability.
Both routes are complementary.
Figure 8. Basic accountability schematics
Long route to accountability
Policymakers
Lobbying ContractsVoting Policy implementation
Short route to accountability
Clients Client power Serviceproviders

An Assessment of Mexico’s Payment for Environmental Services Program
57
Accountability, both upward and downward, is important in the provision of services,
especially the provision of environmental services for which no market has developed. The
reason for this is simple – in a market transaction, like the purchase of a meal, the buyer can
punish the seller if he is dissatisfied with the meal by going to a different restaurant the next
time, demanding his money back, or, in extreme cases, bringing legal or social sanctions to bear.
In the case of services provided through public agencies, there is no “other restaurant”. For
this reason, the desires of the three key actors must either line up very well, or contracts must be
written which force accountability in all three relationships. However, it is usually difficult to
write a contract that is “complete” in the sense that it takes into account even unexpected events
(in the case of the PES program, the intervention of “El Campo No Aguanta Más”), while still
allowing the service providers sufficient freedom to exercise their expertise. It is always
preferable, if possible, to choose providers whose interests are aligned with those of the clients
and policymakers.
In the case of the PES program, we modify this diagram to allow the service provider to
be divided into two parts – the agency implementing the program, whom we will call the
intermediate service provider, and the forest-holders are the final service providers receiving the
payments and delivering environmental services. The service being provided is the conservation
of forests in order to generate higher quality and greater quantity of water, and the “clients” are
the institutions responsible for the provision of water at the municipal level.
Figure 9. Accountability schematic for PES, Mexico.Long route to accountability
Policymakers
CongressLobbying ContractsVoting Policy implementation
Intermediate serviceproviders
NGOCONAFOR
Short route to accountabilityFinal service
Clients Clients Client power providersWater consumers Water providers Forest holders
Ejidos

An Assessment of Mexico’s Payment for Environmental Services Program
58
We add several other important actors to the PES accountability scheme. First, we have
the members of the ejido. Because the payments are in many cases being given to common
property forests, it is important to consider how the lump sum transfer to the entire community
can be used to hold individual members accountable for the provision of the environmental
services. In addition, we add the consumers of water. Since consumers are often voters, they
are in a position to exercise power both over the federal policymakers and the water providers,
who are in many cases (elected) municipal authorities or private companies overseen by the
municipality. Finally, we add a dotted circle in the middle of the schematic representing a local
NGO. We do this because INE’s initial proposal was to find a local NGO to implement a pilot
PES program before undertaking a national level implementation. We will discuss the possible
implications of this choice below. In order to understand the present state of the program, let’s
consider the relationships between different actors, one by one, beginning with that between the
policymakers and the intermediate service provider, CONAFOR.
a. Policymaker-Intermediate Service Provider Relations
The policymakers, in this case, the administration through Secretary Lichtinger and
Congress, have the objective of preserving hydrological services, which they perceive are at great
risk of being lost. The instrument they choose to reach this objective is a payment program to
owners of standing forests. CONAFOR is chosen as the implementing agency for this program,
and as such it is accountable to the policymakers to operationalize the policy that has been
designed. The relationship between the policymaker and the intermediate provider is complex.
CONAFOR is part of the Secretariat of the Environment and in this sense is not separate from
the policymaker. However, CONAFOR, because it collects revenues from the forest
management permit system, has a certain degree of budgetary autonomy. In addition, while the
constituency of the policymaker is the entire country, the constituency of CONAFOR is a
subset – the owners of commercial forests. Some differences between the policymaker’s initial
objectives and the reality of the program arose because the rules of operation were still subject
to change when the program was transferred to CONAFOR. This gave CONAFOR
considerable influence over the program design, which allowed them to include commercial
forests and private properties among the final service providers, two categories that had not

An Assessment of Mexico’s Payment for Environmental Services Program
59
been contemplated in the initial program design. We will discuss the final impact of these
changes in the next section.
Had the program gone its proposed route through the Subsecretariat of SEMARNAT, it
would have followed the dotted line in the schematic above, with implementation of a pilot
program taking place through an NGO operating in the geographic area targeted by the pilot. It
is impossible to speculate what impact this would have had on the final form of the program,
because this would have depended upon the form of the contract between the government and
the NGO, as well as the constituency of the NGO. However, had the program taken this route,
it would not have been a national level effort, but rather a very small pilot program concentrated
in one or two watersheds. In this sense it would have been easier to promote and implement the
program, since the efforts of the administrative staff would not have been stretched over the
entire country. A more concentrated promotion would likely have minimized some of the
misunderstandings that occurred as a result of the pressured nature of CONAFOR’s
implementation. This takes us towards the next section, the relationship between the
intermediate service provider, CONAFOR, and the final service providers, the forest owners.
b. Intermediate-Final Service Provider Relations
The reason why CONAFOR’s inputs into the policy design resulted in big changes is
that CONAFOR does not have the same objectives as the policymakers because it is subject to
upward pressures from its existing constituency. This constituency, owners of commercial
forests, may contain some members of the appropriate final service providers – forest owners
whose properties are located in the recharge areas of overexploited aquifers – but not every
member of this group is an appropriate target for payments. What is important is that the
commercial forest owners have existing relationships with CONAFOR representatives that
allow them to exert pressure on the way the agency implements its programs. It was simply
easier for CONAFOR to communicate and negotiate with this group since they had already
established relationships through other programs. As we saw in the summary statistics section,
the result of this relationship was that 63% of participating ejidos extract wood for sale.
The characteristics of this constituency, combined with the very short time frame in
which it had to allocate the first round of payments, resulted in payments being distributed not

An Assessment of Mexico’s Payment for Environmental Services Program
60
according to water scarcity criteria, but rather to commercial forests or other types of forests
already receiving benefits through other CONAFOR programs. In particular, it would seem that
in some cases, the payments replaced traditional command and control policies for forest
conservation. As we saw in the case studies, payment recipients located in Biosphere Reserves
were previously forbidden to practice extractive activities in their forested areas. It is quite
possible that the reserve managers were aware that this restriction could not be enforced in the
long term, and that replacing the restriction with a conditional cash incentive through the PES
program would become more effective in preserving the forest in the long term. Similarly, in the
case of payments allocated to commercially held forests, CONAFOR and the programs it
operates to encourage sustainable forestry may be using the PES program as a way to implement
certain mandated policies – like not cutting forest in areas near rivers or springs. As we
observed in the case studies, the ejidos practicing forestry had put in the program hectares that
were either in their “reserve” lands – those where extraction is forbidden – or in the fallow lands
of their harvest rotation. In this sense, CONAFOR using the PES program to fulfill its
objectives of maintaining good relationships with its traditional clientele as well as of
guaranteeing the success of its existing programs.
An additional objective which influenced CONAFOR’s implementation of the program
in later rounds was the desire to support another of its programs –the Priority Mountains
Programs. This program’s budget was somewhat smaller than that of the PES program and it
shared the stated objective of preserving water production through forest conservation. These
two features made it logical to funnel the PES funds towards these mountains, with the useful
result of reducing administrative costs by concentrating the two programs in the same
geographical areas. Linking the two programs together would help guarantee the probability of
success of both of them by increasing funding and decreasing costs – a result with which any
administrative agency would be happy.
The most important impact of CONAFOR’s targeting scheme was to divert funds from
lands in priority watersheds to commercial forests and to hectares in Priority Mountains. 46%
of the 527,515 hectares enrolled in the PES program in 2004 were located in areas within the
Priority Mountains program. Although some of the mountains in the program are located
within overexploited watersheds, it is clear that many of the enrolled hectares were not
simultaneously in Priority Mountains and overexploited watersheds. As we saw in section IIIb,

An Assessment of Mexico’s Payment for Environmental Services Program
61
79% of the PES hectares in 2003 and 85% in 2004 were in watersheds which were categorized as
“not overexploited.” This is clearly not in line with the objectives of the program.
It seems that the maintenance of existing client relationships and of existing programs
took priority in the administration of the PES program, as was clear from the lack of
understanding of the purpose of the payments by final service providers. CONAFOR was
limited by the political timetable and hence did not spend significant time and energy putting
into place accountability mechanisms for the delivery of environmental services. Such
accountability would require clear understanding by the final service providers that the payments
were in exchange of the hydrological benefits provided by the standing forest. Upward
accountability from the payment recipients to CONAFOR was partially guaranteed through the
contracts which specify that payments are only awarded after a year of no change in the total
forest cover of the contracted properties. This relationship was strengthened by the fact that the
monitoring system uses satellite images to allow for the objective evaluation of forest cover at
the beginning and the end of the payment periods. Currently, monitoring is done randomly on
20% of the enrolled properties. In the past year, no payments have been withheld.
It is extremely important to recognize, however, that CONAFOR brought to the
program two essential benefits: the desire to implement the program and the political clout
necessary to obtain a budget for it from Congress. Without CONAFOR, it is very likely that
Hacienda would have blocked the allocation of money to a PES program indefinitely. The
tradeoff here is an important one: one chooses an intermediate service provider whose
incentives are partially misaligned with the objectives of the policymakers in exchange for
obtaining a budget for the program.

An Assessment of Mexico’s Payment for Environmental Services Program
62
c. Client-Service Provider
When we consider the relationship of the clients (water providers) with the forest
communities, we find a clear breakdown in accountability which is partly due to the nature of
environmental services. This is because environmental services are difficult to provide since
there is not always sufficient demand at the local level to justify supplying them (think of the
demand for carbon sequestered in trees in Chiapas). Even when local demand may exist, as is
the case for water, clients are not always aware of the relationship between environmental
conservation and the services it provides. As was described in the section on the evolution of
the payments program, the provision of water in Mexico is usually done by the municipality, or
by a private company under direct control of the municipality. There is a general sense among
these types of providers (although there is significant variation) that problems with water supply
are simply normal seasonal or yearly fluctuations which are not directly linked with overall
management of the watershed. Where water providers are concerned about this link, as is the
case in southern Veracruz and some states in Northern Mexico, this awareness was triggered by
severe drought years and crippling water shortages.
In terms of our schematic, this means that the relationship between the clients and the
policymakers can easily break down. Because water suppliers are unaware of the link between
the forests and water, and because they are also unaware of the PES program, there will also be
little pressure from water providers on the final service providers to see results in terms of
increased water quality and quantity as an outcome of the spending that is allocated to the PES
program. There will also be little pressure on Congress to continue allocating money to the
program. There is room for water consumers, who clearly benefit through lower long term
prices associated with preservation of their drinking supply, to exert an influence on
policymakers either directly or indirectly through water providers. Since water is the
responsibility of the municipal authorities, because they are either providing the water directly or
supervising a private water provider, citizens presumably take this service into account through
their votes. They might also go the long route and pressure Congress and the administration
directly. Again, however, the will to apply such pressure relies directly on water consumers’
understanding of the link between watershed management and water prices. This additionally
requires that consumers “feel” the scarcity of high quality potable water, which is currently not

An Assessment of Mexico’s Payment for Environmental Services Program
63
the case as the majority of municipalities have trouble collecting even a minimal fee for water
service.
d. Relationships within Final Service Providing Groups
Because most of the final service providers in the case of the Mexican program are
members of common property forests, we must also consider the behavior of the individuals
within these communities with respect to the payments. There is, in fact, an issue of
accountability here as well. The payments are given to the governing bodies of the communities,
the councils, which then allocate these sums. The way in which the sums are allocated depends
very much upon the relationship between the councils and the ejido members. In many cases,
the communication between these two entities is very good – members vote on all activities
concerning the ejido and there is transparency in financial matters. We saw this in many of our
case studies. We also saw that, partially as a result of the poor translation of the program
objectives by CONAFOR representatives, most of the communities did not know why they
were receiving the payments. This could be quite detrimental to achieving forest conservation.
Unless the payments are sufficiently large to cancel all individual needs to use the forest by
increasing their income by a substantial amount, it is essential that individuals understand that
the payments are being given conditional on not cutting down the forest. In other words,
individuals within the ejidos receiving payments must be held accountable for their actions
toward forest conservation by their internal governments.

An Assessment of Mexico’s Payment for Environmental Services Program
64
e. Summary
In sum, looking at the provision of environmental services through a policymaker-
provider-client lens helps us organize our thinking about the development and implementation
of the program. This is a case where the lines of accountability have been blurred on several
levels. First, CONAFOR is an essential intermediate service provider, but it is a provider whose
accountability to the policymakers is weakened by its budgetary autonomy and its commitments
to its traditional forestry constituency. In addition, at the moment of receiving the program,
CONAFOR was allowed to make considerable changes to the targeting and implementation
strategy. Because it experienced significant pressure from its constituents, the owners of
commercial forests, the majority of the land under contract is now commercial forest. As we
saw in the summary statistics section, the vast majority of the enrolled hectares are not in
priority watersheds. This combination of facts suggests that the pressures on CONAFOR
exercised by its constituency shifted funds away from forests in the watersheds that were
intended to be targeted by the program. Implementation of the program was further
complicated by the fact that the clients of hydrological services in Mexico are not able to exert
significant pressure on policymakers and on the providers of the services (the recipients of
payments) due to a lack of information about environmental services in general and the program
in particular. Clearly, however, the program has been successful on many fronts, and there are
many other aspects from which we can extract lessons. These will be the topics of the next
section.

An Assessment of Mexico’s Payment for Environmental Services Program
65
VI. Learning from the Mexican Experience
a. Lessons in political economy
There are multiple lessons to be derived from the administrative and political processes
to which the Mexican PES program was subjected. Many of the forces which modified the
program’s objectives were not foreseeable and could not have been circumvented. Among these
was the unfortunate resistance encountered in Hacienda which was partly due to the fact that
key actors there were busy trying to design and implement a program very similar to the PES. In
this section we focus on aspects of policy design and implementation which could provide useful
guidance for the continuation of Mexico’s program and for programs in other countries.
i. Lessons at the policymaker level
The first important lesson for policy designers is the need to establish clear objectives
and criteria for the program before promotional activities take place. The nationwide tour
resulted in confusion regarding the purpose, rules, and financial mechanisms of the program.
This resulted in bad blood at the local government level in places where trust funds were set up
for payments as well as an overabundance of unqualified applications, which merely exacerbated
CONAFOR’s staffing problem. Clearly defined criteria and objectives could also have helped
minimize the problems that occurred during the implementation phase and increase
transparency of the program. A well-defined program may have facilitated the early stage
negotiations with Hacienda and improved the quality of the “rules of operation”. In addition, a
framework with clear objectives would have facilitated the promotion of the program and the
understanding of it among the participants.
Participants in the early phases of the Mexican program emphasize the importance of
forming an advisory group of both national and international experts to aide in the policy design
process. The combination of expertise from outside the country and experts aware of the
realities of implementing programs in Mexico expedited the design of the program and allowed
recommendations to be made quickly and effectively. Whether or not these recommendations

An Assessment of Mexico’s Payment for Environmental Services Program
66
get implemented depends very much on the relationship between the policymakers and the
intermediate provider or implementing agencies, which leads us to the next point.
ii. Choice of Implementing Agency
In the Mexican case, the choice of CONAFOR as an intermediate service provider had
very important impacts on both payment structure and targeting. Many of these changes
resulted from the fact that CONAFOR’s traditional program objectives and constituency
differed from the program’s objectives and target population. In addition, CONAFOR’s
contract for the implementation of the PES program with the Secretariat of the Environment
was not clearly specified. There are two possible remedies for this situation: first, an
implementing agency could have been chosen whose objectives and constituency were more
closely aligned with those of the program. Such an agency could be one whose interests are
more similar to those of the water providers and whose knowledge of target communities is
more detailed. One alternative model might be to concentrate the responsibilities of program
design in a federal agency like INE, and, once the design is well-defined and the funding
guaranteed, allow implementation to occur on a local level through municipal offices or water
districts.
It is important to recognize, however, that without CONAFOR’s political clout, it is
likely that there would have been no program at all. It may very well be that the tradeoff for
getting the budget approved by Congress was the loss of a carefully planned pilot as well as
some skewing of the targeting criteria.

An Assessment of Mexico’s Payment for Environmental Services Program
67
iii. Intermediate provider service-provider contracts
The contracts between the intermediate provider, CONAFOR, and the final service
providers, the ejidos, must give the forest communities sufficient incentives to cease their
extractive activities in favor of conservation. This requires that payments be high enough to
compensate for the loss of forest extraction, agriculture, or cattle-grazing and that there be
sufficient monitoring and enforcement of program rules. The case studies and the statistics
regarding deforestation risk show us that much of the forest currently under contract is likely to
have a very low opportunity cost – that is to say, one would not have to pay very much in order
to compensate for the loss of income from activities currently taking place in these forests. In
this sense, the magnitude of the payments appears to be high enough given the forests that are
enrolled in the program – whether or not these payments would be high enough to preserve all
of the water services at risk of being lost is another issue, and one we will return to in the
discussion of targeting.
One way to eliminate the guesswork in the magnitude of payment design is to use an
auction process to induce potential participants to reveal the minimum payment which they
would accept in exchange for conservation of their forest. Although we have yet to hear of such
an approach being applied in an environmental services scheme, the Conservation Reserve
Program in the United States did take a step in this direction by allowing potential participants to
place a bid which can affect the probability that they will be included in the program.
One feature of the contracts which is important and easily replicable in other situations
is that contracts should be made over the entire forested area. Although in Mexico this was not
done for all of the communities, it is clearly an important lesson to be learned. In order to avoid
slippage, or the movement of productive activities from PES hectares to other previously
unused forests within the ejidos, it is very important that contracts for payments specified that
there should be no change in the entire forested area. This does not imply that payments should
be given for all of the hectares of forest within the ejido, but rather that the contracts should
eliminate the possibility that deforestation be reallocated from one spot in the community to
another. Agreements can allow for some pre-specified amount of forest conversion. Were the
program not to have followed this strategy, an ejido receiving payments for 10 out of 100
forested hectares within its boundaries might then deforest with impunity the remaining 90

An Assessment of Mexico’s Payment for Environmental Services Program
68
hectares not included in the program. Obviously the choice of which hectares to pay for should
not be arbitrary. The logical option is to pay for those hectares of land which are at risk of being
deforested. Such an approach is described in more detail in section c.iii
The timing of the payments would also be easy to replicate. Payments are given at the
end of each period, after verification of the conserved forest cover. In effect, the payments,
since they are made on a yearly basis, are a rental contract for the environmental services
provided by the forest over the year. This arrangement is logical since it is much easier to
withhold a payment than to request its return, and there is a clear moral hazard problem with
paying before the receipt of a service. As a result of the need to spend the initial budget quickly,
the first year’s payments were given for forest conserved in the previous year. This is not a
method we would recommend for other programs, although it was politically expedient.
An important part of being able to give or withhold payments relies on having an
objective measure of change in forest cover. Here we find another positive lesson from the
Mexican strategy, which was to use satellite images which are transparent and difficult to
manipulate by interested parties. The monitoring scheme consists in choosing communities at
random and assessing the quality of their forest cover at the end of the year, prior to receiving
the payment.
iv. Within community contracts
Mexico is unique in having most of its forest held under common property. However,
many other countries also have substantial tracts of forest under similar institutional
arrangements, and it is important to mention lessons learned within this context. The magnitude
of the payments is unlikely to generate forest conservation through an income effect. This
leaves the PES program in the category of conditional cash transfer, and as such, it is essential
that the conditions of the transfer be clear to recipients. As we saw in our case studies,
oftentimes recipients thought they were receiving payments as an anti-poverty measure. This
misunderstanding of program objectives can be very detrimental in the case where the
opportunity cost of the forest is high. This is a case of incomplete within-community contracts
that had at least some roots in the hasty promotion of the program.

An Assessment of Mexico’s Payment for Environmental Services Program
69
v. Give voice to water service providers
One final political lesson is to allow water service providers to participate in the design
and management of the program. Although bureaucratic limitations did not allow CONAFOR
to funnel the payments through the municipalities, the early participation of the water service
providers could have worked in several ways to bolster the success of the program. First,
because they know their localities, these service providers could have helped to target properties
which were particularly important for the provision of water. Although the general consensus is
that municipalities and private water providers in Mexico are not clearly aware of the
relationship between forests and water, participation in the program could have generated such
awareness. This knowledge is absolutely essential for the development of markets for
hydrological services, which is the final goal of the program. Finally, water service providers are
an important link in the accountability circle. They can generate awareness among consumers of
water, who can then pressure policymakers either directly or indirectly. The providers
themselves are directly linked with the government because they are either municipalities or
private providers operating under the supervision of municipal authorities who are in
communication with the government. They are, therefore, in a position to demand results from
the program – increasing the accountability of the environmental service providers, and helping
provide another source of pressure on policymakers to continue allocating a budget for the
program.

An Assessment of Mexico’s Payment for Environmental Services Program
70
b. Financing lessons
i. Sustainability of the funding source
As was described above, the current financing from the program, consisting in an annual
budget of $20 Million, has been approved by Congress. This does probably not qualify as a
sustainable financial arrangement since, though it has been written into law, it is decoupled from
the intentions of the program and subject to the political process. In some sense, however, the
Mexican program is seeking sustainability through the development of local markets for
environmental services, a criterion which led to the selection of ejidos with downstream
populations of over 5,000. As we saw in the section describing the current participants in the
program, the distribution of the enrolled hectares is widely dispersed. The small number of
participants per large population area may make it difficult to establish markets for two reasons.
First, there may not be a sufficient number of hectares enrolled to actually make a substantial
impact on the downstream water quality and quantity. Second, dispersion of the participants
may make it costly to organize such markets. Although the development of markets would be
sustainable as long as demand for environmental services is strong, it is currently unclear how
the transition from subsidy to market will occur.
In some Mexican cities, with Coatepec in Veracruz serving as an outstanding example,
markets for environmental services have developed in the absence of the payment program
(though the program has been used to support Coatepec in the past two years). It is important
to note, however, that initiation of the program in Coatepec followed a water crisis in the city
which raised the local demand for water services from forests in the mountains above the city.
ii. Guarantee long-term funding
Despite the potential tenuousness of the program’s budget, we do extract one very
positive lesson from the financing of Mexico’s program: the usefulness of creating a trust fund
which guarantees the ability to provide payments to recipient communities over an extended
period. For environmental services programs to be taken seriously, funding must be guaranteed
over a substantial period of time. The Mexican Forest Fund (FFM) is a clever mechanism which

An Assessment of Mexico’s Payment for Environmental Services Program
71
circumvents the political budgeting process by allowing money allocated in one year to be used
in subsequent years. This security, however, comes at the cost of a substantial part of the
budgeting money sitting idle each year. In the case of the FFM, as each year’s new budget
comes in, four fifths of it is put into the fund, where it is paid in equal installments over the next
four years. If one could rely on the yearly financing of the scheme, considerably more hectares
could be enrolled in the first five years of the process than are actually in it. However, in the
face of insecure political outcomes, the trust fund mechanism plays an important role in
enabling long term contracts with service providers in spite of reliance on politically uncertain
annual budget appropriations.
iii. Use bankable certificates
An alternative to the FFM approach is to use the strategy undertaken by PROCAMPO,
an agricultural subsidy program introduced in 1994 to compensate farmers for the negative price
effects of NAFTA. Under PROCAMPO, farmers are given payment certificates against which
they can borrow money from the bank. Using such a strategy would allow for all of the money
granted by Congress each year to be used to pay communities. Had such an approach been
taken, CONAFOR would have been able to contract five times as many hectares in 2003. The
key to making such a system work is a guarantee of funding from the federal budget for the
length of the contracts, in this case, five years.
iv. Develop a plan for continuing participation beyond 5 years
Up until now, there has been a lack of foresight in planning for the continued enrollment
of current participants in the program. In theory, land should continue to be enrolled until the
cost of such enrollment exceeds the environmental benefits generated by the forest. In many
cases, this will be in perpetuity, and planning must be undertaken in order to continue the
financing of the enrolled properties over the long term. The development of markets is clearly a
desirable way to satisfy this necessity. However, there may be many cases where markets cannot
be developed but where land is still of high environmental value. FFM funds should be set aside
to guarantee the financing of this land, while the development of markets where there is
effective demand for water service should be a priority.

An Assessment of Mexico’s Payment for Environmental Services Program
72
c. Targeting lessons
i. Target public goods important within national boundaries
Mexico was wise in its choice of hydrological services provided by forests as the focus of
the program. Because the water quality and quantity associated with forests is a good that is
solely consumed within watersheds, almost all of which are entirely within national boundaries, it
was much easier to seek financing from Congress and to look towards the development of local
markets.
Despite the fact that the targeting of the payments was skewed by the choice of the
implementing agency (see section IVb), the current targeting scheme is moving towards
achieving the goals of the program, with big improvements in the 2004 implementation, where
communities located in priority watersheds are given preference. It is also a scheme which
would be simple to apply in various contexts, although it does require having sufficient
information to prioritize the watersheds that are key to preserve the environmental service of
concern. One of the unforeseen benefits of the program is that the majority of the recipients
are either poor or very poor. In 2003, 72% of the recipients fell into these categories while in
2004 the percentage was 83. This occurred without any additional poverty targeting criteria.
This is the case in Mexico because the poor constitute the majority of forest-owners, but this
would not necessarily hold true in other contexts.
ii. Take into account risk of service loss
The most efficient way of allocating payments in environmental programs is to pay the
lowest cost possible for those hectares of land containing benefits that are at risk of being lost.
If the risk of service loss (in this case, deforestation) is not taken into account, then large
amounts of money will be spent paying for environmental services that were never at risk of
being lost in the first place. Our summary statistics on program participants in Mexico (see
section IIIa) showed that a large number of hectares enrolled (72% in 2003 and 52% in 2004)
had either low or very low risk of deforestation. This implies that the current targeting strategy
is inefficient. The efficiency of the current scheme could be enormously improved by taking
into account both the risk of losing these benefits and the cost of conserving them. In a 2004

An Assessment of Mexico’s Payment for Environmental Services Program
73
paper simulating the effects of different payment targeting schemes to ejidos in Mexico, Alix-
García, de Janvry and Sadoulet (2004) showed that for the same budget, payments allocated to
maximize expected benefits per dollar lead to a fourfold increase in efficiency over a scheme
analogous to the current one which offers a flat payment per hectare with a cap on the number
of allowable hectares.
Operationalizing this scheme means developing some measure of environmental
benefits, weighting these benefits by the deforestation risk, and creating a ratio of expected
benefits to opportunity cost which allows the ordering of properties. One then begins to pay
those with the highest expected benefit/cost ratio and proceeds down the line until the budget is
exhausted. Clearly, the three elements necessary to implement this scheme are: (1) some
measure of the environmental benefits offered by land in each ejido, (2) a measure of the
opportunity cost per hectare, and (3) an estimate of the risk of forest loss. It would be possible
to implement this approach by using a bidding process (as suggested above) to reveal the
opportunity cost of hectares in forest, and then use the ratio of the expected environmental
benefits to the bid made as the targeting criterion.
There has been some suggestion of varying payments in the program according to
vegetation type. To the extent that vegetation type is correlated with opportunity cost or the risk
of forest loss, this may be an effective strategy. However, this seems a blunt instrument
compared to the suggestion in the previous paragraph, or even compared to a system where
existing land market prices are used to predict the opportunity cost based on easily observable
characteristics (one of which may include vegetation type).
Payments in the second round of the program begin to fill one of the criteria of a
targeting strategy that maximizes environmental benefits per dollar, that is to say, payments are
broadly allocated to regions where water resources are over-utilized. They are, therefore,
directed towards communities where the environmental benefits are relatively higher. Another
related lesson is that, in general, where forestry projects are very profitable, forests will be
conserved because it is in the interest of the owners of this forest that it keeps supplying lumber
over the long term. Payments should therefore be directed away from these communities
towards those with unprofitable forestry projects or to non-commercial forests.
An Assessment of Mexico’s Payment for Environmental Services Program
74
iii. Avoid fragmentation
In 2003, the program enrolled 271 properties in 15 states. Figure 6 in section III shows
the distribution of the common properties which were enrolled during this period. The wide
dispersal of these properties works against the formation of local water markets. Although the
number of hectares of preserved forest required to have an impact on the water-providing
capacity of an aquifer will clearly vary by region, the wide dispersal of these properties suggests
that removing the program will not have a visible effect on local water supplies, and therefore it
is unlikely that water providers will be inclined to pay for the services provided. In addition, the
wide dispersal of the properties in the initial phases of the program increased the costs of
administration. The program would have been less expensive to promote and easier to monitor
had funds been focused on a small number of states in the first few years.
iv. Allow for payments outside of forest conservation
As was mentioned previously, there is some scientific evidence that cloud forests
provide more substantial water environmental services than do other types of forests. This
has resulted in a payment scheme which is differentiated by vegetation types. It has also
been suggested that other land uses might be associated with increased water infiltration,
including some agroforestry practices. To the extent that different land management
practices may augment water services, it is recommendable to allow them into the PES
program. Such practices have the additional advantage of being easier to contract upon and
enforce, given that they are easier to verify than a lack of deforestation.

An Assessment of Mexico’s Payment for Environmental Services Program
75
VI. Concluding remarks
We began this report with an overview of the state of the Mexican forest, whose
considerable riches are at risk of being lost due to a combination of perverse incentives, one of
which is the lack of a market for the environmental services that it provides. This forest is a
prime example of a natural resource which supplies services in addition to its extractive value; it
sequesters carbon dioxide, shelters biodiversity, prevents erosion, provides a destination for local
and international tourists, and plays an important role in regulating a complex hydrological
system. Mexico chose to pay for hydrological services through a PES program. The possibilities
and pitfalls of this experience have taught us lessons that will both help improve the Mexican
program and assist in designing PES programs for other services and in other countries.
Our analysis showed that payments as they were distributed in 2003 and 2004 did not
necessarily achieve the goals of the program – they were largely allocated to hectares of land
which were not within critical watersheds. They are also so fragmented in their distribution that
they are unlikely to be providing measurable services to downstream water providers. In
addition, they were not targeted at forests which were at risk of being lost. Our case studies
showed that there was little pressure to deforest in the communities chosen to receive payments
and that, as a result, there were very few behavioral changes induced by the program payments.
In some cases, however, the payments did serve to increase participation in conservation
activities. One serendipitous effect of the targeting was that the majority of payments went to
poor and very poor forest-holders.
The sources of this bias in the program are various. One of the most important was the
choice of service provider, CONAFOR, whose objectives were not directly aligned with those of
the proposed policy. The tradeoff in this choice, however, was a large one. CONAFOR was
very successful in lobbying for a budget for the program and in ensuring that its first phase was
implemented within a very restrictive political timetable. Other important factors which affected
and will continue to affect the program’s success are related to accountability. Without
awareness on the part of water providers and consumers, accountability of forest-holders to
provide environmental services will be very limited, and it is unlikely that local markets for
hydrological services will emerge. In addition, without pressure from these groups, it will
become increasingly difficult for the program to continue to receive budgetary support from

An Assessment of Mexico’s Payment for Environmental Services Program
76
Congress. There are also problems of accountability within communities – if the program
continues to be misunderstood by recipients, the contracts are likely to be broken and market
formation hindered.
The program in Mexico is still quite young, and will surely have many future lessons to
teach us. A thorough evaluation of the actual impact of the program on forest cover will
eventually need to be done, and this will require considerable GIS work as well as further
surveying of the participant (and some non-participating) communities. In addition, the
question of the optimal design of payment contracts in the context of forest common properties
has yet to be answered. As was clear from the introductory section assessing the risks of forest
loss at a national level, there are at least two different types of common property communities –
those that extract wood for sale and those that do not. It is entirely possible that different kinds
of contracts will be required for these two types of forest-holders.
Furthermore, we do not know whether the payment level that is currently being used is
appropriately set. It is clear that the payment level was high enough to attract a substantial
number of participants, but it would seem that often those who chose to participate had no
intention of cutting down the forest in the first place. As we saw in the case studies, some
communities showed absolutely no change in behavior upon receiving program payments. Part
of this may have been because the overall payment amounts were not very high; they could
probably have been lower with the same result. Calibration of the payments must take into
account the fact that forests at higher risk of deforestation, i.e., with a greater opportunity cost,
will require larger payments. The logical conclusion is that payments must be differentiated
according to the level of risk associated with a given forest. The design of such a differentiated
scheme, however, requires considerably more research.
Finally, recalling that the goal of the program is to develop markets for environmental
services within Mexico, an essential part of future research should include a rigorous assessment
of where these markets can truly be developed. This requires knowing which forests are
essential to which watersheds, if they are at risk or not, and the quality and quantity of the
demand for services by downstream users. Integral to such an analysis is identifying forests
which could be preserved through means other than environmental services payments –i.e.,
through changes in the incentive structure created by forest policy. The portrait of forests at risk
could then be completed by those which cannot be saved by markets or through changes in

An Assessment of Mexico’s Payment for Environmental Services Program
77
forest policy. It is these that will require either mandated protection or continuous payments
from federal or international funding sources.

An Assessment of Mexico’s Payment for Environmental Services Program
78
VII. References
Alix-Garcia, J., de Janvry, A., and Sadoulet, E. 2005. “A Tale of Two Communities: ExplainingDeforestation in Mexico.” World Development 33(2): 219-235.
Alix-Garcia, J., de Janvry, A., and Sadoulet, E. 2004. “Payments for Environmental Services: ToWhom, For What, and How Much?” Working Paper. Department of Agricultural andResource Economics, University of California at Berkeley.
Alix-Garcia, J. 2005. “Seeing the Forest and the Trees: A Spatial Analysis of Common PropertyDeforestation” Working Paper. Department of Agricultural and Resource Economics,University of California at Berkeley.
Antinori, C., Magaña Torres, O., Torres Rojo, J.M., Segura, G. y Barton Bray, D. 2004. “Reporteen Fase I del Reconocimiento Nacional de la Comunidad Forestal en México.” The TenthBiennial Conference of the International Association for the Study of Common Property(IASCP). Oaxaca, México, 9 – 13 August.
Central Intelligence Agency (CIA). 2005. World Fact Book 2004 Onlinehttp://www.cia.gov/cia/publications/factbook/fields/2004.html.
CNF, Comisión Nacional Forestal, Semarnat/Conafor. 2001. Programa Nacional Forestal 2001-2006.
Colegio de Posgrados (COLPOS). 2004. Valuación de Programa de Pago por Servicios AmbientalesHidrológicos
CONAPO. 2000. Indices de Marginación, 2000. Mexico City, Mexico.
de Janvry, Alain, and Elisabeth Sadoulet. 2005. “Making Conditional Cash Transfer ProgramsMore Efficient: Designing for Maximum Effect of the Conditionality.” World Bank EconomicReview, forthcoming.
Durán Medina, E., Velásquez A., Mas, J.F. 2004. “El cambio de uso del suelo como unindicador de la conservación en las regiones forestales de propiedad común y las áreasnaturales protegidas.” Paper presented at the Tenth Biennial Conference of the InternationalAssociation for the Study of Common Property (IASCP), Oaxaca, México. 9-13 August.
FIA. 2003. Web site of the International Automotive Federation “Down Mexico Way”http://www.fia.com/Automotive/Automotive/summer%201997/p5.html downloaded7/19/03
García Coll, I. 2002. “Potencial de Recarga de Acuíferos y Estabilización de Ciclos Hídricos deÁreas Forestadas.” Reporte de Investigación. México: INE-DGIPEA (processed).

An Assessment of Mexico’s Payment for Environmental Services Program
79
INE. 2004. Encuesta de los Ejidos Participantes en el Programa de PSAH
Mayrand, Karel and Paquin, Marc. 2004. “Payments for Environmental Services: A Survey andAssessment of Current Schemes.” Unisfera International Center (for the Commission forE n v i r o n m e n t a l C o o p e r a t i o n o f N o r t h A m e r i c a )http://www.cec.org/files/PDF/ECONOMY/PES-Unisfera_en.pdf
Muñoz, C., Guevara, A., Bulás, J.M., Torres, J.M., and Braña, J. 2005. “Pagar por los ServiciosHidrológicos del Bosque en México” Draft Book Chapter.
SEMARNAT. 2004. “La Experiencia de México en el Pago por Servicios AmbientalesHidrológicos y el Fondo Forestal Mexicano.” Powerpoint presentation.
Torres-Rojo, J.M., Magaña, O. Bray, D., Guevara A. and C. Muñoz P. 2005. “HumanDimensions in Forest Management Decision Making: Community Forest Management.Documento de Trabajo, CIDE.
Velázquez, A., Mas, J. y Palacio, J. 2003. Análisis del cambio de uso del suelo Convenio INE-IGg(UNAM) (Oficio de autorización de inversión 312.A.-00215), Instituto de Geografía, UNAM,Enero.
Velásquez, A., Durán, E., Ramirez, I., Mas, J.F., Bocco, G., Ramirez, G., and Palacio, J.L. 2003.“Land use cover change processes in highly biodiverse areas: the case of Oaxaca, Mexico.Global Environmental Change 13: 175-184.
World Bank. 2003. World Development Report 2004: Making Services World for Poor People. OxfordUniversity Press.
World Bank. 2005. Current World Bank Work on Payments for Ecological Services.http://lnweb18.worldbank.org/ESSD/envext.nsf/44ByDocName/PaymentsforEcologicalServicesCurrentProjects