an assessment of the impact of microfinance on …
TRANSCRIPT

1
AN ASSESSMENT OF THE IMPACT OF MICROFINANCE ON TECHNICAL
EFFICIENCY OF SOME COMMERCIAL CROPS IN NIGER STATE,
NIGERIA
BY
HussainaUmmikhanniMAHMUD
P13AGAE9010 (PhD /AGRIC /50618/2005-2006)
A THESIS SUBMITTED TO THE POST GRADUATE SCHOOL, AHMADU
BELLO UNIVERSITY ZARIA IN PARTIAL FULFILMENT OF THE
REQUIREMENTS FOR THE AWARDOF DOCTOR OF PHILOSOPHY
DEGREE IN AGRICULTURAL ECONOMICS
DEPARTMENT OF AGRICULTURAL ECONOMICS AND RURAL
SOCIOLOGY
FACULTY OF AGRICULTURE
AHMADU BELLO UNIVERSITY
ZARIA, KADUNA STATE
NIGERIA
JANUARY 2016

2
DECLARATION
I hereby declare that this thesis titled ―An Assessment of the Impact of Microfinance
on Technical Efficiency of Some Commercial Crops in Niger State, Nigeria” has
been written by me and is a record of my own research work. No part of this thesis has
been presented in any previous application for another degree or diploma in this or any
other institution. All borrowed information has been duly acknowledged in the text and
a list of references provided.
______________________________ _________________
HussainaUmmikhanni MAHMUD Date
Student

3
CERTIFICATION
This thesis titled ―An Assessment of the Impact of Microfinance on Technical
Efficiency of Some Commercial Crops in Niger State, Nigeria” by
HussainaUmmikhanniMAHMUD meets the regulations governing the award of the
degree of Doctor of Philosophy in Agricultural Economics of Ahmadu Bello
University, Zaria, and is approved for its contribution to knowledge and literary
presentation.
______________________________ ____________________
Prof S.A.Rahman Date Chairman,
Supervisory Committee
_______________________________ ______________________
Dr M. A DamisaDate
Member, Supervisory Committee
______________________________ ______________________
Prof. D.F OmokoreDate Member, Supervisory Committee
__________________________________ _____________________
Prof. Z. AbdulsalamDate Head,Deptof Agric. Economics
and Rural Sociology
___________________________________ ___________________
Prof. K Bala Date
Dean, Postgraduate Studies
Ahmadu Bello University, Zaria

4
DEDICATION
This thesis is dedicated to Uma, for all what she stood for me.
5
ACKNOWLEDGEMENT
My profound gratitude goes to Almighty Allah, for His Mercy, assistance, protection
and especially seeing me through this programme successfully. I am extremely grateful
to my supervisors namely, Prof. S.A Rahman, Dr M.A Damisaand Prof. Omokorefor
encouragements and supports-painstakingly going through copies of the thesis, making
corrections, offering very useful suggestions and advices, thus ensuring the final
completion of the study.
My heartfelt gratitude goes to my parents for their invaluable support and affection, my
husband Rt. Hon Umar Musa Ma‘ali and my children-Bilkisu, and the Twins Khadijah
and Aminah for their affection, time and understanding availed me throughout the
course of this study.
I am also thankful to my brothers and sisters that is ―ZubairuMahmuds‖ for their
encouragements and powerful prayers, particularly my twin sister- Hassana-Nafisah,
Prof. Mahmud M.Z, Mahmud Mahmud Z, Hairatu-Super,Jummai-Taibah and Laminde.
May the Cherisher of the world keep us all together in harmony (Amen).
My sincere gratitude goes to Dr Cornelius Adebayo, Mallam Suleiman Salihu of Agric-
Economics, ABU Zaria, MurtalaOmotosho, GaladimanGassolGambo W. Shumo, Mrs
Martina Ali of IAR Library, my big sister-in-law Madam Fatima MukhtarMahmud
andHaliduEbakaka.
The overwhelming assistance and cooperation from DG Niger State Microfinance
Board Alh. Bako .M Bawaand his staff, Mr James Ndatsuof data processing unit,Agric-
Economic Department, FUT Minna was highly appreciated.
Above all, may the peace and blessing of Allah (SWT) be upon his servant Muhammad
(SAW), his companions and followers (Amen).

6
TABLE OF CONTENTS
Content Page
Title Page .……………………………………….………………………………......i
Declaration…………………………………………………………………………...ii
Certification………………………………………………………………………….iii
Dedication…………………………………………………………………………...iv
Acknowledgements………………………………………………………………….v
Table of contents………………………………………………………………….....vi
List of tables………………………………………………………………………....ix
List of figures .............................................................................................................x
Abstract……………………………………………………………………………...xi
CHAPTER ONE……………………………………………………………………1
INTRODUCTION…………………………………………………………….........1
1.1 Background of the Study…………………………………………….………1
1.2 Problem Statement..………………………………………………………….3
1.3 Objective of the Study……………………………………………………….5
1.4 Justification for the Study…………………………………………………....6
1.5 Limitations of the Study………………………………………………….….8
1.6 Hypotheses ..................…………………………………………….………...8
CHAPTER TWO…………………………………………………………………...10
LITERATURE REVIEW………………………………………………................10
2.1 Conceptual Framework..........................………………..……………….….. 10
2.2 Theoretical Framework...........................................................................…… 11
2.3 Microfinance‘s Contribution to Agricultural Finance.…………………….. .13
2.4 Overview of Microfinance Activities in Nigeria…………….…………….. .20
2.5 Microfinance in Nigeria: Evolution and Challenges………………….…… .31
CHAPTER THREE……………………………………………………………….36
METHODOLOGY..……………………………………………………………….36
3.1 Study Area……………….………………………………………………….36

7
3.2 Sampling procedure………….……………………………………………...39
3.3 Method of Data Collection…………………………………….……………40
3.4 Analytical Tools……………………………………………………………..41
3.5 Test of Hypothesis…………………………………….…………………….46
3.6 Measurement of Variables and their a priori expectations ............................48
CHAPTER FOUR………………………………………………………………....53
RESULTS AND DISCUSSIONS…………………………………………………53
4.1 Socio-Economic characteristics of the Farmers………………………….….53
4.2 Determinants of Technical inefficiency in crop production……………..….59
4.3 Impact of Micro credit on determinant of technical inefficiency………..…..75
4.4 Accessibility of Microfinance to crop farmers……………………………....76
4.5 Problems militating against production efficiency of farmers in the
study area .......................................................................................................87
CHAPTER FIVE…………………………………………………………………..92
SUMMARY, RECOMMENDATIONS AND CONCLUSION…………..…….92
5.1 Summary……………………………………………………………………..92
5.2 Conclusions…………………………………………………………………. 94
5.3 Recommendations……………………………………………………………94
5.4 Contribution to Knowledge………………………………………………….96
REFERENCES………………………………………………………………………99
APPENDIX.................................................................................................................112

8
LIST OF TABLES
Table Page
Table 3.1 Microfinance Banks in Niger State and their Locations…………….....40
Table 3.2 Variables in Production Function and their a priori Expectations..........50
Table 3.3 Signs of coefficient in Technical Inefficiency Model.............................52
Table 4.1 Ages of the respondents..……………………………………………....54
Table 4.2 Level of Education……………………………………………….….....55
Table 4.3 Years of Farming Experience…………………...…………………......56
Table 4.4 Household Size of the Respondents…………………………………...57
Table 4.5 Farm Size Distribution………………………………………………... 58
Table 4.6 Gender of the Farmers………………………………………………....58
Table 4.7 Relationship between Inputs and Output for both groups of farmers ...61
Table 4.8 Elasticity of the Production and Return to Scale……………………...63
Table 4.9 Input/ Output Levels for both groups of Farmers….....…………….... 65
Table 4.10 Test of Output obtained from the two Groups of Farmers…………....66
Table 4.11 Frequency Distribution of Technical Efficiency Estimates…………....67
Table 4.12 Test of technical efficiency level obtained from the two
groups of farmers………………………………….....………………...69
Table 4.13 Maximum Likelihood Estimates for Loan beneficiary and
non- loan beneficiary farmers .........................................................…...72
Table 4.14 F-test between socio-economic factors and technical efficiency
in crop production among the two groups of farmers……....………….75
Table 4.15 Impact of Credit use on Technical Efficiency of the loan beneficiary
farmer………………………………………………….……....……….76
Table 4.16 Household Characteristics ……………………………………...……..78
Table 4.17 Characteristics of loan received by loan beneficiary farmers in
the study area……………………………………………………...…...79
Table 4.18 Factors Affecting Access to Credit by Crop Farmers…………….........83
Table 4.19 Determinant of Loan Size………………………………………….......87
Table 4.20 Summary of Problems faced by Crop farmers in the Study Area…......91

9
LIST OF FIGURES
Figures Page
Fig.1 Map of Nigeria showing Niger State ...........................……………......36
Fig. 2 Map of Niger Stateshowing the Study Area……………..…..…….... 37
Fig. 3 Distribution of Loan amount received by Loan beneficiaries…………80

10
ABSTRACT
The study was designed to carry out an assessment of the impact of microfinance on
technical efficiency of some commercial crops in Niger State. Major commercial crops
grown by the sampled farmers include yam, rice millet, maize cowpea, sorghum and
groundnut. These crops are grown in combination with another during one farming
season. A multistage sampling technique was usedin selecting the respondent farmers.
Primary data was used for this study.A cross-sectional data from farm survey of crop
farmers for 2014 growing season was collected from a total of 360 crop farmers
sampled from 18 Local Government Areas of the State. The tools used in analyzing the
data collected were descriptive statistics, stochastic production frontier and double
hurdle models. The results from the analysis of the socioeconomic characteristics of the
loan beneficiary and non-loan beneficiary farmers reveals that there was no significant
difference between both groups of farmers in terms of age, education levels, farming
experience and household size. Food crop production in the study area was found to be
inelastic with a decreasing return to scale for both groups of farmers. Whereas, the
mean output tested for both group was not statistically different from one another. The
result from the distribution and level of technical efficiencies for both groups of farmers
examined shows a mean technical efficiency of 52.9% and 74.2% for the loan
beneficiary and non-loan beneficiary farmers respectively. It further reveals a
significant difference in the technical efficiency level obtained by both groups of
farmers. The result also showed that there was a statistically significant relationship
between the socio-economic factor and technical efficiency in crop production among
the loan beneficiary and non-loan beneficiary farmers.It further indicates that 85.7%
and 3.9% of the total variation in aggregate food crop production by the loan
beneficiary and non-loan beneficiary respectively was due to technical inefficiency.The
impact of micro credit on technical efficiency of the loan beneficiary farmer shows that
credit use was statistically significant in respect of land, fertilizer and herbicides. While
it does not have any significant difference in terms of labour usage, quantity of seeds
and consequently the yield obtained as compared to the non-beneficiary farmer. Though
the accessibility of microfinance to crop farmers was found to be determined by
household and loan characteristic of the farmers. It shows that there was a significant
difference in the total income, farm capital, land size, household size and education
level between the two groups but no significant difference in their age, marital status,
farming experience and output level. It further shows that majority of the loan
beneficiaries (70) borrowed above N100, 000.00; the average loan amount borrowed
was N145, 166.67 at an average interest rate of 15.16% for 10months.Based on the
findings of the study, it was concluded that food crop farmers, especially microcredit
users‘ respondent in the study area, have low technical efficiency (TE) value and low
output levels. It further concludes that credit alone cannot engender higher technical
efficiency except it goes with other complementary factors such as good agricultural
practices (GAPs), efficient utilization of farm inputs, and timely disbursement of loan
and sufficient loan volume.

11
CHAPTER ONE
INTRODUCTION
1.1 Background to the Study
The practice of Microfinance in Nigeria is culturally rooted and dates back to several
centuries, with traditional role of providing credit for rural and urban low-income
earners in agriculture related businesses. The Microfinance Institutions are mainly of
the informal Self-Help Groups (SHGs) or Rotating Savings and Credit Association
(ROSCAs) types. Other providers of such services include savings collectors and co-
operative societies. However, the informal financial institutions generally have limited
outreach due primarily to paucity of loanable funds (CBN, 2005).
In Nigeria, credit has been recognised as an essential tool for promoting small and
Micro Enterprises (SMEs). About 70 percent of the population is engaged in the
informal sector or in agricultural production. The Federal and State governments have
recognized that for sustainable growth and development, the financial empowerment of
the rural areas is vital, being the repository of the predominantly poor in society and in
particular the SMEs. If this growth strategy is adopted and the latent entrepreneurial
capabilities of this large segment of the people is sufficiently stimulated and sustained,
then positive multipliers will be felt throughout the economy. In order to enhance the
flow of financial services to Nigerian rural areas, Government in the past has initiated a
series of publicly-financed micro/rural credit programmes and policies targeted at the
poor and to improve rural enterprise production capabilities (Olaitan, 2006). Notable
among such programmes were the Rural Banking Programme, sectoral allocation of
credits, a concessionary interest rate, and the Agricultural Credit Guarantee Scheme–
ACGS(1978). Other institutional arrangements were the establishment of the Nigerian

12
Agricultural and Co-operative Bank Limited- NACB(1972), the National Directorate of
Employment-NDE(1986), the Nigerian Agricultural Insurance Corporation-
NAIC(1987), the Peoples Bank of Nigeria- PBN(1989), the Community Banks-
CBs(1990), and the Family Economic Advancement Programme- FEAP(1997) (CBN,
2005). Despite these schemes, many rural businesses have not had adequate capital
finances, nor have they experience expansion in such businesses due to funding
constraints.
In 2000, Government merged the NACB with the PBN and FEAP to form the Nigerian
Agricultural Cooperative and Rural Development Bank Limited (NACRDB) to enhance
the provision of finance to the agricultural sector. It also created the National Poverty
Eradication Programme (NAPEP), National Agricultural and Land Development
Authority (NALDA), National Policy on Integrated Rural Development (NPIRD) and
others with the mandate of providing financial services to alleviate poverty(CBN,
2005).
Microfinance is about providing financial services to the poor who are traditionally not
served by the conventional financial institutions. It refers to the entire flexible
structures and processes by which financial services are delivered to micro
entrepreneurs as well as the poor and low income population on a sustainable basis. It
recognized poor and micro entrepreneurs who are excluded or denied access to
financial services on account of their inability to provide tangible assets as collateral for
credit facilities (Jamil, 2008). It plays an important role by alleviating poverty through
promoting the use of farm inputs. This in turn creates opportunities for increasing
agricultural productivity among small and marginal farmers (Nosiru, 2010).

13
Microfinance as a tool of rural financial services has a clear impact on poverty by
positively affecting the household economic development, ensuring Income Generating
Activities (IGA), sources of income, reducing vulnerability, housing tenure and
enterprise growth.
Microfinance does not just have a positive impact on poverty but on agricultural
productivity. Despite Nigeria‘s abundant agricultural resources and oil wealth, poverty
is still a challenge in the country (IFAD, 2009). Agricultural productivity is very low in
Nigeria. This is because about 90 percent of Nigeria‘s food is produced by small scale
farmers who cultivates small plots of land and depend on rainfall rather than on
irrigation. Neglect of rural infrastructure affects the profitability of agricultural
production. The neglect of rural roads impedes the marketing of agricultural
commodities; prevent farmers from selling their produce at reasonable prices and leads
to spoilage. Limited accessibility to credit cuts small scale farmers off from sources of
inputs, equipment and new technology and this keeps yields low (IFAD, 2009).
In realization of the enormous potentials of small and medium enterprises as an engine
room of economic development and grassroots empowerment, Microfinance are
granted to farmers for arable crop cultivation, roots crops cultivation, animal
husbandry, poultry farming, fish farming and processing and marketing of agricultural
products.
1.2 Problem Statement
Access to finance is a necessity when it comes to investing in economic activities so as
to ensure production and growth (Nosiru, 2010). Many times, the impact assessments
have been based on simple comparisons of loan beneficiaries and non- loan

14
beneficiaries from Microfinance institutions. However, not much has been debated on
the real impact of credit, particularly microcredit on production level.Proponents stated
that it reduces poverty through higher employment and higher incomes. This in
addition, is expected to lead to improved nutrition and improved education of the loan
beneficiaries' children. Some argued that microcredit empowers women (Goldberg,
2005). Critics say that microcredit has not increased incomes, but has driven poor
households into a debt trap (Bateman, 2010). They argued that the money from loans in
most cases are small and is often used for durable consumer goods or consumption
instead of being used for productive investments.
Despite the recent growth in the microfinance sector, advancing loans and credit to
farmers to increase crop production is still a challenge (Tenaw and Islam, 2009). Miller
(2011) reports that in order for microfinance organizations to venture into crop
agriculture, it is important to understand the context of crop agriculture and their
potential role in it. Indeed, agricultural microfinance is not business as usual but
requires a different approach from that typically applied in many microfinance
organizations. The agricultural sector is characterized by generally much lower returns
on capital, slower velocity of capital, higher uncontrolled risks and less understanding
of finance and business (Miller, 2011). Although, it is argued that improved
productivity and output levels will be achieved through the introduction of new
production technology, credit is a prerequisite to gain access to such technology
particularly for the small-scale farmers in Africa with little or no capital of their own.
Therefore, microfinance is very critical in increasing crop production.

15
The significant role of agriculture in nation building all over the world cannot be
overemphasized. Agriculture isa major contributor to Nigeria‘s Gross Domestic Product
and small-scale farmers play a dominant role in thiscontribution (Rahji and Fakayode
2009), but their productivity and growth are hindered by limited access tocredit
facilities (Odoemenem and Obinne 2010).
The problem is, there are many obstacles impeding the contribution of microfinance to
food and cash crops production. These are the quantity and volume of credit, credit
access, high transaction costs, and limited knowledge ofMicrofinance and inadequate
management of information system necessary for Microfinance to achieve positive
impacts on agricultural production in the study area. For this reason farmers rely on the
costly source of accessing financial services especially through informal sources at
higher costs and difficult loan terms and repayment, thus necessitating the research to
find out to what extend this institutions have contributed to crop production and the
factors militating against the achievement of farmers goals in the study area.
In the light of the above, this study tends to answer the following research questions:
i. What are the socioeconomic characteristics of the crop farmers who
borrowed from Microfinance and those who did not in the study area?
ii. What are the factors determining technical efficiency in crop production
among loan beneficiaries and non-loan beneficiaries of microfinance?
iii. What is the influence of microfinance on technical efficiency of crop
farmers in the study area?
iv. What are the factors determining the accessibility and farmers‘ level of
accessibility to microfinance in the study area?
v. What are the factors militating against crop production in the study area?

16
1.3 Objectives of the Study
The broad objective of the study was to examine the status and influence of
microfinance among crop farmers as well as the determinant of technical efficiency in
crop production in the study area. The specific objectives were to:
i. describe the socio-economic characteristics of crop farmers (both loan
beneficiaries and non-loan beneficiaries) in the study area;
ii. examine the determinants of technical efficiency in crop production among loan
beneficiaries and non-loan beneficiaries in the study area;
iii. determine the influence of microfinance on technical efficiency of crop farmers
in the study area;
iv. identify the factors determining the accessibility and level of accessibility to
microfinance among the loan beneficiaries;
v. identify the factorsmilitating against crop production in the study area.
1.4 Justification of the Study
Poverty reduction has been an important development challenge over decades. One of
theidentified constraints facing the poor is lack of access to formal sector funds to
enable them to take advantage of economic opportunities to increase their level of
output, hence move out of poverty. Traditional aid has not helped in solving this
problem. One of the development strategies to promote financial sustainability for poor
individuals in the society is microfinance (Lindvert, 2006).
Despite the significant demand for financial services in rural areas, institutions offering
financial services-such as Banks, credit unions, cooperatives, Microfinance Institutions
(MFIs) or insurance companies-are typically reluctant to serve in rural areas due to

17
precarious nature of agricultural production. As a result, the majority of poor
households are bereft of financial access to the formal financial system(CBN, 2014).
Although, a lot of changes were done on the policy framework establishing
microfinance, these were due to the perceived failure of the existing microfinance
framework. Adeyemi (2008) captured this thus, ―despite decades of public provision
and direction of provision of microcredit, policy orientation, and the entry of new
players, the supply of microcredit is still inadequate‖. He identified some of the
challenges which microfinance institutions face that impinge on their ability to perform
to include; undercapitalization, inefficient management and regulatory and supervisory
loopholes. To these, Mohammed and Hassan (2009) added usurious interest rates and
poor outreach. Further buttressing the challenges facing microfinance banks,
Nwanyanwu (2011) identified diversion of funds, inadequate finance, and frequent
changes in government policies, heavy transaction costs, huge loan losses, low capacity
and low technical skill in the industry as impediments to the growth of this subsector.
These challenges many of which contributed to the failure of previous microfinance
schemes are still be-devilling the microfinance banking scheme in Nigeria.
Though the informal institutions provide loans, but at exorbitant interest rates. The
setting up of micro financial institution will allow the poor to have easy access to credit
at relatively lower interest rate compared to the informal credit sources and in the same
vein, devoid of encumbrances (Anyanwu, 2004). The policy framework establishing
microfinance institutions in the country, saddles them with the responsibility of
providing easy, cheap and affordable financial services to resource poor farmers, in a
timely and competitive manner, which would enable them to undertake and develop

18
long-term, sustainable entrepreneurial skill, mobilizing loans and creating employment
opportunities and increase the productivity of these rural farmers, thereby increasing
their farm income and output and uplifting their standard of living (Olawuyi et al,
2010). Though Mejeha and Nnanna (2010) noted that among the factors responsible for
lack of significant effect of credit schemes are insufficient loan amount, poor loan
repayment and corrupt practices of loan beneficiaries and loan officials. Supporting this
view, Nwaru (2005) and Omeh (2006) stated that Nigerian small-scale farmers are
known to be economically weak with little or no capital investment. Consequently, they
use low technology tools and methods in their production activities, which in turn lead
to reduced output and productivity. Ekwueme et al (2007) and Ifeoma (2008)explained
that, inadequate access to economicresources especially financed by the numerous
sparselylocated farmers across Nigeria continues to inhibitagricultural development.
This calls for criticalexaminations and the adoption of an approach to avoiddeclaring
farmers ―an endangered species‖.
It is therefore an irony of circumstance that thesmall-scale farmers who produce about
85% of food consumed in thecountry and the agricultural exports are perpetually
handicapped by lackof production credit and bedeviled with poverty.Nevertheless, few
studies have been carried out to examine the influence of Microfinance on the technical
efficiency of farmers in Niger state. Thus, for a meaningful planning, it is desirable that
a study of this nature be carried out to identify factors militating against the
achievement of farmer‘s objectives which is optimum production, as well as access to
Microfinance in the study area. Also, it is anticipated that the findings from the study
would be useful to farmers in making medium and long-term investments, which will in
turn boost agricultural development as a whole.

19
1.5 Limitation of the Study
The factors that limited the scope of the study include the following:
i. The reliance on one season data made it impossible to account for production
uncertainties that are common in agricultural production.
1.6 Hypotheses
There is no significant relationship between output level of the beneficiaries
and non loan beneficiariesin crop production in the study area.
There is no significant difference in technical efficiency between the loan
beneficiaries and non loan beneficiary farmers from microfinance for crop
production.
There is no significant relationship between the socio-economic factors and
technical efficiency in crop production.

20
CHAPTER TWO
LITERATURE REVIEW
2.1 Conceptual Framework
The term 'Microfinance' means providing very poor families with very small loans
(Microfinance) to help them engage in productive activities or develops their tiny
businesses (The Microfinance Gateway, 2008). According to the Consultative Group to
Assist the Poor (CGAP), Microfinance is the supply of loans, savings and other basic
financial services to the poor, including working capital loans, consumer credit,
pensions, insurance and money transfer services. Similarly, Hossain (2002) defines
Microfinance as, the practice of offering small, collateral-free loans to members of
cooperatives who otherwise would not have access to the capital necessary to begin
small business or other income generating activities.
Microfinance helps an individual to become independent economically and provides
additionalincome generating activities (Rahman and Rahim, 2007).Micro enterprises
and small enterprises not only raise the living standards of the poor and the self-
employed,they also provide jobs and contribute to GDP and economic growth. Yet such
enterprises oftenhave limited access to financial services. Providing financial services
to the entrepreneurial poor increaseshousehold income, reduces unemployment, and
creates demand for other goods and services especiallynutrition, education, and health
services (Brandsma and Chaouali, 2004).Sociological perspective of micro finance
emphasize that access to credit provides the poor with productivecapital that helps to
build up their sense of dignity, independence, and self-confidence, and hence
aremotivated to become participants in the rural economy. Micro credit presents the
poor with income, food,shelter, education and health and can therefore have immediate
and long term consequences (Adams andBartholomew, 2010). Microfinance is

21
emerging a survival strategy of rural families in developing countries. It has proven
thatmicro credit is a powerful tool for poverty reduction by improving the ability of
poor people to increaseincomes and build assets (Herani et al. 2007). Microfinance
promoter favor raising lending rates to marketlevels to improve cost recovery. In credit
market, informal lending is much costly than formal lending butformal lending have
long process which poor people borrow (Briones, 2007). Microfinance plays a key
rolein fighting against poverty to build income and property. It is the main source for
poor to maintain theireconomic lifestyle in developing countries (Haq et al. 2008).
Khavul (2010) argues that microfinance is a new word, which is popularly used in the
field of finance in recent times. He further argues that the term microfinance constitutes
two words: micro and finance, which could mean small credit or ‗microcredit‘.
Nonetheless, the concept of microfinance goes far beyond small credit and it is to be
noted that not all small credit is microfinance (Khavul, 2010). Likewise, Ghosh (2006)
explains that microfinance constitutes various financial services, which mostly includes
savings and credit. It also contains other services like insurance, directed to eventually
benefit the poor or disadvantaged section of the population, especially those who are
economically poor.According to World Bank (2007), the term refers to provision of
financial services including saving and credit) to the poor. Micro-finance banks
therefore are institutions that are established to provide financial services to the poor.
2.2 The Theoretic Framework
It has been hypothesised that Microfinance as a tool of rural financial services has clear
impact on poverty by positively affecting the household economic development,
ensuring Income Generating Activities (IGA), sources of income, reducing

22
vulnerability, housing tenure, enterprise growth. Microfinance (MF) has become a
buzzword among the development practitioners. Hulme (2000) argues that MFIs are not
a cure for poverty. However, MFIs could create and provide a broad range of micro
financial services that would support poor people in their efforts to improve their own
prospects and the prospects of their families. He believes that effective Microfinance
makes these agencies designed to help the poor more likely to achieve the goals that
poor people seek to achieve.
Murdoch (1995) investigates that Micro-finance plays an important role in income and
consumption smoothing. Improved access to financial services can have two principal
effects on household outcomes. First, it can raise the expected value of income and
therefore of consumption and future investment and asset accumulation. This is the
traditional and often sole argument for provision of services by micro-finance
institutions. Second, it can decrease the variances of income and consumption. For the
food-insecure poor, it is particularly important to reduce the down-side risk of falling
below minimum levels of disposable income for consumption of food and other basic
needs.
Throughout the world, poor people are excluded from formal financial system.
Exclusion ranges from partial exclusion in developed countries to full or nearly full
exclusion in less developed countries (LDCs). Absent access to financial services, the
poor have developed a wide variety of informal community based financial
arrangement to meet their financial needs. Microfinance is created to fill this gap (Irobi,
2008). Similarly, Anyanwu (2004) noted that microfinance bank is not just providing
capital to the poor, but to also combat poverty at an individual level. It also has a role at

23
institutional level which creates institutions that deliver financial services to the poor
who are continuously ignored by the formal banking sector.
Khan (1997) suggests a variety of activities like financing housing, meeting basic
needs, and promoting and financing small entrepreneurs. All these aspects, however,
can be covered in a comprehensive integrated program with focus on micro financing
like Bangladesh and Bolivia which has, over the last 20 years, captured the interest of
multilateral donor agencies and private sector Bankers (Enugu Forum, 2006).
Adamu (2007) observed that microfinance institutions Nigeria have grown
phenomenally, driven largely by expanding informal sector activities and the reluctance
of commercial banks to fund emerging microenterprises. But, the number of
beneficiaries of microfinance institutions is an insignificant proportion of the people in
need of microfinance services. It has been estimated that formal microfinance
institutions only service less than one million clients, in a country where over 70% of
the country‘s population live below the poverty line (Dahiru and Zubair, 2008). The
results also suggested that micro-financing is unsuccessful at reaching the group most
prone to destitution, the vulnerable poor.The major challenges of microfinance in
Nigeria include: communication gaps and Inadequate awareness; insufficient support
from governments; inadequate donor funding; less attention on financial sustainability
of MFIs; lack of adequate loan or equity capital to increase loan-able funds; high
turnover of MFI staff; limited support for human and institutional capacity building;
illegal government and NGO operations that spoil the market; and lack of standardize
reporting and performance monitoring system for MFIs (Irobi, 2008).

24
2.3 Empirical Studies on Microfinance and Technical Efficiency of crop
Production
Studies carried out on micro-financing in Bangladesh revealed that, informal credit
sources such as local money lenders and wealthier community members often charge
interest rates that are prohibitively high. This as a result makes the landless poor in rural
Bangladesh to face severe liquidity constraints which affect their economic well being.
More specifically, the inability to access credit at reasonable rates of interest limits their
opportunities to rise above poverty by restricting their labour use, income and
productivity. It then can be hypothesized that micro credit is expected to have a positive
impact on the levels of consumption, employment, and productivity of the landless and
near landless poor in rural Bangladesh (Khandker, 1999).
Maldonado (2005) study investigated microfinance‘s impact on Bolivian rural
households‘ education choices. It identifies several effects of microfinance that
positively influence a household‘s demand for child education. Microfinance‘s ability
to expand a household‘s income and serve as an income smoother, the empowering
effect it has on women and their ability to make decisions regarding schooling, and the
demand microfinance creates for children‘s education—especially in programs that
include an educational aspect for the mother—all lead to higher rates of primary school
enrolment and completion.
Gobbi et al (2005) has done a comparative analysis of the two survey conducted in
Nepal and Pakistan. They interviewed 100 women clients from at least three different
microfinance institutions for each country. The women represent a sample that have
borrowed in initial micro finance loan and apply for loans to start their own business.
25
The institutions which were selected, Priority was given to those that took into the
account achievements of gender equality, empowerment, saving and self-sustainability.
Their study showed that micro finance industry is fast growing in both countries and the
outcomes are significant in both countries. The result showed a positive impact on
profits and sales of their products in both the countries.
Girabi and Mwakaje (2013) study the impact of microfinance on smallholder farm
productivity in Tanzania. Using descriptive and regression analysis, they find that credit
beneficiary realize high agricultural productivity compared to the non-credit beneficiary
respondents. They also find that major factors hindering smallholder farmers‘ access to
credit are lack of information, inadequate credit supply, high interest rates and
defaulting.
Jegede et al. (2011), in a study on impact of microfinance on poverty alleviation in
Nigeria noted a significant effect of microfinance institution in alleviating poverty by
increasing income and changing economic status of those who patronize them and
concluded that microfinance is indeed a potent strategy of poverty reduction and a
viable tool for purveying credit to the poor.
Appah et al. (2012), in a similar study carried out in Bayelsa state also noted a
significant differences between microfinance and status of women in the state
concludes that microfinance alone cannot reduce poverty in any society where basic
infrastructures like good roads, steady power supply, good transportation system etc are
nearly not available for women to benefit from the introduction of microfinance in
Nigeria.

26
i. Concept of Production Efficiency
Production efficiency is an economic level at which the economy can no longer
produce additional amounts of a good without lowering the production level of another
product. Production efficiency is concerned with the relative performance of the
process used in transforming inputs into output. This will happen when an economy is
operating along its production possibility frontier. It is the ability to produce a good
using the fewest resources possible. Efficient production is achieved when a product is
created at its lowest average total cost. Thus, Productive efficiency occurs when the
economy is utilizing all of its resources efficiently.
The concept is illustrated on a production possibility frontier (PPF) where all points on
the curve are points of maximum productive efficiency (i.e., no more output can be
achieved from the given inputs). Equilibrium may be productively efficient without
being allocatively efficient i.e. it may result in a distribution of goods where social
welfare is not maximized (Standish, 2000).Productive efficiency takes place when
production of one good is achieved at the lowest cost possible, given the production of
the other good(s). Equivalently, it is when the highest possible output of one good is
produced, given the production level of the other good(s). In long-run equilibrium for
perfectly competitive markets, this is where average cost is at the base on the average
(total) cost curve i.e. where MC=A (T)C.
Productive efficiency requires that all firms operate using best-practice technological
and managerial processes. By improving these processes, an economy or business can
extend its production possibility frontier outward and increase efficiency further.The

27
concept of efficiency is concerned with the relative performance of the processes used
in transforming given inputs into outputs.
ii. Empirical Studies on Productivity and Technical Efficiency
Win et al. (2007), investigates factors influence technical efficiency in groundnut
production systems among farmers in Mandalay division and Magway division,
Myanmar. Mandalay and Magway divisions are regions where the groundnut
productions have grown the largest areas annually in Myanmar. Primary data were used
in the analysis of data. The analytical tools include descriptive statistic and stochastic
frontier production function by using the maximum likelihood estimation (MLE). MLE
is applied on a cross-sectional of 282 sampled farmers during 2006-07 cropping season.
The efficiency measure is regressed on set explanatory variables which include seed
(kg/ha), land (ha), amount of chemical fertilizers (kg/ha), amount of farmyard manure
(kg/ha), cost of insecticides and pesticides (kg/ha), labor (man day) access to
institutions, and access to government services. The result shows that the mean
efficiency in groundnut production is about 0.59. It means that it can be rise the
groundnut production of Myanmar in this areas about 0.41 (41%) to produce at
efficiency level.
Bravo-Ureta and Pinheiro (1997) used the stochastic parametric model to measure the
technical, allocative and economic efficiencies in recent agricultural production
efficiency studies. In their study of peasant farming in the Dominican Republic, using
the Cobb-Douglas production frontiers, found that younger and more educated farmers
exhibited higher levels of technical efficiency and that, additionally, contract farming,

28
medium-size farms and being an agrarian reform beneficiary had a positive association
with economic and allocative efficiencies.
Ajibefun and Daramola (1999) investigated the technical inefficiency in poultry egg
production in Ondo State, Nigeria, and concluded that older birds tended to be less
inefficient in egg production, and that the higher the level of education and the years of
experience of the decision maker of the farm, the less the level of technical inefficiency.
The stochastic frontier method was employed in this study.
Liverpool-Tasie et.al (2011),noted that the levels of technical efficiency and
productivity differ by crop, location and cropping system. Though there are some
exceptions, and Nigerian farmers across all regions are below their production frontiers
and consequently the opportunity exists to increase their productivity above existing
level.
Similarly, in a study by Rahman and Umar (2009) on measurement of technical
efficiency and its determinants in crop production in Lafia Local Government Area of
Nasarawa State of Nigeria using a stochastic frontier production model noted that sixty
five percent (65%) of the farmers were within the age range of 31-50 years and 67%
had farm size ranging from 2-4 hectares. While the technical efficiency of crop
production range from 32.7% to 89.4% with mean of 69.6%. Farm size and fertilizer
were the major inputs that are associated with the variation in crop output. It also
revealed that significant socio economic variables that accounted for the observed
variations in technical efficiency among crop farmers were age, gender, marital status,
household size, other occupation and land ownership.

29
iii. Empirical Studies on the Influence of Credit on Crop Production
Advocates of microfinance argue that Microfinance is a powerful tool used to alleviate
poverty. In recent times, however, many studies do suggest that the reality promise of
microfinance may be less attractive than the promise. Adams and Bartholomew (2010)
examined the impact of microfinance from the perspectives of maize farmers in
Nkoranza in the Brong Ahafo Region of Ghana. The findings of the study based on a
survey of 100 participants in the microfinance program suggest that the impact of
microfinance on both social and economic wellbeing is marginal. The key issue
identified by most of the recipients is lack of entrepreneurial skills and market for their
produce. The key recommendation from the study is the need improve infrastructure
and establish linkages between the farm and non-farm sectors of the rural economy.
Similarly, Gender activists also argue in favour of microfinance as a means of
empowerment by supporting women‘s economic participation. Boyle (2009) claims that
by supporting women‘s economic participation, microfinance helps to improve
household well-being. Littlefield (2005) reports that the opportunities created by credit
availability helps a lot of poor people to invest in their own businesses, educate their
children, improve their healthcare and promote their overall well-being. This is
supported by a study by Karlan and Zinman (2006) in South Africa where recipients of
Microfinance were shown to be better off than non-beneficiaries. In another study by
Khan and Rahaman (2007) in the Chittagong district in Bangladesh, recipients of
microfinance facilities were reported to improve their livelihoods and moved out of
poverty. More importantly, Khan and Rahaman (2007) reported that microfinance

30
recipients had empowered themselves and become very active participants in the
economy.
Furthermore, using a regression model to examine the impact of microfinance, Priya
(2006) found that there is significant positive relationship between credit recipients and
income; the findings suggest that program participation led to a 10% increase in
income. However, the UNCDF (2009) report suggests that though Microfinance may be
helpful in reducing poverty, it is never a panacea and that it is only one of such tools to
reduce poverty or the vulnerabilities of the poor. Buckley (1997) and Rogaly (1996)
have also noted that microfinance may not always be the best tool to help the poorest of
the poor. A similar argument is made by Hashemi and Rosenberg (2006) who claim
that microfinance does not reach the poorest in the community.
2.4Overview of Microfinance Activities in Nigeria
Before the emergence of formal Microfinance institutions, informal Microfinance
activities flourished all over the country. Informal Microfinance is provided by
traditional groups that work together for the mutual benefits of their members. These
groups provide savings and credit services to their members. The informal
Microfinance arrangements operate under different names: The Yoruba ethnic group
refers to it as Esusu or Ajo, Igbos refer to it as Isusu or Uto and the Hausa call Adashi
(Anyanwu 2004, Basu et al 2004, Alabi et al 2007, Onaolapo and Oladejo 2011). The
key features of these informal schemes are savings and credit components, informality
of operations and higher interest rates in relation to the formal Banking sector. The
informal associations that operate traditional Microfinance in various forms are found
in all the rural communities in Nigeria (Otu et al., 2003). They also operate in the urban

31
centres. However, the size of activities covered under the scheme has not been
determined. The non-traditional, formalized Microfinance institutions (MFIs) are
operating side by side with the informal services. The financial services provided by the
MFIs in Nigeria include savings, credit and insurance facilities. In Nigeria, the formal
financial system provides services to about 35% of the economically active population
while the remaining 65% are excluded from access to financial services (CBN, 2011).
This 65% are often served by the informal financial sector, through Non-Governmental
Organization (NGO)-microfinance institutions, money-lenders, friends, relatives, and
credit unions (CBN, 2011).
Microfinance services, particularly, those sponsored by government, have adopted the
traditional supply-led, subsidized credit approach mainly directed to the agricultural
sector and non-farm activities, such as trading, tailoring, weaving, blacksmithing, agro-
processing and transportation. Although the services have resulted in an increased level
of credit disbursement and gains in agricultural production and other activities, the
effects were short-lived, due to the unsustainable nature of the programmes.
The microfinance industry in Nigeria had been confronted by numerous challenges
since the launch of the Microfinance Policy Framework in December, 2005. Coming on
the heels of the banking sector consolidation, many of those adversely affected found
their way into microfinance. Thus, a significant number of the newly licensed MFBs
were established or operated like ‗mini-commercial banks‘. Also, the erstwhile
community banks (CBs) that converted to MFBs did not fare any better (CBN, 2011).
With regards to the provision of financial services, Nigeria lags behind many African
countries. In2010, 36% of adults – roughly 31 million out of an adult population of 85
million – were servedby formal financial services. This figure compares to 68% in
32
South Africa and 41% in Kenya (CBN, 2012).Several factors have accounted for the
persisting gap in access to financial services. For instance, the distribution of
microfinance banks in Nigeria is not even, as many of the banks are concentrated in a
particular section of the country, which investors perceived to possess high business
volume and profitability. Also, many of the banks carried over the inefficiencies and
challenges faced during the community banking era. In addition, the dearth of
knowledge and skills in microfinancing affected the performance of the MFBs.
Furthermore, there are still inadequate funds for intermediation owing to lack of
aggressive savings mobilization, inability to attract commercial capital, and the non
establishment of the Microfinance Development Fund (CBN, 2011).
An assessment of the microfinance sub-sector, following the launching of the policy
however revealed some improvements. These include increased awareness among
stakeholders such as governments, regulatory authorities, investors, development
partners, financial institutions and technical assistance providers on microfinance.
Specifically, a total of 866 microfinance banks have been licensed (between2006-
2010), Microfinance Certification Programme (MCP) for operators of microfinance
banks put in place and the promotional machinery beefed up. Accordingly,
entrepreneurs are taking advantage of the opportunities offered by increasingly
demanding for financial services such as credit, savings, payment services, financial
advice and non financial services (CBN, 2011).
Nigeria has the third highest number of poor people in the world. Most of these poor
people are dependent on micro and small-scale farm and off-farm enterprises for their
livelihood. As such, their entrepreneurial contributions are strategic to the Nigerian
33
economic development and their growth has great potential to contribute to income
generation and poverty alleviation. One of the challenges Microfinance currently faces
in Nigeria is for the MFIs to reach a greater number of the poor (CBN, 2005). The size
of the un-served market by the existing financial institutions is large. Enhancing
Financial Innovations and Access (EFInA), in its Access to Finance Survey in Nigeria
in 2008, alluded to the fact that 79 per cent of the total population in Nigeria is
unbanked out of which 86 per cent are rural dwellers. Also in 2005, the aggregate
microcredit facilities in Nigeria accounted for about 0.2 per cent of Gross Domestic
Product (GDP) and less than one per cent of total credit to the economy (CBN, 2011).
This revealed the existence of a huge gap in the provision of financial services to a
large number of the economically active poor and low income households. The effect of
not addressing this situation appropriately would further accentuate poverty and slow
down growth and development (CBN, 2011).
Globally, micro, small and medium enterprises (MSMEs) are known to contribute to
poverty alleviation through their employment generating potentials. In Nigeria,
however, the employment generation potentials of small businesses have been seriously
constrained by lack of access to finance, either to start, expand or modernize their
present scope of economic activities. Delivering on employment generation and poverty
alleviation by MSMEs, would require multiple channels of financial services, which an
improved Microfinance framework should provide (CBN, 2011).
Government interventions, through a multiplicity of credit institutions established in
recent years, have not resulted in significant improvement in financial intermediation.
The liberalization of the economy since the introduction of the Structural Adjustment

34
Program in the 1980s has tended to exacerbate the financial problems of the agricultural
sector. Loanable funds from government sources have dwindled considerably. The cost
of borrowing has escalated and the financial outlay for agricultural enterprises has
multiplied several-fold irrespective of the scale of operation, due to the ravages of
inflation. Consequently, only a limited number of entrepreneurs are in a position to
meet their financial requirements. The difficulties faced by agricultural financing are
not unrelated to the liberalization of the economy and reforms in the financial sector in
particular(Olomola and Gyimah-Brempong,2014). Unlike the situation during the pre–
structural adjustment era, lending to agriculture has been decontrolled since the mid-
1980s. Interest rates are now determined on the basis of market fundamentals. Usually,
commercial banks set their lending rates based on the Central Bank of Nigeria (CBN)
rates, the risk levels, the cost of doing business (which has been judged to be very high
in the country), and profit markups and other considerations. This results in very high
lending interest rates for the private sector in general and for agriculture in particular.
Rates are sometimes in the double digits and appear very unattractive to any investor in
the agricultural sector. This has accounted for commercial banks‘ low rate of
participation in agricultural financing. Moreover, monetary policy provides a risk-free
haven for commercial banks to invest in. The open market operations of the CBN,
which involve mopping up excess liquidity through the issuance of government
securities in an attempt to control inflation, has indirectly affected the flow of
investment funds to the agricultural sector. More often than not, the biggest buyers of
such securities are commercial banks. In such cases, funds that should have been loaned
out to the private sector by banks are instead invested in risk-free government
securities. This leads to the crowding out of bank lending to the private sector, making

35
it even more difficult for highly risky sectors such as agriculture (Olomola and
Gyimah-Brempong,2014).
The agricultural sector has been poorly served by the financial system partly on account
of the unfavourable policy environment, which includes weak regulatory regimes, poor
physical and financial infrastructure, and policies that repress the formation of effective
linkages between the financial and real sectors of the economy. The Nigerian financial
sector has witnessed fundamental reforms since 2005, but the effects on agricultural
financing have been lackluster. The traditional arguments that the agricultural sector is
too risky, farmers are too dispersed and inaccessible in remote rural locations as well as
the supply-side constraints continue to be relevant. It is still expensive to provide
financial services in rural areas, which typically less-dense economic activity poorer
infrastructure than urban areas and is more subject to risks from weather and
agricultural price changes(Olomola and Gyimah-Brempong, 2014).
(a) Goals of Microfinance Institutions
The establishment of Microfinance banks in Nigeria has become imperative to serve the
following purposes (CBN, 2011):
i.Provision of timely, diversified, affordable and dependablefinancial services
economically active poor;
ii. Creation of employment opportunities and increase the productivity and
household income of the active poor in the country, thereby enhancing
their standard of living;

36
iii. Promotion of synergy and mainstreaming of the informal Microfinance
sub-sector into the formal financial system;
iv. Enhancement of service delivery to micro, small and medium enterprises
(MSMEs);
v. Mobilization of savings for intermediation and rural transformation;
vi. Promotion of linkage programmes between microfinance institutions
(MFIs), Deposit Money Banks (DMBs), Development Finance Institutions
(DFIs) and specialized funding institutions;
vii. Provision of dependable avenues for the administration of the microcredit
programmes of government and high net worth individuals on a non-
recourse basis; and
viii. Promotion of a platform for microfinance service providers to network
and exchange views and share experiences.
(b) Microfinance Suppliers
(i) Commercial Agriculture Credit Scheme (CACS)
As part of its developmental role, the Central Bank of Nigeria (CBN) in collaboration
with the Federal Government of Nigeria, represented by the Federal Ministry of
Agriculture and Rural Development (FMARD) established the Commercial Agriculture
Credit Scheme, hereinafter referred to as CACS, for promoting commercial agricultural
enterprises in Nigeria, which is a sub–component of the Federal Government of Nigeria

37
Commercial Agriculture Development Programme (CADP). This Fund was to
complement other special initiatives of the Central Bank of Nigeria in providing
concessionary funding for agriculture such as the Agricultural Credit Guarantee
Scheme (ACGS) which is mostly for small scale farmers, Interest Draw-back scheme,
Agricultural Credit Support Scheme, etc (CBN, 2014). The scheme was to be financed
from the proceeds of the N200billion three (3) year bond raised by the Debt
Management Office (DMO). The fund was to be made available to the participating
bank(s) to finance commercial agricultural enterprises. In addition, each State
Government could borrow up to N1.0billion for on-lending to farmers‘ cooperative
societies and other areas of agricultural development provided such
initiatives/interventions are in line with the objectives of CACS (CBN, 2014).
(ii). Development Finance Institutions
Development Finance Institutions (DFIs) channel the public sector's access to financial
initiativesfor Micro,Small and Medium Enterprises (MSMEs). Unfortunately, while
DFIs run multiple interventions, client outreach is limited.
The Bank of Agriculture (BoA) serves 1.9 million clients – mainly farmers,
entrepreneurs andwomen's groups – including 700,000 MSME clients with loans
provided at 8% p.a. The BoA hasdeveloped rural branch networks encouraging
cooperative societies and self-help groups.However, the BoA has been a loss-making
institution largely due to capital depletion from OpExand lean losses.
While the Bank of Industry (BoI) targets SMEs across all sectors with loan rates capped
at 10%. Majorinterventions by BoI include the NGN 5 billion Small Business
Development Fund, the USD 4million accessesto Renewable Energy Project and the

38
NGN 3 billion MSME Development Fund.Revenue growth has been limited by its
small asset portfolio but the bank is profit-making,achieving NGN 2.6 billion in 2010
(CBN, 2012)
(iii) Commercial Banks and Microfinance Institutions
Following the 2009 financial crisis and CBN intervention, the sector has
undergoneconsolidation, with three banks being acquired by existing local players and a
further threenationalized by the Asset Management Corporation of Nigeria (AMCON),
resulting in a total of21 commercial banks as of September 2011.Between 2006 and
2011, total assets grew by 29% and deposits by 35%. High-cost branch distribution
channels largely drove this growth. Commercial banks, while not operating at their
optimum, are best placed to drive FinancialInclusion due to their large network and
capital base (CBN, 2012).
While the Non-bank microfinance institutions (MFIs), which include financial NGOs,
financial cooperatives,self-help groups, trade associations and credit unions, though not
regulated by the Central Bank ofNigeria work through linkageprogrammes such as
RUFIN. Today, 671 MFIs are registered with CBN, serving 346,266clients (CBN,
2012).
(c) Challenges of Micro Financing
i. Rates of interest
According to Anyanwu (2004) the interest rates in the Microfinance institutions are
much higher than the prevailing rates in the Banks. This ranges between 32-48%.

39
During this period the Banks are charging between 19.5% and 21.6 % (Anyanwu,
2004). Money lenders at informal sector charge interest rates of 100% or more. Some of
the clients when interviewed by MFI evaluators bitterly complained about the interest
rates being too high.
Two reflections could be made. First, given the fact that people borrowing at this rate
indicate that they are industrious and productive. It is only that they are not given
access to financial institutions, because they do not have collateral to meet the
requirements of formal financial institutions and then they remain poor and liabilities to
the economy instead of being assets. Second, the objective of Microfinance to combat
poverty might be defeated since the clients have to repay back double of what they have
received at all cost.
ii. Inequitable in the Distribution of Wealth and Income
The conventional Micro financing in Nigeria aggravates the inequitable distribution of
income and wealth in Nigeria. This is due to the fact that while interest rate on
borrowing from Microfinance institutions ranges from 30% to 100%, interest rates on
both voluntary and mandatory savings for the clients are between 4.5% and 6% per
annum. Again, lending at this rate is taking the rewards of poor and redistributes it to
the rich. The poor loan beneficiaries must pay the amount through group pressure even
if it resort them to another borrowing or selling their properties (Anyanwu, 2004).
Moreover, the current micro financing in Nigeria gives loan to commerce based activity
to the detriment of agriculture based which is the source of income and sustenance for
the majority of poor Nigerians. In a study conducted by CBN on the major ten MFIs in

40
Nigeria it was found that the loan disbursement goes to the trade and commerce
because of its fast yield and high return. The average loan on this sector was 78.4%.
The corresponding figure on agriculture which most poor rely on for their livelihood
was only 14.1%. It was only 3.5% on manufacturing and absolutely no funding is given
towards housing and consumption (Folake, 2005).
iii. Outreaching the poor
According to Central Bank of Nigeria‗s estimate the unreachable client of Microfinance
reaches 40 million (CBN, 2004). Microfinance specific institutions in Nigeria have not
been able to adequately address the gap in terms of credit, savings and other financial
services required by the micro entrepreneurs. The existence of huge un-served market -
over 80 million people (65% of Nigeria‘s active population).In 2005, the share of micro
credit as a percentage of total credit was 0.9%, while it contributed a meagre 0.2
percent of the GDP (Bamisile, 2006). The inequitable redistribution exists in the sense
that the Microfinance institutions represent the rich category of the people while the
clients represent poor category and still the former charge the latter higher interest rate
on loan as high as 100% in some cases and pays only 5% on savings made by the
clients, an unfair justification for that matter.
According to the CBN Governor after introducing new policy on Microfinance he
stated that the new focus on small and medium-scale enterprises was borne out of the
realization that the country could not go far in employment generation and poverty
alleviation without these enterprises having their pride of place (Soludo, 2008). He
added that the Microfinance policy, which evolved as a result of the perceived need for
funding of businesses, which have no access to Banks. These Funds will benefit only

41
35 per cent of the nation‘s population, particularly micro and small scale entrepreneurs,
due to uneven spread of the MFBs across the states (Soludo, 2008).
It is well documented that for many small and development oriented donor agency
(multilateral and large scale farmers) that lack of access to financial services is bilateral
and a critical constraint to the establishment or expansion of a Microfinance programme
and many viable agricultural enterprises. Microfinance may enable the small and
marginal farmers to purchase inputs which are needed to increase their productivity, as
well as financing other agricultural activities. With an estimated 1.3 billion people of
the world, access to savings facilities also plays a key part in living on incomes of less
than $1 a day. Though most Governments (especially the Sub-Saharan Africa) employ
programmes which enables the poor to smoothen their consumption, expenditures and
financing investments which improves their livelihood. These results in enormous
productivity in agriculture and other economic activities and hence, reduces poverty.
However, a lot has to be done to integrate Microfinance institutions fully into the
mainstream of rural services such as savings and credit to the poor. Also financial
systems especially commercial banks have to recognize household finances as
necessary but not a sufficient condition for rapid poverty reduction.
(d) History and Performance of Microfinance Bank in Niger State
As of July 2011, Nigeria had 866 microfinance banks (MFBs), the majority of which
wereformerly community banks and are now single branch institutions. Only 82 MFBs
service theNorth-West and North-East geopolitical zones combined – the regions with
the highestunbanked rate – compared to over 500 in the South-West and South-East
geopolitical zones. The MFB network serves 3.8% of the adult population (3.2 million
42
clients). Of the 3.2 millionMFB clients, 65% use savings products, 14% use credit
products and 4% have an ATM card.The biggest challenges for MFBs are the high
refinancing costs compounded by a low focus ondeposits, high operating expenses and
low staff capacity, leading to poor asset portfolios. Assuch, the vast majority of MFBs
lack the scale and operating capacity to have a strong impact onFinancial Inclusion
(CBN, 2012).
Though, previous administration in the State had numerous agenda on Microfinance in
order to compliment the policy at the centre (The Federal Government), until in 2008,
in line with the Federal Government policy, the State converted its Community Banks
into Microfinance Bank and made it as a matter of policy at least each Local
Government should have one or more Microfinance Bank. Thus the new era for fully
operational Microfinance Bank in the State began (Niger State Government Gazette,
2009).
2.5 Agricultural Productivity
The concept of productivity is a relative term and sometimes it is considered to be an
overall efficiency and effectiveness of productive units or as a ratio of output to the
corresponding inputs used. Though all these definitions are apparently conflicting to
each other but their different interpretations have common characteristics i.e.
productivity is someone‘s‘ ability to produce more economically and efficiently
(Mohammad, 1992). In this study therefore, agricultural productivity could be defined
as ratio of output to inputs in relation to fertilizers, improved seeds, labour and
chemicals (herbicides/pesticides) employed in agriculture.

43
i. Technical Efficiency
This in production is defined as the physical ratio of product output to the factor inputs.
The greater theratio, the greater the magnitude of the technical efficiency, implying
existence of difference in technicalefficiency between firms/farms. The production
function pre-supposes technical efficiency, whereby maximumoutput is obtained from a
given level of inputs combination; hence it is a factor-product relationship. Animportant
assumption underlying efficiency concept is that firms operate on the outer bound of
productionfunction that is, on their efficiency frontier, implying that when firms fail to
operate on the outer bound oftheir production function, they are said to be technically
inefficient. For such firms, an improvement intechnical efficiency could be achieved in
three ways, through (a) improved production techniques, whichimplies a change in
factor proportions through factor substitution under a given technology, thus
representinga change along the given production function; (b) an improvement in
production technology, which representsa change in the production function itself such
that the same amount of resources produce more output, oralternately, the same amount
of output is derived from smaller quantities of resources than before, and (c)
asimultaneous improvement in both production techniques and technology (Amazaet
al., 2001). The technicalefficiency of individual farmers is defined by Ogundari and
Ojo (2007), as the ratio of observed output to thecorresponding frontiers output,
conditional on the level of input used by the farmers. In essence, technology according
to Ogundele and Okoruwa(2004) plays a very significant role in determining the levels
of technical efficiency of a firm, and that wherethe producing unit did not comply
strictly with the accompanied recommendation, the result may bedevastating.
Efficiency level of farmers, according to Awotide and Adejobi (2006), has direct

44
bearing on thecost of production which consequently translates to more profit to the
farmers.
iii. Measuring Efficiency Using Frontier Production Function
Efficiency is a very important factor of productivity growth, especially in developing
agricultural economies where resources are meager and opportunities for developing
and adopting better technologies are dwindling (Ali and Chaudhry, 1990). Such
economies can benefit greatly by determining the extent to which it is possible to raise
productivity or increase efficiency, at the existing resource base or technology. For
efficient production, non-physical inputs, such as experience, information and
supervision, might influence the ability of a producer to use the available technology
efficiently. Each type of inefficiency is costly to a firm or production unit (e.g., a farm
household) in the sense that each in-efficiency causes a reduction in profit below the
maximum value attainable under full efficiency.
In a production function context, a farm is said to be technically inefficient, for given
set of inputs, if its output level lies below the frontier output (the maximum flexible
output) (Rahman, 2003). The popular approach to measure the efficiency is the use of
frontier production function (Tzouvelekas et al, 2001; Wadud and White, 2002). The
variation of actual output from the frontier due toinefficiency and random shocks can
be captured throughstochastic frontier approach .The existence of inefficiencyin crop
production comes from inefficient use of scarceresources. There exist two main
competing methods foranalyzing technical efficiency and its principaldeterminants: the
parametric frontier (stochastic frontierapproach) and the non-parametric frontier
(dataenvelopment analysis). Non-parametric frontier suffersfrom the criticism that it

45
takes no account of the possibleinfluence of random shocks like measurement errors
andother noises in the data (Coelli, 1995).The parametric frontier uses econometrics
method toestimate the parameters of both stochastic frontierproduction function and
inefficiency effect model. The stochastic production function as a tool of analysis based
on parametric stochastic efficiency decomposition methodology is used to estimate the
technical, allocative and economic efficiency measures of a firm (farm). The Cobb
Douglas model is usually used to fit stochastic production frontiers for farmers by using
the maximum likelihood technique. The functional form has been widely used in farm
efficiency analyses for both developing and developed countries (Bravo-Ureta and
Evenson, 1994). Thebiggest advantage of stochastic frontier approach is theintroduction
of stochastic random noises that are beyondthe control of the farmers in addition to the
inefficiencyeffects. The disadvantage of this approach is that itimposes explicit
restriction on functional forms anddistributional assumption for one-sided error term
(Coelli and Battese, 1996).
In opposite to the stochastic frontiermethod, data envelopment analysis is a
deterministicfrontier, meaning that all deviation from the frontier isattributed to
inefficiency only. It is difficult to accept thisassumption, given the inherent variability
of agriculturalproduction in developing countries due to a lot ofexogenous factors like
weather shocks, pests, diseases,etc (Coelli and Battese,1996).Furthermore, because
ofthe low level of education of farmers in developingcountries, keeping accurate
records is not a commonpractice. Thus, most available data on production are
morelikely to be subject to measurement errors.
vi. Usefulness of Stochastic Frontier Analysis

46
• Stochastic Frontier Analysis (SFA)produces efficiency estimates or efficiency scores
of individual producers. Thus one can identify those who need intervention and
corrective measures.
• Since efficiency scores vary across producers, they can be related to producer
characteristics like size, ownership, location, etc. Thus one can identify source of
inefficiency.
• SFA provides a powerful tool for examining effects of intervention. For example, has
efficiency of the banks changed after deregulation? Has this change varied across
ownership groups?

47
CHAPTER THREE
METHODOLOGY
3.1 Study Area
The study was conducted in Niger state. The state is located between latitudes 8.2⁰N
and 11.3⁰N and longitudes 3.3⁰E and 7.2⁰ E. It is bordered at the north by Zamfara
state, northwest by Kebbi and south by Kogi state and southwest by Kwara state.
Kaduna and Federal Capital Territory Abuja are in the northeast and south east
respectively (See figure 1).

48
Fig. 1 Map of Nigeria showing Niger State
Fig.2 Map of Niger Stateshowing the Study Area
As at 2006, the state has population of about 3,950,249 persons of which 2,032725 are
men while the remainder are females (NPC, 2006). It is one of the largest states in
Nigeria with a landmassof 86,000km2 (8.6 million hectares) which represents about
9.3% of the total landmass of Nigeria. Niger state experiences distinct dry and wet
seasons with annual rainfall varying from 1,100mm (120 days) in the northern part to
1,600mm (150 days) in the southern part. This makes it possible for cultivation of
certain crops in certain part of the state (Niger State Government, 2011).

49
Occupationally 85% of the adult populace are farmers while the remainder are engaged
in vocational and white collar jobs. The state is blessed with vast arable land for
agricultural activities (farming, fishing and livestock rearing) and numerous natural
resources like solid minerals (gold, talc, kaolin, graphite, ball clay, marble, copper iron,
manganese, feldspar). The two major dams for electricity generation in the country are
located in the state. The extensive flood plains in the southern boundary of the state,
availability of large water bodies, dams and reservoirs offer great opportunity for dry
season cultivation of fadama crops such as rice, sugarcane, maize and assorted
vegetables. The abundant grassland and fodder, favourable weather and abundant water
supply give an ideal condition for livestock production (Niger State Government,
2011).
Niger state is divided into three zones, each zone with a marked climatic pattern and a
defined agricultural activities namely; Zone I, II, III. Zone I is found in the southern
part of the state and comprises of Agaie, Bida, Edati, Katcha, Gbako, Lapai ,Lavun and
Mokwa Local Government Areas (LGA). And Zone II comprises of Rafi, Bosso,
Shiroro, Chanchaga, Paikoro, Gurara, Tafa, Munya and Suleja LGA. While Zone III
comprises of Agwara, Borgu,Kontogora, Magama, Mariga, Mashegu, Rijau and
Wushihi LGA.
The zones have agriculture as its major traditional occupation with trade and crafts as
the secondary occupation. Mixed cropping is the major farming practice in the three
zones with a combination of various food crops in the mixture. The most important
food crops grown include rice, maize, yam, millet, sorghum, groundnut, cassava and
cowpea. Livestock keeping is also predominantly practiced by the farmers especially

50
the female members of the household (especially poultry, goats and sheep)(Niger State
Government, 2011).
Major commercial crops grown by the sampled farmers include yam, rice millet, maize
cowpea, sorghum and groundnut. These crops are grown in combination with another
during one farming season.
3.2 Sampling procedure
A multistage sampling technique was used. Multi-stage samplingtechnique involves a
procedure whereby the selection of units into thesample is organized into stages. It
usually involves a combination ofsampling methods. All the three agricultural zones
were covered in thisstudy. There are thirty two (32) Microfinance Banks established in
the state (as at the time of this research) but only nineteen (19) have commenced full
financial operations. In stage one; the list of crop farmers (those cultivating rice, maize,
yams and other crop for commercial purpose from the three distinctive zones) using
micro credits was obtained from the Microfinance Board. This list represents the
sample frame for the micro credit beneficiaries. For stage two;six LocalGovernment
area was randomly selected from each agricultural zone. Inthe third stage;one
operational microfinance bank was randomly selected from each of the six Local
Government areas. In the fourth stage; ten (10) percent of the beneficiaryfarmers each
were randomly selected. This gave rise to one hundred and eighty five (185)
microfinance beneficiary farmers.
On the other hand, multi-stage sampling technique was used in regards to non loan
beneficiaries too. In stage one; all the non micro-credit beneficiary farmersin the six

51
Local Government areasselected were identified. Instage two; ten (10) food crop
farmers each who do not borrow from microfinance were randomly selected. This gave
rise to one hundred and ninety (190) farmers who are non-loan beneficiaries of
microfinance.
Thus, the sum of the two categories (375)was used for the study, this formed the sample
size. The sample selection was done in line with the suggestion by Cooper and
Schindler (2002). According to them, a sample size of a hundred (100) respondents is
good for any statistical analysis.
Table 3.1 Microfinance Banks in Niger State and their Locations
LGA Location Name of MB No of loan
beneficiaries
(farmers)
Sample
size (10%)
1 Agaie Agaie Babba 107 11
2 Agwara Agwara Kpacharka 135 13
3 Bida Bida Edumama 59 6
4 Chanchaga Chanchaga Lapo 94 9
5 Chanchaga Chanchaga Minna 53 5
6 Edati Enagi Dangizhi 98 10
7 Gbako Lemu Chibgeyaji 84 8
8 Gurara Gawu babangida Bmazazhin 114 11
9 Lavun Busu Busu 46 5
10 Lavun Kutigi Lavunkpan 130 13
11 Magama Nasko Naisa 152 15
12 Mashegu Makera Tattali 135 13
13 Mariga Bangi Kunagaba 156 15
14 Munya Sarkin pawa Acheajebwo 116 11
15 Paikoro Paiko Pana 147 14
16 Rafi Kagara Masoyi 131 13
17 Rijau Rijau Gulfare 62 6
18 Shiroro Gwada Bwayi 67 6
19 Wushishi Wushishi Tanadi 53 5
Source;Niger State Microfinance Board (2013).
3.3 Method of Data Collection

52
Primary data was used for the study. The primary data wascollected by trained
enumerators and the researcher by administration of structured questionnaire through
informal discussion and personal interviews with the farmers‘ household head. A cross-
sectional data from a farm survey of crop farmers for 2014 growing season was used.
The data collected includes demographic information, such as age, educational level,
marital status, farm size, amount of credit obtained, types of crops grown and years of
experience in farming.
Production information was also collected; this includes output and inputs such as seed,
fertilizer, pesticide, herbicides and labour used.
3.4 Analytical Tools
The analytical tools that were used to achieve the objectives are; descriptive statistics,
stochastic frontier production functionsand double hurdle analysis.
3.4.1 Descriptive statistics
Descriptive statistics used were mean, percentages and frequency distribution in
achieving objectives that describe the socio-economic characteristics of crop farmers
and identifies the factors militating against crop production in the study area (i.e.
objective 1 and 5 of the study).
3.4.2 Stochastic frontier production function
The stochastic production frontier was used to achieve objectives 2 and 3 of the study.
This function have been employed in other studies to determine technical efficiency of
agricultural production (Bakhsh et al., 2006; Erhabor and Emokaro, 2007; Binuomota et

53
al., 2008). The general stochastic production frontier with a multiplicative disturbance
term of the farm is shown below:
expEY f X ………………………(1)
Y= the quantity of farm outputs
X= Vector of input quantities
β= a vector parameters
E=Stochastic disturbance term consisting of two independent elements U and V.
Where E=V-U
The symmetric component, V, accounts for factors outside the farmers‘ control, such as
weather and diseases. It is assumed to be independent and identically distributed normal
random variable (O, δV2). A one side component U≤O reflects the technical
inefficiency relative to the stochastic frontier, E
F X . The distribution of U is half
normal. The stochastic production frontier model can be used to analyze cross sectional
data. The model simultaneously estimates the individual efficiency of the respondent
farmers as well as determinants of technical efficiency (Batesse and Coelli, 1995). The
frontier of the farm is given as.
exp
v uY f x
............................... (2)
Measures of efficiency for each farm can be calculated as
expv uf x
Yf x

54
exp
v u............................... (3)
The specific model is explicitly written as:
jLnY = β0 + β1Ln X1 + β2LnX2 + β3LnX3 +β4LnX4 + β5LnX5 + β6LnX6 + ei.............. (4)
Where; jY is crop output (kilogram)
J is 1, 2, 3 ...360 crop farmers;
X1 is farm size (hectares)
X2 labour (man-days)
X3 is fertilizer (kilogram)
X4 is seeds (kilogram)
X5 is herbicide (Litres)
X6 is capital /access to credit (N)
i is regression coefficients of inputs (input elasticities) and
i i ie v u is the error term.
Kumbhakar et al.(1991), assume that the technical inefficiency effects are non-negative
truncations of a normal distribution with mean, which is linear function of exogenous
factors whose coefficients are unknown, and an unknown variance. Invariably, it is
assumed that inefficiency effects are independently distributed and ijU arises by
truncation (at zero) of the normal distribution with mean ijU and variance δU2.
In the
same line, Ray (1988) and Sharma et. al (1999) estimated the determinant of technical,
allocative and economic inefficiency as
ijU = δ0 + δi ZIJ…………………… (5)

55
Where ijU is the inefficiency
ij
ijsZ Are the vectors of explanatory variables associated with technical, allocative and
economic inefficiencies;δ is are vectors of unknown parameters to be estimated.
An explicit equation can be expressed as
ijU = δ0 + δ1 Zi1+ δ2 Zi2+ δ3Zi3 + δ4 Zi4 + δ5 Zi5 +…………….. δ7Z7……..(6)
Where
iU =technical inefficiency of the ith farmer
Z1=Farmer‘s age (yrs)
Z2=Years of farming experience of the ith farmer in crop production
Z3=Annual income level (N)
Z4=Years of formal education of the ith farmer
Z5=Household size of ith farmer (number of people)
Z6=Land ownership of the ith farmer
Z7= Marital Status of the ith farmer measured as dummy (if married 1, 0 otherwise)
The concept of technical efficiency relates to the question of whether a firm uses the
best available technology in its production process. It is assumed that 0 < technical
efficiency < 1, where technical efficiency = 1 implies that the firm is producing on its
production frontier and is said to be technically efficient. 1 – Technical efficiency is
therefore the largest proportional reduction in input that can be achieved in the
production of the output. Alternatively it can be interpreted as the largest percentage
cost saving that can be achieved by moving the firm towards the frontier isoquant
through radial rescaling of all inputs (Chavas and Aliber 1993).

56
3.4.3 Double hurdle model
Double Hurdle Model was used to achieve objective 4 of the study. The Double Hurdle
model is a parametric generalization of the P-Tobit model, in which the causes and
extent of access to credit are determined by two separate stochastic processes given as:
Observed loan size: Y = d.Y**.............................................. (7)
Loan participation: W = α‘Z + u (u ϵ N(0,1)) .........................................(8)
d = 1 if W > 0 and 0 otherwise.
Loan size equation: Y* = β‘X + v (v ϵ N(0, δ2) ...................................(9)
Y** = Y* if Y* > 0 and 0 otherwise.
Where
W is defined whether the households decide to take out credit,
Y* is latent variable showing farmers‘ loan amount obtained,
Y is the observed dependent variables (the amount of money the farmer obtained),
Z is a vector of variables explaining the credit participation decision,
X is a vector ofvariables determining on the credit amount,
u and v are the correspondingerror terms assumed to be independent and distributed as
u ϵ N(0,1) and v ϵN(0,δ2).
Empirical results by both Moffat (2003) and Martínez-Espiñeira (2006) reveal that
theDouble-Hurdle model gives superior results to those obtained from Tobit and P-
Tobitmodels.This model was solved in one procedurein Strata.The log likelihood of the
Double Hurdle model is given as:

57
Log (L) = ' '
' '
0
11 i i
i i
x y xin z in z
Where
Log(L)= Accessibility to microfinance(i.e. loan size) (Naira)
1X = age of the farmer (years)
2X = land size (hectares)
3X = ownership of land (1, owned, 0 otherwise)
4X = marital statuses (1 if married, 0 otherwise)
5X = farm income of the respondent in 2014(Naira)
6X = cost of borrowing from microfinance (Naira)
7X = education level (Years)
8X = distance/ outreach to microfinance (Km)
9X = farming experience (Years)
10X = family size of the respondents
11X = extension contact (no of time)
Yi = whether farmers access to credit (takes the value of 1 if the farmers take credit, 0
forotherwise).
Z and X= is the vector of farmers characteristics
β and α= is the vector of parameters
µ and ε = the error term N (0, 1)
3.5 Test of Hypothesis

58
Z-test was performed to test the significance of each of the explanatory variables at
alpha levels of one, five and ten percent by subjecting the two means of output and
technical efficiency to the test.
1 2
2 2
1 2
1 1
X XZ
S S
n n
Where,
X1 and X2 are individual mean output and or technical efficiency of beneficiaries and
non-beneficiary farmers respectively.
n1 and n2 are the sample size of loan beneficiariesand non-beneficiary farmers
respectively.
S12 + S2
2 are the estimated variance of the mean output and or technical efficiency of
loan beneficiariesand non-loan beneficiaries respectively.
Chows test was performed to ascertain the conformity of the result obtained from
production function analysis and also test for significant difference between socio-
economic factors affecting access to microfinance and technical efficiency for loan
beneficiariesand non-loan beneficiary farmers. Chows test is given as;
2 2 2
1 2
2 2
1 2 1 2
/
/ 2
e p e e k
e e nF
n k
To test the hypotheses bi = Bi (null),
bi ≠ Bi (alternative)
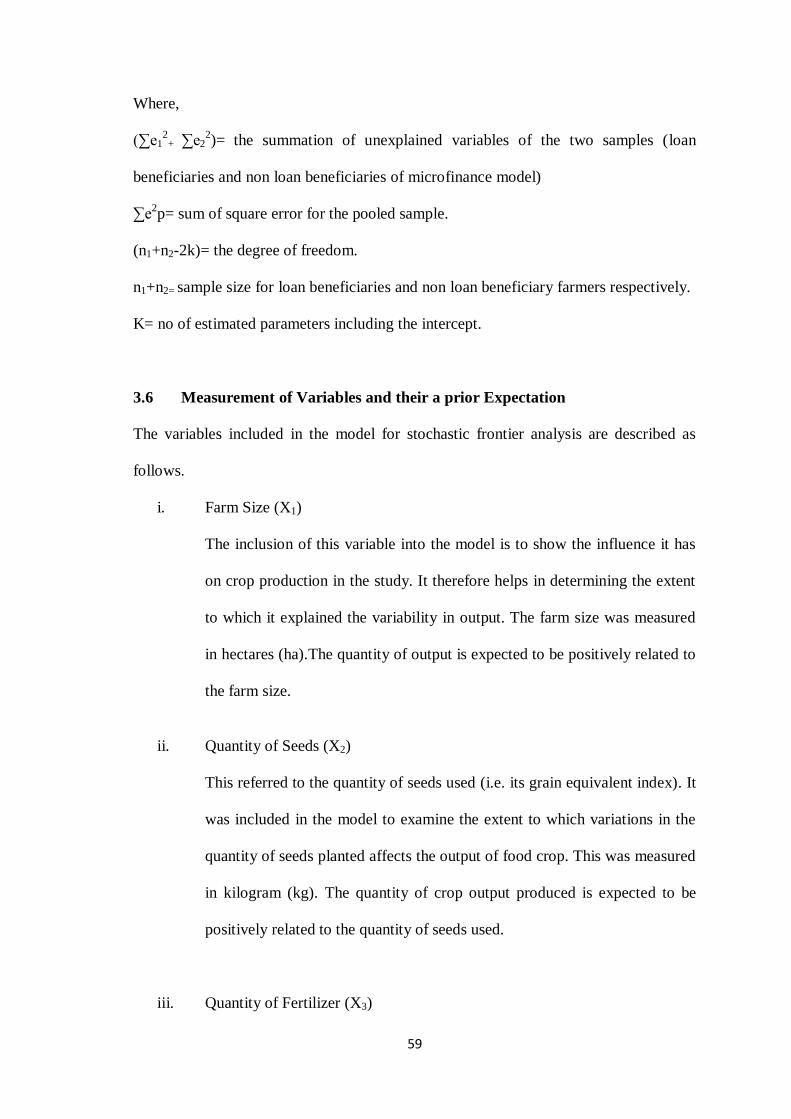
59
Where,
(∑e12
+ ∑e22)= the summation of unexplained variables of the two samples (loan
beneficiaries and non loan beneficiaries of microfinance model)
∑e2p= sum of square error for the pooled sample.
(n1+n2-2k)= the degree of freedom.
n1+n2= sample size for loan beneficiaries and non loan beneficiary farmers respectively.
K= no of estimated parameters including the intercept.
3.6 Measurement of Variables and their a prior Expectation
The variables included in the model for stochastic frontier analysis are described as
follows.
i. Farm Size (X1)
The inclusion of this variable into the model is to show the influence it has
on crop production in the study. It therefore helps in determining the extent
to which it explained the variability in output. The farm size was measured
in hectares (ha).The quantity of output is expected to be positively related to
the farm size.
ii. Quantity of Seeds (X2)
This referred to the quantity of seeds used (i.e. its grain equivalent index). It
was included in the model to examine the extent to which variations in the
quantity of seeds planted affects the output of food crop. This was measured
in kilogram (kg). The quantity of crop output produced is expected to be
positively related to the quantity of seeds used.
iii. Quantity of Fertilizer (X3)

60
This was measured in kilogram (kg). It referred to the quantity of fertilizer
materials used. Fertilizer use replenishes depleted soil nutrients and hence
increases agricultural productivity. It was included in the model in order to
know the extent to which its variations affect the total output from the
farm.The output of crops realized is expected to be positively related to the
quantity of fertilizer used.
iv. Quantity of Herbicides (X4)
This referred to the quantity of herbicides used in food crop production. It
inclusion in the model was to determine the extent to which its variations
affects total output from the farm. The unit of measurement used was litres
(ltr).
v. Total Farm Labour (X5)
This referred to the amount of physical effort used in man-days. It was
included in the model to determine if labour was being over or under
utilized in food crop production in the study area. It is expected to positively
influence the mean output of crops. This is because increasing the amount of
labour should help farmers to carry out critical agricultural operations on
time and thus permit farmers to respond more rapidly to problems when a
rapid response may be crucial in reducing crop losses (Fufa and Hassan,
2003).
vi. Output (Y)
This refers to the physical quantity of food crop in tonnes harvested from the
various sampled fields.It is a measure of total quantity of crops harvested

61
during 2014 cropping season expressed in tonnes. It is determined from farm
level data and used as the dependent variable.
The quantity of outputs of crops wasobtained in their local measures and
then converted tokilogram. The output in kilograms was later converted to
GrainEquivalent using the conversion factor by Kormawa(1999). This was
done to allow output aggregation aswell as allowing for a technical
relationship betweeninputs and outputs to be estimated for the crop mixture.
Thus,all crop outputs regardless of cropping system used were aggregated
into a single output grain equivalent index.
Table 3.2 Variables in Production Function and their a priori Expectations
Variables Description A priori expectations
X1
X2
X3
X4
X5
X6
Farm size
Labour
Fertilizer
Seeds
Herbicide
capital
+
+
+
+
+
+
3.6.1 Variables in Technical Inefficiency Model and their a priori Expectations
The estimated coefficients ofthe inefficiency function provide some explanations for
the relative efficiency levels among individual farms. Since the dependent variable of
the inefficiency function represents the mode of inefficiency, a positive sign of an
estimated parameter implies that the associatedvariable has a negative effect on
efficiency and a negative sign indicates the reverse. Invariably, a negative estimated
coefficient ofthe inefficiency function implied a reduction in the level of inefficiency
hence an increase in technical efficiency.

62
i. House hold size: The number of persons living in the household is hypothesized
to determine inefficiency negatively and thus increasing the output. This means
that households with large family size would manage their farms on time than
their counterparts. This is because at the time of peak seasons, there is shortage
of labor. This is possible since more labor can be deployed during peak season
in order to timely undertake the necessary farming activities like ploughing,
weeding and harvesting that raise efficiency.
ii. Age of the farmer and farming experience: .Age of the head of household,
which is considered as a proxy of farmers' experience in farming, is
hypothesized to have negative effect on inefficiency. This is because as age
increases farming experiences increases so that efficiency increases. But after
certain age interval it will have negative effect on efficiency because of older
farmers are thought to be more conservative in implementing modern
technologies. This means that age and efficiency have inverted u-shaped
relationship i.e. efficiency increases with age up to some point and then
decreases with rise in age. Hence, middle aged farmers are more efficient than
old aged and younger farmers. Since farming like any other professions needs
accumulated knowledge, skill and physical capability, age of the farmers is
decisive in determining efficiency. The knowledge, the skills as well as the
physical capability of farmers is likely to increase as age increases. However
this tends to decrease after a certain age level. Older farmers will have less
physical capacity to undertake their farming activities efficiently.

63
iii. Education: It is hypothesized that education of household head would be able to
negatively influence technical inefficiency from the given level of inputs than
their uneducated counterpart. This is because education can increase their
information acquisition and adjustment abilities, thereby increasing their
decision making capacity. In addition to this it will help them to adopt modern
agricultural technologies and be able to produce higher output using the existing
recourses moreefficiently.
Table 3.3 Signs of co-efficient in Technical inefficiency model and their a priori
Expectations
Variables Description A priori expectations
Z1
Z2
Z3
Z4
Z5
Z6
Age of the farmer
Farming experience
Income
Education
Household size
Land ownership
-
-
-
-
-
-

64
CHAPTER FOUR
RESULTS AND DISCUSSIONS
4.1 Socio-Economic Characteristics of the Farmers
The socio economic characteristics of the respondents considered in this study were
age, level of education, farming experience, farm size, gender of the farmer and
household size.
4.1.1 Age of the Farmers
The findings in table 4.1 showed that 3.3% and 10% of loan beneficiaries and non-loan
beneficiary farmers were below the age 30. Also about31.7% and 31.6% of
beneficiaries and non-loan beneficiaries respectively are between the age 30 and 40
years, while 65% and 58.3% of the same were above 40 years. The mean age was
found to be 43 years and 42 years for the beneficiaries and non-loan beneficiaries
respectively. This shows that large proportion of the respondents were still in their
active years and are likely to be productive and can strive more to access farm credit.
It also implies that the production of food and other farming activities were in the
hands of the ageing population. Previous studies have indicated similar trend in the age
of practicing farmers in Nigeria (Abdulfatah, 2012). This finding agrees with Tanko
et.al (2011) who reported mean ages of 44 years for food crop farmers in Niger state
and also the findings of Onubuogu and Onyeneke (2012) among roots and tuber crop
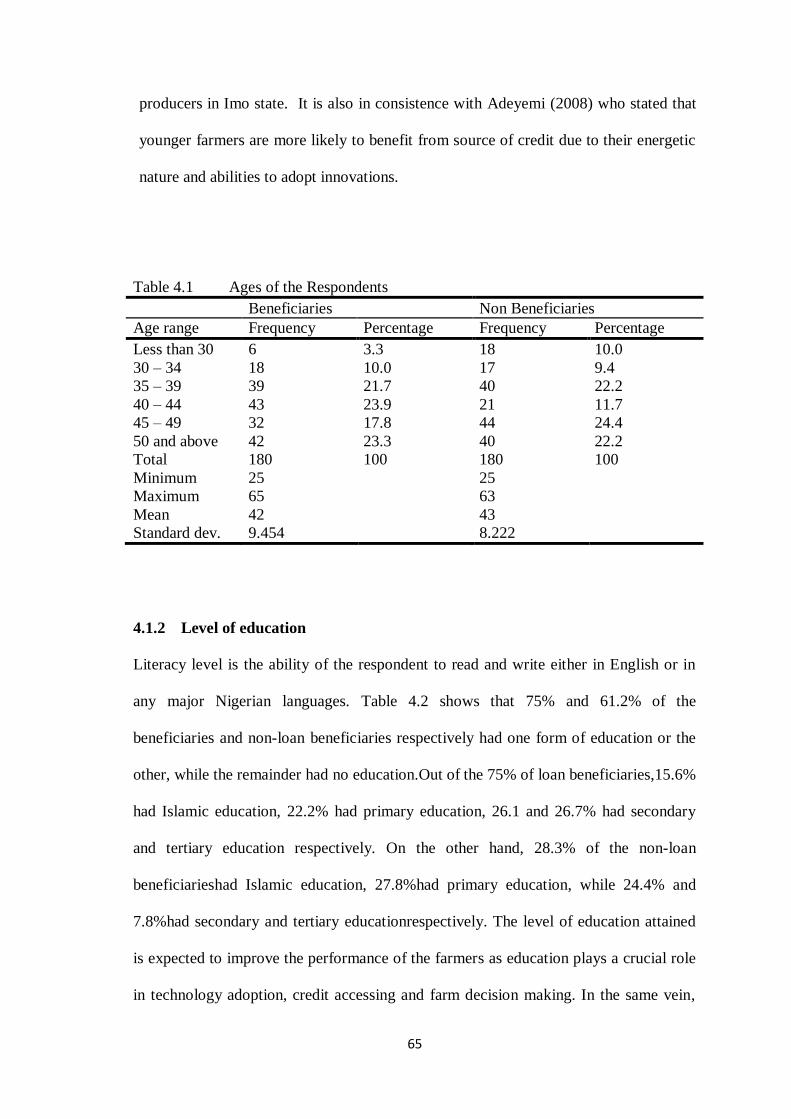
65
producers in Imo state. It is also in consistence with Adeyemi (2008) who stated that
younger farmers are more likely to benefit from source of credit due to their energetic
nature and abilities to adopt innovations.
Table 4.1 Ages of the Respondents
Beneficiaries Non Beneficiaries
Age range Frequency Percentage Frequency Percentage
Less than 30
30 – 34
35 – 39
40 – 44
45 – 49
50 and above
Total
6
18
39
43
32
42
180
3.3
10.0
21.7
23.9
17.8
23.3
100
18
17
40
21
44
40
180
10.0
9.4
22.2
11.7
24.4
22.2
100
Minimum
Maximum
Mean
Standard dev.
25
65
42
9.454
25
63
43
8.222
4.1.2 Level of education
Literacy level is the ability of the respondent to read and write either in English or in
any major Nigerian languages. Table 4.2 shows that 75% and 61.2% of the
beneficiaries and non-loan beneficiaries respectively had one form of education or the
other, while the remainder had no education.Out of the 75% of loan beneficiaries,15.6%
had Islamic education, 22.2% had primary education, 26.1 and 26.7% had secondary
and tertiary education respectively. On the other hand, 28.3% of the non-loan
beneficiarieshad Islamic education, 27.8%had primary education, while 24.4% and
7.8%had secondary and tertiary educationrespectively. The level of education attained
is expected to improve the performance of the farmers as education plays a crucial role
in technology adoption, credit accessing and farm decision making. In the same vein,

66
Asefa (2012) asserted that the level of education of a farmercan increase their
information acquisition andadjustment abilities, thereby- increasing their
decisionmaking capacity. In addition to this it will help them toadopt modern
agricultural technologies and be able toproduce higher output using the existing
recourses moreefficiently.
Table 4.2 Years of Formal Schooling/Education
Beneficiary farmers Non Beneficiary farmers
Form of
education
Frequency Percentage Frequency Percentage
No formal
Islamic
Primary
Secondary
Tertiary
Total
45
28
40
47
48
180
25
15.6
22.2
26.1
26.7
100
72
51
50
44
14
180
40
28.3
27.8
24.4
7.8
100
Minimum
Maximum
1
5
1
5
4.1.3 Years of Experience in Farming
Results in table 4.3 indicate that the mean years of farming experience was 24 years for
both thebeneficiaryand non- beneficiary farmers. Majority (46.1% of loan beneficiaries
and 37.8% of the non-loan beneficiaries) of the respondents had between 20-29years of
farming, implying that the respondents were relatively young with a few decades of
experience in farming.This may affect their level of awareness and access to
microfinance and also go a long way to ease the bottlenecks (bureaucracy) in the
process of loan acquisition from the bank. It is believed that higher years of farming
experience is a necessary key for efficient crop yield, thus microfinance banks would
prefer their clients to have good years of farming experience. This is in consistence
with the findings of Ambali (2013), in his studies on Microcredit and Technical

67
Efficiency of Rural Farm Households in Egba Division of Ogun State who notes a
mean years of farming experience of 23 years.
Table 4.3 Years of Farming Experience
Borrower Non borrower
Years of
experience
Frequency Percentage Frequency Percentage
Less than 10
10 – 19
20 – 29
30 – 39
40 – 49
Total
1
46
83
37
13
180
0.6
25.6
46.1
20.6
7.2
100
12
37
68
47
16
180
6.7
20.6
37.8
26.1
8.9
100
Minimum
Maximum
Mean
Standard dev.
10
46
24
8.831
6
45
24
9.450
4.1.4 Household Size
This study reveals a mean household size of 9 and 10 for the borrower and non-loan
beneficiaries respectively. It shows that 53.9% of the loan beneficiarieshad a household
size of less than 10 persons, 37.2% of them had a household size between 10-14
persons while only 8.9% had over 15 persons in their household. Similarly, 38.3% of
the non-loan beneficiaries had a household size of less than 10 persons, 46.7 had a
household size between 10-14 persons and only 14.1% of them had over 15 persons in
their households. This implies that the larger the family size, the more of labour
component usage on the farm and the more mouths to feed but less farm income to be
realized by the farmer. Tijjani (2006) noted that the major reason why farmers keep
large family members is for the provision of farm labour during peak production

68
periods. Thus, the larger the family size, the more labour is available for farming
operations.
Household size is an important factor in traditional subsistence agriculture, because it
determines to a larger extent the supply of labour for immediate farm employment and
for generation of income for meeting family needs. This finding is in consonance with
those of Olanpekun and Kuponiyi (2009), who pointed out that a large family may
serve as incentive for engaging in livelihood diversification in order to meet the
obligation of the family. Effiong (2005) and Idiong (2007) reported that a relatively
large household size enhances the availability of labour, though household size may not
guarantee for increased efficiency.
Table 4.4 Household Size of the Respondents
Borrower Non borrower
Household size Frequency Percentage Frequency Percentage
Less than 5
5 – 9
10 – 14
15 – 19
20 – 24
25 and above
Total
25
72
67
16
-
-
180
13.9
40.0
37.2
8.9
-
-
100
11
58
84
23
3
1
180
6.1
32.2
46.7
12.8
1.7
0.6
100
Minimum
Maximum
Mean
Standard dev
3
18
9
3.643
1
28
10
3.856
4.1.5 Farm Size
The result in table 4.5 shows that majority (54.4% of the borrowing and 87.8% of the
non-loan beneficiaries) of the respondents had farm sizes less than 4 hectares. While
between 38.8% of the loan beneficiariesand 12.1% of the non-loan beneficiaries had

69
farm sizes between 4 hectares and 9 hectares. The percentage of loan beneficiaries and
non-loan beneficiaries having between 10 hectare and 15 hectares was 6.6% and 1.1%
respectively. Though, the mean farm size for the beneficiaries and non-loan beneficiary
farmers was 4.4 hectares and 2.52 hectaresrespectively. This implies that most of the
food crop farmers are small holders of land for agricultural production. Farm size is an
important fixed input in agricultural production and determine to a large extent the
output and income of the farmer. This finding agrees with Imonikhe (2004) who opined
that the size of the farm cultivated by farmers is a function of the financial background
and experience of the farmer.
Table 4.5 Farm Size Distribution
Beneficiary Farmers Non Beneficiary Farmers
Range(farm sizes
ha)
Frequency Percentage Frequency Percentage
Less than 4
4—6
7—9
10—12
13—15
Total
98
44
26
6
6
180
54.4
24.4
14.4
3.3
3.3
100
158
17
3
2
-
180
87.8
9.4
1.7
1.1
-
100
Mean
Standard dev
4.40
3.133
2.52
1.424
4.1.6 Gender/Sex of the Respondent
Table 4.6 shows that majority of the respondents (95% of the loan beneficiaries and
94.4% of the non-loan beneficiaries) were male. This clearly shows complete
dominance in food crop production by male farmers. It further lends credence to the
call for more concerted efforts at empowering the women so as to redress the gross
inequality in gender distribution and greater involvement in crop production. This result

70
agrees with Amos (2006) and Ahmadu and Alufohai (2012) who reported that food
crop production in Nigeria is dominated by male farmers.
Table 4.6 Gender of the Farmers
Beneficiary Non beneficiary
Sex Frequency Percentage Frequency Percentage
Male
Female
Total
171
9
180
95.0
5.0
100
170
10
180
94.4
5.6
100
4.2 Determinants of Technical Efficiency in Crop Production
4.2.1 Relationship between Input and Output in Crop Production
Maximum likelihood estimate was applied on the data collected from sampled 360 crop
farmers in Niger state. The efficiency measures was regressed on set of explanatory
variables which included land (hectare), labour (man-day), fertilizer (kilogram), seeds
(kilogram), herbicides (litre) and capital input (Naira).The result from the maximum
likelihood estimates for the borrower and non-loan beneficiaries is shown in table 4.7.
Theresults in table 4.7 indicate that the beneficiaryand non-beneficiaryfarmer‘sco-
efficient sign for quantity of fertilizer were both positive and significantly related to
output level. This result agrees with the a priori expectation. This indicates a direct
relationship with output and contributes positively to food crop productivity. This
implies that 1% in fertilizer usage will induce a 0.28% increase in total farm output.
This finding agrees with Olagunju (2007) who noted that fertilizer usage in potato
farming by credit users was positively and statistically related to the output. And also
that of Amaza et.al (2006) who reported positive coefficients for variable in food crop
production in Borno state.Though, this result is contrary to the findings of Ambali et.al
(2012) who reported a negatively no significant relationship between fertilizer and food
crop output in a similar study in Ogun state.

71
Labour was found to be highly significant and positively related to output for both
group of farmers. This conforms to a priori expectation. Labour appears to be the one of
important factor of production with an elasticity of 0.255, showing the labour- intensive
nature of farming in the study area. This suggests that a 1 percent increase in labour
will induce an increase of 0.3 percent in the farm output and vice versa. These results
agree with previous work by Amaza et al. (2006).
Quantity of seeds was found to be statistically significant for both beneficiary and non
beneficiary farmers but has a negative co-efficient sign which was contrary to a priori
expectations. This implies that a 1% increase in quantity of seeds will bring about 0.2%
reduction in output.The negative co-efficient of seeds is also an indication of excessive
use of seeds by both groups during crop production.This was contrary to the findings of
Amaza et.al (2006) and Mustapha and Salihu (2015) who found a positive and
significant relationship of seed to output among maize/cowpea intercropping women
farmers in Gombe state.
The estimated coefficient for land was negative and not statistically significant for the
loan beneficiary farmer but statistically significant for the non loan beneficiary farmers.
This was contrary to expectation, whichmeans that increase in land size given
commensurate level of the inputs the farmers were using could onlylead to fall in crop
output. Thus, land expansion may not bring marginal outputs given the way they were
combining their resources. This is in consistence with the finding of Ndubueze-Ogaraku
and Ekine (2015)
Herbicides was positive and not significant for the beneficiary farmer but was
significant in the case of the non beneficiary farmers, this result conforms to a priori

72
expectations. This implies that an increase in the use of these inputs will lead to
anincrease in crop production level which will invariably increase the technical
efficiency of the farmers. This result is in consistence with the findings of Mustapha
and Salihu (2015) in a technical efficiency study who found that the agrochemical use
had a positive and significant relation to maize/cowpea production in Gombe state. And
also the findings of Ambali et.al (2012) who reported a positive but significant
relationship between herbicides and output of food crops in Ogun state.
Farm capital (input) was found to be positively related to output and not statistically
significant for the loan beneficiary farmer but significantly related for the non
beneficiary farmers.This result is in line with the a priori expectation and indicates that
an increase in this variable input will bring about a proportionate increase in output of
the crops. Farm capital (inputs) was found to be a significant variable factors affecting
output of food crops produced by non loan beneficiaries but not for the beneficiary
farmers. This result is in agreement with Enwerem and Ohajianya (2013) whose
findings shows that capital input was one of the variable factors affecting output of rice
farmers in Imo State.
Table 4.7 Relationship between Inputs and Output for the Loan beneficiaries and
Non Loan beneficiaries.
Variables Parameter Co-efficient
(Beneficiary farmers)
Co-efficient (Non
Beneficiary farmers)
Constant
Land (ha)
Labour (man-days)
Fertilizer (kg)
Seeds (kg)
Herbicides (litres)
Farm capital (N)
β0
β1
β2
β3
β4
β5
β6
6.5963(0.5311)***
-0.0913(0.1311)
0.2551(0.0670)***
0.2820(0.5423)***
-0.2080(0.0471)***
0.0342(0.1042)
0.0278(0.0294)
4.8064(1.1175)***
-0.3824(0.1099)***
0.1251(0.0547)**
0.4169(0.1067)***
-0.2269(0.0354)***
0.5627(0.1271)***
0.1039(0.1027)
Sigma squared
Log likelihood function
1.481(0.3072)***
-200.1150
0.1009(0.0399)***
-63.2750
Figures outside the parentheses_ co-efficient, figures inside the parentheses_ Standard
Deviation, ***Significant at 1% ** Significant at 5%

73
4.2.2 Elasticity of Production and Return to Scale
Table 4.8 shows the elasticity of the production and return to scale for both loan
beneficiary and non-loan beneficiary. From the table, theelasticities of all inputs
employed in crop production by the loan beneficiaries shows that labour, fertilizer,
herbicide and farm capital were indicating a positive response in output, while seeds
and farm size indicating a negative response in output. This also implies that a 1%
change in any variable input while keeping the other inputs constant will result in a
certain percentage changein the quantity of output equal to the elasticity of the variable
input in the same direction as the change of the inputs. The elasticities of production
with respect to various inputs indicate that only fertilizer(0.28) and labour (0.26) were
the important input to which output was more responsive because of their elasticity
values which was higher than the elasticities of farm size, seeds, herbicides and farm
capital(0.21,0.03 and 0.09 respectively).
However, the elasticities of all inputs employed in food crop production by the non-
loan beneficiary showed that labour,fertilizer, herbicides and farm capital were positive,
indicating a positive response in output.This also implies that a 1% change in any
variable input while keeping the other inputs constant will result in a certain percentage
change in the quantity of output equal to the elasticity of the variable input in the same
direction as the change of the inputs. The elasticities of production with respect to
various inputs indicate that herbicides, fertilizer and farm size (0.56, 0.42 and 0.38
respectively) were the important input to which output was more responsive because of
their elasticity values. This was higher than the elasticity of labour (0.13), seeds (0.23)
and farm capital (0.10).

74
The sum of elasticities indicates the nature of returns to scale associated with a
particular production system. Thus the behaviour of the output when all the factors of
production are changed simultaneously in the same proportion is referred to return to
scale. Return to scale is said to be decreasing, constant and increasing when the sum of
elasticities of production is less than one, equal to one and greater than one
respectively. From the table the result showsthat the sum of elasticities of production
for both the loan beneficiaries and non-loan beneficiaries are 0.30 and 0.60
respectively. This implies that there was a decreasing return to scale for both group of
farmers, meaning that if all inputs in the model were increased by 1% simultaneously,
output will increase by 0.30% for the loan beneficiaries and 0.60% for the non-loan
beneficiaries. It is thus advisable for both groups of farmers to use their recourse based
on the marginal value productivity of the individual inputs as a guiding factor so as to
maximize total output. This result so far implied that the non-loan beneficiariesare
operating a little bit efficiently than the loan beneficiaries.The sum of production
elasticities has a function coefficient of 0.30 and 0.60 for the two groups of crop
farmers (beneficiary and non-beneficiary farmers respectively).
This means that the food crops farmers are in stage III of production function phase (i.e.
irrational stage of production) which is a decreasing return to scale. This was
necessitated by the low and negative value of the coefficient of farm size and seeds.
Therefore, it implies that food crops farmers in Niger State are subsistent farmers and
donot allocate and utilize their inorganic fertilizer optimally.
Table 4.8 Elasticity of the Production and Return to Scale
Variable inputs Loan beneficiaries (co-
efficient b1)
Non borrower (co-efficient
b1)
Farm size (X1)
Labour (X2)
-0.09
0.26
-0.38
0.13

75
Fertilizer (X3)
Seeds (X4)
Herbicides (X5)
Capital input (X6)
∑bi
0.28
-0.21
0.03
0.03
0.30
0.42
-0.23
0.56
0.10
0.60
4.2.3 Level of Inputs/Output used In Crop Production
The inputs used for crop production in this study by both group of farmers were land,
seeds, fertilizer, herbicides and labour. While the output was the total tonne of crop
(grain equivalent) obtained per unit area cultivated. This is shown in table 4.9
a. Land
Land is one of the most limiting resources for crop production in the study area. The
loan beneficiaries cultivated an average of 4.4 hectares per person, while the non-loan
beneficiaries grew an average of 2.52 hectares per person. Though the loan beneficiaries
cultivated more land than the non-beneficiary counterparts, food crop is still
predominantly produced by these small holder farmers. This finding is in consonance
with Adesoji and Farinde (2006).
b. Seeds
The average seeds (grain equivalent) used in crop production by the borrowing and non-
loan beneficiarieswas 65.91kg and 54.09kg respectively.
c. Fertilizer
Majority of the respondents used chemical fertilizer for crop production in the study. An
average of 10.02kg and 8.28kg was used by the borrower and non-loan beneficiaries
respectively. Despite a widely accepted view that inorganic fertilizer is necessary for
sustained productivity growth, fertilizer use in Africa is estimated to have stagnated at 6-

76
12kg/ha/year for the last 10 years (Monpellier,2013). It was noted that no Africa country
was said to have been able to achieve the 50kg of nutrient per hectare use target set for
2015 at Abuja fertilizer summit (Monpellier,2013).
d. Herbicides
Table 4.9 shows that the borrowing farmer used as much as 14.72 litres of herbicide
while the non-borrowing used 6.05 litres. The high usage of herbicide(residual effect)
by borrower of micro credit could possibly be attributed to less lower yield obtained
than the non-loan beneficiaries.
e. Labour
The total labour used was made up of both family and hired labour. The family labour
was costed and treated as hired labour based on the opportunity cost principles. The
average labour used in crop production in the study area by both the borrowing and
non-borrowing farmer was 138 man-days and 120.17 man-days respectively.
f. Output
The output is the total quantity (grain equivalent/grain yield) of food crop produced or
harvested from a given area of land. In this study, the averageoutput obtained by the
loan beneficiaries was found to be lower than the non-borrower‘s. The output obtained
was 9093.40kg (9.09tonnes) and 9270.92kg (9.27tonnes) for the borrowing and non-
loan beneficiaries respectively. This implies that the output realised by the loan
beneficiary farmers was lower than their contemporary despite the credit obtained. This
might be due to underutilization of some inputs by this group of farmers and also due to
lack of good agricultural practices. The result is shown in table 4.9.

77
Table 4.9 Input/ Output Levels for Loan beneficiaries and Non Loan beneficiaries
Beneficiary Farmers Non Beneficiary Farmers
Inputs
variables
Min Max Co-efficient Min Max Co-efficient
Land (ha)
Labour(man-
day)
Fertilizer (kg)
Seeds (kg)
Herbicide(ltr)
Farm capital
(N)
2
98
5
35
2
7000
15
158
26
200
24
500000
4.40(3.13)
138.54(1261.65)
10.04(5.89)
65.91(47.71)
14.72(21.48)
133512(77921)
1
90
3
10
2
8000
10
150
22
105
17
250000
2.52(0.30)
120.19(32.71)
8.28(4.45)
54.09(30.91)
6.05(3.09)
112433(47462)
Output (Kg)
Income (N)
500
75000
42750
1500000
9093(7801)
307294(181166)
2500
30000
38660
580000
9271(7404)
272556(103158)
Figures outside the parentheses_ Mean, figures inside the parentheses_ Standard
Deviation,
4.2.4 Test of hypothesis
The output data obtained for both group of farmers wasstatistically tested for
significance using the z-tests for comparing the two sample arithmetic means between
the borrowing and non-loan beneficiaries(table 4.10).The test of significance of the
output level confirmed that the mean output between the borrowerand non-loan
beneficiaries wasnot statistically significant. This implies that the null hypothesis (Ho)
which states that there is no significant difference in the output obtained by the
borrower and non-loan beneficiaries should be accepted; while rejecting the alternative
that states a significant difference in the level of output between the two groups of
farmers. The implication is that there was under and over utilization of certain inputs
such as herbicide and seeds by both groups which invariably resulted to no difference
between them.

78
Table 4.10 Test of Output obtained from the two Groups of Farmers
Farmers
Group
N Mean S.D Z-value Z-table LOS
Borrower
Non
borrower
180
180
9093.40
9270.93
7801.24
7403.93
2.76E-03 0.0120 0.01
4.2.5 Estimation of Technical Efficiency of the farmers
A significant characteristic of the stochastic frontier production model is its ability to
produce farm specific measures of technical efficiency. The distribution of farmers‘
technical efficiency indices derived from the analysis of stochastic frontier production
function is provided in table 4.11.The result shows that 24.4% and 59.4% of borrowing
and non-loan beneficiaries had attained between 0.71 and 1.0 efficiency levels
respectively,while 34% of the loan beneficiaries and 5% of the non-loan beneficiaries
were below 50% level of efficiency. This low level of technical efficiency exhibited by
the loan beneficiaries is an indication that a large fraction of the output can be attributed
to wastages.
The technical efficiency of the sampled farmers is less than 1 (100%) indicating that all
the farmers (both the loan beneficiaries and non-loan beneficiaries) are producing
below maximum efficiency frontier. A range of technical efficiency is observed across
the sample farms where the spread is large. The best farm had a technical efficiency of
0.934 (93.4%) and 0.992 (99.2%) for the borrower and non-loan beneficiaries
respectively; While the worst farm has a technical efficiency of 0.126 (12.6%) for the

79
borrower farmer and 0.226 (22.6%) for the non-borrower farmer. This implies that, on
the average, the respondent were able to obtain a little over 52.9% and 74.2% (for
borrower and non-loan beneficiaries respectively) of optimal output from a given mix
of production inputs.
Table 4.11 Frequency Distribution of Technical Efficiency Estimates
Loan beneficiaries Non Loan beneficiaries
Efficiency class Frequency Percentage Frequency Percentage
Less than 0.50
0.50—0.60
0.60—0.70
0.70—0.80
0.80—0.90
0.90—1.0
Total
61
39
36
35
7
2
180
34.0
21.7
20.0
19.4
3.9
1.1
100
9
14
50
41
35
31
180
5.0
7.7
27.8
22.8
19.4
17.2
100
Mean
StandardDeviation
Minimum
Maximum
0.5299
0.2570
0.1266
0.9340
0.7428
0.2220
0.2266
0.9922
The distribution of technical efficiency suggests that potential gains in technical
efficiency among the sample farmers are large. With the mean of 52.9% and 74.2% (for
borrower and non-loan beneficiaries respectively), it implies that in the short run, there
is the scope for increasing technical efficiency in food crop production in the study area
by 47.1% for loan beneficiaries and 25.8% for the non-loan beneficiaries.
The magnitude of the mean efficiency of the farmers is a reflection of the fact that most
of the sample farmer carry out food crop production under technical condition
involving the use of inefficient tools, unimproved seed varieties, under application of
fertilizer and so on. The low under application of fertilizer,over usage of seeds and
herbicides by majority of the farmers are one of the major factors that have influenced
the level of technical efficiency.
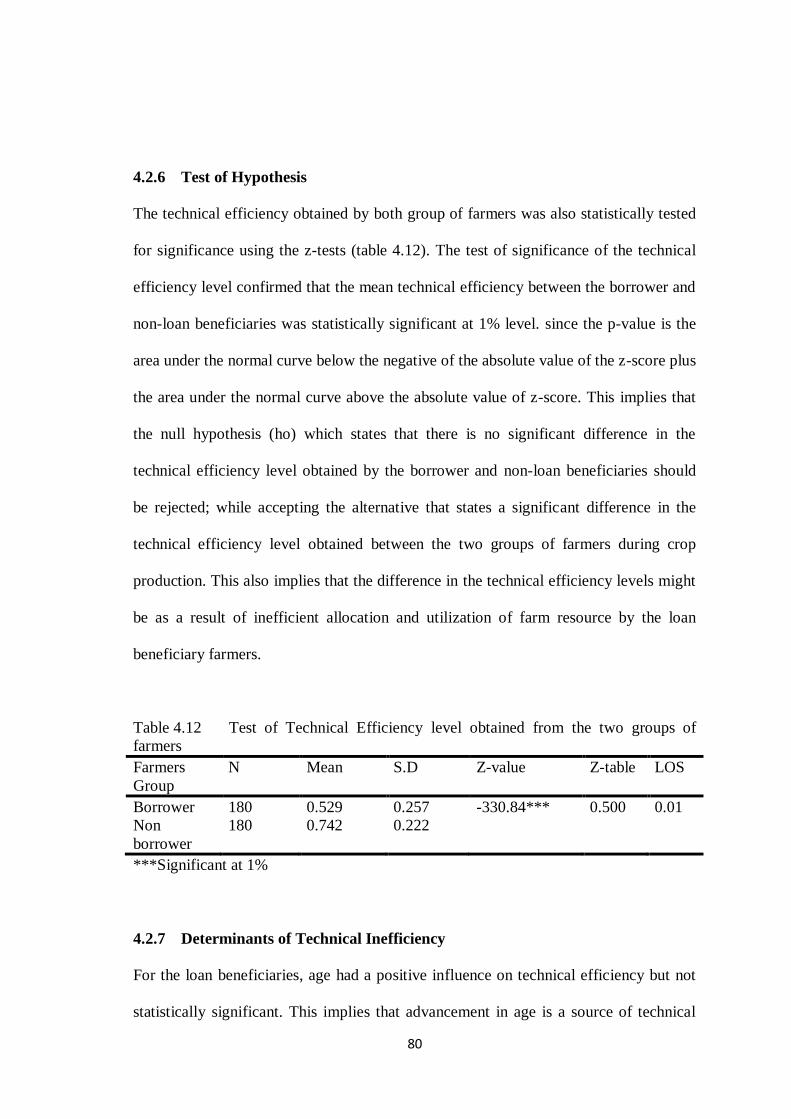
80
4.2.6 Test of Hypothesis
The technical efficiency obtained by both group of farmers was also statistically tested
for significance using the z-tests (table 4.12). The test of significance of the technical
efficiency level confirmed that the mean technical efficiency between the borrower and
non-loan beneficiaries was statistically significant at 1% level. since the p-value is the
area under the normal curve below the negative of the absolute value of the z-score plus
the area under the normal curve above the absolute value of z-score. This implies that
the null hypothesis (ho) which states that there is no significant difference in the
technical efficiency level obtained by the borrower and non-loan beneficiaries should
be rejected; while accepting the alternative that states a significant difference in the
technical efficiency level obtained between the two groups of farmers during crop
production. This also implies that the difference in the technical efficiency levels might
be as a result of inefficient allocation and utilization of farm resource by the loan
beneficiary farmers.
Table 4.12 Test of Technical Efficiency level obtained from the two groups of
farmers
Farmers
Group
N Mean S.D Z-value Z-table LOS
Borrower
Non
borrower
180
180
0.529
0.742
0.257
0.222
-330.84*** 0.500 0.01
***Significant at 1%
4.2.7 Determinants of Technical Inefficiency
For the loan beneficiaries, age had a positive influence on technical efficiency but not
statistically significant. This implies that advancement in age is a source of technical
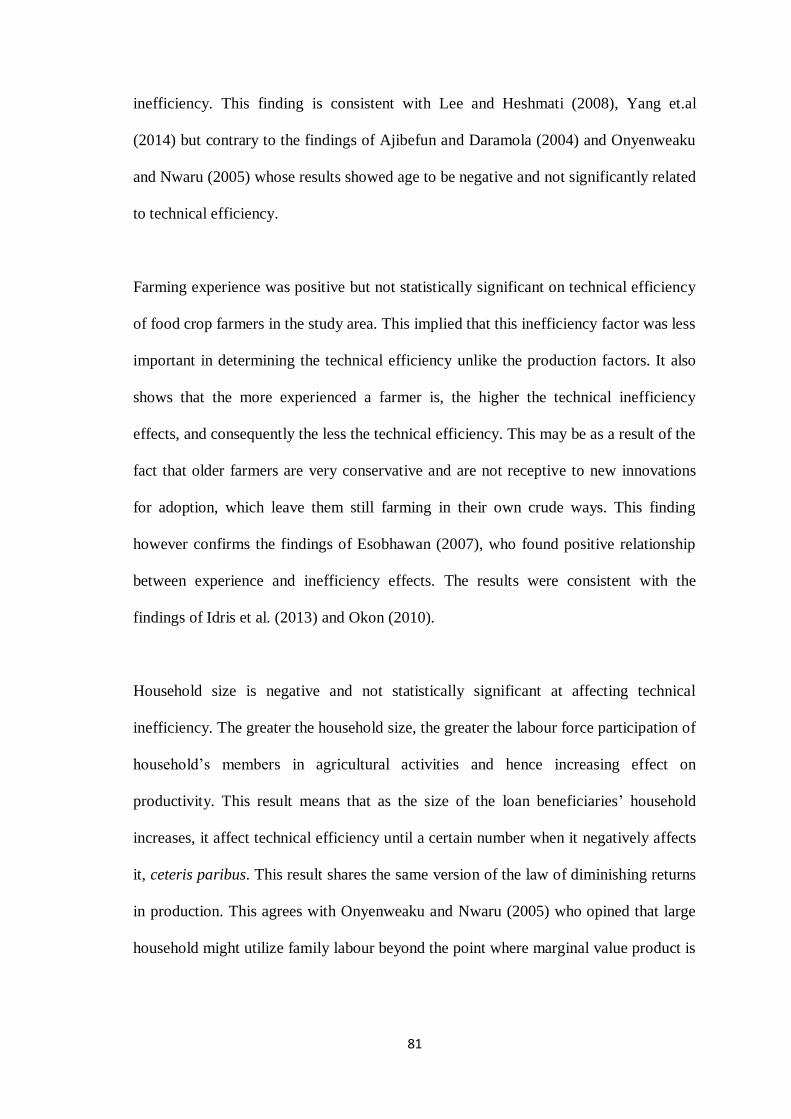
81
inefficiency. This finding is consistent with Lee and Heshmati (2008), Yang et.al
(2014) but contrary to the findings of Ajibefun and Daramola (2004) and Onyenweaku
and Nwaru (2005) whose results showed age to be negative and not significantly related
to technical efficiency.
Farming experience was positive but not statistically significant on technical efficiency
of food crop farmers in the study area. This implied that this inefficiency factor was less
important in determining the technical efficiency unlike the production factors. It also
shows that the more experienced a farmer is, the higher the technical inefficiency
effects, and consequently the less the technical efficiency. This may be as a result of the
fact that older farmers are very conservative and are not receptive to new innovations
for adoption, which leave them still farming in their own crude ways. This finding
however confirms the findings of Esobhawan (2007), who found positive relationship
between experience and inefficiency effects. The results were consistent with the
findings of Idris et al. (2013) and Okon (2010).
Household size is negative and not statistically significant at affecting technical
inefficiency. The greater the household size, the greater the labour force participation of
household‘s members in agricultural activities and hence increasing effect on
productivity. This result means that as the size of the loan beneficiaries‘ household
increases, it affect technical efficiency until a certain number when it negatively affects
it, ceteris paribus. This result shares the same version of the law of diminishing returns
in production. This agrees with Onyenweaku and Nwaru (2005) who opined that large
household might utilize family labour beyond the point where marginal value product is

82
equal to the wage rate. It is also in consistence with Sekhon et.al (2010), but it contrary
with the findings by Ajewole and Folayan (2008).
Education level found to be related to technical efficiency because it has a positive
contribution to it and was statistically significant at 1% level. This implies that farmers
with formal education tend to be more efficient in food crop production, presumably
due to their enhanced ability to acquire technical knowledge, which makes them more
close to the frontier output. It is very plausible that the farmers with education responds
readily to the use of improved technology such as the application of fertilizer use of
pesticides etc, thus producing closer to the frontier this is in agreement with
comparative finding of Amaza et.al (2006).
The result shows that farm size has a negative effect on output. In other words, it can be
explained that other things remaining constant, 1% increase in farm size leads to
decrease production by 0.091%, on an average. Inability of the small farmers to use
other inputs proportionately while increasing farm size may be liable for this surprising
result. Influence of external factors like attack of insects, salinity, over rainfall in
harvesting period etc. may also be liable for this negative effect of land size on output.
Generally small farmers can manage small land size and unable to incur additional cost
properly for cultivating additional land. Farmers search for alternate employment and
thus cannot manage their own farm. So, output from additional land may decrease in
the study area. But they are not able to maintain the additional cost. Sen (1964) stated
that there exists inverse relationship between farm size and productivity and hence
finding of this study is in commensurate with Sen‘s findings.

83
Income had negative co-efficient and was found to be statistically significant to
technical efficiency, which conforms to a priori expectation. This implies that the more
the income the less the technical inefficiency in crop production. This result is contrary
to the findings of Rahman and Umar (2009) in a technical efficiency study who
reported income having a positive a relation to output but no significant relationship
with technical efficiency.
Land ownership was negative and is not significantly related to technical efficiency,
and in conformity with the a priori expectations. This implies that farmers who owned
land are more technically efficient in production than those who do not. This is so as
those who owned land do not have constraints on the duration and usage they put it to
thus making them to have better output since they will be willing to adopt output
enhancing technology. Ownership of land with title provides security for the household
which has been reported to encourage investment in productivity enhancing
technologies resulting in higher efficiency (Gorton and Davidova, 2004; Kariuki,
2008).This result disagrees with that of Rahman and Umar (2009) and also that of
Toritseju and O‘raye (2014) who reported a positive influence but not significant
relationship between land ownership and technical efficiency.
Gamma was estimated at 0.857 which implies that 85.7% of the total variation in
aggregate food crop production by the loan beneficiaries is due to technical
inefficiency. Such a result according to Tadesse and Krishnamoorthy (1997) indicates a
good fit for the model.

84
Table 4.13 Maximum Likelihood Estimates for Borrower and non loan beneficiaries
Variables Parameter Co-efficient
(loan beneficiaries)
Co-efficient
(non loan
beneficiaries)
Production Variables
Constant
Land
Labour
Fertilizer
Seeds
Herbicides
Farm capital
Inefficiency Variables
Constant
Age
Farming exp.
income
Education
Household size
Land ownership
Diagnostic statistics
Sigma squared
Gamma
Log Likelihood Function
LR Test of one-sided
Error
b0
b1
b2
b3
b4
b5
b6
d0
d1
d2
d3
d4
d5
d6
6.596(0.531)***
-0.091(0.131)
0.255(0.067)***
0.282(0.542)***
-0.208(0.047)***
0.034(0.104)
0.028(0.029)
0.054(0.996)
0.016(0.031)
0.029(0.028)
-0.727E-05(0.931E-06)***
0.446(0.139)***
-0.036(0.057)
-0.174(0.256)
1.481(0.307)***
0.857(0.039)***
-200.115
86.404
4.806(1.117)***
-0.382(0.109)***
0.125(0.054)**
0.416(0.106)***
-0.227(0.035)***
0.562(0.127)***
0.104(0.103)
1.610(0.748)***
-5.74E-04(9.7E-03)
-1.01E-04(9.8E-03)
-1.38E-05(9.4E-06)
-0.014(0.029)
0.025(0.014)**
-0.379(0.111)***
0.101(0.039)***
0.039(0.541)
-63.275
57.858
Figures outside the parentheses_ co-efficient, figures inside the parentheses_ Standard
Deviation, ***Significant at 1% ** Significant at 5%
Most of the variables examined in the inefficiency model for the non-loan beneficiary
farmershave negative signs which imply that these variables have positive effect on the
technical efficiency of the farmers. This is also shown in table 4.13.
Age of the non-loan beneficiaries had a negative co-efficient and not statistically
significant. This implies thatas the age of the farmer‘s increases, the technical
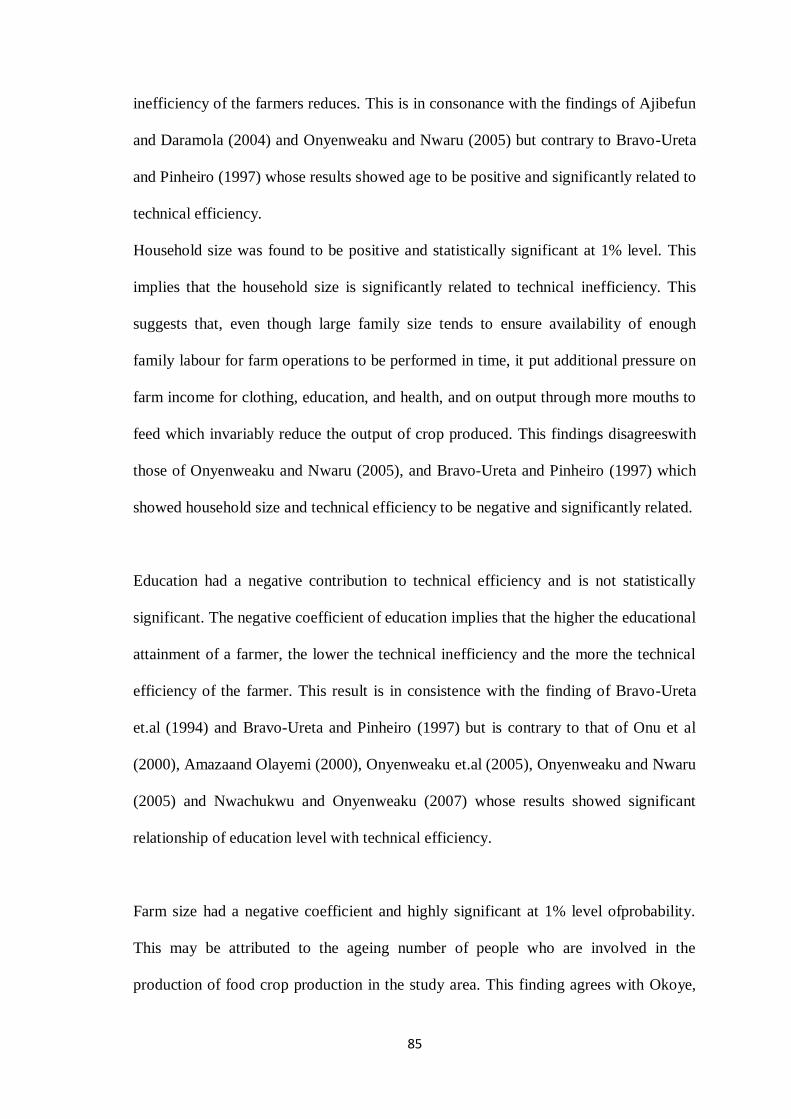
85
inefficiency of the farmers reduces. This is in consonance with the findings of Ajibefun
and Daramola (2004) and Onyenweaku and Nwaru (2005) but contrary to Bravo-Ureta
and Pinheiro (1997) whose results showed age to be positive and significantly related to
technical efficiency.
Household size was found to be positive and statistically significant at 1% level. This
implies that the household size is significantly related to technical inefficiency. This
suggests that, even though large family size tends to ensure availability of enough
family labour for farm operations to be performed in time, it put additional pressure on
farm income for clothing, education, and health, and on output through more mouths to
feed which invariably reduce the output of crop produced. This findings disagreeswith
those of Onyenweaku and Nwaru (2005), and Bravo-Ureta and Pinheiro (1997) which
showed household size and technical efficiency to be negative and significantly related.
Education had a negative contribution to technical efficiency and is not statistically
significant. The negative coefficient of education implies that the higher the educational
attainment of a farmer, the lower the technical inefficiency and the more the technical
efficiency of the farmer. This result is in consistence with the finding of Bravo-Ureta
et.al (1994) and Bravo-Ureta and Pinheiro (1997) but is contrary to that of Onu et al
(2000), Amazaand Olayemi (2000), Onyenweaku et.al (2005), Onyenweaku and Nwaru
(2005) and Nwachukwu and Onyenweaku (2007) whose results showed significant
relationship of education level with technical efficiency.
Farm size had a negative coefficient and highly significant at 1% level ofprobability.
This may be attributed to the ageing number of people who are involved in the
production of food crop production in the study area. This finding agrees with Okoye,

86
et.al (2008) but contrasts those of Onyenweaku and Effiong, (2005),Onyenweaku and
Nwaru (2005), and Onyenweaku, et.al (2005).
Farming experience is negative and not significantly related to technical inefficiency.
This conforms to a priori expectation. It indicates that as the farmer becomes older in
farming, he tends to gain more experience in farming principles and management, pest
and diseases control. This result agrees with the finding of Rahman and Umar (2009)
but disagrees with that of Onyeweaku and Nwaru (2005).
Income was negatively related to technical inefficiency but not statistically significant.
This implies that the more income the farmer has the more inputs and farm implements
he is able to purchase and also the timelier he is able to carry out certain farm activities
and operation.
Land ownership was negatively significant to technical inefficiency of crop production
by the non-beneficiary farmers. This is consistent with a priori expectation. This
implies that landownership had a significant influence on efficiency crop production for
non-beneficiary farmers. Ownership of land, especially with title, has been associated
with increased security that provides farmers an incentive to invest in long term
productivity enhancing practices that influence efficiency (Gorton and Davidova, 2004;
Kariuki, 2008).
The estimation of gamma, which is the ratio of variance of farm-specific performance
of Technical efficiency to the total variance of value productivity per hectare was

87
0.039, implying that 3.9% of the difference between the observed and frontier output is
primarily due to the factors which are under the control of farmers.
4.2.8 Chow test
In order to test for the hypothesis which states that there is no significant relationship
between the socio-economic factors and technical efficiency in crop production
between the two groups of farmer, F-test was conducted using the pooled sum of
squares and the sum of square of the lead equations at 348 degree of freedom and at 1%
level of significant.
The result showed that there was a significant difference between the variances of the
two samples and as such, we reject the null hypothesis, which states that there is no
significant relationship between the socio-economic factors and technical efficiency in
crop production between the two groups of farmer while accepting the alternative one.
This implies that the socioeconomic factors (age, household size, education, farm size,
farming experience and gender) of the famers in the study area have a very significant
effect on the technical efficiency of food crop production.
Table 4.16 F-test between socio-economic factors and technical efficiency in crop
production among the two groups of farmers.
Parameter N SSE (Upper
limit)k
(Lower
limit)n1+n
-2k
F-value f-tab Los
Borrower
Non borrower
Pooled
180
180
360
6.83e+09
4.76e+09
1.27e+10
6 348 322.5*** 2.80 0.01
***Significant at 1%

88
4.3 Impact of Micro Credit on Technical Efficiency of the Loan Beneficiary
Farmer
The result from the independent t-test between the loan beneficiary and non-loan
beneficiary farmersin table 4.15shows that credit use was statistically significant for the
loan beneficiaries in respect of land, fertilizer and herbicides. This may imply that the
availability of credit to the loan beneficiary farmer has enhanced him by cultivating
more land than the non-borrower farmer and using more input particularly fertilizer and
herbicides.
Credit use does not have a significant difference in terms of labour usage, quantity of
seeds and consequently the yield obtained as compared to the non-borrower farmer.
Thus, it can be inferred that credit use has no effect on the yield of the borrower
farmer.This result is in consistence with the findings Muhammad, et.al (2013), in
similar studies in Pakistan, but contrary to those of Kamau, et.al (2014) in Kenya.
The t-test shows that the income levels of the borrower households were significantly
higher than the non-borrower households. This shows that the loan advanced by
microfinance had a significant effect upon the income level of the borrower farmer.
This evidently shows that the income obtained by the borrower farmer might not
necessarily be from the yield of his farm produce alone, possibly through other means
like petty trading. This finding is contrary to the findings of Muhammad et .al (2013)
who reported significant impact of credit use on the income of the borrower.
Table 4.15 Impact of Credit use on Technical Efficiency of the borrower farmer
Inputs variables Loan beneficiaries Non loan beneficiaries t-test
Land (ha)
Labour(man-day)
Fertilizer (kg)
4.40(3.13)
138.54(1261.65)
10.04(5.89)**
2.52(0.301)
120.19(32.71)
8.28(4.451)
34.10***
0.002
5.86***

89
Seeds (kg)
Herbicide(ltr)
Farm capital (N)
65.91(47.71)
14.72(21.48)
133511.59(77920.91)
54.09(30.91)
6.05(3.088)
112433.33(47461.73)
0.65
3.32***
6.09***
Output (Kg)
Income (N)
9093.40(7801.24)
307294.41(181165.55)
9270.93(7403.93)
272555.56(103157.54)
-0.22
2.23**
Figures outside the parentheses_ co-efficient, figures inside the parentheses_ Standard Deviation, ***Significant at 1% ** Significant at 5% 4.4 Accessibility of Microfinance to Crop Farmers
Factors assumed to influence the uptake of credit are usually categorized as either
knowledge based and poverty based (Wiklund and Shepherd, 2003). Knowledge based
determinants includes age and education (Kimuyu and Omiti, 2000; Zeller 1993; 1994);
family business history, entrepreneurial/ farming experience, industry specific know-
how, training and social capital, (Lore, 2007).
Property based determinants are land size, livestock, and other assets. Determinants of
borrowing tested in this study include age, educational level, marital status, family size,
land ownership, income, cost of borrowing, farming experience, extension contacts
(number of visits) and distance to microfinance banks.
4.4.1 Household characteristics of the farmers
Table 4.16 compares the household characteristics of loan beneficiaries and non-loan
beneficiaries of agricultural microcredit in the study area. Households who were loan
beneficiaries had bigger farm sizes, higher educational level, as well as higher
household income and farm capital compared to non-loan beneficiaries.
Non-borrowing households had the least of these characteristics in comparison to the
loan beneficiaries. Contact with extension agents was higher and statistically significant
for loan beneficiaries compared to non-loan beneficiaries (Table 4.16). Also, there were
more men than women in both borrower and non-borrower categories. The percentage

90
of educated farmers among the loan beneficiary group was marginally higher than for
the non-loan beneficiary group. Hence education does not seem to vary much between
the two groups which could suggest a weak influence of formal education on access to
microcredit in the study area. Educated farmers may have other sources of income apart
from farming, which may affect the decision to borrow.
It was also noted thatfarm capitalwas higher forloan beneficiaries indicating that it
(farm capital) could influence access to credit. A fairly high proportion of non-loan
beneficiarieshad household size slightly higher than that of loan beneficiaries.Another
possible important determinant of access to microcredit is the total income of
households. The results show statistical differences in the total income between loan
beneficiaries and non-loan beneficiaries. The total income of loan beneficiaries was
statistically higher than the income non-loan beneficiaries.
Table 4.16 Household Characteristics
Variables Borrower Non-borrower t-stat
Age of farmer
Education level
Household size
Farm size
Farm capital
Income
Marital status
Gender
Farming
experience
Extension
contacts
Output
42.11(9.454)
3.45(1.291)
8.93(3.643)
4.40(3.133)
1335211.59(77920)
307294.41(181165.55)
1.03(0.180)
1.06(0.219)
23.98(8.831)
2.81(1.654)
9093.4(7801.24)
42.58(8.222)
2.88(1.140)
10.27(3.856)
2.52(1.424)
112433.33(47461.73)
272555.56(103157.54)
1.03(0.165)
1.05(0.230)
24.13(9.450)
0.80(0.642)
9270.4(7403.93)
-0.50
4.45***
-8.58***
28.58***
6.09***
2.23**
0.00
0.42
-0.15
42.76***
-0.22
Figures outside the parentheses_ co-efficient, figures inside the parentheses_ Standard Deviation, ***Significant at 1% ** Significant at 5%
It is evident from the table that there is a statistically significant difference between the
microfinance loan beneficiaries and non-loan beneficiaries in terms of-farm capital

91
andland cultivated. In terms ofphysical characteristics, both group seem to be
heterogeneous while in terms of socio-economic characteristics both groups seem to be
homogenous and the averages ofdifferent household characteristics are not significantly
different between the two groups except for household size and education levels. With
regard to output level, there is a marked differencebetween the two groups. The figures
show that non-loan beneficiaries of microfinance are output level was
higher(9270.93kg) than the loan beneficiaries (9093.40kg) although the difference is
not statistically significant.
4.4.2 Loan characteristics of the farmers
The loan characteristics of the loan beneficiaries in the study area showed average loan
size of N145, 166.67. The interest rates charged per year on the loan beneficiaries was
15.16%, while the average duration of the loans was about 10 months. This implies that
shorter loans were given to the loan beneficiaries for agricultural production (Table
4.17).
Figure 3show that most of the loan beneficiaries have an average loan of N 145,166.67.
Majority (70) of the farmers borrowed above N100, 000.00. Only ten farmers in the
sample borrowed more thanN250, 000.00, jut five of the farmers borrowed least
amounts (below N50, 000.00). Overall, the credit supplied by the formal
financialinstitutions in the study area is rather limited.
4.17 Characteristics of loan received by loan beneficiariesin the study area
Variables Mean S.D T-test
Average loan size(N)
Interest rates(%p.a)
Loan duration(mths)
145166.67
15.16
10
53539.26
7.612
3
2.71***
1.99**
3.033***
***Significant at 1% ** Significant at 5%

92
Fig.3 Distribution of Loan amount received by Loan beneficiaries
4.4.3 Determinants of Access to Credit by Crop Farmers
Following the results of the Probit model, access to credit was positively related to the
age, farm size, income, and education level of the farmers. The coefficients in table
4.18 show that the probabilityof individual farmers‘ access to credit is positively
affected by age, farm size, income,education level of the farmersand negatively related
to farming experience, land ownership and household size. These results revealed that
variables with positive signs indicate that their higher values increase the chances that
the farmers have to access credit and vice versa.
5 5
70
50
40
10
00
10
20
30
40
50
60
70
80
≤ 50 50≤100 100≤150 150≤200 200≤250 250 and above
Fre
qu
en
cy (n
o o
f ca
ses)
Loan size ( N'000)

93
Age and farm size was found to be statistically significant and having positive influence
on the probability to access credit. This implies that the chances of the farmers in
accessing credit in the study area increases with age which is an indication that an
increase in age of the borrower by one year increases the probability of accessing loan
by 5%. This means that other things remaining constant as the household age increases
they accumulate collateral that enable them seek for individual loan. Coupled with this
is that the chances of older people beingconsidered for credit are high, and are due to
the high probability of success, with the low riskof default. This is consistent with the
results from Nguyen (2007) who found out that olderhouseholds often have more
assets, reputation and meet the requirement for getting formalcredit in contrast with
younger household who often lack capital and other conditions forcingthem to join
micro-credit groups to access informal credit. Contrary to this, Ayamaga et al. (2006)
also foundthat as age increases, the probability of a farmer to participate in microcredit
programmes inNorthern Ghana, decreased.
Farm size also plays a crucial role in farming decisions and was considered as an
important variable in determining both access to microcredit and size of loan applied
for.Households with small farm lands may not need to borrow to finance their
production or may only need small loans. However households with large farm lands
may need more loans. Furthermore, households with large farm lands may be wealthier
or better-off in the community and this can influence their access to credit. Lenders are
also more likely to give bigger loans to farmers with large farms compared to those
with small farms. This finding is in consistence with Diagne (1999), who noted that
farm size was a significant determinant of access to informal credit and the loan size.
And also the finding of Okurut (2006), who hypothesized that household with more

94
land are more likely to have an interest to expand production and a higher probability of
borrowing. Land can also be used as collateralfor the loan.
Income of the farmers was found to be a significant factor with a positive influence on
the probability to access to microfinance.Household income plays a role in the
decision-making of the household regarding whether to seek loan for farming or not. As
observed by Dodson (1997), demand for agricultural credit over the short term is
influenced by income level and the need to replace capital stock. In rural communities,
economic status, proxied by household income, plays a major role in participation in
projects and access to resources. Hence the income of the household is hypothesised to
influence both loan access and size. Poorer households may be considered as risky loan
beneficiarieswho can affect their loan access and amount borrowed.
Education level of the farmers was found to be a significant factor with a positive
influence on the probability to access to microfinance.The level of education attained
by a farmer not only increases his/her farm productivity but also enhances ability to
understand and evaluate new production technologies (Eze, 2007). Possession of
literacy is one of the criteria for the procurement of formal credit from micro finance
banks (Njoku and Odii, 1991).
Household size is another important household characteristic which influences many
household decisions. Household size was found to have a negative influence on
probability to access credit but a significant factor in accessing credit. This implies that
household size decreases the probability to access to microcredit. Evidence supported
that household size was negatively associated with access to microcredit (Lawal et al,

95
2009). People with large family size are less likely to accept microcredit (Lawal et al,
2009).However, large family size of 9 and above is most likely to spend more of the
microloan in financing consumption and other basic needs as such stands less chance to
access microcredit (Akram et al,2008).
Farming experience and land ownership was found to have negative influence on the
decision to access to microfinance. This might probably be because of non-acceptability
of rural lands by most financial institutions due to its traditional ownership systems.
The chi square estimate of 11.421 is highly significant. As a measure of goodness of fit,
it shows that the data set fit the regression line to a reasonably high level.
Table 4.18 Factors Affecting Access to Credit by Crop Farmers
Variables Coefficients S.D Z test
Age
Farmsize
Farming experience
Income
Education
Household size
Land ownership
Constant
0.0507
0.2867
-0.0110
1.07E-06
0.2969
-0.0842
-0.0378
-3.1331
0.0166
0.0403
0.0156
6.43E-07
0.0638
0.0274
0.1563
0.7013
3.04***
7.11***
-0.71
1.66*
4.65***
-3.07***
-0.24
-4.47***
Log likelihood -192.4287
LR chi2(7) 114.21
Prob chi2 0.0000
Peudo R2 0.2288
Figures outside the parentheses_ co-efficient, figures inside the parentheses_ Standard Deviation, ***Significant at 1% ** Significant at 5%
4.4.4 Determinants of loan amount/size
Following the results in table 4.18, the determinants of the loan amount/size as
calculated in the double hurdle models show that loan amount/sizehas positive

96
coefficient and was related to marital status, farm size, education, cost of borrowing,
farming experience, house hold size, distance to the microfinance bank and extension
contacts. The coefficients also show that the probabilityof borrower farmer loan size is
negatively related to age of the borrower and income level.
Age was found to have to be statistically significant and having negative influence on
loan amount/size.The negative coefficients of age imply that the chances of the farmers
in accessing credit and its size decreases with age. It also means that old age tends to
reduce the probability of accessing microfinance credit and loan size. It infers that
younger farmers stand better chance than older farmers in accessing microfinance. This
is however in agreement with Adeyemi (2008) who showed that older farmers stand
less chance of accessing microfinance.This result is also consistent with the findings of
Sebopetji and Belete (2009).
Farm size was found to be positively correlated with loan size and was statistically
significant at 1% level. This finding was in consistence with Diagne (1999), who noted
that farm size was a significant determinant of access to informal credit and the loan
size.
Land ownership had a positive influence amount borrowed but not statistically
significant in the amount/size of the loan. This is so because land in rural areas
especially land held under custom, generally lacks formal documentation.
Mobuogwu(2013) noted that since such lands lack documentation, securing loan with
such(as collateral) becomes problematic, as banking institutions require titles for land to
be eligible as collateral. In the same vein, it was noted that under many customs, rural

97
dwellers have only possessory rights to the land they occupy. As a result, the consent of
the family or village head is needed to transact with or alienate such land. Moreover,
under many cultures in Nigeria, women are excluded from inheritance, despite women
representing 50 percent of the agricultural labor force and farming constituting the
principal business inrural areas. As such, 50 percent of the agricultural labor force is
often deprivedof the assets needed to obtain loans (FOA, 2011).
Marital status has a positive influence on loan amount/size and was found to be
statistically significant at 1% level. This could be as a result and perception that
marriage confers responsibility and some degree of trustworthiness which could be a
strong weapon particularly when it comes to loan repayment.
Cost of borrowing from the microfinance had a positive influence on the loan size and
was also significantly related to the loan amount. This implies that the more the volume
of the loan acquired by the borrower the high the cost of obtaining it. This also is a
determinant of loan size.
Education was found to be statistically significant at 5% level and also having a
positive influence on the loan amount/size. The implication is that it may be deliberate
policy of MFIs to issue microcredit to literate clientele. Education is perhaps supposed
to impact positively on farmers‘ access to credit and other resources and even in their
usage. Adereti (2005) confirms that education is an essential tool in accessing and using
farm resources efficiently.
Years of farming experience of the loan beneficiaries was noted to be positively and
significantly related to loan amount/size. The years of farming experience of the

98
household head is believed to influence both access to loan and the size of loan. This is
because older farmers with years of farming experience are expected to be
knowledgeable about farming and the various sources of credit. They are also expected
to have better credit management skills and credibility with lenders (Anang et.al,2015).
Distance to the microfinance bank has a positive influence on the loan amount. In the
findings of Pedrosa and Do (2008) noted that long distances between clients and
microfinance offices limits access to basic financial services and thus a major barrier to
development.
Household size was found to have a positive influence on loan size. Access to
microcredit and the amount of loan borrowed are hypothesised to be influenced by the
size of the farming household as it determines the household labour supply which is
important for agricultural production. Households with limited labour supply may need
to borrow to augment their labour supply while households with excess labour may not
face such liquidity constraints. Household size can therefore ease the liquidity
constraints of the household, thus influencing the decision to borrow as well as the loan
amount.
Extension contacts were found to have a positive influence on the loan amount/size but
not statistically significant in the amount/size of the loan acquired. This indicates that
extension service delivery enhances accessibility to microcredit. The result is expected
because extension agents are important source of information for many rural farmers.
Extension agents also help to link farmers‘ groups to credit sources. Thus extension
contact is expected to positively impact access to microcredit. The result agrees with

99
Sanusi and Adedeji (2010) who reported a positively significant relationship between
extension contact and access to formal credit in Rwanda. Efforts to improve access to
agricultural microcredit to smallholder farmers must therefore take into consideration
the improvement of extension service delivery to farmers.
Table 4.19 Determinant of Loan Size
Loan size Co-efficient T value
Age
Farm size
Land ownership
Marital status
Income
Costofborrowing
Education
Distance tobank
Farming experience
Household size
Extension contact
-Constant
-1032.382(463.473)
3669.716(947.855)
7.144(4313.064)
44985.230(13137.070)
-0.020(0.127)
4.407(0.175)
3806.714(1871.141)
199.013(154.433)
792.147(386.378)
611.824(787.543)
1133.284(1020.318)
-26994.89(25997.89)
-2.23***
3.87***
0.001
3.42***
-1.63
25.07***
2.03**
1.29
2.05**
0.78
1.11
-1.04
Figures outside the parentheses_ co-efficient, figures inside the parentheses_ Standard Deviation, ***Significant at 1% ** Significant at 5%
4.4 Problems Militating Against Production Efficiency of Farmers in the Study
Area
a. Low rainfall
Rainfall regime is the most important climatic factor influencing crop cultivation
activities particularly in tropical regions of Nigeria (Ayanlade et al, 2010). Rainfall can
vary considerably even within few distance and different time scale. This implies that
crop yield is exceedingly variable over space and time which will have a big effect in
determining the kind of crop to be grown, farming system to be adopted and the
sequence of farm operations (Adejuwon, 2005). Ayanlade et al. (2010) reported that
rainfall variability is very high in most part of northern guinea Savannah (Yola,

100
Minna, and Kaduna) except Jos which has a unique pattern and a significant
relationship with tuber yield (cassava and yam). Ayanlade et al.(2010) further showed
that rainfall pattern affect output of agricultural produce but, Owusu-sekyere et al.
(2011) observed that since the peak monthly rainfall is declining there is probability
that lower amount of rainfall may occur in future which may have effect on crop
output. Low amount of rainfall constitute more problem to the loan beneficiaries more
than their counterparts.
b. Farm machine, tools and labour
Farmers still rely on the use of tools like hoe and cutlasses, these poor tools can lead to
time wastage, low yield and low farm income to the farmer. While machines are
limited and expensive to hire and equally more expensive to purchase and maintain.
This sometimes cannot be used in some small farm holding and some kinds of soils
and also for cultivation of some crops like yam.
c. Poor Transportation
This includes bad roads, inadequate vehicles, and high cost of bringing the farm
produce from the farm to the market and from rural to urban centres. This increases the
activities of middle men in the movement of food crops from the farm to the urban
centres where they are consumed.
d. Fertilizer/Herbicide
The scarcity and high cost of fertilizer in the study area was a major concern to the
farmers. This was ascertained by almost half of the sampled farmers. Abutu (2014)
noted that initially, the government was subsidizing organic Fertilizer to help boost
agriculture in Nigeria. During this period, most farmers get access to fertilizers at

101
affordable prices. Today, most government at various levels placed low premium to
subsidizing of organic fertilizer thereby making the commodity to be too expensive for
the poor farmers to afford. Also, government had divorced herself from distributing
fertilizers to farmers as it used to be in the past instead the procurement is left in the
hands of fake or relatives of those in power who are tagged as contractors of the
government. These people diverts the products to unknown destinations while the
chief executives will be in the government house organizing press conference to tell
the world the number of millions of metric tonnes of fertilizer distributed to farmers
for that farming season. Problems with fertilizer quality, arbitrage, and timeliness of
fertilizer distribution persisted. Olufokunbi and Titilola (1993) sum it up as follows:
―A large percentage of the demand for fertilizers has not at any time been met. Most of
the actual prices paid are as much as, or even higher than what the landed costs
actually are. Unintended beneficiaries are the ones that have been gaining from
fertilizer marketing arrangement.‖
High cost is another problem militating against theuse of herbicides. Herbicides are
good especially for clearing of weed around our environment; they cause a lot of
damage bykilling the non-targeted beneficial insects thereby creating more problems
in the near future. Kughur (2012) noted that the high cost of herbicides is as a result of
middle men‘sinvolvement in the sale and distribution of herbicides. The middle men in
their attempt to maximize profit buy in largequantities and hike the price of herbicides
almost beyond the average price making it difficult for the peasant farmers to
buy.Apart from that most of the peasant farmers‘ farmland is not big enough to engage
people outside their family as that willamount to waste of their little resources.

102
e. Loan volume and delay in disbursement
It was noted from the findings of the study that the amount requested by the loan
beneficiaries farmers were not the amount granted. In all cases, the amount granted
and disbursed was lower than the one requested. The disbursement in most cases was
not timely, in the sense that it is not disbursed in line with the time the farmer needed
it most for farm activities. In such case, the loan is diverted for another use aside from
what it was initially required for. Ekunwe et.al (2015) in the micro-credit access and
profitability on crop production noted that untimely delivery of loan constituted the
greatest constraint, a second constraint was high interest rate, and then insufficient
loan volume approved. 38.3% of the loan beneficiaries reported small loan volume and
delay in disbursement.
f. Storage
The inadequate storage and processing facilities has accounted for divergence between
national food security and household food security. Even if the total production of
food seems adequate at the aggregate level, it will not lead to significant improvement
in food security unless the food is available for consumption at the right time and in
the right form(Olukunle,2013). A significant quantity of products harvested in Nigeria
perishes due to lack of storage and processing facilities. Simple, efficient, and cost
effective technologies for perishables, such as roots, tubers, fruits and vegetables, are
not as highly developed in the country compared to the storage technologies for cereal
grains and legumes.

103
Heavy post-harvest losses occur due to inadequate storage facilities, especially in tines
of bumper harvests. Olukunle (2013), noted that post-harvest food storage losses are
very high, approximately 40 per cent for perishables, compared to cereal grains and
pulses at about 15 percent. Traditional storage facilities have certain deficiencies,
including a low elevated base giving easy access to rodents, wooden floors that
termites could attack, weak supporting structures that are not moisture-proof, and
inadequate loading and unloading facilities.
Across local government regions, most farmers store only a portion of their crops for
consumption. They sell part of their crop early to get cash to pay for their immediate
financial obligations, including, in some instances, repaying the production loan to the
middlemen and microfinance institution.
g. High interest rate
High interest rates charged by most of the microfinance institute further makes the
available credit not sufficient for farm use. An average of 15.9%p.a was charged as in
contrast to CBN recommended charge through the Agricultural Credit Support Scheme
(ACSS) funds which are disbursed to farmers and agro-allied entrepreneurs at a single-
digit interest rate of 8.0 %p.a(Alegieuno,2010)
4.20 Summary of Problems faced by Crop farmers in the Study Area.
Problems Loan beneficiaries Non loan beneficiaries
Freq % Freq %
Poor Transportation
Fertilizer/herbicide
Low amount of rainfall
Machine/labour
Storage
Loan volume/delay in disbursement
High interest rate
51
111
60
47
58
69
164
28.3
61.7
31.1
26.1
32.2
38.3
91.1
66
59
12
18
58
-
-
36.7
32.8
6.7
10
32.2
-
-

104
CHAPTER FIVE
SUMMARY, RECOMMENDATIONS AND CONCLUSION
5.1 Summary
The significance of microfinance as a major tool in financing agricultural production in
Nigeria has necessitated the overhauling of its financial tools in improving /increasing
crop productivity. Thus, the purpose of this study was to examine the status and
influence of microfinance among the food crop farmers in Niger state.
Primary data was used for this study. A cross-sectional data from farm survey of crop
farmers for 2014 growing season was collected from a total of 360 crop farmers
sampled from 17 Local Government Areas of the state. An analysis of the
socioeconomic characteristics of the borrower and non-borrower reveals that there was
no significant difference between the both groups of farmers in terms of age, education
levels, farming experience and household size.
However, the levels of input used and output obtained by these groups of farmers
showed that fertilizer, seeds, labour, herbicides and farm capital were significant at 1%
level of probability, implying that these values are significantly different from one
another. The results further showed that an average of 10.02kg of fertilizer, 65.91kg of
seeds, 14.72 litres of herbicides and 138 man-day labourswas used by the borrower
farmer on each hectare of land. While the non-borrower farmer used an average of
8.28kg of fertilizer, 54.09kg of seeds, 6.05 litres of herbicides and 120 man-days labour
on a hectare of land.

105
Crop production was found to be inelastic with a decreasing return to scale for both
groups of farmers. Though the mean output tested the both group was not statistically
different from one another.
The distribution and level of technical efficiencies for both groups of farmers was
examined. The mean technical efficiency was found to be 52.9% and 74.2% for the
borrower and non-loan beneficiaries respectively. The result further shows that there
was a significant difference in the technical efficiency level obtained by the two groups
of farmers.
Furthermore, the determinants of technical efficiency observed in the study were age,
household size, education level, farming experience and credit access for the two
groups. The result showed that there was a statistically significant relationship between
the socio-economic factor and technical efficiency in crop production among the
borrower and non-loan beneficiaries. The result further indicates that 85.7% and 3.9%
of the total variation in aggregate food crop production by the borrower and non-loan
beneficiaries respectively is due to technical inefficiency.
The impact of micro credit on technical efficiency of the loan beneficiary farmer
showed a statistically significant relationship ofcredit use in respect of land, fertilizer
and herbicides. While it does not have any significant difference in terms of labour
usage, quantity of seeds and consequently the yield obtained as compared to the non-
beneficiary farmers. The accessibility of microfinance to crop farmers was determined
by household and loan characteristic of the farmers. The results show that there was a
significant difference in the total income, farm capital, land size, household size and
education level between the two groups. While there was no significant difference in
their age, marital status, farming experience and output level. Although majority of the

106
loan beneficiaries (70) borrowed above N100, 000.00, the average loan amount
borrowed was N145, 166.67 at an average interest rate of 15.16% for 10months.
It was observed from the study that age, farm size, income, education level and
household size were factors that significantly affect access to credit.And equally, age,
farm size, marital status, cost of borrowing, education level and farming experience had
a significant influence on the loan size.
5.2 Conclusions
Based on the findings of the study, the study revealed that food crop farmers, especially
microcredit users‘ respondent, are yet to achieve their best, as shown by their low
technical efficiency (TE) value and low output levels, meaning that credit is not
administered with good agricultural practices (GAPs). It further shows that credit alone
cannot engender higher technical efficiency except it goes with other complementary
factors such as efficient utilization of farm inputs (GAPs), and timely disbursement of
loan and sufficient loan volume- This is an indication that loan volumes may be too
small for making a significant impact on crop production.
Furthermore, the results of this study show that both group of farmers are operating
under decreasing return to scale which Olayide and Heady (1982) stated is
characteristic of small-scale peasant farming, applicable only in the short-run.
Moreover, it suggests, according to Ogundari and Ojo (2007), that, efforts should be
made to expand the present scope of production to actualize theirpotential production as
resources have not been fully exploited, meaning that, more output could be achieved
by employing more of the variable inputs.

107
5.3 Recommendations
Based on the findings of the study and conclusion drawn, the following policy
recommendations are made.
i. Banking policies for agricultural credit are still business oriented rather than
directed towards development. So, it is imperative on the part of Federal
Government to chalk out policies and programmes aimed at larger national
interest rather than individual and personal gains. Thus, the Central Bank of
Nigeria (CBN) through credit policies should make efforts to simplify the
borrowing procedure in the terms of time-lag, acceptance of security,
documentation and disbursement of loan. On the other hand, credit facility by
microfinance banks should be provided on time, otherwise the delay in the
completion procedure for taking loans will occur and the farmers will not get
maximum profit regarding their plans.
ii. The central bank of Nigeria (CBN) should make sure that the funds mobilized
for loans are effectively disbursed to the farmers through microfinance banks
and at a reduced interest rate so that farmers would be able to borrow sufficient
money from microfinance bank which would enable them to purchase sufficient
equipment, machineries, storage facilities and farming tools for agricultural
activities.Routine checks and surveillance should be placed on the microfinance
banks by the CBN in order to monitor and ascertain that those laid down rules
and condition for granting loan are strictly followed by the microfinance banks.
iii. Acquisition and recovery process for credit should be simple to give benefits to
maximum number of farmers. Micro credit should come in package including
input supply (seed, fertilizer, pesticides etc), technical know- how and

108
marketing. This would increase the income of the loan beneficiaries and hence
repayment condition will be improved.
iv. It is recommended that Agricultural Development Project (ADP) should
organize training for farmers on application of herbicides and farmers should
form associations so as to pull resources together, buy farm chemicals directly
from the distributors in large quantity and disburse them among themselves to
prevent been exploited especially the hike in price by the middle men. Also
agricultural research institutes in the state should be able to educate farmers
through extension services on advantages of good agricultural practices such as
utilization of improved seeds varieties, recommended seeds rates, fertilizer
rates, cropping patterns, pest and diseases control and proper farm storage.
v. Additionally, there is the need to examine how, when, and what type of
linkages between the non-farm and farm sectors are needed to give the desired
effect on productivity. Financial organizations need to know who they are able
to reach in order to broaden their clientele base; and on the other hand, it is
important to know how much people borrow and by what this is determined, in
order to address the demand for credit in a better way. The way forward then, is
how government, the private sector and civil society organizations (including
NGO‘s) can work together to ensure the success of microfinance and other tools
of crop production efficiency.
5.4 Contribution to Knowledge
1. This study will contribute to the literature on assessment of microfinance on the
technical efficiency of crop production in Niger state.

109
2. It was noted that major determinant of technical efficiency in crop production
by the loan beneficiary farmers (labour, fertilizer, herbicide and farm capital)
was underutilizedwhile seeds was over used which lead to low output level
compare to the other groups. It wasfurther observed that all the input elasticities
were inelastic;a one percent increase in each input results in a less thanone
percent increase in output.This proves that credit without GAPs is inadequate to
promote efficiency. Furthermore, it was observed that the loan beneficiary
farmers used 65kg of seeds, 10kg of fertilizer, 14.72 litres of herbicide and 138
man day labour to produce 9 tonnes (grain equivalent) of food crop while their
counterpart used 54kg of seeds, 8.28kg of fertilizer, 6 litres of herbicides,
120man day of labour in producing 9.27 tonnes of food crops on an hectare of
land.
3. The farm specific technical distribution revealed thatnone of the farmers
reached the frontier threshold.Thus, within the context of the efficient
agriculturalproduction, food crop output per hectare production by loan
beneficiary and non loan beneficiary farmers canstill be increased by 47.1% and
25.8% respectively with using available inputs andtechnology. Though both the
loan beneficiary and non beneficiary farmers were found to have a return
toscaleof 0.30 and 0.60 respectively, which implying that both groups of
farmers are operating instage three of the production frontiers.
4. The findings of the study indicates that there is high interest rates charged by the
microfinance and low volume of loans availed to the farmer which might have

110
lead to lower yield obtained by the loan beneficiaries compared to their
contemporaries as the volume is too low for any meaningful crop production.
5. The distance to most of these microfinance banks, coupled with lot of
bureaucracy the farmers undergoes before obtaining loan and untimely
disbursement makes the farmer want to go without the loan and sometimes
divert it to other use other than crop production.
6. Credit access bows down to the awareness and the knowledge that the
microfinance bank provides loan to its clientele. Though majority of the loan
beneficiaries have one form of education or the other, they still have limited
knowledge of the functionality of microfinance and how to harness benefits
from it.
7. Lastly, microfinance banks are not designed for crop production but rather for
adding value to agricultural produce because of many problems associated with
crop production.

111
REFERENCES
Abdulfatah Y. (2012). Analysis of Economic Efficiency among small scale cassava
farmers in Ondo North Agricultural Development Zone1, Ondo State, Nigeria.
Unpublished Msc. Thesis, Department of Agricultural Economics and
Extension, Bayero University Kano.68pp.
Abutu, Odoh Patrick (2014). Challenges of Agriculture in Nigeria Economy: A Bane to
Food Security. Journal of Agriculture and Veterinary Science (IOSR-JAVS) e-
ISSN: 2319-2380, p-ISSN: 2319-2372. Volume 7, Issue 5 Ver. I (May. 2014),
PP 18-21 www.iosrjournals.org
Adam, G. (2007), Role of Microfinance Institutions in Actualization of MDGs. Paper
delivered at the induction ceremony of Institute of Chartered Economists of
Nigeria (ICEN) in Port Harcourt
Adams, S. and Bartholomew T. A (2010). Impact of Microfinance on Maize Farmers in
Nkoranza (Brong Ahafo Region of Ghana). Journal of Management Research,
2(2):1-13
Adejuwon J.O (2005). Food Crop Production in Nigeria: Present effects of climate
Variability.Climate Research, Inter-Research, Germany: 53-60.
Adereti F.O (2005). Rural Womens Access to and control over Productive Resources;
Implications for Poverty Alleviation among Osun State Rural Women, Nigeria.
Journal of Human Ecology, 18(3):225-230
Adesoji S.A and Farinde A.J(2006). Socio-economic Factors influencing yield of arable
crops in Osun State, Nigeria. Asian Journal of Plant Science, 5:630-634
Adeyemi, K. S. (2008). Institutional reforms for efficient microfinance operations in
Nigeria.Central Bank of Nigeria Bullion, 32(1), 26-34.
Ahmadu, J and G.O Alufohai (2012). Estimation of Technical Efficiency in irrigated
ricefarmers in Niger State. American-Eurasian Journal of Agriculture and
Environmental Sciences, 12(12):1610-1616
Ajewole, O.C and Folayan, J.A (2008). Stochastic Frontier Analysis of Technical
Efficiency inDry Season Leaf Vegetable Production among Small Scale holders
in Ekiti State, Nigeria. Agricultural Journal, 3(4): 252-257. ISSN:1816-9155
©Medwell Journals
112
Ajibefun I. A and Daramola A. G (2004) Efficiency of micro-enterprises in the
NigerianEconomy. AERC Resource Paper 134. African Economic Research
Consortium, Nairobi.
Ajibefun, I. A and Daramola, A. G (1999). Measurement and source of technical
inefficiency in poultry egg production in Ondo State, Nigeria. Journal Econ.
Rural Development, 13:85–94.
Akram, W.,Z. Hussain,H. Sabir, and M. Hussain (2008). Impact of Agricultural Credit
ongrowth and poverty in Pakistan (Time Series Analysis). European Journal of
Scientific Research, 23(2), 243-251.
Alegieuno, Joe (2010). Microcredit Financing by Deposit Money Banks/Microfinance
Banks and the Agricultural Sector Development in Nigeria. Central Bank of
Nigeria Economic and Financial Review December 2010
Ali, M. and Chaudhry, M. A (1990). Interregional farm efficiency in Pakistan‘s
Punjabi. A frontier production function study. Journal of Agricultural
Economics, 41:62–73
Amaza P. S and Olayemi J. K (2000). The influence of education and extension contact
on foodcrop production in Gombe state, Nigeria. Journal of Agri-business and
Rural Development 1(1):80–92.
Amaza, P.S, Y. Bila and A. C. Iheanacho (2006). Identification of Factors that
Influence
Technical Efficiency of Food Crop Production in West Africa: Empirical
Evidence from Borno State, Nigeria. Journal of Agriculture and Rural
Development in the Tropics and Subtropics .Volume 107, No. 2, pages 139–147
Ambali, O.I. Adegbite, D.A. Ayinde, I.A. and Idowu, A.O. (2012). Analysis of
Production Efficiency of Food Crop Farmers of Bank of Agriculture Loan
Scheme in Ogun State Nigeria. Asian Journal of Agricultural Sciences 4(6):
383-389, ISSN: 2041-3890 © Maxwell Scientific Organization, 2012
Submitted: August 04, 2012 Accepted: September 03, 2012 Published:
November 25, 2012
Ambali, O. I. (2013). Microcredit and Technical Efficiency of Rural Farm Households
in Egba Division of Ogun State Nigeria. Journal of Agriculture and
Sustainability, Volume 2, Number 2, 196-211, ISSN 2201-4357
Amos,T.T (2006). Resource Use in Tilapia production among Small Scale Tilapia
Farmers in the Savanna Zone of Northern Nigeria. International Journal of
Fishery, 2(1):42-47.
Anang, B. A, T. Sipiläinen, S. Bäckman and J. Kola (2015). Factors influencing
smallholder farmers‘ access to agricultural microcredit in Northern Ghana vol.
10(24), pp.2460-2469, 11 june,2015. DOI: 10.5897AJAR ISSN 1991-637X
Copyright ©2015 http://www.academicjournals.org/AJAR

113
Anyanwu, C. M (2004). Microfinance Institutions in Nigeria: Policy, Practice and
Practice andPotentials, Paper Presented at the G24 Workshop on constraints to
Growth in Sub Saharan Africa, Pretoria, South Africa, by the Deputy Director
Central Bank of Nigeria, November 29-30, 2004
Appah, Z. E, John M. S and Soreh, W (2012). An Analysis of Microfinance and
Poverty Reduction in Bayelsa State of Nigeria. Kuwait Chapter of Arabian
Journal of Business and Management Review, 1(7): 38-57
Asefa, Shumet (2012). Who is technically efficient in Crop Production in Tigray
Region, Ethiopia? Stochastic Frontier Approach. Global Advanced Research
Journal of Agricultural Science (ISSN: 2315-5094) Vol. 1(7) pp. 191-200,
September, 2012Available online http://garj.org/garjas/index.htm. Copyright ©
2012 Global Advanced Research Journals
Ayamaga, M., Sarpong, D. and Brempong. S. (2006). Factors Influencing the Decision
to Participate in Micro-credit Programmes: An Illustration for Northern Ghana.
GhanaJournal of Development Studies, 3(2): 57-65.
Ayanlade A,T. O Odekunle ,and O.O.I Origoomunje (2010). Impact of Climate
ChangeVariability on Tuber Crops in Guinea Savannah Part of Nigeria: AGIS
Approach. 2(1): 27-35
Bakhsh, K., Ahmad, B. and Hassan, S. (2006), ―Food Security through increasing
Technical Efficiency‖, Asian Journal of Plant Science, Vol. 5 No.6, pp. 970 –
976.
Bamisile, A. S. (2006). Developing a Long -Term Sustainable Microfinance Sector In
Nigeria: The Way Forward, Washington Dc, USA October 23. 27, 2006.
Basu, A, Balvy R, Yulek, M (2004): Microfinance in Africa: Experience and Lessons
from IMF. AN IMF Working paper.
Bateman, M. (2010). ―The illusion of Poverty Reduction‖ Red Pepper Magazine. 44-48
Shepherdess walk, London N17 JP. Office(at)redpepper.org.uk
Binuomoto, S.O., Ajetomobi, J.O. and Ajao, A.O. (2008), ―Technical Efficiency of
Poultry Egg Producers in Oyo State, Nigeria‖, International Journal of Poultry
Science, Vol. 7 No. 12, pp. 1227 – 1231.
Boyle, G. (2009). Be the Change: Empowering Women through Microfinance.
http://www.brazencareerist.com (Accessed on 25/11/09).
Brandsma, J. and Chaouali, R. 2004, ―Making microfinance work better in the Middle
East and North Africa‖, Report of World Bank Institute and World Bank, Middle
East and North Africa Region, Finance, Private Sector, and Infrastructure
Group.

114
Bravo-Ureta, E. B, Boris, E. and Evenson, R.E. (1994). Efficiency in Agricultural
Production. The case of peasant farmers in Eastern Paraguay. Journal of
Agricultural Economics, 10:27–37.
Bravo-Ureta, B.E. and A.E. Pinheiro (1997). Technical, economic and allocative
efficiency in peasant farming: Evidence from the Dominican Republic. The
Developing Economics, 35(1): 48-67.
Briones, R. 2007, ―Do Small Farmers Borrow Less when the Lending rate Increases?
The Case of Rice Farming in the Philippines‖, MPRA Paper No. 6044
Buckley, G. (1997). Microfinance in Africa? Is it Either the Problem or the Solution?
World Development, 25(7): 1081-1091.
Central Bank of Nigeria (2004). Microfinance Policy, Regulatory and Supervisory
Framework for Nigeria. Abuja, Nigeria.
Central Bank of Nigeria (2005). Microfinance Policy, Regulatory and Supervisory
Framework for Nigeria. Abuja, Nigeria.
Central Bank of Nigeria (2011). Microfinance PolicyFramework for Nigeria. Abuja,
Nigeria. Revised April 29 2011. CBN Abuja, Nigeria.
Central Bank of Nigeria (2012). National Financial Inclusion. Summary Report. CBN,
Abuja, 20 January 2012.
Central Bank of Nigeria (2014). Guidelines for Commercial Agriculture Credit Scheme
(CACS). Central bank of Nigeria (CBN) and Federal Government of Nigeria.
Development finance department Central bank of Nigeria, Abuja May14, 2014
Chavas, J. and Aliber, M (1993). An Analysis of Economic Efficiency in Agriculture:
A nonparametric Approach. Journal of Agricultural and Resource Economics,
8(1): 1-16.
Coelli.T.J and G.E. Battese (1996). ―Identification of Factors which Influence the
Technicalinefficiency of Indian Farmers‖. Australian Journal of agricultural
Economics, 40, No.2: 103-128.
Cooper, D. R and Schindler, P. S. (2002). Business Research Methods (8th edition).
Boston McGraw-Hill Irvin.
Dahiru, M.A. and Zubair, H. (2008), Microfinance in Nigeria and the prospects of
introducing its Islamic version there in the light of the selected Muslim
countries experience. Munich Personal REPEC Archive. Paper N0.8287

115
Diagne, Aliou (1999). ―Determinants of household access to and participation in formal
and informal credit markets in Malawi.‖ Food Consumption and Nutrition
Division, Discussion Paper No. 67.
Dodson C. B (1997). Changing Agricultural Institutions and Markets. The Farm Credit
OutlookMimeo pp. 1-25.
Enugu Forum, Policy Paper 7. Policy Challenges for Microfinance Design and Practice
inNigeria. Debating Policy Options for National Development.2006.
www.Microfinancegateway.com
Effiong, E.O (2005). Efficiency of Production in selected livestock enterprises in Akwa
Ibom State, Nigeria. Unpublished Ph.D. Dissertation. Michael Okpara
University of Agriculture, Umudike.
Ekunwe, P.A ,S.I Orewa, M.O Abulu, and R.A Egware (2015). Micro-Credit Access
and Profitability on Crop Production in Orhionmwon Local Government Area
of Edo State, Nigeria.Journal of Applied Science and Environmental
Management. March, 2015 Vol. 19 (1) 81 - 87 Full-text Available Online at
www.ajol.info and www.bioline.org.br/ja
Enwerem, V. A and Ohajianya D. O (2013). Farm Size and Technical Efficiency of
Rice Farmers in Imo State, Nigeria. Greener Journal of Agricultural Sciences,
3(2):128-136. ISSN: 2276-7770
Erhabor, P.O. and Emokaro, C.O. (2007), ―Relative Technical Efficiency of Cassava
Farmers in the three Agro-Ecological Zones of Edo State, Nigeria‖, Journal of
Applied Science, Vol. 7 No. 19, pp. 2818 – 2823.
Esobhawan, A.O. (2007). ―Efficiency Analysis of Artisanal Fishery Production in Edo
State, Nigeria. Ph.D thesis, Dept. of Agricultural Economics and Extension,
Ambrose Alli University, Ekpoma.
Ezeh C.I (2007). Impact of Selected Rural Development Programme on Poverty
Alleviation in Ikwuano LGA, Abia State, Nigeria. African Journal of Food
Agriculture, Nutrition and Development,. Volume 7 No.5. ISSN 1684-5374
Folake, A. F (2005). Microfinance as a Policy Tool for Poverty Alleviation. A Study of
thePerformance of Ten Microfinance Institutions in Nigeria. Morgan State
University.
Food and Agriculture Organisation. (2011). The State of Food and Agriculture 2010-
2011, FAO, Rome, Italy. http://www.fao.org/docrep/013/i2050e/i2050.pdf.
Fufa, B and R. M. Hassan, (2003). Stochastic Maize Production Technology and
Production Risk Analysis in Dadar District, East Ethiopia. Agrekon, 42 (2), 116-
128.
Girabi, F. and Mwakaje, A. E. (2013). Impact of microfinance on smallholder farm
productivity in Tanzania: The case of IRAMBA DISTRICT. Asian Economic
and Financial Review, 3(2), pp.227-242.

116
Ghosh, R. (2006). Microfinance in India: A Critique.
Gobbi S.(2005), ―Microfinance and Micro enterprise development Their contribution to
the economic empowerment of women‖ International Labor Office, Geneva.
Goldberg, N (2005). ―Measuring the impact of Microfinance, taking stock of what we
know‖ Grameen Foundation USA Publication Series. www.gfusa.com
Gorton, M. and Davidova, S. (2004). ―Farm Productivity and Efficiency in the CEE
Applicant Countries: a Synthesis of Results‖ Agricultural Economics 30: 1-16.
Hashemi, S and Rosenberg, R. (2006). Does microfinance reach the poorest?
Graduating the Poorest Into Microfinance: Linking Safety Nets and Financial
Services. CGAP focus Note. No.34. Washington, DC USA.
Haq, M., Hoque, M. and Pathan, S. 2008, ―Regulation of Microfinance Institutions in
Asia: A Comparative Analysis‖, International Review of Business Research
Papers, 4(4):421-450.
Herani, G. M., Rajar, A.W. and Dhakan, A. A. 2007, ―Self-Reliance Micro-Finance in
Tharparkar-Sindh:Suggested Techniques‖, Indus Journal of Management &
Social Sciences, 1(2):147-166.
Hossain, F (2002). Small loans, big claims. Journal of Foreign Policy, 12 (2):79-
82.Hulme, D. (2000). Impact Assessment Methodologies for
Microfinance: Theory, Experience and Better Practice. World
Development, 28(1):79-98.
Idris N.D.M., Siwar C., Talib,. B. (2013). Determinants of Technical efficiency on
pineapple farming, American journal of applied Sciences(AJAS).4: 426-431.
Idiong, I.C (2007). Estimation of Farm Level Technical Efficiency in Small scale
Swamp Rice Production in Cross River State of Nigeria: A Stochastic Frontier
Approach. World Journal of Agricultural Science, 3(5): 653-658.
Ifeoma, N. (2008): The role of Commercial Banks in Financing Agriculture: An
Undergraduate dissertation, Department of Agricultural Economics and
Extension. Federal University of Technology Yola, Nigeria.
Imonikhe, G.A (2004).‖Impact of Katsina State Agricultural and Community
Development on Income and Productivity of Farmers‘. An unpublished ph.D
Thesis, Ahmadu Bello University Zaria, Nigeria. Pp40-59
International Fund for Agricultural Development (2009). Enabling Poor Rural People to
Overcome Poverty in Nigeria. IFAD via Paolo di Dono. Rome, Italy.
Irobi, N. C (2008). Microfinance and Poverty Alleviation. A Case study of Obazu
Progressive Women Association. Mbiere, Imo State Nigeria. Uppsala, Dept of
Economics.

117
Jamil, B (2008). "Microfinance as a tool for poverty alleviation in Nigeria" Paper
Presented at Sensitization Workshop on Microfinance Banking in Kano State,
Nigeria.
Jegede, C. A., Kehinde, J. and Akinlabi, B. H (2011). Impact of Microfinance on
PovertyAlleviation in Nigeria. An Empirical Investigation; European Journal of
Humanities and Social Sciences, 2(1): 97-
111http://www.journalsbank.com/ejhss.htm ©Journalsbank®Publishing
Inc.2011.
Kamau, D., Ayuo, A and Kebete P. (2014). An analysis of Credit Use and Expenditure
on Agricultural Production; The Case of Uasin Gishu County of Kenya. Journal
of Economics and Sustainable Development, ISSN 2222-1700(Paper)
ISSN2222-2855(online). Vol.5 no2, 2014
Kariuki, D.K., Ritho C.N., Munei K. (2008). ―Analysis of the Effect of Land Tenure on
Technical Efficiency in Smallholder Crop Production in Kenya‖ Conference on
International Research on Food Security, Natural Resource Management and
Rural Development, October 7-9, University of Hohenheim.
Karlan .D and Zinman .J (2006). Expanding credit access: Using randomised supply
decisions to estimate the impacts. Review of Financial Studies, 23 (1): 433-464.
Khavul, S. (2010). Microfinance: Creating Opportunities for the Poor? Academy of
Management Perspective, p. 57.
Khan, M. A. and Rahaman, M.A (2007). Impacts of Microfinance on Living Standards,
Empowerment, and Poverty Alleviation and Poor People: A Case Study on
Microfinance in the Chittagong District of Bangladesh. http://www.essays.se.
(Accessed on 24/11/09).
Khan, M. F (1997). Social Dimensions of Islamic Banks in Theory and Practice.
Islamic Research and Training Institute, Islamic Development Bank.
Manuscript.
Khandker, H. Z (1999). ―Assessing the Impact of Micro-credit on Poverty and
Vulnerability inBangladesh,‖ Policy Research Working Paper 2145
(Washington, D.C.: World Bank, (1999),p. 3.
Kimuyu P. and J. Omiti (2000). ―Institutional Impediments to Access to Credit by
Micro andSmall Scale Enterprises in Kenya.‖ IPAR Discussion Paper
No.026/2000. IPAR. Nairobi.
Kormawa, P.M. (1999). Food demand structures and market studies for IITA mandate
crops: An overview. In: Kormawa, P.M. and E. Aiyedun (Eds.), Food Demand
and Market Studies in the Drier Savannah of Nigeria. Proceedings of a

118
Methodological and Stakeholders‘ Workshop, September 7-8, Kaduna, Nigeria,
pp: 23-32.
Kumbhakar, S.C., Ghosh, S. and McGuckin, J.T (1991). A Generalized Production
Frontier Approach for Estimating Determinants of Inefficiency in U.S. Dairy
Farms. Journal of Business and Economic Statistics, 9: 279-86.
Kughur , Peter Gyanden (2012). The effects of herbicides on crop production and
environment in Makurdi Local Government area of Benue State, Nigeria
.Journal of Sustainable Development in Africa (Volume 14, No.4, 2012) ISSN:
1520-5509 Clarion University of Pennsylvania, Clarion, Pennsylvania
Lawal ,J.O., B.T Omonona,O.I.Y Ajani and O.A Oni (2009). Effects of social capital
on credit access among cocoa farming households in Osun State,Nigeria.
Agricultural Journal,4 (4)184-191.
Lee, Jeong-Dong and Hesmati, Almas (2008). Productivity, Efficiency and Economic
growth in Asia-Pacific. Http://books.googlecom.ng/bo
Lindvert, M. (2006). ―Sustainable Development Work and Micro Finance: A Case
Study of howECLOF Ghana is Working Towards Financial Sustainability‖. An
unpublished Thesis submitted to the Department of Social Sciences, Mid
Sweden University.
Littlefield, E. (2005). Microfinance - Where We Are Now and Where We Are Headed,‖
Microfinance speech given at the International Year of Microfinance and
Georgetown University Conference on, Washington DC.
Liverpool-Tasie S, B Olaniyan, S Salau & J Sackey. (2011). A Review of Fertilizer
Policy Issues in Nigeria. IFPRI NSSP Working Paper 0019. Abuja: IFPRI-
Abuja.
Lore, M. (2007). ―An Evaluation of Human Capital Factors that can Enhance Access to
Credit among Retailers in Nairobi.‖ Unpublished Project Report Submitted to
United states International University-Africa. Nairobi.
Maldonedo J. (2005), ―The Influence of Microfinance on the Education Decision of
Rural Household Evidence from Bolivia‖ Universidad de Los Andes. CEDE
Document No 2005-46 Bogotá Columbia.
Martínez Espiñeira R. (2006). A Box-Cox double-hurdle model of wildlife valuation:
thecitizen‘s perspective. Ecological Economics 58(1), 192-208
Mejeha, R.O. and Nnanna, I.N. (2010). Effect of Root and Tuber Expansion
Programme (RTEP) on Commercialization of Staple Food Crops in Abia State
Nigeria. In: Commercial Agriculture, Banking Reform and Economic
Downturn: Setting a New Agenda for Agricultural Development in Nigeria.
Proceedings of the 11th
Annual National Conference of National Association of
Agricultural Economists (NAAE), FUT, Minna, Nov. 30 – Dec.3: 66-71.

119
Miller, C (2011). Agricultural Value Chain Finance Strategy and Design. Technical
Note.Rome: Food and Agriculture Organization of the United Nations.
Microfinance Gateway (2008). Internal Operational Challenges around Rural and
Agricultural Finance. CGAP/ Microfinance Gateway. 1818 H Street NW, MSN
P3-300, Washington, DC 20433 USA.
Mobuogwu Maureen (2013). Rural Land and Credit access in Nigeria. Focus on land in
Africa. World Resources Institute.
Moffatt, P. G (2003). Hurdle models of loan default. School of Economic and Social
StudiesUniversity of East Anglia. Available on-line at
http://www.crc.ems.ed.ac.uk/conference/presentations/moffat.pdf.
Mohammad, N. (1992). Anthropogenic Dimensions in Agriculture. Ashok Kumar &
Concept. New Delhi: publishing company.
Mohammed, A. D. and Hassan, Z. (2009), Microfinance in Nigeria and the Prospects of
Introducing and Islamic Version in the light of Selected Muslim Countries‘
Experience. Review of Islamic Economics, 13(1), pp. 115-174
Muhammad, N.K., Munir, K,Saqib, S.A, Saqib, A., Murad, A and Sobia N. (2013). The
Effect of Zarai Taraqiati Bank in enhancing Farm Productivity through
Agricultural credit; A Case of District Lakki Marwat, KPK-Pakistan. Research
Journal of Agriculture and Forestry Science, Vol. 1(8)1-4, September 2013
Murdoch J. (1995), ―Income Smoothing and Consumption Smoothing‖ Journal of
Economic Perspectives 9(3): 103-114.
Mustapha A and Salihu. A (2015). Determinants of Technical Efficiency of
Maize/Cowpea Intercropping Among Women Farmers in Gombe State,
Nigeria.Journal of Agriculture and Sustainability, Volume 7, Number 2, 2015,
245-258, ISSN 2201-4357
National Population Commission (NPC), (2006). Official Census Figures. NPC, Abuja,
Nigeria
Ndubueze-Ogaraku, M. E and Ekine, D. I (2015). Application of the Stochastic
Production Frontier Function Model to Cassava Production in the Floodplain
Area of Rivers State, Nigeria. Journal of Biology, Agriculture and Healthcare,
Vol.5, No.4, 2015. www.iiste.org, ISSN 2224-3208 (Paper) ISSN 2225-093X
(Online)
Niger State Government Gazette (2009). The A.B.C of S.M.E and Microfinance In
Niger State. Governor‘s office.
Nguyen, C. (2007). Determinants of Credit Participation and its Impact on Household
Consumption: Evidence from Rural Vietnam. Paper presented at the 3rd
Leicester PhDConference on Economics, England.

120
Njoku, J.E and M.A.C.A Odii (1991). Determinants of Loan repayment under the
special emergency loan scheme(SCALS) in Nigeria. A case study of Imo State.
In African Review of Money, Finance and banking. FIN Africa Italy
Nosiru, M.O(2010).Microcredits and Agricultural Productivity inOgun State,
Nigeria.World Journal of Agricultural Science,6(3): 290-296.IDOSI
Publications.
Nwanyanwu, O. J. (2011). Microfinance in Nigeria: Problems and Prospects. African
Research Review, 5(2), 87-103.
Nwaru, J.C. (2005). Determinants of Farm and off-farm Incomes and Savings of Food
Crop farmers in Imo State, Nigeria: Implication for Poverty Alleviation.
Nigerian Agricultural Journal. 36:26-42.
Odoemenem, I. U and C.P.O, Obinne (2010). Assessing the Factors Influencing the
Utilization of Improved Cereal Crop Production Technologies by Small Scale
Farmers InNigeria. Indian Journal of Science and Technology. 3(1), pp. 180 –
183.
Ogundari, K. and Ojo, S.O (2007). Economic Efficiency of Small Scale Food Crop
Productionin Nigeria: A Stochastic Frontier Approach. Journal of Social
Science, 14(2): 123-130.
Ogundele, F.O. and Okoruwa, V.O. (2004). A Comparative Analysis of Technical
Efficiency between Traditional and Improved Rice Variety Farmers in Nigeria.
African Journal of Economic Policy, 11(1): 91-108.
Okoye,B.C, Onyenweaku, C.E., Ukoha, O.O., Asumugha, G.N and Aniedu, O.C
(2008). ―Determinant of Labour Productivity on Smallholder cocoyam farms in
Anambra State, Nigeria.‖ Scientific Research and Essay. 3(11):559-561
Okon, U. E, A.A Enete and N.E Bassey(2010). Technical Efficiency and its
Determinants in Garden Egg (Solanum Spp) Production In Uyo Metropolis,
Akwa Ibom State, Nigeria. Field Actions Science Report. Special Issue 1. Urban
Agriculture.http://factsreports.revues. org/458
Okurut, Francis Nathan (2006). ―Access to credit by the poor in South Africa: Evidence
from Household Survey Data 1995 and 2000.‖ Stellenbosch economic working
papers: 13/2006.
Olagunju, F. I. (2007) Impact of Credit Use on Resource Productivity of Sweet
Potatoes Farmers in Osun-State, Nigeria. Journal of Social Science, 14(2): 175-
178 Kamla-Raj 2007
Olaitan M.A (2006) "Finance for Small and Medium Scale Enterprises in Nigeria"
Journal of International Farm Management, Volume 3 No 2 January

121
Olanipekun , A.A and Kuponiyi, F.A (2010). The Contribution of Livelihood
Diversification to rural households in Ogbomoso Agricultural Zone of Oyo
State, Nigeria. Nigerian Journal of Rural Sociology, Volume 11, No 2.
December 2010.
Olawuyi, S.O., Olapade-Ogunwole, F., Fabiyi Y.L and Ganiyu M.O. (2010). Effects of
Micro-finance Bank Credit Scheme on Crop Farmers‘ Revenue in Ogbomoso
South L.G.A of Oyo State. Proceedings of the 11th Annual Conference of
National Association of Agricultural Economists (NAAE). University of Benin.
Nov. 30th – Dec.3rd.
Olayide, S.O. and Heady, E.O. (1982). Introduction to Agricultural Economics. Ibadan
University Press, Nigeria.
Olomola A.S and Gyimah-Brempong, K (2014). Loan demand and rationing among
Small Scale farmers in Nigeria. IFPRI Discusion paper 01403 December 2014.
Olukunle, Oni Timothy (2013) Challenges and Prospects of Agriculture in Nigeria: The
Way Forward. Journal of Economics and Sustainable Development,
www.iiste.org .ISSN 2222-1700 (Paper) ISSN 2222-2855 (Online) Vol.4,
No.16, 2013.
Omeh, N.G. (2006). Determinants of Commercialization of Cassava Production in Abia
State, Nigeria. An unpublished undergraduateProject submitted to the
Department of Agricultural Economics,Michael Okpara University of
Agriculture, Umudike.
Onaolapo and Oladejo (2011): Impact of Cooperative Financing on MDGS of Poverty
Eradication; Lesson from Nigeria. Research Journal of Finance and
Accounting, Volume 2, No11.
Onu, J. K., Amaza, P.S and Okunmadewa, F.Y (2000). Determinants of Cotton
Production and Economic Efficiency. African Journal of Business and
Economic Research1:234–240.
Onubuogo,G.C and Onyeneke R.U (2012). Market Orientation of Root and Tuber crops
Production in Imo State, Nigeria. Agricultural Science Research Journal, Vol.
2(5); pp206-216
Onyenweaku, C.E. and Effiong, E.O. (2005). Technical Efficiency in Pig Production in
Akwalbom State, Nigeria. International Journal of Agricultural and Rural
Development, 6: 51-57.
Onyenweaku C. E and Nwaru, J. C (2005). Application of Stochastic Frontier
Production Function to the measurement of Technical Efficiency in Food
Production in Imo state, Nigeria. Nigeria Agricultural Journal36:1-2.
Onyenweaku, C.E., Igwe, K.C and Mbanasor, J.A. (2005). Application of a Stochastic
Frontier Production Function to the measurement of Technical Efficiency in

122
Yam Production in Nasarawa State, Nigeria. Journal of Sustainable Tropical
Agricultural Resources, 13: 20-25.
Owusu–Sekyere J.D., Alhassan, M and Nyarko, B.K (2011). Assessment of Climate
Shift andCrop Yields in the Cape Coast Area in the Central Region of Ghana.
APRN J. Agric. and Biol. Sci., 6(2): 10-16
Pedrosa, Jose and Quy-Toan Do (2008). How does geographic distance affect credit
marketaccess in Niger? Policy Research Working Paper Series 4772. The World
Bank.
Priya, M (2006). The Effects of Microfinance Program Participation on Income and
Income Inequality: Evidence from Ghana. http://cniss.wustl.edu/publications
(Accessed on 15/11/09).
Rahim, A. R. A. and Rahman, A. 2007, ―Islamic Microfinance: A Missing Component
in Islamic Banking‖, Kyoto Bulletin of Islamic Area Studies, 1(2):38-53
Rahji, M. A. Y; and S. A. Fakayode (2009). A Multinomial Logit analysis of
Agricultural Credit Rationing by Commercial Banks in Nigeria. International
Research Journal of Finance and Economics 24, 91.
www.eurojournals.com/finance
Rahman, S (2003). "Profit Efficiency among Bangladeshi Rice Farmers." Food Policy,
28:487-503.
Rahman, S. A and Umar, H. S (2009). Measurement of Technical Efficiency and its
Determinants in Crop production in Lafia Local Government Area of Nasarawa
State, Nigeria.Journal of Tropical Agriculture, Food, Environment and
Extension, 8(2): 90 – 96.
Ray, S (1988). Data Envelopement Analysis, Non discretionary Inputs and Efficiency:
AnAlternative Interpretation. Socio- Economic Planning Science journal, 22:
167- 176.
Rogaly, B (1996). Microfinance Evangelism, Destitute Women, and the Hard Selling of
aNew Antipoverty Formula. Development in Practice, 6, 100-112.
Sanusi, W. A and Adedeji, I. A. (2010). ―A Probit Analysis of Accessibility of Small-
ScaleFarmers to Formal Source of Credit in Ogbomosho Zone, Oyo State,
Nigeria.‖ Agricultural Tropica et Subtropica 43 (1): 49–53.
Sebopetji T.O and Belete, A. (2009). An Application of Probit Analysis to Factors
AffectingSmall-Scale Farmers‘ Decision to take Credit: A Case Study of
Greater Letabo Local Municipality in South Africa. Africa Journal of
Agricultural Research, 4(8):718-723.
Sekhon, M.A., Mahal,A.K., Kaur, M and Sidhu, M.S (2010). Technical Efficiency in
Crop Production: A Region-wise analysis. Agricultural Economics Research
Review, Vol. 23, July-Dec 2010, pp.367-374

123
Sen, A.K. (1964) Size of holding and productivity, The Economic Weekly, 16 (17-18):
777-778.
Sharif, N. R and Dar, A (1996). An Empirical Study of the Patterns and Sources of
TechnicalInefficiency in Traditional and HYV Rice Cultivation in Bangladesh.
Journal of Development studies, 32, 612-629.
Soludo, C. C (2008). Framework for Public Private Partnership in Microfinancing in
Nigeria.Being a Keynote Address by the Governor of Central Bank of Nigeria at
the International Microfinance Conference and Annual
Microfinance/Entrepreneurship Awards, Abuja, Nigeria, January 17 -18, 2008
UNDP‗s document on Development of a sustainable pro-poor financial sector
Phase II MicroStart Nigeria.www.uncdf.org accessed on 12/01/2008
Standish, B (2000) Economics: Principles and Practice. South Africa: Pearson
Education.pp. 13–15. ISBN 978-1-86891-069-4.
Tadesse, B. and Krishnamoorthy, S (1997). Technical Efficiency of Paddy farmers of
TamilNadu: An Analysis based onFarm and Ecological Zone.Journal of
Agricultural Economics 16:185-192.
Tanko,L., Baba, K.M and Adeniji, O. B (2011). Analysis of the Competitiveness of
Mono-crop and mixed crop enterprises in farming system of smallholder
farmers in Niger State, Nigeria. International Journal of AgriScience, 1(6):344-
355
Tenaw, S.K.M., Islam, Z and Parviainen, T (2009). Effects of Land Tenure and
Property rightson agricultural productivity in Ethiopia, Namibia and
Bangladesh. University of Helsinki Department of Economics and Management
Discussion Papers no 33 Helsinki 2009.
The Montpellier panel (2013). Sustainable Intensification: A New Paradigm for African
Agriculture, London. www.ag4impact.org.
Tijjani, A. A. (2006). Analysis of the technical efficiency of rice farms in Ijesha Land
of Osun State, Nigeria. Agrekon, 45(2): pp 126-135.
Toritseju Begho and O‘raye Dicta Ogisi (2014) Bayes Approach to the Estimation of
TechnicalEfficiency and Returns to Scale in Agriculture:A Case of Nigeria.
Asian Journal of Agricultural Extension,Economics & Sociology3(4): 275-284,
2014; Article no. AJAEES.2014.4.002. SCIENCEDOMAIN
internationalwww.sciencedomain.org
Tzouvelekas, V., Pantzios, C. J and Fotopoulos, C (2001). "Technical Efficiency of
Alternative Farming Systems: The case of Greek organic and conventional
Olive-growing farming." Food Policy, 26: 549-569.
United Nations Capital Development fund [UNCDF]. (2009). Enabling Poor Rural
People toOvercome Poverty in Ghana. United Nations, New York.

124
Wadud, A. and White, B (2002). Farm household efficiency in Bangladesh; A
Comparison ofStochastic Frontier and DEA methods. Applied Economics, 32,
1665-1678.
Wiklund, J and Shepherd, D. (2003). Knowledge-based Resources, Entrepreneurial
Orientationand Performance of Small and Medium Sized Businesses. Strategic
ManagementJournal. 24:1307-1314
Win, S.S., Kitchaicharoen J. and Chaovanopoopho Y. (2007). An Empirical Study of
Efficiency of Groundnut Production in Central Myanmar; A Stochastic Frontier
Analysis.
Yang, J., Wang, H.,Jin, S.,Chen, K.Z., Reidinger, J and Chao, P. (2014) . Migration,
Local off Farm Employment and Agricultural Production Efficiency: Evidence
from China. IFPRI Discussion paper 1338. Washington DC; International Food
Policy Research Institute (IFPRI)
http://ebrary.ifpri.org/cdm/ref/collection/p15738coll2/id/128117.
Zeller, Manfred (1993). ―Participation of Rural Households in Informal and Formal
Credit Markets in Madagascar.‖ Washington, D.C.: IFPRI.
Zeller, Manfred (1994). Determinants of Credit Rationing: A Study of Informal
Lenders andFormal Credit Groups in Madagascar. World Development. 22 (12):
1895–1907.

125
APPENDIX
DEPARTMENT OF AGRICULTURAL ECONOMICS & RURAL SOCIOLOGY
FACULTY OF AGRICULTURE,
AHMADU BELLO UNIVERSITY ZARIA, NIGERIA.
RESEARCH QUESTIONNAIRE
SECTION A
1. Name of respondent……………………………………………………………
2. Local Govt/ district …………………………………………………………….
3. Village ………………………………………………………………………..
4. Age………………………………………………………………………….
5. Sex ; male ( ) female ( )
6. Marital status ; married ( ) single ( )
7. If married, number of people in the household…………………………………
8. Level of education
a. Not literate at all
b. Islamic school
c. Primary school
d. Secondary school
e. Tertiary institution
9. Main occupation
a. Farming
b. Petty trading
c. Civil service
d. Agricultural marketing

126
e. Others
(specify)…………………………………………………………………….
10. Land tenure
a. Hired
b. Borrowed
c. Inherited
d. Purchased
11. If your land is not owned by you, how much do you pay to either hire or
purchase it? ..........................................................................................................
12. If hired/borrowed, what is the length of your hired/borrowed capability?
...............................................................................................................................
13. What is your source of capital
a. Bank
b. Cooperative
c. Owned
d. Borrowed from informal source
e. Others
(specify)………………………………………………………………..
SECTION B
14. How long have you been farming? .......................................................................
15. What kind of crops do you grow? .........................................................................
16. How many hectares do you devote to crop
farming………………………………

127
17. How many hectares do you devote to cash crop farming? ……….....................
18. How many tones/kg of crop did you harvest
a. Maize
b. Rice
c. Yams
d. Others……………………………………………………………………
19. How much did you obtain after sales of produce? .......................................
20. What are the inputs you used for this season
cultivation………………………………………………………………………
……………………………………………………………………………………
……………………………………………………………………………………
……………
21. What quantity of seeds did you use? …………………………………………..
22. What quantity of herbicide did you use? ...............................................................
23. What amount of labour did you use? ..............................................................
24. What type of fertilizer did you use?
a. Chemical fertilizer
b. Organic (animal dung)
25. What quantity of fertilizer did you use? …………………………………….
26. What was your total sale of the output? .............................................................
27. How much is the lease price of land per hectare (N)……………………….
28. How much is the price of labour for man-day (N) …………………………..
29. How much is price of seeds per kilogram (N) …………………………………

128
30. What is price of fertilizer per kilogram (N) ……………………………………
31. How much is price of herbicides (N) …………………………………………
32. How much of capital was invested (N) ………………………………………
33. What amount of yield did you get (kg/ha) ………………………………….
SECTION C
34. Is there a microfinance institution in your area? ..................................................
35. Who introduced you to microfinance? .................................................................
36. If extension officer, how many visits do you receive from them……………..
37. If no, where do you access a microfinance institution? .........................................
38. How close is a microfinance bank to you? ...........................................................
39. Do you enjoy micro credit from the microfinance? ..............................................
40. If yes, how easy do you access credit?
41. If no, what are the difficulties encountered while accessing
microcredit?............................................................................................................
.................................................................................................................................
.................................................................................................................................
.................................................................................................................................
.........................................................................................................
42. How long have you been enjoying micro credit? ..................................................
43. What is the quantity do you enjoy? ……………………………………………
44. How often do you enjoy microcredit?..................................................................a
seasonal, semi-annually, monthly, yearly

129
45. What are the cost incurred in obtaining micro
credit?……………………………………………………………………………
……………………………………………………………………………………
……………………………………………………………………………………
……………………………………………………………………………………
……………………………………………………………………………………
……
46. What are the conditions required in order to obtain microcredit?
……………………………………………………………………………………
……………………………………………………………………………………
……………………………………………………………………………………
…………………………………………………..………………………………
……………………………………………………………………………………
……………..
……………………………………………………………………………………
……
47. How much did of microcredit did you obtain for this growing
season?....................................................................................................................
.................................................................................................................................
.................................................................................................................................
.............................................................................
48. How much did you dedicate for arable crop cultivation?..................................
49. How much did you dedicate for cash crop cultivation? ...............................
50. How much did you pay as interest? ..............................................................

130
51. What is the duration of payment? ...................................................................
52. Is it instalment or wholesome? ............................................................................
53. If instalment, how many instalments did u make?..............................................
54. What are the problems you encounter in order to obtain micro-credit?
……………………………………………………………………………………
……………………………………………………………………………………
……………………………………………………………………………………
……………………………………………………………………………………
……………………………………………………………………………………
……………………………………………………………………………………
………………………………
55. What encumbrances do you encounter when obtaining micro credits?
……………………………………………………………………………………
……………………………………………………………………………………
……………………………………………………………………………………
………………………………………..…………………………………………
……………………………………………………………………………………
56. What problems do you encounter in crop production?
……………………………………………………………………………………
………………………………………..…………………………………………
……………………………………………………………………………………
……………………………………………………………………………………
…………………