an assessment of the investment climate in kenya - isbn...
TRANSCRIPT

D I R E C T I O N S I N D E V E L O P M E N T
Private Sector Development
An Assessment of theInvestment Climate in Kenya
Giuseppe Iarossi
47716
Pub
lic D
iscl
osur
e A
utho
rized
Pub
lic D
iscl
osur
e A
utho
rized
Pub
lic D
iscl
osur
e A
utho
rized
Pub
lic D
iscl
osur
e A
utho
rized
Pub
lic D
iscl
osur
e A
utho
rized
Pub
lic D
iscl
osur
e A
utho
rized
Pub
lic D
iscl
osur
e A
utho
rized
Pub
lic D
iscl
osur
e A
utho
rized

An Assessment of the Investment Climate in Kenya


An Assessment of theInvestment Climate in KenyaGiuseppe Iarossi

© 2009 The International Bank for Reconstruction and Development / The World Bank
1818 H Street NWWashington DC 20433Telephone: 202-473-1000Internet: www.worldbank.orgE-mail: [email protected]
All rights reserved
1 2 3 4 5 12 11 10 09
This volume is a product of the staff of the International Bank for Reconstruction andDevelopment / The World Bank. The findings, interpretations, and conclusions expressed in thisvolume do not necessarily reflect the views of the Executive Directors of The World Bank or thegovernments they represent.
The World Bank does not guarantee the accuracy of the data included in this work. The bound-aries, colors, denominations, and other information shown on any map in this work do not implyany judgement on the part of The World Bank concerning the legal status of any territory or theendorsement or acceptance of such boundaries.
Rights and Permissions
The material in this publication is copyrighted. Copying and/or transmitting portions or all of thiswork without permission may be a violation of applicable law. The International Bank forReconstruction and Development / The World Bank encourages dissemination of its work and willnormally grant permission to reproduce portions of the work promptly.
For permission to photocopy or reprint any part of this work, please send a request with completeinformation to the Copyright Clearance Center Inc., 222 Rosewood Drive, Danvers, MA 01923,USA; telephone: 978-750-8400; fax: 978-750-4470; Internet: www.copyright.com.
All other queries on rights and licenses, including subsidiary rights, should be addressed to theOffice of the Publisher, The World Bank, 1818 H Street NW, Washington, DC 20433, USA; fax:202-522-2422; e-mail: [email protected].
ISBN: 978-0-8213-7812-0eISBN: 978-0-8213-7813-7DOI: 10.1596/978-0-8213-7812-0
Cover photo: © World Bank/Curt Carnemark
Library of Congress Cataloging-in-Publication Data
Iarossi, Giuseppe.An assessment of the investment climate in Kenya / Giuseppe Iarossi.
p. cm.Includes bibliographical references and index.ISBN 978-0-8213-7812-0 — ISBN 978-0-8213-7813-7 (electronic)1. Investments—Kenya. 2. Business enterprises—Kenya. 3. Corporate culture—Kenya. I. Title.
HG5843.A3I27 2009330.96762—dc22
2008051559

Abbreviations xiAcknowledgments xiii
Overview 1
Chapter 1 Competitiveness of Kenyan Firms 11Overview 11Labor Productivity 13Unit Labor Costs 14Total Factor Productivity 15Note 17
Chapter 2 Business Climate 19Introduction 19Tax Rates 26Corruption 29Crime 44Tax Administration 48Business Licensing and Permits 49Notes 55
Contents
v

vi Contents
Chapter 3 Access to Finance 57Access to Finance from an International Perspective 57Effect of Firm Size on Access to Credit 65Characteristics of Loan Products 68Loan Applications and Rejections 69Notes 71
Chapter 4 Labor Markets and Human Capital 73Worker Skills 74Labor Regulations 80Wages 81Absenteeism 85Notes 86
Chapter 5 Microenterprises in Kenya 89Registration Characteristics 89Benefits of Formality: Access to Finance and Land 90Costs of Formality: Taxes, Burden of Inspections,
and Business Licensing 93Notes 96
Chapter 6 Recommendations 97
Technical Appendix 111Enterprise Survey in Kenya: Sample Design 111Note 112
References 113
Index 117
Figures1.1 Trends in Public and Private GDP Growth/Private
Share in Total GDP, 1978–2005 121.2 Cross-Country Comparison of Labor Productivity 141.3 Unit Labor Costs 151.4 Total Factor Productivity Relative to South Africa 172.1 Top-Ranked Constraints by Labor Growth and
Labor Productivity 222.2 Indirect Costs in 2003 and 2007—Kenya
Manufacturing Sector 26

2.3 Indirect Costs, All Formal Firms—International Comparison 27
2.4 Firms Reporting Tax Rate as Major or Very Severe Problem 282.5 Total Amount of Taxes as Percentage of
Profit—International Comparison 282.6 Breakdown of Taxes—International Comparison 292.7 Firms Perceiving Corruption as a Severe or Major
Constraint—International Comparison 302.8 Kenya—Evolution of Transparency International
Corruption Rating 312.9 Transparency International Corruption
Rating—International Comparison, 2007 312.10 Bribes in Public Procurement 322.11 Bribe Requests from Tax Inspectors—Cross-Country
Comparison 332.12 Percentage of Firms Requesting Licenses from
Local and Central Government 332.13 Bribes, Licenses, and Utilities: Percentage of Firms
from Which Informal Payments Are Requested When They Apply for Licenses and Utilities 34
2.14 Courts Malfunctioning: Percentage of Firms ThatConsider the Court System Efficient 35
2.15 Court Procedures and Cost—International Comparison 362.16 Time and Cost to Close a Business—International
Comparison 362.17 Percentage of Firms That Experienced Sales Losses
from Electrical Outages 372.18 Sales Lost as a Result of Power Outages—International
Comparison 402.19 Days to Obtain an Electricity Connection—International
Comparison 402.20 Inventory Holdings—International Comparison 412.21 Inland Transportation Costs 422.22 Percentage of Sales Lost While in Transit—International
Comparison 432.23 Transportation Losses, by Firm Characteristics 432.24 Cost of Clearing Customs 442.25 Percentage of Firms Reporting Crime as a Major
or Very Severe Obstacle to Business—International Comparison 45
Contents vii

2.26 Crime Costs—International Comparison 462.27 Cost of Security Services in Percent of Sales—International
Comparison 472.28 Total Costs of Crime—International Comparison 472.29 Impact of Security on Business Decisions 482.30 Time Spent in Dealing with Tax Officials—International
Comparison 492.31 Number of Tax Payments and Time to Fill Out
Forms—International Comparison 502.32 Percentage of Firms Complaining about Business
Licensing and Permits—International Comparison 512.33 Duration, Cost, and Number of Procedures Required to
Obtain Business Licenses—International Comparison 522.34 Manager’s Time Spent Dealing with Regulations 522.35 Duration and Cost to Start a Business—International
Comparison 532.36 Average Time to Renew a Business License—Kenya 532.37 Trade Documents Preparation Costs 542.38 Use and Cost of Facilitators When Dealing with Licenses 543.1 Percentage of Manufacturing Enterprises Reporting
Finance as a Serious Impediment to Operation, by Size—International Comparison 58
3.2 Annual Cost of Borrowing 593.3 Sources of Finance for Working Capital—International
Comparison, Manufacturing Sector 613.4 Sources of Finance for New Investments—International
Comparison, Manufacturing Sector 623.5 Median Annual Real Cost of Borrowing and Loan
Duration Terms—International Comparison, Manufacturing Sector 63
3.6 Collateral Requirements—International Comparison 643.7 Access to Credit, by Firm Size 664.1 Percentage of Manufacturing Firms Reporting
Skills Shortage as a Serious Constraint to Firm Operation—International Comparison 74
4.2 Percentage of Firms Providing Training and Percentage of Workers Trained 78
4.3 Percentage of Manufacturing Firms Reporting Labor Regulations Are a Serious Problem—International Comparison 80
viii Contents

4.4 Country Rankings According to Strictness of Labor Regulations 82
4.5 Median Monthly Wages for Production Workers—International Comparison, Manufacturing Sector 83
4.6 Median Monthly Wages in Food and Garment Sectors—International Comparison 84
4.7 Workers’ Absenteeism, Number of Days in Past 30 Days,Manufacturing Sector 86
5.1 Business Constraints: Percent Ranking Problem to Be Major or Severe 91
5.2 Percentage of Firms Using Various Sources to Finance New Investment and Obtain Working Capital, by Firm Size 92
5.3 Microenterprise Financial Characteristics 935.4 Percentage of Income Reported for Tax Purposes:
Microenterprises 945.5 Perceived Reasons for Choosing Informality 955.6 Median Number of Visits/Required Meetings with
Tax Officials per Year 95
Tables2.1 Firms Reporting Major or Very Severe Business
Constraints: All Formal Firms, Kenya, 2007 202.2 Ranking and Rating of Business Constraints in Kenya 212.3 Kenyan Firms in Manufacturing Sector Reporting
Major or Very Severe Constraints, 2007 and 2003 232.4 Firms Reporting Major or Very Severe
Constraints—International Comparison 242.5 Indirect Costs—All Formal Sectors, Kenya, 2007 252.6 Frequency and Duration of Power Outages and
Power Generator Ownership in Kenya 382.7 Power Outages and Usage of Electrical
Generators—International Comparison 393.1 Median Interest Rates and Loan Duration by Firm Size 673.2 Credit Line/Loan Providers 683.3 Loan Characteristics 683.4 Reasons for Loan Rejections 693.5 Reasons for Not Applying for Loan or Line of Credit 704.1 Percent of Firms Reporting Skills Shortage as Major
or Severe Constraint 75
Contents ix

4.2 Do Reports of Skills Constraints Vary by Worker Education? 76
4.3 Share of Firms Reporting Skills as a Serious Constraint, by Training and Employment Growth 76
4.4 Percentage of Manufacturing Firms Saying That theAverage Worker in the Firm Has Completed Different Levels of Schooling 77
4.5 Firm-Based Training: Prevalence and Percentage of Workers Trained, Manufacturing Sector 79
4.6 Median Monthly Wages by Occupation 84A.1 Sample Distribution in Kenya, by Sector and Location 112
x Contents

xi
Abbreviations
AIDS acquired immune deficiency syndromeCOMESA Common Market for Eastern and Southern AfricaCOMTRADE Common Format for Transient Data ExchangeDFID UK Department for International DevelopmentEPZ export processing zoneFSD Financial Sector DeepeningFY fiscal yearGDP gross domestic productGoK government of KenyaHCDA Horticultural Corps Development AuthorityHIV human immunodeficiency virusICA Investment Climate AssessmentIFC International Finance CorporationISO International Organization for StandardizationIT information technologyKIPPRA Kenya Institute for Public Policy Research and AnalysisKPLC Kenya Power and Lighting Co. Ltd.K Sh Kenya shillingkWh kilowatt hourLCSPS Latin America and Caribbean Public Sector Group

LEGJR Legal and Judicial Reform Practice GroupMSME Micro, Small, and Medium Enterprise (program)NATTET National Association for Technology Transfer and
Entrepreneurial TrainingPSDS Private Sector Development StrategyRPED Regional Program for Economic DevelopmentSME small and medium enterpriseSMLE small, medium, and large enterpriseSSA Sub-Saharan AfricaTFP total factor productivityVAT value-added tax
xii Abbreviations

xiii
This booklet is a shorter version of the Kenya Investment ClimateAssessment (ICA) produced in June 2008 by the Finance and PrivateSector Development Group of the World Bank’s Africa Region and spon-sored by the UK Department for International Development (DFID)Country Office in Kenya. Those interested in more details should readthe full ICA report available at www.worldbank.org/afr/aftps.
This book was prepared by Giuseppe Iarossi, but the full ICA reportwas produced by a larger team that also included Leonardo Garrido,Ricardo Gonçalves, James Habyarimana, Manju Kedia Shah, Sofia Silva,and Måns Söderbom—each having responsibility for different chapters.Numerous other people participated in the completion of the report; theirnames are listed in the ICA acknowledgments section.
The analysis is based on a survey of 781 establishments. The design ofthe survey and the management of the data collection process were ledby Giuseppe Iarossi and Giovanni Tanzillo. The data collection fieldworkwas conducted by Etude Economique Conseil (EEC Canada) from May2007 through July 2007.
Particular acknowledgments are due to the DFID Country Office inNairobi for its sustained commitment to, and financial support of, thisinitiative. Without DFID this major survey work and report would nothave been possible.
Acknowledgments


The central objective of this Investment Climate Assessment (ICA) is toidentify the main impediments to productivity growth Kenyan firms face.This objective is achieved through the analysis of firm-level data directlycollected by the World Bank in 2007. This report complements the DoingBusiness indicators and provides a solid analytical foundation for privatesector development policy dialogue and design. The last Kenya ICA(2004) indeed served as one of the key analytical tools to inform the gov-ernment of Kenya (GoK) of its reform efforts during the past few years.It showed that the business environment in Kenya was characterized bypoor infrastructure, complex and bureaucratic administrative and regula-tory regimes, poor governance, poor service delivery, insecurity, andunsuitable financial instruments.
This ICA arrives at a critical juncture; the government has committedto improving the investment climate, even further convinced that growthcan be achieved only through a prosperous private sector. Based on theview that prosperity requires a thriving industrial sector, private sector-ledgrowth is central to the government’s Economic Recovery Strategy and itsrecent “Vision 2030.” In early 2007 GoK launched its first-ever PrivateSector Development Strategy. This strategy is based on five pillars: improv-ing Kenya’s business environment, accelerating institutional transforma-tion, facilitating growth through greater trade expansion, improving
Overview
1

productivity of enterprises, supporting entrepreneurship, and developingsmall and medium enterprises. All these pillars are linked to the ICA’s ana-lytical goal.
The ICA uses a robust and standardized methodology that has beenapplied to many countries worldwide. The ICA is based on a representa-tive sample of 657 formal firms and 124 informal establishments. Thesample was drawn in four locations—Nairobi, Mombasa, Nakuru, andKisumu—and covers manufacturing and services. Weights were used inthe analysis of the data to ensure full representativeness of the results.Although the sample is quite large, sample nonresponse could invalidatethe results of the analysis—especially for more sensitive questions on cor-ruption, taxes, or sales. To reduce such possibilities, strict quality controlprocedures were applied during the data collection process. These controlsled to an overall response rate above 90 percent. The analysis is based onperception questions and objective indicators. Perception questions areused as the starting point of the study, but because of their inherent limi-tations, throughout the report objective questions are used to confirm orreject what the perception questions appear to indicate. The use of objec-tive questions allows also for more meaningful cross-country comparisons.Consequently, international comparisons are made not only on the basis ofperception questions but, more important, on the basis of objective indi-cators, such as indirect costs and the prevalence of generator use, amongothers. The use of objective indicators is the preferred approach to iden-tify binding constraints. Finally, data from additional sources (DoingBusiness, Connecting People, Transparency International) are used to vali-date the conclusions drawn from the survey results.
Although Kenya has recorded some improvements in the past fouryears, including an increase in productivity, Kenyan firms still face anadverse business environment. In fact, the total losses incurred by busi-nesses because of power outages, theft and breakage during transport,payments of bribes, and protection payments are much higher than totallosses experienced by the middle-income countries in Africa and byChina and India.
The top constraints identified by the Kenyan managers were tax rates,access to finance, corruption, security, infrastructure services (electricityand transportation), and business licensing.
In Kenya, complaints about the tax rate top all other constraints; it hasbeen the most reported bottleneck since 2003. Kenya has reduced thecorporate tax rates in recent years. Nevertheless, objective indicators offiscal pressure suggest that the tax burden in Kenya remains higher than
2 An Assessment of the Investment Climate in Kenya

in most comparator countries. Kenyan firms are still required to pay halftheir corporate income in taxes, an overall amount that is lower than inChina and India, but much higher than in the African comparator coun-tries. The high tax burden faced by Kenyan firms is due mainly to theprofit tax rate (32.5 percent), which is the highest of all comparatorcountries, including China and India. Although a more detailed analysisof the tax burden in Kenya is recommended, one potential impact of ahigh tax regime is higher evasion, as well as the presence of a larger infor-mal sector. In fact, our analysis shows that one of the top three reasons forinformality is the negative perception associated with the tax burden.
Access to credit is significantly more difficult for microenterprises andsmall enterprises. Consistent with improvements in the banking sectorduring the past few years, the proportion of firms constrained by accessto finance in Kenya declined from 75 percent in 2003 to approximately36 percent in 2007. Notwithstanding a favorable lending regime with lowreal costs of debt and a high proportion of firms with good quality infor-mation, 90 percent of microenterprises and 60 percent of small firms inKenya declare they need loans, compared with 40 percent of medium andlarge firms. Microenterprises are priced out of the market also because ofcollateral requirements—43 percent of microfirms and 12 percent ofsmall firms, compared with only 7 percent of medium and large firms,report that collateral requirements discouraged loan applications. Thecomplexity of the application process is another impediment for micro-and small firms.
Although the ranking of corruption has improved during the pastfour years, it remains one of the top bottlenecks for firms in Kenya. Ingeneral, because of the various rules and regulations, 75 percent offirms in Kenya reported having to make informal payments to “getthings done.” Corruption costs Kenyan firms approximately 4 percentof annual sales, which is a considerable amount by international stan-dards. Furthermore, Kenyan firms are required to pay approximately12 percent of the value of a public contract in informal payments. Thatis again higher than all comparator countries. Bribes to tax inspectorsare also common in Kenya, as is the request for informal payments forlicensing and utility hookups. Finally, one particular aspect of corrup-tion that seems to be unique to Kenya is the common practice of policerequesting payments from trucks in transit.
Security remains a major constraint to firms in Kenya. In 2007 approx-imately one-third of Kenyan managers rated crime as a major constraint.Crime can add significantly to the cost of doing business in Kenya, both
Overview 3

directly through theft and indirectly through security measures used toprevent violence. Overall, these costs amount to approximately 9 percentof sales, which is considerably higher than in all other comparator coun-tries, including South Africa, in which these costs reach only 1.5 percent.These data are based on a survey conducted before the unrest followingthe 2007 elections. Consequently, these figures must be considered to beconservative because recent conversations with businesspeople in thecountry have highlighted the lack of security even more.
Electricity and transport are the main infrastructure bottlenecksaffecting Kenyan firms. Close to 80 percent of firms in Kenya experiencelosses because of power interruptions. That percentage is higher than thatof all the comparator countries. As a consequence, almost 70 percent offirms have generators, which are costly to obtain and to operate. Powerdisruption costs Kenyan firms approximately 7 percent of sales. In a cross-country comparison these losses are among the highest. Similarly, Kenyancompanies lose 2.6 percent of their sales because of spoilage and theftduring transportation. That percentage is higher than that of all compara-tor countries.
Although Kenya has recently reduced the number of tax payments, taxadministration remains a major burden for firms in Kenya. Approximatelyone-third of firms rate it as a major bottleneck. Approximately 75 percentof firms in Kenya report having been visited by tax officials in 2007. All ourcomparator countries but China experience a much lower number of visitsby tax administration officials. Moreover, the tax filing system in Kenya iscumbersome. Kenyan firms spend about 430 hours in preparing forms andfiling and paying taxes. Value-added tax (VAT) refunds, however, are rela-tively efficient in Kenya.
Notwithstanding recent reforms, business licensing remains an impor-tant constraint for Kenyan firms. Approximately 20 percent of managersinterviewed place licenses among the top three constraints, and morefirms complain about them than in all comparator countries. The Kenyangovernment has taken this problem seriously, and a number of reformshave been implemented whose effect will be felt in the next few years.Reforms notwithstanding, Kenya does not perform as well as comparatorcountries in areas such as new business starts, license renewal, and thecost of licenses. Hence the reform program must continue.
Although formalization would facilitate access to finance for informalfirms, the financial burden of registration and taxation and the minimumcapital requirements to register a business are the main reasons thatfirms do not choose formality.
4 An Assessment of the Investment Climate in Kenya

To address those constraints, the following recommendations aresuggested.
Taxes• Taking into account rebates and fiscal incentives, conduct an in-depth
study of the effective marginal rate of taxation to determine the extentof excessive taxation across different sectors.
Finance• Enhance credit information infrastructure.• Upgrade corporate registries, collateral registries, and public record
systems. • Computerize the property registration process, and simplify taxes and
fees. • Promote the application of innovative products and technology to
expand access to finance.• To promote improvement in small businesses’ access to the products
and services of commercial banks, facilitate the provision of capacitybuilding for small businesses to have a better understanding of therequirements of banks (how to approach banks for business loans andhow to use bank services), and prepare small businesses for a relation-ship with a commercial bank.
• Increase transparency in regard to interest rates and noninterestcharges and fees (such as negotiation, commitment, legal, evaluation,processing, and insurance) on checking and current accounts.
• Establish a clear timetable for the creation of a credit bureau.• Facilitate capacity building for banks to develop and market new
products.
Corruption• Conduct an in-depth study of corruption in the country.• Give prosecutorial power to the Anti Corruption Authority, and ensure
that the successful anticorruption cases are given better publicity.• For tax administration, continue reforms aimed at the following:
– Minimizing human contact between taxpayer and officials and mak-ing the process more transparent by relying heavily on informationtechnology to file tax returns
– Establishing independent internal and external audits– Introducing organizational changes of the Revenue Authority:
incentives for high performers, sanctions for corrupt behavior, careerdevelopment, and competitive salaries
Overview 5

• For public procurement, continue reforms aimed at the following:– Reviewing procurement rules with the goal of simplifying tender
documents, reducing minimum value of contract for single sources,and introducing anticorruption laws, performance standards, andsanctions
– Improving transparency in public-private interactions through e-procurement, publication of tender documents and tendersreceived, and public participation in negotiations
– Introducing a vetting system (conducted by an international firm,possibly with the involvement of civil society) to prequalify com-panies interested in bidding for government contracts, to addressconflict of interests and fraudulent companies
– Establishing an independent tender evaluation and the auditing andmonitoring of unit rates
– Supporting greater level of integrity and professionalism amongmultinationals and domestic companies through professionalassociations, codes of conduct, monitoring and benchmarking, andintegrity pacts
• In regard to the police, carry out the following:– Have observers join the trucks to monitor the request for bribes.
Use recording systems to monitor traveling time and illegalbehavior.
– Establish computerized checkpoints to make the process more trans-parent and quicker with less interaction between truck drivers andpolice officials. Educating truck drivers about the automated systemwill also reduce the harassment they face.
– Install electronic weighing stations. – Involve associations engaged in trucking operations in sensitizing
truck drivers to comply with the rules and regulations. – Establish an independent police complaints commission entrusted
with following up on the implementation of the reform program.– Reduce the discretionary power of the police.– Conduct effective educational campaigns of traffic rules to reduce
ability of police to extort bribes.• In regard to utilities, carry out the following:
– Complete the liberalization of fixed-line telephony.– Privatize some forms of service delivery (utility hookups).– Use citizen report cards to assess the performance and quality of
services and monitor progress. Publish progress reports periodicallybased on customer surveys and timely audits.
6 An Assessment of the Investment Climate in Kenya

Electricity• Increase public investment in energy generation, transmission, and
distribution to increase connectivity.• Encourage increased private financing and investment in the energy
sector—today the private sector accounts for 12 percent of the powersupply.
• Establish clear rules for private generators’ “open access” to the trans-mission network, the concept of which was established in the energypolicy.
• Ensure that electricity pricing maintains the financial viability ofpower companies, while protecting the most vulnerable consumers.
• Develop the legal framework for investments in energy.• Consider using the least-cost development plan to increase invest-
ments in energy.
TransportRoads• The Ministry of Finance should establish a system for ensuring proper
investment planning and management. That would, among otherthings, involve the following:– Issuing guidelines for a minimum level of preparation of projects
before they are submitted for budget requests– Strengthening institutional structure for implementing the guidelines
• Ongoing reforms in the roads sector should be expedited. That wouldinvolve the following:– Expediting the operationalization of the Kenya National Highways
Authority, the Rural Roads Authority, and the Urban Roads Authority– Strengthening the residual Ministry of Roads to perform its overall
policy, planning, and coordination role– Promoting the use of long-term output and performance-based con-
tracting and concessioning for maintenance and management of themajor road network by the private sector, starting with the NorthernCorridor
• The government should improve governance in the road sector by car-rying out the following:– Strengthening the Engineers’ Registration Board – Assisting the construction industry in establishing a professional body – Developing a comprehensive construction industry development
policy and establishing a dedicated construction industry develop-ment board
Overview 7

– Ensuring regular updating of contractors’ qualifications and capacity– Approving policy on private sector participation in the management
of weigh stations and control of axle load regulations• Improvements should be made to the public transportation system.• More private involvement in transport should be facilitated.
Ports and Maritime• Expedite conversion of Kenya Ports Authority to a landlord authority.• Concession the Mombasa container terminal(s), dockyard and marine
services, and bulk oil terminals.• Streamline cargo clearance procedures, and remove the police escort
system for transit cargo by road (except for hazardous and militarysupplies).
• Introduce risk-based targeting for cargo inspection and verification.• Implement a harmonized customs clearance system and one-stop bor-
der posts. • Review and ensure compatibility of local maritime regulations with
the International Maritime Organization treaties.
Aviation• Expedite safety and security enhancement at Jomo Kenyatta Interna-
tional Airport, and strengthen the Kenya Civil Aviation Authority.
Railways• Expedite putting in place the independent, multisector regulatory
body, in particular for the railway sector. • Convert the residual Kenya Railways Corporation into an asset hold-
ing company that would also monitor and evaluate the performanceof the concession.
Licensing and Regulatory Governance• Follow up with the implementation of the licensing reforms.• Reduce the overall burden of licenses imposed on businesses, includ-
ing a reduction in time and costs of obtaining a license to undertakebusiness operations.
• Continue establishment of an electronic register of licenses.• Adopt a regulatory reform strategy to serve as a framework for licens-
ing and other regulatory reforms and to ensure their sustainability. • Reduce the burden imposed on businesses by on-site inspections.• Tackle licensing and regulatory reforms at the local government level.• Introduce a system for vetting proposed regulations to ensure that
they do not place an undue burden on businesses.
8 An Assessment of the Investment Climate in Kenya
• Reduce the cost of trade documents.• Reduce the minimum capital requirement to register a company.• Reduce the costs to start a business.• Reduce the time taken to start a business.• Reduce the number of payments for social security contribution and
for VAT, and establish online filing as already done in South Africa andMauritius.
• Harmonize the various tax identification numbers (PIN, VAT, etc.)into one universal number.
• Identify clear responsibilities to continue licensing reforms.• Improve information and transparency on regulatory reforms and
outcomes.• Reduce time for VAT refund by allowing firms to use it as credit
toward next payment.• Reduce number of licenses by local authority, and clarify the legal
status of the “circular.”
Overview 9


Overview
After more than a decade of stagnation, Kenya’s economy shows signs ofstrengthening, with continued growth in per capita gross domestic prod-uct (GDP) at rates of 1.6 percent in 2004, 2.6 percent in 2005, an esti-mated 2.9 percent in 2006, and an estimated 4 percent in 2007,1 all in anenvironment of perceived moderately enhanced macrostability.
From the institutional standpoint, recent growth acceleration in Kenyahas been driven largely by the private sector—from the demand side, byprivate consumption and exports, and from the supply side, by a broadarray of activities producing tradable and nontradable goods and services,including horticulture, telecommunication, wholesale and retail trade,manufacturing, and transportation.
All private main economic activities exhibited positive growth dur-ing the 2001–05 period, led in overall contribution by agriculture, trans-port and communication, manufacturing, and wholesale and retailtrade, which together explained more than three-quarters (3.1 percentagepoints) of the private growth during the period (3.9 percent). The privatesector generated almost 86 percent of the value added between 2001 and2005, more than 1 percentage point above its average during the 1990s(figure 1.1).
C H A P T E R 1
Competitiveness of Kenyan Firms
11

12 An Assessment of the Investment Climate in Kenya
Nevertheless a growth diagnostics approach shows that the investmentrate is low in Kenya for two broad reasons: First, returns on investmentare low and risks to appropriation of returns are high; second, access tofinance is limited and costs are high for certain categories of borrowers,such as rural and small entrepreneurs. Further, returns on investment arelow mainly because business costs—other than the cost of labor andcapital—are high. These nonfactor costs take various forms, includinghigh transportation costs and high energy costs. They also include opportu-nity costs resulting from delays of shipments, as well as direct payments inthe form of bribes. The net impact of these nonfactor costs on a business iseither reduced sales revenue—and hence reduced profitability and produc-tivity (as measured)—or high total production costs. Macroeconomic andpolitical risks have receded considerably since the 2002 elections, but theyremain important. In addition, crime and the security situation remaindeterrents to investment.
Having a clearer understanding of the impediments to investment,productivity, and growth at the firm level is essential to pinpoint areas ofreform. This report intends to achieve that goal and to provide a solidanalytical foundation for private sector development policy dialogue anddesign. Based on firm-level data on approximately 650 establishments,the Kenya Investment Climate Assessment (ICA) is able to identify key
0
1
2
3
4
5
6
7
19781980
19821984
19861988
19901992
19941996
19982000
20022004
% a
nn
ual
gro
wth
GD
P
82
83
83
84
84
85
85
86
86
87
87
% o
f rea
l GD
P
share in private GDP/total GDP
private GDP growth rate trend
public GDP growth rate trend
Figure 1.1 Trends in Public and Private GDP Growth/Private Share in Total GDP,1978–2005
Source: Economic Survey, Kenya Central Bureau of Statistics.

Competitiveness of Kenyan Firms 13
bottlenecks to enhance the competitiveness of the private sector and toestablish links between business environment constraints and firm-levelcosts and productivity measures.
The previous ICA—based on 2003 data—reported that Kenyan firmshad only a weak competitive advantage compared with strategic competi-tors such as Tanzania and Uganda and were at a severe disadvantage com-pared with firms in China and India. Kenyan plants and equipment wereoutdated, overvalued, and inefficiently used; investment levels were lowand declining. Productivity growth had been zero or negative since the1990s. Enterprises were adversely affected by the negative business envi-ronment, especially the burden of bribes, the costly infrastructure, and adifficult regulatory environment.
How has Kenyan manufacturing changed during the past four years?How does Kenya now compare regionally and internationally? This chap-ter addresses those issues by examining data from 396 formal manufac-turing enterprises surveyed in mid-2007. This chapter comparesperformance reported by firms from this survey with establishmentsinterviewed in the previous ICA and benchmarks Kenyan firms to thosein other countries.
Labor Productivity
Labor productivity is measured by manufacturing value added per worker.Earlier studies of Kenyan manufacturing found that labor productivity inKenya was comparable with that of China and India and was much higherthan that of Tanzania and Uganda. High labor productivity in Kenya, how-ever, was associated with much higher capital intensity compared withfirms in China and India. Once we controlled for capital, total factor pro-ductivity was lower in Kenya than in East Asia.
The Kenya Institute of Manufacturers conducted its own EconomicSurvey in 2006. It found that labor productivity, measured as value addedper worker in manufacturing, had increased from K Sh 456,000 in 2001to K Sh 612,347 in 2005––an increase of 34 percent at current prices.
The present survey looks at new data from all four comparators versusKenya (figure 1.2). Patterns of labor productivity (measured in constant2005 US$) remain the same across comparators. Kenyan workers are stillfar more productive than workers in Tanzanian and Ugandan firms(except for large Tanzanian firms, whose productivity is far higher thanothers). Kenyan firms have productivity only marginally lower than thatof firms in China and much higher than that of firms in India.

14 An Assessment of the Investment Climate in Kenya
Examining across firm size, we see that for most countries laborproductivity increases with firm size, except in Kenya, in which laborproductivity is relatively flat across different size classes. Large firms inKenya are significantly less productive than firms in Tanzania and onlyslightly more productive than firms in Uganda.
Differences in labor productivity across sectors are driven primarily bydifferences in capital intensity. Labor productivity and capital intensityare higher for exporters compared with domestic firms and for foreignenterprises compared with local enterprises. These patterns are similar tothose found in other countries; however, unlike in most other countriesin sub-Saharan Africa, in Kenya, capital intensity and labor productivitydo not change significantly across size classes.
Unit Labor Costs
Labor productivity per se cannot be used to benchmark competitiveness.Even though labor has low productivity, as long as workers are paid lowwages they remain competitive. We examine this issue by looking at unitlabor costs, which measure the ratio of labor costs per worker to valueadded per worker. Figure 1.3 presents the differences in unit labor costsacross the three African countries, China, and India.
Kenya0
2,000
4,000
6,000
8,000
lab
or p
rod
uct
ivit
y (2
005
US$
)
10,000
12,000
14,000
Tanzania Uganda China India
overall small medium large
Figure 1.2 Cross-Country Comparison of Labor Productivity
Source: ICA Survey.

Competitiveness of Kenyan Firms 15
We see that unit labor costs in Kenya are lower than in Tanzania andmuch lower than in Uganda. There is no significant difference acrosssize classes; however, labor cost in Kenya is 25 percent of value added,compared with only 15 percent of value added in China. Higher pro-ductivity in China is not offset by higher wages, rendering China verycompetitive internationally. In India, although labor productivity is low,it is offset by much lower labor costs, making firms in India, particularlythe larger ones, more competitive than those in Kenya (figure 1.3).
Labor productivity and unit labor costs, however, are only partial meas-ures of manufacturing competitiveness; they ignore the contribution ofcapital to the production process. Differences in labor productivity couldbe driven entirely by differences in the machinery and equipment use perworker. We examine that next by looking at total factor productivity.
Total Factor Productivity
Although measures of firm productivity such as labor productivity pro-vide useful information on firm performance, they can be misleadingwhen considered in isolation. To obtain an overall assessment of produc-tivity, it is necessary to take both capital and labor use into account. Thatcan be done by calculating total factor productivity (TFP). Differences inTFP are differences in output that cannot be explained by differences in
Kenya0
0.1
0.2
0.3
0.4
rati
o o
f lab
or c
ost
per
wo
rker
tova
lue
add
ed p
er w
ork
er 0.5
0.6
0.7
Tanzania Uganda China India
overall small medium large
Figure 1.3 Unit Labor Costs
Source: ICA Survey.

16 An Assessment of the Investment Climate in Kenya
the use of labor, capital, and other intermediate inputs. Differences in TFPcan be due to the quality of workers, quality of management, technologyused (so long as it is not embodied in capital), or firm organization. Firmsfor which TFP is higher are more efficient.
TFP is calculated by estimating a particular econometric model calledthe Cobb-Douglas production function using data for enterprises from allmanufacturing subsectors. To compare TFP between Kenya and compara-tor countries, we pool the observations for all comparator countries intoa single regression.
The 2003 ICA for Kenya reported that there had been no visible pro-ductivity improvement for the average firm between 1999 and 2000 and2002 and 2003. Regression analysis showed no significant change in TFPbetween the two periods.
Has this pattern been reversed? Are Kenyan firms more productivetoday than four years ago? Using the identical methodology to allow com-parison with the earlier results, we estimate productivity changes overtime by including a time trend dummy with the unbalanced and balancedpanel of firms from the 2003 and 2007 surveys. All values have been con-verted to constant 2005 dollars using the GDP deflator and the averageannual exchange rates reported by the International Monetary Fund. Ourresults show that TFP, measured in value added terms, has increased by26 percent during the four-year period, indicating an average annualincrease of 7 percent.
Results of TFP growth, however, given only one time series compo-nent, are sensitive to model specification. Results for a matched panel offirms between 2003 and 2007 show a 23 percent increase in productiv-ity in Kenya during the four-year period. Nevertheless, by simply addingcapacity utilization as an additional explanatory variable, the growth ratedeclines from a 7 percent annual rate to a 4 percent annual rate, and this isno longer significant. These results show that the use of existing capacity(rather than new investments) accounts for the increase in productivityover time.
Further to our analysis, we examine differences jointly in TFP overtime and in a broader regional context by pooling data from investmentclimate surveys over time in Kenya, Tanzania, and Uganda and by addingcountries with higher incomes such as Botswana, Namibia, Senegal, andSouth Africa. Again we see that Kenyan firms have become 15 percentmore efficient during this four-year period––an increase of approximately4 percent annually. We also included middle-income comparators suchas Namibia and Botswana and controlled for capital and labor inputs,

sectoral differences, and differences resulting from capital use, measuredby capacity utilization. Results showed that enterprises in Kenya are farless productive than firms in Namibia, in which productivity is almostdouble that of Kenya, and than firms in Botswana, in which firms are22 percent more efficient than Kenyan firms (figure 1.4).
What explains the lower productivity of Kenyan firms compared withmiddle-income countries in sub-Saharan Africa? Several factors coulddrive productivity differentials. The role of an adverse business environ-ment is particularly important in that regard. As shown in the next chap-ter, our data indicate that enterprises in Kenya continue to face an adversebusiness climate: Total losses incurred by businesses because of poweroutages, transport losses resulting from theft and breakage, corruption,and protection payments are much higher compared with middle-incomecountries in Africa and with China. In Kenya, a substantial part of sales islost because of these indirect costs, compared with a much smaller per-centage in China and India.
Note
1. IMF 2007.
Competitiveness of Kenyan Firms 17
Kenya 2003
Tanza
nia 2002
Uganda 2002
Uganda 2006
Tanza
nia 2006
Kenya 2007
Senegal
Botswana
Namib
ia0
TFP
com
par
ed w
ith
TFP
of
Sou
th A
fric
a (%
)
10
20
30
40
50
60
70
Figure 1.4 Total Factor Productivity Relative to South Africa
Source: ICA Survey.


19
Introduction
In 2007 a firm-level survey of approximately 650 formal establishmentswas conducted in Kenya. During the interview, two types of questionswere used to ask firms to identify the major constraints to their businessactivity. One question asked them to rate a set of approximately 20potential bottlenecks. Table 2.1 shows the percentage of firms perceivingeach constraint as major or very severe.1 The second question asked themanagers to rank the top three bottlenecks to their business among thesame list of constraints (table 2.2). The questions show a consistent pic-ture. The top three constraints identified by the Kenyan managers weretax rates, access to finance, and corruption. More than one-third ofrespondents identified these three as major bottlenecks. They were fol-lowed by complaints about infrastructure services (electricity and trans-portation), crime, and practices of competitors in the informal sector.
Such negative perceptions vary across sector of activity as well as firmcharacteristics. Both manufacturing and retail complain about tax rates;themanufacturing sector also complains about transportation and electricity,and the retail sector complains about access to finance. A larger share ofsmall firms (compared with medium and large firms) perceived tax rate,access to finance, and practices of competitors in the informal sector to be
C H A P T E R 2
Business Climate

Table 2.1 Firms Reporting Major or Very Severe Business Constraints: All Formal Firms, Kenya, 2007 (%)
Obstacle Total Small Medium Large Dom Foreign Out.
Nairobi Nairobi Manuf Retail Other Nonexp Exp
Tax rates 58 62 51 52 60 31 65 54 57 63 54 58 57 Access to finance (avail. and cost) 42 53 25 13 44 19 50 36 36 52 35 43 20 Competitors in the inform. sect. 41 45 37 28 42 23 56 31 49 41 39 41 41 Corruption 38 37 37 52 38 48 29 45 51 27 43 38 47 Crime, theft, and disorder 33 25 48 51 32 47 41 28 47 28 33 32 46 Tax administration 32 34 28 29 33 25 39 27 43 32 29 32 32 Transportation 31 27 31 52 30 40 45 21 53 32 23 29 53 Business licensing and permits 28 30 25 26 27 39 28 28 28 27 29 29 20 Electricity 28 26 25 43 28 26 30 26 53 16 29 26 44 Customs and trade regulations 24 26 13 31 23 31 24 23 34 22 22 23 35 Macroeconomic instability 19 19 19 12 18 29 23 16 26 21 15 18 28 Telecommunications 16 15 13 31 15 25 17 15 24 10 18 16 19 Regulation on pricing and markups 15 19 4 0 17 0 27 6 0 17 10 15 20 Functioning of the courts 13 10 15 25 13 14 12 13 37 8 10 11 35 Political instability 10 7 13 18 9 17 13 8 16 3 13 10 11 Access to land 7 7 6 15 8 3 8 7 17 3 8 7 12 Labor regulations 4 2 7 10 4 8 4 5 16 3 2 3 24 Regulation on hours of operation 3 4 2 0 3 5 7 1 0 4 0 3 12 Zoning restrictions 3 4 0 0 4 0 7 0 0 4 0 3 0 Inadequately educated workforce 3 3 3 6 3 8 2 4 9 3 1 3 6
Source: ICA Survey.
20
LocationIndustry ExportAll firms Size Ownership

severe constraints. Similarly, more firms outside Nairobi indicated thesethree constraints as binding compared with those in Nairobi. Finally, theshare of nonexporters complaining about tax rate and access to finance ishigher than that of exporters.
Another way to look at these constraints is to identify which con-straints are more problemaitic for high-performing firms. To examine thisissue, we divided firms into two groups: firms above the 75th percentileof labor productivity and of employment growth. Figure 2.1 shows that,for both categories of firms, infrastructure (electricity and transport), taxrates, and competition from informal firms remain the biggest problems,confirming what previous tables indicated.
Business Climate 21
Table 2.2 Ranking and Rating of Business Constraints in Kenya (% of firms)
Indicator Ranking Indicator Rating
Tax rates 54 Tax rates 58 Access to finance (availability
and cost) 33 Access to finance (availability
and cost) 42
Corruption 31 Practices of competitors in informal sector
41
Practices of competitors in informal sector
26 Corruption 38
Crime, theft, and disorder 25 Crime, theft, and disorder 33 Transportation 24 Tax administration 32 Electricity 23 Transportation 31 Business licensing and permits 20 Business licensing and permits 28 Tax administration 15 Electricity 28 Macroeconomic instability 11 Customs and trade regulations 24 Telecommunications 10 Macroeconomic instability 19 Customs and trade regulations 7 Telecommunications 16 Access to land 4 Regulations on pricing and
markups 15
Regulations on pricing andmarkups
4 Functioning of the courts 13
Political instability 3 Political instability 10 Inadequately educated work-
force 2 Access to land 7
Functioning of the courts 2 Labor regulations 4 Labor regulations 2 Hours of operation 3
Zoning 3 Inadequately educated
workforce 3
Source: ICA Survey.

22 An Assessment of the Investment Climate in Kenya
A similar survey conducted in 2003 enables us to analyze the evolu-tion of these perceptions during the past four years. Table 2.3 showsthat in the manufacturing sector,2 tax rates have been among the topfive constraints since 2003; however, today they appear to have becomethe top constraint. Infrastructure services (electricity and transport)have become more binding constraints in recent years. They movedfrom the mid-lower part of the rating in 2003 to become the secondand third constraints in 2007. In contrast, telecommunications has easedas a constraint and today is among the least problematic. Crime and cor-ruption have improved their ratings, although still remaining among themost pressing problems. Finance was the most important problem formanufacturing firms in 2003 but since then has improved, at least forthe manufacturing sector (table 2.3).
During the past four years, the perceived constraints identified byKenyan firms have changed somewhat. In 2003, manufacturing firmswere concerned primarily about finance (mainly cost), corruption, crime,and taxes. In 2007 we recorded an improvement in corruption, whereastax rates reached the top position of perceived constraints. Similarly, in
Figure 2.1 Top-Ranked Constraints by Labor Growth and Labor Productivity
transport
transport
informalcompetition
crime
crime
electricity
electricity
tax rates
0 5 10 15 20 25
hig
h g
row
th(>
75th
pct
ile)
hig
h p
rod
uct
ivit
y(>
75th
pct
ile)
Source: ICA Survey.

Business Climate 23
2007 we recorded major improvement in macroinstability and telecom,once among the major constraints to Kenyan firms but today no longer anissue (table 2.3).
In a comparison across countries (table 2.4), for all major constraintsidentified earlier, Kenya performs worse than the best-performingcomparator countries (South Africa, China, and India). The only excep-tion is electricity, in which Kenya performs better than China andIndia.3 The comparison with the other comparator countries––Senegal,Tanzania, and Uganda––is more mixed, with some bottlenecks per-ceived to be more of a problem in Kenya and others more problematicin the other countries.
These perceived constraints have a significant impact on indirect costs.Table 2.5 reports the estimated impact of some of these constraints on theindirect costs of firms in Kenya. The survey data show that firms in Kenyahave to bear indirect costs that amount to approximately 20 percent oftheir total sales. Of these, electricity (production lost because of power
Table 2.3 Kenyan Firms in Manufacturing Sector Reporting Major or Very Severe Constraints, 2007 and 2003 (%)
Indicator Rating 2007 Dynamics Rating 2003
Tax rates 1 57 · 4 68Transportation 2 53 · 12 37Electricity 3 53 · 9 48Corruption 4 51 ‚ 2 74Practices of competitors
in informal sector 5 49 – 5 65Crime, theft, and disorder 6 47 ‚ 3 70Tax administration 7 43 – 7 51Access to finance
(availability and cost) 8 36 ‚ 1 75Customs and trade
regulations 9 34 · 11 40Business licensing and
permits 10 28 · 16 15Macroeconomic instability 11 26 ‚ 8 51Telecommunications 12 24 ‚ 10 44Access to land 13 17 · 14 25Labor regulations 14 16 · 15 23Political instability 15 16 ‚ 6 52Inadequately educated
workforce 16 9 ‚ 13 28Source: ICA Survey.
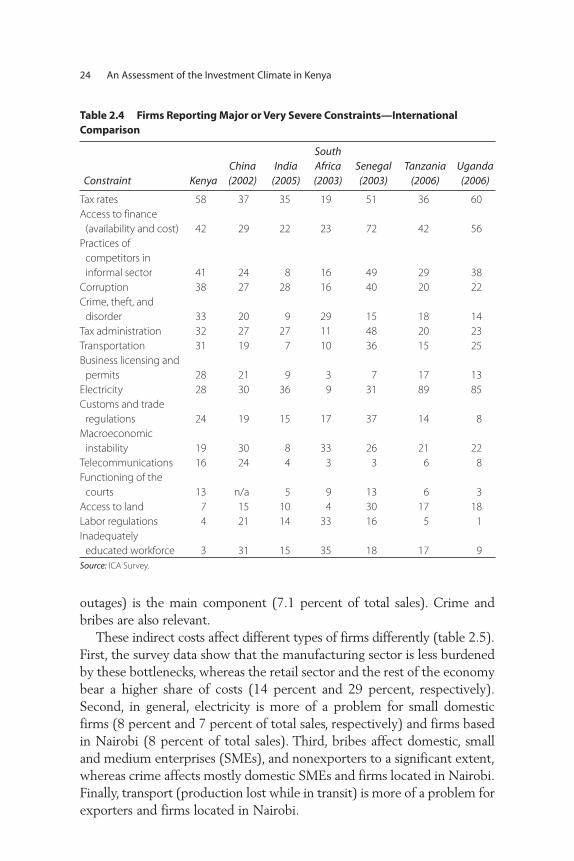
outages) is the main component (7.1 percent of total sales). Crime andbribes are also relevant.
These indirect costs affect different types of firms differently (table 2.5).First, the survey data show that the manufacturing sector is less burdenedby these bottlenecks, whereas the retail sector and the rest of the economybear a higher share of costs (14 percent and 29 percent, respectively).Second, in general, electricity is more of a problem for small domesticfirms (8 percent and 7 percent of total sales, respectively) and firms basedin Nairobi (8 percent of total sales). Third, bribes affect domestic, smalland medium enterprises (SMEs), and nonexporters to a significant extent,whereas crime affects mostly domestic SMEs and firms located in Nairobi.Finally, transport (production lost while in transit) is more of a problem forexporters and firms located in Nairobi.
24 An Assessment of the Investment Climate in Kenya
Table 2.4 Firms Reporting Major or Very Severe Constraints—International Comparison
Constraint KenyaChina(2002)
India(2005)
SouthAfrica (2003)
Senegal (2003)
Tanzania (2006)
Uganda(2006)
Tax rates 58 37 35 19 51 36 60Access to finance
(availability and cost) 42 29 22 23 72 42 56Practices of
competitors in informal sector 41 24 8 16 49 29 38
Corruption 38 27 28 16 40 20 22Crime, theft, and
disorder 33 20 9 29 15 18 14Tax administration 32 27 27 11 48 20 23Transportation 31 19 7 10 36 15 25Business licensing and
permits 28 21 9 3 7 17 13Electricity 28 30 36 9 31 89 85Customs and trade
regulations 24 19 15 17 37 14 8Macroeconomic
instability 19 30 8 33 26 21 22Telecommunications 16 24 4 3 3 6 8Functioning of the
courts 13 n/a 5 9 13 6 3Access to land 7 15 10 4 30 17 18Labor regulations 4 21 14 33 16 5 1Inadequately
educated workforce 3 31 15 35 18 17 9Source: ICA Survey.

Table 2.5 Indirect Costs—All Formal Sectors, Kenya, 2007 (%)
Total Location
Indirect costs as% of sales
All formalfirms Small Medium Large Domestic Foreign Nonexporter Exporter
OutsideNairobi Nairobi Manufacturing Retail Others
Electricity 7.1 8.1 5.1 5.1 7.3 4.5 7.1 6.9 5.5 8.0 5.9 5.5 8.6Bribes 3.6 3.9 3.2 2.0 3.7 2.4 3.7 1.8 2.6 4.2 2.4 3.1 4.3Production lost
while in transit 2.6 2.0 2.2 3.2 2.9 1.6 0.3 3.1 1.1 3.2 2.0 1.6 7.5Theft, robbery, or
arson 3.9 3.9 4.6 2.4 4.0 2.2 3.9 3.6 2.7 4.8 2.2 3.1 5.4Security 2.9 2.9 3.2 2.7 2.9 3.0 3.0 2.0 2.3 3.3 1.7 2.6 3.6Total 20.1 20.8 18.4 15.4 20.8 13.7 18.0 17.5 14.1 23.6 14.2 15.9 29.5
Source: ICA Survey.
25
Firm size Ownership Export Industry

During the past four years, even these indirect costs have improved. Inthe manufacturing sector they have decreased from almost 18 percent in2003 to 14 percent in 2007; however, not all aspects of indirect costs haveimproved. Although the costs of crime and security have improved,electricity and corruption costs have remained the same and transportationhas increased slightly from 1.4 percent to 2 percent (figure 2.2).
From an international point of view, figure 2.3 shows that the level ofindirect costs for Kenyan firms is higher than that of all comparatorcountries. Tanzanian firms bear almost the same level of indirect costs,whereas firms in India, China, and South Africa bear indirect costs thatrange from slightly more than half to less than one-quarter of those ofKenyan firms. These results appear to confirm the perception that elec-tricity, transport, and crime are significant problems for Kenyan firms.
Tax Rates
Businesses worldwide tend to complain about tax levels. Nevertheless, inKenya, complaints about tax rates top all other constraints. This percep-tion has improved during the past four years, falling from 68 percent ofKenyan firms perceiving it as a major problem in 2003. Nevertheless,Kenya and Uganda are the two countries in the group of comparatorswith the highest share of firms complaining about tax rates. Kenya’s
26 An Assessment of the Investment Climate in Kenya
Figure 2.2 Indirect Costs in 2003 and 2007—Kenya Manufacturing Sector
18
16
14
12
10
8
6
4
2
0
% o
f sal
es
electricity bribes transit crime security total ind.costs
2003 2007
Source: ICA Survey.

Business Climate 27
average is also higher than the average of low-income countries and sub-Saharan African countries (figure 2.4).
In 2007 almost 60 percent of Kenyan managers cited the financial bur-den of taxation as the most serious obstacle to their operations andgrowth. This perception is more pronounced among small and large firms,domestically owned firms, or those located outside Nairobi. Statistically,there is no significant difference in this perception between exporting andnonexporting firms.4
Kenya has reduced corporate tax rates in recent years5 by making themmore comparable with those of its neighbors in East Africa. Nevertheless, asnoted in the World Bank’s Doing Business 2008, objective indicators of fis-cal pressure suggest that the tax burden in Kenya is higher than that in mostcomparator countries. In fact, Kenyan firms are required to pay half (50.9percent) their corporate income in taxes. This amount is lower than China’sand India’s but much higher than amounts in the other African comparatorcountries. For instance, South African and Ugandan firms face a tax burdenof just 37.1 percent and 32.3 percent, respectively (figure 2.5).
Figure 2.3 Indirect Costs, All Formal Firms—International Comparison
0
4
8
12
per
cen
t
16
20
24
Kenya
China 2002
India 2005
South A
frica
Senegal
Tanzania
Uganda
electricity
bribes
production lost while in transit
theft, robbery or arson
security
Source: ICA Survey.

28 An Assessment of the Investment Climate in Kenya
0
10
20
30
40
50
60
70
80
China
GhanaIn
dia
Kenya
Senegal
South A
frica
Tanza
nia
Uganda
Figure 2.5 Total Amount of Taxes as Percentage of Profit—International Comparison
Source: Doing Business 2007.
0
10
20
30
40
50
60
70
KenyaChin
aIn
dia
South A
frica
Senegal
Tanza
nia
Uganda
low in
com
e
Sub-Sahara
Africa
countries
% o
f fir
ms
Source: ICA Survey.
Figure 2.4 Firms Reporting Tax Rate as Major or Very Severe Problem

Business Climate 29
More specifically, the high tax burden faced by Kenyan firms is duemainly to the profit tax rate (32.5 percent), which is the highest rate of allcomparator countries, including China and India. The profit tax in Chinaand India is less than 20 percent and in South Africa it is less than 25 per-cent. Kenya has profit tax rates greater than 7 percentage points than inthe major comparator countries. However, labor taxes and contributions inKenya are lower than in most comparator countries (figure 2.6).
One potential impact of a high tax regime is the presence of a largerinformal sector. As shown in chapter 5, one main reason for informality isthe negative perception associated with the tax burden. According to the2006 Kenya economic survey, the informal sector constitutes 72 percentof the working population. The sector has grown by 37.2 percent duringthe past four years to 6.5 million workers.6
Corruption
Although the ranking of corruption has improved during the past fouryears, Kenyan firms still place it among the most important constraints totheir businesses. Almost one-third of firms ranked corruption among thetop three constraints; 38 percent rated it as a major or severe problem.Nearly 70 percent of firms that reported corruption as a binding con-straint ranked it as a top constraint.
0
10
20
30
40
50
per
cen
t
60
70
China
GhanaIn
dia
Kenya
Senegal
South A
frica
Tanza
nia
Uganda
profit tax (%) labor tax and contributions (%)
Source: Doing Business 2007.
Figure 2.6 Breakdown of Taxes—International Comparison

30 An Assessment of the Investment Climate in Kenya
There appears to be no significant difference in this perception amongfirms with respect to their size, export orientation, ownership, and legalstatus; however, complaints about corruption are more pronouncedamong firms that are located in Nairobi.
From an international point of view, Kenya and Senegal are the twocountries in which the perception of corruption is the highest, withalmost 40 percent of firms complaining about this problem. Countriessuch as South Africa, China, and India appear to enjoy a much lower levelof corruption, with 16 percent, 27 percent, and 28 percent of firms,respectively, complaining about it (figure 2.7).
Results of the present survey are confirmed by other data sources. Boththe Transparency International corruption perception index and theWorld Bank governance indicators show an improvement in Kenya’s ratingduring the past few years (figure 2.8). Nevertheless, Kenya’s corruptionrating remains the worst among all comparator countries (figure 2.9). In2007 Kenya’s rank in the corruption perception index was 150th of 180countries surveyed.
Corruption takes many different forms, from making payments forutility hookups to informal payments in public procurement. In general,three-fourths of Kenyan firms reported having to make informalpayments to “get things done” with rules and regulations. This costs
0
5
10
15
20
25
30
35
40
% o
f fir
ms
45
Kenya
China
India
South A
frica
Senegal
Tanza
nia
Uganda
Source: ICA Survey.
Figure 2.7 Firms Perceiving Corruption as a Severe or Major Constraint—International Comparison

Business Climate 31
Kenyan firms approximately 4 percent of annual sales. By internationalstandards, this is a considerable amount. Firms in comparator countriesface a lower level of informal payments, with firms in China, India, andSouth Africa paying less than half that amount.
The survey data allow us to identify the many aspects of a businessthat create opportunity for illegal payments. Firms were asked how much
Figure 2.8 Kenya—Evolution of Transparency International Corruption Rating
Figure 2.9 Transparency International Corruption Rating—International Comparison, 2007
1.75
1.80
1.85
1.90
1.95
2.00
2.05
2.10
2.15
2.20
2.25
2003 2004 2005 2006 2007
Source: Transparency International.
0
1
2
3
4
5
6
Kenya
Ghana
Uganda
South A
frica
China
India
Senegal
Tanza
nia
Source: Transparency International.
Note: The transparency rating ranges from 10 (highly clean) to 0 (highly corrupt).

32 An Assessment of the Investment Climate in Kenya
they were supposed to pay as informal payments in public procurement.The answers provided by Kenyan managers show a staggering differencebetween Kenya and the other comparator countries. Kenyan firms arerequired to pay approximately 12 percent of the value of a public con-tract as informal payments. That is higher than in all comparator coun-tries (figure 2.10).
Bribes to tax inspectors are also common in Kenya. Corruption in therevenue authority is common knowledge in Kenya. The commissioner gen-eral said that in 2008 tax revenues will increase in part as a result of hiscrackdown on “leakages.”7 According to the survey data one-third ofsampled firms reported having tax inspectors request informal payments.That figure is high by international standards. With the exception of India,Kenya fares worse than all other comparator countries (figure 2.11).
The frequency of inspections seems to be correlated with briberequests from tax inspectors. The more often firms are visited, the morelikely they are to be asked for informal payments. Similarly, firms thatadmit paying the tax inspectors also declare approximately 3 percent to8 percent fewer sales for tax purposes.
Licensing represents yet another opportunity for informal paymentrequests. Kenyan firms are required not only to obtain licenses when theystart operation, but also to renew them yearly. Virtually all firms in Kenyaare required to renew licenses and permits periodically; however, although
0
2
4
6
8
10
per
cen
t o
f co
ntr
act
valu
e
12
14
China
India
Kenya
Senegal
South A
frica
Tanza
nia
Uganda
Source: ICA Survey.
Figure 2.10 Bribes in Public Procurement

Business Climate 33
2003
2007
60
% o
f fir
ms
50
40
30
20
10
0
Kenya
Kenya
China
India
Senegal
South A
frica
Tanza
nia
Uganda
Source: ICA Survey.
Figure 2.11 Bribe Requests from Tax Inspectors—Cross-Country Comparison
about one-third need to renew licenses with the central government,almost all firms in Kenya need to periodically renew licenses with the localgovernment (figure 2.12). When dealing with licenses, Kenyan firms areasked for informal payments approximately one-quarter of the time.
0
10
20
30
40
50
60
70
80
90
100
local government central government
one license two licenses three licenses
Source: ICA Survey.
Figure 2.12 Percentage of Firms Requesting Licenses from Local and Central Government

Informal payments might also occur when utility hookups arerequested. In fact, one-quarter of Kenyan firms requesting utility hookupsdeclared they have been asked for informal payments. Overall, such pay-ments appear to be more frequent with construction permits and waterhookups and least common with electricity connections and importlicenses (figure 2.13).
One particular aspect of corruption that appears to be unique toKenya is the common practice of police requesting payments fromtrucks in transit. The survey questionnaire asked managers to indicate towhat extent this practice was common. Although not widespread, thisphenomenon is significant, with 21 percent of firms reporting having tomake such payments. The average amount paid is approximately 2.5percent of sales and is borne more by the service sector than by the man-ufacturing industry.
Finally, another often forgotten aspect of corruption relates to thefunctioning of the courts. If we look at general perceptions, it appears thatonly 13 percent of firms consider the functioning of the court a problem.Hence, it might appear to be an issue that does not need to be addressed;however, if we estimate the perception among firms that had a disputeover payment and used the courts to solve it, the share of managers con-cerned about the functioning of the courts rises to 33 percent, on a parwith crime and tax administration. Furthermore, discontent about thefunctioning of the courts is quite widespread. Although most firms admit
34 An Assessment of the Investment Climate in Kenya
0
5
10
15
20
per
cen
t 25
30
35
40
constr
uctio
n perm
it
operatin
g license
import
license
single b
usiness
perm
it
expatriate
work
perm
it
electric
al connect
ion
water c
onnectio
n
telephone co
nnectio
n
Source: ICA Survey.
Figure 2.13 Bribes, Licenses, and Utilities: Percentage of Firms from Which Informal Payments Are Requested When They Apply for Licenses and Utilities

Business Climate 35
that court decisions are generally enforced, fewer than one-quarter offirms consider the Kenyan courts fair, impartial, and uncorrupted; an evensmaller number consider them fast (figure 2.14).
The Doing Business indicators confirm our conclusions by showingthat the number of court procedures in Kenya is among the highest andthat the cost of court proceedings is also quite significant with respect tomany of our comparator countries (figure 2.15). Related to the function-ing of the courts is the procedure for closing a business. Even in this case,the Doing Business indicators show that the cost and the timing of suchprocedures in Kenya are among the highest. In Kenya it takes more thanfour years to close a business (second only to India, where courts arenotoriously slow), and the cost of such procedures amounts to approxi-mately 22 percent of the value of the estate (figure 2.16).
ElectricityFindings from earlier firm-level surveys have highlighted the importanceof a reliable power supply. For different reasons—strong economicgrowth in some places, economic collapse in others, war, poor planning,population booms, high oil prices, and drought—sub-Saharan nationsface crippling electricity shortages.8 And yet Kenyan firms do not indi-cate power as a major constraint, although 85 percent of them reportexperiencing power outages. This apparent contradiction is explained by
Figure 2.14 Courts Malfunctioning: Percentage of Firms That Consider the Court System Efficient
0
10
20
30
40
50
60
per
cen
t
fair, impartial, anduncorrupted
quick affordable able to enforce itsdecision
Source: ICA Survey.

the fact that two out of three firms own a generator. Hence, althoughonly 28 percent complain about electricity, 31 percent do not complainbecause they have their own power supply. From a policy standpoint,however, we need to consider those with a generator as firms complain-ing about electricity. If we do that, then electricity rises as one of the topproblems facing Kenyan firms in 2007.
36 An Assessment of the Investment Climate in Kenya
Figure 2.15 Court Procedures and Cost—International Comparison
Figure 2.16 Time and Cost to Close a Business—International Comparison
0
5
10
15
20
25
30
35
40
45
50
China Ghana India Kenya Senegal SouthAfrica
Tanzania Uganda
procedures (number) cost (% of claim)
nu
mb
er o
f pro
ced
ure
s/%
of c
laim
co
st
Source: Doing Business.
0
2
4
6
8
10
12
year
s
% o
f est
ate
China Ghana India Kenya Senegal SouthAfrica
Tanzania Uganda0
5
10
15
20
25
30
35
time (years) cost (percent of estate)
Source: Doing Business.

With the recent growth of the Kenyan economy, electricity consumptionhas been growing at a steady pace, reaching a growth rate of 5 percent in2006.9 Henceforth, it is not surprising to note that during the past fouryears electricity has become more of a problem than it used to be. In fact,although in 2003 only 48 percent of manufacturing firms complainedabout this problem, 53 percent of manufacturing firms did so in 2007,ranking this as the third most important bottleneck.
Additional survey evidence shows how serious the problem of poweris. Close to 80 percent of firms in Kenya experience losses resulting frompower interruptions. This is the highest value of all comparator countries,along with Uganda (figure 2.17). In China, only 40 percent of firmsreport losses resulting from power outages, and in South Africa even lessdo so (13 percent).
Furthermore, Kenyan firms experienced approximately eight poweroutages per month in 2007, each lasting approximately 4.5 hours. Hence,firms in Kenya lost on average the equivalent of approximately four daysof production a month because of power outages. Given the dimensionof such a problem, two out of three firms in Kenya own or share a gener-ator and use it for 16 percent of their electricity needs (table 2.6). Amongall comparator countries, Kenya is the country with the highest share offirms owning a generator (table 2.7).
Owning a generator is, however, costly. Not only is it more expensiveto generate electricity, but the capital investment of a generator accountsfor approximately 3 percent to 5 percent of the total value of machinery
Business Climate 37
Figure 2.17 Percentage of Firms That Experienced Sales Losses fromElectrical Outages
0
10
20
30
% o
f fir
ms
40
50
60
70
80
90
China India Kenya Senegal South Africa Tanzania Uganda
Source: ICA Survey.
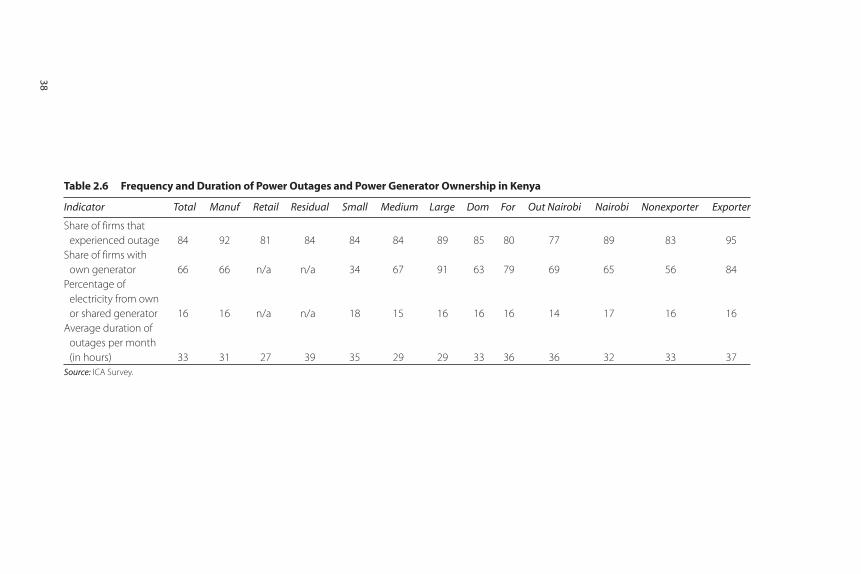
Table 2.6 Frequency and Duration of Power Outages and Power Generator Ownership in Kenya
Indicator Total Manuf Retail Residual Small Medium Large Dom For Out Nairobi Nairobi Nonexporter Exporter
Share of firms that experienced outage 84 92 81 84 84 84 89 85 80 77 89 83 95
Share of firms withown generator 66 66 n/a n/a 34 67 91 63 79 69 65 56 84
Percentage of electricity from own or shared generator 16 16 n/a n/a 18 15 16 16 16 14 17 16 16
Average duration of outages per month (in hours) 33 31 27 39 35 29 29 33 36 36 32 33 37
Source: ICA Survey.
38

Business Climate 39
and equipment. That explains why generators are owned mainly bymedium-size and large firms.
The impact of unreliable power supply on production costs is not lim-ited to the generation of electricity. As we saw earlier, Kenyan firms suf-fered a 7 percent loss in sales because of power disruption. Small domesticfirms are more affected by such disruptions. Nairobi-based firms reporthigher costs.
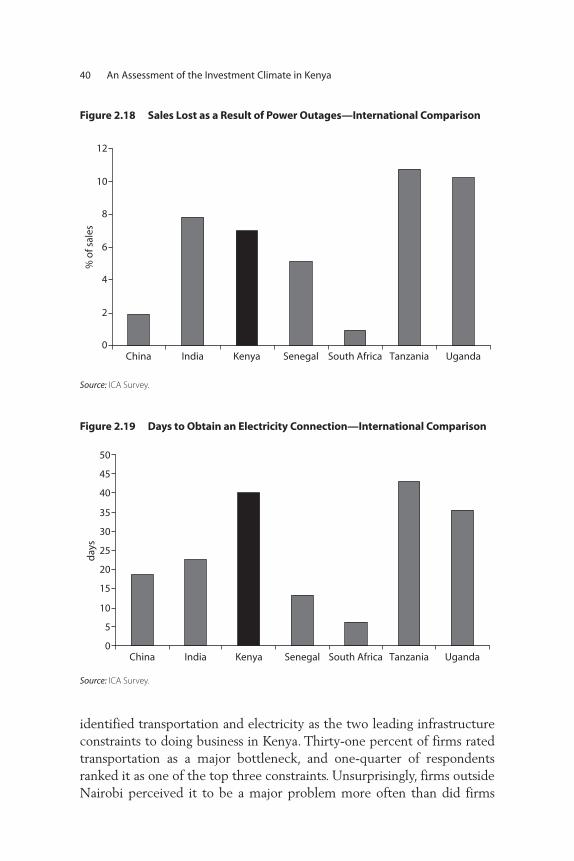
From an international perspective, the losses suffered by Kenyan firmsare among the highest, and they are the greatest component of all indi-rect costs considered. Chinese and South African firms enjoy a muchlower level of such losses (figure 2.18).
Obtaining a power connection is still a lengthy process in Kenya.One-quarter of sampled firms requested a connection within the past2 years, and it took them 40 days to obtain it. That is double the timeit takes firms in China and India and more than six times the time ittakes in South Africa (figure 2.19). Firms that were asked to makeinformal payments to set up an electric connection report a longerperiod of time to receive it—79 days. The waiting time is even longeroutside Nairobi.
Transporatation and CustomsA country’s ability to efficiently connect firms, suppliers, and consumersto global supply chains is essential to its competitiveness. By using sevenmeasures of performance, a recent assessment of the logistics gap acrosscountries10 ranked Kenya 76th of 150 economies, well behind SouthAfrica (ranked 24th), China (30th), and India (39th). Survey respondents
Table 2.7 Power Outages and Usage of Electrical Generators—International Comparison
Indicator Kenya India Senegal South Africa Tanzania Uganda China
Share of firms with own generator 66 52 62 9 42 25 18
Percentage of electricity fromown or sharedgenerator 16 22 7 0 16 8 2
Average duration ofoutages permonth (in hours) 33 27 24 2 88 106 n/a
Source: ICA Survey.
identified transportation and electricity as the two leading infrastructureconstraints to doing business in Kenya. Thirty-one percent of firms ratedtransportation as a major bottleneck, and one-quarter of respondentsranked it as one of the top three constraints. Unsurprisingly, firms outsideNairobi perceived it to be a major problem more often than did firms
40 An Assessment of the Investment Climate in Kenya
0
2
4
6
8
10
12
China
% o
f sal
es
India Kenya Senegal South Africa Tanzania Uganda
Source: ICA Survey.
Figure 2.18 Sales Lost as a Result of Power Outages—International Comparison
0
5
10
15
20
25
30
35
40
45
day
s
50
China India Kenya Senegal South Africa Tanzania Uganda
Source: ICA Survey.
Figure 2.19 Days to Obtain an Electricity Connection—International Comparison

located in the capital city. Particularly worried about the status of thetransportation system is the manufacturing sector. More than 60 percentof manufacturing firms transport their own goods, and in 2007 more thanhalf reported transportation as a major problem, up from only 37 percentin 2003.
Supply chain problems often result in firms holding large inventories,which represent an additional cost for firms. Figure 2.20 shows that firmsin Kenya hold on average 17 days of production in stocks of their mostimportant input. Although that is not high compared with other coun-tries, inventory holdings for manufacturing enterprises in Kenya are muchhigher, with an average of 47 days. That is among the highest of all com-parator countries (figure 2.20).
Kenyan firms bear high direct and indirect costs because of the qualityof the transportation infrastructure. Inland transport costs in Kenya aremuch higher than in China and India—where they are just a fraction ofthe costs in Kenya—and they are among the highest of all comparatorcountries. As shown in figure 2.21, shipping a 40-foot container costsKenyan firms much more than it costs firms in all other comparator coun-tries, except Uganda.
Unfortunately, when we look at losses from transportation-relatedproblems, Kenya does not perform any better. Kenyan companies lose2.6 percent of their sales to spoilage and theft during transportation. Thatis the highest value of all comparator countries. China, India, and SouthAfrica lose half that amount (figure 2.22).11
Business Climate 41
0
10
20
30
40
50
no
. of d
ays
of p
rod
uct
ion
China India Kenya Senegal South Africa Tanzania Uganda
all manufacturing
Source: ICA Survey.
Figure 2.20 Inventory Holdings—International Comparison

The losses presented previously affect different types of firms differ-ently. Losses during transportation affect more large firms, exporters, andfirms located in Nairobi (figure 2.23).
Half the transportation losses reported by Kenyan firms are due totransport delays, and the other half are due to theft during transporta-tion. Crime, hence, is also a problem when transporting goods. As we sawearlier, firms in Kenya admit to paying police when transporting goods.More specifically, 21 percent of them do so (25 percent of manufactur-ing firms). On average, they pay the equivalent of 1 percent of sales.These payments appear to protect firms from delays. Firms that admit
42 An Assessment of the Investment Climate in Kenya
Figure 2.21 Inland Transportation Costs
Source: Connecting to People.
0
500
1,000
1,500
2,000
2,500
40-Foot Container Costs
Inland Transportation Costs
0
500
1,000
1,500
2,000
2,500
3,000
3,500
China IndiaKenya Senegal SATanzania Uganda
China IndiaKenya Senegal SATanzania Uganda
export
US
$U
S $
import
export import

Business Climate 43
Figure 2.22 Percentage of Sales Lost While in Transit—International Comparison
0
1
2
3
% s
ales
lost
China IndiaKenya South Africa Tanzania Uganda
Source: ICA Survey.
Figure 2.23 Transportation Losses, by Firm Characteristics
0
1
2
3
4
exporter
outside N
airobi
small
mediu
mlarg
e
domesti
c
fore
ign
nonexporter
Nairobi
manufa
ct.
reta
il
% s
ales
lost
Source: ICA Survey.
they provide informal payments, in fact report a shorter time to reachMombasa from Nairobi (three hours or less).12
Another aspect of transportation not captured by the previously men-tioned losses is the time it takes to transport goods within Kenya. Surveyedfirms were asked to estimate how long it takes to ship goods from theircities to Nairobi, Mombassa, Nakuru, and Kisumu. Firms reported thatit takes approximately 14 hours from Nairobi to Mombasa, 4 hours
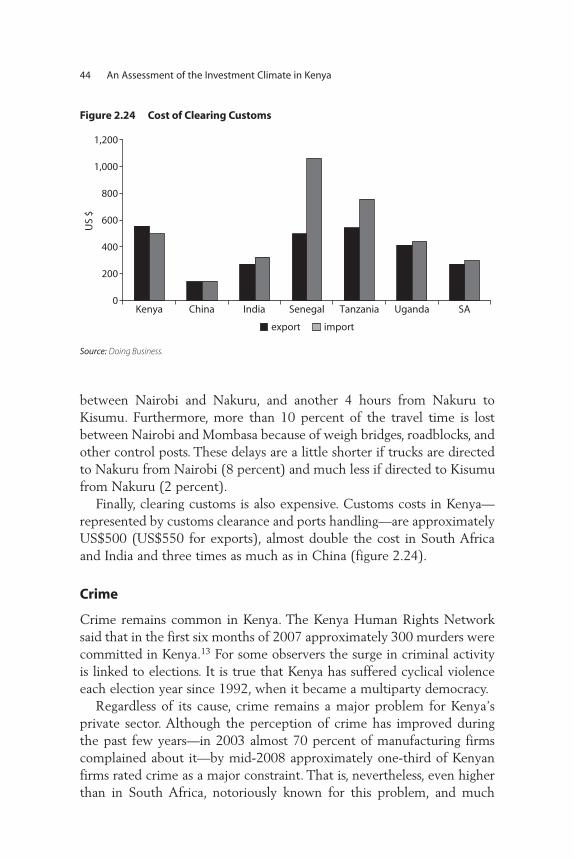
between Nairobi and Nakuru, and another 4 hours from Nakuru toKisumu. Furthermore, more than 10 percent of the travel time is lostbetween Nairobi and Mombasa because of weigh bridges, roadblocks, andother control posts. These delays are a little shorter if trucks are directedto Nakuru from Nairobi (8 percent) and much less if directed to Kisumufrom Nakuru (2 percent).
Finally, clearing customs is also expensive. Customs costs in Kenya—represented by customs clearance and ports handling—are approximatelyUS$500 (US$550 for exports), almost double the cost in South Africaand India and three times as much as in China (figure 2.24).
Crime
Crime remains common in Kenya. The Kenya Human Rights Networksaid that in the first six months of 2007 approximately 300 murders werecommitted in Kenya.13 For some observers the surge in criminal activityis linked to elections. It is true that Kenya has suffered cyclical violenceeach election year since 1992, when it became a multiparty democracy.
Regardless of its cause, crime remains a major problem for Kenya’sprivate sector. Although the perception of crime has improved duringthe past few years—in 2003 almost 70 percent of manufacturing firmscomplained about it—by mid-2008 approximately one-third of Kenyanfirms rated crime as a major constraint. That is, nevertheless, even higherthan in South Africa, notoriously known for this problem, and much
44 An Assessment of the Investment Climate in Kenya
Figure 2.24 Cost of Clearing Customs
0
200
400
600
800
1,000
1,200
US
$
China IndiaKenya Senegal SATanzania Uganda
export import
Source: Doing Business.

higher than all comparator countries (figure 2.25). China and India enjoya much lower level of crime, with 20 percent and 9 percent of firms com-plaining about it, respectively.
Concerns about crime vary across firms. Compared with small firms,medium-size and large firms are significantly more likely to reportcrime as a severe constraint. Surprisingly, firms in Nairobi are less likelythan those located in other cities to perceive crime as severe. Finally,manufacturing firms complain more about crime than do firms in theother activity sectors.14
When we look at more objective indicators of crime, the picture isthe same. Although objective measures of crime are hard to obtain,the survey asked a number of questions related to crime. The datashow that crime can add significantly to the costs of doing business inKenya, both directly through theft and indirectly through securitymeasures and protection payments extended to organized crime toprevent violence.
As indicated in figure 2.26, Kenyan firms reported losses from crimeaveraging almost 4 percent of annual sales. These costs are significantlyhigher than costs experienced by firms in all other comparator countries,including South Africa, in which losses were less than 1 percent. Similarly,in China and India objective cost data show much lower losses (one-tenththe cost experienced by Kenyan firms).
Similar results are obtained if we look at the indirect costs resulting fromthe installation of security measures on the business premises. In Kenya,about three-quarters of firms incurred extra costs to pay for security
Business Climate 45
Figure 2.25 Percentage of Firms Reporting Crime as a Major or Very Severe Obstacle to Business—International Comparison
35
per
cen
t
25
15
5
30
20
10
0China IndiaKenya SenegalSouth Africa Tanzania Uganda
Source: ICA Survey.
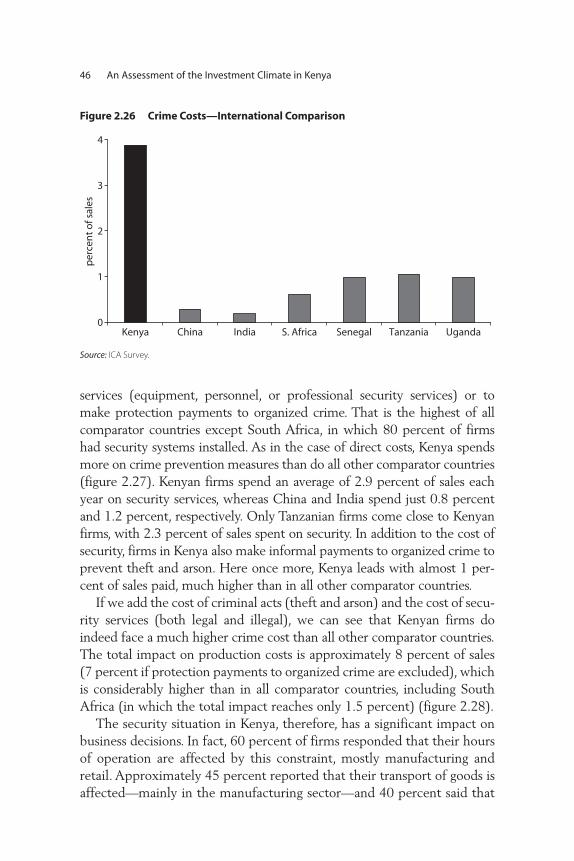
services (equipment, personnel, or professional security services) or tomake protection payments to organized crime. That is the highest of allcomparator countries except South Africa, in which 80 percent of firmshad security systems installed. As in the case of direct costs, Kenya spendsmore on crime prevention measures than do all other comparator countries(figure 2.27). Kenyan firms spend an average of 2.9 percent of sales eachyear on security services, whereas China and India spend just 0.8 percentand 1.2 percent, respectively. Only Tanzanian firms come close to Kenyanfirms, with 2.3 percent of sales spent on security. In addition to the cost ofsecurity, firms in Kenya also make informal payments to organized crime toprevent theft and arson. Here once more, Kenya leads with almost 1 per-cent of sales paid, much higher than in all other comparator countries.
If we add the cost of criminal acts (theft and arson) and the cost of secu-rity services (both legal and illegal), we can see that Kenyan firms doindeed face a much higher crime cost than all other comparator countries.The total impact on production costs is approximately 8 percent of sales(7 percent if protection payments to organized crime are excluded), whichis considerably higher than in all comparator countries, including SouthAfrica (in which the total impact reaches only 1.5 percent) (figure 2.28).
The security situation in Kenya, therefore, has a significant impact onbusiness decisions. In fact, 60 percent of firms responded that their hoursof operation are affected by this constraint, mostly manufacturing andretail. Approximately 45 percent reported that their transport of goods isaffected—mainly in the manufacturing sector—and 40 percent said that
46 An Assessment of the Investment Climate in Kenya
Figure 2.26 Crime Costs—International Comparison
0
1
2
per
cen
t o
f sal
es
3
4
Kenya China India S. Africa Senegal Tanzania Uganda
Source: ICA Survey.

Business Climate 47
their investment decisions are affected by crime (10 percent to a signifi-cant extent) (figure 2.29). All this evidence leads us to conclude thatcrime has a significant cost implication for Kenyan firms, and therefore itremains a major constraint.
Figure 2.27 Cost of Security Services in Percent of Sales—International Comparison
0
1
2
3
Senegal Tanzania UgandaKenya China(2002)
India(2005)
South Africa
% o
f sal
es
Source: ICA Survey.
Figure 2.28 Total Costs of Crime—International Comparison
0
% o
f sal
es
2
4
6
8
10
Kenya China India Senegal Uganda Tanzania* South Africa
crime security systems protection payments
Source: ICA Survey.* Data on organized crime not available.
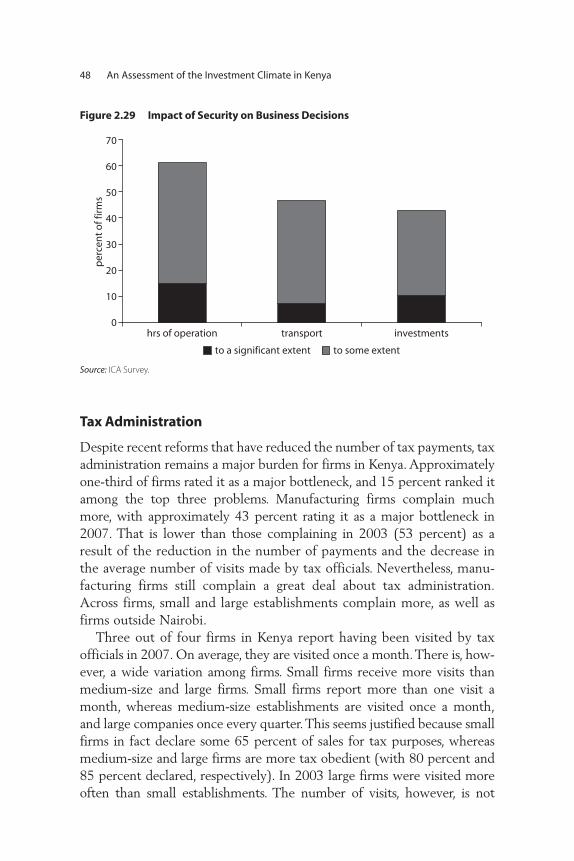
Tax Administration
Despite recent reforms that have reduced the number of tax payments, taxadministration remains a major burden for firms in Kenya. Approximatelyone-third of firms rated it as a major bottleneck, and 15 percent ranked itamong the top three problems. Manufacturing firms complain muchmore, with approximately 43 percent rating it as a major bottleneck in2007. That is lower than those complaining in 2003 (53 percent) as aresult of the reduction in the number of payments and the decrease inthe average number of visits made by tax officials. Nevertheless, manu-facturing firms still complain a great deal about tax administration.Across firms, small and large establishments complain more, as well asfirms outside Nairobi.
Three out of four firms in Kenya report having been visited by taxofficials in 2007. On average, they are visited once a month. There is, how-ever, a wide variation among firms. Small firms receive more visits thanmedium-size and large firms. Small firms report more than one visit amonth, whereas medium-size establishments are visited once a month,and large companies once every quarter. This seems justified because smallfirms in fact declare some 65 percent of sales for tax purposes, whereasmedium-size and large firms are more tax obedient (with 80 percent and85 percent declared, respectively). In 2003 large firms were visited moreoften than small establishments. The number of visits, however, is not
48 An Assessment of the Investment Climate in Kenya
Figure 2.29 Impact of Security on Business Decisions
0
per
cen
t o
f fir
ms
10
20
30
40
50
60
70
hrs of operation transport investments
to a significant extent to some extent
Source: ICA Survey.
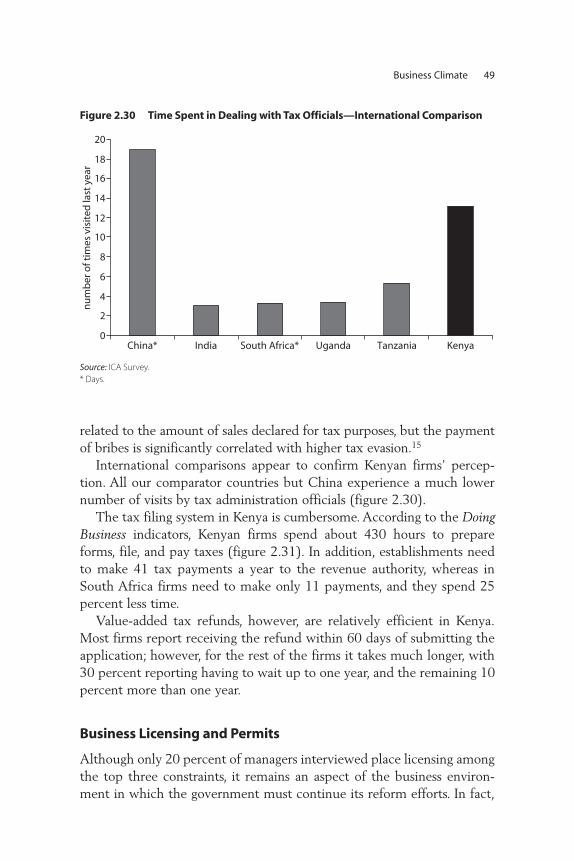
related to the amount of sales declared for tax purposes, but the paymentof bribes is significantly correlated with higher tax evasion.15
International comparisons appear to confirm Kenyan firms’ percep-tion. All our comparator countries but China experience a much lowernumber of visits by tax administration officials (figure 2.30).
The tax filing system in Kenya is cumbersome. According to the DoingBusiness indicators, Kenyan firms spend about 430 hours to prepareforms, file, and pay taxes (figure 2.31). In addition, establishments needto make 41 tax payments a year to the revenue authority, whereas inSouth Africa firms need to make only 11 payments, and they spend 25percent less time.
Value-added tax refunds, however, are relatively efficient in Kenya.Most firms report receiving the refund within 60 days of submitting theapplication; however, for the rest of the firms it takes much longer, with30 percent reporting having to wait up to one year, and the remaining 10percent more than one year.
Business Licensing and Permits
Although only 20 percent of managers interviewed place licensing amongthe top three constraints, it remains an aspect of the business environ-ment in which the government must continue its reform efforts. In fact,
Business Climate 49
Figure 2.30 Time Spent in Dealing with Tax Officials—International Comparison
0
2
4
6
8
10
12
14
16
18
20
nu
mb
er o
f tim
es v
isit
ed la
st y
ear
China* India South Africa* Uganda Tanzania Kenya
Source: ICA Survey.* Days.
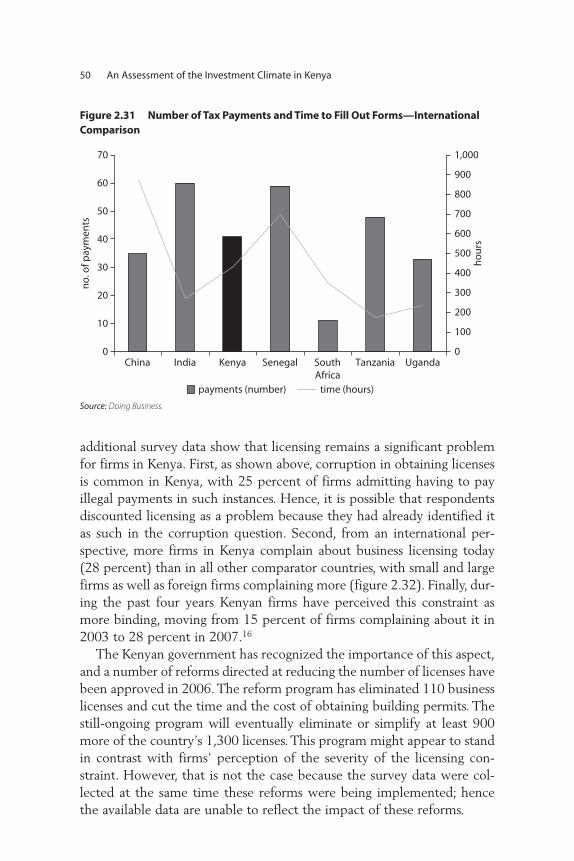
50 An Assessment of the Investment Climate in Kenya
0
10
20
30
40
50
60
70
China India Kenya Senegal SouthAfrica
Tanzania Uganda
no
. of p
aym
ents
0
100
200
300
400
500
600
700
800
900
1,000
ho
urs
payments (number) time (hours)
Source: Doing Business.
Figure 2.31 Number of Tax Payments and Time to Fill Out Forms—International Comparison
additional survey data show that licensing remains a significant problemfor firms in Kenya. First, as shown above, corruption in obtaining licensesis common in Kenya, with 25 percent of firms admitting having to payillegal payments in such instances. Hence, it is possible that respondentsdiscounted licensing as a problem because they had already identified itas such in the corruption question. Second, from an international per-spective, more firms in Kenya complain about business licensing today(28 percent) than in all other comparator countries, with small and largefirms as well as foreign firms complaining more (figure 2.32). Finally, dur-ing the past four years Kenyan firms have perceived this constraint asmore binding, moving from 15 percent of firms complaining about it in2003 to 28 percent in 2007.16
The Kenyan government has recognized the importance of this aspect,and a number of reforms directed at reducing the number of licenses havebeen approved in 2006. The reform program has eliminated 110 businesslicenses and cut the time and the cost of obtaining building permits. Thestill-ongoing program will eventually eliminate or simplify at least 900more of the country’s 1,300 licenses. This program might appear to standin contrast with firms’ perception of the severity of the licensing con-straint. However, that is not the case because the survey data were col-lected at the same time these reforms were being implemented; hencethe available data are unable to reflect the impact of these reforms.

The Kenyan government has made substantial achievements in licens-ing, as proved by Kenya’s appearance among the top 10 worldwidereformers in 2007, according to the Doing Business indicators. As anexample, since 2005 Kenya has been able to improve both the time (by30 percent) and the cost to deal with construction licenses (by 20 percent).In 2008, Kenya became the best performer among our comparator coun-tries in the number of procedures required and the time taken to dealwith licenses and their cost (figure 2.33).
The positive impact of these reforms is also reflected in the amount oftime managers need to spend in dealing with requirements imposed bygovernment regulations. Although in 2003 managers had to dedicateapproximately 14 percent of their time to this task, in 2007 they spentapproximately half that. By an international comparison, Kenya is muchbetter than most of our comparator countries (figure 2.34).
Reforms notwithstanding, there are other areas of the business envi-ronment related to business licensing in which Kenya does not perform aswell as the other comparator countries. For instance, starting a business inKenya remains a lengthy process. Kenya is second only to Senegal in thenumber of days required to start a new activity, with China, India, andSouth Africa requiring approximately one-third less time. The problem isnot in the number of procedures necessary to follow, an area in whichKenya performs relatively well. The bottleneck appears to be in the actualprocessing time. Similarly, the cost of these procedures is also relativelyhigh when compared with both China and South Africa (figure 2.35).
In addition to obtaining a license, renewing it is an area in whichthere is room for improvement. Most firms interviewed during the
Business Climate 51
Figure 2.32 Percentage of Firms Complaining about Business Licensing and Permits—International Comparison
China 2002 IndiaKenya0
5
10
20
30
15
25
per
cen
t
Senegal South AfricaTanzania Uganda
Source: ICA Survey.

survey said that they needed to renew licenses (up to three) from thelocal government periodically. Although on average it takes about 18days to obtain a domestic business license and 43 days to obtain anexpatriate license, the great majority of firms can obtain a license in amonth. Nevertheless, the processing time to renew licenses is much
52 An Assessment of the Investment Climate in Kenya
Figure 2.33 Duration, Cost, and Number of Procedures Required to ObtainBusiness Licenses—International Comparison
0
200
400
600
800
1,000
day
s
% o
f in
com
e p
er c
apit
a1,200
1,400
1,600
China India Kenya Senegal SouthAfrica
Tanzania Uganda0
5
10
15
20
25
30
35
40
2,365
procedures (number)
duration (days) cost (% of income per capita)
Source: Doing Business.
Figure 2.34 Manager’s Time Spent Dealing with Regulations
0
5
10
15
20
% o
f man
ager
’s t
ime
25
30
Kenya Kenya China India Senegal SouthAfrica
Tanzania Uganda
2003
2007
Source: ICA Survey.
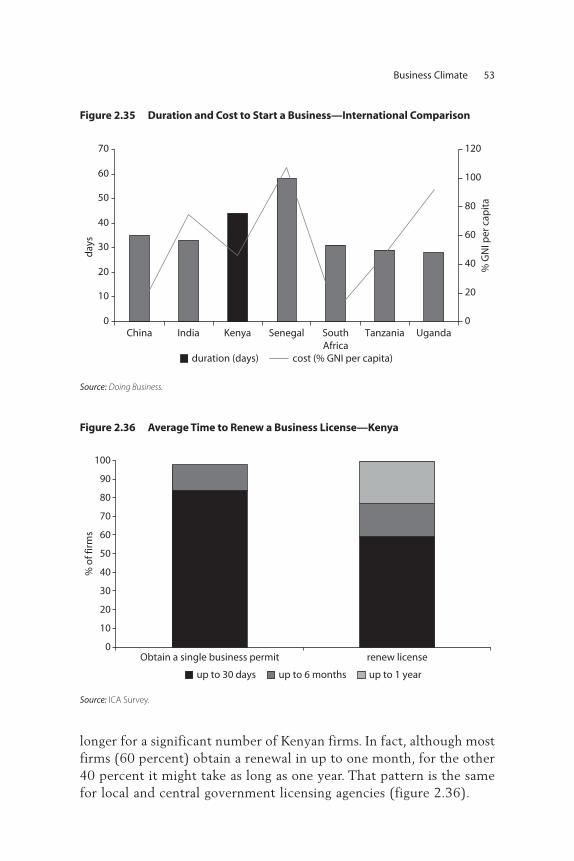
longer for a significant number of Kenyan firms. In fact, although mostfirms (60 percent) obtain a renewal in up to one month, for the other40 percent it might take as long as one year. That pattern is the samefor local and central government licensing agencies (figure 2.36).
Business Climate 53
Figure 2.35 Duration and Cost to Start a Business—International Comparison
0
10
20
30
day
s
% G
NI p
er c
apit
a
40
50
60
70
China India Kenya Senegal SouthAfrica
Tanzania Uganda0
20
40
60
80
100
120
cost (% GNI per capita)duration (days)
Source: Doing Business.
Figure 2.36 Average Time to Renew a Business License—Kenya
Source: ICA Survey.
0
10
20
30
% o
f fir
ms
40
50
60
70
80
90
100
Obtain a single business permit renew license
up to 30 days up to 6 months up to 1 year
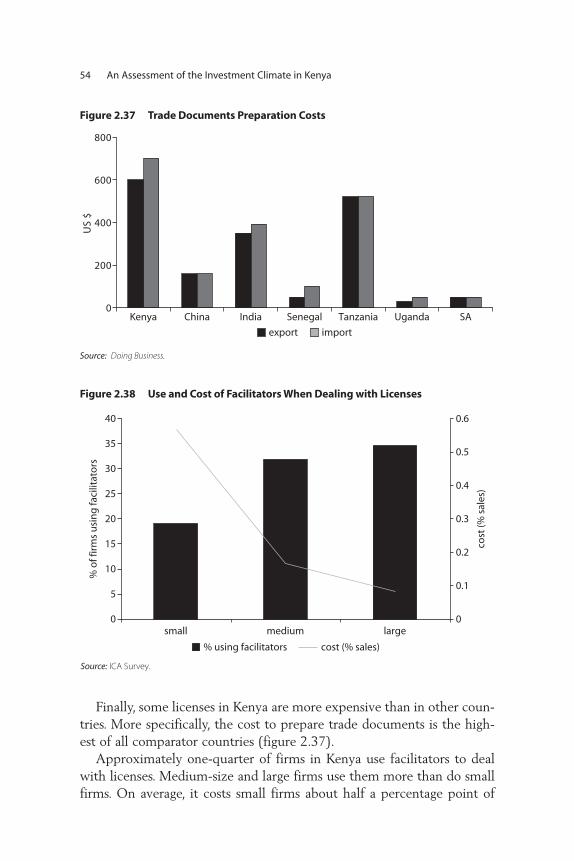
54 An Assessment of the Investment Climate in Kenya
Figure 2.37 Trade Documents Preparation Costs
Source: Doing Business.
0
200
US
$
400
600
800
China IndiaKenya Senegal SATanzania Uganda
export import
Figure 2.38 Use and Cost of Facilitators When Dealing with Licenses
Source: ICA Survey.
0
5
10
15
20
25
30
35
40
small medium large
% o
f fir
ms
usi
ng
faci
litat
ors
0
0.1
0.2
0.3
0.4
0.5
0.6
cost
(% s
ales
)
% using facilitators cost (% sales)
Finally, some licenses in Kenya are more expensive than in other coun-tries. More specifically, the cost to prepare trade documents is the high-est of all comparator countries (figure 2.37).
Approximately one-quarter of firms in Kenya use facilitators to dealwith licenses. Medium-size and large firms use them more than do smallfirms. On average, it costs small firms about half a percentage point of

sales to use facilitators, with medium-size and large firms paying less thando small firms (figure 2.38).
Notes
1. All results are weighted.
2. The survey in 2003 covered only manufacturing firms; hence, comparisonsacross time refer only to that sector.
3. Throughout the report, cross-country data refer to different years, morespecifically, India—2005, China—2003, South Africa—2003, Senegal—2003,Tanzania—2005, and Uganda—2005.
4. The difference in perception across firm characteristics is estimated with aprobit model with robust standard error. The result of the empirical relation-ship is presented in the appendix in the full ICA report.
5. Deloitte & Touche.
6. Business Daily Africa; http://www.bdafrica.com/index.php?option=com_content&task=view&id=4527&Itemid=5822.
7. Report “Plug on Tax ‘Leaks’ Helps Kenya to Clean Up” by the Financial Times(downloaded November 27, 2007 at http://www.ft.com/cms/s/0/516d3b92-9884-11dc-8ca7-0000779fd2ac.html?nclick_check=1).
8. “Toiling in the Dark: Africa’s Power Crisis,” The New York Times, July 29,2007. http://www.nytimes.com/2007/07/29/world/africa/29power.html?_r=2&oref=slogin&pagewanted=print&oref=slogin.
9. Africa Economic Outlook, African Development Bank/Organisation forEconomic Co-operation and Development.
10. Connecting to People: Trade Logistics in the Global Economy, 2007, World Bank.
11. This value refers to exports.
12. The number of observations are too few to be able to estimate this value forthe other cities.
13. Reported by Reuters at http://uk.reuters.com/article/latestCrisis/idUKL1192304320070711 (downloaded on November 15, 2007) and http://www.time.com/time/world/article/0,8599,1680997,00.html (November 27, 2007).
14. See appendix in the full ICA report for a complete set of regression results.
15. See more in the section on corruption.
16. Recall that because in 2003 the sample was composed only of manufacturingfirms, every panel comparison refers to manufacturing firms only.
Business Climate 55


Access to Finance from an International Perspective
Enterprise development requires the availability of external financing tobridge the gap between internally generated resources and the financingneeds of dynamic firms. We begin this chapter by examining firm percep-tions of the cost and availability of external finance. We then turn toobjective measures of the availability and cost of external financing.
About 36 percent of small, medium, and large enterprises (SMLEs) and76 percent of microenterprises in the manufacturing sector in Kenya ratedaccess to and cost of finance as a major or severe obstacle (figure 3.1).1 Inaddition, a higher proportion of formal nonmanufacturing firms reportfinance as a major or severe impediment to firm operation and growth:48 percent of retail firms and 41 percent of services firms.
Although cross-country comparisons of perceptions data are difficultto make, it is instructive to examine perceptions of the external financingregime in Kenya relative to a set of comparators.2 Figure 3.1 shows thatrelative to middle-income South Africa and the fast-growing economiesof China and India, a higher proportion of manufacturing firms in Kenyareport access to and cost of financing as a major or severe impedimentto operation. Only about 10 percent of SMLEs in the manufacturingsector rated access to finance as a serious concern in South Africa.
Access to Finance
57
C H A P T E R 3

The corresponding estimates are 23 percent and 15 percent for China andIndia, respectively. The comparison with the other African comparators,however, is more favorable and consistent with a number of other studieson the Kenyan banking sector: 41 percent of firms in Tanzania, 55 percentin Senegal, and 60 percent of firms in Uganda report being constrained bypoor access to finance. A potential concern with a comparison of nationalaverages is that differences in the composition of manufacturing sectorsacross the comparator countries drive the differences in perceptions thatwe observe. We obtain the same ranking of countries, however, when werestrict the comparison only to firms in the garment and textile subsectors.
A similar picture emerges when microenterprises are compared inFigure 3.1. Only 27 percent of microfirms in South Africa report thattheir growth is impeded by the lack of access to finance, compared withnearly three times that fraction in Kenya.3 Access to external financing formicrofirms appears more favorable in the less developed private sector ofTanzania, in which only 46 percent of firms report access to finance as amajor or severe impediment. In Uganda, however, the proportion ofmicrofirms that report being constrained by the lack of availability andcost of finance is similar to that in Kenya.
How much have perceptions changed during the past three years inKenya, and to what extent are changes related to shifts in the external
58 An Assessment of the Investment Climate in Kenya
SMLEs
0 20 40 60 80
Kenya
South Africa
Tanzania
Senegal
Uganda
India
China
% of firms reporting financeis serious obstacle
Microenterprises
0 20 40 60 80
Kenya
South Africa
Tanzania
Uganda
% of firms reporting financeis serious obstacle
Figure 3.1 Percentage of Manufacturing Enterprises Reporting Finance as a Serious Impediment to Operation, by Size—International Comparison
Source: ICA survey.
Note: Cross-country comparisons are only for manufacturing enterprises..

finance regime? Using data from the 2003 and 2007 surveys, we restrictthe analysis to a set of firms surveyed in each year. This addresses con-cerns that differences in perceptions across the two survey periods aredriven by differences in sample composition. A total of 75 percent ofthese firms reported being constrained by access to finance in 2003. In2007, only 36 percent of the same set of firms reported access to financeas a major or severe impediment. The decline in the proportion of firmsconstrained by access to finance is large (a 40 percent decline) and sug-gests a significant improvement in the external financing regime.
The decline in firm perceptions is consistent with changes in theperformance of the banking sector during the past five years (Kenya:Accelaration and Sustaining Inclusive Growth, World Bank 2008). First,improvements in fiscal management during the past five years induced ashift out of government securities and into credit to the private sector.Consequently, increased competition in the banking sector has led to alarge expansion in credit to the private sector. The subsequent decline inthe nominal cost of borrowing underlines the effects of improved fiscalmanagement and competition in the banking sector. An examination ofFigure 3.2 confirms a decline in the weighted average cost of short- andlong-term finance by almost 5 percentage points across the two surveyyears. The decline in the nominal cost of borrowing is reinforced by risinginflation between 2003 and 2007, suggesting an even larger decline in thereal cost of borrowing.
Access to Finance 59
0
5
10
15
20
25
30
1 3 5 7 9 11 1 3 5 7 9 11 1 3 5 7 9 11 1 3 5 7 9 11 1 3 5 7 9 11 1 3 5 7 9 11 1 3 5 7 9 112000 2001 2002 2003 2004 2005 2006
%, a
nn
ual
ized
loans overdraft 91-day TB
Figure 3.2 Annual Cost of Borrowing
Source: Central Bank of Kenya.
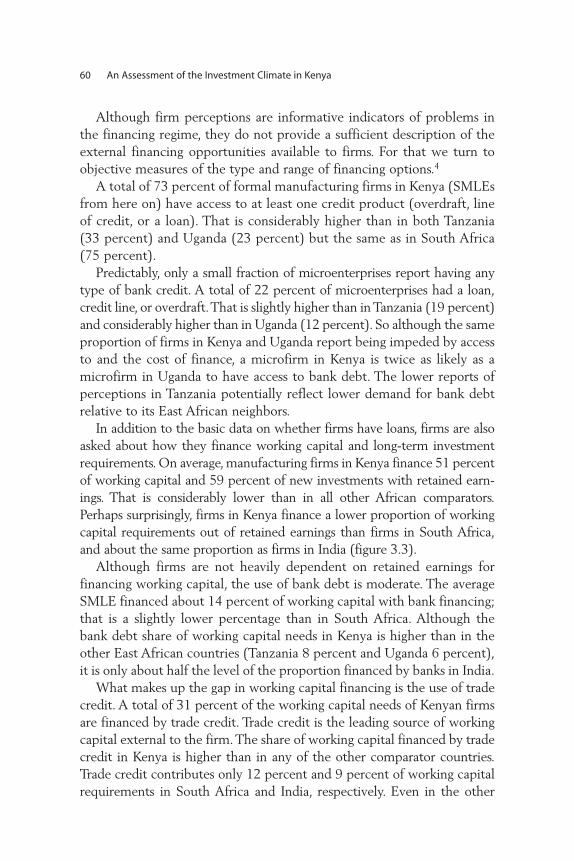
Although firm perceptions are informative indicators of problems inthe financing regime, they do not provide a sufficient description of theexternal financing opportunities available to firms. For that we turn toobjective measures of the type and range of financing options.4
A total of 73 percent of formal manufacturing firms in Kenya (SMLEsfrom here on) have access to at least one credit product (overdraft, lineof credit, or a loan). That is considerably higher than in both Tanzania(33 percent) and Uganda (23 percent) but the same as in South Africa(75 percent).
Predictably, only a small fraction of microenterprises report having anytype of bank credit. A total of 22 percent of microenterprises had a loan,credit line, or overdraft. That is slightly higher than in Tanzania (19 percent)and considerably higher than in Uganda (12 percent). So although the sameproportion of firms in Kenya and Uganda report being impeded by accessto and the cost of finance, a microfirm in Kenya is twice as likely as amicrofirm in Uganda to have access to bank debt. The lower reports ofperceptions in Tanzania potentially reflect lower demand for bank debtrelative to its East African neighbors.
In addition to the basic data on whether firms have loans, firms are alsoasked about how they finance working capital and long-term investmentrequirements. On average, manufacturing firms in Kenya finance 51 percentof working capital and 59 percent of new investments with retained earn-ings. That is considerably lower than in all other African comparators.Perhaps surprisingly, firms in Kenya finance a lower proportion of workingcapital requirements out of retained earnings than firms in South Africa,and about the same proportion as firms in India (figure 3.3).
Although firms are not heavily dependent on retained earnings forfinancing working capital, the use of bank debt is moderate. The averageSMLE financed about 14 percent of working capital with bank financing;that is a slightly lower percentage than in South Africa. Although thebank debt share of working capital needs in Kenya is higher than in theother East African countries (Tanzania 8 percent and Uganda 6 percent),it is only about half the level of the proportion financed by banks in India.
What makes up the gap in working capital financing is the use of tradecredit. A total of 31 percent of the working capital needs of Kenyan firmsare financed by trade credit. Trade credit is the leading source of workingcapital external to the firm. The share of working capital financed by tradecredit in Kenya is higher than in any of the other comparator countries.Trade credit contributes only 12 percent and 9 percent of working capitalrequirements in South Africa and India, respectively. Even in the other
60 An Assessment of the Investment Climate in Kenya
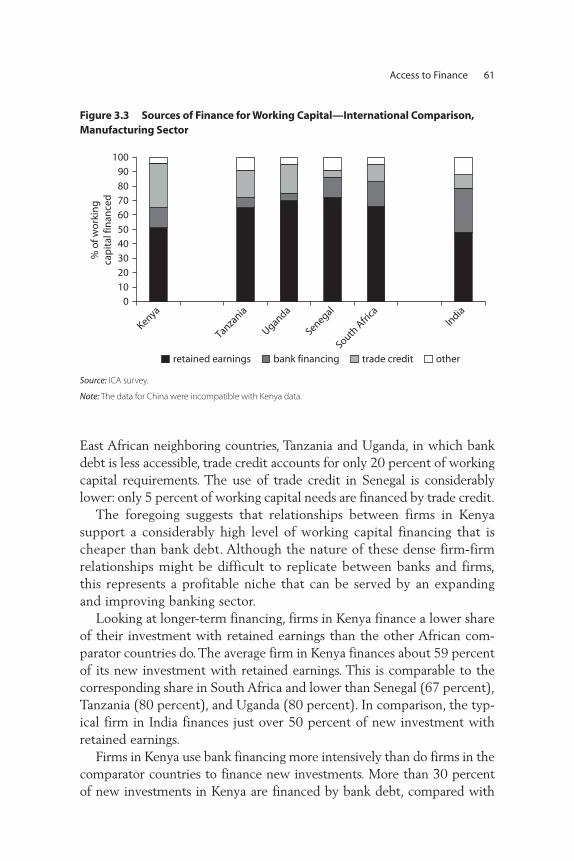
East African neighboring countries, Tanzania and Uganda, in which bankdebt is less accessible, trade credit accounts for only 20 percent of workingcapital requirements. The use of trade credit in Senegal is considerablylower: only 5 percent of working capital needs are financed by trade credit.
The foregoing suggests that relationships between firms in Kenyasupport a considerably high level of working capital financing that ischeaper than bank debt. Although the nature of these dense firm-firmrelationships might be difficult to replicate between banks and firms,this represents a profitable niche that can be served by an expandingand improving banking sector.
Looking at longer-term financing, firms in Kenya finance a lower shareof their investment with retained earnings than the other African com-parator countries do. The average firm in Kenya finances about 59 percentof its new investment with retained earnings. This is comparable to thecorresponding share in South Africa and lower than Senegal (67 percent),Tanzania (80 percent), and Uganda (80 percent). In comparison, the typ-ical firm in India finances just over 50 percent of new investment withretained earnings.
Firms in Kenya use bank financing more intensively than do firms in thecomparator countries to finance new investments. More than 30 percentof new investments in Kenya are financed by bank debt, compared with
Access to Finance 61
010
20
3040
50
60
7080
90100
Kenya
Tanzania
Uganda
Senegal
South A
frica
India
% o
f wo
rkin
gca
pit
al fi
nan
ced
retained earnings bank financing trade credit other
Figure 3.3 Sources of Finance for Working Capital—International Comparison, Manufacturing Sector
Source: ICA survey.
Note: The data for China were incompatible with Kenya data.

only 5 percent in Tanzania and Uganda and 15 percent to 20 percent inSenegal, South Africa, and India (figure 3.4).
It is instructive to explore some explanations for the more extensiveuse of bank financing in Kenya. Below we elaborate on two plausibledemand-side explanatory variables: the cost of debt and the quality ofinformation for assessing debt applications.5
An important determinant for the demand for bank debt is the realcost of borrowing. Although the cost of a Kenya shilling borrowedincludes a variety of costs other than interest, we have data only on theinterest cost of borrowing. As recent survey evidence has shown, how-ever, noninterest charges and fees constitute a considerable share of thecost of borrowing. These charges include negotiation, commitment,legal, valuation, processing, and insurance fees. Data on each of thesepotential loan fees were not collected as part of this survey, but much ofthe scanty evidence suggests that interest costs account for the principalshare of the cost of finance.
As figure 3.5 demonstrates, the real interest rate facing borrowers playsan important role in explaining the intensive use of debt financing in Kenya.Median real interest rates are the second lowest among comparator coun-tries, with only Chinese firms facing lower real costs of borrowing.6
A second determinant of financing is the quality of information thatfirms produce and maintain. Information that can be reliably used to
62 An Assessment of the Investment Climate in Kenya
0
20
40
60
80
100
Kenya
Uganda
Tanzania
Senegal
South A
frica
India
% o
f new
inve
stm
ent
finan
ced
retained earnings bank financing trade credit other
Figure 3.4 Sources of Finance for New Investments—International Comparison, Manufacturing Sector
Source: ICA survey.

Access to Finance 63
Real Annual Cost of Borrowing
0
2
4
6
8
10
12
14
16
Senegal Uganda
Median Loan Duration
0
10
20
30
40
50
60
70
China Kenya South Africa India Tanzania
Uganda
mo
nth
s
Tanzania China Kenya Senegal India South Africa
real interest
per
cen
t
Figure 3.5 Median Annual Real Cost of Borrowing and Loan Duration Terms—International Comparison, Manufacturing Sector
Source: ICA survey.
evaluate financing propositions makes banks more willing to lend. Anexamination of the prevalence of externally audited accounts is a goodmeasure of the quality of information produced by firms. A total of 88percent of manufacturing firms in Kenya produce audited financial
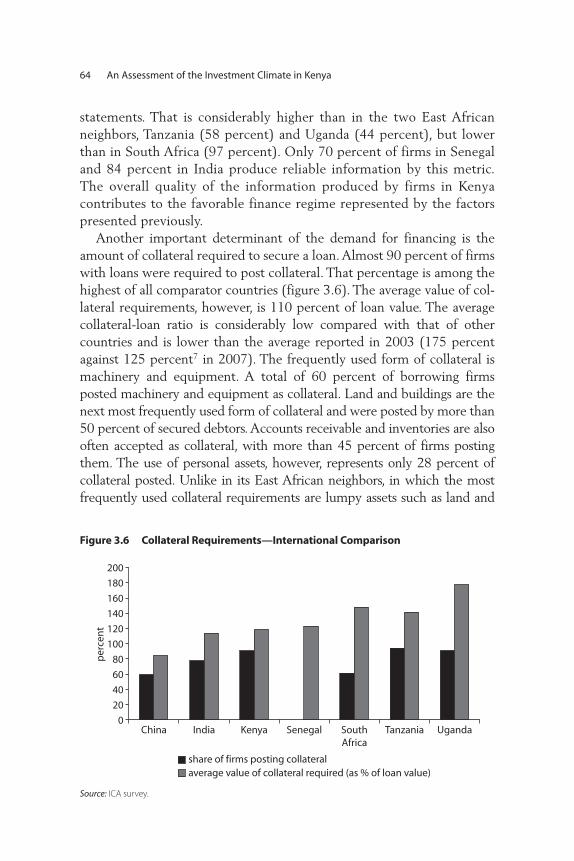
statements. That is considerably higher than in the two East Africanneighbors, Tanzania (58 percent) and Uganda (44 percent), but lowerthan in South Africa (97 percent). Only 70 percent of firms in Senegaland 84 percent in India produce reliable information by this metric.The overall quality of the information produced by firms in Kenyacontributes to the favorable finance regime represented by the factorspresented previously.
Another important determinant of the demand for financing is theamount of collateral required to secure a loan. Almost 90 percent of firmswith loans were required to post collateral. That percentage is among thehighest of all comparator countries (figure 3.6). The average value of col-lateral requirements, however, is 110 percent of loan value. The averagecollateral-loan ratio is considerably low compared with that of othercountries and is lower than the average reported in 2003 (175 percentagainst 125 percent7 in 2007). The frequently used form of collateral ismachinery and equipment. A total of 60 percent of borrowing firmsposted machinery and equipment as collateral. Land and buildings are thenext most frequently used form of collateral and were posted by more than50 percent of secured debtors. Accounts receivable and inventories are alsooften accepted as collateral, with more than 45 percent of firms postingthem. The use of personal assets, however, represents only 28 percent ofcollateral posted. Unlike in its East African neighbors, in which the mostfrequently used collateral requirements are lumpy assets such as land and
64 An Assessment of the Investment Climate in Kenya
200180160140120100806040200
KenyaChina UgandaTanzaniaSenegal SouthAfrica
India
share of firms posting collateralaverage value of collateral required (as % of loan value)
per
cen
t
Figure 3.6 Collateral Requirements—International Comparison
Source: ICA survey.

buildings, in Kenya movable assets and receivables are used, an importantindicator of Kenya’s financial market development and sophistication.
Finally, we examine one aspect of the terms under which credit isextended: the duration of the loan. Ideally, a firm would like to match thecash flows from its investments with loan repayment obligations. Forinvestments with long payback periods, firms would generally preferlonger loan durations. Although we are unable to show the desired lengthof loan terms from the firm’s perspective, we can show the actual dura-tion for the loans in the sample. Figure 3.5 illustrates that the medianduration of loans in Kenya is in the middle of the pack of comparatorcountries.8 The typical loan in Kenya has a term of three years comparedwith four years in Senegal, and five years in India and South Africa.Compared with its East African neighbors, in Kenya loan duration termsappear considerably more favorable.
Despite nearly 40 percent of firms reporting major or severe impedi-ments to growth as a result of poor access to finance, the cross-countrycomparisons paint a much more favorable picture of the finance regimefor firms in Kenya. It is underpinned by low real-interest costs of borrow-ing and the good quality of information firms produce. Compared withfirms in their East African neighbors, Kenyan firms enjoy a superior advan-tage in access to finance. Although Kenyan firms use as much if not morebank debt as in India and South Africa, they face shorter loan durations.
Effect of Firm Size on Access to Credit
Having shown that aggregate measures of access to credit in Kenya arerelatively good, we examine in more detail variation in access to creditwithin Kenya. Essentially, we ask how firm characteristics affect the like-lihood of access to finance. In this section, we also examine the relativeprospects of formal nonmanufacturing firms in the retail sector and otherservice sectors with respect to the financing regime.
Firm size is an important determinant of access to credit. Access tocredit is significantly more difficult for microenterprises than for smallenterprises and considerably more difficult for small enterprises thanfor medium-size and large enterprises (figure 3.7). That pattern is con-sistent with a well-established fact across a variety of developing andeven some developed economies. Consequently, microenterprises aremore likely to report that access to finance is a serious obstacle. Evenwithin the sample of formal firms, firms with fewer than 20 employeesare twice as likely as firms with more than 20 employees to report
Access to Finance 65

finance as a major or severe constraint. Although perception measuresdo not adequately capture the dimensions of a firm’s ability to borrow,we find similar size disparities in more objective measures of access tocredit. Microenterprises are less likely to have a bank account. Only 41percent of microenterprises have a bank account, compared with 90percent of small and 99 percent of medium and large firms. That dis-parity is likely a major source of differences in access to credit. A bankaccount represents a banking institution’s primary channel of informa-tion about a potential borrower. These results are consistent with therecent financial access report for Kenya, which finds that informalityand individual bank account holding are negatively related (www.fsdkenya.org/finaccess). The recent calls by the Central Bank governorfor the establishment of a low-fee checking account resonates withsome of the changes highlighted by the result above.9 Although loanapplication rates are similar between micro- and small formal firms,the proportion of small firms with a loan is double the proportion ofmicrofirms that have a loan. The differences in access to an overdraftfacility are even more glaring. Among microenterprises, only 3 percenthave access to an overdraft facility compared with 66 percent amongmedium and large enterprises.
66 An Assessment of the Investment Climate in Kenya
0
25
50
75
100
reportingfinance as a
seriousconstraint
with bankaccount
withoverdraft
with loan applied forloan
with loanapplication
rejected
% o
f fir
ms
micro small medium/large
Figure 3.7 Access to Credit, by Firm Size
Source: ICA survey.
Note: Includes both manufacturing and nonmanufacturing enterprises.

The impact of firm size is evident even when we restrict the analysisto the formal sample. Within the SMLE subsample, small firms have lessaccess than medium and large firms. For example, only 27 percent ofsmall firms report having any credit products, compared with 55 percentof medium and large firms. This difference is statistically significant evenafter controlling for other factors that might affect access. Small firms areabout 17 percentage points more likely to report that access to finance isa serious obstacle compared with large firms, ceteris paribus. In regard toobjective measures, the gap widens between the smallest formal firms andlarge firms: small firms are about 46 percentage points less likely to haveoverdraft facilities and about 42 percentage points less likely to have aloan or overdraft than are large firms, holding all other factors constant.Relative to large firms, medium firms are only about 13 percentage pointsless likely to have an overdraft and 16 percentage points less likely to havea loan or overdraft. Small firms are also about 10 percentage points lesslikely to apply for a loan; however, after controlling for other factors thatmight affect the likelihood of submitting a loan application, this effect isno longer statistically significant.
Do differences in access also translate to differences in the price of debt or the term of the loans received by firms of different sizes?Table 3.1 shows the median price and duration for all formal firms inthe sample. As the table shows, medium firms pay about 200 basispoints more than do large firms. In regression analysis, after controllingfor a variety of firm characteristics, we obtain a statistically significantsize premium in the median price of debt. Small and medium firmspay about 100 basis points more than large firms, all other factorsbeing equal; however, the size advantage does not translate to otheraspects of the debt contract. Median loan durations are identical acrossall size categories, and collateral requirements are slightly lower for thesmallest formal firms.
Access to Finance 67
Table 3.1 Median Interest Rates and Loan Duration by Firm Size
Size categoriesAnnual interest
rateLoan duration
months
Collateralrequirements(percent loan
value)
Small (5–19 employees) 14.0 36.0 110.0Medium (20–99 employees) 14.0 36.0 120.0Large (100 + employees) 12.0 36.0 118.5Total 13.9 36.0 120.0

Characteristics of Loan Products
Of the 657 firms in the formal sample, firms report 64 lines of credit and208 loans. Most credit products observed relate to the manufacturingsector. There are only 12 lines of credit and 14 loans reported in themicroenterprise sample of 124 firms. Almost all loans and credit lines tothe formal sector (SMLEs) are issued by private commercial banks, withstate-owned banks accounting for only an 8 percent share of all loans.Microfinance institutions dominate lending to microfirms, although pri-vate commercial banks account for 31 percent of loans to this sector(table 3.2).
About half the loans in our sample were obtained in 2006, with theearliest loan in 1974. The size of loans varies from 20 thousand to 20 billionKenya shillings, with the median being 5 million (table 3.3).10 As a fractionof the estimated current value of the firm’s fixed assets the average loan-fixed assets ratio is about 36.5 percent (median 12.5 percent), which
68 An Assessment of the Investment Climate in Kenya
Table 3.2 Credit Line/Loan Providers
Microenterprises SML enterprises
Type of financial institution No. of obs. Percent No. of obs. Percent
Private commercial banks 8 31 223 82State-owned banks and/or
government agency 5 19 23 8Nonbank/microfinance
institutions 12 46 25 9Other 1 4 1 1Total 26 100 272 100Source: ICA surveys. Note: SML enterprises include manufacturing and nonmanufacturing enterprises; obs. � observations.
Table 3.3 Loan Characteristics
Variable N Min Median Max
Year of approval 270.00 1974 2006 2007Total duration in months 271.00 2 36 240Amount at time of
approval (Kenya shillings) 271.00 20,000 5 million 20 billionAverage annual interest rate
(percent) 272.00 5.00 13.95 100.00Collateral as a percentage
of loan amount 245.00 20.00 120.00 400.00Source: ICA surveys. Note: Includes manufacturing and nonmanufacturing enterprises.

indicates a relatively moderate degree of leverage. The average andmedian nominal interest rates are about 13 percent. The average andmedian loan maturity is about three years.
Loan Applications and Rejections
Measures of loan application and rejection rates provide important infor-mation about impediments to accessing finance. We find that a relativelysmall proportion of firms applied for a loan in 2007. A total of 26 percentof microenterprises did so. Among formal SMLEs, 26 percent of smallfirms and more than one-third of medium and large firms applied for aloan in 2007. Rejection rates are surprisingly low for microenterprises:only 13 percent of loan applications were rejected. The correspondingrejection rate for small enterprises is 21 percent, and only 12 percent oflarge firms had loan applications rejected. The reasons for these rejectionsprovide important insights into the types of policy interventions likely toimprove access. Although the sample sizes used for this analysis are toosmall to be conclusive, it is worth exploring reported reasons. Inadequatecollateral is the most frequently cited reason for rejection of loans amongsmall formal firms. For medium and large firms, incompleteness of loanapplications accounts for nearly half of all loan rejections (table 3.4).
Given the low rejection rates, it is surprising that application rates arenot higher. One plausible explanation is that self-selection into applica-tions produces a high-quality pool of loan applicants.
Access to Finance 69
Table 3.4 Reasons for Loan Rejections
Reason
SML enterprises
Small Medium-large
Collateral or cosigners unacceptable (%) 59 19
Insufficient profitability (%) 6 6Problems with credit
history or report (%) 18 6Incompleteness of loan
application (%) 6 44Concerns about level of
debt already incurred (%) 0 19Other objections (%) 11 6Sample size 17 16
Source: ICA surveys. Note: Includes manufacturing and nonmanufacturing enterprises.

Understanding why firms do not apply for loans is an importantstarting point for identifying the bottlenecks that are potentially recti-fiable by policy interventions. We present the reasons reported by firmsthat did not apply for loans in table 3.5. Microenterprises are less likelyto report “no need for loan” as a reason for nonapplication. Only 10percent of microenterprises say they do not need loans, compared with38 percent of small and 60 percent of medium and large firms. Thatcorroborates the evidence presented previously that access to credit,particularly for micro- and small firms, is much worse compared withmedium and large firms. Microenterprises are also more likely to bepriced out of the market because of collateral requirements—43 per-cent of microfirms compared with 12 percent of small firms and 7 per-cent of medium and large firms report that collateral requirementsdiscouraged loan applications. Given the preponderance of fixed assetsas collateral and the size and scope of microfirms, it is not surprisingthat collateral requirements are an impediment to accessing finance formicrofirms. Regression results confirm the importance of physicalfixed assets in access to finance. Ownership of land is associated witha 19 percentage point increase in securing an overdraft or loan. In addi-tion, firms that own land are nearly 13 percentage points less likely tohave a loan application rejected. Together with collateral requirements,the application process itself is considered a major problem by bothmicro- and small firms, even though small firms complain more about
70 An Assessment of the Investment Climate in Kenya
Table 3.5 Reasons for Not Applying for Loan or Line of Credit
SML enterprise
Reason Microenterprise Small Medium and large
No need for loan (%) 10 38 60Application procedures are
complicated (%) 24 11 6Interest rates are not favorable (%) 13 26 17Collateral requirements are
unattainable (%) 43 12 7Size of loan and maturity are
insufficient (%) 5 3 2Did not think it would be
approved (%) 2 5 1Other (%) 2 5 7Sample size 92 231 216
Source: ICA surveys. Note: Includes manufacturing and nonmanufacturing enterprises.

the interest rates. More specifically, a little more than one-quarter ofsmall formal firms and one-sixth of medium and large firms fail toapply because of unfavorable interest rates. Less than 5 percent offirms across the entire size distribution report size of loan and matu-rity to be deterrents to accessing external finance. This suggests theabsence of any rationing of credit. Finally, 11percent of small formalfirms find the application process complicated.
Notes
1. The question on perceptions asks whether the “access to and cost of financing”is a major or severe impediment to firm operation and growth. In the rest ofthe paper we use the phrase “access to finance” and “access to and cost offinance” interchangeably.
2. Differences in access to and the cost of finance are driven by a variety offactors, including economic growth prospects, the nature of bank ownershipand regulation, and other demand- and supply-side factors that determinethe quality of the marginal firm that has access to finance.
3. Microfirms are defined as firms with five or fewer employees.
4. These measures are derived from firm-reported data and as such do notaddress a variety of aspects of the market for external financing. For instance,our data allow us to observe whether a firm does not have a loan, an over-draft, or other debt instrument, but is uninformative as to why a firm isunable to secure financing. Although one possible interpretation is that thereare problems on the supply side, it is quite likely that the firm has sufficientinternal resources, did not present a sound financing proposition to externalfinanciers, keeps bad records, or does not have sufficient collateral—alldemand-side constraints that preclude a conclusion that banks are unwillingto lend. In an attempt to further elaborate on possible bottlenecks in the lend-ing regime, later in this chapter we report the results of an inquiry into whyfirms do not use external financing options.
5. These are by no means the only or even the most important explanatoryvariables. We focus on these because the data to investigate their plausibilityare available.
6. We need to keep in mind that low borrowing costs in China and India (andto a much lesser extent in Kenya) reflect structural features of the financialsystems, particularly government ownership of major banks.
7. Manufacturing sector only.
8. It is possible that responses to this question refer to ex post durations ratherthan ex ante commitments by banks.
Access to Finance 71

9. See a recent speech by the governor of the Central Bank of Kenya on bankcharges and fees on August 28, 2007: http://www.bis.org/review/r071107e.pdf.
10. At 2006 exchange rates, that corresponds to a median loan size of about$70,000.
72 An Assessment of the Investment Climate in Kenya

A well-functioning labor market is vital to the success of the government’spolicies to establish a globally competitive economy and provide jobs to agrowing population. This chapter uses the firm-level data provided by thepersonnel managers of surveyed firms together with individual-levelemployee survey data to describe the labor market in the manufacturing,retail, and services sectors. The chapter starts with a broad description offirm perceptions on a variety of labor market constraints and firm responsesto these constraints, including training. The chapter then examines wage-setting behavior using firm- and worker-level data.
The data used for this chapter include 396 manufacturing, 150 retail, and111 services sector establishments. Because of data availability, wage-settingbehavior is examined only for manufacturing firms. The individual-leveldata come from 1,160 workers matched to the sampled firms in the man-ufacturing sector.
Labor market constraints are very low on firms’ lists of impediments togrowth. Two constraints are pertinent to this chapter: the extent to whichan inadequately educated workforce and labor regulations constrain thegrowth and operations of enterprises. An overwhelming majority of firmsin Kenya do not perceive either to be a major or very severe impedimentto growth. Less than 20 percent of all manufacturing firms report either
Labor Markets and Human Capital
73
C H A P T E R 4

constraint to be a major or very severe impediment. The same holds truefor the retail and services sector: less than 5 percent of retail firms andother services firms report being inhibited by either constraint. For firmsin Kenya, labor regulations are much more important constraints thaninadequate skills.
Worker Skills
Labor market constraints are at the bottom of firms’ lists of impedimentsto growth. In particular, the shortage of skilled workers is the least impor-tant constraint to the operation and growth of manufacturing firms inKenya. About 8 percent of manufacturing firms report the shortage ofskills as a major or severe impediment to growth. Figure 4.1 shows theproportion of manufacturing firms that report being constrained by apoorly educated workforce in Kenya and across a set of comparator coun-tries. It is striking that the sample of firms surveyed in Kenya have thelowest proportion reporting major constraints, tied with Uganda. Twicethe proportion of firms report inadequate skills in neighboring Tanzania.Predictably, middle-income countries register a higher proportion of firmsunhappy with the quality of the workforce.
74 An Assessment of the Investment Climate in Kenya
8.3 8.9
14.516.9
2830.7
35.5
0
10
20
30
40
% o
f fir
ms
Uganda
Kenya 2007In
dia
Tanzania
Kenya 2003Chin
a
South A
frica
Figure 4.1 Percentage of Manufacturing Firms Reporting Skills Shortage as a Serious Constraint to Firm Operation—International Comparison
Source: ICA survey.
Note: Cross-country comparisons are only for manufacturing enterprises. In all countries shown the figure presents percentage of firms that report that skills shortage is a major or severe constraint to firm operation.

We include the unweighted proportion of manufacturing firms surveyedin 2003 as a guide to trends in firm perceptions of formal education duringthe past four years. The data show a very large downward trend in concernsabout skills in Kenya. In particular, the proportion of firms concerned hasdropped from 28 percent to a little more than 8 percent, a 70 percentdecline in the proportion of firms concerned about formal worker training.1
Is it possible that the 2007 estimates conceal important variation acrossfirm characteristics? We examine that possibility by looking at firm percep-tions of formal worker training across sectors, firm size, export status, andownership categories (table 4.1). Firms in the manufacturing sector aremore than twice as likely as retail firms and more than six times as likelyas service firms to report skills shortages as a constraint to performance.Medium-size, foreign-owned, and exporting firms in the manufacturingsector are more likely to report that lack of skills is a major or severeimpediment than other firms are.
We advance three tentative explanations of why firms do not reportany immediate concerns with the formal education of the workforce.First, it is possible that firms have made the necessary input-mix adjust-ments that are compatible with a low-skills workforce. Second, it is possiblethat the quality of formal training has risen sufficiently to match firmneeds. This would suggest that firm-based training is an adequate substi-tute for poor formal education. Finally, it is possible that other bindingconstraints in the business environment dominate the importance ofschooling. In other words, in an environment of low growth, driven bypoor infrastructure services, we would not expect skills constraints to topfirms’ lists of concerns.
We use data on the average education level of workers to examine theextent to which concerns about skills varies with skill intensity of operation.
Labor Markets and Human Capital 75
Table 4.1 Percent of Firms Reporting Skills Shortage as Major or Severe Constraint
Firm category Manufacturing Retail Services
Small (5–19 employees) 4.1 4.0 2.3Medium (20–99 employees) 11.1 0 0Large (100+ employees) 9.2 33.3 0Nonexporter 6.8 3.3 1.80Exporter 9.6 0 0Domestic 6.8 2.7 1.3Foreign 13.2 10.0 10Weighted average 8.9 3.5 1.4
Source: ICA Survey.

For the next two explanations, we can examine the extent to whichtraining and employment growth affect perceptions of worker schooling.
Firms were asked to report the education level of the typical worker inthe firm. We use these data to examine whether perceptions of skills short-ages are related to average skill intensity of the firm. Table 4.2 shows thepercentage of firms reporting major or severe constraints because of skillsshortages. As average education levels increase, the proportion of firmswith concerns about the availability of skills declines from 10 percent forlow education firms to 6.5 percent for high education firms. These differ-ences in perceptions, however, are not statistically significant, suggestingthe availability of skills is not an important bottleneck.
By looking at training we explore the extent to which concerns aboutlow levels of skills correspond to adequate responses by the firms. Table 4.3shows the proportion of firms that report being constrained by inadequateworker schooling, by training and above-median growth.
Table 4.3 demonstrates that complaints about inadequately schooledworkers are not associated with whether the firm provides training orwhether the firm had an annual employment growth above 7.7 percent.This is consistent with the fact that inadequate worker education is lowon firms’ list of constraints.
76 An Assessment of the Investment Climate in Kenya
Table 4.2 Do Reports of Skills Constraints Vary by Worker Education?
Average education levelPercentage of firms reporting major or severe
impediment as a result of skill shortages
0–3 years 10.004–6 years 8.007–12 years 8.8313 years + 6.49
Note: The estimates shown above are restricted to the manufacturing sector.
Table 4.3 Share of Firms Reporting Skills as a Serious Constraint,by Training and Employment Growth
Yes No
Does firm provide training? 9.87(2.43)
7.38(1.68)
Firm employment growth above median 9.41(2.06)
7.22(1.86)
Note: Standard errors in parentheses. The estimates shown above are restricted to the manufacturing sector. Median employment growth between 2003 and 2006 is 7.7 percent.

Another way of discriminating between some of the previous explana-tions is by examining the number of years of schooling of a typical workerin the typical firm in the manufacturing sector, from an international per-spective.2 Simple comparisons of years of schooling completed couldunder- or overestimate differences in learning achievement given cross-country differences in the quality of a year of education. As Table 4.4shows, the typical worker in Kenya has between 7 and 12 years of school-ing. A total of 68 percent of firms report that their typical worker hasbetween 7 and 12 years of schooling. Although that is lower than the cor-responding estimates in middle-income South Africa, it is higher than inthe other African comparators. A higher proportion of firms report typicaleducation levels of more than 12 years: 17 percent of Kenyan firms reportaverage education levels of more than 12 years of schooling—higher thanin any comparators except Uganda.
An important avenue of human capital deepening is through firm-based training; however, the ability of firms to impart the requisite skillswill depend on a variety of factors that include the extent of firm-leveldemand for skills development, the availability of external training byspecialized firms, and financial and space constraints at the firm level. Weexamine the extent to which firms support skills development throughon-the-job training. We abstract from implicit learning-by-doing (workerexperience) and focus instead on formal on-the-job training programs.
In Kenya, about 41 percent of firms provide training to their workers.Of the firms that provide training, nearly two-thirds of skilled workersand about 50 percent of unskilled workers received training (figure 4.2).
To understand how training can be extended to more workers inKenya, it is useful to identify the correlates and determinants of firm-based training. Figure 4.2 shows the proportion of firms with on-the-jobtraining and the percentage of workers trained across a range of firmcharacteristics. There is a striking size training provision relation: large
Labor Markets and Human Capital 77
Table 4.4 Percentage of Manufacturing Firms Saying That the Average Worker inthe Firm Has Completed Different Levels of Schooling
0–6 years 7–12 years >12 years
Uganda 36 45 18Tanzania 35 57 8Kenya 15 68 17South Africa 10 78 12
Source: ICA surveys. Note: Comparable data are unavailable for China and India.

firms are almost twice as likely to provide training as medium firms. Thelargest firms are three times as likely to provide training as small firms.The proportion of workers trained, skilled and unskilled, does not fol-low the same pattern: in fact, the pattern for skilled workers appearsto be reversed, with the smallest firms training a higher proportion ofskilled workers.
As with firm size, exporting firms and, to a much lesser extent, for-eign-owned firms, are considerably more likely to provide training as arenonexporters and domestically owned firms, respectively. In addition,foreign-owned firms train a higher proportion of unskilled workers thando domestically owned firms. Not all relationships shown in figure 4.2are robust, controlling for other associations. For instance, it is likely thatthe exporting and foreign ownership differences in training arise fromfirm-size differences in each of these two categories. To address that factor,we investigate the correlates of firm-provided training using regressionanalysis. We carry out a firm- and individual-level analysis.
After controlling for a variety of factors, only the firm-size character-istic is significant: a large firm is about 36 percentage points more likelyto provide training than is a small firm. Likewise, a medium firm is about19 percentage points more likely to provide training than a microfirm.
78 An Assessment of the Investment Climate in Kenya
On-the-Job Training
0
10
20
30
40
50
60
70
% o
f fir
ms
80
small (
5–19)
mediu
m (2
0–99)
large (1
00+)
nonexporter
exporter
domesti
c
fore
ign
tota
l
% train % skilled % unskilled
Figure 4.2 Percentage of Firms Providing Training and Percentage of Workers Trained
Source: ICA surveys.
Note: The figure shows percentage of firms that provide firm-based training and the percentage of skilled andunskilled workers that are trained. Only data for manufacturing firms are available.

We also find that firms that are active in human immunodeficiency virus(HIV) prevention or testing of their workers are 13 percentage pointsmore likely to provide training than are other firms. Similar results havebeen observed with respect to training and HIV prevention in othercountries in sub-Saharan Africa (Ramachandran and others 2005). Thisvariable is assumed to measure the degree to which firms are sensitive toturnover of skilled workers and the skill intensity of production.
An examination of training at the individual worker level suggests thatformal schooling is an important complement of firm- and individual-financed training. An extra year of formal schooling is associated with a 3to 5 percentage point increase in the likelihood of receiving training (bothfirm- and self-financed). Further, we find evidence of a negative gendergap in firm-provided training: female workers are nearly 5 percentagepoints less likely to receive firm-based training. Union workers are morelikely to receive firm-based training.
It is instructive to evaluate the extent of training provision from aninternational perspective. Manufacturing firms in Kenya lag behind thecomparator countries with respect to on-the-job training (table 4.5).Slightly more than two of five firms provide training in Kenya, comparedwith more than 70 percent of firms in China and more than 60 percentin South Africa. Only India and Uganda have a slightly lower share offirms that provide training.
Conditional on providing training, firms in Kenya compare morefavorably, falling in the middle of the distribution of all comparatorcountries with respect to the proportion of the workforce that is trained.The data used in this table, however, cannot determine the quality of thetraining provided.
Labor Markets and Human Capital 79
Table 4.5 Firm-Based Training: Prevalence and Percentage of Workers Trained,Manufacturing Sector
CountryPercentage firms offering training
Percentage productionworkers trained
Percentage nonproduction workers trained
India 16 7 6Uganda 32 61 28Kenya 2007 41 66 50Tanzania 42 69 31Kenya 2003 48 — —South Africa 64 45 47China 72 48 25
Source: ICA surveys.

A comparison of the 2003 and 2007 samples suggests that the provisionof firm-based training has not changed over time. In 2007 the percentageof firms that provided training was 45.6; in 2003 it was 44.2 percent. Thedifference is not statistically significant, suggesting that skills developmentdoes not appear to have changed much among formal, established firms.
Labor Regulations
Labor regulations govern the terms under which firms hire, utilize, and fireworkers. These terms include remuneration guidelines, leave and overtimepolicies, and separation policies. We investigate the extent to which thisregulatory regime is an impediment to firm operation in Kenya. Unlikeconcerns about the quality of the workforce, labor regulations are a mod-erate impediment to firm operation and growth. A total of 16.3 percent offirms in manufacturing find labor regulations to be a severe or major con-straint to growth and operation (figure 4.3). The corresponding proportionin the retail and services sectors is less than 3 percent.
As figure 4.3 shows, labor regulations constitute a modest obstacle tothe operation of firms in Kenya. In fact, this is in the bottom 5 constraintsof the 17 bottlenecks presented. From an international perspective, Kenya
80 An Assessment of the Investment Climate in Kenya
1
6.7
11.414.3 14.5
16.3
20.722.5
32.9
0
% o
f fir
ms
10
20
30
40
Uganda 2006
Tanzania
Thailand
India
Malaysia
Kenya 2007Chin
a
Kenya 2003
South A
frica
Figure 4.3 Percentage of Manufacturing Firms Reporting Labor Regulations Are a Serious Problem—International Comparison
Source: ICA surveys.
Note: In all countries presented, the figure shows percentage of firms that report that labor regulation is a majoror severe constraint to firm operation.

registers an intermediate proportion of firms that are constrained by laborregulations. Crucially, Kenya is behind both of its East African neighborson this matter: only 7 percent of firms in Tanzania and 1 percent inUganda complain about labor regulations. The graph shows that laborregulations are considerably more constraining in South Africa andMauritius than in East Africa.
The trend in firms’ concerns about labor regulations has been moder-ately downward. Nearly 22 percent of the panel sample in 2003 foundlabor regulations to be a major or severe constraint, compared with 15.9percent in 2007.
Firms were asked to report an elasticity of employment with respect totwo aspects of labor regulations: hiring and firing workers. Firms wereasked whether they would hire or fire more workers if the regulations gov-erning both aspects were removed. In all, 2 percent of firms reported thatlabor regulations had affected hiring decisions, nearly 4 percent of firmsreport that regulations had affected their firing decisions, and 5 percent offirms had both firing and hiring constrained by labor regulations. In all,only 11 percent of firms report being constrained by labor regulations. Thecorresponding proportion of firms in the retail and services sectors is lessthan 2 percent. In general, the regulatory regime governing the hiring,remuneration, and firing of workers in Kenya appears reasonable to firmsin all three sectors.
That finding is consistent with other evidence. The Doing Businessreport collects detailed information on how labor regulations affect hiring,firing, and rigidity of employment. On the basis of these regulations, thereport calculates objective measures that assess how strict labor regulationis in the country. Kenya is ranked 68th of 165 countries surveyed in 2006.This ranking is considerably higher than that of all the middle-incomecomparators and much lower than Tanzania’s (figure 4.4).
Wages
Assuming uniform worker productivity across countries, the level ofwages paid to workers would determine the competitiveness of the man-ufacturing sector in Kenya. The wage level and its growth trajectory isparticularly important given that Kenya has been engaged in a 10-yearstrategy of attracting foreign direct investment. Given the advantages of alow regulatory burden and a relatively well-educated workforce (withrespect to the region), it is important that wage levels remain competitiveto support an attractive low-cost production environment. Rising wages
Labor Markets and Human Capital 81

that are not commensurate with productivity gains are likely to result inthe flight of foreign direct investment to more favorable destinations andgreater competitive pressure from imports.
Cross-Country ComparisonsThis section compares median wages paid to various worker categorieswith wages in comparator countries. These comparisons do not accountfor differences in human capital or the sectoral composition of manufac-turing in the comparator countries. Figure 4.5 shows the median monthlywage in U.S. dollars paid to production workers.
The median monthly wage for a full-time permanent productionworker in Kenya is $116.3 Wages in Kenya are generally higher than inother East African comparators. For example, median monthly compen-sation in Kenya is about 30 percent higher than in Tanzania and Uganda.Median production wages in Kenya are a small fraction of median pay inSouth Africa.
A comparison with the economies that dominate global manufacturingis telling. Kenyan wages are higher than wages in China and India. The typ-ical Indian production worker earns about 60 percent of the Kenyanworker’s wage, and a corresponding Chinese worker earns about 80 percentof the Kenyan production worker’s median monthly earnings. Given thatthe aggregate numbers above conceal differences in sample composition,we restrict the analysis to the food and garment sectors for each of our
82 An Assessment of the Investment Climate in Kenya
8
3846
64 6878
87
112
143
0
25
50
75
100
125
150
175
Uganda
Malaysia
Thailand
Maurit
ius
Kenya
China
South A
frica
India
Tanzania
ran
kin
g a
mo
ng
175
co
un
trie
s
Figure 4.4 Country Rankings According to Strictness of Labor Regulations
Source: Doing Business.

comparators. Figure 4.6 presents the results of such an analysis. Again, theordering of median monthly wages is unchanged. Focusing on the garmentsector, the median monthly wage paid in Kenya is nearly twice the wagepaid in Tanzania. Median wages in Uganda, China, and India are about 70percent of wages in Kenya.
In addition, we include a comparison between median wages (in2005$) in the 2003 manufacturing sample. The previous estimates showthat median wages in 2007 are virtually unchanged from the 2003 levels.
Comparisons across Firms in KenyaTable 4.6 provides tentative evidence that very large firms pay medianwages for production workers that are about 20 percent higher than thewages of small firms. Econometric analysis confirms that estimate.Although firm-level data show weak results, after controlling for individ-ual worker characteristics results from worker-level regressions providestronger evidence of this link: a worker earns more in a larger firm.
Foreign-owned firms pay about 20 percent more for nonproductionworkers than do domestically owned firms. Exporters pay about 30 percentmore for nonproduction workers compared with nonexporters. Thesedifferences in remuneration policy for nonproduction workers are
Labor Markets and Human Capital 83
8452
85116 118
783
71 89
0
100
200
300
400
500
600
700
800
Uganda
Tanzania 2002
Tanzania 2005
Kenya 2007
Kenya 2003
South A
frica
India
China
US$
Figure 4.5 Median Monthly Wages for Production Workers—International Comparison, Manufacturing Sector
Source: ICA surveys.
Note: The figure shows median monthly wages in constant 2005 US$. Deflators and exchange rates are from theWorld Bank, World Development Indicators.

statistically significant. Apparent differences in pay for productionworkers by ownership and export status are not statistically significant.
Firms with access to external credit do not appear to pay higher wagesthan firms without access to external credit, after controlling for otherfactors. Furthermore, we find that firms that use an external auditor donot pay more or less than nonexternally audited firms.
84 An Assessment of the Investment Climate in Kenya
53 7067 73 95
212
0
100
200
300
400
US$
500
600
700
800
Tanzania
Uganda
China
India
Kenya
South A
frica
food garments
Figure 4.6 Median Monthly Wages in Food and Garment Sectors—International Comparison
Source: ICA surveys.
Note: The figure shows median monthly wages in constant 2005 US$. Deflators and exchange rates are from theWorld Bank, World Development Indicators.
Table 4.6 Median Monthly Wages by Occupation (2005 US$)
Firm category Production workers Nonproduction workers
Small (<20) 93 150Medium (20–99) 116 205Large (100+) 116 231Nonexporter 104 173Exporter 116 231Domestic 104 185Foreign 116 220Employment growth below median 116 231Employment growth above median 110 173Total 116 202
Note: All wages are converted to 2005 dollars using the exchange rate from the World Development Indicators.

Firms that provide training to workers pay higher wages to bothproduction and nonproduction workers. This is consistent with humancapital theory: the worker and the firm share gains in productivityresulting from training.
There is little evidence to support the idea that collective bargaining hasa large impact on wage rates. Firms with higher unionization rates do notappear to pay higher wages to production workers than firms with lowerrates, and union members do not appear to receive higher wages than otherworkers do, after controlling for other variables that might affect wages.
Unionization rates are not very high in Kenya. Among the comparatorcountries, only Tanzania, China, and the middle-income economies havehigher unionization rates. A total of 31.3 percent of workers in Kenya’smanufacturing sector are members of a union. Unionization rates areeven lower in the retail sector (7.4 percent) and the services sector (7.3percent). Unionization rates are higher in larger firms. About 41 percentof workers in large manufacturing firms are unionized, compared withless than 17 percent in small firms.
Worker characteristics have a strong effect on wages. An extra year ofschooling increases earnings by about 7 percent to 9 percent—on the highend of the distribution of returns to schooling found in developing coun-tries. Returns to an extra year of schooling average only 4 percent inUganda. High returns to worker experience are also documented. As wasestablished previously, returns to an extra year in the labor market arepositive at the beginning of a worker’s career and negative toward the endof the career. An additional year of experience increases wages by about3 percent to 4 percent at the beginning of the career. There is no evidenceof gender discrimination, holding constant worker attributes. Surprisingly,we find that workers who are union members earn nearly 25 percent lessthan nonunionized workers. The size of this effect declines as we includeworker characteristics, suggesting worker-firm matching as a possibleexplanation for this finding. Workers who obtained their job through thenetwork earn significantly less than workers hired through more formalchannels. Finally, we find that firm size is a still significant factor in deter-mining worker earnings.
Absenteeism
Workers miss an average of a half-day per month because of their ownillness and a further half-day per month because of illness in the family.Figure 4.7 shows the comparison in worker absenteeism across Uganda,
Labor Markets and Human Capital 85
Tanzania, and South Africa. The typical worker misses fewer days inKenya compared with the rest of East Africa, but more than in SouthAfrica. Using the estimates for South Africa as a reasonable standard, afirm in Kenya loses about eight days a year because of worker absen-teeism. That is equivalent to just under 3 percent of working time in acalendar year.4
One-fifth of firms asked in the survey reported that worker absenteeismhad increased because of illness. Across sectors, there was minimal varia-tion in the prevalence of illness-related worker absence, with 22 percent offirms in the manufacturing sector, 15 percent in retail, and 19 percent inthe services sector. When asked specifically about HIV-related workerabsence, an even smaller proportion of firms reported experiencing anuptick in worker absence. Overall, 5.5 percent of firms reported anincrease in worker absence, with the manufacturing sector leading withnearly 7 percent of firms compared with 3.7 percent and 3.2 percent inthe services and retail sectors, respectively.
Notes
1. Similar results are obtained if we use the panel portion of our sample.
2. Education data were not collected in the retail and services sectors.
86 An Assessment of the Investment Climate in Kenya
0
0.2
0.4
0.6
0.8
1
1.2
ownillness
familyillness
ownillness
familyillness
ownillness
familyillness
ownillness
familyillness
South AfricaKenyaTanzaniaUganda
day
s ab
sen
t in
pas
t 30
day
s
male female total
Figure 4.7 Workers’ Absenteeism, Number of Days in Past 30 Days, Manufacturing Sector
Source: ICA surveys.
Note: The figure shows the average number of days that a worker reports having been away from work becauseof own illness or illness in the family during the past 30 days.

3. For several reasons cross-country comparisons of wages using median wages forfull-time permanent production workers can be different from comparisonsusing average labor costs from the firm’s financial statements. One notable dif-ference between the two measures is that labor costs from the firm’s financialstatements include wages for nonproduction workers, managers, and profession-als. Many other factors can also affect results, including the ratio of productionto nonproduction workers, ratios of skilled to unskilled production workers, dif-ferences in average (relative to median) education levels, differences in ratios offull-time and part-time workers, and differences in ratios of permanent andtemporary workers.
4. This assumes a working calendar of just under 250 days.
Labor Markets and Human Capital 87


The Kenya ICA survey included a separate survey of microenterprises,those with fewer than five employees. It is estimated that more than 80percent of manufacturing employment in Kenya is generated by firms inthat sector. Understanding the characteristics of the sector, its impedimentsto growth, and its reasons for choosing to remain informal is essential forthe government to design appropriate policies that will encourage firms tobecome formal, stimulate industrial growth, and reduce the current dual-ism in the industrial sector.
Registration Characteristics
A total of 124 microfirms were surveyed in Kenya. Of these 52 percentwere located in Nairobi, and 16 percent around each of the other cities:Mombasa, Nakuru, and Kisumu. Most firms surveyed were in the manu-facturing sector (74.2 percent); others were in the construction, retail,and service sectors. Most firms (75 percent) were sole proprietorships;others were partnerships.
On the basis of the information collected, the microenterprises sur-veyed can be subdivided into those that have any formal registration andthose that do not. Firms are classified as “registered” if they have done atleast one of the following:
Microenterprises in Kenya
89
C H A P T E R 5
• Registered name with the Office of the Registrar or other governmentinstitutions responsible for approving company names
• Registered with the Office of the Registrar, the local courts, or othergovernment institutions responsible for commercial registration
• Obtained an operating or trade license or otherwise registered for ageneral business license with any municipal agency
• Obtained a tax identification number from the tax administration orother agency responsible for tax registration
In our microenterprise survey, we see that of the 124 firms surveyedin this group, 58 percent have a municipal license, less than 40 percenthave a commercial license, only 28 percent have their company nameregistered, and only 27 percent are registered for tax purposes. Thosethat are registered for tax purposes have most other registrations also. Inall subsequent analysis, these are defined as “formal” microenterprises.Firms select themselves to register and formalize operations: we exam-ine the characteristics of this group versus those that choose informality(e.g., not registered for tax purposes), to identify key factors that governthose choices. As discussed in the microenterprise literature, firms maychoose to formalize to gain greater access to the formal financial systemand to avail themselves of public infrastructure facilities and other gov-ernment services. They do so also to avoid the burden of tax evasion andnoncompliance. However, firms that choose to remain informal are likelyto do so when the costs of being formal and adhering to all the regulatoryand tax laws are greater than the benefits provided by formality. Theymay also remain informal if they simply do not have the knowledgerequired to formalize.
Benefits of Formality: Access to Finance and Land
Firms were asked to rank various areas of the investment climate todetermine which constraints present the largest obstacles to enterpriseoperations. These rankings are presented in figure 5.1, disaggregated byformal versus informal status.
From figure 5.1, we see that more than 80 percent of informalmicroenterprises rank access to finance to be a major constraint, comparedwith 55 percent of formal micros. Similarly, access to land is ranked as amajor constraint by 33 percent of informal firms against less than 15 percentof formal micros. Do these differences in rankings reflect differential accessto the formal financial sector by registered firms?
90 An Assessment of the Investment Climate in Kenya

Microenterprises, both formal and informal, rely significantly more oninternal funds and retained earnings to finance their working capital andinvestment than do firms in the formal sector. On average, microfirmsfinance about 78 percent of working capital and 85 percent of new invest-ment with retained earnings, compared with 61 percent and 68 percentfor formal businesses. Unsurprisingly, bank financing accounts for only 3.8percent and 5.1 percent of microfirms’ working capital and new invest-ment needs compared with 10.9 percent and 23.3 percent for establish-ments in the formal sector (Figure 5.2). This is likely explained by the factthat trade credit-producing relationships are long-lasting relationships andmicrofirms are generally very young or face a high probability of closure,which potentially discourages the provision of supplier credit.
As figure 5.3 demonstrates, good account keeping is essential forobtaining access to the banking sector, particularly for borrowing.Approximately 40 percent of formal microfirms report auditedaccounts, compared with a negligible number of informal micros. Mostformal micros have access to deposit accounts, whereas less than 30percent of informal micros have that access. The distinction is evengreater for borrowing—more than 40 percent of formal micros haveloans or a line of credit, compared with only about 10 percent of infor-mal microfirms. This suggests a potentially large and positive effect offormalization on access to credit. On the one hand, microfirms thatengage in some formal activities might generate better information onwhich banks can lend. Alternatively, semiformality likely signals ameasure of unobserved firm quality or the desire to formalize. Informal
Microenterprises in Kenya 91
908070605040302010
0
transp
ort
access
to fin
ance
electrici
ty
tax administratio
n
business
licensin
gcri
me
anticompetit
ive...
custo
ms and tr
ade...
tax rate
macro in
stabilit
y
telecommunica
tions
corru
ption
politica
l insta
bility
court
syste
m
labor regulatio
ns
access
to la
nd
skille
d worker s
hortage
informal formal
Figure 5.1 Business Constraints: Percent Ranking Problem to Be Major or Severe
Source: ICA survey.

92 An Assessment of the Investment Climate in Kenya
Financing New Investment
0
10
20
30
40
50
60
70
80
90
100
total
Sources of Working Capital
% o
f fir
ms
% o
f fir
ms
0
10
20
30
40
50
60
70
80
90
100
small(5–19)
medium(20–99)
large(100+)
totalsmall(5–19)
medium(20–99)
large(100+)
internal funds private banks trade credit other
internal funds private banks trade credit other
Figure 5.2 Percentage of Firms Using Various Sources to Finance New Investmentand Obtain Working Capital, by Firm Size
Source: ICA surveys.

firms, on the other hand, prefer not to engage in any level of formalityand consequently are not bankable.
We examine this issue by estimating the probability of having a depositaccount and the probability of having a current loan. After controlling fora number of factors such as entrepreneur education, previous experience,land ownership, and registration status, we see that university-educatedentrepreneurs are more likely than others to have bank accounts and loans,ceteris paribus. Registration status matters, after controlling for entrepre-neur skills. Formal firms are much more likely to have a bank account andloans, indicating either some requirement within the banking sector orsome self-selection out of the banking sector by informal firms.
Access to land is also ranked as a bigger problem by informal firms,compared with formal microenterprises. Most microfirms, both informaland formal, do not own land. Only 13 percent of microfirms do, com-pared with 40 percent of enterprises in the formal sector. Contrary towhat we would expect, however, four times as many informal firms (36percent) own land than do formal firms (9 percent). Nevertheless, theydo not have access to the banking system. Hence, the issue of registrationis more important than being able to provide collateral. In addition, asshown in the finance chapter, the major constraint to access to finance formicrofirms is the complexity of the application procedure.
Costs of Formality: Taxes, Burden of Inspections, and Business Licensing
When examining the ranking of constraints across firm types, we see thatbesides problems pertaining to electricity and transport (which affect
Microenterprises in Kenya 93
80
70
60
50
40
30
20
10
0pct with audited
accounts
pct with depositaccounts
pct with currentloan
informal micro formal micro
% o
f mic
rofir
ms
Figure 5.3 Microenterprise Financial Characteristics
Source: ICA survey.

firms in both the formal and informal manufacturing sectors and arediscussed in detail in the business climate chapter), formally registeredmicrofirms find the burden of tax administration and regulatoryrequirements to be a major constraint.
One of the main benefits of informality is the ability to avoid taxation.The survey data confirm that presumption. In Kenya, informal firmsdeclare only 20 percent of their sales, compared with more than 80 per-cent declared by formal microfirms. What is unique is that the spread ishighest in Kenya, indicating that this tax obstacle could drive the choiceof informality (figure 5.4). That explains why informal firms do notreport the tax burden as the top reason for not choosing formality. Forthem, the main reason is the minimum capital requirement and the costsof registration.
However, apart from obvious areas such as tax administration,1 thereis no significant difference between formal and informal microfirms withregard to the reasons for choosing informality. Although the data showsome variations across firms, the financial burden of registration and tax-ation plus the minimum capital requirements are the main reasons thatfirms do not choose formality (figure 5.5). Not surprisingly, regressionanalysis shows that only the administrative burden of complying with alltax laws appears as a significantly more important burden for formalmicrofirms than for informal microfirms.
Microfirms are more easily subjected to harassment by tax officials.Although microfirms are visited as frequently as formal firms—close to80 percent of microfirms report having been visited by tax officials lastyear—the difference between visits to formal and informal micros isstriking. Firms that have chosen informality are visited once every three
94 An Assessment of the Investment Climate in Kenya
80
90
70
60
50
40
30
20
100
Botswana
% of income
Kenya Namibia Tanzania Uganda
informal formal
Figure 5.4 Percentage of Income Reported for Tax Purposes: Microenterprises
Source: ICA survey.

to four days by tax officials,2 compared with formal microfirms, which arevisited once every three to four months (figure 5.6). That is much higherthan in any comparator country. In many instances, microfirms reportcorresponding expectations of bribes—36 percent of those that reportinspector visits say that a bribe was expected at the time of the visit.Again, there is a big difference between formal and informal firms. Formal
Microenterprises in Kenya 95
strict labor marker rules
adm. burdens (e.g., inspections)
adm. burden of complying with tax laws
financial burden of taxes
minimum captial requirements
cost of registration procedures
time to complete registration
0 10 20 30% of micro firms
40 50 60
difficulty of getting information
formal informal
Figure 5.5 Perceived Reasons for Choosing Informality
120
num
bero
f vis
its
100
80
60
40
20
Botswana Kenya Namibia Tanzania Uganda0
informal formal
Figure 5.6 Median Number of Visits/Required Meetings with Tax Officials per Year
Source: ICA survey.
Source: ICA survey.

microfirms reported being asked for bribes 15 percent of the time,whereas informal firms reported being asked almost three times as often(44 percent). More generally, informal firms are more subject to bribes.They pay 1 percent of sales more in illegal payments to get things donecompared with formal microfirms.
Notes
1. Since informal firms do not deal with tax administration they would naturallynot rate it as a problem.
2. The mean values are even higher for Kenya: 141 visits for informal firms, 33for formal firms. Firm interviewers reported that typically informalmicrofirms were visited by inspectors to obtain free access to firm services,such as a free meal.
96 An Assessment of the Investment Climate in Kenya

This report identifies the main constraints to private sector developmentin Kenya on the basis of a survey conducted in 2007 of approximately650 formal firms in four locations in the country. Perception and objec-tive indicators confirm that tax rates, finance, and corruption remain thethree most important impediments. Electricity and transport are identi-fied by Kenyan managers as the main infrastructure constraints; securityand licensing are reported as constraints as well. To address these bottle-necks, we propose the following recommendations.
Recommendations
97
C H A P T E R 6

1. Taxes High taxes are the most reported bottleneck in
Kenya. Objective indicators of fiscal pressuresuggest that the tax burden in Kenya remainshigher than in most comparator countries. If alltaxes and fees are considered, Kenyan firms arestill required to pay half their corporate incomein taxes, an overall amount that is much higherthan in the other African comparator countries.
• Kenya has recently reduced the tax ratescorporations face. The most importantreforms in corporate income taxes havefocused mainly on lowering rates in efforts tocombat global competition. Rates have beenreduced from a peak of 45 percent in 1990 toabout 30 percent today.
• Conduct an in-depth study of the effectivemarginal rate of taxation to determine theextent of excessive taxation across differentsectors, also taking into account rebates andfiscal incentives.
2. FinanceAlthough we observed a decline in the
proportion of firms constrained by access tofinance since 2003—from 75 percent to 36percent—access to credit is significantly moredifficult for smaller firms. A total of 90 percentof microenterprises and 60 percent of smallfirms declare they need loans, compared with40 percent of medium and large firms. Hence,firm size is an important determinant of accessto credit. Among microenterprises, only 3percent have access to an overdraft facilitycompared with 66 percent among mediumand large enterprises. Similarly, only 27 percentof small firms report having any creditproducts, compared with 55 percent ofmedium and large firms. Together with
• Regulations for private credit bureauoperators were published in the July 11,2008, gazette and the Central Bank ispreparing to license the first operator(s)—supported by the bank’s Financial and LegalSector technical assistance project. In parallel,the International Finance Corporation (IFC) isworking with the Kenya Bankers Associationon ensuring effective participation of banksin the new credit bureau(s).
• A reform program for the companies’registers has been developed and is beingimplemented by the Registrar General,supported by the Bank’s Financial and LegalSector technical assistance project.
• Focus on land registration and transfer issueshas intensified following the 2007 elections.
• Enhance credit information infrastructure.With the new regulations to be issued by theCentral Bank of Kenya, support will be givento enabling private bureaus to operate inKenya. Several international and localcompanies are reporting keen interest inapplying for the license once regulations areissued. IFC is providing assistance to theKenya Bankers Association with the code ofconduct and strategy for bank participationin private bureaus.
• Upgrade corporate registries, collateralregistries, and public record systems. Thescope of the financial informationinfrastructure should include efficient accessto corporate information, registries of securedlending charges, court records, and so on.
98
Problem Action Taken Recommendations
Policy Matrix

collateral requirements, the applicationprocess itself is also considered a majorproblem by both micro- and small firms.
• Computerize the property registration process,and simplify taxes and fees. Efficient landregistries and the ability to easily perfect andtransfer land titles are important vehicles toprovide property owners with access to collateralized financing. Backlog and paper-based records necessitate that all history of transactions relevant to the property be checked every time.
• Promotion of new products is beingundertaken by the private sector—as in therevolution in m-banking created bySafaricom’s M-Pesa and Equity Bank’s vastincrease in client outreach. New productdevelopment has also been supported bythe UK Department for InternationalDevelopment/World Bank FinancialDeepening Trust in areas such as weatherinsurance, warehouse receipts, and paymentssystem innovation.
• Capacity building is being supported by theBank’s Micro, Small, and Medium Enterprise(MSME) project, which promotes lending tosmall and medium enterprises (SMEs) andbusiness development services.
• Promote the application of innovative productsand technology to expand access to finance.Capacity building for banks and microfinanceinstitutions in the use of different lendingtechnologies, secured lending, leasing,mortgage finance and, in the longer run, thepromotion of new products such as warehousereceipts or weather insurance is likely to have alarge impact on financial depths.
• To promote improved access by smallbusinesses to the products and services ofcommercial banks, facilitate the provision ofcapacity building for small businesses to betterunderstand the requirements of banks (how toapproach banks for business loans and how touse bank services) and prepare them for arelationship with a commercial bank. The
(continued)99

• Kenya’s Financial Sector Deepening program(FSD Kenya) is supporting the Central Bank indeveloping improved disclosure of bankinterest rates and fees to all consumers toencourage stronger competition in financialmarkets so that the benefits from increasingproductivity and efficiency in the bankingsector give rise to benefits in pricing amongconsumers. Very preliminary indicationssuggest that price-based competition isleading to downward pressure on prices.
training would be organized in collaborationwith local business development trainingservice providers and training institutes andshould be sponsored by local banks.
• Increase transparency in regard to interest ratesand noninterest charges and fees (such asnegotiation, commitment, legal, evaluation,processing, and insurance) on checking andcurrent accounts.
• Establish a clear timetable for the creation of acredit bureau.
• Facilitate capacity building for banks todevelop and market new products.
3. CorruptionAlthough the ranking of corruption has improved
during the past four years, Kenyan firms stillplace it among the most important constraintsto their business. Nearly 70 percent of firms thatreported corruption as a binding constraintranked it as a top constraint. Corruption takesmany different forms, from making paymentsfor utility hookups to informal payments inpublic procurement. In general, three-fourths offirms in Kenya reported having to make informal
• The government of Kenya (GoK) now postson the ministries’ Web sites all information oncontracts, including names of contractors,decisions of the Procurement Appeals Board,bidders and tender outcomes, andcontractors’ performance. Contracts above 5million shillings are posted on the Web sitehosted at Treasury. Plans are at an advancedstage for local hosting at Public ProcurementOversight Authority
• Conduct an in-depth study of corruption in thecountry
• Give prosecutorial power to the Anti-Corruption Authority, and publicize better thesuccessful anticorruption cases
• Tax administration: continue reforms aimed at– Minimizing human contact between
taxpayer and officials and making theprocess more transparent by relying heavilyon information technology to file taxreturns
100
Problem Action Taken Recommendations
Policy Matrix

payments to “get things done” with rules andregulations. This costs Kenyan firmsapproximately 4 percent of annual sales. TheEnterprise Survey data allow us to identify themany aspects of a business that createopportunity for illegal payments. For instance,Kenyan firms are required to pay approximately12 percent of the value of a public contract asinformal payments. One-third of surveyed firmsreported being subjects of informal paymentrequests from tax inspectors visiting them. Thatis high by international standards. Licensingrepresents yet another opportunity for informalpayments to be made. When dealing withlicenses, Kenyan firms are requested to makeinformal payments approximately one-fourth ofthe time. Furthermore, one particular aspect ofcorruption that seems to be unique to Kenya isthe common practice of the police requestingpayments from trucks in transit. Finally, the shareof managers concerned about the functioningof the courts—of those that actually usedthem—rises to 33 percent, on a par with crimeand tax administration.
• GoK is proposing to blacklist companiesfound to have been involved in cases ofcorruption in accordance with the newprocurement law. No requests for blacklistinghave been received so far from any of theprocuring entities.
• GoK is taking steps to accelerateimplementation of a more coordinated andprioritized e-government initiative, withpublic access to procurement as one of thehighest near-term priorities.
• GoK is taking steps to establish mobilevisiting courts in sparsely populated areas.Visiting courts at Mpekotoni, Archers Post,Wamba, Loitokitok, Dadaab, Kakuma, andMarimanti have been upgraded to full-fledged courts.
• GoK is taking steps to incorporate alternativedispute resolution mechanisms and provisionof legal aid schemes. The Rules Committee isconsidering experiences learned during astudy tour, with a view toward creating apilot project in the Milimani CommercialCourt.
• GoK is taking steps to launch comprehensivewireless-based public information hubs in
– Establishing independent internal andexternal audits
– Introducing organizational changes of theRevenue Authority: incentives for highperformers, sanctions for corrupt behavior,career development, and competitive salaries
• Public procurement: continue reforms aimed at– Reviewing procurement rules with the goal
of simplifying tender documents, reducingthe minimum value of a contract for singlesource, and introducing anticorruption laws,performance standards, and sanctions
– Improving transparency in public-privateinteractions through e-procurement,publication of tender documents andtenders received, and public participation innegotiations
– Introducing a vetting system (conducted byinternational firm, possibly with involvementof civil society) to prequalify companiesinterested in bidding for governmentcontracts to address conflict of interests andfraudulent companies
(continued)101

districts and constituencies, with publicaccess to government a high priority.
• Restructuring and privatization of TelkonKenya is ongoing.
– Establishing an independent tender evaluationand auditing and monitoring unit rates
– Supporting a greater level of integrity andprofessionalism among multinationals anddomestic companies through professionalassociations, codes of conduct, monitoringand benchmarking, and integrity pacts
• Police– Have observers join the trucks to monitor
requests for bribes. Use recording systems tomonitor traveling time and illegal behavior.
– Establish computerized checkpoints to makethe process more transparent and quickerwith the least possible interaction betweentruck drivers and police officials. Educatingtruck drivers about the automated systemwill also reduce the harassment they face.
– Install an electronic weighing station. – Involve associations engaged in trucking
operations in sensitizing truck drivers tocomply with the rules and regulations.
– Establish an independent police complaintscommission entrusted with following up onthe implementation of the reform program.
– Reduce the discretionary power of police.
102
Problem Action Taken Recommendations
Policy Matrix

– Conduct effective educational campaigns oftraffic rules to reduce ability of police toextort bribes.
• Utilities– Complete the liberalization of fixed-line
telephony.– Privatize some forms of service delivery
(utility hookups).– Use citizen report cards to assess the
performance and quality of services andmonitor progress. Publish progress reportsperiodically, based on customer surveys andtimely audits.
4. ElectricityClose to 80 percent of firms in Kenya experience
losses because of power interruptions. This isthe highest percentage of all comparatorcountries. Consequently, almost 70 percent offirms have generators, which are costly toobtain and operate. Power disruption costsKenyan firms approximately 7 percent of sales.In a cross-country comparison, these losses areamong the highest.
• Since June 2006, KPLC has been managed byan international management servicescontractor.
• KPLC made a profit in FY2005/06 andFY2006/07. During FY2007/08, KPLC’sperformance has continued to improve—forexample, network losses were reduced. As ofmid-2008, the government was providing anontargeted subsidy to electricity consumersof K Sh 0.60 per kilowatt-hour.
• The conversion of the Electricity RegulatoryBoard to the Energy Regulatory Commissionon July 7, 2007, was an important step in the
• Increase public investment in energygeneration, transmission, and distribution toincrease connectivity.
• Encourage increased private financing andinvestment in the energy sector—today, theprivate sector accounts for 12 percent of thepower supply.
• Establish clear rules for private generators’ “openaccess” to the transmission network, the conceptof which was established in the Energy Policy.
• Ensure that electricity pricing maintains thefinancial viability of power companies, whileprotecting the most vulnerable consumers.
(continued)103
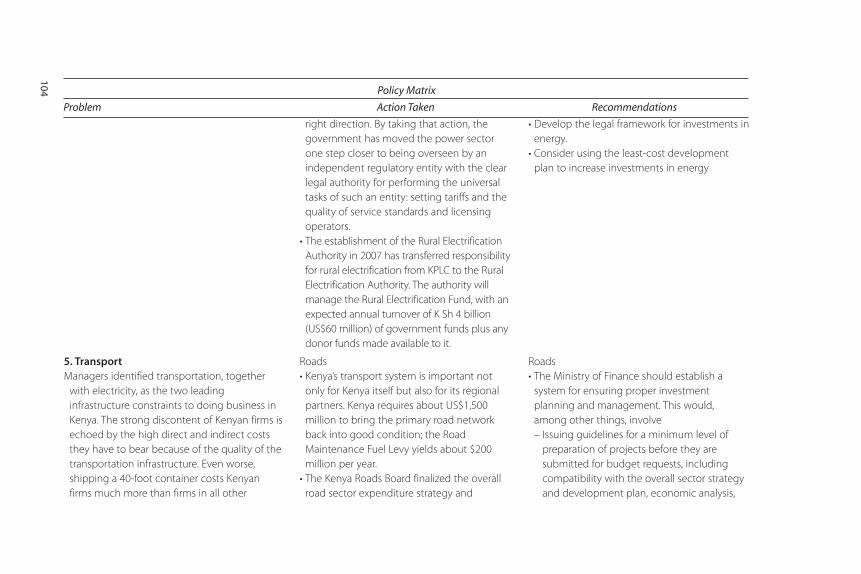
right direction. By taking that action, thegovernment has moved the power sectorone step closer to being overseen by anindependent regulatory entity with the clearlegal authority for performing the universaltasks of such an entity: setting tariffs and thequality of service standards and licensingoperators.
• The establishment of the Rural ElectrificationAuthority in 2007 has transferred responsibilityfor rural electrification from KPLC to the RuralElectrification Authority. The authority willmanage the Rural Electrification Fund, with anexpected annual turnover of K Sh 4 billion(US$60 million) of government funds plus anydonor funds made available to it.
• Develop the legal framework for investments inenergy.
• Consider using the least-cost developmentplan to increase investments in energy
5. TransportManagers identified transportation, together
with electricity, as the two leadinginfrastructure constraints to doing business inKenya. The strong discontent of Kenyan firms isechoed by the high direct and indirect coststhey have to bear because of the quality of thetransportation infrastructure. Even worse,shipping a 40-foot container costs Kenyanfirms much more than firms in all other
Roads• Kenya’s transport system is important not
only for Kenya itself but also for its regionalpartners. Kenya requires about US$1,500million to bring the primary road networkback into good condition; the RoadMaintenance Fuel Levy yields about $200million per year.
• The Kenya Roads Board finalized the overallroad sector expenditure strategy and
Roads• The Ministry of Finance should establish a
system for ensuring proper investmentplanning and management. This would,among other things, involve– Issuing guidelines for a minimum level of
preparation of projects before they aresubmitted for budget requests, includingcompatibility with the overall sector strategyand development plan, economic analysis,
104
Problem Action Taken Recommendations
Policy Matrix

comparator countries, except Uganda.Unfortunately, when we look at indirect costsKenya does not perform any better. Kenyancompanies lose 2.6 percent of their sales tospoilage and theft during transportation. Thatis the highest percentage of all comparatorcountries.
investment plan, but that now awaitsgovernmental adoption.
• To efficiently manage the entire road networkin Kenya, the government passed the KenyaRoads Act and has established three roadsauthorities, namely, the Kenya NationalHighways Authority, Kenya Rural RoadsAuthority, and the Kenya Urban RoadsAuthority.
• The chair and members of the board of thethree authorities have been appointed, andthe authorities will become operational assoon as the three CEOs and senior staff areappointed. The government has also adopteda detailed road sector policy and strategypaper that will form the basis for futureprograms and reforms in the sector.
• The Ministry of Roads has drafted a policypaper on the involvement of the privatesector in the management of truck weighstations and axle load control.
Aviation• The Kenya Airports Authority and the Kenya
Civil Aviation Authority have been givenfinancial autonomy and now retain therevenue generated from their operations,
confirmation of having prepared detaileddesigns based on field investigations and therequired bidding documents, and readinessfor implementation
– Strengthening the institutional structure forimplementing the guidelines. A special unitcould be set up to screen projects submittedfor budget funds. Such a unit would have aclose working relationship with the Medium-Term Expenditure Framework and BankSupervision Department units in the Ministryof Finance and would be the repository of amultiyear rolling investment programcontaining an inventory of appraised andpriority-ranked projects for budgetaryconsideration in the future.
• Ongoing reforms in the roads sector should beexpedited. That would involve– Expediting the operationalization of the Kenya
National Highways Authority, the Rural RoadsAuthority, and the Urban Roads Authority
– Strengthening the residual Ministry of Roadsto perform its overall policy, planning, andcoordination role
– Promoting the use of long-term output andperformance-based contracting or
(continued)105

which had been previously remitted to theTreasury.
• The responsibility for passenger, baggage,and mail security screening at the airportshas been transferred from the police to theKenya Airports Authority, allowing for bettermonitoring, control, and training of securitystaff.
• The regulations for safety and security havebeen harmonized and adopted by all fourmember countries of the East AfricanCommunity.
concessioning for maintenance andmanagement of the major road network bythe private sector, starting with theNorthern Corridor
• The government should improve governancein the road sector:– Strengthen the Engineers’ RegistrationBoard, and empower it further to disciplineand sanction engineers and firms whoperform poorly and violate its charter withregard to professional conduct and ethics.The same would be true for the Associationof Consulting Engineers.– Assist the construction industry in
establishing a professional body forconstruction contractors (nationalconstruction council or a contractors’registration board), and strengthen it toengage in self-regulation.
– Develop a comprehensive constructionindustry development policy, and establisha dedicated construction industrydevelopment board to implement thepolicy to enhance the performance of theconstruction industry.
106
Problem Action Taken Recommendations
Policy Matrix

– Ensure regular updating of contractors’qualifications and capacity, facilitate trainingin different aspects of construction andsupervision techniques, and reprimand poorperformance.
– Approve policy on private sectorparticipation in the management of weighstations and control of axle load regulations.
• Improve the public transportation system.• Facilitate more private involvement in
transport.Port and Maritime• Expedite conversion of Kenya Ports Authority
to a landlord authority.• Concession the Mombasa container
terminal(s), the dockyard and marine services,and the bulk oil terminals.
• Streamline cargo clearance procedures, andremove the police escort system for transitcargo by road (except for hazardous andmilitary supplies).
• Introduce risk-based targeting for cargoinspection and verification.
• Implement a harmonized customs clearancesystem and one-stop border posts inaccordance with COMESA protocols.
(continued)107
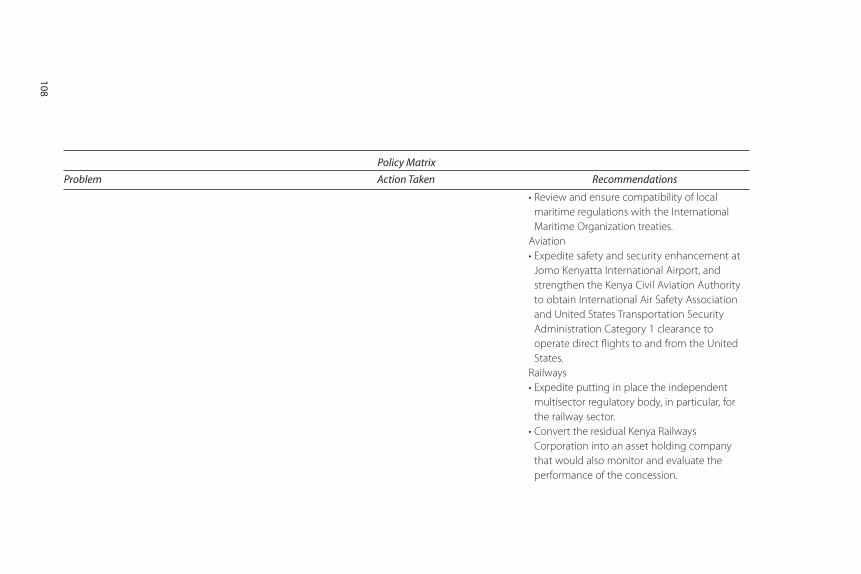
• Review and ensure compatibility of localmaritime regulations with the InternationalMaritime Organization treaties.
Aviation• Expedite safety and security enhancement at
Jomo Kenyatta International Airport, andstrengthen the Kenya Civil Aviation Authorityto obtain International Air Safety Associationand United States Transportation SecurityAdministration Category 1 clearance tooperate direct flights to and from the UnitedStates.
Railways• Expedite putting in place the independent
multisector regulatory body, in particular, forthe railway sector.
• Convert the residual Kenya RailwaysCorporation into an asset holding companythat would also monitor and evaluate theperformance of the concession.
108
Problem Action Taken Recommendations
Policy Matrix
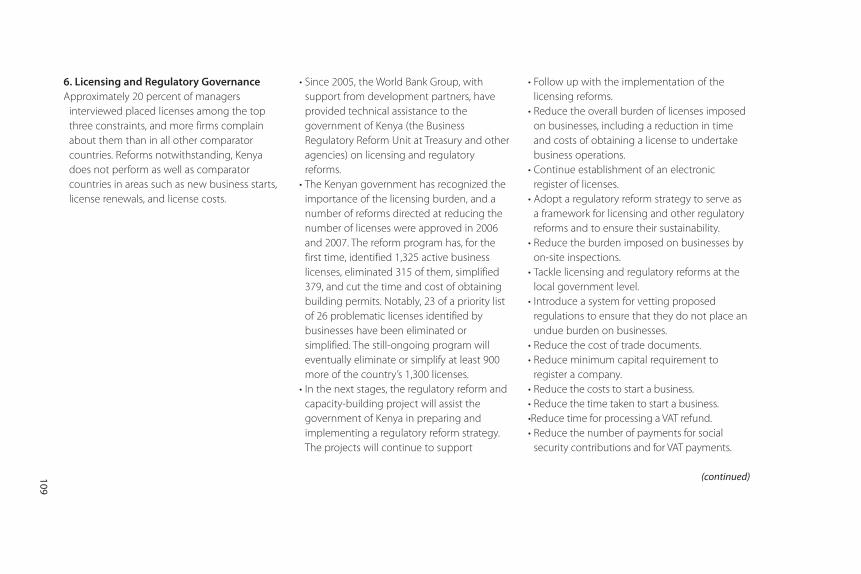
6. Licensing and Regulatory GovernanceApproximately 20 percent of managers
interviewed placed licenses among the topthree constraints, and more firms complainabout them than in all other comparatorcountries. Reforms notwithstanding, Kenyadoes not perform as well as comparatorcountries in areas such as new business starts,license renewals, and license costs.
• Since 2005, the World Bank Group, withsupport from development partners, haveprovided technical assistance to thegovernment of Kenya (the BusinessRegulatory Reform Unit at Treasury and otheragencies) on licensing and regulatoryreforms.
• The Kenyan government has recognized theimportance of the licensing burden, and anumber of reforms directed at reducing thenumber of licenses were approved in 2006and 2007. The reform program has, for thefirst time, identified 1,325 active businesslicenses, eliminated 315 of them, simplified379, and cut the time and cost of obtainingbuilding permits. Notably, 23 of a priority listof 26 problematic licenses identified bybusinesses have been eliminated orsimplified. The still-ongoing program willeventually eliminate or simplify at least 900more of the country’s 1,300 licenses.
• In the next stages, the regulatory reform andcapacity-building project will assist thegovernment of Kenya in preparing andimplementing a regulatory reform strategy.The projects will continue to support
• Follow up with the implementation of thelicensing reforms.
• Reduce the overall burden of licenses imposedon businesses, including a reduction in timeand costs of obtaining a license to undertakebusiness operations.
• Continue establishment of an electronicregister of licenses.
• Adopt a regulatory reform strategy to serve asa framework for licensing and other regulatoryreforms and to ensure their sustainability.
• Reduce the burden imposed on businesses byon-site inspections.
• Tackle licensing and regulatory reforms at thelocal government level.
• Introduce a system for vetting proposedregulations to ensure that they do not place anundue burden on businesses.
• Reduce the cost of trade documents.• Reduce minimum capital requirement to
register a company.• Reduce the costs to start a business.• Reduce the time taken to start a business.•Reduce time for processing a VAT refund.• Reduce the number of payments for social
security contributions and for VAT payments.
(continued)109
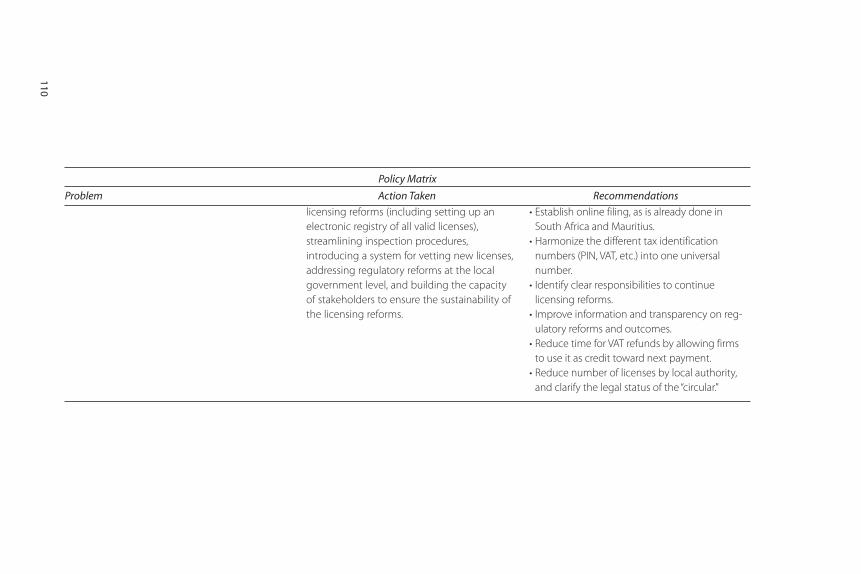
licensing reforms (including setting up anelectronic registry of all valid licenses),streamlining inspection procedures,introducing a system for vetting new licenses,addressing regulatory reforms at the localgovernment level, and building the capacityof stakeholders to ensure the sustainability ofthe licensing reforms.
• Establish online filing, as is already done inSouth Africa and Mauritius.
• Harmonize the different tax identificationnumbers (PIN, VAT, etc.) into one universalnumber.
• Identify clear responsibilities to continue licensing reforms.
• Improve information and transparency on reg-ulatory reforms and outcomes.
• Reduce time for VAT refunds by allowing firmsto use it as credit toward next payment.
• Reduce number of licenses by local authority,and clarify the legal status of the “circular.”
110
Problem Action Taken Recommendations
Policy Matrix

Enterprise Survey in Kenya: Sample Design
The World Bank’s 2007 Enterprise Survey in Kenya was administered to781 firms in four locations. Appendix Table 1 shows the sample distribu-tion across cities and sectors. The sampling approach used was stratifiedsimple random sampling for the formal economy and simple randomsampling for the microfirms. Close to 60 percent of the formal sample isrepresented by manufacturing firms, within which food and beverages(17 percent), garments (12 percent), and other manufacturing (31 per-cent) represent individual strata. Outside the manufacturing sector, theretail sector accounts for 19 percent of the sample, and fewer than one-quarter of the firms belong to the rest of the services stratum.
In regard to geographical distribution, the capital city has the highestnumber of firms (60 percent) in the sample; the rest is distributed acrossthe other three locations, Mombasa, Nakuru, and Kisumu. Finally, 124microfirms (with four employees or fewer) are also included in the sam-ple. They are about equally split between Nairobi and the rest of thecountry.1
Technical Appendix
111

Note
1. Note that the sample was not stratified by size. The appendix in the full ICAreport includes a detailed description of the sampling methodology followed.
112 Technical Appendix
Table A.1 Sample Distribution in Kenya, by Sector and Location
Nairobi Mombasa Nakuru Kisumu Total
Manufacturing 274 51 34 37 396Food and beverages 73 13 8 16 110Garments 62 13 2 5 82Other manufacturing 139 25 24 16 204Retail 59 16 26 25 126Rest of the services 69 20 22 24 135Total—formal 402 87 82 86 657Micro (4 employees or
fewer) 64 20 20 20 124Total 466 107 102 106 781
Source: ICA Survey.

Adda, Jerome, and Russell Cooper. 2003. Dynamic Economics. QuantitativeMethods and Applications. Cambridge, MA, and London, England: MIT Press.
Arvis, J.F., et al. 2007. Connecting to People: Trade Logistics in the Global Economy.World Bank, Washington, DC.
Bigsten, Arne, and Måns Söderbom. 2006. “What Have We Learned from aDecade of Manufacturing Enterprise Surveys in Africa?” World Bank ResearchObserver 21 (2): 241–65.
Bigsten, Arne, Paul Collier, Stefan Dercon, Marcel Fafchamps, Bernard Gauthier,Jan Willem Gunning, Abena Oduro, Remco Oostendorp, Catherine Pattillo,Måns Söderbom, Francis Teal, and Albert Zeufack. 2004. “Do AfricanManufacturing Firms Learn from Exporting?” Journal of Development Studies40 (3): 115–41.
Campos, J. Edgardo, and Sanjay Pradhan. 2007. “The Many Faces of Corruption:Tracking Vulnerabilities at the Sector Level.” The World Bank, Washington,DC, April.
Economic Survey. Various Years. Kenya Central Bureau of Statistics.
Escribano, Alvaro, and J. Luis Guasch. 2005. “Assessing the Impact of theInvestment Climate on Productivity Using Firm-Level Data: Methodologyand the Cases of Guatemala, Honduras, and Nicaragua.” Policy ResearchWorking Paper 3621. The World Bank, Washington, DC.
113
References

FSD Kenya (Financial Sector Deepening Kenya). www.fsdkenya.org/finaccess.
Government of Kenya. Various Years. “Economic Survey.” Central Bureau ofStatistics.
Government of Kenya. Various years. “Statistical Abstract.” Central Bureau ofStatistics.
Hausmann, Ricardo, Jason Hwang, and Dani Rodrik. 2005. “What You ExportMatters.” Working Paper 11905. NBER (National Bureau of EconomicResearch), Cambridge, MA. December.
IMF (International Monetary Fund). Various years “International FinancialStatistics.” Online database.
IMF (International Monetary Fund). 2007. “Kenya—Staff Report for the 2006Article IV Consultation, Second Review Under the Poverty Reduction andGrowth Facility Arrangement, and Request for Extension and Rephasing ofthe Arrangement, Reduction in Access and Waiver of Performance Criteria.”IMF, African Department. March 13.
Klinger, Bailey, and Daniel Lederman. 2004. “Discovery and Development: AnEmpirical Exploration of ‘New’ Products.” Policy Research Working Paper3450. The World Bank, Washington, DC. November.
MDRA (Marketing and Development Research Associates). 2006. “A Report on Corruption in the Trucking Operation in India.” MDRA. New Delhi.September.
Ndung’u, Njuguna. Survey on bank charges and lending rates in Kenya. CentralBank of Kenya 2007.
The New York Times. Toiling in the Dark: Africa’s Power Crises (June 29, 2007).On-Line Article.
Ramachandran, V., Manju Shah, and Ginger Turner. 2005. Does the Private SectorCare about AIDS? Evidence from Investment Climate Surveys in East Africa.World Bank, Washington, DC.
Söderbom, Måns, and Francis Teal. 2000. “Skills, Investment and Exports fromManufacturing Firms in Africa.” Journal of Development Studies 37 (2): 13–43.
Söderbom, Måns, and Francis Teal. 2003. “Are Manufacturing Exports the Key toEconomic Success in Africa?” Journal of African Economies 12 (1): 1–29.
Speaking notes of Prof. Njuguna Ndung’u, governor of the Central Bank of Kenya,at the launch of the survey on bank charges and lending rates. Nairobi. August28, 2007.
World Bank. 2008 Kenya: Accelerating and Sustaining Inclusive GrowthWashington, DC.
World Bank. 2008. Africa Development Indicators 2007. Washington, DC: WorldBank.
114 References

World Bank and UNCTAD (United Nations Conference on Trade andDevelopment). Various years. “World Integrated Trade Solution (WITS).”COMTRADE database, maintained by the United Nations StatisticalDivision.
World Bank Group. Various years. Doing Business. Washington, DC: World Bank.
World Bank. Various years. “World Development Indicators Database.” WorldBank, Washington, DC.
Reference 115


A
absenteeism, 85–86, 86faudits, 63, 91aviation, 8, 105t–106t
B
bank credit, 60bank disclosure, 100tbank financing, 61–62, 62f, 91, 92fborrowing costs, 59, 59f, 62, 63fBotswana, 17, 17f, 94f, 95fbribes, 25t, 27f, 31, 96
licenses, 34frecommendations, 101tto tax inspectors, 32, 33futility hookups, 34, 34f
business, 46–47, 48f. See also firmscrime costs, 3–4, 45starting, 51, 53ftime and cost of closing, 36f
business environment, 2, 17. See alsoconstraints
major obstacles, 19, 20t, 21t
C
capacity building, 99t–100t, 109tChina, 24t, 41f
borrowing costs and loan duration, 63fbribes in public procurement, 32fcollateral requirements, 64fcorruption, 30f, 31fcourt costs and closing a business, 36fcrime, 45f, 46f, 47fcustoms’ costs, 44findirect costs, 27flabor, 14f, 80f, 82fobtaining a license and dealing with
regulations, 52fobtaining an electrical connection, 40fsales lost due to power outages, 37f, 40fsales lost in transit, 43fskills shortage, 74fstarting a business, 53ftax visits, 49ftaxes, 28f, 29f, 50funit labor costs, 15, 15fwages for food and garment sectors, 84fworker training, 79t
Index
117
Figures, notes, and tables are indicated by f, n, and t, respectively.

citizen report cards, 6collateral, 64, 64f, 67t, 70collective bargaining, 85constraints, 2–3, 21, 90–91. See also
corruptionchanging perceptions of, 22–23country comparison, 23, 24tcrime, 44–47, 45felectricity and transport, 4finance access, 57, 65labor, 73–74, 80–81, 82fmajor business environment obstacles,
19, 20tranked by labor growth and
productivity, 22franking of, 21t, 91frated by manufacturing firms, 23trecommendations for, 5–9, 97taxes, 22, 94–96
corruption, 3, 29–37international comparison, 24tlicensing, 32, 34f, 50, 101tperceptions index, 30police payments for transport, 6, 34, 42,
101t, 102trating by country, 31frecommendations, 5–6, 100t–103t
courts, 24t, 101tcosts, 35, 36fperceptions of, 34–35, 35f
credit access, 91, 93and firm size, 65–67, 66f, 67t
credit information infrastructure recommendations, 98t
credit line, 68t, 70tcrime, 3–4, 22, 44–47, 45f
country comparison of costs, 24t, 46f, 47findirect costs, 25t, 26t, 27f
customs, 24t, 44, 44f
D
debt financing, 62
E
economic instability, international comparison, 24t
Economic Recovery Strategy, 1economy, 11education, 73–74, 93
country comparison, 24t, 77, 77telectricity, 4, 22. See also power outages
indirect costs, 25t, 26t, 27f
international comparison, 24tobtaining connection, 39, 40frecommendations for, 7, 103t–104treliability and shortages of, 35–37, 39
Electricity Regulatory Board, 103t–104tEnterprise Survey, sample design and
approach, 115, 116texports, top constraints to, 20t
F
finance access, 57–58, 65, 66and cost of, 5, 57, 71neducation level impacts, 93international comparison, 24tproblem and recommendations,
98t–100tfinancial products, promotion of, 99tFinancial Sector Deepening program, 100tfinancing demand, 64financing options, 60financing sources for working capital, 61f,
62f, 91and investment, 92ffirm-firm, 61
firms, 16–17. See also business; manufacturing firms; microfirms
audits and information quality, 63–64business environment complaints, 19,
20tconstraint ranking, 91fconstraints affecting high performers, 21credit access, 60
and firm size, 3, 65–67, 66ffinance access, 57, 59, 65financing working capital, 61–62, 61f
and investment, 92fhigh perceptions of corruption,
30, 30findirect costs’ impact varies, 24, 25tlabor and education, 73–76, 75t, 76tlabor regulations, 80–81, 80fland access, 93licensing and permit complaints, 51flicensing requests, 33, 33flosses due to crime, 44–45, 45flosses due to unreliable electricity, 37f,
39productivity, reasons why lower, 17skills shortage perceptions, 76taxation as biggest business obstacle, 27time spent dealing with regulations, 51,
52f
118 Index

training, 77, 78, 78fand inadequate education, 75, 76
wage comparisons, 83–85formalization, 4, 89–90
costs of, 93–96finance and land access, 90–91, 93reasons not to, 94, 95f
G
generator ownership, 36, 37, 38t, 39tGhana, 28f, 29f, 31f, 36fgross domestic product (GDP) growth
trends, 12fgrowth diagnostics approach, 12
H
HIV, and firm-based training, 79
I
illness-related absenteeism, 85–86, 86fincome reporting, 94, 94fIndia, 24t, 41f
borrowing costs and loan duration, 63fbribes in public procurement, 32fcollateral requirements, 64fcorruption, 30f, 31fcourt costs and closing a business, 36fcrime, 45f, 46f, 47fcustoms’ costs, 44ffinancing sources, 61f, 62findirect costs, 27flabor, 14f, 80f, 82fobtaining a license and dealing with
regulations, 52fobtaining an electrical connection, 40fpower outages and use of generators, 39tsales lost due to power outages, 37f, 40fsales lost in transit, 43fskills shortage, 74fstarting a business, 53ftax visits, 49ftaxes, 28f, 29f, 50funit labor costs, 15, 15fwages for food and garment sectors, 84fworker training, 79t
indicators, objective, 2indirect costs, 23, 24
due to crime, 45international comparison, 27ftransport, 41
informal payments. See bribes
informality, and bribery, 96informality, reasons for, 29, 94, 95finfrastructure services, constraint
to business, 22interest rates, 62, 67tinventory holdings higher, 41, 41fInvestment Climate Assessment (ICA),
1–2, 12–13, 16
L
labor, 22f, 73–74costs, 14–15, 15fproductivity, 13–14, 14f, 22fregulations, 24t, 80–81
labor tax, 29fland access, 24t, 93licensing, 4, 90
and permits, 49–54, 51fbribe opportunities, 32, 34f, 101tcorruption, 8–9, 50–51facilitators, 54–55, 54finternational comparison, 24tobtaining, 52fproblem and recommendations,
109t–110trenewal, 51–53, 53frequests, 33, 33f
loan applications and rejections, 69–71, 69tloan costs, 59, 59floan duration, 63f, 65, 67tloan products, characteristics of, 68–69, 68tloans, reasons for not applying, 70tlogistics gap, 39
M
Malaysia, labor regulations, 80f, 82fmanufacturing firms, 41, 41f, 60
business constraints, 19, 20tfinance access, 57–58, 58ffinancing sources, 61findirect costs by constraint, 26tlag in on-the-job training, 79, 79trating of constraints, 23tskills shortage country comparison, 74ftax constraints, 22, 48
Mauritius, labor regulations, 82fmicrofirms, 70, 71n
benefits of formality, 90–91credit access, 3, 60, 66, 66ffinance access, 57–58, 58f, 90–91financial characteristics, 92fincome reporting, 94f
Index 119

land access, 90–91, 93loan applications, 70registration, 89–90working capital financing, 91
murders, 44
N
Namibia, 17, 17f, 94f, 95f
O
objective indicators, 2overdraft product, 66
P
police corruption, 6, 34, 42, 101t, 102tport and maritime recommendations,
107t–108tpower outages, 37, 37f, 40f
country comparison, 39tfrequency and duration, 38tproblem and recommendations, 103t
Private Sector Development Strategy, 1private sector, driving economic growth,
11, 12fprocurement, 6, 32, 32f, 100t–101tproduction costs and losses, 37f, 39, 46profit tax, 29, 29fproperty registration process, 99t
R
railways, 8, 108trecord keeping, 91registration, 4, 89–90, 98tregulatory governance, 80–81, 82f, 94–96
recommendations, 8–9, 109t–110tretail firms, 19, 20troads, recommendations, 7–8, 104t–106tRural Electrification Authority, 104t
S
sales lost in transit, 42, 43fsecurity, 3–4, 25t, 26t
services, 46, 47fSenegal, 24t, 41f
borrowing costs and loan duration, 63fbribes in public procurement, 32fcollateral requirements, 64fcorruption, 30f, 31fcourt costs and closing a business, 36fcrime, 45f, 46f, 47f
customs’ costs, 44ffinancing sources, 61f, 62findirect costs, 27fobtaining a license and dealing with
regulations, 52fobtaining an electrical connection, 40fpower outages and use of generators, 39tsales lost due to power outages, 37f, 40fstarting a business, 53ftaxes, 29f, 50fTFP, 17f
shipping costs. See transport costsskilled workers, shortage of, 74South Africa, 24t, 41f, 77t
borrowing costs and loan duration, 63fbribes in public procurement, 32fcollateral requirements, 64fcorruption, 30f, 31fcourt costs and closing a business, 36fcrime, 45f, 46f, 47ffinancing sources, 61f, 62findirect costs, 27flabor regulations, 80f, 82fobtaining a license and dealing with
regulations, 52fobtaining an electrical connection, 40fpower outages and use of generators, 39tsales lost due to power outages, 37f, 40fsales lost in transit, 43fskills shortage, 74fstarting a business, 53ftax visits, 49ftaxes, 28f, 29f, 50fTFP, 17fwages for food and garment sectors, 84fworker training, 79t
supply chain problems, 41
T
Tanzania, 24t, 41fborrowing costs and loan duration, 63fbribes in public procurement, 32fcollateral requirements, 64fcorruption, 30f, 31fcourt costs and closing a business, 36fcrime, 45f, 46f, 47fcustoms’ costs, 44feducation levels, 77tfinancing sources, 61f, 62fincome reporting of microfirms, 94findirect costs, 27flabor, 14f, 80f, 82f
120 Index

obtaining a license and dealing with regulations, 52f
obtaining an electrical connection, 40tpower outages and use of generators, 39tsales lost due to power outages, 37f, 40fsales lost in transit, 43fskills shortage, 74fstarting a business, 53ftax visits, 49f, 95ftaxes, 28f, 29f, 50fTFP, 17funit labor costs, 15fwages for food and garment sectors, 84fworker training, 79t
tax administration, 4, 48–49, 94international comparison, 24treforms, 100t–101t
tax inspectors, bribery of, 32, 33ftax payments and time to complete forms,
50ftax rate, 2–3, 22, 26–27, 29
international comparison, 24ttax reporting, 48–49, 94ftax visits, 48–49, 49f, 94–95, 95f, 96ntaxes, 27, 28f
comparison, 27, 29frecommendations, 5–6, 98t
telecommunications, 22, 24tThailand, labor regulations, 80f, 82ftotal factor productivity (TFP), 15–17, 16,
17ftrade credit financing, 60, 62f, 92ftrade documents preparation costs,
54, 54ftrade regulations, international comparison,
24ttrade, supply chain and inventory
problems, 41training, 76t, 77, 79, 80. See also worker
skillsTransparency International, corruption, 30,
31ftransport, 4, 22, 39–44
bribes to police, 34costs, 26t, 41, 42finternational constraint comparison, 24tlogistics gap, 39losses, 25t
and payments to police, 42by firm characteristics, 43finternational comparison of indirect
costs, 27frecommendations, 7–8, 104t–105t
U
Uganda, 24t, 41f, 94fborrowing costs and loan duration,
63fbribes in public procurement, 32fcollateral requirements, 64fcorruption, 30f, 31fcourt costs and closing a business, 36fcrime, 45f, 46f, 47fcustoms’ costs, 44feducation levels, 77tfinancing sources, 61f, 62findirect costs, 27flabor, 14f, 82fobtaining a license and dealing with
regulations, 52fobtaining an electrical connection, 40fpower outages and use of generators,
39tsales lost due to power outages,
37f, 40fsales lost in transit, 43fskills shortage, 74fstarting a business, 53ftax visits, 49f, 95ftaxes, 28f, 29f, 50fTFP, 17funit labor costs, 15fwages for food and garment sectors,
84fworker training, 79t
unionization, 85unit labor costs, 14–15, 15futilities, 6–7, 34, 34f
V
value-added tax refunds, 49violence, 44
W
wages, 81, 84tcross-country comparison, 82–83,
87nexperience and education impacts, 85firm comparisons, 83–85food and garment sectors, 84f
worker skills, 74–80, 78fworkers, hiring and firing, 81working capital, financing, 60–61, 61f, 91,
92fWorld Bank Group, 109t
Index 121

ECO-AUDIT
Environmental Benefits Statement
The World Bank is committed to preservingendangered forests and natural resources.The Office of the Publisher has chosen toprint An Assessment of the InvestmentClimate in Kenya on recycled paper with30 percent post-consumer waste, in accor-dance with the recommended standards forpaper usage set by the Green Press Initiative,a nonprofit program supporting publishers inusing fiber that is not sourced from endan-gered forests. For more information, visitwww.greenpressinitiative.org.
Saved:• 4 trees• 3 million BTUs of total
energy• 342 lbs. of CO2
equivalent of green-house gases
• 1,421 gallons of waste water
• 183 pounds of solid waste


Although the circumstances in which Kenyan firms must do business have improved since
2004, including an increase in productivity, Kenyan firms still face an adverse business
environment. An Assessment of the Investment Climate in Kenya reports on the main
impediments to productivity growth identified by managers of Kenyan businesses:
• Lack of access to financing. Despite a favorable lending regime, 90 percent of microen-
terprises and 60 percent of small firms in Kenya declared that they needed loans,
compared to 40 percent of medium-sized and large firms.
• Corruption and crime. Seventy-five percent of firms in Kenya reported having to make
informal payments to “get things done.” This sort of corruption costs Kenyan firms
approximately 4 percent of annual sales. In 2007, approximately one-third of Kenyan
managers rated crime as a major business constraint. In addition, Kenyan companies
lose 2.6 percent of their sales because of spoilage and theft during transportation.
• Unreliable infrastructure services. Transportation and energy remain significant
bottlenecks. Close to 80 percent of firms in Kenya experience losses because of power
interruptions. As a consequence, almost 70 percent of firms have generators, which are
costly to obtain and operate.
Managers also complained about taxes. Kenya has reduced corporate tax rates in recent
years, but some objective indicators suggest that the country’s tax burden remains higher
than in most comparator countries. Given the potential impacts of high taxes—high
evasion and the presence of a large informal economic sector—the report recommends
a more detailed assessment of the effective rate of taxation.
An Assessment of the Investment Climate in Kenya recommends specific changes in each of
these areas of constraint, as well as in the areas of transportation and regulatory reform.
The book will be of interest to readers working in business and finance, economic policy,
corporate governance, and poverty reduction.
ISBN 978-0-8213-7812-0
SKU 17812