an assessment of the possibilities for transfer of ... · an assessment of the possibilities for...
TRANSCRIPT

An Assessment of the Possibilities for Transfer of European Biomass Gasification Technology to China
Part 1 by
AV Bridgwater
AACM Beenackers K Sipila
Part 2 by
Yuan Zhenhong Wu Chuangzhi
Sun Li
Page 1
EXECUTIVE SUMMARY
In order to develop bio-energy within the context of the China-EU Energy Working Group (EWG), supported by the EC DGXVII THERMIE Programme, an assessment of the opportunities in China for European biomass gasifier manufacturers has been carried out. Part 1 of this report first sets out the terms of reference for the study followed by a description of the process of gasification and environmental aspects of gasification in order to provide a reference for those less familiar with the technology. A report on the study visit to China follows including particular reference to the two main opportunities identified: A biomass fed village fuel gas system The first opportunity is proposed to be provided by a fixed bed gasifier with a high level of tar cracking or removal. The feed is assorted agricultural waste and wood waste and data is included on waste arisings for a village in the Liaoning Province. Many other similar opportunities exist. Electricity generation from rice husks by gasification or combustion This opportunity is already being met in a few locations by downdraft gasification and engines but improvements in the technology are required, particularly with regard to the environment. This report concludes with a discussion of how the proposals may be progressed and draws attention to the following aspects: • More information is required to adequately define the projects, • The different objectives and provisions of the European Commission and the Chinese
organisations have to be resolved so that there is a common basis for proceeding, this particularly includes financing,
• A mechanism for identifying and encouraging European Companies to take advantage of the opportunities is suggested,
• A number of barriers to implementation are identified which require early resolution such as protection of intellectual property and proprietary rights; establishment of commercial relationships, and identification of local requirements and resources,
These need to be resolved early in the continuing negotiations. The involvement of Chinese research institutes is considered important for the ongoing development of the technology and provision of appropriate expertise. This is one mechanism that provides complementary support to any commercial initiatives and encourages continued collaboration between the EU and China. Part 2 of this report is the contribution to the survey by the Chinese experts together with their response to the request for further information.
Page 2

CONTENTS
1 PROJECT OUTLINE....................................................................................................... 8 1.1 Aims and Objectives.................................................................................................. 8 1.2 Proposed Work Programme ....................................................................................... 8
2 GASIFICATION ............................................................................................................... 9 2.1 Introduction................................................................................................................ 9 2.2 Principles ................................................................................................................... 9 2.3 Gasification Process................................................................................................. 10
2.3.1 Feeding ...................................................................................................... 10 2.3.2 Gasification................................................................................................ 10 2.3.3 Ash removal............................................................................................... 10 2.3.4 Heat recovery............................................................................................. 11 2.3.5 Gas Cleaning ............................................................................................. 11 2.3.6 Power Generation ...................................................................................... 12
2.4 Gasification Technology .......................................................................................... 14 2.4.1 Introduction ............................................................................................... 14 2.4.2 Downdraft.................................................................................................. 14 2.4.3 Updraft....................................................................................................... 15 2.4.4 Fluid bed.................................................................................................... 16 2.4.5 Circulating fluid bed.................................................................................. 17 2.4.6 Entrained bed............................................................................................. 17 2.4.7 Twin fluid bed............................................................................................ 17 2.4.8 Summary.................................................................................................... 18
2.5 Products of Gasification .......................................................................................... 19 2.6 Gas Clean-up ........................................................................................................... 19
2.6.1 Introduction ............................................................................................... 19 2.6.2 Hot gas clean-up for particulates ............................................................... 19 2.6.3 Tar Cracking .............................................................................................. 20 2.6.4 Catalytic Cracking ..................................................................................... 20 2.6.5 Thermal cracking....................................................................................... 21 2.6.6 Tar Removal .............................................................................................. 21 2.6.7 Alkali Metals ............................................................................................. 22 2.6.8 Fuel-Bound Nitrogen................................................................................. 22 2.6.9 Sulphur ...................................................................................................... 22 2.6.10 Chlorine ..................................................................................................... 23 2.6.11 Summary of Clean-up Methods................................................................. 23
2.7 Power Generation Interfacing Requirements........................................................... 23 2.7.1 Definition................................................................................................... 23 2.7.2 Gas Quality Requirements......................................................................... 23 2.7.3 Fuel Specifications and Turbine/Engine Requirements ............................ 25 2.7.4 Fuel Combustion ....................................................................................... 25 2.7.5 Energy Recovery ....................................................................................... 26
3 ENVIRONMENT, HEALTH AND SAFETY ............................................................... 28 3.1 Introduction.............................................................................................................. 28 3.2 Environmental Aspects of Gasification Operations................................................. 28
3.2.1 Dust............................................................................................................ 28 3.2.2 Wastewater and condensables ................................................................... 29 3.2.3 Fly ash and char......................................................................................... 30 3.2.4 Odour problems ......................................................................................... 30 3.2.5 Noise.......................................................................................................... 31
Page 3
3.3 Hazards of Gasifier Operation ................................................................................. 31 3.3.1 Combustible gases and vapours................................................................. 31 3.3.2 Combustible dusts ..................................................................................... 32 3.3.3 Fire risks .................................................................................................... 32 3.3.4 Carbon monoxide poisoning...................................................................... 32 3.3.5 Other toxic compounds.............................................................................. 33 3.3.6 Other hazards............................................................................................. 33
3.4 Conclusions.............................................................................................................. 33
4 VISIT TO CHINA........................................................................................................... 34 4.1 Itinerary.................................................................................................................... 34 4.2 Liaoning State Science and Technology Commission (LSSTC) and
Liaoning Institute of Energy Resources (LIER) ...................................................... 34 4.3 Wood flooring factory near Dalian .......................................................................... 35 4.4 Huoshi Village ......................................................................................................... 36
4.4.1 Waste arisings ............................................................................................ 36 4.4.2 Waste and energy costs.............................................................................. 37 4.4.3 Project product........................................................................................... 37 4.4.4 Discussion and identification of information requirements ...................... 38 4.4.5 Summary of information requirements...................................................... 39
4.5 Guangzhou Institute of Energy Research (Tuesday 16th September 1997)................................................................................................................................. 39 4.5.1 Current gasifier problems - Discussion with GIER................................... 43
4.6 Engine manufacturer................................................................................................ 43 4.7 Rice husk resources ................................................................................................. 44 4.8 Rice husk gasifiers for power generation ................................................................ 44
4.8.1 Gasifiers 1.................................................................................................. 44 4.8.2 Gasifier 2 ................................................................................................... 45
5 IMPLEMENTATION ..................................................................................................... 47 5.1 Feasibility of central production of LHV cooking gas from biomass for
villages..................................................................................................................... 47 5.2 Biomass availability at Huoshi village .................................................................... 47 5.3 State of the art of Chinese technology ..................................................................... 47 5.4 Gas quality specification.......................................................................................... 47 5.5 Opportunities for Projects........................................................................................ 48
5.5.1 Village system............................................................................................ 48 5.5.2 Small scale industrial power generation by gasification ........................... 49 5.5.3 Small scale industrial power generation by gasification ........................... 51
5.6 European technology available................................................................................ 52 5.6.1 Small scale fixed bed gasification ............................................................. 52 5.6.2 Medium scale gasification of rice husks for electricity............................. 53 5.6.3 Medium scale combustion of rice husks for electricity............................. 53
5.7 Recommendations.................................................................................................... 54
6 Further information requirements ................................................................................ 55 6.1 Chinese policies ....................................................................................................... 55 6.2 Technical and market data ....................................................................................... 55 6.3 Huoshi village.......................................................................................................... 55
6.3.1 Feedstocks ................................................................................................. 55 6.3.2 Products ..................................................................................................... 55 6.3.3 Gas distribution ......................................................................................... 56 6.3.4 General questions ...................................................................................... 56 6.3.5 Additional comments and observations..................................................... 56
Page 4
6.4 Questions on rice husk project................................................................................. 56 6.4.1 Feedstocks ................................................................................................. 56 6.4.2 Products ..................................................................................................... 57 6.4.3 Gas distribution ......................................................................................... 57
6.5 Questions to EC DG XVII....................................................................................... 57
7 Further EC-China Interactions ..................................................................................... 58 7.1 China and EU Objectives......................................................................................... 58 7.2 Further actions ......................................................................................................... 58 7.3 Involve European companies................................................................................... 58 7.4 Barriers to implementation ...................................................................................... 58 7.5 Provide assistance to Chinese organisations............................................................ 59 7.6 Continued co-operation ........................................................................................... 59
8 REFERENCES................................................................................................................ 60
PART 2
9 Part A. Background........................................................................................................ 68 9.1 General Information................................................................................................. 68
9.1.1 Population.................................................................................................. 68 9.1.2 National Economy ..................................................................................... 69 9.1.3 Rural Economy.......................................................................................... 70
9.2 Energy Situation ...................................................................................................... 72 9.2.1 Energy Production ..................................................................................... 72 9.2.2 Primary Energy Consumption ................................................................... 73 9.2.3 Energy Balance.......................................................................................... 74 9.2.4 Prediction of Energy Demand ................................................................... 75
9.3 Environment Impact ................................................................................................ 76 9.3.1 Energy Production ..................................................................................... 76 9.3.2 Energy Consumption ................................................................................. 77
10 Part B. Gasifiable Biomass Resources.......................................................................... 80 10.1 Introduction.............................................................................................................. 80
10.1.1 Biomass Energy in the National Energy Structure .................................... 80 10.1.2 Utilization of Biomass Energy .................................................................. 80 10.1.3 New Biomass Energy Technology............................................................. 82 10.1.4 Gasifiable Biomass Resources .................................................................. 83 10.1.5 Crop Residues............................................................................................ 84 10.1.6 Firewood and Forest Residues................................................................... 86
10.2 Industry Wastes........................................................................................................ 88 10.2.1 Municipal Refuses ..................................................................................... 88 10.2.2 Total Amount of Gasifiable Biomass......................................................... 89
10.3 Predictive Analysis of Gasifiable Biomass Resource.............................................. 89 10.3.1 Model design ............................................................................................. 89
10.4 Calculation............................................................................................................... 90 10.4.1 Crop Residues (CRt) .................................................................................. 90 10.4.2 Firewood (FWt) ......................................................................................... 90 10.4.3 Municipal Refuse (MRt) ............................................................................ 91 10.4.4 Industry Wastes (IRt) ................................................................................. 91 10.4.5 Prediction of Biomass’s Consumption ...................................................... 91 10.4.6 Available Biomass for Gasification Use.................................................... 92
11 PART C. Biomass Gasification in China...................................................................... 93 11.1 General..................................................................................................................... 93
11.1.1 Classification of gasification processes..................................................... 93
Page 5
11.1.2 Gasifiers Existing in China........................................................................ 93 11.2 Technical Aspects .................................................................................................... 94
11.2.1 ND gasifier ................................................................................................ 95 11.2.2 XFL Gasifier.............................................................................................. 96 11.2.3 CFBG gasifier............................................................................................ 97
11.3 Analysis of Benefits................................................................................................. 98 11.3.1 ND gasifier used to drying wood............................................................... 98
11.4 XFL gasifier used to providing fuel gas in a village................................................ 99 11.4.1 CFBG gasifier for treating wood wastes in a timber ............................... 100
11.5 Problems ................................................................................................................ 100 11.5.1 Technology .............................................................................................. 100 11.5.2 Resources................................................................................................. 101 11.5.3 Finance .................................................................................................... 101 11.5.4 Policy....................................................................................................... 101 11.5.5 Society ..................................................................................................... 101
11.6 Development in the future ..................................................................................... 101
12 Part D. AnswerS to Further Information Required by EU experts ......................... 103 12.1 Chinese Policies..................................................................................................... 103
12.1.1 Mechanisms for achieving the object of utilizing biomass energy efficiently 103 12.1.2 Popularization of new technologies......................................................... 104 12.1.3 Financial support from government ........................................................ 104 12.1.4 Electricity cost ......................................................................................... 104 12.1.5 Available incentive policies..................................................................... 105
12.2 Technical and market data ..................................................................................... 105 12.2.1 Manufacturers of gasifier ........................................................................ 105 12.2.2 Manufacturers of internal combustion engine ......................................... 105
12.3 Huoshi Village ....................................................................................................... 106 12.3.1 Feedstocks ............................................................................................... 106 12.3.2 Products ................................................................................................... 107 12.3.3 Gas distribution ....................................................................................... 108
12.4 General questions................................................................................................... 108 12.4.1 Additional comments and observations................................................... 109
12.5 Husk Project........................................................................................................... 109 12.5.1 Feedstocks ............................................................................................... 109 12.5.2 Products ................................................................................................... 110 12.5.3 Gas distribution ....................................................................................... 110
13 References .......................................................................................................................111
Page 6

PART 1
REPORT OF MISSION TO CHINA
by
AV Bridgwater, Aston University, Birmingham B4 7ET, UK
AACM Beenackers,
Groningen University, Nyenborgh 4, Groningen NL-9774 AG, Netherlands
K Sipila, VTT Energy, PO Box 1601 – Espoo, FIN-02044 VTT, FINLAND
Page 7

1 PROJECT OUTLINE
1.1 Aims and Objectives
The overall project objective is to collate and analyse data on biomass sources and gasification prospects in China and compare these to the available biomass gasification technologies in Europe in order to define a suitable demonstration project. The project is being carried out in the framework of the China-EU Energy Working Group (EWG) and is supported by the EC DGXVII THERMIE Programme, of which the Project Officer is Dr K Maniatis. 1.2 Proposed Work Programme
China has substantial biomass resources in the form of agricultural residues which are currently used for domestic energy and fuel applications mostly through combustion. This is often, however, inefficient as well as contributing to local pollution from inadequately controlled gaseous emissions. At the same time, there is a severe shortage of fossil fuels. Of the several methods for utilising these residues, thermal gasification is widely considered to be the most effective way of converting the biomass into a gaseous fuel that can be used in a more efficient and less polluting manner. The resultant fuel gas can be used as a fuel gas for cooking, for heating or for electricity production via an engine. There are examples of applications in Europe ranging from technologically innovative pilot plants to demonstration and commercial scale units. In China, there are many examples of commercial small gasification systems which are described later in this report and in the Appendices. The EU and China have formed an Energy Working Group in order to provide a framework for continued co-operation and the joint development of a demonstration project. Agreement was reached early in 1997 to proceed with these plans and, following a feasibility study to be carried out in 1997, will submit a proposal to the THERMIE programme. The work programme is broken down into individual tasks. 1. Carry out a preliminary survey of biomass resources in China; 2. Review the level of development of biomass gasification and power generation
technology in China and in the EU which will include the status of the technology, its suitability for the biomass sources identified, its performance and cost.
3. Study the market demand and possible applications for the main gasification technologies identified in the review in China.
4. Recommend a demonstration project for implementation in China with scope and outline specifications
5. Review the recommendations for a demonstration plant followed by detailed specification of the selected concept.
Page 8

2 GASIFICATION
2.1 Introduction
Biomass gasification has been practiced for over 100 years, but with little commercial impact due to competition from other fuel sources and other energy forms. In the last 20 years, there has been a renewed interest world wide with many instances of substantial demonstration and commercial scale plants. In particular, the last few years have seen a major resurgence of interest in biomass gasification processes mostly due to environmental and political pressures required of CO2 mitigation measures. Very few processes have yet proved economically viable, although the technology has progressed steadily. There is sufficient expertise and knowledge now available to have a high level of confidence in modern gasification processes. The recent interest for environmental reasons has created interest in many organisations who have the resources to thoroughly develop and market suitable technologies that meet these environmental and political requirements. The result has been consolidation of interest at an industrial level and substantial speculative investment in these technologies of the future. 2.2 Principles
Thermochemical gasification is the conversion by partial oxidation at elevated temperature of a carbonaceous feedstock such as biomass or coal into a gaseous energy carrier. This gas contains carbon monoxide, carbon dioxide, hydrogen, methane, trace amounts of higher hydrocarbons such as ethane and ethene, water, nitrogen (if air is used as the oxidising agent) and various contaminants such as small char particles, ash, tars and oils. The partial oxidation can be carried out using air, oxygen, steam or a mixture of these. Air gasification, as proposed for this project, produces a low heating value (LHV) gas (4-7 MJ/Nm3 higher heating value) suitable for boiler, engine and turbine operation but not for pipeline transportation due to its low energy density. Oxygen gasification produces a medium heating value (MHV) gas (10-18 MJ/Nm3 higher heating value) suitable for limited pipeline distribution and as synthesis gas for conversion, for example, to methanol and gasoline. Such a medium heating value gas can also be produced by pyrolytic or steam gasification. Gasification with air is the more widely used technology since there is not the cost or hazard of oxygen production and usage, nor the complexity and cost of multiple reactors. Gasification occurs in a number of sequential steps: • drying to evaporate moisture, • pyrolysis to give gas, vaporised tars or oils and a solid char residue, • gasification or partial oxidation of the solid char, pyrolysis tars and pyrolysis gases. When a solid fuel is heated to 300-500ºC in the absence of an oxidising agent, it pyrolyses to solid char, condensable hydrocarbons or tar, and gases. The relative yields of gas, liquid and char depend mostly on the rate of heating and the final temperature. Generally in gasification, pyrolysis proceeds at a much quicker rate than gasification and the latter is thus the rate controlling step. The gas, liquid and solid products of pyrolysis then react with the oxidising agent - usually air - to give permanent gases of CO, CO2, H2, and lesser quantities of hydrocarbon gases. Char gasification is the interactive combination of several gas-solid and gas-gas reactions in which solid carbon is oxidised to carbon monoxide and carbon dioxide, and hydrogen is generated through the water gas shift reaction. The gas-solid reactions of char oxidation are the slowest
Page 9
and limit the overall rate of the gasification process. Many of the reactions are catalysed by the alkali metals present in wood ash, but still do not reach equilibrium. The gas composition is influenced by many factors such as feed composition, water content, reaction temperature, and the extent of oxidation of the pyrolysis products. Not all the liquid products from the pyrolysis step are completely converted due to the physical or geometrical limitations of the reactor and the chemical limitations of the reactions involved, and these give rise to contaminant tars in the final product gas. Due to the higher temperatures involved in gasification compared to pyrolysis, these tars tend to be refractory and are difficult to remove by thermal, catalytic or physical processes. This aspect of tar cracking / removal in gas clean-up is one of the most important technical uncertainties in implementation of gasification technologies and is discussed below. 2.3 Gasification Process
The complete gasification system or process consists of: Feeding Gasification Ash removal Heat recovery Gas clean-up Water treatment Power generation
These are briefly summarised before the main aspects are described in more detail. 2.3.1 Feeding
Biomass has a number of peculiar properties that must be considered in designing feeding systems which relate to its grain structure. In devising handling and feeding systems where gas tight seals are required, provision must be made for particles to fall away or be swept aside since blockage will result in major physical deformation. This is well known but poorly understood. Pressurised gasifiers are a special and extreme example of this problem. Another problem, particularly with pressure gasifiers is the inert gas requirement which can be considerable from purging feeders due to the high voidage of most bulk biomass. 2.3.2 Gasification
Recent large scale demonstration and commercial biomass gasification plants have focused on fluid beds and circulating fluid beds (CFB) rather than fixed beds (1). This is due to a variety of reasons including scalability, feed specification tolerance, and controllability which all favour fluid bed and CFB gasifiers. A 10 MWe IGCC system for example might require one CFB gasifier, but four fixed bed gasifiers, although the overall costs may be similar. The advantages and disadvantages of the different types of gasifier have been described before and systems that are currently available or are being developed are summarised later. It can be concluded that there are no perceived obstacles to successful demonstration of an advanced biomass gasifier. 2.3.3 Ash removal
The quantity of ash requiring removal and disposal from a biomass gasifier is relatively small at typically 1-2% of the dry feed weight. Removal from the gasifier will vary according to the
Page 10

type of system. Fixed beds will usually have a rotating grate with screw or mechanical discharge from the base of the reactor. Fluid beds may have an overflow arrangement or extraction from the bed as a "bleed", while circulating fluid beds will take a side-stream off from an appropriate place in the circuit. Each process will have its own proprietary system. Reliability is a function of the experience gained by the developer and the mode of ash removal. Secondary and tertiary ash removal will arise from cyclones, hot gas filters and water washing systems. Apart from hot gas filters where little operating experience has been obtained, these are well understood and reliable. 2.3.4 Heat recovery
The product gas will usually be hot, ranging from around 800 C up to 1100 C. It will need to be cooled before a hot gas filter to around 500-600 C, or even lower if water washing is the first gas cleaning step. This provides the opportunity to recover heat as steam for combined cycle operation when up to 10% of the total energy content of the feed might be recovered. Particular care is needed to avoid tar deposition or fouling of the heat exchanger surfaces with ash, char or any other contaminants. Primary raw gas cleaning is thus very important. The specification of the entire heat recovery and gas cleaning train requires careful evaluation and optimisation, and generalisations other than identification of problems is not possible. The most convincing evidence of plausible design is data from extensive operation with a quantitative appreciation of deviations from ideality. 2.3.5 Gas Cleaning
This section of the overall system has received the least exposure to large scale and long term operation. It therefore must be considered the least certain aspect of the system. 2.3.5.1 Tar cracking and Tar removal
There is no clear view as to whether tar cracking or tar removal is preferable, although the current trend is to prefer cracking to minimise potential tar deposition problems and minimise washing water requirements. Although not relevant to the cases considered in this study, it should be noted that pressurised systems rely on high temperatures to maintain tars in the vapour phase to give as hot a gas as possible to the turbine combuster to maximise efficiency. Particulate removal is then by hot gas filtration. Atmospheric pressure systems have fewer constraints from the complexity of high-pressure systems but for turbine applications require the fuel gas to be compressed before combustion, and thus cooling and a high degree of cleaning is required. At least one system advocates the use of both cracking and removal to ensure that a sufficiently clean gas is delivered to the turbine. For engine applications, a clean cold gas is required, but not to the purity requirements of a turbine. Water washing may be adequate depending on the gasifier. 2.3.5.2 Heat recovery
Heat may be recovered from the hot raw gas at several stages. Recovery from the raw gas is described above. Some further heat may be recovered after the hot gas filter but this is lower grade, although for larger plants, a more sophisticated water/steam cycle may be justified on a counter-current principle. Low temperature heat is only worth recovering if there is a good
Page 11
local market for the heat. Careful optimisation of the total heat system is necessary to obtain the high efficiencies promised in combined cycle plants. 2.3.5.3 Hot gas clean-up
Much has been written and assumed about the effectiveness and performance of hot gas filters that cannot be substantiated for biomass based systems. This is probably the least developed aspect of the entire system. There is no long term or large scale operating experience. Claims for effectiveness and the consequences of failure of such devices will require careful evaluation. 2.3.5.4 Water treatment
Water treatment will be required if there is wet washing or if there are any condensates from the process. While it is believed that most organics can be satisfactorily processed in conventional biological filters, there is a paucity of data to support this claim (1). However if there is a water scarcity and intensive internal recycling is used to give more concentrated wastewater, then there is a potential problem with phenols and related compounds. These may require incineration or other disposal. 2.3.6 Power Generation
2.3.6.1 Gas compression
Established turbosets are designed on the assumption that the compressor throughput matches the turbine throughput, with small allowances made for fuel addition in the combustion chambers and air bleeds from the compressor for blade cooling. The low energy density of LHV gases means that the volume of fuel injected will be substantial. In cases where the gasifying medium is taken from the turbine compressor this is not expected to be a problem. However, where the gasifying medium is provided independently there will be a large difference between compressor and turbine throughputs due to the addition of fuel gas which will require redesign of the turboset to match the compressor with the turbine. There is a potential problem when using the turbine compressor to supply the gasifier, whereby loss of output from the gasifier will mean loss of power at the turbine and thus loss of power to the compressor supplying the gasifier. Such a situation could rapidly shutdown the system. Advanced control systems, possibly with auxiliary firing, would be needed to reduce this risk. Alternatively additional and/or oversized compressors can be used. Compressors are well established technology. However, there are uncertainties in this application in the potential mismatch between turbine and compressor, and in the design of an adequate control system. 2.3.6.2 Gas turbine
Gas turbine manufacturers have produced turbines fuelled by LHV gases such as those produced in from steel smelting operations. These tend to be large industrial units. Design work and trials are underway with aeroderivative turbines but there are no reports of commercial applications with LHV gases. Whilst turbine manufacturers are confident that the combustion of LHV gases is technically feasible there remains some uncertainty until this is proven. Some auxiliary fuel capability would be beneficial at start-up and at times when the gasifier is
Page 12
unavailable or product gas output is limited. This would require redesign of fuel burners, which is again assumed to be technically feasible but at the expense of additional design cost and uncertainty with operation of a multifuel combuster. The importance and uncertainty of gas clean-up has been noted above. It should be remembered that turbines of the scale likely to be used for biomass applications are far smaller than the 100 + MWe units usual in natural gas fired or coal-gas fired applications, due to the disperse nature of biomass arisings. This reduced capacity means that turbine components are more susceptible to damage from fuel contaminants as the protective layers are necessarily thinner. This is exacerbated by the high volume of fuel that is required. Turbine reliability is therefore closely related to the effectiveness and reliability of the gas clean-up system. Complete combustion of the fuel may be difficult to achieve which would result in high hydrocarbon emissions. This problem can be solved by increasing the size of the combustion chambers and will add to the design cost of the turbine. Again, the solution is assumed to be technically feasible but unproven. It is generally agreed that thermal NOx emissions are unlikely to be a problem due to low flame temperatures. However fuel-bound nitrogen could cause substantial NOx emissions unless action is taken to remove the nitrogen compounds form the fuel or to remove NOx from the flue gas. 2.3.6.3 Engines
The use of LHV gases such as landfill or digester gas in gas engines is well developed and machines exist that can be used in this application. Their disadvantage lies in the low quality waste heat that is generated as a result of engine cooling and from exhaust gases. This makes application in combined cycle mode unlikely. Operation in co-generation mode is more accepted. Engines also have the advantage that they can be run on a variety of fuels or fuel combinations with relatively minor adjustment. Gas cleaning is very important, though engines are considered to be less sensitive to contaminants than gas turbines. The main uncertainty with engines is an economic one. Electrical efficiencies of engines at the rating required are higher than turbines in simple cycle mode. When turbines are operated in combined cycle or STIG modes then they become much more competitive in terms of electrical efficiency although the systems naturally become more complex and more expensive. Also there is a far greater potential for waste heat in a gas turbine cycle than that in engine cycles. Thus there is some uncertainty about the choice between turbines and engines at the likely scale of a biomass based unit of 5-30 MWe. 2.3.6.4 Steam generation
Steam generation is an established technology and there are few problems associated with it other than the design of the system to make best use of the available waste heat. However, there is still a risk of corrosion if removal of sulphur and chlorine compounds from the product gas is inadequate. The use of steam in combined cycles is established in large scale generating systems. Application at the scale required is technically feasible although it may not be economically viable. Steam production from waste heat from engines is also established although only low pressure steam could be generated.
Page 13
2.4 Gasification Technology
2.4.1 Introduction
A range of reactor configurations have been developed as shown in Table 1. Figures 1 to 3 show the configurations of the more common gasifier types. At the end of this section, Table 2 summarises the key features of each reactor type; Table 3 summarises the other relative advantages and disadvantages of the most common gasifier types; and Table 4 summarises performance data for most gasifier types. Each main type of gasifier configuration is described below with significant features and limitations highlighted. There are several recent reviews of all these gasifiers (2, 3) of which the former is appended. Table 1 Gasification Reactor Types
Fixed bed Mode of contact Downdraft solid moves down, gas moves down. Updraft solid moves down, gas moves up. Co-current solid & gas move in same direction - downdraft. Counter-current solid & gas move in opposite directions - updraft. Cross current solid moves down, gas moves horizontally. Variations stirred bed; two stage gasifier. NB although called Fixed Bed gasifiers, the bed actually moves slowly down the reactor under gravity. Fluid bed Single reactor low gas velocity, inert solid stays in reactor. Fast fluid bed inert solid is elutriated with product gas and recycled. Circulating bed inert solid is elutriated, separated and recirculated. This sometimes also refers
to fast fluid bed or twin reactor systems. Entrained bed usually no inert solid; highest gas velocity of lean phase systems; can be run
as a cyclonic reactor Twin reactor steam gasification and/or pyrolysis occurs in the first reactor; char is
combusted in the second reactor to heat the fluidising medium for re-circulation. Either can be any type of fluid bed, although the combuster is often a bubbling fluid bed.
Moving bed mechanical transport of solid; usually lower temperature processes; Includes: Multiple hearth; Horizontal moving bed; Sloping hearth; Screw / auger kiln.
Other Rotary kiln: good gas-solid contact; careful design needed to avoid solid carry over
Cyclonic and vortex reactors: high particle velocities give high reaction rates
2.4.2 Downdraft
The downdraft gasifier features a co-current flow of gases and solids through a descending packed bed which is supported across a constriction known as a throat where most of the gasification reactions occur (see Figure 2-1). The reaction products are intimately mixed in the turbulent high temperature region around the throat which aids tar cracking. Some tar cracking also occurs below the throat on a residual charcoal bed where the gasification process is completed. This configuration results in a high conversion of pyrolysis intermediates and hence a relatively clean gas. Downdraft gasification is simple, reliable and proven for certain fuels, such as relatively dry
Page 14
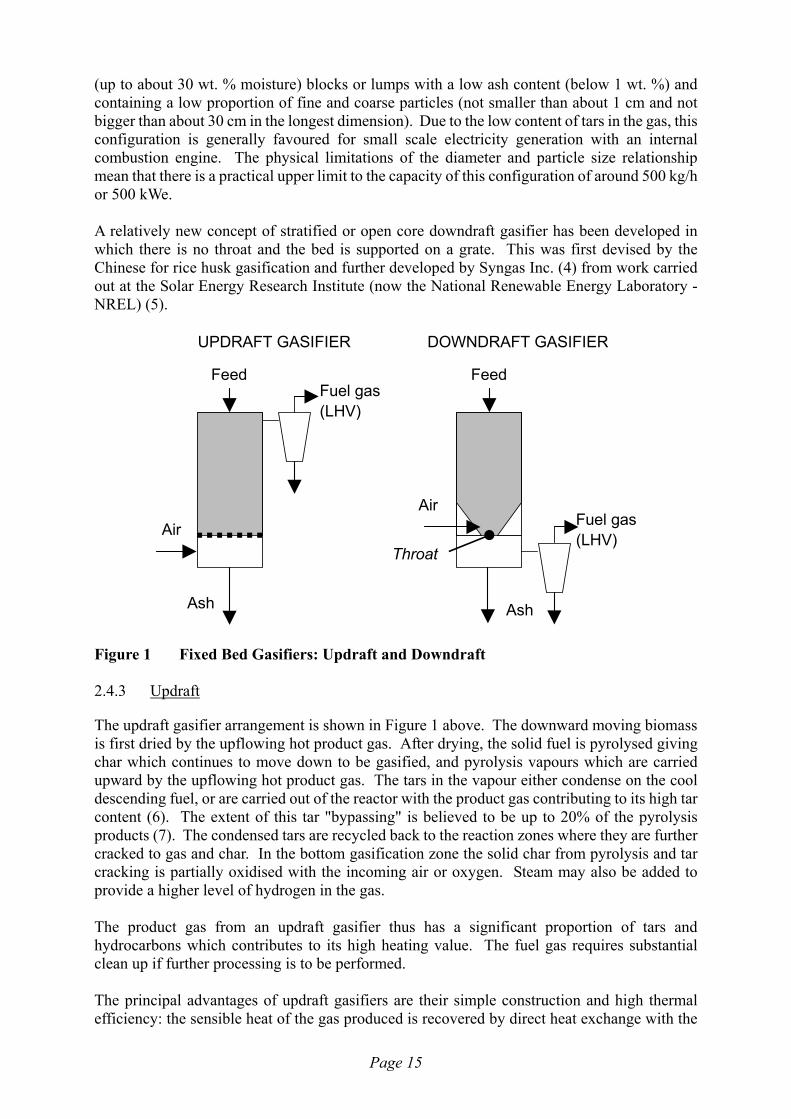
(up to about 30 wt. % moisture) blocks or lumps with a low ash content (below 1 wt. %) and containing a low proportion of fine and coarse particles (not smaller than about 1 cm and not bigger than about 30 cm in the longest dimension). Due to the low content of tars in the gas, this configuration is generally favoured for small scale electricity generation with an internal combustion engine. The physical limitations of the diameter and particle size relationship mean that there is a practical upper limit to the capacity of this configuration of around 500 kg/h or 500 kWe. A relatively new concept of stratified or open core downdraft gasifier has been developed in which there is no throat and the bed is supported on a grate. This was first devised by the Chinese for rice husk gasification and further developed by Syngas Inc. (4) from work carried out at the Solar Energy Research Institute (now the National Renewable Energy Laboratory - NREL) (5).
Fuel gas(LHV)
Air
Ash
Fuel gas(LHV)
Air
Ash
Throat
DOWNDRAFT GASIFIERUPDRAFT GASIFIER
Feed
Feed
Figure 1 Fixed Bed Gasifiers: Updraft and Downdraft
2.4.3 Updraft
The updraft gasifier arrangement is shown in Figure 1 above. The downward moving biomass is first dried by the upflowing hot product gas. After drying, the solid fuel is pyrolysed giving char which continues to move down to be gasified, and pyrolysis vapours which are carried upward by the upflowing hot product gas. The tars in the vapour either condense on the cool descending fuel, or are carried out of the reactor with the product gas contributing to its high tar content (6). The extent of this tar "bypassing" is believed to be up to 20% of the pyrolysis products (7). The condensed tars are recycled back to the reaction zones where they are further cracked to gas and char. In the bottom gasification zone the solid char from pyrolysis and tar cracking is partially oxidised with the incoming air or oxygen. Steam may also be added to provide a higher level of hydrogen in the gas. The product gas from an updraft gasifier thus has a significant proportion of tars and hydrocarbons which contributes to its high heating value. The fuel gas requires substantial clean up if further processing is to be performed. The principal advantages of updraft gasifiers are their simple construction and high thermal efficiency: the sensible heat of the gas produced is recovered by direct heat exchange with the
Page 15

entering feed, which thus is dried, preheated and pyrolysed prior to entering the gasification zone. In principle, there is little scaling limitation, although no very large biomass gasifiers have been built. 2.4.4 Fluid bed
Fluid bed gasifiers are a more recent development that take advantage of the excellent mixing characteristics and high reaction rates of this method of gas-solid contacting. Although only recently applied to biomass, there are over 50 years experience with peat. Fluidised bed reactors are the only gasifiers with isothermal bed operation. A typical operating temperature for biomass gasification is about 800-850˚C. Most of the conversion of the feedstock to product gas takes place within the bed. However some conversion to product gas continues in the freeboard section from reactions of entrained small particles and particularly from thermal tar cracking. In most cases carbon conversion approaches 100 %, unless excessive carry over of fines takes place which will occur with a top feeding configuration. The bubbling fluid bed gasifier tends to produce a gas with a tar content between that of the updraft and downdraft gasifiers. Some pyrolysis products are swept out of the fluid bed by gasification products, but are then further converted by thermal cracking in the freeboard region (see Figure 2 below). Loss of fluidisation due to bed sintering is also a commonly encountered problem depending on the thermal characteristics of the ash, but the inherently lower operating temperature of a fluid bed and better temperature control provide an acceptable control measure. The problem is that alkali metals from the biomass ash form low melting eutectics with the silica in the sand, resulting in agglomeration and bed sintering with eventual loss of fluidisation. With biomass of high ash/inerts content it is better to use alumina or even metallic sand such as chromite sand. Carbon loss with entrained ash can, however, become significant and fluidised beds are not economical for small scale applications. Moreover, they incur higher operating (i.e. compression) costs. Fluidised bed gasifiers also have the advantage that they can be readily scaled up with considerable confidence. Only the fuel distribution becomes problematical in large beds, although multiple feeding is an acceptable solution. Alternative configurations such as twin bed systems and circulating fluidised beds are also available to suit almost every type of feedstock or thermochemical process. In catalytic thermochemical processes the bed material can be replaced by the catalyst therefore avoiding costly impregnation techniques. Alternatively a second catalytic reactor can be added (8) as in the TPS system (3) or a thermal cracking reactor can be added (9). Fluidised beds provide many features that are not present in the fixed bed types, including high rates of heat and mass transfer and good mixing of the solid phase, which means that reactions rates are high and the temperature is more or less constant in the bed. A relatively small particle size compared to dense phase gasifiers is desirable and this may require additional size reduction. The ash is elutriated and is removed as fine particulates entrained in the off gas.
Page 16

Fluidbed
Fuel gas(LHV)
Feed
CFB
Air Air
Fuel gas(LHV)
Feed
BUBBLING FLUID BEDGASIFIER
CIRCULATING FLUID BEDGASIFIER
Figure 2 Bubbling and Circulating Fluid Bed Gasifiers
2.4.5 Circulating fluid bed
The fluidising velocity in the circulating fluid bed is high enough to entrain large amounts of solids with the product gas (see Figure 2). These systems were developed so that the entrained material is recycled back to the fluid bed to improve the carbon conversion efficiency compared with the single fluid bed design. A hot raw gas is produced which, in most commercial applications to date, is used for close coupled process heat or retrofitting to boilers to recover the sensible heat in the gas (3. This configuration has been extensively developed for woodwaste conversion in pulp and paper mills for firing lime and cement kilns (10, 11) and steam generation for electricity. 2.4.6 Entrained bed
In entrained flow gasifiers no inert material is present but a finely reduced feedstock is required. Entrained bed gasifiers operate at much higher temperatures of 1200ºC or even above, depending on whether air or oxygen is employed, and hence the product gas has low concentrations of tars and condensable gases. However, this high temperature operation creates problems of materials selection and ash melting. Conversion in entrained beds effectively approaches 100%. There is little experience with biomass in such systems. 2.4.7 Twin fluid bed
Twin fluid bed gasifiers are employed to give a higher heating value gas from reaction with air than a single air blown gasifier (see Figure 3). The gasifier in effect is a pyrolyser, heated with hot sand from the second fluid bed which is heated by burning the product char in air, before recirculating it back to the first reactor. Steam is also usually added to encourage the shift reaction to generate hydrogen and to encourage carbon-steam reactions. Product quality is good from a heating value viewpoint, but poor in terms of tar loading from the essentially pyrolysis process.
Page 17

Fluegas
Feed
Product fuel gas(MHV)
CFB
Ash
Char & sand
AirSteam
Fluidbed
Hot sandrecycle
TWIN FLUID BED GASIFIER
Figure 3 Twin Fluid Bed Gasifier
2.4.8 Summary
A summary of the relative advantages and disadvantages is given in Table 2. Table 2 Gasifier Characteristics
Downdraft Simple, reliable and proven for certain fuels High residence time of solids Relatively simple construction Needs low moisture fuels Close specification on feedstock characteristics, High carbon conversion Uniform sized feedstock required Low ash carry over Very limited scale-up potential Fairly clean gas is produced Possible ash fusion and clinker formation on grate Low specific capacity Updraft Product gas is very dirty with high levels of tars Low exit gas temperature Very simple and robust construction High thermal efficiency Good scale up potential High carbon conversion Suitable for direct firing Low ash carry over High residence time of solids Relatively simple construction Bubbling fluid bed Good temperature control & high reaction rates Good scale-up potential In-bed catalytic processing is possible Can operate at partial load Greater tolerance to particle size range than fixed bed Low feedstock inventory Moderate tar levels in product gas Carbon loss with ash Higher particulates in the product gas Good temperature control Good gas-solid contact and mixing High specific capacity Tolerates variations in fuel quality Easily started and stopped
Page 18

Circulating Fluid Bed Good temperature control & high reaction rates High specific capacity Greater tolerance to particle size range than fixed bed High carbon conversion Moderate tar levels in product gas Good gas-solid contact Relatively simple construction and operation Very good scale-up potential Entrained flow Costly feed preparation needed for woody biomass Slagging of ash High temperatures give good gas quality but lower HV Very good scale-up potential Only large scale applications above about 10 t/h Materials of construction Carbon loss with ash Low feedstock inventory Produces tar free gas and little methane High conversion Good gas-solid contact and mixing High specific capacity Twin fluid bed MHV gas produced with air, without oxygen Catalyst can be added to bed Complex and hence costly design Scale-up complex Moderate tar levels requiring cracking or cleaning High specific capacity Complexity requires capacities of greater than 5 t/h Good gas-solid contact 2.5 Products of Gasification
The products of gasification will vary according to the reactor configuration and oxidant used. Ideally, there is complete conversion of all tars, hydrocarbons and char in the gasifier to give fuel gas. However, reactor design can give rise to incomplete oxidation, the extent of which is mostly determined by reactor geometry. The product gas is thus usually contaminated with tars, char, ash and inert material and extensive cleaning is required for many applications. 2.6 Gas Clean-up
2.6.1 Introduction
Gases formed by gasification will be contaminated by some or all of the constituents listed in Table 4. The level of contamination will vary depending on the gasification process and the feedstock. Gas cleaning must be applied to prevent erosion, corrosion and environmental problems in downstream equipment. 2.6.2 Hot gas clean-up for particulates
Gas streams from biomass gasification contain very small carbon containing particles which are difficult to remove by cyclones. Tests using high efficiency cyclones showed that particulates levels were not reduced to less than 5-30g/Nm3 (12). For this reason barrier filtration methods such as sintered metal or ceramic filters are preferred. This particularly important for pressurised systems where the sensible heat of the gas needs to be retained as well as avoiding scrubbing systems for tar removal. High temperature ceramic or metal candle filters have been tested with gasification products from peat and coal. Many designs do not give a constant pressure drop, but this increases as the deposits build up. One solution is to layer the filters where removal efficiencies in excess of 99.8% have been reported.
Page 19

Table 4 Fuel Gas Contaminants and their Problems
Contaminant Examples Problems Clean-up method
Particulates Ash, char, fluidised bed material
Erosion Filtration, Scrubbing
Alkali metals Sodium, potassium compounds.
Hot corrosion Cooling, Adsorption Condensation, Filtration,
Fuel-bound nitrogen
Mainly ammonia and HCN
NOx formation Scrubbing, SCR
Tars Refractive aromatics Clogs filters Tar cracking Tar removal
Difficult to burn Deposits internally Sulphur, chlorine
HCl, H2S Corrosion Lime or dolomite, Scrubbing, Absorption
Emissions Tests on wood-derived gases have presented a further problem with filter clogging by soot caused by thermal cracking of tars both in the gas phase and on the filter surface. This problem can be reduced by cooling the gas to below 500ºC and reducing gas face velocities across the filter surface. However, if temperatures fall below 400ºC, there is still a potential problem of tar deposition. Recent developments employ ceramic candle filters with automatic pulsing to strip off the accumulated filter cake but these are not free of problems. 2.6.3 Tar Cracking
2.6.3.1 Introduction
Tar concentration is mainly a function of gasification temperature with reducing tars levels as temperature increases. The relationship between temperature and tar level is a function of the reactor type and processing conditions. The tars formed in pyrolysis are thermally cracked in most environments to refractory tars, soot and gases. Tar levels and characteristics are also dependent on the feedstock. Tests have shown that tar production in wood gasification is much greater than in coal or peat gasification (12). These may partially react to give soot which can block filters which appears to be a problem peculiar to biomass gasification. This implies that technology developed in coal gasification tar cleaning may not be directly transferable to biomass feeds. There are two basic ways of destroying tars (8): • by catalytic cracking using, for example, dolomite or nickel, (reviewed in 8), • by thermal cracking, for example by partial oxidation or direct contact. 2.6.4 Catalytic Cracking
Pilot-scale tests have shown that catalytic cracking of tars can be very effective. Tar conversion in excess of 99% has been achieved using dolomite, nickel-based and other catalysts at elevated temperatures of typically 800-900ºC. These tests have been performed using both fossil and renewable feeds. Most reported work uses a second reactor. Some work has been carried out on incorporation of
Page 20
the catalyst in the primary reactor which has often been less successful than use of a second reactor (e.g. 13) although this approach has been selected for the Biopower plant at Varnamo (3). Elevated freeboard temperatures thermally crack tars and can reduce the load on the catalytic cracker. Catalyst deactivation is generally not a problem with dolomite, but there is no long term operating experience and catalyst losses may be a problem. An initial loss of activity is sometimes experienced as carbon compounds settle on the catalyst, but these compounds gasify as the bed temperature rises and the catalyst is reactivated. Metal catalysts tend to be more susceptible to contamination. Low hydrogen concentrations in the product gas will reduce the catalytic activity of metal based systems. The low sulphur content of biomass gases can reduce the activity of metal sulphide catalysts by stripping out the sulphur. 2.6.5 Thermal cracking
Tests on a fluidised bed peat gasifier at VTT has shown that tar levels can be reduced to levels found in downdraft systems by thermal cracking at 800-1000˚C (10). However, biomass-derived tars are more refractory and are harder to crack by thermal treatment alone. As indicated above, elevated freeboard temperatures in fluid bed gasifiers provide some thermal tar cracking. There are several ways of achieving thermal cracking: • Increasing residence time after initial gasification such as in a fluid bed reactor
freeboard, but this is only partially effective, • Direct contact with an independently heated hot surface which requires a significant
energy supply and thus reduces the overall efficiency. This is also only partially effective due to reliance on good mixing,
• Partial oxidation by addition of air or oxygen (e.g. 9). This increases CO2 levels, reduces efficiency and increases cost for oxygen use. It can be very effective particularly at high temperatures of up to 1300ºC or more.
2.6.6 Tar Removal
2.6.6.1 Water scrubbing
Water scrubbing is widely assumed to be a proven technique for physical removal of particulates, tars and other contaminants. Unfortunately most experience is not so reassuring and there are many reported problems, particularly in the poor removal efficiencies of tars although surprisingly little hard data is available (14). These require more physical capture and agglomeration or coalescence than simple cooling. Biomass derived tars are known to form aerosols and a complex treatment system is likely to be required even to attain tar removal levels of 90%. A typical system will include cool the gas to aid coalescence of particulates and tars in the next stage. A high efficiency scrubber then follows to intimately contact the contaminants and reduce the pressure so that the water will condense onto the particulates and tar droplets thus increasing their size and improving their susceptibility to agglomeration and coalescence. The final stage is to provide a high residence time tower to allow the system to equilibrate. Tar levels down to 20-40 mg/Nm3 and particulate levels down to 10-20 mg/Nm3 can be achieved with such a system. Soluble gases such as ammonia, and soluble solids such as sodium carbonate are effectively removed. These systems are fairly expensive and create a waste disposal problem by generating large
Page 21

quantities of contaminated water. The wastewater can usually be treated by conventional biological processes unless there is a high recycle ratio when more concentrated solutions will be produced requiring special disposal. There is no performance data on such systems. Cooling the product will also reduce electrical efficiency, but is essential for applications in engines to provide the highest energy density gas. 2.6.6.2 Electrostatic precipitators
This is an effective but costly way of removing tars. There is little experience on biomass derived gasification products. 2.6.7 Alkali Metals
Alkali metals exist in the vapour phase at high temperatures and will therefore pass through particulate removal devices unless the gas is cooled. The maximum temperature that is considered to be effective in condensing metals is around 600˚C. Tests on alkali species has shown that their gaseous concentrations fall with temperature to the extent that concentrations are close to turbine specifications at temperatures below 500-600˚C (12). Thus it is possible that gas cooling to this level will cause alkali metals to condense onto entrained solids and be removed at the particulate removal stage. Alkali metals may also damage ceramic filters at high temperatures. A hot gas clean-up system will thus first have a cooler before the hot gas filter. Alkali metals cause high temperature corrosion of turbine blades, stripping off their protective oxide layer. For this reason it is widely believed that their concentration must not exceed 0.1 ppm at entry to the turbine. There is no experience with modern coated blades in such an environment. Alternatively or additionally, water scrubbing can be used as described above. 2.6.8 Fuel-Bound Nitrogen
50-80% of fuel-bound nitrogen is converted to ammonia and lesser quantities of other gaseous nitrogen compounds during gasification. These compounds will cause potential emissions problems by forming NOx during combustion. There are two ways of approaching the problem of NOx emissions, any of which may be used singly or in combination: • use low-NOx combustion techniques, • use selective catalytic reduction (SCR) at the exhaust of the engine or turbine. Nitrogen-containing contaminants all exist in the vapour phase and will therefore pass through all particulate removal devices. Catalytic conversion methods can sometimes remove ammonia but this is dependent on the catalyst. Some catalysts are reported to increase ammonia content by releasing nitrogen bound in tars. Water scrubbing is effective in removing these soluble impurities, but results in loss of sensible heat and thus poorer efficiencies. SCR involves a reaction between ammonia and NOx to form nitrogen and water. This is well established technology and is often specified in exhaust gases from engines and turbines. There is, however, a cost and efficiency penalty. 2.6.9 Sulphur
Sulphur is not generally considered to be a problem since biomass feeds have a very low
Page 22

sulphur content. However the specification on turbines is typically 1 ppm or often much less, and even lower if co-contaminants are present such as alkali metals. Some gas compositions have reported 0.01% S which represents 100 ppm. Sulphur removal may therefore be necessary for turbine applications which can often be achieved with a conventional sulphur guard. Dolomite (CaO.MgO), often used for tar cracking, will also absorb significant proportions of sulphur. Sulphur concentrations (as H2S) will be lower than those produced in the combustion of fossil fuels, and hence expensive sulphur removal trains will not be necessary. If a dolomite tar cracker is included in the process, this will reduce the sulphur levels considerably, but possibly not to the low levels required. A sulphur guard, consisting of a hot fixed bed of zinc sulphide is likely to be adequate for the concentrations expected. This would be relatively inexpensive to install but would create a waste disposal problem from the zinc sulphide produced. 2.6.10 Chlorine
Chlorine is another potential contaminant that can arise from pesticides and herbicides as well as in waste materials. Levels of 1 ppm are often quoted, but this is a function of the temperature, chlorine species, co-contaminants, and materials of construction. The behaviour of chlorine and metals at elevated temperatures is well understood. Chlorine and compounds can be removed by absorption in active material either in the gasifier or in a secondary reactor, or by dissolution in a wet scrubbing system. Dolomite and related materials are less effective at removing chlorine than sulphur. 2.6.11 Summary of Clean-up Methods
A summary of the contaminants and the methods for clean-up was given in Table 4. 2.7 Power Generation Interfacing Requirements
2.7.1 Definition
The product gases from gasification of biomass may be used in either gas turbines or engines for the generation of electricity. This section considers gas quality requirements and control techniques that are required to make the use of gas turbines or engines a feasible and viable proposition. The gas quality requirement for a gas turbine is known to be very demanding but poorly specified and without any evidence that the specifications are necessary or justified. 2.7.2 Gas Quality Requirements
2.7.2.1 Turbine operation
Some typical conventionally stated turbine fuel gas specifications are summarised in Table 5. It must be emphasised that this list indicates some of the known problem areas and the specifications are not definitive but serve to show the extent to which the fuel gas may have to be cleaned according to various sources. Indeed, some of the specifications may turn out to be much more strict, and some contaminants will need to be possibly up to 10 times lower particularly in difficult combinations. Known major problems are alkali metals and sulphur. Sulphur is not normally associated with biomass, but trace levels of, for example, 0.1 % weight, can lead to levels of sulphur in the fuel
Page 23

gas of up to 100 ppm. This level is not acceptable (see Table 5) and will require reduction. Alkali metals are a major component of the ash of many biomass forms and their effect on turbines is well known, although the particular nature of the biomass derived alkali metals and their association with other contaminants such as sulphur is not known. Solid inerts such as char and fluid bed material will clearly have a deleterious effect on any moving parts and will require almost total removal. Suggested limits are indicated in Table 5. Table 5 Some Notional Gas Turbine Fuel Specifications
Contaminants Tolerance examples Minimum gas heating value (LHV) 4-6 MJ/Nm3 Minimum gas hydrogen content 10-20% Maximum alkali concentration 20-1000 ppb Maximum delivery temperature 450-600˚C Tars at delivery temperature All in vapour form or none Maximum particulate (ash, char etc ) level Particle size, µ Concn., ppm wt. >20 0.1 10-20 1.0 4-10 10.0 NH3 No limit HCl 0.5 ppm S as H2S or SO2 1 ppm N2 No limit Combinations Total metals < 1 ppm Alkali metals + sulphur < 0.1 ppm Tars are a potential problem if the gas has to be compressed as in an atmospheric gasifier since they will deposit in the compressor. Pressurised gasifiers overcome this problem by removing the need for a fuel gas compressor as the gas can be filtered hot and burned hot with the tars remaining in the gas phase and combusted. Tars otherwise will require cracking and/or removal as discussed below. Chlorine is a difficult contaminant as it interacts with most metals at the temperatures involved in gasification and combustion. Changing from a reducing (as in the gasifier) to an oxidising environment (as in the combuster) exacerbates the potential problem. The reactions between chlorine and most metals are well known and the operating regimes well understood. Biomass often contains nitrogen, particularly from bark and some special biomass forms. NOx generated from fuel bound nitrogen may cause problems and gas cleaning should, therefore, reduce traces of HCN and NH3 to a minimum. This is adequately dealt with in a water scrubbing system, but in pressurised system with hot gas filtration, a post-combustion catalytic process (SCR) would be required. There will be a trade-off between increasing the gas cleaning to a high standard and increasing the maintenance cost of the turbine. This interaction has not been studied and no data is available. 2.7.2.2 Engine operation
Engines have the advantage of higher tolerance to contaminants than turbines (e.g. up to 30
Page 24

ppm tars can be tolerated). If the gas is compressed in a turbocharger there will be similar but possibly less demanding quality requirements on the gas. There is no robust data on the gas quality specifications. The simple cycle is not very efficient since there is considerable energy wasted in the hot exhaust gases. Efficiency can, therefore, be increased by adding a heat recovery system after the gas turbine. These systems can either generate steam or preheat the air. The steam can power a steam turbine in a combined cycle mode, or the steam can be mixed with the combustion gases and fed through the gas turbine in a steam injected gas turbine (STIG) cycle. The residual heat from the steam turbine or air preheater can be used as process steam or in district heating. Gas turbines are proven in power generation when fuelled by high-grade fossil fuels such as natural gas or liquid fuels such as diesel. Low heating value fuels such as gases formed in biomass gasification have not been demonstrated in gas turbines although medium heating value producer gas from coal gasification has been used successfully at the Cool Water demonstration coal integrated gasifier/combined cycle (CIG/CC) 100MWe facility in the United States (15). 2.7.3 Fuel Specifications and Turbine/Engine Requirements
Coal integrated gasification (CIG) capacities are far greater than the capacities proposed for biomass systems, typically ranging from 100 at a demonstration scale to 1000 MWe. The gas turbines used are bigger and more tolerant of gas contamination. Biomass based systems are limited in size by the availability and collection costs of the resource. There are few advocates of biomass based combined cycle power systems above 50-100 MWe, and few sites where biomass can be delivered in sufficient quantities - 40 d.a.f. t/h at 45% efficiency for 100 MWe. Contaminant limits for systems based on biomass integrated gasification (BIG) will have to be much stricter to ensure a long turbine life, as suggested in Table 18 although definitive limits have yet to be finalised. 2.7.4 Fuel Combustion
2.7.4.1 Fuel Calorific Value
The heating values of gasifier fuels are 4 to 10 times lower than those of conventional gas turbine fuels. This means that correspondingly more fuel will have to be burned to input an equivalent amount of heat energy. The additional throughput will mean that combustion chambers and burners will require modification, particularly to meet increasingly stringent environmental requirements. Contaminant limits may have to be tightened to account for the extra volume of fuel gas required. 2.7.4.2 NOx Production
A low flame temperature is predicted from combustion of LHV gas due to its dilution by nitrogen. This will reduce thermal NOx production which is not, therefore, expected to be an environmental problem. The composition of MHV gases, which are largely hydrogen and carbon monoxide with some methane, suggests that they will have a high flame temperature which could lead to NOx problems. MHV burners will have to be carefully designed to account for this or some form of dilution may be necessary, possibly by the nitrogen extracted in oxygen gasification, or by steam. SCR processes are available for reducing NOx in exhaust gas but there is an economic and energetic penalty.
Page 25

Biomass often contains nitrogen, particularly from bark and some special biomass forms. NOx generated from fuel bound nitrogen may cause problems and gas cleaning must therefore reduce traces of HCN and NH3 to a minimum. SCR may be required at the turbine or engine exhaust. 2.7.4.3 Auxiliary Fuel Capability
It would be desirable for the turbine to have a dual fuel capability to supplement fuel gas and to ensure maximum availability. However, this will almost certainly require a new burner design, and also additional modifications to the combustion chambers. 2.7.4.4 Indirect Firing
One way of avoiding the problems of gas cleaning is to burn the fuel in a separate combustor and heat the turbine gases indirectly via a high temperature gas/gas heat exchanger (a Brayton cycle). This approach is applied at the Free University of Brussels (VUB) CHP plant (16). The main problem is the loss of efficiency caused by indirect heating of the turbine working gases, and the temperature limits imposed by the heat exchanger materials which limits the efficiency attainable. While indirect heating improves turbine reliability, there are costs incurred in flue gas treatment and the gas/gas heat exchanger. 2.7.5 Energy Recovery
2.7.5.1 Combined Cycle
Exhaust gases typically leave the gas turbine at temperatures between 500-600 C for aeroderived turbines and 400-500˚C for industrial turbines, and so still have considerable thermal energy. This energy, and other sources of high temperature gas such as the raw gas from the gasifier, can be recovered in a heat recovery steam generator (HRSG) which produces steam. This steam can be used in a steam turbine to generate extra electricity. The steam is then cooled and condensed in a cycle before passing once again through the steam generator. This combination of gas turbine and steam cycle is known as a combined cycle (CC). The waste heat from the steam turbine can be recovered as heat for example for district heating.. Steam turbines and boilers are only normally economic in large scale applications (>100MWe), unless there are special circumstances such as low cost feedstocks, and for this reason combined cycles are very sensitive to scale. Steam injection gas turbine (STIG) cycles may be more appropriate to smaller generating systems, but there is no experience of such a system on biomass derived gases. 2.7.5.2 Combined Heat and Power
In all the cycles noted, excess heat or steam can be used as process steam or in district heating. This will increase overall system efficiency at the expense of additional capital cost. 2.7.5.3 Electricity production
There are two basic machines for generating power: turbines and engines. There is no clear allocation of choice of machine and size of system, but the orthodox view is that engines are more suitable up to 5-10 MWe and turbines above 10-20 MWe for an atmospheric pressure gasifier and above 20-30MWe for a pressure gasifier. Engine gen-sets are, however, available up to 50 MWe, and gas turbines have been successfully used at 3 MWe. Turbine options are listed in Table 19.
Page 26

Turbines become more attractive at larger sizes, particularly for IGCC and similarly advanced cycles when higher efficiencies can be achieved and economies of scale become more noticeable. Engines have the advantage of robustness, high efficiency at low sizes, higher tolerance to contaminants than turbines (e.g. up to 30 ppm tars can be tolerated), easier maintenance, and have a wide acceptability. However operation in combined cycle mode is rarely justified as only a small increment in efficiency can be gained. There is poor economy of scale as capacity is more a function of number of cylinders than size of cylinders and constant specific capital costs that are independent of size are typical.
Page 27

3 ENVIRONMENT, HEALTH AND SAFETY
3.1 Introduction
The operation of a gasification plant can result in occupational health and safety hazards unless adequate and effective preventive measures are taken and continuously enforced. A gasification system consists of: • fuel storage, handling and feeding system; • the gasifier, gas cooling and cleaning equipment; • utilisation of the gas. Each part of the plant creates specific occupational, health and safety hazards. Table 6 describes the main environmental concerns and major hazards associated with the operation of gasification system. Table 6 Environmental Aspects of Gasification Systems
Process activity Fuel Feeding Gasifier Gas Gas preparation system cleaning utilisation Environmental Concerns
Dust * * * Noise * * * * * Odour * * * Wastewater * * Tar * * Fly ash * Exhaust gases *
Hazards Fire * * * * * Dust explosion * * * Mechanical hazard * * * * Gas poisoning * * * * Skin burns * * * Gas explosion * * * Gas leaks * * *
This section examines the sources of environmental concerns and describes the measures which have to be taken to limit environmental impact and only considers in-plant environmental factors concerning gas, liquid and solid emissions and wastes. The major hazards are then discussed and safety guidelines are provided for appropriate operation of gasifier systems. 3.2 Environmental Aspects of Gasification Operations
3.2.1 Dust
Dust is generated during feedstock preparation, storage and handling; feeding; and fly ash removal by particulate collection equipment. The handling of solid materials is a notorious source of airborne particles, especially when the solids are dry and friable. Dust generation creates several problems including: • airborne or entrained dust may form explosive mixtures with air in which a primary
Page 28
explosion can render the dust airborne causing secondary explosions and these can be devastating;
• the inhalation of dust is a potential source of lung damage; • eye and skin irritation may occur; • layers of combustible dust may cause smells, or smoulder and ignite; • dust settlement on all exposed horizontal surfaces lead to safety problems for personnel
in routine operations, as well as increased maintenance and aesthetic detraction; • increased friction and wear of mechanical equipment caused by dust deposition
increases costs and reduces reliability, both increasing the potential for accidents; Preventive measures include: • minimisation of solids handling and avoidance of rough handling to minimise attrition
of fuel particles and suspension of dust; • complete enclosure of all solids handling, particularly conveying equipment at the
discharge points; • installation of suction hoods and gas cleaning equipment to control localised dust
sources, for example mills and screens; • maintenance of an under-pressure in enclosed environments to prevent the spreading of
dust into adjacent premises, again with suitable gas cleaning equipment. Solid particles also arise in the product gas from gasification such as cinders, fly-ash, filter dust, charcoal, fluid bed inerts and catalyst fines. Since such sources are localised they are, in principle, easier to control. In the discharge of fine material such as fly-ash, they may need to be wetted to prevent re-entrainment during handling and disposal. Carbon formed by secondary cracking or incomplete gasification can also form explosive mixtures with air but it is usually contained in appropriate vessels. Charcoal from biomass can be pyrophoric and needs to be adequately cooled prior to discharge and storage if arising in significant amounts. Some types of gasifiers may produce hot particles as a consequence of malfunction or equipment faults. These may ignite flammable materials and cause a fire. From an occupational health viewpoint, dust particles may be classified by: Size Particles larger than 5 µ (0.005mm) are arrested by wet hairs in
the nostrils. Those smaller than 0.2 µ (0.0002 mm) do not settle in the lungs and are breathed out again. Hence the intermediate size range is the most dangerous;
Shape and composition Some materials are known to cause lung damage, for example asbestos (asbestosis) and silica (fibrilosis). The latter may arise from fluid bed materials.
Dust originating from fly-ash removal may be toxic due to adsorption of chemicals onto the dust particles. Several compounds with carcinogenic properties, such as benzo (a) anthracene and benzo (a) pyrene are adsorbed onto the dust particles. They are dangerous to human health either after inhalation and skin contact and/or after accumulation in the food chain. Dust particles may also adsorb non-polar organic compounds up to 40 % of their weight which may be higher for soot and carbon black with their very high specific surface areas. The dispersion of gasifier dust may lead to air and food contamination. 3.2.2 Wastewater and condensables
Wastewater and condensates may be produced during gas cooling and wet gas cleaning (1). The condensate is known to contain, for example, acetic acid, phenols and many other organic compounds. There is a risk of water pollution and adverse health effects from the tars and
Page 29

soluble organics. The condensate and wastewater consists mainly of water and can be divided into an aqueous i.e. water soluble, and a non-water soluble fraction consisting of tars and oils. Separation, however, is not always simple since wood tar tends to emulsify in the aqueous phase. The insoluble fraction consists mainly of tars, fly ash, phenolic compounds and light oils. The tars in particular, as well as the condensates, are toxic and require careful evaluation of their occupational and safety aspects. Little research has been carried out to determine the mutagenic and carcinogenic effects of biomass tar, but research on coal tar has confirmed the above reservations. It is safe to assume that some of the tar components may be carcinogenic. High temperature gasifier operations can increase this problem since the mutagenic and carcinogenic effects are related to the presence of polycyclic aromatics and their relative concentration increases as process temperature increases. Direct content between skin and tars or condensates should be avoided by appropriate clothing and training. Tars present an insignificant fire hazard as their flash points are comparatively high. Tar disposal has not been examined. It may be recycled to the gasifier or incinerated. Other disposal options are unlikely to be acceptable. Since tars are such a potential problem in wastewater and in their own right, every effort should be made to reduce their environmental impact by: • cracking tars during or after gasification; • applying hot gas clean-up and so avoiding wet gas scrubbing; • reducing gasification temperatures to limit the production of refractive polycyclic tars.
Pressurised gasifiers are assumed to operate with hot gas clean-up with no waste water and no tar production. Atmospheric pressure gasifiers are more likely to include a wet scrubbing system, particularly if an engine is specified for power generation. Wastewater treatment is usually assumed to be relatively simple and low cost although there is remarkably little information on treatment methods or costs. The design of the wastewater treatment plant would be expected to rely partly on chemical treatment such as solvent extraction of phenolics with incineration of recovered organics, and orthodox biological treatment of the dilute, low BOD phase. 3.2.3 Fly ash and char
Fly ash and char present similar problems to those caused by dust as described above. There is an additional risk of fire that dictates that fly ash and char should be stored moist. Disposal of this wetted mixture presents its own environmental problems. The solids need to be separated from the water in a water treatment facility. Extracted water will be contaminated and may require further treatment before discharge using orthodox water treatment technology. There are no known special problems. The solid fraction should be considered an industrial waste and discharged accordingly to licensed landfill sites. 3.2.4 Odour problems
Odours may arise because of : • the degradation of organic matter (for example in refuse or sewage gasification); • the occurrence of even minute gas leaks; • the handling and storage of tar, wastewater, fly ash and other by-products.
Page 30

Wood tar has a strong, characteristic and persistent odour, even in minute concentrations. The smell of coal tar is somewhat aromatic due to the presence of naphthalene, anthracene and phenanthrene. Tar derived from ligno-cellulosic feedstocks is more pungent. When sulphur or nitrogen containing feedstocks are used the producer gas also contains odorous gases, such as H2S, COS or NH3. The tar and wastewater may be contaminated by even more strongly smelling organic sulphur and nitrogen compounds although this is unlikely to be a problem with biomass derived products due to the very low levels of sulphur and nitrogen. 3.2.5 Noise
Noise is produced whenever a mechanical part or an engine or motor is in operation. Particular plant areas where noise levels are likely to be significant are: • reception storage and handling equipment, • the feeding system; • the compressors; • the gas turbine or engine; The effects on humans of prolonged exposure to noise are well documented. Adequate measures must be taken to minimise noise for example by using sound and vibration absorbent materials between supports or acoustic enclosure. Operators are also required to be provided with ear protection plugs. 3.3 Hazards of Gasifier Operation
3.3.1 Combustible gases and vapours
A flammable gas is combustible only within a certain range of concentrations, bounded by the LEL (Lower Explosion Limit) and the UEL (Upper Explosion Limit). Below the LEL, the mixture is too lean to sustain combustion. Above the UEL the reaction stops because of a deficiency in oxygen. In both cases the generation of heat becomes too slow to give rise to the characteristic acceleration in reaction rates, which marks the start of an explosion. The range between the LEL and UEL values depends on the reactivity of the flammable compound or mixture. It widens when the flammable gas or the combustion air is preheated or under pressure. Some data is given in Table 7. Table 7 Some LEL and UEL Values and Self Ignition Temperatures in Air
LEL, Vol. % UEL, Vol. % Self ignition temperature, °C Hydrogen 4.0 76 400 Carbon monoxide 12.5 74 * Methane 4.6 14.2 540 Ethane 3.0 12.5 515 Ethene 3.1 32.0 490 Propane 2.2 9.5 450 * this temperature is highly dependent on the presence of traces of moisture. Explosive mixtures could arise when: • air leaks into the gasifier plant as a consequence of a reduction in operating pressure.
Reduced pressure may arise due to rapid cooling, condensation of vapour such as water,
Page 31
chimney effects, the suction of an induced draft fan or of an engine. • fuel gas leaks out of the gasifier plant into a confined space thus building up a
substantial concentration in an enclosed space. A source of ignition is necessary for an explosion, so explosion proof or flame proof or spark proof motors would be specified in any such areas. In addition, such an atmosphere is also likely to present a lethal toxicity hazard from carbon monoxide so suitable detectors should be fitted.
When a flammable mixture of gas and air is formed, an explosion may occur when the mixture is ignited. Ignition may occur from static electricity, sparking equipment such as motors, or contact with a hot surface. In view of the wide explosion limits of the main components of producer gas - hydrogen and carbon monoxide - the accidental formation of explosive gas mixtures should be prevented. Mixtures of producer gas with oxygen enriched air or pure oxygen have a higher UEL compared to mixtures with air. The LEL does not change significantly. This means that oxygen gasifiers present an even higher explosion risk, e.g. when oxygen breaks through the fuel layer or there is a perturbation in the fuel supply. 3.3.2 Combustible dusts
Combustible solids such as wood, flour and coal dust when as very small particles can also form explosive mixtures with air within certain concentration limits. These boundaries usually range from a LEL of 20 to 50g/m3 and a UEL of 2 to 6 g/m3. Numerous carbohydrate materials, including starch, sugar and wood flour, have given rise to extremely destructive explosions. 3.3.3 Fire risks
The main fire risks in gasifier systems are associated with: • fuel storage; • combustible dusts formed in fuel comminution; • fuel drying (in forced draft conditions a fire is likely to expand quickly); • ignition procedure (especially for moving bed gasifiers); • the product gas. There are also the usual risks associated with any construction involving a thermal unit. Local rules and guidelines should be followed with construction and materials selection of buildings. Adequate means for fire-fighting should be provided and the gasifier operators should be well acquainted with their existence, location and operating instructions. Such fires can be avoided with proper procedures and proper layout of the plant. 3.3.4 Carbon monoxide poisoning
Carbon monoxide is a major constituent of producer gas and is by far the most common cause of gas poisoning. It is particularly noxious due to the absence of colour or smell. The accepted Threshold Limit Value (TLV) is 50 ppm CO (0.005 vol. %), although concentrations and exposure are closely linked. There is extensive documentation available on effects, treatment and controls that are laid down by the relevant statutory authorities. Since carbon monoxide is an odourless, colourless gas, it may only be detected through instrumentation and personal detectors are necessary when working in confined spaces. All operating personnel should be aware of the hazards presented by the gas. The best way of avoiding the risk of carbon dioxide poisoning is to build the gas generator in the open with the minimum of containment and with adequate ventilation particularly where gases may collect.
Page 32

3.3.5 Other toxic compounds
It is well-established that extremely toxic dioxins and furans (PCDs and PCFs) are formed during most combustion and gasification processes when some chlorine is present. Under normal operating conditions the concentration of these compounds in wood fired units is extremely small, although pesticide treated wood and waste materials can provide the source of chlorine necessary for their formation. A close coupled IGCC system will normally provide satisfactory operating conditions for thermal destruction of these compounds and it is generally believed that these compounds do not present any problem. 3.3.6 Other hazards
Other hazards include skin burns, mechanical hazards, electrical hazards. Some of the surfaces of the gasifier, the cyclones, the gas lines, the engine and its exhaust may get hot during operation and thus create a hazard to personnel for skin burns. For permanent stationary installations such surfaces should be insulated to protect the operators and also to reduce heat losses. Covers or rails should be installed to keep personnel at a safe distance. All equipment with moving parts such as blowers, fans, screw conveyors, front end loaders, pretreatment and feeding equipment, etc. present a hazard from moving parts and should be suitably protected. All electric appliances provide the potential for electric shocks and suitable precautions need to be taken using standard procedures and equipment specifications. Any work on elevated equipment involves the hazard of possible falls. Similarly there is some hazard from falling objects, tripping on hot equipment or slipping on oil-stained floors. Unauthorised, inexperienced, or untrained personnel should be prevented from entering the plant to reduce the risk of injury through improper use of equipment or facilities. For all "normal" hazards that may arise in a process plant there are well documented and statutory requirements. 3.4 Conclusions
The gasification system has to be designed to meet all local environmental and safety requirements. If it is operated correctly and no accidents occur, then the environmental impact will normally be acceptable. Safety design is a major consideration and there are a range of precautions that have to be included and provided for that will be defined internationally, nationally and locally. In addition, an important aspect of safety and environmental management is good training. The general factors are outlined above but there may be additional specific requirements such as the following: • dust from feed handling • dust explosions • gas explosions • carbon monoxide poisoning • tars and wastewater management • solids disposal • noise All of these factors can be adequately managed through good design and operation practice.
Page 33

4 VISIT TO CHINA
4.1 Itinerary
The main contact and guide for the duration of the study tour was Professor Yuan Zhenhong who works for the China Biomass Technology Centre as a division of the State Science and Technology Division of China. The SSTCs work within the framework of the 8th and 9th 5 year national plans. In 1995, 25% of energy requirements come from biomass in rural areas, mostly through relatively low efficiency combustion in stoves.. This is equivalent to about 200 mtce. The Chinese authorities plan to reduce the contribution from this type of technology to 10% by 2010 and to 5% by 2020 through replacement with high performance and less polluting technology. The mechanisms for achieving this target are not defined but clearly offers considerable potential for introduction of new technology. 4.2 Liaoning State Science and Technology Commission (LSSTC) and
Liaoning Institute of Energy Resources (LIER)
The first appointment was at Shenyang where the Director of Liaoning SSTC hosted a lunch with a number of local Politicians and others concerned with renewable energy in the province and region. The main contact for this stage of the tour was Dr Lin Weigji, Director of the Liaoning Institute of Energy Resources (LIER). Other persons present included: • Mrs. Wu Li Xia, Director International Co-operation Division of LSSTC, • Mr. Yang Zhong Hua, senior engineer of LSSTC, • Dr. Jiang Chonglin, Associate professor of Liaoning Institute of Energy Recourses • Professor Li Jixiang, Professor of Biomass. A visit was then made to the LIER headquarters in Yingkou where a presentation on the Institute was given. LIER has 130 staff, all dedicated to energy research. Of the four research departments of LIER, the Department of Biomass Energy Applications and the Department of Heat Energy are of particular relevance and will play an important supportive role in implementing EC biomass gasification technology in Huoshi village. This was followed by a visit to the laboratories where a number of bioenergy projects were viewed as listed below: 1. Sawdust and fines from wood processing waste were gasified in a down-draft gasifier
with the resultant gas burned in a combustor to heat two carbonisers with briquetted wood waste for production of briquetted charcoal. The vapours were cooled in air cooled heat exchangers to collect the liquor. The objective was to establish performance and costs of gasification, carbonisation and briquetting. The process produced 500 kg per day of charcoal from each carbonisers but have not been used for some time.
2. A down flow fixed bed high pressure and high temperature pyrolysis had been installed many years ago to improve yields of charcoal. The equipment has obviously not been used for many years.
3. There were two new Tessari engine generating sets which were planned to run on bio-diesel funded in part through an EU project. This had not yet commenced.
4. An autoclave was available to study adhesives production from chemicals waste. This also has not been used for some time.
This showed the resources and facilities available at LIER and confirmed LIER’s ability in both pilot plant design and construction. There are no current bioenergy projects at LIER, with funding only supporting the salaries of the staff in the institute. Funding comes from the State, the Province, the city, profit from contracted work and sometimes from industrial sponsors. The Institute would benefit from modern analytical equipment such as a gas chromatograph, process mass spectrometer and tar measuring equipment.
Page 34

LIER fully supports the idea of an EC project in Huoshi village and appears capable of acting as a local support partner for implementing advanced gasification technologies. 4.3 Wood flooring factory near Dalian
A factory manufacturing parquet flooring was visited in Sanhou, a village near Dalian and not far from Huoshi.. The key person was Mr. Sun Ying Xian who is Director of the Rural Energy Office. The factory imports rough sawn timber from Northern China and finishes it into hardwood parquet flooring (see Figure 4). Current waste production is around 500 t/y as sawdust and offcuts but there will be approximately 700 tonnes per year of waste arising from the factory when it is operating at full output in 1998.
Figure 4 Wood floor factory
Some of the waste is used within the factory to raise steam to dry the wood while the rest is disposed of. It was not clear whether the wood waste was sold or given away, but a figure of 0.1 Yuan per 10 kg or 10 Yuan per tonne or about 1.25 US dollars was quoted as the selling price. The factory is owned by a resident of Huoshi which was the proposed site of the gasification system to be funded as part of the demonstration activity in the THERMIE programme. The wood waste will be made available to the proposed gasifier project as described below.
Figure 5 Wood waste from wood flooring factory (Figure 4)
Page 35
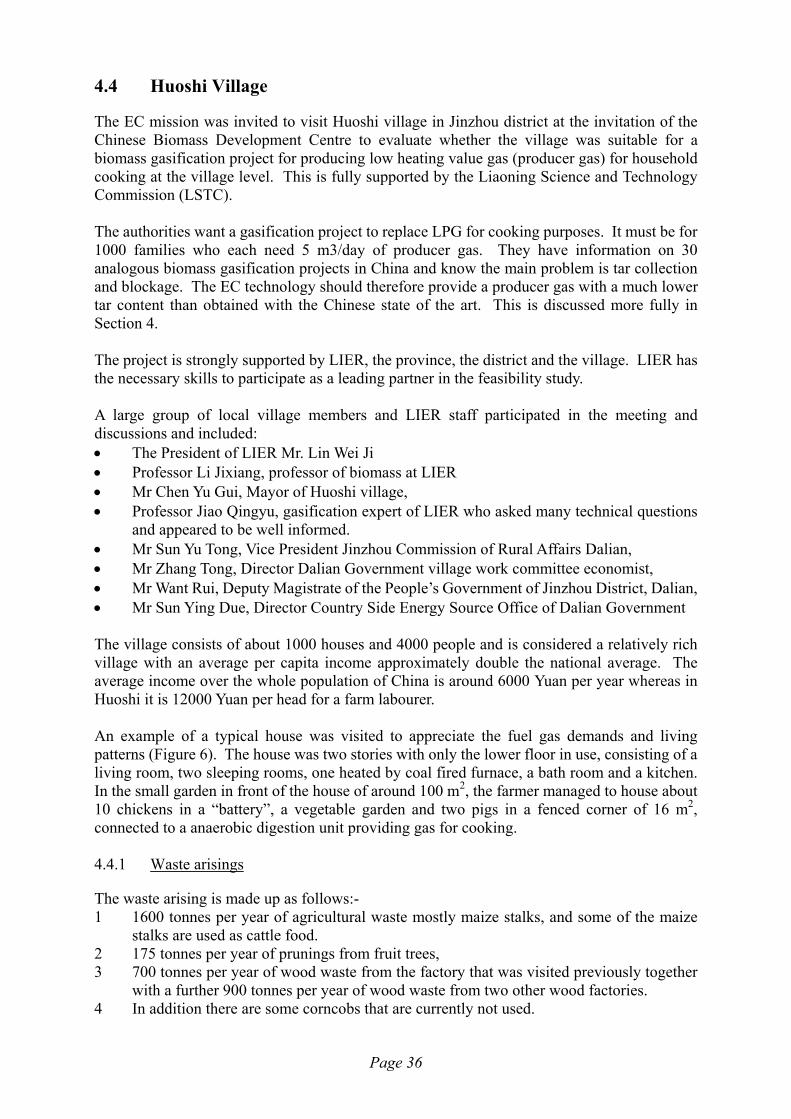
4.4 Huoshi Village
The EC mission was invited to visit Huoshi village in Jinzhou district at the invitation of the Chinese Biomass Development Centre to evaluate whether the village was suitable for a biomass gasification project for producing low heating value gas (producer gas) for household cooking at the village level. This is fully supported by the Liaoning Science and Technology Commission (LSTC). The authorities want a gasification project to replace LPG for cooking purposes. It must be for 1000 families who each need 5 m3/day of producer gas. They have information on 30 analogous biomass gasification projects in China and know the main problem is tar collection and blockage. The EC technology should therefore provide a producer gas with a much lower tar content than obtained with the Chinese state of the art. This is discussed more fully in Section 4. The project is strongly supported by LIER, the province, the district and the village. LIER has the necessary skills to participate as a leading partner in the feasibility study. A large group of local village members and LIER staff participated in the meeting and discussions and included: • The President of LIER Mr. Lin Wei Ji • Professor Li Jixiang, professor of biomass at LIER • Mr Chen Yu Gui, Mayor of Huoshi village, • Professor Jiao Qingyu, gasification expert of LIER who asked many technical questions
and appeared to be well informed. • Mr Sun Yu Tong, Vice President Jinzhou Commission of Rural Affairs Dalian, • Mr Zhang Tong, Director Dalian Government village work committee economist, • Mr Want Rui, Deputy Magistrate of the People’s Government of Jinzhou District, Dalian, • Mr Sun Ying Due, Director Country Side Energy Source Office of Dalian Government The village consists of about 1000 houses and 4000 people and is considered a relatively rich village with an average per capita income approximately double the national average. The average income over the whole population of China is around 6000 Yuan per year whereas in Huoshi it is 12000 Yuan per head for a farm labourer. An example of a typical house was visited to appreciate the fuel gas demands and living patterns (Figure 6). The house was two stories with only the lower floor in use, consisting of a living room, two sleeping rooms, one heated by coal fired furnace, a bath room and a kitchen. In the small garden in front of the house of around 100 m2, the farmer managed to house about 10 chickens in a “battery”, a vegetable garden and two pigs in a fenced corner of 16 m2, connected to a anaerobic digestion unit providing gas for cooking. 4.4.1 Waste arisings
The waste arising is made up as follows:- 1 1600 tonnes per year of agricultural waste mostly maize stalks, and some of the maize
stalks are used as cattle food. 2 175 tonnes per year of prunings from fruit trees, 3 700 tonnes per year of wood waste from the factory that was visited previously together
with a further 900 tonnes per year of wood waste from two other wood factories. 4 In addition there are some corncobs that are currently not used.
Page 36
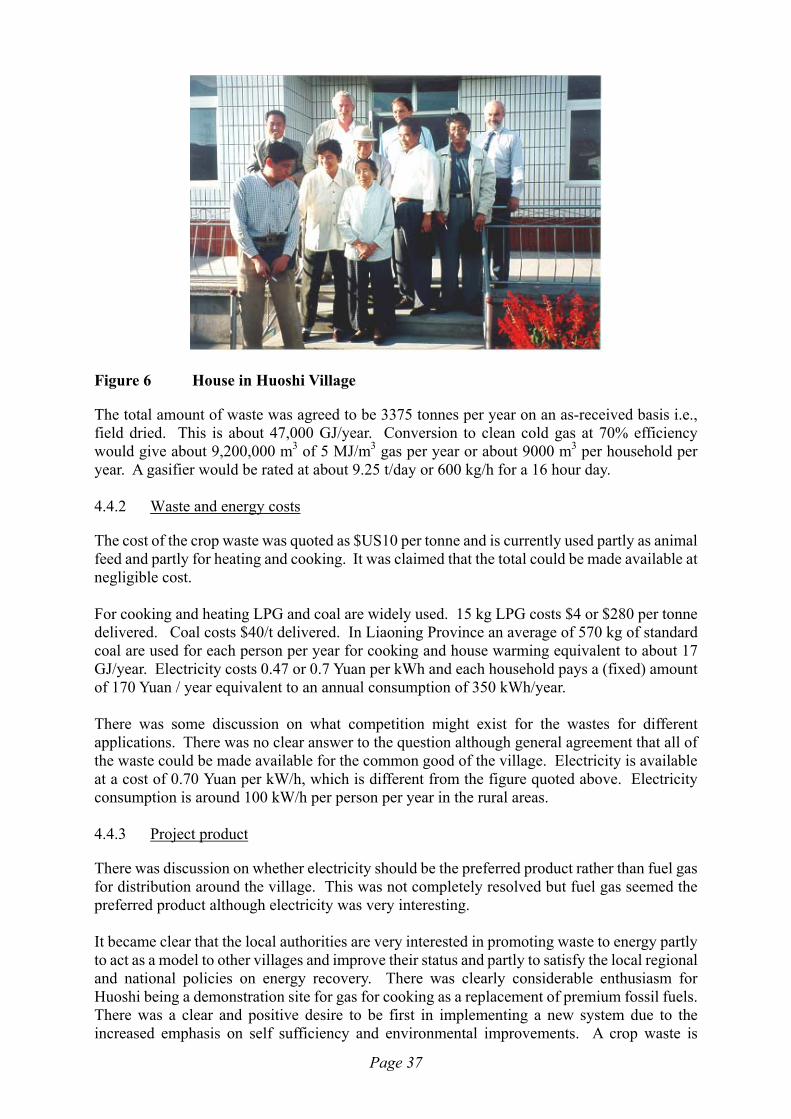
Figure 6 House in Huoshi Village
The total amount of waste was agreed to be 3375 tonnes per year on an as-received basis i.e., field dried. This is about 47,000 GJ/year. Conversion to clean cold gas at 70% efficiency would give about 9,200,000 m3 of 5 MJ/m3 gas per year or about 9000 m3 per household per year. A gasifier would be rated at about 9.25 t/day or 600 kg/h for a 16 hour day. 4.4.2 Waste and energy costs
The cost of the crop waste was quoted as $US10 per tonne and is currently used partly as animal feed and partly for heating and cooking. It was claimed that the total could be made available at negligible cost. For cooking and heating LPG and coal are widely used. 15 kg LPG costs $4 or $280 per tonne delivered. Coal costs $40/t delivered. In Liaoning Province an average of 570 kg of standard coal are used for each person per year for cooking and house warming equivalent to about 17 GJ/year. Electricity costs 0.47 or 0.7 Yuan per kWh and each household pays a (fixed) amount of 170 Yuan / year equivalent to an annual consumption of 350 kWh/year. There was some discussion on what competition might exist for the wastes for different applications. There was no clear answer to the question although general agreement that all of the waste could be made available for the common good of the village. Electricity is available at a cost of 0.70 Yuan per kW/h, which is different from the figure quoted above. Electricity consumption is around 100 kW/h per person per year in the rural areas. 4.4.3 Project product
There was discussion on whether electricity should be the preferred product rather than fuel gas for distribution around the village. This was not completely resolved but fuel gas seemed the preferred product although electricity was very interesting. It became clear that the local authorities are very interested in promoting waste to energy partly to act as a model to other villages and improve their status and partly to satisfy the local regional and national policies on energy recovery. There was clearly considerable enthusiasm for Huoshi being a demonstration site for gas for cooking as a replacement of premium fossil fuels. There was a clear and positive desire to be first in implementing a new system due to the increased emphasis on self sufficiency and environmental improvements. A crop waste is
Page 37

sometimes burnt and is becoming an increasing problem of disposal and therefore the price is not likely to go up but rather to go down and there was a claim of a proposed ban on burning crops. 4.4.4 Discussion and identification of information requirements
Key questions with responses where available are given below: Question Response 1 What is the preferred product Fuel gas, although electricity is very
interesting 2 Is there sufficient fuel to provide gas for
the village? There were assurances that there was sufficient fuel.
3 When does this fuel arrive (seasonally) and how can it be stored.?
Information will be required
4 Should it be pre-processed such as by briquetting and what is the cost of this?
This will require assessment
5 What does the fuel actually cost to buy apart from any processing prior to gasification.
This will be ascertained
6 How much gas is needed for cooking, Information will be required 7 How does the demand for gas vary over
the day, over the week and over the year.? Information will be required
8 What impact will changes in village population have on the size of the installation?
The village is contracting in size rather than growing.
9 What skills and labour is available for operation of the unit?
These were claimed not to be a problem.
10 Are any grants or subsidies available? Only available for remote AND poor villages. This does not apply to Huoshi.
11 Will any industries use the gas? Wood and boilers could use some gas but no information was available.
12 Who will own and operate the facility? This is a village project and the village would take the responsibility of finding the money and providing the feedstock to run it and the skilled labour to operate it.
13 Will the toxicity of the high carbon monoxide levels in the gas create a problem?
This was accepted and felt by the village that it could be dealt with through adequate training and education.
During the discussions, it became clear that there were already projects in China utilising down-draft gasifiers to provide low heating value fuel gas. information provided at this meeting in the village suggested that each family used about 5 cubic metres per day and that the pipeline length in total was 800 metres. Problems reported are that the water freezes in winter and blocks the pipes and tars accumulate in the pipeline with removal increasing the cost of operation. Further details of this system and another system based on pyrolysis are described in papers presented at the conference later in the week and included at the end of this report. Other demonstration projects analogous to this are planned elsewhere but no details were available. Other suggestions were the use of bio-gas and possibly a blend of thermal gasification with biological gasification.
Page 38

There was an overall emphasis on an improvement of technology and improvement on efficiency as in the 8th and 9th year five year plans. Coal is widely used for steam raising both creating increasing concern over air pollution. Then followed some questions from the Chinese side concerning the technologies that are available in Europe and how the feasibility study will be carried out. It was explained that all current projects in Europe are concerned with generation of electricity at scales starting at 5MW and going up to 30mW. There is no interest in fuel gas production in Europe. It was clear from the discussion that the Chinese were wanting an advanced technology. 4.4.5 Summary of information requirements
A considerable amount of information will be required in order to specify a suitable system. Some of the key questions identified at the meeting were: 1. Quantity and seasonality of the biomass sources and varieties, 2. Main characteristics of each fuel such as moisture, size, shape and density 3. Cost of each type of fuel, 4. Additional sources of fuel, 5. Storage of biomass fuel, 6. Is there sufficient fuel to provide gas for the village, 7. Is pre-processing of fuel required e.g. briquetting and what facilities are available and
what does it cost, 8. How much gas is needed for cooking, 9. What other uses may be found for the gas? 10. Gas demand patterns on an hour to hour basis, day to day and winter / summer seasons, 11. Future gas requirements as population changes and living standards rise, 12. Gas quality and necessary equipment modifications for burning a low heating value gas, 13. Skills availability for operation and maintenance, 14. The site of the gasifier, 15. Storage of gas, 16. Size, length and extent of gas distribution system, 17. Toxicity of carbon monoxide, 18. Storage and distribution of gas, 19. Impact on alternative renewable energy forms such as biogas. Further specifications are to be added later. 4.5 Guangzhou Institute of Energy Research (Tuesday 16th September
1997)
The Guangzhou Institute is one of nine national institutes, and in Guangzhou about 30 people are working with bioenergy. Their special interest was on thermal gasification of wood powder and rice husks. The main activities are presented in Tables 8 and 9 as well as Figure 7. The driving force was small and medium-scale power generation and to some extent also heat production. About 30 gasifiers were believed to be in operation, with about five under construction. The key people there are Professor Xu Bingyan who is now partially retired and Professor Wu. The Research Institute employs 25 people in total with 70% of their funding from the State which pays all the salaries, the additional 30% comes from sponsors including industry. Table 8 Biomass Resources in China - Structure of Primary Energy Consumption
Page 39
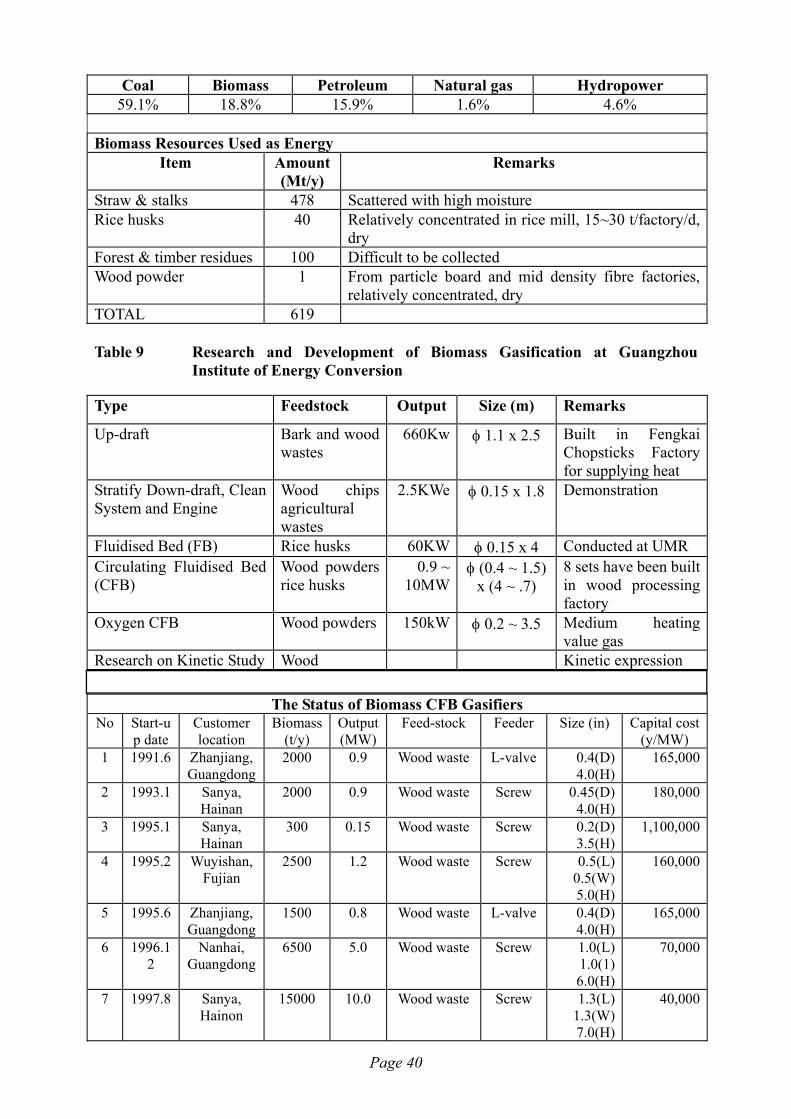
Coal Biomass Petroleum Natural gas Hydropower 59.1% 18.8% 15.9% 1.6% 4.6%
Biomass Resources Used as Energy
Item Amount (Mt/y)
Remarks
Straw & stalks 478 Scattered with high moisture Rice husks 40 Relatively concentrated in rice mill, 15~30 t/factory/d,
dry Forest & timber residues 100 Difficult to be collected Wood powder 1 From particle board and mid density fibre factories,
relatively concentrated, dry TOTAL 619
Table 9 Research and Development of Biomass Gasification at Guangzhou
Institute of Energy Conversion
Type Feedstock Output Size (m) Remarks
Up-draft Bark and wood wastes
660Kw φ 1.1 x 2.5 Built in Fengkai Chopsticks Factory for supplying heat
Stratify Down-draft, Clean System and Engine
Wood chips agricultural wastes
2.5KWe φ 0.15 x 1.8 Demonstration
Fluidised Bed (FB) Rice husks 60KW φ 0.15 x 4 Conducted at UMR Circulating Fluidised Bed (CFB)
Wood powders rice husks
0.9 ~ 10MW
φ (0.4 ~ 1.5) x (4 ~ .7)
8 sets have been built in wood processing factory
Oxygen CFB
Wood powders 150kW φ 0.2 ~ 3.5 Medium heating value gas
Research on Kinetic Study Wood Kinetic expression
The Status of Biomass CFB Gasifiers No Start-u
p date Customer location
Biomass (t/y)
Output (MW)
Feed-stock Feeder Size (in) Capital cost (y/MW)
1 1991.6 Zhanjiang, Guangdong
2000 0.9 Wood waste L-valve
0.4(D) 4.0(H)
165,000
2 1993.1 Sanya, Hainan
2000 0.9 Wood waste Screw 0.45(D) 4.0(H)
180,000
3 1995.1 Sanya, Hainan
300 0.15 Wood waste Screw 0.2(D) 3.5(H)
1,100,000
4 1995.2 Wuyishan, Fujian
2500 1.2 Wood waste Screw 0.5(L) 0.5(W) 5.0(H)
160,000
5 1995.6 Zhanjiang, Guangdong
1500 0.8 Wood waste L-valve
0.4(D) 4.0(H)
165,000
6 1996.12
Nanhai, Guangdong
6500 5.0 Wood waste Screw 1.0(L) 1.0(1) 6.0(H)
70,000
7 1997.8 Sanya, Hainon
15000 10.0 Wood waste Screw 1.3(L) 1.3(W) 7.0(H)
40,000
Page 40

8 1997.9 Nanning, Guangxi
15000 10.0 Wood waste Screw 1.3(L) 1.3(W) 7.0(H)
40,000
9 1997.10
Putian, Fujian
10000 7.0 Rice hulls Screw 1.5(L) 1.5(W) 7.0(H)
45,000
Figure 7 Scheme of the Biomass Gasification and Generation System (1000 kW)
Page 41

They are working on downdraft and updraft gasifiers and more recently on a circulating fluid bed gasifier for wood waste and rice husks. They are also looking at tar cracking using dolomite and nickel but as this is a new project there are no results yet. Another project they are working on is the pyrolysis of plastics and tyres in a fixed bed down flowing pyrolyser that is heated through the walls using the offgas from the pyrolysis process. The reactor is 25 mm in diameter and 2 meters long. The combuster is a fluidised bed operating at around 400ºC. For rice husks, the open core down-draft gasifier, connected to a 200 kWe gas engine, was the dominant type. The largest installation developed 1 MWe electricity with five engines, and a new engine of 1 MWe for producer gas is under development. The main problem with down-draft gasifiers is disposal of poor quality waste water, which was clearly seen during the visit to a rice mill with two gasifiers and two engines of 200 kWe each. GIER are active in developing such systems. The gas is cleaned and cooled by water scrubbing before introduction into an engine. The waste water is settled and in some cases aerated in a simple basin, but the chemical and biological load to rivers is far too high. For this reason, catalytic gas cleaning is the dominant R&D area for fixed-bed gasification. GIER are also active in this area and planning considerable expansion in their RD&D. The effect of limestone and dolomite is tested in a laboratory fluid-bed reactor of about 15 cm in diameter. There was also great interest in nickel-based catalysts. Tar sampling and gas cleaning measurements and results were discussed. Some VTT reports on tar sampling and gas cleaning results have been sent. For rice husks gasification the second problem was the high content of unburned carbon in the ash of typically 30 - 50 %. The ash is usually landfilled but it contains too much organic load and can be leached by rain. As a result, there is a enormous demand for advanced rice husks conversion systems in the size range of 0.1 -5 MWe. There is claimed to be 40 Mt/y rice husks which require disposal which also offer a substantial biomass resource, potentially offering up to 5000 MWe. Some rice husks are already combusted in boilers. Fluid-bed gasification is the main area of interest at GIER for power generation. In the institute there are two small-scale gasifiers (4 and 15 cm in diameter) for fundamental research into fuels, reactivity, gas cleaning, etc. A conventional well-equipped fuel laboratory was also visited. The main interest is on bubbling-bed gasifiers with ash and char recycle (called circulating fluid-bed gasifiers). The entrepreneurs in co-operation with the Institute have build so far eight units in the size range of 0.4 - 10 MWth. The diameter of the gasifiers is 0.4 - 1.5 m and 4 - 7 m in height. The main fuels are wood powder from wood-processing factories and rice husks at a smaller scale. The newest installation is located in Nanning where a 10 MWth fluid bed gasifier is connected to a 80 MWth coal-fired CFB boiler. Dry wood powder is gasified and the resultant gas replaces up to 30% of the coal. After cyclone cleaning, the gas is introduced to the boiler via a 20 m long transportation pipe. The gasifier was needed to produce fuel gas to replace coal because elutriation from the coal boiler was expected to be too high. It was not clear if direct injection instead of fluid bed gasification was really needed, there might be some other reasons why this installation is favourable in this case. Perhaps the high percentage of coal replacement by wood powder was the main reason and benefit of gasification. However, this 9 MWth installation is an excellent demonstration project for gasification. Because the particle size is less than one millimetre, pyrolysis and gasification reactions with air are very fast and almost complete carbon conversion can be reached. Possibilities for Integrated Gasification Combined Cycle (IGCC) were also discussed.
Page 42
However, the question of competitiveness of this technology is important, as it is not usually attractive at capacities lower than 20 MWe compared to combustion and a steam cycle in terms of efficiency and cost. Table 9 above shows a list of fluid bed gasifier references at Guangzhou Institute. The capital costs were claimed as typically 150,000 - 40,000 Yuan/MWe for a turnkey plant. The lower number is for larger units of 7 to 10 MWe. The Guangzhou Institute concentrates on thermal gasification technologies. It has no activities on biomass combustion and steam cycles. For this reason, it was not obvious that the fixed-bed gasification route would be the most suitable compared to conventional combustion technologies. On the other hand, the existing gasification technology seems to be working technically, but will not meet the environmental standards in the future. That is why the technology must be improved either by gasifier modifications or by advanced gas-cleaning systems. The Guangzhou Institute is very active in the field of biomass gasification, and is probably the most active in fluid-bed gasification in China. The main areas for co-operation were defined as: • gas cleaning for engine and pipe line applications, • gasifier design for improved carbon conversion and • concept development for advanced small and medium-scale power generation by
gasification from local biomass. Possible co-operation activities are defined at the end of this report. 4.5.1 Current gasifier problems - Discussion with GIER.
Three problems with rice husk gasification were identified: 1. The ash contains high levels of carbon (up to 30%) reducing performance and creating a
waste disposal problem. The gasifiers are oversized which adversely affects the economics.
2. The tar content of the gas is too high resulting in high engine maintenance costs. E.g. spark plugs are replaced every month and a major overhaul with some cylinder liner replacement every six months.
3. The wash water is very polluting. The scale of rice mills is increasing and it is necessary to consider 500 kWe units now and later 1 or 2 MWe. GIER are developing a CFB system to process 600 kg/h rice husks with 18% ash. This operates at 600-700ºC to avoid ash sintering. This will process 30 t/d for 16 hours/day and give 1MWe from 5 engines of 200 kWe each. Tar production levels have been measured for different gasifier types as 5 g/m3 from updraft, 3 g/m3 from downdraft and 2 g/m3 from CFB 4.6 Engine manufacturer
The company converts medium speed diesel engines to normal compression rating spark ignition engines. 30 engines are sold per year to run on gas with 15 running on producer gas from gasifiers. They claim to be the only company making such conversions. 300 engines have been sold to run on LHV gas in total including supplying 50 to Indonesia. Engines to run on coal mine gas are also popular and there is ongoing co-operation with the USA. In Europe the company is co-operating with AVL of Austria for natural gas. De-rating was claimed to be 50% for LHV gas i.e. a 400 kWe diesel engine becomes 290 kWe
Page 43

on natural gas and 220 kWe on producer gas. A 800 kWe diesel engine is currently being modified to produce 500 kWe from producer gas. This is a current project with GIER. Conventional diesel engines are sold in the range 220-1280 kWe. Other companies are producing dual fuel engines up to a maximum size of 800 kWe from biogas. 4.7 Rice husk resources
It was claimed that there is 400 mt/y rice produced per year with about 20% husks production. The average size of a rice mill is about 150 t/d rice over a 16 hour day, giving about 30 t/d husks. The rice straw is traditionally used as a fuel in villages but is being replaced by kerosene. Rice husk disposal is becoming a major problem. It was claimed that about 40 Mt/y rice husks are available for conversion in China. 4.8 Rice husk gasifiers for power generation
Two visits to operational rice husk gasifiers were made. 4.8.1 Gasifiers 1
The first set of gasifiers was at the Huang family in Longhai county. The factory processes between 120 and 150 tonnes per day of paddy which contains around 20% husk. The basis of the process is milling to separate the rice from the husk. This gives rise to about 30 tonnes per day of husk. The conversion efficiency is 2.1 kg of husk per kilowatt hour generated. The husks are gasified in two open core throated gasifiers, approximately 1.5 meters in diameter. (Figure 8) The offgas is water scrubbed in three sequential scrubbers, each approximately 4 meters high and 0.8 meters diameter. The water is re-circulated via an open external tank. Each gasifier drives a 160 kWe engine running at 600 rpm (Figure 9). The engines are spark ignition engines modified from diesel. More information is available on these engines elsewhere in this report. The system runs for 16 hours per day.
Figure 8 Open core downdraft gasifiers running on rice husks
Page 44
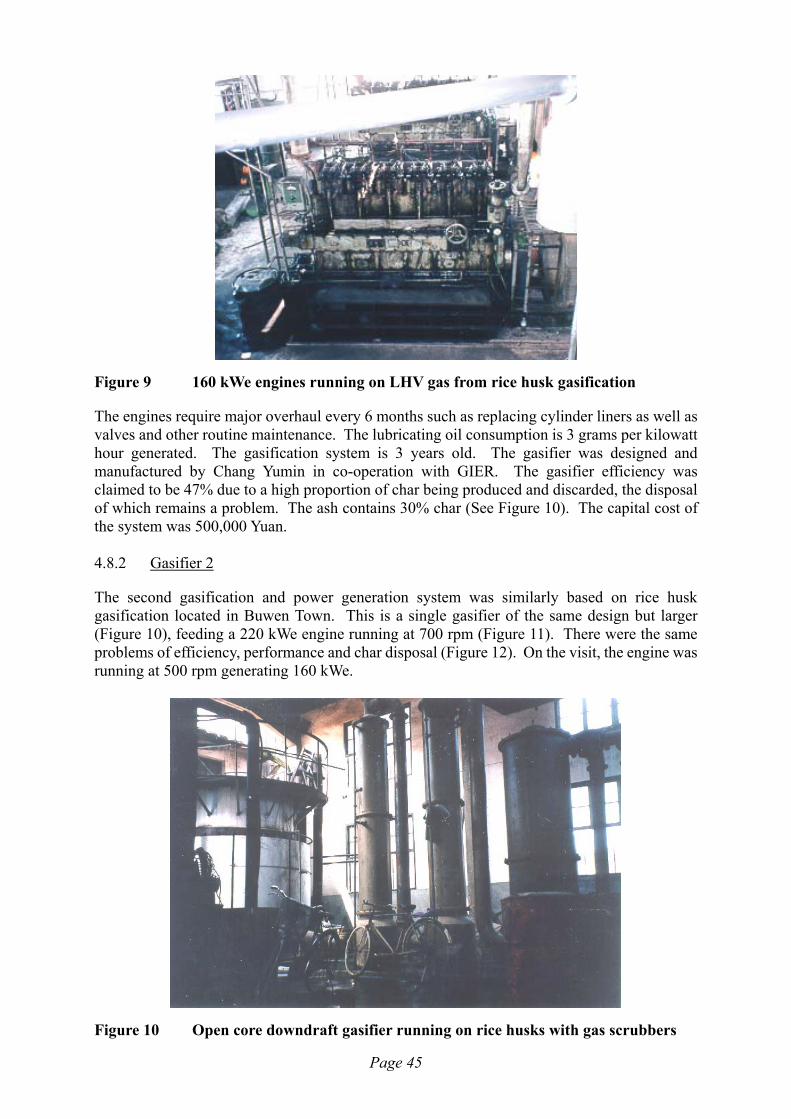
Figure 9 160 kWe engines running on LHV gas from rice husk gasification
The engines require major overhaul every 6 months such as replacing cylinder liners as well as valves and other routine maintenance. The lubricating oil consumption is 3 grams per kilowatt hour generated. The gasification system is 3 years old. The gasifier was designed and manufactured by Chang Yumin in co-operation with GIER. The gasifier efficiency was claimed to be 47% due to a high proportion of char being produced and discarded, the disposal of which remains a problem. The ash contains 30% char (See Figure 10). The capital cost of the system was 500,000 Yuan. 4.8.2 Gasifier 2
The second gasification and power generation system was similarly based on rice husk gasification located in Buwen Town. This is a single gasifier of the same design but larger (Figure 10), feeding a 220 kWe engine running at 700 rpm (Figure 11). There were the same problems of efficiency, performance and char disposal (Figure 12). On the visit, the engine was running at 500 rpm generating 160 kWe.
Figure 10 Open core downdraft gasifier running on rice husks with gas scrubbers
Page 45

Figure 11 220 kWe engine running on LHV gas from rice husk gasification
Figure 12 Char waste from rice husk gasification creating a waste disposal problem
Page 46

5 IMPLEMENTATION
Two distinct opportunities emerged for gasification technology implementation in China: 1 Biomass gasification in villages for production of fuel gas for distribution or for power
generation such as the opportunity identified for central household cooking in Huoshi village, Jinzhou district.
2 Waste gasification in companies for power and heat generation within the factory 5.1 Feasibility of central production of LHV cooking gas from biomass
for villages
About 30 low heating value gas biomass gasification units for central cooking at a village level are presently in operation in China. According to the Chinese experts at the meeting in Huoshi village, these units are economically feasible. Economic feasibility is also indicated by the large number of units installed. Apparently, the economic data are known and favourable which has resulted in the rapid spread of this technology. From this data it may be concluded that such projects at village level can be attractive provided sufficient cheap biomass is available. 5.2 Biomass availability at Huoshi village
Huoshi village has 1000 families who reportedly need 5 m3 of LHV gas per day. If this gas is assumed to have 5.2 MJ/m3 and each kg of biomass produces 1.9 m3 gas, a unit of 26000 MJ/day consuming 2.6 tons of biomass/day can be considered requiring 960, say a thousand, tons of biomass/year. According to the information provided at Huoshi village (see Section 2.4) this amount of biomass is available. So it can be preliminarily concluded that Huoshi village has the potential for a biomass gasification system to supply all homes with cooking gas in an economically feasible way. These data are sufficiently positive to be able to define a tender for supply of a central cooking gas facility in Huoshi village. Based on the tenders received, a final economic analysis should be prepared by LIER in co-operation with the mission experts. 5.3 State of the art of Chinese technology
The present state of the art of low heating value gas biomass gasification technology in China is described by Sun et al. (1997) in the above mentioned conference proceedings. It is conventional down-draft technology in combination with conventional (wet) gas cleaning and filtering. According to the providers of the technology, the tar content in the cooking gas is only 100 mg/Nm3 which is not a problem because the pipes sloping with condensing water and condensed tars being collected from the lowest point and periodically removed. According to other experts however, the tar content runs as high as 1 g/Nm3 and really provides the main problem. 5.4 Gas quality specification
Whichever of these claims is true, European technology should be superior, particularly in respect of gas quality. A specification of a maximum of 30 mg/Nm3 but preferably below 10 mg/Nm3 should be set, which is an order of magnitude better than the best claims of present
Page 47

Chinese state of the art. The dust contents of the present Chinese units are unknown but particulates may cause fouling, particularly in association with tar and are not healthy. Therefore, this figure should also be low, preferably as low as required for gas engines which is typically 30 ppm. 5.5 Opportunities for Projects
Three potential projects have been identified: 1 Village gas production for fuel gas for cooking, although electricity may be produced, 2 Power generation from rice husks in factories by gasification and engine, 3 Power generation from rice husks in factories by combustion and boiler. 5.5.1 Village system
An installation capable of producing a low heating value gas from various biomass resources of up to 20% moist (dry basis) having a minimum heating value of 5.2 MJ/Nm3. Fuels may vary from wood wastes and sawdust from a timber factory, agricultural wastes as maize and millet stalks and prunings from fruit trees. Additional information is required on the biomass arising as defined in section 2.4.5, and it is suggested that LIER should be asked to specify the fuel more accurately including for example size, moist, availability over the year per fuel type etc. The installation should include the necessary feed preparation equipment to guarantee that the gasifier and its feeding system can handle any of the above feedstocks up to the desired capacity of the installation. The variability of gas demand will have a significant impact on the nominal size, turn-down and storage requirements for feedstock and product gas. The gas might be assumed to be used for cooking with roughly 40% consumed in 1.5 hours at lunch, 40% in 1.5 hours at dinner and the rest in the morning between 6 and 7 a.m. If production is foreseen in 2 shifts of 8 hours each, the production capacity should be 1625 MJ/hr or 450 kWth. The gas storage facility should have a capacity of half a day, i.e. 2500 m3. Careful design of the system with suitable feed storage and gas storage is necessary to ensure that sufficient gas is available to meet demand over each day, each week and each season of the year. A conceptual layout is shown in Figure 13. The offer should give details on piping as well, unless this is managed locally. To reduce costs, this should be left to the Chinese authorities. The same is proposed on waste water handling facilities. In order to provide a framework for progressing the ideas presented, a draft specification is given in Table 10. This is not intended to be definitive nor binding, but to provide the basis for further discussions.
Page 48
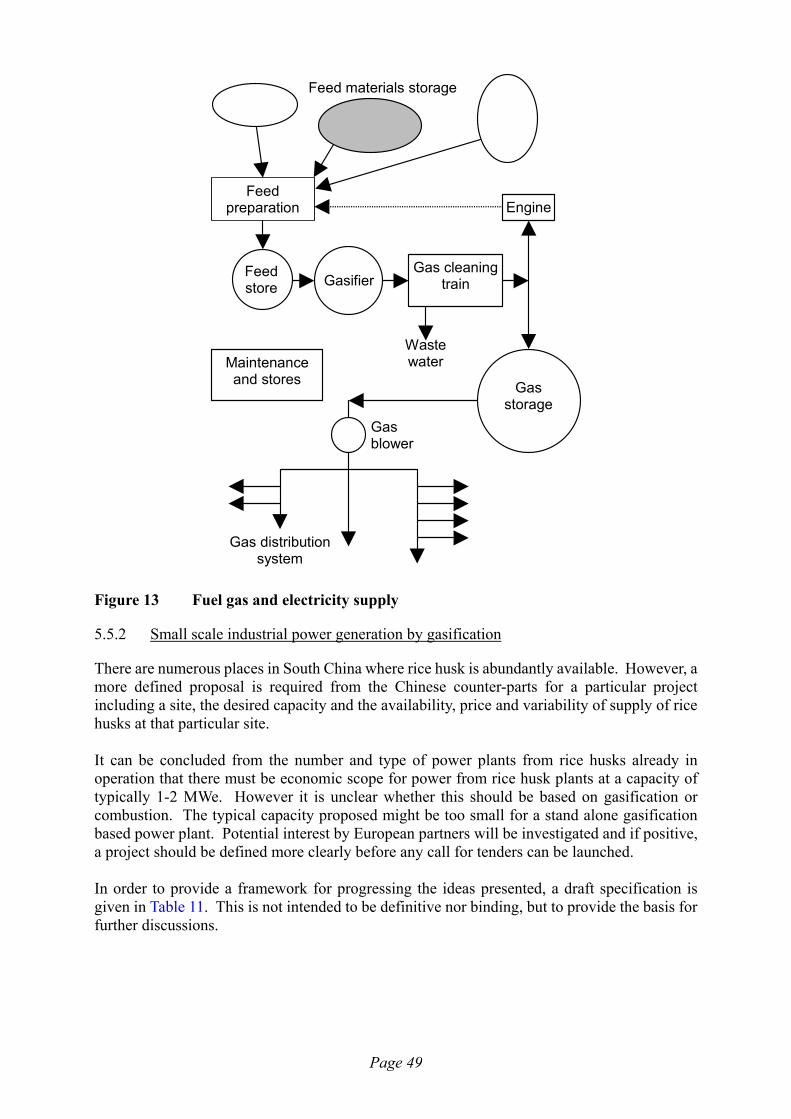
EngineFeed
preparation
Feed materials storage
GasifierFeedstore
Gasstorage
Gas cleaningtrain
Gas distributionsystem
WastewaterMaintenance
and stores
Gasblower
Figure 13 Fuel gas and electricity supply
5.5.2 Small scale industrial power generation by gasification
There are numerous places in South China where rice husk is abundantly available. However, a more defined proposal is required from the Chinese counter-parts for a particular project including a site, the desired capacity and the availability, price and variability of supply of rice husks at that particular site. It can be concluded from the number and type of power plants from rice husks already in operation that there must be economic scope for power from rice husk plants at a capacity of typically 1-2 MWe. However it is unclear whether this should be based on gasification or combustion. The typical capacity proposed might be too small for a stand alone gasification based power plant. Potential interest by European partners will be investigated and if positive, a project should be defined more clearly before any call for tenders can be launched. In order to provide a framework for progressing the ideas presented, a draft specification is given in Table 11. This is not intended to be definitive nor binding, but to provide the basis for further discussions.
Page 49

Table 10 Draft Specification Of Village Gas Supply System
Feedstock Type 1 2 3 4 Description Maize stalks Prunings Wood waste Corn cobs Size delivered Up to 1 m Up to 1m 1 to 300 mm 200 - 400 mm Moisture delivered Up to 25% Up to 50% Up to 20% Up to 50% Months produced To be specified To be specified To be specified To be specified Feed Pretreatment Feed storage Yes Yes Yes Yes Storage time, days To be specified To be specified To be specified To be specified Comminution needs Yes Yes Yes Yes Drying requirement To be specified To be specified To be specified To be specified Conveyance To be specified To be specified To be specified To be specified Gasifier Type To be specified Throughput, dry kg/h 200 to 500 Hours operation / day 16 Days operation / week 7 Days operation / year 365 Moisture maximum To be specified Moisture minimum To be specified Gas cleaning To be specified Tar cracking To be specified Product gas Higher heating value, minimum, MJ/Nm3 5 Tar content, maximum, mg/Nm3 10.0 Particulates, maximum size, µm 5 Particulates, maximum quantity, mg/Nm3 10.0 Moisture content, maximum, ppm Dew point less than 20°C Gas storage required, days 1.0 Gas burners To be recommended by gasifier supplier Waste streams Gas To be specified Liquid, aqueous To be specified tar To be specified Solid, char content of ash 20% maximum
Page 50
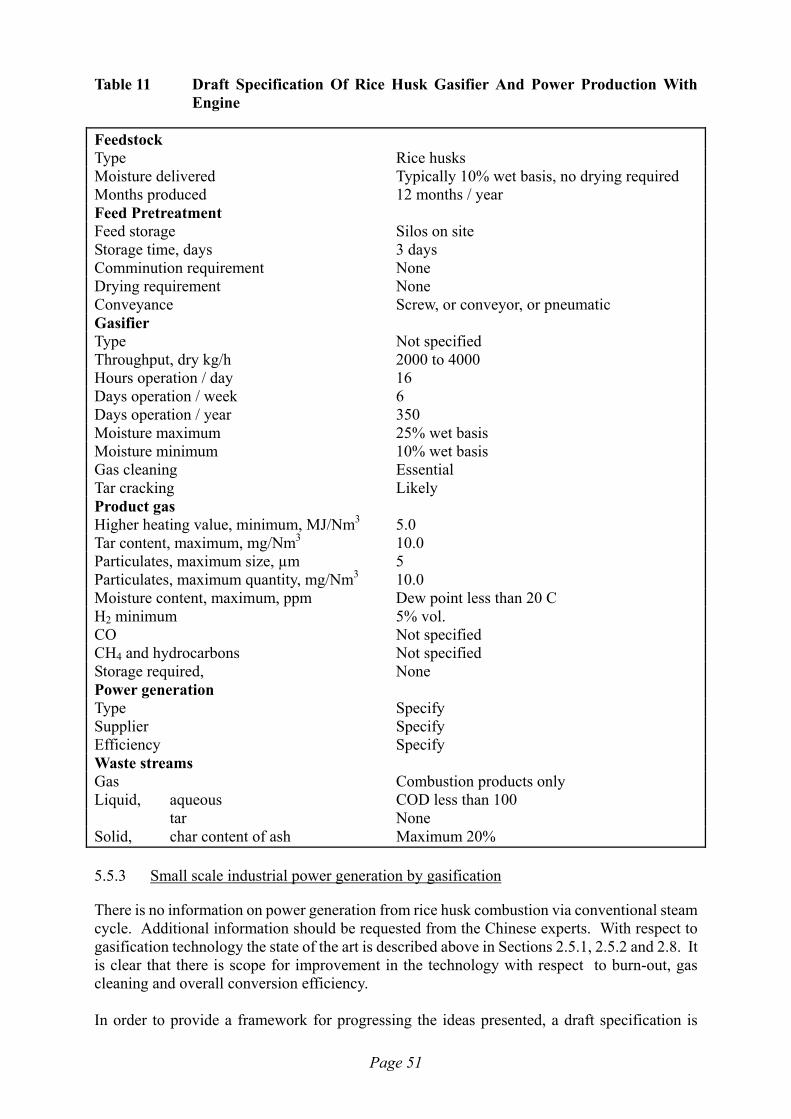
Table 11 Draft Specification Of Rice Husk Gasifier And Power Production With Engine
Feedstock Type Rice husks Moisture delivered Typically 10% wet basis, no drying required Months produced 12 months / year Feed Pretreatment Feed storage Silos on site Storage time, days 3 days Comminution requirement None Drying requirement None Conveyance Screw, or conveyor, or pneumatic Gasifier Type Not specified Throughput, dry kg/h 2000 to 4000 Hours operation / day 16 Days operation / week 6 Days operation / year 350 Moisture maximum 25% wet basis Moisture minimum 10% wet basis Gas cleaning Essential Tar cracking Likely Product gas Higher heating value, minimum, MJ/Nm3 5.0 Tar content, maximum, mg/Nm3 10.0 Particulates, maximum size, µm 5 Particulates, maximum quantity, mg/Nm3 10.0 Moisture content, maximum, ppm Dew point less than 20 C H2 minimum 5% vol. CO Not specified CH4 and hydrocarbons Not specified Storage required, None Power generation Type Specify Supplier Specify Efficiency Specify Waste streams Gas Combustion products only Liquid, aqueous COD less than 100 tar None Solid, char content of ash Maximum 20% 5.5.3 Small scale industrial power generation by gasification
There is no information on power generation from rice husk combustion via conventional steam cycle. Additional information should be requested from the Chinese experts. With respect to gasification technology the state of the art is described above in Sections 2.5.1, 2.5.2 and 2.8. It is clear that there is scope for improvement in the technology with respect to burn-out, gas cleaning and overall conversion efficiency. In order to provide a framework for progressing the ideas presented, a draft specification is
Page 51

given in Table 12. This is not intended to be definitive nor binding, but to provide the basis for further discussions. Table 12 Draft Specification Of Rice Husk Combustor And Power Production With
Boiler And Steam Engine/Turbine
Feedstock Type Rice husks Moisture delivered Typically 10% wet basis, no drying required Months produced 12 months / year Feed Pretreatment Feed storage Silos on site Storage time, days 3 days Comminution requirement None Drying requirement None Conveyance Screw, or conveyor, or pneumatic Combustor Type Throughput, dry kg/h 2000 to 4000 Hours operation / day 16 Days operation / week 6 Days operation / year 350 Moisture maximum 25% wet basis Moisture minimum 10% wet basis Steam conditions Temperature Specify Pressure Specify Saturation Specify Power generation Type Specify Supplier Specify Efficiency Specify Waste streams Flue gas Particulates, maximum size, µm 5 Particulates, maximum quantity, mg/Nm3 10.0 Temperature Specify Liquid, aqueous COD less than 100 Solid, char content of ash 10%
5.6 European technology available
5.6.1 Small scale fixed bed gasification
For a relatively small plant as discussed here, moving bed technology probably is the only economically viable choice. Without advanced gas upgrading technology the only system that may come close to the severe tar requirements set, will probably be based on down-draft gasification with internal pyrolysis gas recycle and combustion. However this system has only been proven for wood chips at up to 25 kg/h. Therefore it needs up-scaling and proved feedstock versatility before guarantees can be given. Another candidate with potentially attractive technology is BTG (Netherlands). Here both a
Page 52
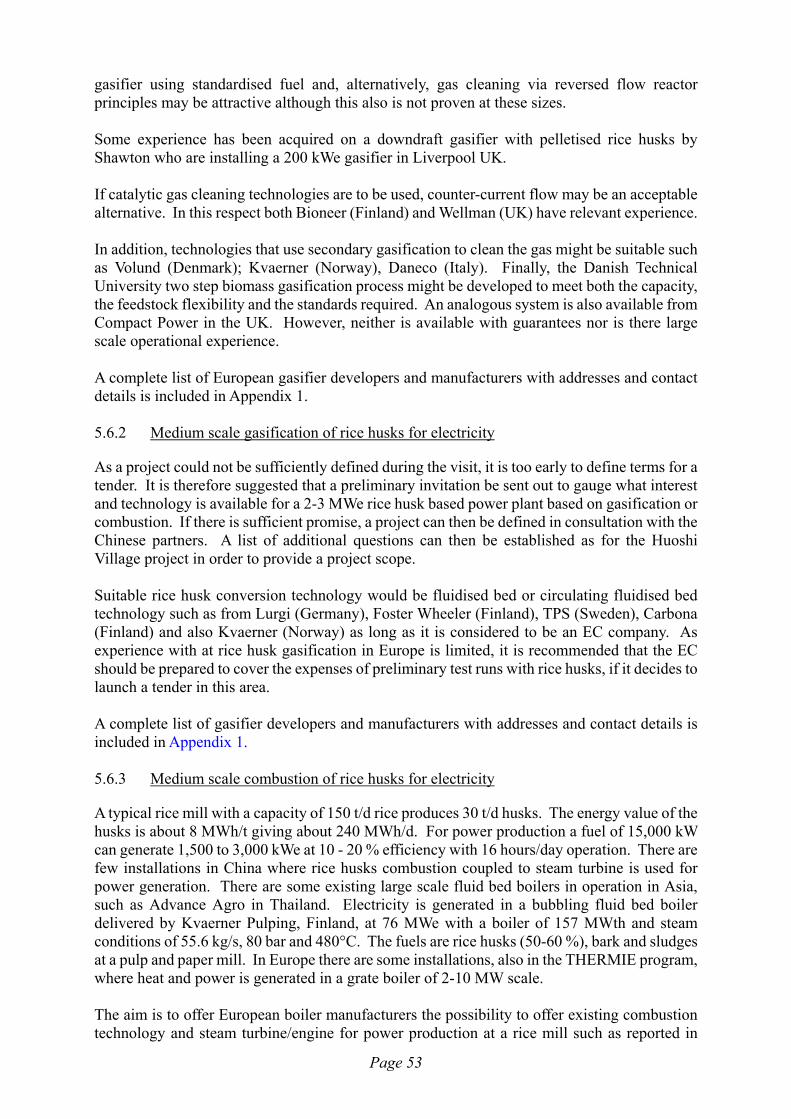
gasifier using standardised fuel and, alternatively, gas cleaning via reversed flow reactor principles may be attractive although this also is not proven at these sizes. Some experience has been acquired on a downdraft gasifier with pelletised rice husks by Shawton who are installing a 200 kWe gasifier in Liverpool UK. If catalytic gas cleaning technologies are to be used, counter-current flow may be an acceptable alternative. In this respect both Bioneer (Finland) and Wellman (UK) have relevant experience. In addition, technologies that use secondary gasification to clean the gas might be suitable such as Volund (Denmark); Kvaerner (Norway), Daneco (Italy). Finally, the Danish Technical University two step biomass gasification process might be developed to meet both the capacity, the feedstock flexibility and the standards required. An analogous system is also available from Compact Power in the UK. However, neither is available with guarantees nor is there large scale operational experience. A complete list of European gasifier developers and manufacturers with addresses and contact details is included in Appendix 1. 5.6.2 Medium scale gasification of rice husks for electricity
As a project could not be sufficiently defined during the visit, it is too early to define terms for a tender. It is therefore suggested that a preliminary invitation be sent out to gauge what interest and technology is available for a 2-3 MWe rice husk based power plant based on gasification or combustion. If there is sufficient promise, a project can then be defined in consultation with the Chinese partners. A list of additional questions can then be established as for the Huoshi Village project in order to provide a project scope. Suitable rice husk conversion technology would be fluidised bed or circulating fluidised bed technology such as from Lurgi (Germany), Foster Wheeler (Finland), TPS (Sweden), Carbona (Finland) and also Kvaerner (Norway) as long as it is considered to be an EC company. As experience with at rice husk gasification in Europe is limited, it is recommended that the EC should be prepared to cover the expenses of preliminary test runs with rice husks, if it decides to launch a tender in this area. A complete list of gasifier developers and manufacturers with addresses and contact details is included in Appendix 1. 5.6.3 Medium scale combustion of rice husks for electricity
A typical rice mill with a capacity of 150 t/d rice produces 30 t/d husks. The energy value of the husks is about 8 MWh/t giving about 240 MWh/d. For power production a fuel of 15,000 kW can generate 1,500 to 3,000 kWe at 10 - 20 % efficiency with 16 hours/day operation. There are few installations in China where rice husks combustion coupled to steam turbine is used for power generation. There are some existing large scale fluid bed boilers in operation in Asia, such as Advance Agro in Thailand. Electricity is generated in a bubbling fluid bed boiler delivered by Kvaerner Pulping, Finland, at 76 MWe with a boiler of 157 MWth and steam conditions of 55.6 kg/s, 80 bar and 480°C. The fuels are rice husks (50-60 %), bark and sludges at a pulp and paper mill. In Europe there are some installations, also in the THERMIE program, where heat and power is generated in a grate boiler of 2-10 MW scale. The aim is to offer European boiler manufacturers the possibility to offer existing combustion technology and steam turbine/engine for power production at a rice mill such as reported in
Page 53

Section 2.8. The amount of rice husks is 30 t/d equal to 240 MWh/d. At the moment there is no outlet for the heat, only electricity will be generated. In the future there might be possibilities for hot water and low pressure steam markets The boiler ash will be landfilled. The aim is to continue detailed discussions with the European industry and Chinese delegations in order to prepare three separate cases for rice husk utilisation. The technologies are: a) in small scale fixed bed gasification and clean gas combustion for cooking, b) in medium scale fixed bed gasification and clean gas engine/combustion for power generation and c) in large scale combustion for electricity generation. 5.7 Recommendations
It is recommended that: 1 all the above companies be sent a copy of this report (in confidence) and asked whether
they are interested in tendering for any of the opportunities defined in Sections 4.6.1 for village fuel gas, 4.6.2 for power production via gasification, and/or 4.6.3 for power production via combustion. .
2 any company which expresses serious interest and is perceived to have a suitable technology be invited to Brussels to meet the EC Project Officer and the Expert Team for discussions and that the EC provides support for this.
3 serious consideration be given to supporting relevant RD&D in support of a company offering a suitable technology as it is unlikely that any European company will have sufficient experience on the feedstocks concerned to enable them to offer any sort of guarantee.
4 the questions set out below be sent the Chinese Group for their consideration.
Page 54

6 FURTHER INFORMATION REQUIREMENTS
Additional information is required to refine the specifications and assist potentially interested companies. This is set out below: 6.1 Chinese policies
1. The Chinese authorities plan to replace wood and biomass burning stoves from 25% currently to 10% by 2010 and to 5% by 2020 through replacement with high performance and less polluting technology. What mechanisms will be applied to achieve this?
2. What is the electricity cost and what is the cost and economic incentive for providing it locally. Are electricity costs fixed per person or per household or based on consumption. If fixed, what incentives are there to restrict or control usage?
3. What business and commercial mechanisms and constraints are available for establishing new technologies and new and joint ventures in China?
6.2 Technical and market data
1. To raise the interest of European Companies, market studies are needed on the potential market for each technologies proposed, this will be taken as a variable input parameter.
2. For the sake of possible partnership formation between Chinese and EC industrialists, could a list of commercial companies be provided in: • fixed bed gasifiers • (circulating) fluid bed gasifiers • combusters • diesel engine manufacturers • steam and gas turbine manufacturers and importers Any relevant data on these companies would be welcome.
6.3 Huoshi village
6.3.1 Feedstocks
1. Is there sufficient biomass to provide fuel gas or electricity for the village? 2. When does this fuel arrive (seasonally) and how can it be stored.? 3. Should it be pre-processed such as by briquetting and what is the cost of this? 4. What does the fuel actually cost to buy apart from any processing prior to gasification? 5. The projected wood wastes from the parquet flooring factory may not be fully available
for gasification because some is required for steam raising at the factory. Of the projected total wood waste, how much is available?
6. What types of biomass are available and at what time of the year? 7. What are the prices per dry tons and what are the moisture contents of each type of feed? 8. Could the Chinese authorities confirm the biomass availability figures quoted in section
2.4.1 or provide up dated information? 9. Could the Chinese authorities confirm the biomass and utility cost figures quoted in
section 2.4.2 or provide up dated information? 10. What other wastes and residues could be made available and at what cost? 6.3.2 Products
1. What is the preferred product from the village gasifier - fuel gas for distribution or electricity?
Page 55

2. How much fuel gas is needed for cooking, and how does the demand for gas vary over the day, over the week and over the year.?
3. Will the fuel gas be used for heating or any other purpose and if so how much will be required?
4. What impact will changes in village population have on the size of the installation? 5. What skills and labour is available for operation of the unit? 6. Are any grants or subsidies available? 7. Will any industries use the gas? 8. Who will own and operate the facility? 9. Will the toxicity of the high carbon monoxide levels in the gas create a problem? 6.3.3 Gas distribution
1. Could the Chinese experts comment on the desired size of the storage facilities as gas storage facilities in Europe were traditionally about one day, but a facility of half a day is suggested for Huoshi?.
2. What is the variation of gas consumption over each day and over the different hours of the day as this is important in sizing the gasifier and the storage? Data should be available from other Chinese villages.
3. Will the gas piping system in the village and the water treatment system be left as the responsibility of the local authorities on the assumption that this technology is available locally?
6.3.4 General questions
1. Will the economics of the plant be negatively affected by the biogas plants already present in many farm houses?
2. Do the Chinese experts agree on the capacity proposal (1625 MJ/hr during 16 hrs/day) 3. Where will the site of the gasifier be and what provisions will be made for availability of
water, electricity, space for water treatment and space for biomass storage (although storage facilities are understood to be outside the project and provided locally).
4. Are the cooking installations to be adapted to the low calorific gas produced? If so, the costs should be considered and be taken into account in the feasibility study.
6.3.5 Additional comments and observations
Though not considered to be part of the EC project, the followed will need to be considered: 1. Design of the gas distribution system and the costs of it should be prepared. 2. Waste water treatment facilities will be needed 3. Biomass storage will be needed 4. Feed preparation will be needed 6.4 Questions on rice husk project
Although this project is less well defined and requires further consideration, some of the questions that will need to be asked are set out below. 6.4.1 Feedstocks
1. What are the arisings of rice husk? 2. What is the range of size plants that should be considered? 3. When does this fuel arrive (seasonally) and how can it be stored? 4. What is the cost of the rice husk?
Page 56

6.4.2 Products
1. Will any electricity be exported and if so, what is its value? 2. What skills and labour is available for operation of the unit? 3. Are any grants or subsidies available? 6.4.3 Gas distribution
1. What is the variation of electricity consumption over each day and over the different hours of the day as this is important in sizing the gasifier and generating set.
2. What turn down is required? 3. Will the gas piping system in the village and the water treatment system be left as the
responsibility of the local authorities on the assumption that this technology is available locally?
6.5 Questions to EC DG XVII
Initial trials with unknown feedstocks will be necessary to get superior EC technology proven for Chinese feedstocks. This is essential for rice husk conversion where Europe has no relevant experience in fluidised bed technology apart from some bench scale university experiments in Beenackers group in the early eighties. This will also be needed for the village fuel gas project based on local feedstocks. It is common practice that the costs of such experiments are paid by the project proposer. In fact, for projects in developing countries it is usual that even the costs of preparing tenders are paid by the proposer. Is DG XVII or the World Bank prepared to cover any or all of these expenses? Can European companies establish an independently operating business in China or do they need a Chinese partnership? If so what minimum percentage of participation is required? What procedures are necessary and how can the EC and this EC-China collaboration help?
Page 57
7 FURTHER EC-CHINA INTERACTIONS
7.1 China and EU Objectives
There are some fundamentally different views and objectives between the Chinese TORs and the EU and THERMIE Programmes which must be resolved if there is to be a successful outcome to these discussions. The European Commission is prepared to organise the selection, evaluation and establishment of one or more European gasification or combustion processes that fulfil the requirements set out in this report and which satisfy the objectives of the Chinese requirements. It is anticipated that support for this venture would come from the World Bank and the companies involved. It is not foreseen that the European Commission will contribute to the project in any way other than to assist the selection and evaluation of the processes and assist in the procurement of the necessary finance. While it is sincerely hoped that this project will lead to a long standing and mutually beneficial collaboration at institutional, research and commercial levels, there is no commitment to any further funding beyond the present project. 7.2 Further actions
There are two main actions that need to be undertaken: 1 Identify and encourage companies in EC to take advantage of this opportunity to export
technology and know-how, 2 Assist the relevant Chinese Authorities and Institutions in China to take advantage of
European technology in biomass gasification and combustion. 7.3 Involve European companies
The EC has to establish a mechanism to ensure that all companies in the EU with relevant technology are made acquainted with the opportunities in China. In addition to circulation of this report and advertising of the opportunities, it is recommended that a workshop be held to which all relevant EU companies be invited to summarise their processes before the Commission, the World Bank and a Chinese delegation. After the presentations, opportunities will be provided for the Chinese Delegation members to have further discussions, if necessary in private, and for site or company visits to be arranged. This does provide a cost effective forum for all parties to meet together and explore how to progress this project. However, the extent to which this can be supported by the EC is understood to be limited. 7.4 Barriers to implementation
A number of problems will need to be faced and satisfactorily addressed in setting up and implementing these projects in China. Such considerations are likely to be at the forefront of any preliminary negotiations so recognition and early resolution will expedite the projects. These aspects include: • Protection of intellectual property and proprietary technology, • Arrangements for establishing proper commercial relationships with secure financial
provisions, • Establishment of environmental requirements, • Establishment of any other local requirements, • Assurances of satisfactory local support such as feedstock availablility, properly skilled
labour, markets for products, adequate price levels, and authorisations,
Page 58

• Financing of the ventures, The European Commission would expect to have all such issues resolved in principle in advance of any detailed discussions and negotiations with European Companies so that satisfactory technical and commercial support can be provided in the project and technology selection and evaluation stages. 7.5 Provide assistance to Chinese organisations
There are several centres of excellence in biomass gasification in China such as at Guangzhou, which should be actively involved in any gasification developments in China. These institutes have extensive experience in operating biomass gasifiers and their experience would be most valuable is setting up, operating and developing any gasification or combustion projects, including provision of training and analytical support. There are other mechanisms open for general support through researcher and scientist exchange as well as the training that will accompany any successful industrial co-operation. 7.6 Continued co-operation
The visit and conference provided extensive evidence of a widespread interest in China in bio-energy and a sincere commitment to its development. This matches a similar level of activity in Europe and there is therefore a substantial incentive to develop closer and beneficial links between Chinese and European companies and between Chinese and European Research and Academic Institutes.
Page 59

8 REFERENCES
1 Mackie, KL, et al. Final Report of IEA Bioenergy Wastewater Activity, NZFRI, 1995 2 Beenackers, AACM and Maniatis, K, “Gasification technologies for heat and power from
biomass”, in Biomass Gasification and Pyrolysis, eds. Kaltschmitt, MK and Bridgwater AV (CPL Press, 1997)
3 Bridgwater, A.V. and Evans, G.D., "An assessment of thermochemical conversion systems for processing biomass and refuse", ETSU report B/T1/00207/REP, November 1993 (ETSU, UK-DTI, 1993)
4 Graboski, M.S. and Brogan, T.R., "Development of a downdraft modular skid mounted biomass/waste gasification system", in Klass, D. (Ed.) Energy from biomass and waste XI, (IGT, 1988)
5 Reed, T.B., "Operation of a pressurised downdraft gasifier to produce medium-Btu gas", Biofuels and municipal waste technology research program summary: FY 1986. Jul 1987. pp. 189, (US DOE/CH/10093-6, DE87001140)
6 Bridgwater, A.V., Maniatis, K. and Masson, H.A., "Gasification technology", in Pyrolysis and Gasification, Eds. Ferrero, G-L, Maniatis, K, Buekens, A and Bridgwater, A.V. pp 41-65, CEC, (EUR 12736, 1990)
7 Belleville, P. and Capart, R., "A model for predicting outlet gas concentrations from a wood gasifier", pp 217-228 in Bridgwater, A.V., (Ed.) Thermochemical Processing of Biomass, Butterworth, 1984; Also Shand, R.N. and Bridgwater, A.V., "Fuel gas from biomass: status and new modelling approaches", pp 229-254, ibid.
8 Bridgwater, A.V., "Catalysis in thermal biomass conversion processes", accepted by J. Applied Catalysis, 1994
9 LeMasle, J-M, Steine Industrie, Final report EC contract JOUB 0052, 1991 (EC 1991) 10 Lyytinen, H., "Biomass gasification as a fuel supply for lime kilns: description of recent
installations", Tappi Journal, 77-80, (July 1987). 11 Herbert, P.K. and Loeffler, J.C., "Gas from biomass and waste for industrial use",
Proceedings of conference on thermal power generation and the environment, Hamburg, September 1993 (Unipede and IEA)
12 Kurkela E, Ståhlberg P, Laatikainen J and Simell P., "Development of Simplified IGCC-Processes for Biofuels - Supporting Gasification Research at VTT", Bioresource Technology, Vol.46, No.1-2, pp 37-48, 1993
13 Corella, J., Herguido, J., Gonzalez-Saiz, J., Alday, FJ and Rodriguez-Trujillo, JL, in Bridgwater, AV and Kuester, JL (Editors), Research in Thermochemical Biomass Conversion, Elsevier Applied Science Publishers, London and New York, 1988, p. 754.
14 Mackie, KL, et al., IEA Bioenergy Agreement Environmental Systems Group, Interim report, FRI, New Zealand 1993.
15 Corman J C, "System Analysis of Simplified IGCC Plants", General Electric Company, Report No. ET14928-13, 1986
16 De Ruyck J, Maniatis K, Distlemans M and Baron G, "The Free University of Brussels Biomass Gasification CHP Plant", in "Advances in Thermochemical Biomass Conversion", Bridgwater AV (ed.), pp.411-422, Blackie Academic and Professional, 1994.
Page 60
APPENDIX 1
EUROPEAN GASIFIER DEVELOPERS AND MANUFACTURERS
Austrian Energy Fluid bed gasifier PO Box 2 A-1211 Vienna AUSTRIA Contact: Di Tauschitz Tel: 43 1 250 45 Biomass Technology Group
Downdraft gasification and tar cracking Fax: 43 1 250 45130 Twente University of Technology AHT J Ferges - See Ferges PO Box 217 Enschede NL 7500 AE Ansaldo - see TPS NETHERLANDS
Contact: H E M Stassen Arcus Umwelttechnik GmbH Tel: +31 53 489 2897 Downdraft gasification Fax: +31 53 489 3116 Schwarzer Mersch 2 Freren D-49832 Bioneer-Ahlstrom
Updraft gasification GERMANY A Ahlstrom Corporation B9 Energy P.O. Box 537 Downdraft gasification Hameenlinna SF-13111 9 Shipquay Street FINLAND Londonderry BT48 6DJ Tel: +358 17 233 71 Northern Ireland Fax: +358 17 238 21 UK Contact: D Jenkins BKW Bio-Kraftwerk-GmbH & Co. KG Tel +44 1504 271 520 C/o DG Bank Fax + 44 1504 308 090 Berliner Allee 5 Hannover D-30175 Baumann A GERMANY Downdraft gasification AG Florastr 2 Carbona Inc.
Fluid bed pressure gasification Thun CH 3601 SWITZERLAND Carbona Inc. PO Box 610 Bio-Heizstoffwerk Berlin GmbH FIN-33101 Tampere Mariendorfer Damm 49 FINLAND
Contact: K Salo Berlin D-12109 GERMANY Tel: +358 9 540 71550 Fax: +358 9 540 71540
Page 61

CFB Gasification CCT - see Ensofor Dept. Mechanical Engineering and Marine
Technology Chemrec Delft University of Technology Entrained flow gasification Delft Kvaerner Pulping AB NL-2628 CD Box 1033 NETHERLANDS
Contact: J Andries Karlstad SE-651 15 SWEDEN Tel: +46 54 19 46 00 De Montfort University
Gasifier, digester and wind hybrid system Fax: +46 54 19 46 41 Caythorpe Court Compact Power Caythorpe Pyrolytic gasification of waste Grantham NG32 3EP 33 Rodney Road UK
Contact Prof Jim Pickens Cheltenham GL50 1HX UK Tel +44 1400 272 521 Contact: J Acton Fax +44 1400 272 722 Tel: +44 1242 224243 Daneco – Daneco Gestione Impianti
Updraft gasification Fax +44 1242 221273 Udine Condens Oy ITALY Updraft gasification Contact: Dr Gianfranco Velcich Talkkunapolku 6 Hameenlinna Dinamec SEE Seghers Better Technology 13100 FINLAND Easymod Energiesysteme CmbH Contact: I Haavisto Downdraft gasification Reifergang 5a Danish Technological Institute Barth D-18356 Straw pyrolysis and gasification GERMANY Danish Technological Institute Aarhus Ensofor SA
Updraft gasification DK-8000 DENMARK Curio CH-6985 Tel: +45 8943 8617 SWITZERLAND
Contact: L Jaccard Fax: +45 8943 8673 DASAG Everhard Downdraft and entrained flow gasification Downdraft gasification Energy Engineering Ltd. UK Birchstr, 6, Contact J Seed, Border Biofuels Seuzach CH-8472 Tel: 01835 823 043 SWITZERLAND Ferges
Fixed bed up and downdraft gasification Delft University of Technology
Page 62

AM Wildpahl 5 Formerly: Wamsler Umwelttechnik GmbH Bergisch Gladbach D-51429 Dantestr 4-6 GERMANY Wiesbaden D-65189 GERMANY Fortum CFB gasification Imbert GmbH fur Energie und Umwelt
Downdraft gasification Robert-Bosch-STr. 7 Foster Wheeler Weilerswist Atmospheric fluid bed gasification and
pressure CFB gasification D-53919 GERMANY
R&D Centre Karhula SF 78201 KARA Engineering Almelo B.V.
Downdraft gasification FINLAND Contact: R Lundqvist PO Box 570 Tel: +358 5229 3314 7600 AN Almelo Fax: +358 5229 3309 NL 7602 PD NETHERLANDS
Contact: K Reinders Tel: +31 5490 76580 Fax: +31 5490 70525 Krupp-Uhde GmbH
Pressure fluid bed Gazogenes Chevet Friedrich Strasse 15 Downdraft gasification 44141 Dortmund Domaine Commalieres Germany
Contact: J Wolff Villarzel du Razes F-11300 Tel: +49 231 547 3734 FRANCE Fax: +49 231 547 3382 Tel: +33 05 68 31 71 11 Lurgi Energie und Umwelt GmbH
Circulating fluid bed gasification Fax: +33 05 68 31 52 22 Lurgiallee 5 Gibros bv Frankfurt/Main D-60295 Pyrolysis / gasification GERMANY PB 7324 Numansdorf 3280AC Martezo Touillet
Downdraft gasification Netherlands Tel: +31 186 653944 237 route de Paris Fax: +31 186 654380 Poitiers F-86000 Contact: JHO Hazelwinkel FRANCE Tel: +33 05 49 88 16 66 Hugo Petersen Umwelt Engineering Fax: +33 05 49 88 09 39 Downdraft gasification Gesellschaft fur verfahrenstechnischen
Anlagenbau mbH & Co. KG J Martin Downdraft gasifier
Page 63

Fluid bed gasification UCL/TERM Place du Levant 2 Austrian Drau Power Plants B-1348 Kohldorferstrasse 98 BELGIUM Zeltweg A-8740 Contact: J Martin AUSTRIA Tel: +32 10 472200 Fax: +32 10 452296 Rheinbraun AG Fluid bed gasification Melima Maschinenau Rheinbraun AG Downdraft gasification Cologne Loohof 1 GERMANY
Contact: H-P Schiffer Endingen CH-5304 SWITZERLAND Tel: +49 221 480 1 Fax: +49 221 480 3333 MHB Multifunktionelle Heizungs-und
Bausysteme GmbH Royal Schelde
Downdraft gasification Downdraft gasification Industriestr. 3 Schelde Milieutechnologie Furstenwalde D-15517 Houtkade 60 GERMANY 4460 AR Goes NETHERLANDS
Contact: G H Huisman Netherlands Energy Research Foundation (ECN) Tel: +31 113 221360
Gasification Fax: +31 113 221372 Business Unit: Fuels, Conversion and
Environment Rural Generation Ltd Downdraft gasification PO Box 1
Petten 1755 ZG Brook Hall Estate NETHERLANDS 65-67 Culmore Rd Contact: E P Schenk Londonderry BT48 8JE Noell Abfall- und Energietechnik GmbH Northern Ireland Fixed bed and entrained flow gasification UK
Contact: J Gilliland Alfred-Nobel-Str. 20 Wurzburg D-97064 Tel + 44 1504 354 635 GERMANY Fax +44 1504 350 970 Noell-KRC Energie-u Umwelttechnik
GmbH
Fixed bed gasification Halsbruckerstrasse 34 FREIBERG D-09599 GERMANY Tel: +49 3731 365 672 Scanarc Plasma Technologies AB
Updraft gasification with plasma tar cracking
Fax: +49 3731 365 672 ODK PO Box 41
Page 64
Hofors S-813 21 SWEDEN Tel: +46 290 230 50 Thermoselect S.A.
Pyrolysis + gasification Fax: +46 290 200 75 Piazza Pedrazzini 11 Seghers Better Technology 6600 Locarno Fluid bed SWITZERLAND
Contact: Dr K Oelmann Gentsesteenweg 311 B-9240 Zele Tel: +41 91 752 2340 Belgium Fax: +41 91 752 2370 Contact: A Geeroms Tel: +32 9 367 9494 TPS Termiska Processer AB (Studsvik)
Circulating fluid bed and tar cracking Fax: +32 9 367 9495 TPS Termiska Processer AB Shawton Engineering Studsvik Downdraft gasification Nykoping S 61182 Junction Lane SWEDEN
Contact: E Rensfelt Sankey Valley Industrial Estate Newton le Willows WA12 8DN Tel: +46 155 210 00 UK Fax: +46 155 630 52 Contact: M Walker Tel: +44 (0) 1925 220338 UET Umwelt- und Energietechnik Freiberg
GmbH Fax: +44 (0) 1925 220135 Carbo-V process: Pyrolysis / gasification
Siemens AG Pulvermuhlenweg Rotary kiln gasification Freiberg D-09599 Bereich Energierezeugung (KWU), GERMANY Thermische Entsorgung Freyeslebenstr. 1 Ventech Industrial Ltd
Downdraft gasification Erlangen D-91058 GERMANY Lamarsh Bures Tampella Power (Enviropower) Suffolk CO8 5EP Pressurised gasification UK
Contact: M Ling Tampella Inc. Research and Development Centre Osuusmyllynkatu 13 Tampere SF-33700 FINLAND Contact: R Hokajarvi Tel;+358 31 241 3555 Fax: +358 31 241 3599 VER Verwertung und Entsorgung von
Reststoffen GmbH Crossflow gasification
Kesselsdorfer Str. 216
Page 65
Dresden D-01169 UK Contact: T Grimshaw GERMANY
Tel: +44 1794 518141 Volund Energy Systems Fax: +44 1794 518143 Updraft gasification Head of Mechanical Design Department Wellman Process Engineering
Updraft gasification and tar cracking Falkevej 2 Esbjerg DK-6705 Furnace Green DENMARK Dudley Road Tel: +45 75 14 28 44 Oldbury B69 3DL Fax: +45 75 14 14 02 UK
Contact: R McLellan Waste Gas Technology (UK) Ltd Tel: +44 121 601 3000 Rotary kiln gasification Fax: +44 121 601 3123 22 Romsey Industrial Estate Greatbridge Road Romsey Hampshire SO51 0HR
Page 66

PART 2
Survey Study on Biomass Gasification in China
by
Yuan Zhenhong,
China Biomass Development Centre, Beijing, 100083 China
Wu Chuang-zhi,
Guanghzou Institute of Energy Conversion, Guanghzou, 510070 China
Sun Li,
Shandong Academy of Sciences, Jinan, 250014 China
December, 1998
Page 67
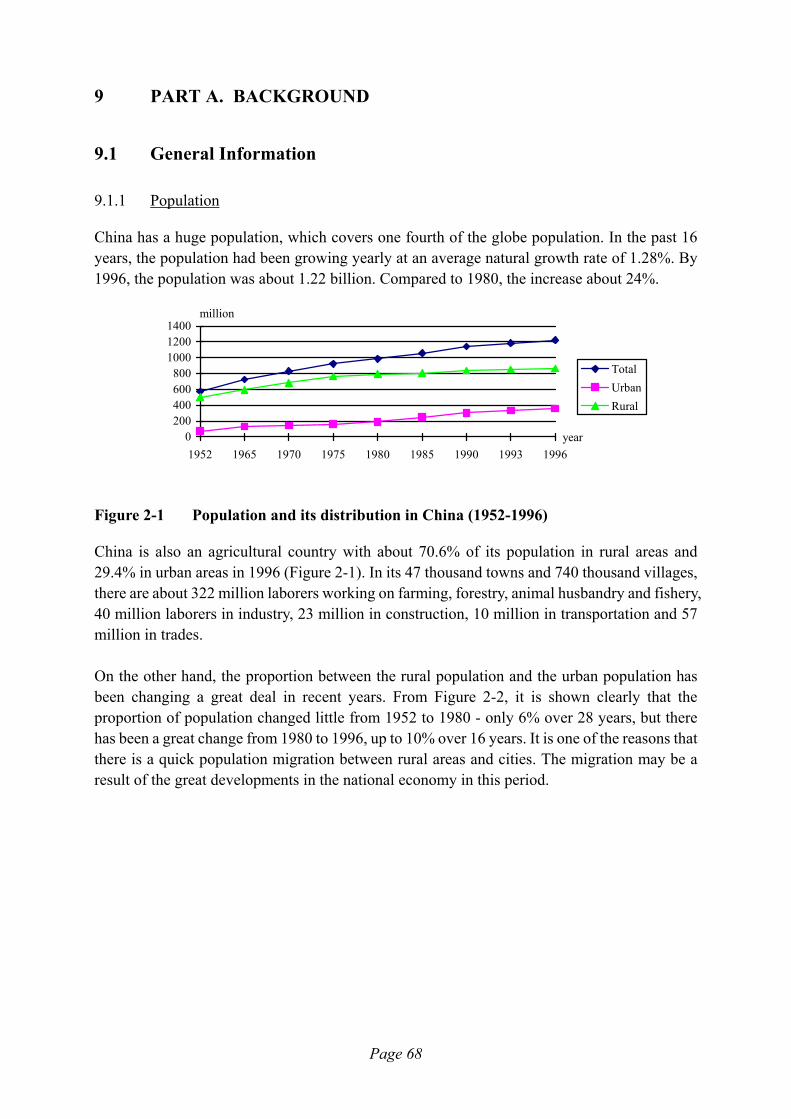
9 PART A. BACKGROUND
9.1 General Information
9.1.1 Population
China has a huge population, which covers one fourth of the globe population. In the past 16 years, the population had been growing yearly at an average natural growth rate of 1.28%. By 1996, the population was about 1.22 billion. Compared to 1980, the increase about 24%.
0200400600800
100012001400
1952 1965 1970 1975 1980 1985 1990 1993 1996year
million
TotalUrbanRural
Figure 2-1 Population and its distribution in China (1952-1996)
China is also an agricultural country with about 70.6% of its population in rural areas and 29.4% in urban areas in 1996 (Figure 2-1). In its 47 thousand towns and 740 thousand villages, there are about 322 million laborers working on farming, forestry, animal husbandry and fishery, 40 million laborers in industry, 23 million in construction, 10 million in transportation and 57 million in trades. On the other hand, the proportion between the rural population and the urban population has been changing a great deal in recent years. From Figure 2-2, it is shown clearly that the proportion of population changed little from 1952 to 1980 - only 6% over 28 years, but there has been a great change from 1980 to 1996, up to 10% over 16 years. It is one of the reasons that there is a quick population migration between rural areas and cities. The migration may be a result of the great developments in the national economy in this period.
Page 68
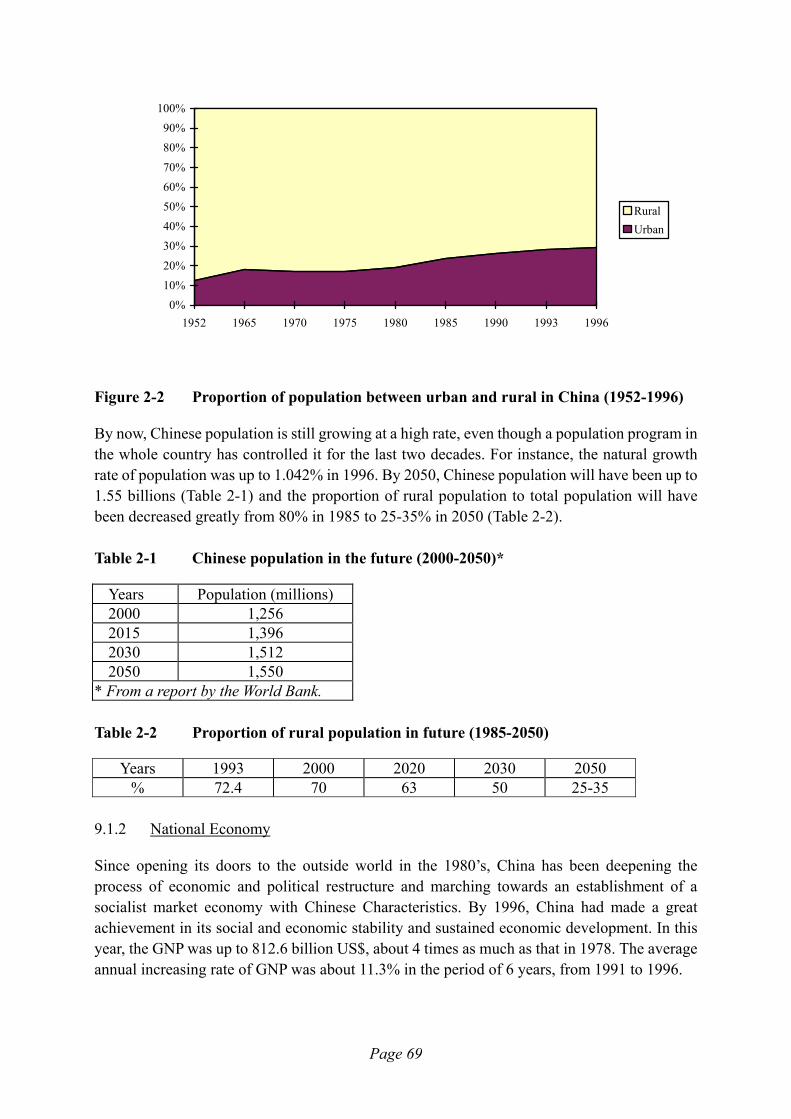
0%
10%20%
30%
40%
50%
60%
70%
80%
90%100%
1952 1965 1970 1975 1980 1985 1990 1993 1996
RuralUrban
Figure 2-2 Proportion of population between urban and rural in China (1952-1996)
By now, Chinese population is still growing at a high rate, even though a population program in the whole country has controlled it for the last two decades. For instance, the natural growth rate of population was up to 1.042% in 1996. By 2050, Chinese population will have been up to 1.55 billions (Table 2-1) and the proportion of rural population to total population will have been decreased greatly from 80% in 1985 to 25-35% in 2050 (Table 2-2). Table 2-1 Chinese population in the future (2000-2050)*
Years Population (millions) 2000 1,256 2015 1,396 2030 1,512 2050 1,550
* From a report by the World Bank. Table 2-2 Proportion of rural population in future (1985-2050)
Years 1993 2000 2020 2030 2050 % 72.4 70 63 50 25-35
9.1.2 National Economy
Since opening its doors to the outside world in the 1980’s, China has been deepening the process of economic and political restructure and marching towards an establishment of a socialist market economy with Chinese Characteristics. By 1996, China had made a great achievement in its social and economic stability and sustained economic development. In this year, the GNP was up to 812.6 billion US$, about 4 times as much as that in 1978. The average annual increasing rate of GNP was about 11.3% in the period of 6 years, from 1991 to 1996.
Page 69

0100200300400500600700800900
1000
1978
1980
1983
1984
1985
1986
1987
1988
1989
1990
1991
1992
1993
1994
1995
1996
* Values in the figure are based on current prices and average exchange rates of RMB Yuans for 100 US$ in these fiscal years respectively.
GNP (billion US$)GNP per capital (US$)AER (RMB to US$)
Figure 2-3 A curve of economy development in China from 1978 to 1996
In Figure 2-3, there are two peaks of economy growing. One exists between 1988 and 1989; annual increasing rates of GNP are 25% and 14% respectively in these two years, and another one is from 1992 to 1996. In China, three economic sectors, primary industry, second industry and tertiary industry mainly contribute the rate, in which the primary industry means the agriculture. In 1988, for example, the rates for the three sectors are 26%, 44% and 30% respectively. In the second peak, they are 22%, 44% and 34% respectively in the year of 1992, and 20%, 50% and 30% respectively in the year of 1996. A research result on the increasing of Per Capital GNP in the first half of the next century is shown in the Table 2-3. Table 2-3 A Prediction for Per Capital GNP (US$) 2000-2050
Proposals\years 2000 2020 2030 2050 1 1,000 2,500 3,350 6,000 2 1,000 1,900 2,450 4,000
9.1.3 Rural Economy
China is an agricultural country, that is, the rural economy is one of the most important sectors in the national economy. As shown in the Table 2-4, the GNP of primary industry, agriculture, occupies about 20% of the total GNP. Table 2-4 Gross National Products and National Income in 1996
Items Total Primary Industry
Second Industry
Tertiary Industry
Per capital (US$)
GNP (billion US$) 812.6 162.5 406.3 243.8 677.5 % 100 20 50 30
Page 70 In Table 2-4, the primary industry means agriculture, including farming, forestry, animal

husbandry and fishery; the second industry is composed of manufacture, mining, processing, construction etc.; and the tertiary industry is related to transportation, communication, commerce and other public service facilities. In fact, the so-called rural industry involved in the second industry and tertiary industry has become an important sector in the rural economy since the 1980’s (Figure 2-4).
0%10%20%30%40%50%60%70%80%90%
100%
1983 1984 1985 1986 1987 1988 1989 1990 1991 1992 1993
UrbanRural industryAgriculture
Figure 2-4 Ratio of the rural section in the national economy in China 1983 - 1993
From Figure 2-4, the rural industry had been growing at a high speed in the decade. In 1983, the rural industry occupied only 9% of the national economy, however, by 1993, its sector had gone up to 30% of the national economy. Concerning the rural industry, the rural economy had covered about 51% of the total national economy in 1993, about 277.8 billion US$ of GNP.
11%3%
60%
2%
24%
Farming
Forestry
Animal Husbanry
Fishery
Rural Industry
Figure 2-5 Composition of the rural economy in 1993 (GNP of 277.9 billion US$ in
total)
In the rural economy, there was about 60% from the rural industry, but farming, forestry, animal husbandry and fishery was 24%, 2%, 11% and 3% respectively in 1993.
Page 71
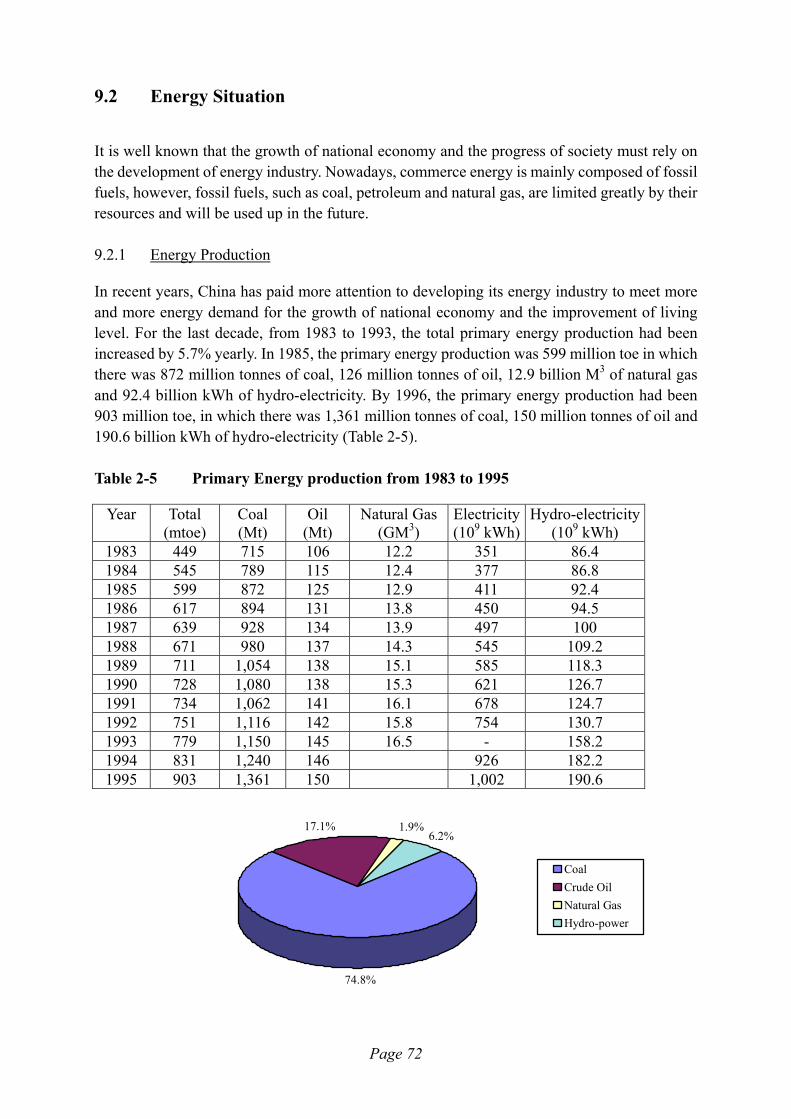
9.2 Energy Situation
It is well known that the growth of national economy and the progress of society must rely on the development of energy industry. Nowadays, commerce energy is mainly composed of fossil fuels, however, fossil fuels, such as coal, petroleum and natural gas, are limited greatly by their resources and will be used up in the future. 9.2.1 Energy Production
In recent years, China has paid more attention to developing its energy industry to meet more and more energy demand for the growth of national economy and the improvement of living level. For the last decade, from 1983 to 1993, the total primary energy production had been increased by 5.7% yearly. In 1985, the primary energy production was 599 million toe in which there was 872 million tonnes of coal, 126 million tonnes of oil, 12.9 billion M3 of natural gas and 92.4 billion kWh of hydro-electricity. By 1996, the primary energy production had been 903 million toe, in which there was 1,361 million tonnes of coal, 150 million tonnes of oil and 190.6 billion kWh of hydro-electricity (Table 2-5). Table 2-5 Primary Energy production from 1983 to 1995
Year Total (mtoe)
Coal (Mt)
Oil (Mt)
Natural Gas (GM3)
Electricity (109 kWh)
Hydro-electricity (109 kWh)
1983 449 715 106 12.2 351 86.4 1984 545 789 115 12.4 377 86.8 1985 599 872 125 12.9 411 92.4 1986 617 894 131 13.8 450 94.5 1987 639 928 134 13.9 497 100 1988 671 980 137 14.3 545 109.2 1989 711 1,054 138 15.1 585 118.3 1990 728 1,080 138 15.3 621 126.7 1991 734 1,062 141 16.1 678 124.7 1992 751 1,116 142 15.8 754 130.7 1993 779 1,150 145 16.5 - 158.2 1994 831 1,240 146 926 182.2 1995 903 1,361 150 1,002 190.6
Page 72
1.9%6.2%
17.1%
74.8%
CoalCrude OilNatural GasHydro-power

Figure 2-6 Production and composition of primary energy (921 million toe in total, 1996)
In China, the coal mining industry is the most important energy industry and coal energy is the biggest part of energy sources, while the oil and natural gas energy industry and the electricity industry have been greatly developed only in the recent 40 years. In 1953, about 70 million tonnes of coal, 0.62 million tonnes of oil, 11 million M3 of natural gas and 1.5 billion kWh of hydro-electricity was produced and occupied respectively about 97.88%, 1.73%, 0.03% and 0.36% of total primary energy production, 35.76 million toe. By 1993, 1,150 million tonnes of coal, 145 million tonnes of oil, 16.5 billion M3 of natural gas and 158 billion kWh of hydro-electricity was produced and occupied about 73.8%, 18.6%, 2.0% and 5.6% of total primary energy production respectively. In 1996, the total energy production was 921 mtoe in which the hydro-power was up to 6.2%, the coal up to 74.8, and the crude oil and natural gas was down to 17.1% and 1.9% respectively (Figure 2-6). 9.2.2 Primary Energy Consumption
As a developing country, China has been consuming more and more the primary energy, which is promoted by the development of its national economy in recent 20 years. In 1970, the total consumption of primary energy was only 205 million toe in this country, of which about 81% came from coal energy. After 26 years, in the year of 1996, the amount was up to 972 million toe, as much as 4.7 times of that in 1970. From Figure 2-7, it can be seen that consumption increasing rates of oil, natural gas and electricity is steeper than that of coal. It means that more and more clean energy, such as oil, gas fuel and electricity, has been used in modern industries and daily life.
0
500
1000
1500
2000
2500
1953 1957 1960 1965 1970 1975 1980 1985 1990 1993 1995
Coal (Mt)
Oil (0.1Mt)
Natural Gas(0.01G cu.m)
Hydro-power(0.1Gkwh)
Figure 2-7 Consumption of primary energy in China
Because these clean energy sources are playing more and more important roles in the national economic actions, the proportion of coal in the total national energy consumption is reduced gently in recent years. By 1993, the proportion of coal energy consumption had decreased to 75%, but that of other primary energy sources, such as oil, natural gas and hydro-electricity had increased to 17.5%, 1.6% and 5.9% respectively (Figure 2-8).
Page 73

1.6% 5.9%17.5%
75%
CoalCrude OilNatural GasHydro-power
Figure 2-8 Consumption and composition of primary energy in China (972 million toe
in total, 1996)
In order to produce the clean energy, a great amount of coal have been converted to second energy products, such as electricity, charcoal and coal oil. In 1995, about 444 million tonnes of coal, equal to 311 million toe, was used for power generation. The amount is about 32.3% of the total coal consumption of 1,377 million tonnes or equal to 964 million toe in this year.
29%
71%
Urban Rural
Figure 2-9 Sector of rural commerce energy in the total energy consumption in 1993
In 1993, the total rural energy consumption was 410 million toe, but only 230 million toe came from the commerce energy, occupied 29% of the total commerce energy consumption in the country, and other 180 million toe came from biomass and other energy resources. 9.2.3 Energy Balance
In fact, there is a big shortage in the energy providing market, even though, China has done its best to develop its energy industry in recent years. That is, the energy production can not be enough to meet the energy demand due to a poor base facility and an investment shortage for developing energy industry in China. In 1993, there was a shortage of 3 million toe between energy production and energy consumption, that is, China has become an energy imported country which the amount of energy imported will be more than that of energy exported (Table 2-6). Table 2-6. Primary Energy Balance in 1992
Items Overall Energy Coal Oil Natural Gas Electricity (109 kWh)Page 74

mtoe Mt MT (109M3) Hydropower Output 779 1,150 145 16.5 158.2 Consumption 782 1,140 153 16.5 158.2 Balance -3 10 -8 0 0 To consider the energy demand, the shortage may be 10% in the whole country. Some factories have to stop their operation due to the energy shortage. Especially in rural areas, the shortage must be over 30%, thus cutting down forests has become a way to make compensation for the shortage. 9.2.4 Prediction of Energy Demand
It is well known that the energy consumption in a country is greatly related to the size of population and the scale of economic action in the country. According to some research works on population and economy in the future, the energy demand will be increased steeply in the next century. Table 2-7 Predictions of demand for energy in 2000
Items / Institutes State Statistical Bureau
Energy Institute of SPC
Tech. & Econ. Institute
Increase in GNP % 8 9 9 8.9 Energy Requirement (mtoe) 1,080 1,130 1,060 980 Coal (Mt) 1,600 1,670 1,570 1,400 Crude Oil (Mt) 200 200 165 200 Natural Gas (109 M3) 30 30 25 Electricity (109 kWh) 1,360 Hydro Power(109 kWh) 140 240 230 200 Nuclear Power(109 kWh) 30 30 10 25
By 2000, the energy demand will have been over 1,000 million toe (Table 2-7), in which coal energy will still play an important role in the country, about 74% of the total energy consumption. In a report for long-term prediction on energy demand in future, it has been pointed out that the energy demand will be increased at a high speed as the growth of population and the development of economy in the country. Of course, more and more new technologies will be used to save energy consumption. From Table 2-8, the energy demand will be up to 3,780 million toe by 2050, about 4.8 times as much as that in 1993. Table 2-8 A prediction of total energy demand for 2000 -2050
Items Years 1985 2000 2020 2050 Population(million) 1,045 1,256 1,380 1,550 Per capital GNP(US$ in 1980) 465 1,000 2,500 6,000 GNP (billion US$ in 1980) 480 1,250 3,450 9,000 Energy demand (Mtoe) 544 1,000 2,100 3,780
Page 75

Per capital energy consumption (Toe) 0.52 0.80-0.90 1.52 2.44 Energy / GNP (kgoe/US$) 1.13 0.81 0.64 0.46 Energy saving in average (%/ year) 4.0 3.3 1.0 1.0 Elasticity of energy consumption 0.53 0.61 0.72 0.61 By survey data from related government divisions, it has been estimated that the total oil reserve may be up to 60 billion tonnes, the recoverable oil reserve will be 15 billion tonnes and the explored reserve is 3.3 billion tonnes in China in 1992. The total natural gas reserve may 30x1012 M3, the recoverable reserve can be 6.4x10¹² M3 and the explored reserve is 1.4x10¹² M3 in 1992; the total coal reserve may be 450 billion tonnes and the explored reserve is 985 billion tonnes. Based on these data and planning rates of economic growing, some research works have been made and a similar result has been obtained by several energy experts. In a report, it is pointed that the oil resource will have been exhausted by 2040, natural gas by 2060 and coal by 2300.
9.3 Environment Impact
It is well known that the production and consumption of energy is one of the most important human actions and is a prerequisite for the progress of human society. Meanwhile, the production and consumption of energy must cause a harmful pollution on the human living environment. In recent years, environment pollution has become a hot topic in the world due to its seriously limited effects on most of human actions, especially on the development of economy and the progress of society. In the modern human society, coal and oil are two important energy resources and their production and utilization in a large scale can bring a serious pollution on the globe environment, especially a great contribution to the GHG. As a developing country, China uses coal as its main energy source, over 75% of its total energy consumption in 1996, from which a serious problem of environment pollution has been caused in the whole country in recent years. 9.3.1 Energy Production
Any kind of energy source, including coal, oil, natural gas, and even new and renewable energy, like hydro-electricity, nuclear energy, biomass, wind energy, terrestrial heat and solar energy, can create environmental effects when it is explored as an energy source. In the case of coal, its exploration in a large scale can cause a series of critical effects on the environment:
• causing earth’s surface to collapse or subside by mining coal underground;
• destroying earth’s surface structures and ecological systems by mining coal on the surface;
• polluting underground water;
• producing many kinds of wastes, such as CO, SOx, CO2, CH4 , gangue, coal powder and others, to pollute atmosphere layer and water system.
In case of oil and natural gas, their exploration can also cause serious pollution in the
Page 76

environment as in the case of coal:
• polluting waste system including underground water system and on the ground water system by waste oil;
• destroying farmland and agri-ecological distribution by drilling mud and oil-bearing water;
• creating air pollution by water, gas and solid wastes from refining processes;
• harming fishery production and maritime ecological systems by oil escaping from oil tankers or offshore oil fields.
Finally, some environment effects can be caused from explorations of other energy sources, for example: • to build a hydro-electricity plant, a big water reservoir is needed certainly so that a large
area of farmland, and/or forest will be inundated, natural ecological systems of agricultural and/or forest will be destroyed;
• to get enough wood energy, an over-cutting down of forest may be conducted; • to explore geothermal energy in a long time, an earth’s surface drooping down or
earthquake may be caused from a change of geological structure; • to operate a nuclear generation plant, a radiation pollution may be caused from a nuclear
escaping occasionally. By 1993, the area of earth’s surface drooping down caused by mining industry had been up to 2 million hectares, the area of farmland polluted by industrial wastes had been 10 million hectares, and the area of losing soil and water had been 150 million hectares. According to statistics, the area of farmland is reduced by 0.3 million hectares yearly. 9.3.2 Energy Consumption
In fact, a process of energy consumption is a process of pollution formation, that is, when a kind of fuel is utilized as an energy source, it is always in company with varied pollution from waste gas or other pollutants. Coal and oil are two kinds of main energy sources in the world, which can cause very serious pollution on environments. Coal is mainly used to produce one or more kinds of second energy products, such as heat energy, gas fuel, liquid fuel and/or electricity, or burnt directly as a primary energy. Oil is mainly used to produce liquid fuels by a refining process, such as gasoline and diesel oil, or to generate electricity. From utilization of the two energy sources, air pollution by waste gases, such as CO, SOx, CO2 and NOx , is one of the most serious effects on environments. In 1989, about 13.6 million tonnes of soot and 14.8 million tonnes of SO2 was produced by burning coal, which may contribute respectively 62% and 93% of their total emissions in the whole country. Table 2-9 shows levels of air pollution from industrial waste gases from 1990 to 1996. Table 2-9 Waste gas from industry production
Total waste Flue gas from SO2 Soot Industrial
Page 77
Years gas (1012 M3) fuel (1012 M3)
(Mt) (Mt) Dust (Mt)
1990 1991 1992 1993 1995 1996
8.54 10.10 10.48 10.96 10.75 11.12
5.95 6.54 7.20 7.54
- 7.00
14.9 15.8 16.9 17.9 14.1 13.6
13.2 13.1 14.1 14.2 8.38 7.58
7.8 5.8 5.8 6.2 6.4 5.6
It is clear that the pollution has been increasing with annual rates of 8.67% for the total waste gas and 8.21% for flue gas in China. For example, in 1993, the total waste gas from industrial production was up to 10,960 billion m3 and the flue gas from burning fossil fuels was over 7,540 billion m3, covering 68.8% of the total waste gas. In China, the air pollution is caused from a great amount of coal burnt directly. As an average values yearly, the suspended particles in air is up to 0.93 mg/m3/day in cities of Northern areas and 0.41 mg/ m3/day in cities of Southern areas. The concentration of SO2 in air is around 0.092 mg/m3/day in cities of Northern areas and 0.088 mg/ m3/day in cities of Southern areas. And the concentration of NOx in air goes to 0.054 mg/m3/day in cities of Northern areas and 0.048 mg/ m3/day in cities of Southern areas. In general, fossil fuels, like coal, oil and natural gas, are called carbon-hydrogen energy from which waste gas emitted is mainly composed of CO2 which is a kind of greenhouse gas(GHG). It is estimated that the total CO2 emission from fossil fuels was 2,270 million tonnes in China, equalized to 620 million tonnes of carbon and contributed 11.8% of CO2 emission on the global GHG.. Up to 1993, the total CO2 emission from fossil fuels might have arrived at 660 million tonnes of carbon of which about 110 tonnes from oil fuel and 550 tonnes from coal fuel. Based on data in 1985, a prediction on the amount of CO2 emission from using fossil fuels in the next century has been made by a research group in China. The result is shown in Table 2-10. Table 2-10 A prediction for emission of CO2 from fiscal fuels in China
Fossil fuel CO2 Emission (106t carbon/year) 1985 1990 2020 2025 Coal 530 540 1,150-1,350 1,670-1,940 Oil 76 100 190-220 320-370 Natural gas 7 8 60-70 90-110 Coal gas 9 12 40-70 70-80 Total 622 660 1,570* 2,220* * An average value. By 2025, the annual CO2 emission will have gone up to 2,220 million tonnes of carbon, about 3.36 times as much as that in 1990 and 1.41 times as much as that in 2000. The increasing rate is 7.17% yearly. China's government has paid a great deal of attention on reducing its contribution of CO2
emission on the global GHG through ways as following:
Page 78

• to improve energy efficiencies of fossil fuels for saving energy sources, reducing consumption of fossil fuels and controlling CO2 emission;
• to develop new and renewable energy, such as solar energy, wind energy, biomass energy, tide energy and nuclear energy for changing its energy consumption composition, that is, reducing consumption of fossil fuel, especially coal;
To protect and develop forest resources, increase forest-cover rate, turn the land green with parks and trees for speeding the absorption of CO2 and improving environment.
Page 79
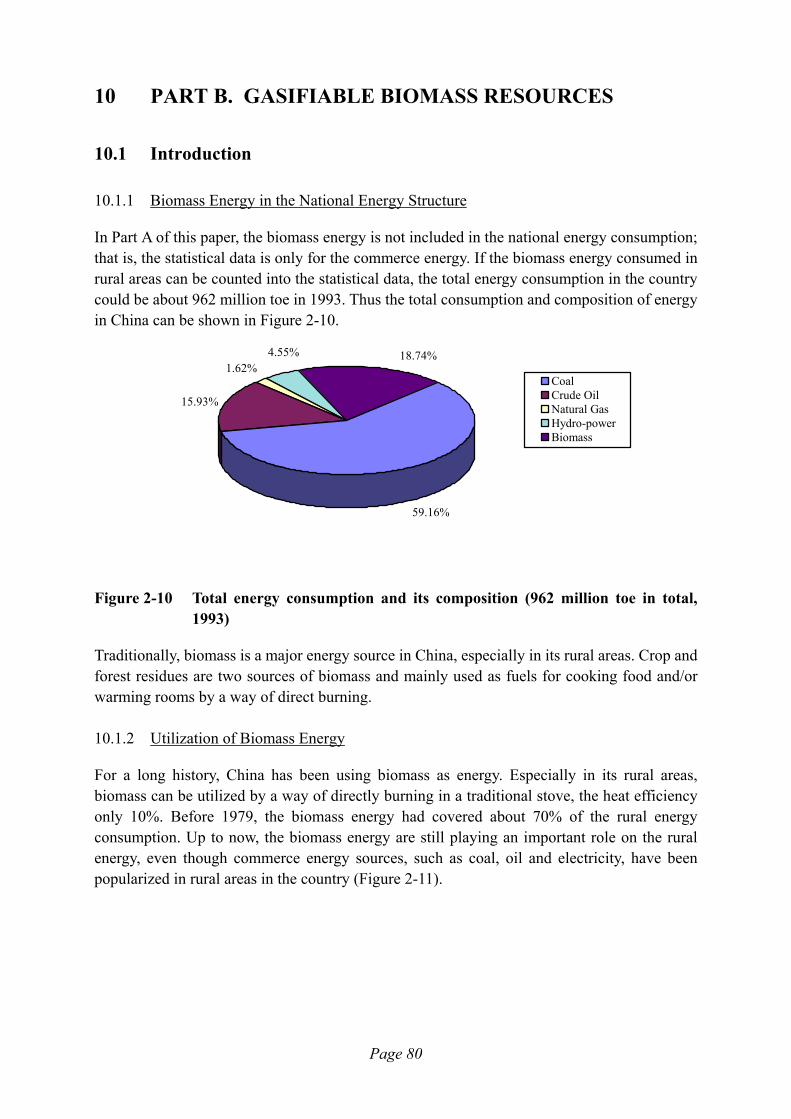
10 PART B. GASIFIABLE BIOMASS RESOURCES
10.1 Introduction
10.1.1 Biomass Energy in the National Energy Structure
In Part A of this paper, the biomass energy is not included in the national energy consumption; that is, the statistical data is only for the commerce energy. If the biomass energy consumed in rural areas can be counted into the statistical data, the total energy consumption in the country could be about 962 million toe in 1993. Thus the total consumption and composition of energy in China can be shown in Figure 2-10.
59.16%
15.93%
1.62%4.55% 18.74%
CoalCrude OilNatural GasHydro-power
Biomass
Figure 2-10 Total energy consumption and its composition (962 million toe in total,
1993)
Traditionally, biomass is a major energy source in China, especially in its rural areas. Crop and forest residues are two sources of biomass and mainly used as fuels for cooking food and/or warming rooms by a way of direct burning. 10.1.2 Utilization of Biomass Energy
For a long history, China has been using biomass as energy. Especially in its rural areas, biomass can be utilized by a way of directly burning in a traditional stove, the heat efficiency only 10%. Before 1979, the biomass energy had covered about 70% of the rural energy consumption. Up to now, the biomass energy are still playing an important role on the rural energy, even though commerce energy sources, such as coal, oil and electricity, have been popularized in rural areas in the country (Figure 2-11).
Page 80
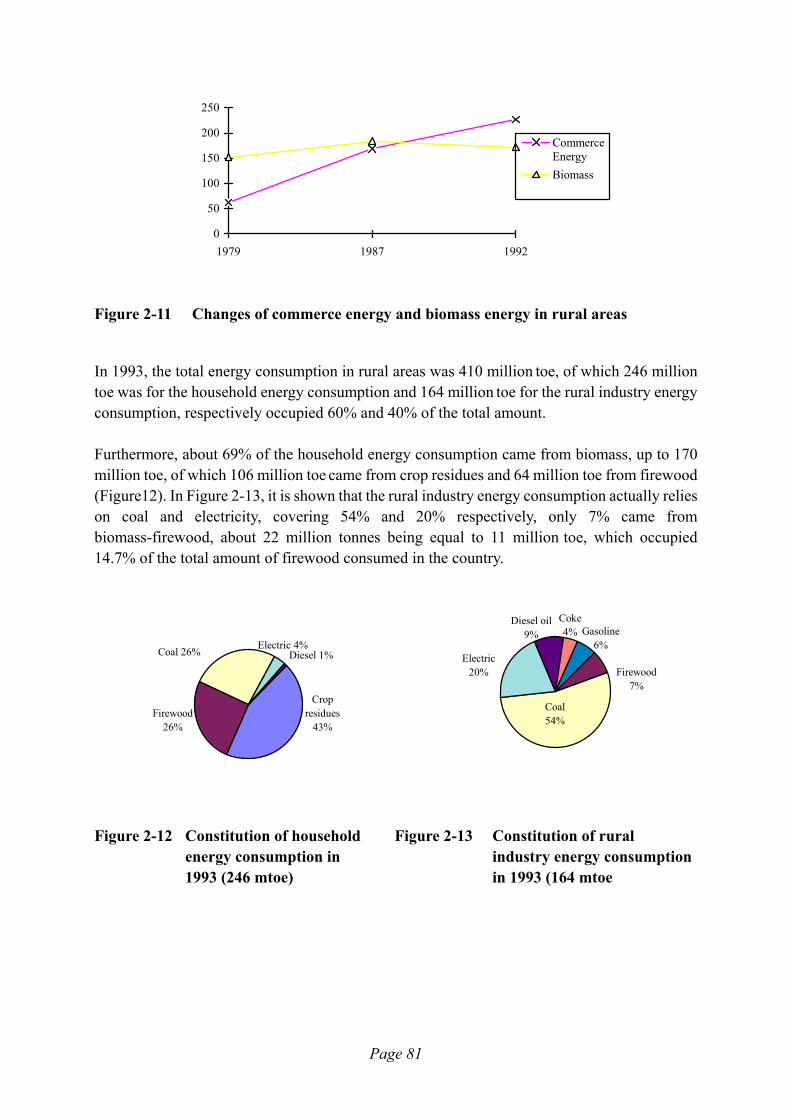
0
50
100
150
200
250
1979 1987 1992
CommerceEnergyBiomass
Figure 2-11 Changes of commerce energy and biomass energy in rural areas
In 1993, the total energy consumption in rural areas was 410 million toe, of which 246 million
toe was for the household energy consumption and 164 million toe for the rural industry energy consumption, respectively occupied 60% and 40% of the total amount. Furthermore, about 69% of the household energy consumption came from biomass, up to 170 million toe, of which 106 million toe came from crop residues and 64 million toe from firewood (Figure12). In Figure 2-13, it is shown that the rural industry energy consumption actually relies on coal and electricity, covering 54% and 20% respectively, only 7% came from biomass-firewood, about 22 million tonnes being equal to 11 million toe, which occupied 14.7% of the total amount of firewood consumed in the country.
Firewood26%
Coal 26%
Crop residues
43%
Electric 4%Diesel 1%
Firewood7%
Gasoline6%
Coke4%
Diesel oil9%
Electric20%
Coal54%
Figure 2-12 Constitution of household Figure 2-13 Constitution of rural
energy consumption in industry energy consumption 1993 (246 mtoe) in 1993 (164 mtoe
Page 81

Firewood18.03%
Coal37.28%
Electricity10.37%
Crop residues26.23%
Coke1.79%
Diesel oil4.00% Gasoline
2.29%
Figure 2-14 Constitution of the total rural energy consumption in 1993 (410 mtoe)
As shown in Figure 2-14, the biomass energy consumed for household uses and industry occupied about 44% of the total energy consumption in rural areas in 1993. Recently, in the rural energy consumption, the proportion of commercial energy including coal, electricity, oil and natural gas etc. has been going up in a large scope, although their prices are always much higher than that of biomass fuels. Thus, it has become urgent to develop some advance processes for conversion of biomass to clean and convenient fuels in the country. 10.1.3 New Biomass Energy Technology
In 1979, a serious shortage of energy occurred in Chinese rural areas. The total energy consumption only 224 million toe. Even though about 83.4% of rural energy was used as living energy, about 47% of rural families still fell into dire straits of lacking energy for 3-6 months per year. In order to resolve this problem, China's government put the development of biomass energy utilization technology into the 6th Five Year Plan (1981-1985) and the 7th Five Year Plan (1986-1990). Since that time, China had begun to develop its biomass resources and energy conversion technology. Up to 1990, about 2.8 million hectares of firewood forest had been planted, 5 million sets of household biogas digesters had been built and operated, and a great amount of saving-fuel stoves had been used by 110 million of rural families. Since 1991, the development of rural economy has brought a new problem that rural residents have begun to disuse their traditional fuel - biomass, but prefer to use convenient and clean fuels, such as coal and liquefied natural gas, because direct burning biomass fuels is less efficient, labored and too dirty. Thus, most of crop residues have to be burnt directly in cultivated land in order to reduce works on transportation and stockpile of these residues. So, China begun to develop its new technologies for converting biomass into convenient and clean energy products, such as low or middle energy gas fuel, biogas, briquetting fuel and liquid fuel, in the period of the 8th Five Year Plan (1991-1995). During the 9th Five Year Plan (1996-2000) and the first decade of the next century, China will continue to develop its biomass
Page 82
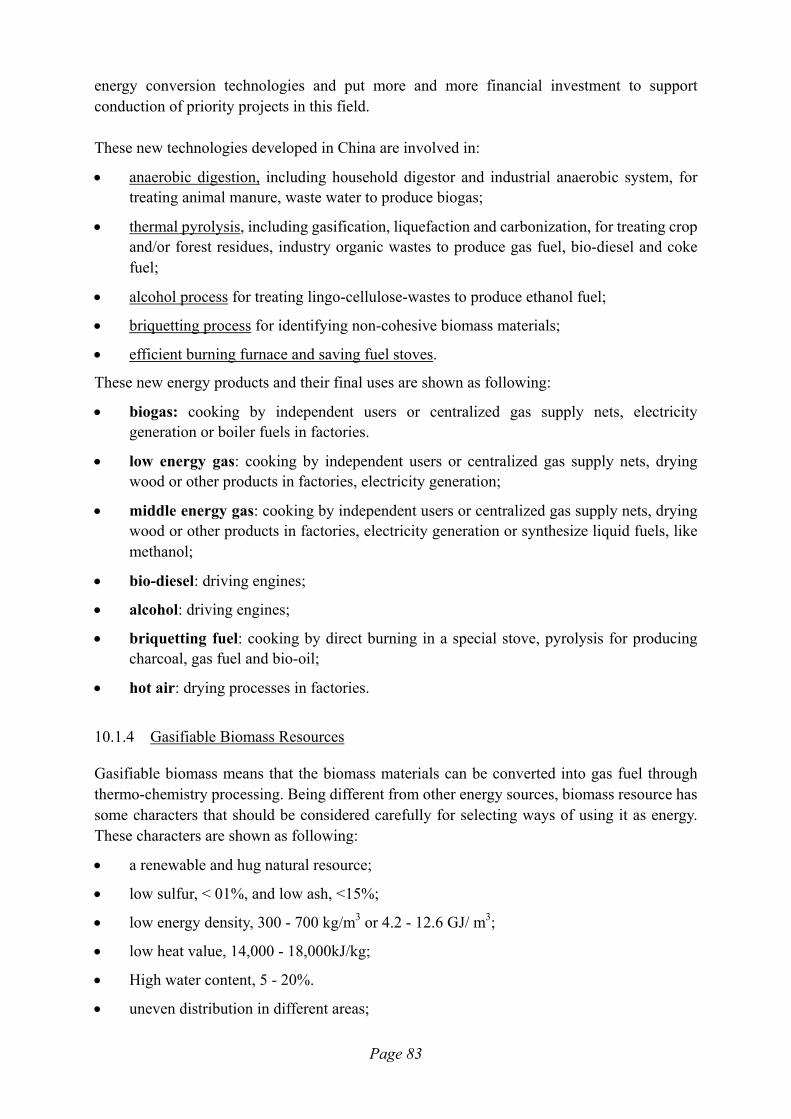
energy conversion technologies and put more and more financial investment to support conduction of priority projects in this field. These new technologies developed in China are involved in:
• anaerobic digestion, including household digestor and industrial anaerobic system, for treating animal manure, waste water to produce biogas;
• thermal pyrolysis, including gasification, liquefaction and carbonization, for treating crop and/or forest residues, industry organic wastes to produce gas fuel, bio-diesel and coke fuel;
• alcohol process for treating lingo-cellulose-wastes to produce ethanol fuel;
• briquetting process for identifying non-cohesive biomass materials;
• efficient burning furnace and saving fuel stoves.
These new energy products and their final uses are shown as following:
• biogas: cooking by independent users or centralized gas supply nets, electricity generation or boiler fuels in factories.
• low energy gas: cooking by independent users or centralized gas supply nets, drying wood or other products in factories, electricity generation;
• middle energy gas: cooking by independent users or centralized gas supply nets, drying wood or other products in factories, electricity generation or synthesize liquid fuels, like methanol;
• bio-diesel: driving engines;
• alcohol: driving engines;
• briquetting fuel: cooking by direct burning in a special stove, pyrolysis for producing charcoal, gas fuel and bio-oil;
• hot air: drying processes in factories.
10.1.4 Gasifiable Biomass Resources
Gasifiable biomass means that the biomass materials can be converted into gas fuel through thermo-chemistry processing. Being different from other energy sources, biomass resource has some characters that should be considered carefully for selecting ways of using it as energy. These characters are shown as following:
• a renewable and hug natural resource;
• low sulfur, < 01%, and low ash, <15%;
• low energy density, 300 - 700 kg/m3 or 4.2 - 12.6 GJ/ m3;
• low heat value, 14,000 - 18,000kJ/kg;
• High water content, 5 - 20%.
• uneven distribution in different areas;
Page 83

• difficult for collection and transportation;
• Difficult for calculation of its resources.
So, the survey work on gasifiable biomass resources can be involved in special sources of biomass shown as following:
• Crops residues: such as rice straw, bean stalks, corn stalks, cotton stalks, Chinese sorghum stalks, maize stalks.
• Firewood and wood residues: timber from firewood forest and residues from industry of forest.
• Industry Wastes: Grain processing: corncob, husk and wheat bran. Wood industry: paper mill and timber. Sugar mill: sugarcane and beet root.
• Municipal refuses. 10.1.5 Crop Residues
In China, a great amount of crop residues can be produced from agricultural actions. According to statistical data (1997), in 1996, there were 95 million hectares of cultivated lands and 108 million hectares of undeveloped land in which there was 35.4 million hectares of useable land in this country. The total amount of grain products was 504.5 million tonnes, in which, the amount for rice, wheat and corn was 195.1, 110.6 and 127.5 million tonnes respectively. a. Statistical method The total biomass production of crop residues is related to amounts of crop-products, rates of residues produced from crops and heat values of residues. Thus, the amount of crop residues can be expressed by the following formula:
~S Sii
n
i= ⋅=
∑1
d (1)
in which ~S means the total amount of biomass from crop residues in the country,
Si is the amount of grain produced from a special crop,
di is the rate of residues biomass produced from the special crop,
and i=1,2,3......n for a special crop.
Table 2-11. Rate of Residues Produced from a Special Crop (kg/kg)
Wheat Rice Corn Soybean Tuber Sorghum Millet Cotton oil-crop Others
Rate 1 1 2 1.5 1 2 1 3 2 1
In case of the amount expressed as toe of energy, the formula can be:
Page 84

~E Si ii
n
i= ⋅ ⋅=
∑ α1
d .(2)
in which E expresses the total biomass energy from crop residues in toe,
and α i is the heat value at a low level (LHVi)of a special crop residue and it can be treated as a
constant value (LHVo) in order to simplify calculations. Thus, the biomass energy can be expressed as: ~E = ⋅α ~S . (3)
In case of crop residues, α may be 14,630 kJ/kg, because most of crop residues have their LHVi
around LHVo, that is LHV
Vi
oLH≈ 1 .
b. Results In China, rice, corn and wheat are three kinds of main grain products, meanwhile, they are main biomass resources from agriculture production. In 1996, it was estimated that the total yield of residues was 687 million tonnes, equal to 240 million toe of biomass energy, in which, about 189.6 million toe was from residues of rice, corn and wheat, covering 79% of total biomass energy from all crop residues in the country. Respectively, about 81.6 million toe of biomass energy was contributed by rice residues covering 34%, 38.4 million toe by wheat residues covering 16%, 69.6 million toe by corn residues covering 29% and 50.4 million toe by others covering 21% (Figure 2-15). In 1996, approximately, 22 % of crop residues, 150 million tonnes, was used as animal feeding, 10%, 69 million tonnes, as industrial materials, 10%, 68 million tonnes, as fertilizer to farmland, only 20%, 138 million tonnes, as fuels in rural areas and 38%, 260 million tonnes, burnt directly in farmlands.
29%
16%
34%
4% 5% 7% 2% 3% RiceWheatCornSoybean
Oil-crop
Other
Tuber
Cotton
Figure 2-15 Ratio of different crop residues in 1996 (240 million toe)
Page 85
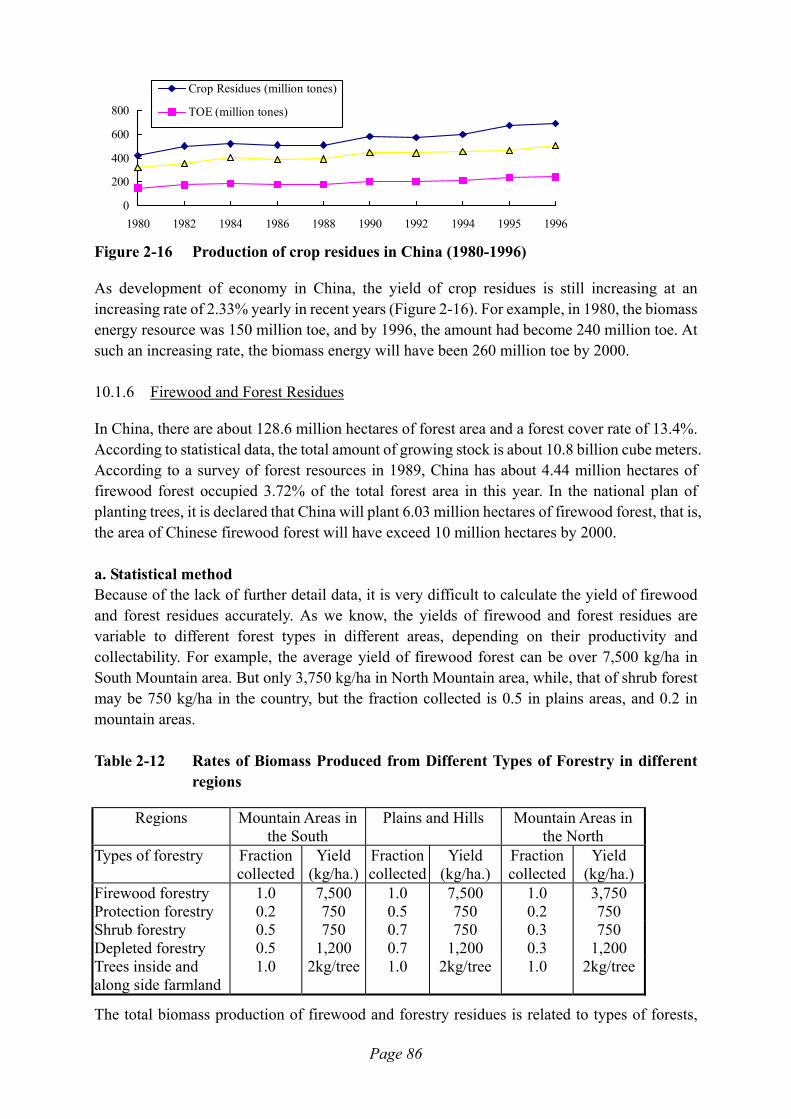
0
200
400
600
800
1980 1982 1984 1986 1988 1990 1992 1994 1995 1996
Crop Residues (million tones)
TOE (million tones)
Figure 2-16 Production of crop residues in China (1980-1996)
As development of economy in China, the yield of crop residues is still increasing at an increasing rate of 2.33% yearly in recent years (Figure 2-16). For example, in 1980, the biomass energy resource was 150 million toe, and by 1996, the amount had become 240 million toe. At such an increasing rate, the biomass energy will have been 260 million toe by 2000. 10.1.6 Firewood and Forest Residues
In China, there are about 128.6 million hectares of forest area and a forest cover rate of 13.4%. According to statistical data, the total amount of growing stock is about 10.8 billion cube meters. According to a survey of forest resources in 1989, China has about 4.44 million hectares of firewood forest occupied 3.72% of the total forest area in this year. In the national plan of planting trees, it is declared that China will plant 6.03 million hectares of firewood forest, that is, the area of Chinese firewood forest will have exceed 10 million hectares by 2000. a. Statistical method Because of the lack of further detail data, it is very difficult to calculate the yield of firewood and forest residues accurately. As we know, the yields of firewood and forest residues are variable to different forest types in different areas, depending on their productivity and collectability. For example, the average yield of firewood forest can be over 7,500 kg/ha in South Mountain area. But only 3,750 kg/ha in North Mountain area, while, that of shrub forest may be 750 kg/ha in the country, but the fraction collected is 0.5 in plains areas, and 0.2 in mountain areas. Table 2-12 Rates of Biomass Produced from Different Types of Forestry in different
regions
Regions Mountain Areas in the South
Plains and Hills Mountain Areas in the North
Types of forestry Fraction collected
Yield (kg/ha.)
Fraction collected
Yield (kg/ha.)
Fraction collected
Yield (kg/ha.)
Firewood forestry Protection forestry
1.0 0.2
7,500 750
1.0 0.5
7,500 750
1.0 0.2
3,750 750
Shrub forestry Depleted forestry
0.5 0.5
750 1,200
0.7 0.7
750 1,200
0.3 0.3
750 1,200
Trees inside and along side farmland
1.0 2kg/tree 1.0 2kg/tree 1.0 2kg/tree
The total biomass production of firewood and forestry residues is related to types of forests,
Page 86
areas of forests, amounts of trees inside and along side farmland and rates of biomass production in different forests and different areas. Thus, the amount can be expressed by the following formula:
( )~ /S A r T dij ij ij i ij
m
i
n
= ⋅ + ⋅
+
==∑∑ η
11
1 3W (4)
in which ~S means the total amount of biomass from firewood and forest residues in the country,
Aij means areas covered by different forests(j) in different regions(i),
rij means rates of biomass produced from different forests(j) in different regions(i),
η ij means collectable coefficients of biomass from different forests(j) in different regions(i),
Ti means amounts of trees inside and along side farmland are in different regions(i)
di means rates of residues produced from trees inside and along side farmland in different
regions(i),
i=1,2,3.....n, regions,
j=1,2,3.....m, types of forests.
and W means amount of production of timber.
In case of the amount expressed as toe of energy, the formula can be revised as following:
E = ⋅α S~ .... (5)
in which E expresses the total biomass energy from firewood and forest residues in toe,
and α is a constant value and expresses an average heat value at low level (LHVo), 18,000 kJ/kg for crop residues, because most of these biomass fuels have their LHVi around LHVo ,
that is LHVLHV
i
o
≈ 1 .
b. Results According to statistical data provided by Forest Industry Ministry, the tree growing stock is about 10.8 billion cube meters and the forest growing stock is up to 9.3 billion cube meters in China. It is estimated that the yearly yield of firewood may be over 170 million tonnes in 1996, or equal to 69 million toe (Figure 2-17). It must be remembered, however, that this estimation is made as a rational supply amount in theory, and in fact, the amount of firewood consumption is beyond these figures much, the shortage comes from over-cutting forest trees. For example, the total consumption of firewood and forest residues was about 64 million toe in 1993, but the total yield was only 52.5 million toe.
Page 87

020406080
100120140160180
1980 1982 1984 1986 1988 1990 1992 1994 1996
Firewood(million tones)
TOE (million tones)
Figure 2-17 Production of firewood in China in several years
10.2 Industry Wastes
Industry Wastes is an important gasifiable biomass resource, mainly including three sectors:
• Grain processing: paddy, millet.
• Wood industry: timber mills.
• Sugar mill: sugarcane and beet root.
Based on the official data, the results are shown as following:
• Grain processing wastes: more than 40 million tonnes of rice husk in dry weight or 14 million toe in every year (yield of paddy and millet: 203 million tonnes in 1996).
• Wood processing wastes: more than 8.4 million tonnes in dry weight or 4.2 million toe in every year (recovery of sawn timber: 57.55%, timber: 67.1 million cube meters in 1996 and the bulk density: 300 kg/m3), only from wooden plate factories, such as shaving board and fibreboard, the wastes of wood powder, sawdust may be up to 1.0 million tonnes.
• Wastes from sugar mill: up to 16 million tonnes in dry weight or 5.6 million toe in every year.
It can be estimated that the biomass resource from industry production might be over 65.6 million tonnes in dry weight, about 23.8 million toe in 1996. 10.2.1 Municipal Refuses
In China, there is a big urban population, up to 360 million in 1996 and the municipal refuses mainly come from daily life, including vegetable wastes, paper wastes, restaurant wastes, fruit skin, kitchen rubbish, fallen branches and leaves of trees, and so on. In average, one person can give out 1.3 kg of the rubbish in every day and the heat value of the rubbish might be up to 4180kJ/kg. Thus, the amount of the municipal refuse may be 170 million tonnes, equal to 17
Page 88

million toe, in every year. 10.2.2 Total Amount of Gasifiable Biomass
From the four sectors described above, it is clear that the total amount of gasifiable biomass can be up to 1,000 million tonnes, about 348 million toe, in which, the crop residues occupies a big proportion, about 68.9%.
6.8%4.9%
68.9%
19.4%FirewoodCrop residuesIndustry wastesMunicial refuses
Figure 2-18 Production and composition of gasifiable biomass (356 million toe in total,
1996)
10.3 Predictive Analysis of Gasifiable Biomass Resource
10.3.1 Model design
As mentioned before, the gasifiable biomass resources must be reasonably utilized and developed on base of consideration to its energy resources use and its other use, such as animal feeding use, fertilizer and industry use, in order to benefit to all-round development of the rural economics. The gasifiable biomass resource is mainly composed of four groups: crop residues, firewood, industry wastes, and municipal refuse. So the predictive analysis model can be designed as follows: BSt=A1CRt+A2FWt+ A3MRt +A4IW-(A5AFt+A6FZt+A7IMt)....................(6) In which, BSt means the amount of gasifiable biomass resources could be utilized. CRt means the amount of crop residues. FWt means the amount of firewood. CSt means the amount of municipal refuses. IWt means the amount of industry wastes. AFt means the amount of animal feeding. FZt means the amount of fertilizer use. IMt means the amount of industry materials. A1 - A7 express a series of coefficients related to these items.
Page 89

10.4 Calculation
The prediction calculation used two packaged software, TSP and GERY. 10.4.1 Crop Residues (CRt)
Based on official data, the prediction has been made by using the GM1.1 system model and double exponential smoothing model:
CRt=6.4+0.13t .(7) The result is shown in the Table 2-13. Table 2-13 Prediction Result for Crop Residues Resources Mt
Year 1998 1999 2000 2001 2002 2003 2004 CRt 667 680 693 706 719 733 746 Year 2005 2006 2007 2008 2009 2010 2011 CRt 759 772 785 798 811 824
In China, the crop residues mainly come from three sources, they are rice, wheat and corn. Based on the official data from 1980 to 1996, the prediction calculation has been made for the three resources of biomass in future (Table 2-14). The Models are shown as following: (1) Rice RIt=1.69+0.017t (8) SRIt=1*RIt... (9) (2) Wheat WHt=1.05+0.018t... (10) SWHt=1*WHt.... (11) (3) Corn COt=1.22+0.053t..... (12) SCOt=2.0*COt... (13) Table 2-14 Prediction for Three Kinds of Crop Residues, Mt
Year 1995 2000 2005 2010 RI 190 198 209 220
WH 102 112 121 131 CO 220 320 320 370
10.4.2 Firewood (FWt)
Based on the official data, the prediction is made by using the GM1.1 system model and double exponential smoothing model:
FWt=1.5872+0.0113t. (14) The result is shown in Table 2-15.
Page 90

Table 2-15 A prediction for firewood, Mt
Year 2000 2001 2002 2003 2004 2005 2006 2007 2008 2009 2010
FWt 163 164 165 167 168 169 170 171 172 173 175 10.4.3 Municipal Refuse (MRt)
Based on the amount of municipal refuses collected in the whole country in 1996, 170 million tonnes, and supposed that a growth of yield will be 8% yearly, the prediction calculation can be conducted with the following formula:
MRt = 1.7(1+1.08)t... .(15)
The result is shown in Table 2-16. Table 2-16 Prediction for municipal refuse, Mt
Year 1998 1999 2000 2005 2010 MRt 186 194 202 242 282
Burnable 0.44 0.46 0.47 0.57 0.66 10.4.4 Industry Wastes (IRt)
Based on the official data, including amounts of wood material used in wood industry, rice produced in agriculture and sugarcane and beet roots used in sugar industry in every year, the resource will have a little growth in future. That is the amount will be around the amount of 80 million tonnes or 30 million toe. 10.4.5 Prediction of Biomass’s Consumption
To consider the consumption of biomass, mainly crop residues can be used as animal feeding, fertilizer and industry materials. 10.4.5.1 Animal feeding (AFt)
Based on official data, a programme to promote crop residues for animal feeding, and the amounts of livestock on hand in the years of 1990-1996 (Table 2-17), the prediction has been made on GM1.1 system and curve analysis. Table 2-17 Amounts of Livestock on Hand (1990-1996) million livestocks
Year 1990 1991 1992 1993 1994 1995 1996 amount 102.9 104.6 107.6 112.9 123.3 122.4 127.2
The model is as following: Number of livestock dX/dt-0.0332X=8634.626. .(16)
X(t+1)=525638.3750e0.0334t-510050.375. (17)
Page 91
Due to “the crop residues animal feeding program”, supposed that one livestock needs 1600kg of crop stalk yearly, the result can be shown in Table 2-18. Table 2-18 A prediction of biomass for animal feeding, Mt
Year 1998 1999 2000 2001 2002 2003 2004 2005 2006 2007 2008 2009 2010
Mt 240 255 262 277 281 285 297 307 315 330 338 345 353 10.4.5.2 Fertilizer and Industrial Material (FZ, IM)
According to an estimate by some experts related to the research area, only 20% of crop residues might be used as fertilizer and industry material, so that the amount is: DSt+ SRt=0.2SSt .(18)
The result is shown in Table 2-19. Table 2-19 Prediction for Biomass as Fertilizer and Industry Material, Mt
Year 1998 1999 2000 2001 2002 2003 2004 2005 2006 2007 2008 2009 2010
Mt 140 142 144 146 148 150 152 154 156 158 160 162 164 Thus, the available crop residues for energy use can be shown as Table 2-20, that will be 307 million tonnes (about 108 million toe). Table 2-20 Prediction of Available Crop Residues for Energy Use, Mt
Year 1998 1999 2000 2005 2010 Amount 287 283 287 308 307
10.4.6 Available Biomass for Gasification Use
According to the formula (6) and calculations above, the result for the available biomass resources for gasification can be obtained as shown in Table 2-21. Table 2-21 Prediction of Available biomass Resources for Gasification Use, Mt
Year 1998 1999 2000 2005 2010 Amount 714 719 732 799 844
toe 228 229 232 247 254
Page 92

11 PART C. BIOMASS GASIFICATION IN CHINA
11.1 General
Most biomass materials are unstable at high temperatures and will break down to form smaller molecules. The basic process actually is “pyrolysis”, a thermal chemical process. By controlling reaction conditions, involving temperature, oxygen supply, pressure, catalysts and reaction speed, different processes can be achieved to produce different useful fuels in the form of oil, charcoal and/or fuel gas. For example, at elevated temperatures in the absence of oxygen, biomass will be decomposed thermally to yield a medium energy gas, a complex liquid and charcoal. Under the presence of a limited amount of air or oxygen, gasification will occur to yield fuel gas. 11.1.1 Classification of gasification processes
In general, gasification processes can be classified as follows:
• According to types of gas reactant, air or oxygen, there are two kinds of gasification processes: air gasification and oxygen gasification.
• According to ways of gas reactants entering systems there are three kinds of gasification processes: down-draught, up-draught and cross-draught.
• According to ways of feeding materials into systems, there are two kinds of gasifiers: fixed bed and fluid bed. Furthermore, if carbon and ash escaping from a fluid bed system is recycled to the system, the process is recycle fluid bed.
Certainly, such a classification is not comprehensive, because it is based on only one technical characteristic. In fact, one gasifier can include several characteristics, for example, a gasifier can be designed as a recycle fluid bed oxygen gasifier. So various processes could be selected for gasifier design based on the feed materials and the end-uses of the product gas. 11.1.2 Gasifiers Existing in China
In China, there are many institutes undertaking the development of biomass gasification technologies, most of which are members of China Biomass Development Center (CBDC). The CBDC have 21 members in the whole country, including institutes, universities, companies and enterprises, who do research and development on biomass gasification. In the 20 years from 1978-1998, several types of biomass gasifier have been developed. Some of them have been used widely in rural areas and forest areas. By developing the technology across the whole country, several benefits are derived through saving commercial energy, protecting the environment, reducing CO2 emission, and providing quality gaseous fuels in rural areas. Overall, there are five kinds of gasification processes: recycle fluid bed, down-draught fixed bed, up-draught fixed bed, up-draught fluid bed as well as pyrolysis for providing fuel gas (Table 2-22).
Page 93

Table 2-22 Biomass Gasifiers Existing in China
Types Oxidant Type Material Moving GSQ-1100 air up-draught fixed ND-400, ND-900 air down-draught fixed XFL-600, XFL-2500 air up-draught fixed stratified CFBG-1 air down-draught recycle fluid CFBG-2 oxygen down-draught recycle fluid HQ-280 air up-draught fixed 10GF54 air down-draught fixed 6250M air down-draught fixed stratified C100-1 none (pyrolysis) fluid Since 1990, various types of gasification systems have been applied successfully in China. By now, there are about 1,000 gasifiers being operated in China. It is estimated that about 100 sets of large systems have been operated for generating electricity through gasification of rice-dust. About 400 sets of ND gasifier have been set up for drying wood products in timber mills, and about 600 sets of biomass gasifier have been used for purposes of boiling water, drying wood, heating room, generating electricity and providing fuel gas through pipeline nets in rural areas, such as with the XFL gasifier and the CFBG gasifier.
11.2 Technical Aspects
In terms of technology, air gasification is the most suitable approach for developing countries, like China. Air gasification is the simplest gasification process, although it varies in scale and types. Only one example has been tested using oxygen as the reactant to produce a medium energy gas in a timber mill (see Table 2-22). Table 2-23 Technique Aspects of Typed Gasifiers Existing in China
Types Diameter (mm)
Rates (kg/m2/h)
Capacity (GJ/h)
Biomass material
Final use Institutes
GSQ-1100 1100 240 2.90 sawdust heating Nanjing Institute Chemistry for Forest Products
ND-600 600 200 0.66 sawdust drying China Agri-machinery Institute
ND-900 900 200 1.40 sawdust boiler China Agri-machinery Institute
XFL-600 600 200 0.66 crop-straw cooking Energy Institute of Shandong Province
CFBG-1 400 2,000 2.90 sawdust boiler Guangzhou Energy Institute
CFBG-2* 150 2,000 0.67 sawdust boiler Guangzhou Energy
Page 94

(oxygen) Institute 10GF54 400 200 10kW sawdust generation China Agri-machinery
Institute 6250M 2,000 150 160kW rice-husk generation Ministry of Commerce of
China However, the ND, XFL and CFGB gasifiers are the most important gasifiers in China, as shown in Table 2-21. A brief introduction is included for the three kinds of gasifiers. Their gas compositions are shown in Table 2-22. Table 2-24 Constituents of gas fuels by three kinds of gasifiers
Gasifiers Materials Average sizes (mm)
H2 % CO2 % O2 % CH4 % CO % CnHm % N2 % Heat value
(kJ/m2)XFL-600 corn stalk 150 12.3 12.5 1.4 2.3 22.5 0.2 47.8 5,303 ND-900 firewood 50-250 12.4 9.6 0.4 2.9 21.1 0.3 53.4 4,865 CFBG-1 sawdust 0.3 16.3 15.6 0.7 6.9 16.7 1.0 43.3 7,264 11.2.1 ND gasifier
The ND-gasifier developed by China Agri-Machinery Institute, has been used widely in China. For all of gasifiers in this series, an air, down -draught, fixed bed process is used successfully and raw materials gasified are variable, mainly firewood and sawdust, but also stalks and cane residue. Up to now, types of gasifiers have been extended from ND-400 to ND-600 and ND-900, and the total amount of the gasifier in use has been up to 400 sets in China and abroad. The fuel gas is utilized mainly for drying wood products in timer mills, but also for generating electricity, and cooking. From research work, the gasifier is suitable for treating various materials, including corn stalks, sawdust, wood powder, firewood, rice-husks, rice-straws, in a wide range of sizes, 0.25-250mm in diameter. Moisture levels of feed materials must be less than 25%. Although this kind of gasifier is very simple in structure and labour intensive in operation, it is suitable for rural enterprises related to biomass processing, such as timber mill, tea farms, grain processing and so on. In these places, biomass wastes and labour are very cheap, and the system can be operated easily by workers who undertake a little training. Table 2-25 Technique Parameters of Gasifier ND-900 (typicala)
Parameters Values Output capacity (MJ/h)b 1,400 Heat-valuelow of gas (kJ/m3) 5,298 Efficiency of gasification (%)c 76.5 Rate of gasification (kW/m2.h) 610 Gas production 264 Air/materialdry (m3/kg) 1.56 Gas/materialdry (m3/kg) 2.43
Page 95

Note: a. The raw material is tea husk. b. Output capacity means that the gasifier can provide how much
reaction energy to end-use devices. c. Efficiency of gasification means the value of comparing energy
in fuel gas at 20ºC with the energy in the raw material. In China, there are about 20 million tonnes of wood residues which come from processing wooden products. However, only 1.6 million tonnes of these wastes, about 8%, are in use, while another 92% have fallen into disuse in forest farms or round timber mills. In these areas, it is urgent to find a way to reducing environment pollution and avoiding fire dangers caused by these residues. It is certainly believed that the series of gasifier will play an important role on resolving these problems. 11.2.2 XFL Gasifier
This series of XFL gasifier is designed by Shandong Province Energy Institute specially for treating crop residues which used to be the main fuel in rural areas before 1990 and is now mostly burnt directly in farm land. The system can provide a farmer’s family with a fine fuel gas for cooking through a pipeline network in a small village. By this system, over 75% of the energy in crop residues is converted into fuel gas and as the heat efficiency of a gas stove is up to 50%, the total system efficiency is more than 35% which is 2-3 times better than burning biomass directly. In China, there are about 864.4 millions people living in rural areas and contributing to about 234.4 million households, 47,000 towns and 740,000 villages in China. These villages vary in size over a wide range, from 50 to 800 households, on average maybe about 300 households in a village. In the past 8 years, the technology has been applied in a village where there are about 450 people living in 100 households and all users are satisfied with the result. The system has been working well not only on treating crop residues, but also on an improved environment freed from pollution caused from the wastes. In the “9th National Five-year Plan”, the technology will be developed to a new stage, that is, three gas stations which cover from 300 to 500 households will be built up and tested in Shandong Province of China. By now, the gasifier has been developed to several types, such as XFL-600, XFL-900, XFL-1100 and about 400 sets have been put in use in Chinese villages. Table 2-26 Technical Parameters of Gasifier XFL-1100 System (typea)
Parameters Values Output capacity (MJ/h)b 618 Heat-valuelow of gas (kJ/m3) 5,328 Efficiency of gasification (%)c 73.9 Rate of gasification (kW/m2.h) 4,469 Gas production (m3/h) 116 Gas/materialdry (m3/kg) 1.90 Average flow of gas in pipeline (Nm3/h) 80 Capacity of gas hold (m3) 45
Page 96

Pressure in pipeline (Pa) 2,000 Pressure before stove (Pa) 800 Total energy efficiency of the system (%) 35 Note: a. The raw material is tea husk. b. Output capacity means that the gasifier can provide
how much reaction energy to end-use devices. c. Efficiency of gasification means the value of
comparing energy in fuel gas at 20C with energy in raw materials.
The next stage of the research work will be:
• to refine the gas fuel by removing water and tar from the gas, • to improve the burning efficiency of stoves by changing their structure, • to evaluate a typical system based on collecting and analyzing data on investment,
operation cost, income and benefits on fields of environment, energy and society. 11.2.3 CFBG gasifier
Compared with fixed bed gasifiers, the fluid bed gasifier is more sophisticated and more efficient. In general, the gasification rate of fluid bed gasifiers is about 6 times higher than that of a fixed bed gasifier, at 28GJ/m2.h compared with 4.5GJ/m2.h. The heat value of the gas from the former is 20% more than that of latter. However, when the gasifier is used to gasify wood powder from a furniture mill, the conversion efficiency is less than 60%, because some wood powder may be blown out of the gasifier by the airflow. In order to resolve this problem, a new type of fluid bed gasifier has been designed by Guangzhou Energy Institute. This is based on recycling unreacted char which is returned to the gasifier for further reaction. The energy conversion efficiency can be improved to 75%. In 1991, Guangzhou Energy Institute built up the first system in Zhanjiang Timber Mill. Up to now it has been operated successfully for 7 years. In the mill, there is about 6,000kg waste wood powder to be yielded daily by its wood processing. By gasification, not only about 11,600 m3 of gas have been produced for providing a boiler fuel gas, but also environment pollution by these wastes have been exterminated in the mill. The process is achieved depending on following prerequisites: a. The raw material must be very small in sizes, 0.32mm in average. b. The air reactant must be entered into the gasifier at a high speed. c. Carbon powder escaping from the gasifier must be recycled successfully to the gasifier. The resultS from tests is shown in Table 2-27. Table 2-27 Technique Parameters of Gasifier CFBG-1 (typicala)
Parameters Values Output capacity (MJ/h)b 2,910 Heat-valuelow of gas (kJ/m3) 7,264 Efficiency of gasification (%)c 74.6 Rate of gasification (kW/m2.h) 2,000 Gas production (m3/h) 400
Page 97
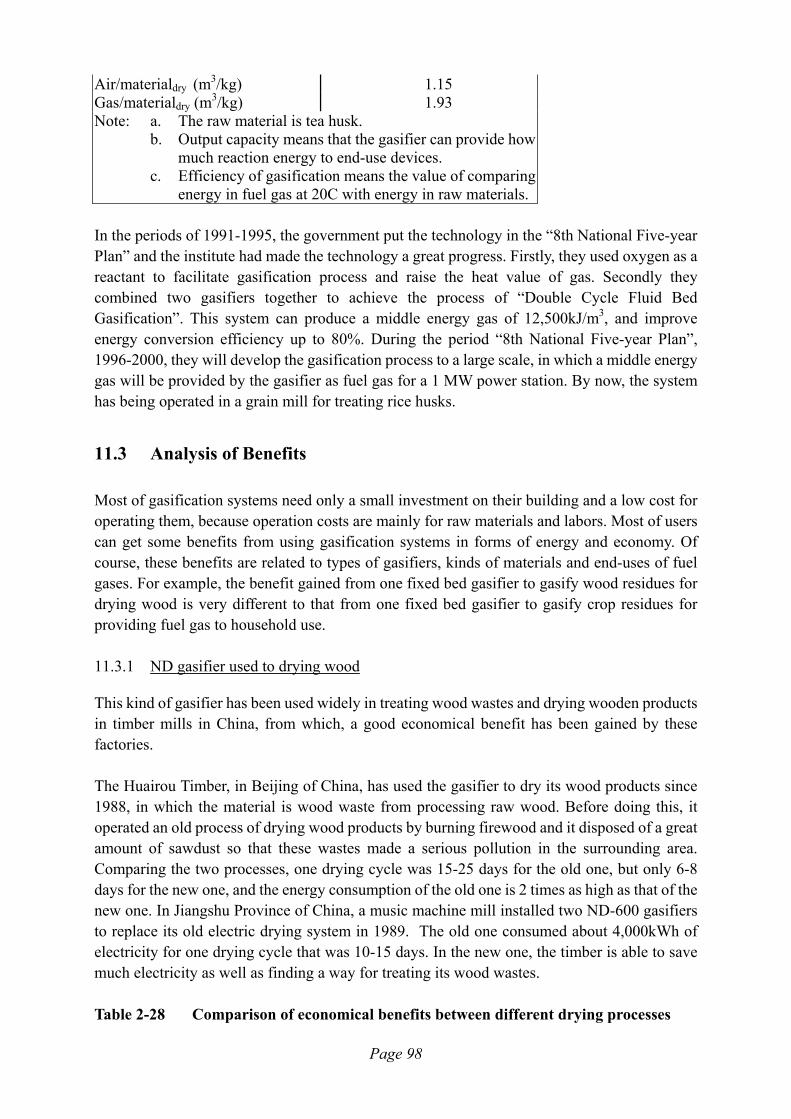
Air/materialdry (m3/kg) 1.15 Gas/materialdry (m3/kg) 1.93 Note: a. The raw material is tea husk. b. Output capacity means that the gasifier can provide how
much reaction energy to end-use devices. c. Efficiency of gasification means the value of comparing
energy in fuel gas at 20C with energy in raw materials. In the periods of 1991-1995, the government put the technology in the “8th National Five-year Plan” and the institute had made the technology a great progress. Firstly, they used oxygen as a reactant to facilitate gasification process and raise the heat value of gas. Secondly they combined two gasifiers together to achieve the process of “Double Cycle Fluid Bed Gasification”. This system can produce a middle energy gas of 12,500kJ/m3, and improve energy conversion efficiency up to 80%. During the period “8th National Five-year Plan”, 1996-2000, they will develop the gasification process to a large scale, in which a middle energy gas will be provided by the gasifier as fuel gas for a 1 MW power station. By now, the system has being operated in a grain mill for treating rice husks.
11.3 Analysis of Benefits
Most of gasification systems need only a small investment on their building and a low cost for operating them, because operation costs are mainly for raw materials and labors. Most of users can get some benefits from using gasification systems in forms of energy and economy. Of course, these benefits are related to types of gasifiers, kinds of materials and end-uses of fuel gases. For example, the benefit gained from one fixed bed gasifier to gasify wood residues for drying wood is very different to that from one fixed bed gasifier to gasify crop residues for providing fuel gas to household use. 11.3.1 ND gasifier used to drying wood
This kind of gasifier has been used widely in treating wood wastes and drying wooden products in timber mills in China, from which, a good economical benefit has been gained by these factories. The Huairou Timber, in Beijing of China, has used the gasifier to dry its wood products since 1988, in which the material is wood waste from processing raw wood. Before doing this, it operated an old process of drying wood products by burning firewood and it disposed of a great amount of sawdust so that these wastes made a serious pollution in the surrounding area. Comparing the two processes, one drying cycle was 15-25 days for the old one, but only 6-8 days for the new one, and the energy consumption of the old one is 2 times as high as that of the new one. In Jiangshu Province of China, a music machine mill installed two ND-600 gasifiers to replace its old electric drying system in 1989. The old one consumed about 4,000kWh of electricity for one drying cycle that was 10-15 days. In the new one, the timber is able to save much electricity as well as finding a way for treating its wood wastes. Table 2-28 Comparison of economical benefits between different drying processes
Page 98
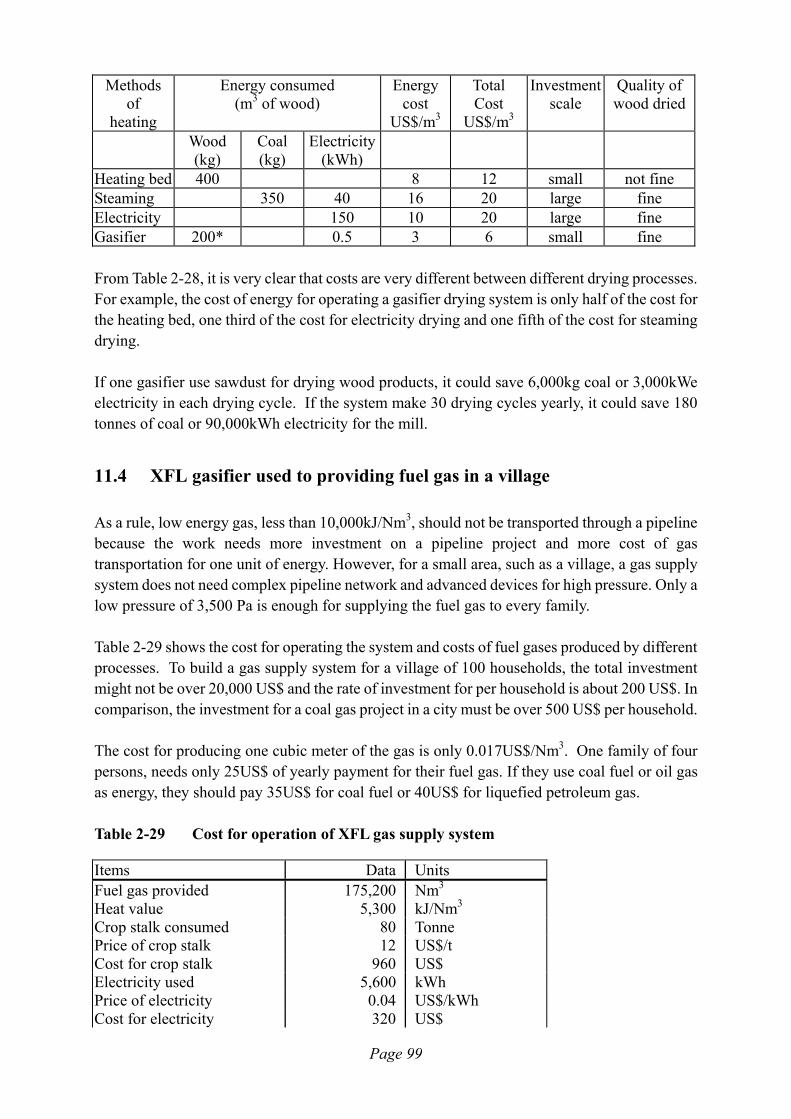
Methods of
heating
Energy consumed (m3 of wood)
Energy cost
US$/m3
Total Cost
US$/m3
Investment scale
Quality of wood dried
Wood (kg)
Coal (kg)
Electricity (kWh)
Heating bed 400 8 12 small not fine Steaming 350 40 16 20 large fine Electricity 150 10 20 large fine Gasifier 200* 0.5 3 6 small fine From Table 2-28, it is very clear that costs are very different between different drying processes. For example, the cost of energy for operating a gasifier drying system is only half of the cost for the heating bed, one third of the cost for electricity drying and one fifth of the cost for steaming drying. If one gasifier use sawdust for drying wood products, it could save 6,000kg coal or 3,000kWe electricity in each drying cycle. If the system make 30 drying cycles yearly, it could save 180 tonnes of coal or 90,000kWh electricity for the mill.
11.4 XFL gasifier used to providing fuel gas in a village
As a rule, low energy gas, less than 10,000kJ/Nm3, should not be transported through a pipeline because the work needs more investment on a pipeline project and more cost of gas transportation for one unit of energy. However, for a small area, such as a village, a gas supply system does not need complex pipeline network and advanced devices for high pressure. Only a low pressure of 3,500 Pa is enough for supplying the fuel gas to every family. Table 2-29 shows the cost for operating the system and costs of fuel gases produced by different processes. To build a gas supply system for a village of 100 households, the total investment might not be over 20,000 US$ and the rate of investment for per household is about 200 US$. In comparison, the investment for a coal gas project in a city must be over 500 US$ per household. The cost for producing one cubic meter of the gas is only 0.017US$/Nm3. One family of four persons, needs only 25US$ of yearly payment for their fuel gas. If they use coal fuel or oil gas as energy, they should pay 35US$ for coal fuel or 40US$ for liquefied petroleum gas. Table 2-29 Cost for operation of XFL gas supply system
Items Data Units Fuel gas provided 175,200 Nm3 Heat value 5,300 kJ/Nm3 Crop stalk consumed 80 Tonne Price of crop stalk 12 US$/t Cost for crop stalk 960 US$ Electricity used 5,600 kWh Price of electricity 0.04 US$/kWh Cost for electricity 320 US$
Page 99
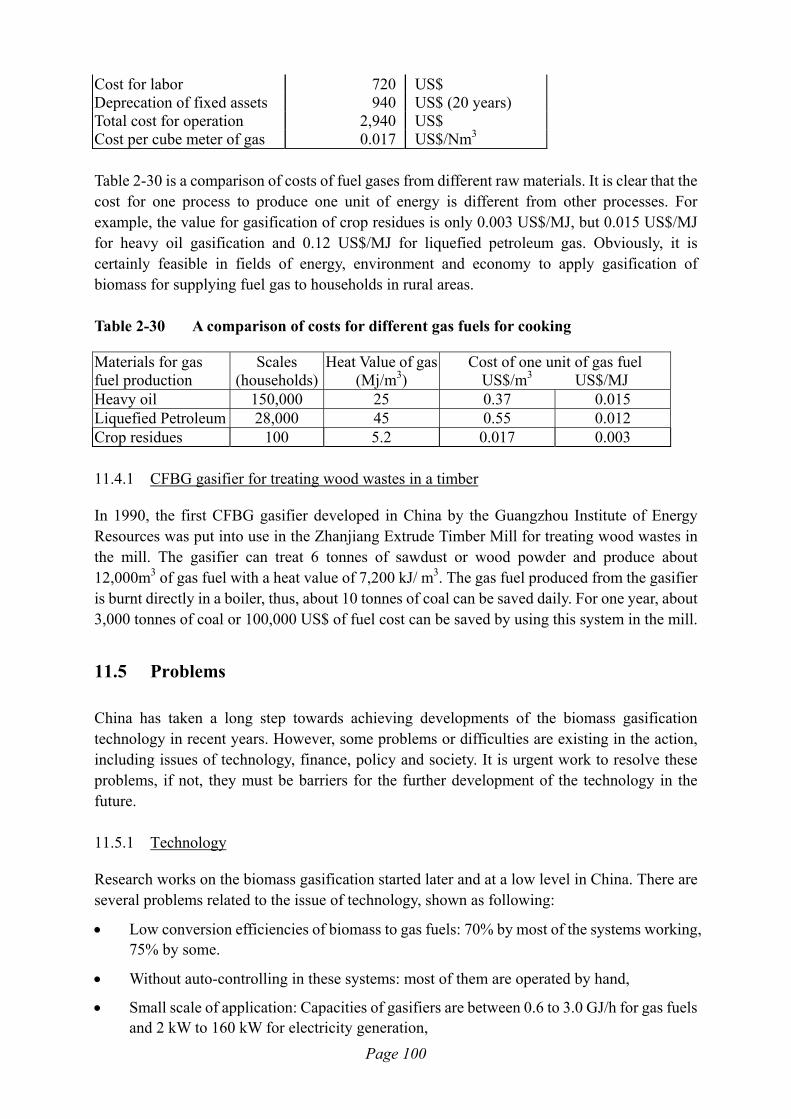
Cost for labor 720 US$ Deprecation of fixed assets 940 US$ (20 years) Total cost for operation 2,940 US$ Cost per cube meter of gas 0.017 US$/Nm3 Table 2-30 is a comparison of costs of fuel gases from different raw materials. It is clear that the cost for one process to produce one unit of energy is different from other processes. For example, the value for gasification of crop residues is only 0.003 US$/MJ, but 0.015 US$/MJ for heavy oil gasification and 0.12 US$/MJ for liquefied petroleum gas. Obviously, it is certainly feasible in fields of energy, environment and economy to apply gasification of biomass for supplying fuel gas to households in rural areas. Table 2-30 A comparison of costs for different gas fuels for cooking
Materials for gas fuel production
Scales (households)
Heat Value of gas (Mj/m3)
Cost of one unit of gas fuel US$/m3 US$/MJ
Heavy oil 150,000 25 0.37 0.015 Liquefied Petroleum 28,000 45 0.55 0.012 Crop residues 100 5.2 0.017 0.003 11.4.1 CFBG gasifier for treating wood wastes in a timber
In 1990, the first CFBG gasifier developed in China by the Guangzhou Institute of Energy Resources was put into use in the Zhanjiang Extrude Timber Mill for treating wood wastes in the mill. The gasifier can treat 6 tonnes of sawdust or wood powder and produce about 12,000m3 of gas fuel with a heat value of 7,200 kJ/ m3. The gas fuel produced from the gasifier is burnt directly in a boiler, thus, about 10 tonnes of coal can be saved daily. For one year, about 3,000 tonnes of coal or 100,000 US$ of fuel cost can be saved by using this system in the mill.
11.5 Problems
China has taken a long step towards achieving developments of the biomass gasification technology in recent years. However, some problems or difficulties are existing in the action, including issues of technology, finance, policy and society. It is urgent work to resolve these problems, if not, they must be barriers for the further development of the technology in the future. 11.5.1 Technology
Research works on the biomass gasification started later and at a low level in China. There are several problems related to the issue of technology, shown as following:
• Low conversion efficiencies of biomass to gas fuels: 70% by most of the systems working, 75% by some.
• Without auto-controlling in these systems: most of them are operated by hand,
• Small scale of application: Capacities of gasifiers are between 0.6 to 3.0 GJ/h for gas fuels and 2 kW to 160 kW for electricity generation,
Page 100
• Lack of sophisticated technology: most gasifier used in China take the process of the air fixed bed gasification, a few gasifiers take the process of fluid bed or recycle fluid bed;
• Little research work on related technologies: such as pretreatment for non-cohesive material, removing tar form gas fuels, catalysis gasification and development of resources.
11.5.2 Resources
Although biomass resources are abundant in China, collection and storage works are very difficult and will be a big problem for using biomass gasification at a large scale. 11.5.3 Finance
As a developing country, China does its best to provide some financial aid for developing the technology, but the aid is not enough for doing this work on a high level and on a large scale. Obviously, a big financial aid from developed countries is necessary for developing the technology quickly in China. 11.5.4 Policy
The government has put a great deal of attention on the technology as mentioned above and supports its development in general. However, there is no policy and law rule to promote its development and application in the country. For example, users or investors could get their loans with low interest or no interest from national banks, and also, they should be treated as tax-payers for paying their income tax at a low tax or tax free. 11.5.5 Society
For less propagation of biomass gasification in the whole country, most of the people do not know the technology and its functions. They believe that conventional energy, like coal, oil and natural gas, are the most convenient energy resources.
11.6 Development in the future
In the period of 1996-2000, the developments on biomass gasification are as following:
To build two gasification systems with pipeline nets in two villages for demonstration: the processes will be the air-down-draught fixed bed with a feeding successfully, their material will be crop residues and the supply capacity of gas fuel will be 300 and 500 households respectively. Also to make 300 systems in application in rural area.
•
•
•
To build a middle scale of power station: the process will be the recycle fluid bed, the material will be the wood powder in a timber mill or rice husk in a grain mill and the capacity will be up to 1.0MW. Also to set up an actual base for developing the technology of biomass gasification power generation on a large scale, more than 3MW.
To make ND series of gasifiers going to markets: the capacity of manufacturing the series will be up to 1,500 sets per year, these gasifiers will be used widely in timber, food
Page 101

processing, tea drying, grain drying and others;
To prompt small generators in a wide use: especially to develop generators of 2 kW and 10kW in remote areas without electricity net, the amount will be 300 sets per year,
•
•
•
To develop new gasification processes and related technologies: catalysis gasification, double recycle fluid bed, gas depuration processes, and so on.
To introduce new technology from developed countries into China for improving the existing gasification processes and developing the large biomass power generation systems in the future.
Page 102
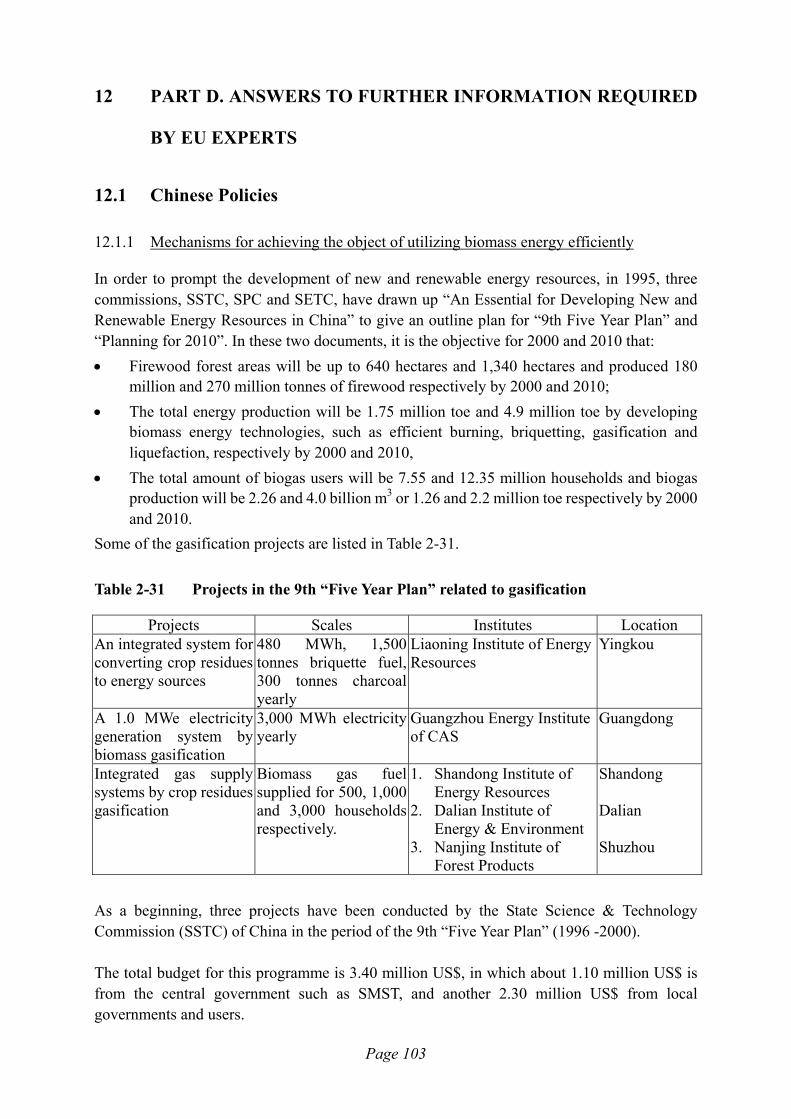
12 PART D. ANSWERS TO FURTHER INFORMATION REQUIRED
BY EU EXPERTS
12.1 Chinese Policies
12.1.1 Mechanisms for achieving the object of utilizing biomass energy efficiently
In order to prompt the development of new and renewable energy resources, in 1995, three commissions, SSTC, SPC and SETC, have drawn up “An Essential for Developing New and Renewable Energy Resources in China” to give an outline plan for “9th Five Year Plan” and “Planning for 2010”. In these two documents, it is the objective for 2000 and 2010 that: • Firewood forest areas will be up to 640 hectares and 1,340 hectares and produced 180
million and 270 million tonnes of firewood respectively by 2000 and 2010; • The total energy production will be 1.75 million toe and 4.9 million toe by developing
biomass energy technologies, such as efficient burning, briquetting, gasification and liquefaction, respectively by 2000 and 2010,
• The total amount of biogas users will be 7.55 and 12.35 million households and biogas production will be 2.26 and 4.0 billion m3 or 1.26 and 2.2 million toe respectively by 2000 and 2010.
Some of the gasification projects are listed in Table 2-31. Table 2-31 Projects in the 9th “Five Year Plan” related to gasification
Projects Scales Institutes Location An integrated system for converting crop residues to energy sources
480 MWh, 1,500 tonnes briquette fuel, 300 tonnes charcoal yearly
Liaoning Institute of Energy Resources
Yingkou
A 1.0 MWe electricity generation system by biomass gasification
3,000 MWh electricity yearly
Guangzhou Energy Institute of CAS
Guangdong
Integrated gas supply systems by crop residues gasification
Biomass gas fuel supplied for 500, 1,000 and 3,000 households respectively.
1. Shandong Institute of Energy Resources
2. Dalian Institute of Energy & Environment
3. Nanjing Institute of Forest Products
Shandong Dalian Shuzhou
As a beginning, three projects have been conducted by the State Science & Technology Commission (SSTC) of China in the period of the 9th “Five Year Plan” (1996 -2000). The total budget for this programme is 3.40 million US$, in which about 1.10 million US$ is from the central government such as SMST, and another 2.30 million US$ from local governments and users.
Page 103

12.1.2 Popularization of new technologies
Under the control of central government, extensive publicity for gasification has been conducted across the whole country through several propaganda media, such as TV programmes, Radio broadcasts, newspaper, magazines, exhibitions and special meetings. 12.1.3 Financial support from government
• Institutes related can get financial aid from SMST and SMA. • Use of fossil fuel, such as coal, gasoline, diesel and liquefied gas, will be limited in rural
areas by increasing their prices and levying a usage tax. 12.1.4 Electricity cost
Electricity costs are very different in different areas depending on capacities of electricity production, price indices, consumer incomes, and so on (Table 2-32). In general, the electricity cost is different for different consumers based on their consumption. In few cases, the cost is fixed monthly or yearly for all consumer families in a resident group according to the group’s electricity consumption shown by a electricity meter. In such a case, there are may be 5 – 10 households in a group and 10 – 50 groups in a village. In addition, there is an incentive policy for industrial consumer to use electricity at different time periods in a day. According to the policy, there are three time periods a day, the peak time: 7:00 – 11:00, 17:00 – 21:00, the valley time: 23:00 – 7:00 and the plain time: 11:00 – 17:00, 21:00 – 23:00. The prices in the three periods are different: the price for the plain time is the basic price shown in the Table 2-32, for the peak time it can be 50% higher than that for the plain time, and for the valley time it can be half that for the plain time. Table 2-32 Prices of electricity in different areas for plain time
Page 104
Area Price (Yuan/kWh) for industry
Price (Yuan/kWh) for consumers
Beijing 0.337 0.364 Shanghai 0.633 0.610 Guangzhou 0.650 Tianjin 0.422 0.379 Shenyang 0.272 0.339 Changchun 0.623 0.339 Dalian 0.240 0.401 Haikou 0.584 0.551 Shenshen 0.850 Jiangmen 0.991 0.672 Shantou 0.870 0.860 Sanya 0.569 0.616 Wuhan 0.470 0.440 Hangzhou 0.500 0.350 Xiamen 0.713 0.367

Jinan 0.560 0.382 Nanjing 0.409 0.470 Chengdu 0.450 0.435 Chongqing 0.376 12.1.5 Available incentive policies
• Companies concerned with development of new and renewable energy technologies, like gasification, can get a long-term low or non-interest loan from national agencies or banks, such as SETC, SPC, CBAD.
• New companies established to develop new and renewable energy technologies, like gasification, can be free of tax or have reduced tax for three years or four years for several taxes, such as increment tax and import tax related to this field.
• Referring wind power generation, the biomass electricity technologies will be protected by a special policy that electric companies must receive the electricity generated by bio-energy systems in low prices, self-cost in biomass generation station and sale it in high prices, market prices of local electricity
12.2 Technical and market data
In China, the production of internal combustion engines was up to 221.5 million kWe and power generation equipment was up to 23.5 million kWe in 1996. 12.2.1 Manufacturers of gasifier
Table 2-33 A list of manufacturers of biomass gasifier
Manufacturers Equipment /facilities
Location areas
Shunsheng Gasifier&Heat Supply Equip. Plant Huairou Gasification Equipment Manufacturer
Gasifier fixed bed Gasifier fixed bed
Beijing Beijing
Liaoning Energy Resources Co. Ltd. Beijing Green Globe Energy Co. Ltd. Botou New Energy Service Co. Ltd. Shandong Tianyi Green Energy Co.Ltd Yiyang Biomass Fuel Co. Ltd.
Gasifier fixed bed Gasifier fixed bed Gasifier fixed bed Gasifier fixed bed Pyrolysis fixed bed
Liaoning Beijing Hebei Shandong henan
Dalian Energy & Environment Co. Ltd. Guangzhou Energy Institute
Pyrolysis fixed bed Cycle fluid bed gasifier
Liaoning Guangzhou
12.2.2 Manufacturers of internal combustion engine
In China, there may be more than 100 factories for manufacturing internal combustion engine in different scales. In Table 2-34, several factories are concerned with production of bio-gas or biomass gas engines. Table 2-34 A list of manufacturers of internal combustion engine
Manufacturers Engine Location, areas
Page 105

Dalian Diesel Engine Factory Diesel engine Dalian Wuxi Diesel Engine Factory Diesel engine Jiangshu Weifang Diesel Engine Factory Diesel engine Shandong Jinan Diesel Engine Factory Diesel engine Shandong Nantong Greatwall Engine Factory Diesel & gasoline engine Jiangshu Shanghai Dynamic Engine Factory Diesel & gasoline engine Shanhai Changzhou Diesel Engine Factory Diesel engine Jiangshu Hongyan Intern Combustion Engine Co. Ltd. Diesel and gas engine Chongqing
12.3 Huoshi Village
12.3.1 Feedstocks
1. Is there sufficient biomass to provide fuel gas or electricity? In the village, there are about 1,600 tonnes of crop residues, 175 tonnes of pruning
residues and 1,000 tonnes of wood wastes from timber mill. In total, there are about 1,100 toe of available biomass for gasification in the village. The total potential capacity of gas fuel by gasification might be 7.2 million m3 yearly. In the village, there are about 4,000 persons in 1,000 households who need only about 2.2 million m3 of such gas fuel for their cooking use, that is, about 70% of crop residues consumed yearly or 30% of the total potential gas production.
2. When does this fuel arrive (seasonally) and how can it be stored? Traditionally, all crop residues in the village are produced in the month of October and
are stored in an open-air pile in a yard. 3. Should it be pre-processed such as by briquetting and what is the cost of this? Before the crop residues can be stored in an open-air pile, they only need to be sun-dried
in farms which incurs no cost. 4. What does the fuel actually cost to buy apart from any processing prior to
gasification? See Table 2-16. 5. The projected wood wastes from the parquet flooring factory may not be fully
available for gasification because some is required for steam raising at the factory. Of the total wood waste, how much is available?
The wood wastes from the factory are not utilized in any way, so all of them can be used as feedstock for gasification.
6. What types of biomass are available and at what time of the year?
• Corn stalks and corncobs are the main crop residues in the village and can be used over the whole year.
• Pruning waste from fruit trees is another biomass source and can be used in winter. • Wood waste is also an available biomass source in the village in a whole year. • Crop residues
Page 106

7. What are the prices per dry tons and what are the moisture contents of each type of feed?
Table 2-34 Some information on biomass materials in Huoshi village
Biomass Price in dry tonnes US$/t Moisture content % Corn stalk and cob 25 5-8 (after sun-dry) Pruning waste 16 5-10(after sun-dry) wood waste 36 10-20
8. Could the Chinese authorities confirm the biomass availability figures quoted in section 2.4.1.or provide up dated information? • Figure 2-1: waste wood, such as wood chips and sawdust, and or crop residues,
such as rice straws, rice husk, corn stalks and wheat straws. • Figure 2-2: wood chips and sawdust for bubbling fluid bed and wood powder for
circulating fluid bed. 9. Could the Chinese authorities confirm the biomass and utility cost figures quoted
in section 2.4.2.or provide up dated information? • Biomass: sawdust, rice husk, crop stalk powdered. • Utility cost: (not be understood).
10. What other wastes and residues could be made available and at what cost? Little other biomass is available in the village.
12.3.2 Products
1. What is the preferred product from the village gasifier - fuel gas for distribution or electricity?
Of course, the preferred product from the village gasifier is fuel gas for distribution to household, then it is electricity.
2. How much fuel gas is needed for cooking, and how does the demand for gas vary
over the day, over the week and over the year? In the whole village, 2.2 million m3 of gas fuel should be needed for cooking in one year.
By a suitable scale gas storage system, the gas fuel can be provided fully to meet cooking demand over the day; by the traditional method of open-air pile after sun-drying stalks, A well operation of the system can be made in the month and the year.
3. Will the fuel gas be used for heating or other purpose and if so how much will be
required? Not for heating, but for electricity generation. The amount may be 5 million m3 for a
160 kWe generator for one year. 4. What impact will changes in village population have on the size of the installation? The natural growth rate of population will be controlled to 1.0% by a population plan
and the amount of gas fuel from the gasifier will be enough for 3 times the existing
Page 107

population in the village. 5. What skill and labour is available for operation of the unit? Labour is available having some knowledge of internal combustion engines, machines
and computers. 6. Are any grants or subsidies available? Yes, the SMST will provide 10 % of the total investment for research works. 7. Will any industries use the gas? No by now, but maybe in future depending on biomass sources, national electricity
provided and energy situation in future. 8. Who will own and operate the factory? The village authority will be its owner and employ some skilled workers to operate the
system. 9. Will the toxicity of the high carbon monoxide levels in the gas create a problem? Yes, maybe, but the toxic problem can be resolved by adding suitable odours to the gas.
12.3.3 Gas distribution
1. Could the Chinese experts comment on the desired size of the storage facilities as gas storage facilities in Europe were traditionally about one day, but a facility of half a day is suggested for Huoshi?
No, the gas storage facility should be capable of storing fuel gas produced in 2/3 of a day.
2. What is the variation of gas consumption over each day and over different hours
of the day as this important in sizing the gasifier and the storage? Data should be available from other Chinese village.
In Chinese rural areas, traditionally, the peak of fuel usage is the time when the residents are cooking for their dinner together with all family members, between 17.00 and 19.00. The fuel consumed may be half that for a day. The fuel consumption is about 1.2 m3 of gas for breakfast, 1.8 m3 for lunch and 3 m3 for dinner.
3. Will the gas piping system in the village and water treatment system be left as the
responsibility of the local authorities on the assumptions that this technology is available locally?
Yes, certainly.
12.4 General questions
1. Will the economics of the plant be negatively affected by the biogas plants already present in many farm houses?
No, it won’t be, because the household biogas digester needs too much labour and is too Page 108
dirty for feeding materials into and emptying out the digester, so it is very inconvenient for users.
2. Do the Chinese experts agree on the capacity proposal (1,625 MJ/hr during 16
hr/day)? The capacity of gasifier should be bigger than 1,625 MJ/hr for 16 hr/day, because the
amount of gas fuel demand for cooking is up to 6,000 m3, that is, at least 1883 MJ/ hr for 16 hr/day of the capacity could meet the cooking demand. In fact, the total capacity of gasifier can be up to 6,000 MJ/hr for 16 hr/day, based on biomass resources in the village. It can be suggested that a gasifier system with a capacity of 2,000 MJ/hr for 16 hr/day can be built as the first step for producing the cooking fuel.
3. Where will the site of the gasifier be and what provision will be made for
availability of water, electricity, space for water treatment and biomass storage (although storage facilities are understood to be outside the project and provided locally).
At the east-north of the village, there is a useless land, about 1,000 m2, which can be used for setting up the gasifier, gas storage tank and waste water treatment facility where is near to the electricity net and water-line and between two resident areas. According the traditional storage method, the biomass fuel can be in storage of open-air piles at the north of the plant site, about 30 m away.
1. Are the cooking installations to be adapted to the low calorific gas produced? If so,
the cost should be considered and be taken into account in the feasibility study. Yes, the stove has been developed by the Shandong Province Energy Institute and costs
for different types are different, and might be between 10 and 30 US$ per set. 12.4.1 Additional comments and observations
1 The village will prepare the biomass storage process. 2 LIER will handle the feed preparation. 3 Chinese experts from a special institute will design the gas distribution system and the
user will cover the cost. 4 LIER will design the wastewater treatment facility.
12.5 Husk Project
12.5.1 Feedstocks
1. What are the arisings of rice husk? In China, the production of paddy was up to 200 million tonnes in 1996, that is, about 40
million tonnes of rice husk can be produced from grain mills yearly. 10 years ago, the rice husk had been utilized as animal feed or cooking fuel in rural areas. But by now, the rice husk began to become useless. The first reason is that the Chinese Ministry of Agriculture forbade animal farmers to use it as an animal feed, due to the husk being less nutritious. Secondly, as a fuel, the rice husk is used by direct combustion, which is
Page 109
not only less efficient, but also pollutes the environment with too much ash and too much smoke. So, it is urgent to find a way for treating the waste.
2. What is the range of size plant that should be considered? Capacities between 2 and 5 MWe are suitable to local demand. 3. When does this fuel arrive (seasonally) and how can it be stored? In general, the waste can be utilized over the whole year because the paddy must be
processed every day in a year. In fact, there is no problem of storage for the rice husk. 4. What the cost of the rice husk? In Fujian Province, the price of rice husk is about 11.1 US$/ton. 12.5.2 Products
1. Will any electricity be exported and if so, what is its value? There was about 6.03 billion kWh of electricity exported abroad. The value is not
known. 2. What skills and labour is available for operation of the unit?
Labour is available having some knowledge of internal combustion engines, machine and computer.
3. Are any grants or subsides available? Yes, the SMST will provide 10 % of the total investment for research work. 12.5.3 Gas distribution
1. What is the variation of electricity consumption over each day and over the different hours of the day as this is important in sizing the gasifier and generation set?
There are three levels of electricity consumption: 8:00 – 12:00 mainly for production activities. 13:00 – 17:00 mainly for production activities. 18:00 – 21:00 (in winter); 19:00 – 22:00 (in summer) mainly for living. 2. What turn down is required? In general, the system is needed to be turned down at the time of 23:00 – 06:00. 3. Will the gas piping system in the village and the water treatment be left as the
responsibility of the local authorities on the assumption that this technology is available locally?
Yes, it will be.
Page 110

13 REFERENCES
1. Statistical Yearbook of China, China Statistical Publishing House, 1994. 2. Statistical Yearbook of China, China Statistical Publishing House, 1997 3. Rural Statistical Yearbook of China, China Statistical Publishing House, 1994. 4. New and Renewable Energy - Technologies and Products in China, State Science &
Technology Commission of China, 1995. 5. A report on development of energy in China, Yan Changle et al, Economy Management
Press, 1994. 6. A Essential Workframe for Developing New and Renewable Energy Resources in China,
SSTC, SPC and SETC, 1995. 7. Priority Projects on Developing New and Renewable Energy Resources in China, SSTC,
1995. 8. A Prediction Research Works on Energy Demand for 2050 in China, Zhou Xiaoqian et al,
the Integrated Planing Division of Ministry of Energy, 1990. 9. New and Renewable Energy Technology and Products in China, SSTC, 1995. 10. An Index of Institutes for New and Renewable Energy in China, SSTC, 1996. 11. Biomass Gasification in China, Yuan Zhenhong, Workshop on Biomass Production and
Utilization, Trieste, Italy, 1996, 5. 12. A Strategy Evaluation Research on Solid Fuel Technology from Biomass in China, Lin
Guofen et al, Research Report for the National Planing by SSTC, 1995. 13. Research and Development Works on Biomass Energy Conversion Technology in China,
Yuan Zhenhong et al, A Report to SSTC, 1994. 14. A Strategy Research on Liquid Fuels from Biomass, Yuan Zhenhong et al., A Research
Work in the “8th National Five-year Plan for the Development of Science & Technology” 1995, 6.
15. A Feasibility Research on Priority Projects of Biomass Energy Technology, Yuan Zhenhong et al, A Meeting Report for the Priority Project Plan by SSTC in the Period of the “9th Five Years Plan”, 1996,3.
16. A Recycle Fluid System for Gasification of Biomass, Xu Bingyan et al., A Research Work put in the “8th National Five-year Plan for the Development of Science & Technology” 1995, 12.
17. A research Work on Catalysis Gasification and its Kinetics for Wood Materials, Jiang Jianchun et al., A Research Work put in the “8th National Five-year Plan for the Development of Science & Technology” 1993, 7.
18. An analysis on Application of CFBG Gasification Technology, Zhen Shunpeng and Wu Chuangzhi et al, 1998
19. Gas Fuel Station with Biomass CFBG Gasifier in Small or Middle City or Town, Xu Bingyan et al 1998.
20. ND-600 Gasifier for Crop and Forest Residues and its Utiliztion, Yang An et al., A workshop on Technologies for Development of New Fuels, the Ministry of Agriculture, 1992.
Page 111
Page 112
21. Exploitation and Utilization of Biomass and the Establishment of Demonstration Project, Yuan Zhenhong et al., Proposal Submitted to priority Projects of “21st Century Agenda of China” 1995.
22. Research Works on Gasification of Biomass and its Key Technology in China, Xu Binyan et al., New Energy, 1995,17(12).
23. The Status of Biomass Energy Technology and its Utilization in China, He Yuanbin et al., a Workshop on Biomass Utilization, AIT, Bangkok, 1995, 9.
24. Present Situation and Research on Fuelwood Forest in China, Guo Huairang, Research and Development of Biomass Energy Technology in China, China Science & Technology Press, 1992
25. Present Situation of Biomass Resources and Their Utilization in China, Xiong Chengyong et al., Research and Development of Biomass Energy Technology in China, China Science & Technology Press, 1992, 7.
26. Evaluation and Utilization of Biomass Energy Resources in China, Wang Mengjie, Research and Development of Biomass Energy Technology in China, China Science & Technology Press, 1992, 7.
27. Biomass Pyrolysis Gasification Technology and Gas Supplying Network in a village, Sun Li et al., Research and Development of Biomass Energy Technology in China, China Science & Technology Press, 1992, 7.