an asterisk monitoring infrastructure based on nagios
TRANSCRIPT

HAL Id: inria-00172050https://hal.inria.fr/inria-00172050
Preprint submitted on 12 Nov 2007
HAL is a multi-disciplinary open accessarchive for the deposit and dissemination of sci-entific research documents, whether they are pub-lished or not. The documents may come fromteaching and research institutions in France orabroad, or from public or private research centers.
L’archive ouverte pluridisciplinaire HAL, estdestinée au dépôt et à la diffusion de documentsscientifiques de niveau recherche, publiés ou non,émanant des établissements d’enseignement et derecherche français ou étrangers, des laboratoirespublics ou privés.
An Asterisk monitoring infrastructure based on NagiosRadu State, Cristi Stefan
To cite this version:Radu State, Cristi Stefan. An Asterisk monitoring infrastructure based on Nagios. 2007. �inria-00172050�

Deliverable
Management of the Internet and Complex Services
European Sixth Framework Network of Excellence FP6-2004-IST-026854-NoE
Deliverable
An Asterisk monitoring infrastructure based on NagiosRadu State, [email protected], Cristian Stefan, [email protected]
The EMANICS Consortium
Caisse des Dépôts et Consignations, CDC, FranceInstitut National de Recherche en Informatique et Automatique, INRIA, FranceUniversity of Twente, UT, The NetherlandsImperial College, IC, UKInternational University Bremen, IUB, GermanyKTH Royal Institute of Technology, KTH, SwedenOslo University College, HIO, NorwayUniversitat Politecnica de Catalunya, UPC, SpainUniversity of Federal Armed Forces Munich, CETIM, GermanyPoznan Supercomputing and Networking Center, PSNC, PolandUniversity of Zürich, UniZH, SwitzerlandLudwig-Maximilian University Munich, LMU, GermanyUniversity of Surrey, UniS, UKUniversity of Pitesti, UniP, Romania
© Copyright 2006 the Members of the EMANICS Consortium
For more information on this document or the EMANICS Project, please contact:Dr. Olivier FestorTechnopole de Nancy-Brabois — Campus scientifique615, rue de Jardin Botanique — B.P. 101F—54600 Villers Les Nancy CedexFrancePhone: +33 383 59 30 66Fax: +33 383 41 30 79E-mail: <[email protected]>
Page 1 of 40

Deliverable
Document Control
Title: An Asterisk monitoring infrastructure based on NagiosType:Editor(s): Dr. Olivier FestorAuthor(s): Cristi Stefan, Radu StateE-mail: [email protected], [email protected] ID:
AMENDMENT HISTORY
Version Date Author Description/Comment
V 1.0 20-04-2007 Cristi Stefan final version
Legal Notices
The information in this document is subject to change without notice.
The Members of the EMANICS Consortium make no warranty of any kind with regard to thisdocument, including, but not limited to, the implied warranties of merchantability and fitness for aparticular purpose. The Members of the EMANICS Consortium shall not be held liable for errorscontained herein or direct, indirect, special, incidental or consequential damages in connection withthe furnishing, performance, or use of this material.
Page 2 of 40

Deliverable
Table of contents
1 Introduction 4
2 Installation 6 2.1 Prerequisites 6 2.2 Main application 7 2.3 Access security 8
3 Configuration 11 3.1 Main config file 11 3.2 The network specification 15 3.2.1 Hosts 17 3.2.2 Services 17 3.2.3 Dependencies 18 3.2.4 Host groups 19 3.2.5 Host extended informations 19 3.3 The alerting mechanism 20 3.3.1 Contacts 20 3.3.2 Contact groups 21 3.3.3 Time periods 21 3.3.4 Escalations 22 3.4 The command definitions 22 3.4.1 General commands 17 3.4.2 Check commands 23 3.4.3 Misc commands 23 3.5 The resource file 24 3.6 The CGI configuration 24
4 Running the application 26 4.1 Starting the server 26 4.2 Customizing the interface 28 4.3 Adding Jabber support 29
5 Installing the Oreon system 30 5.1 Pre-requisites 30 5.2 Configuration 32 5.3 Customization 34
6 Adding graphical display module 35
7 Plugin source code 38
8 Abbreviations 39
Addendum: quick Nagios deployment
Page 3 of 40

Deliverable
An Asterisk monitoring infrastructure based on Nagios
I. Introduction
sterisk is a SIP based OpenSource PBX, offered by Digium, and works on Linux platforms providing advanced VoIP services to either soft- or hardware IP phones. The EMANICS Virtual Laboratory has developed an
international VoIP testbed consisting of several Asterisk servers spread across Europe, each one located at the partner's site, with its own users and extensions, all servers being interconnected by the IAX protocol.
A
Also, the testbed partners can communicate by video conference, using either webcams or video-enabled hardware IP phones. Polycom offers an integrated audio-video system for video conferencing.
The connection to PSTN is achieved using hardware from Digium, like the TDM400 interface card.Every user has a voice-mail box on his server, accessible from the local network.
The goal of my stage is to offer a unified view of the testbed from a single central point. By using monitoring software like Nagios, the partners can have a clear look at the real time status of all servers and services, and, when problems do occur, the system administrators can be notified automatically by email.
Page 4 of 40
Deliverable
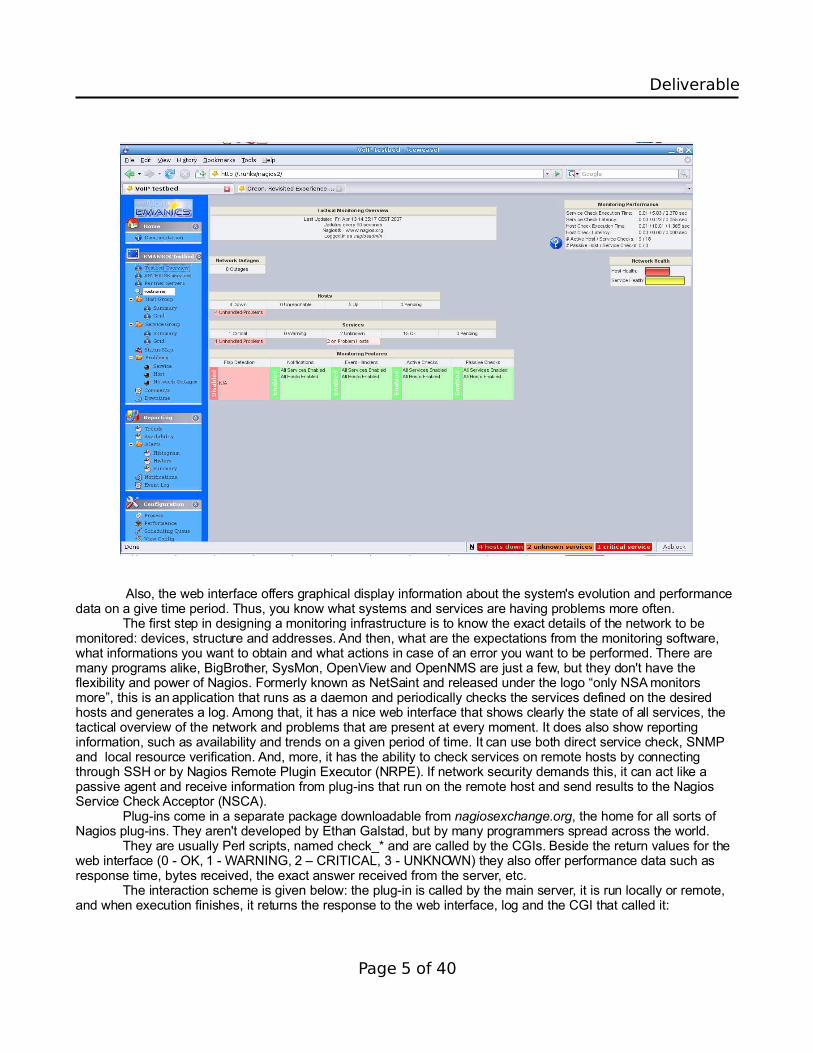
Also, the web interface offers graphical display information about the system's evolution and performance data on a give time period. Thus, you know what systems and services are having problems more often.
The first step in designing a monitoring infrastructure is to know the exact details of the network to be monitored: devices, structure and addresses. And then, what are the expectations from the monitoring software, what informations you want to obtain and what actions in case of an error you want to be performed. There are many programs alike, BigBrother, SysMon, OpenView and OpenNMS are just a few, but they don't have the flexibility and power of Nagios. Formerly known as NetSaint and released under the logo “only NSA monitors more”, this is an application that runs as a daemon and periodically checks the services defined on the desired hosts and generates a log. Among that, it has a nice web interface that shows clearly the state of all services, the tactical overview of the network and problems that are present at every moment. It does also show reporting information, such as availability and trends on a given period of time. It can use both direct service check, SNMP and local resource verification. And, more, it has the ability to check services on remote hosts by connecting through SSH or by Nagios Remote Plugin Executor (NRPE). If network security demands this, it can act like a passive agent and receive information from plug-ins that run on the remote host and send results to the Nagios Service Check Acceptor (NSCA).
Plug-ins come in a separate package downloadable from nagiosexchange.org, the home for all sorts of Nagios plug-ins. They aren't developed by Ethan Galstad, but by many programmers spread across the world.
They are usually Perl scripts, named check_* and are called by the CGIs. Beside the return values for the web interface (0 - OK, 1 - WARNING, 2 – CRITICAL, 3 - UNKNOWN) they also offer performance data such as response time, bytes received, the exact answer received from the server, etc.
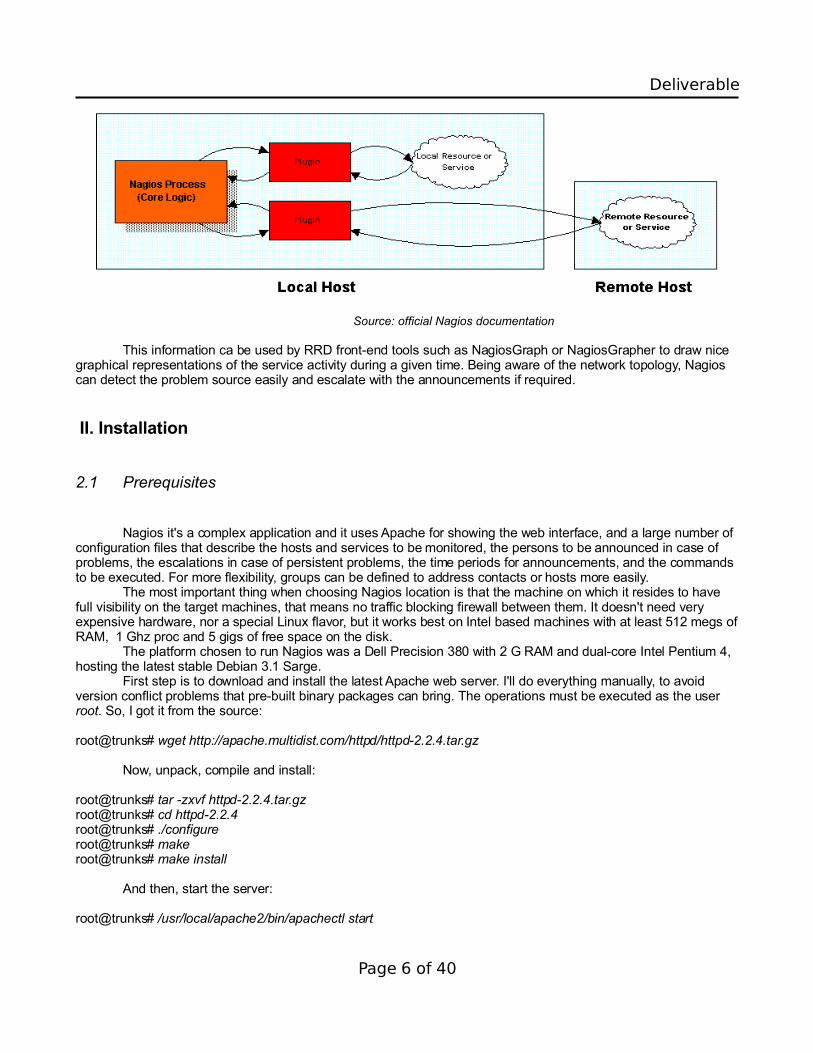
The interaction scheme is given below: the plug-in is called by the main server, it is run locally or remote, and when execution finishes, it returns the response to the web interface, log and the CGI that called it:
Page 5 of 40
Deliverable
Source: official Nagios documentation
This information ca be used by RRD front-end tools such as NagiosGraph or NagiosGrapher to draw nice graphical representations of the service activity during a given time. Being aware of the network topology, Nagios can detect the problem source easily and escalate with the announcements if required.
II. Installation
2.1 Prerequisites
Nagios it's a complex application and it uses Apache for showing the web interface, and a large number of configuration files that describe the hosts and services to be monitored, the persons to be announced in case of problems, the escalations in case of persistent problems, the time periods for announcements, and the commands to be executed. For more flexibility, groups can be defined to address contacts or hosts more easily.
The most important thing when choosing Nagios location is that the machine on which it resides to have full visibility on the target machines, that means no traffic blocking firewall between them. It doesn't need very expensive hardware, nor a special Linux flavor, but it works best on Intel based machines with at least 512 megs of RAM, 1 Ghz proc and 5 gigs of free space on the disk.
The platform chosen to run Nagios was a Dell Precision 380 with 2 G RAM and dual-core Intel Pentium 4, hosting the latest stable Debian 3.1 Sarge.
First step is to download and install the latest Apache web server. I'll do everything manually, to avoid version conflict problems that pre-built binary packages can bring. The operations must be executed as the user root. So, I got it from the source:
root@trunks# wget http://apache.multidist.com/httpd/httpd-2.2.4.tar.gz
Now, unpack, compile and install:
root@trunks# tar -zxvf httpd-2.2.4.tar.gzroot@trunks# cd httpd-2.2.4root@trunks# ./configureroot@trunks# makeroot@trunks# make install
And then, start the server:
root@trunks# /usr/local/apache2/bin/apachectl start
Page 6 of 40

Deliverable
Next thing is to install the gd graphics library:
root@trunks# wget http://www.libgd.org/releases/gd-2.0.34.tar.gzroot@trunks# tar zxvf gd-2.0.34.tar.gzroot@trunks# cd gd-2.0.34root@trunks# ./configureroot@trunks# makeroot@trunks# make install
Finishing with the prerequisites, I can go and install the main app, Nagios itself. At the beginning I created a separate user and group (to allow external commands to be submitted through the web interface) for Nagios:
root@trunks# groupadd nagiosroot@trunks# useradd -g nagios -M nagiosroot@trunks# groupadd nagiocmdroot@trunks# usermod -G nagiocmd nagiosroot@trunks# usermod -G nagiocmd www-data
2.2 Main application
And now I can finally do
root@trunks# wget http://ovh.dl.sourceforge.net/sourceforge/nagios/nagios-2.6.tar.gzroot@trunks# tar zxvf nagios-2.6.tar.gzroot@trunks# cd nagios-2.6root@trunks# ./configure --prefix=/usr/local/nagios --with-htmlurl=/nagios2/ --with-cgiurl=/nagios2/cgi-bin --with-nagios-user=nagios --with-nagios-group=nagios --with-command-group=nagiocmd --sysconfig=/etc/nagios2 --localstatedir=/var/nagios --with-gd-lib=/usr/lib/ --with-mail=/usr/bin/mail --with-lockfile=/var/nagios root@trunks# make allroot@trunks# make install && make install-init
In most cases, the last five parameters from the configure command can be skipped without problems, because they are successfully guessed by the script.
The role of the parameters is to specify where Nagios will reside, what will be the path to call on the web interface, where will CGIs be invoked from, what is the Nagios user and command group, the variable data directory, where the gd library and mail binary are located, and where the PID (lock) file will be stored. All these settings can be found in the main configuration file, the nagios.cfg, and can be also set after installation, in case the command fails to run with them. For running external commands I need to
root@trunks# make install-commandmode
And, to have a starting point in the configuration, I create the samples:
root@trunks# make install-config
The result is the following directory structure: /usr/local/nagios where I have the following folders:
• /bin, for the main executable;
Page 7 of 40

Deliverable
• /libexec, for the plugins;• /sbin, for the CGIs;
Although there are a few more folders, the ones that are really used by my installation are located like this:• /etc with the config files is stored in the /etc/nagios2;• /var with external commands and archived log files is in the /var/nagios;• /share with documentation and web interface files is in /usr/share/nagios2.
Now it's time to install the plug-ins. Some have prerequisites (like fping, qstat, net-snmp, openldap, libmysql, or lm-sensors) but what I need is already installed or can easily be via apt-get. So I ran:
root@trunks# wget http://ovh.dl.sourceforge.net/sourceforge/nagiosplug/nagios-plugins-1.4.7.tar.gzroot@trunks# tar zxvf nagios-plugins-1.4.7.tar.gzroot@trunks# cd nagios-plugins-1.4.7root@trunks# ./configure --prefix=/usr/local/nagios --with-nagios-user=nagios –with-nagios-group=nagios –with-cgiurl=/nagios/cgi-binroot@trunks# makeroot@trunks# make install
There are other options possible here, like --with-mysql or --with-openssl but, since I don't use those plug-ins for this specific task, that is enough...
Now, I had to decide weather I use SSL or not for the connection to Apache. Since the interface will be used only on the local machine, it's a lot simpler without the hassle of encryption.
The basic installation phase is now over and it would have been a lot simpler in case of using the apt-get tool to install the packages and dependencies.
2.3 Access security
To tell Apache that it should offer the Nagios content, I defined an alias and secure access to it. At the end of /etc/apache2/apache2.conf I added a line like this:
Include /etc/apache2/sites-enabled/
and then, I created there a file called nagios with the following content:
ScriptAlias /nagios2/cgi-bin /usr/local/nagios/sbin<Directory "/usr/local/nagios/sbin"> Options ExecCGI AllowOverride None Order allow,deny Allow from all AuthName "Nagios Access" AuthType Basic AuthUserFile /usr/local/nagios/etc/htpasswd.users Require valid-user</Directory>
What I did was to tell Apache that the CGIs are located in /usr/local/nagios/sbin and they should be executed by mod_cgi module, that I want to disable the .htaccess file based access by not allowing override of the default authentication, and define which clients are allowed to connect to the web console - under the name “Nagios Access”, that I don't use SSL for authentication, where the user list is located, and that a user must authenticate to see the CGIs results. I have not restricted any address (Allow from all) but, without user name and password, a guest can only see the welcome page and the documentation.
Page 8 of 40

Deliverable
After that I've defined the alias for the plain HTML part of the web interface, freely viewable:
Alias /nagios2 /usr/local/nagios/share<Directory "/usr/local/nagios/share"> Options None AllowOverride None Order allow,deny Allow from all</Directory>
For the changes to take effect, I need to restart the Apache daemon so that it reads the file:
root@trunks# /etc/init.d/apache2 reload
If there's no error shown, pointing the browser to the http://trunks/nagios2 opens the web interface, but for now I can't view any service or host details since I haven't configured anything, just the logo and doc.
Even if I don't configure SNMP for now, it's a good idea to have it installed for later use:
root@trunks# cpan install Net::SNMP
To be sure the installation works, I can invoke a plug-in manually from the shell, but for that the user root must have the permission to execute the script:
root@trunks# chown nagios /usr/local/nagios/libexec/*root@trunks# chown root.nagios /usr/local/nagios/libexec/check_icmproot@trunks# chmod 4711 /usr/local/nagios/libexec/check_icmp
And by calling
root@trunks# /usr/local/nagios/libexec/check_icmp -H trunks
I got the following:
OK - trunks: rta 0.028ms, lost 0%|rta=0.028ms;200.000;500.000;0; pl=0%;40;80;;
The plug-in terminated successfully and, beside the return status – OK, it printed some performance information: real time average, packet loss and the warning settings.
Before stepping into the configuration work, I also decided to reconfigure the MTA to be able to send mail outside the local system (for Nagios notifications):
root@trunks# dpkg-reconfigure exim4-config
and I've chosen the option to send to Internet. The sender name will be [email protected] but, as Nagios doesn't need to receive mail, the address to listen on will be only the localhost. No relay domains are
Page 9 of 40
Deliverable
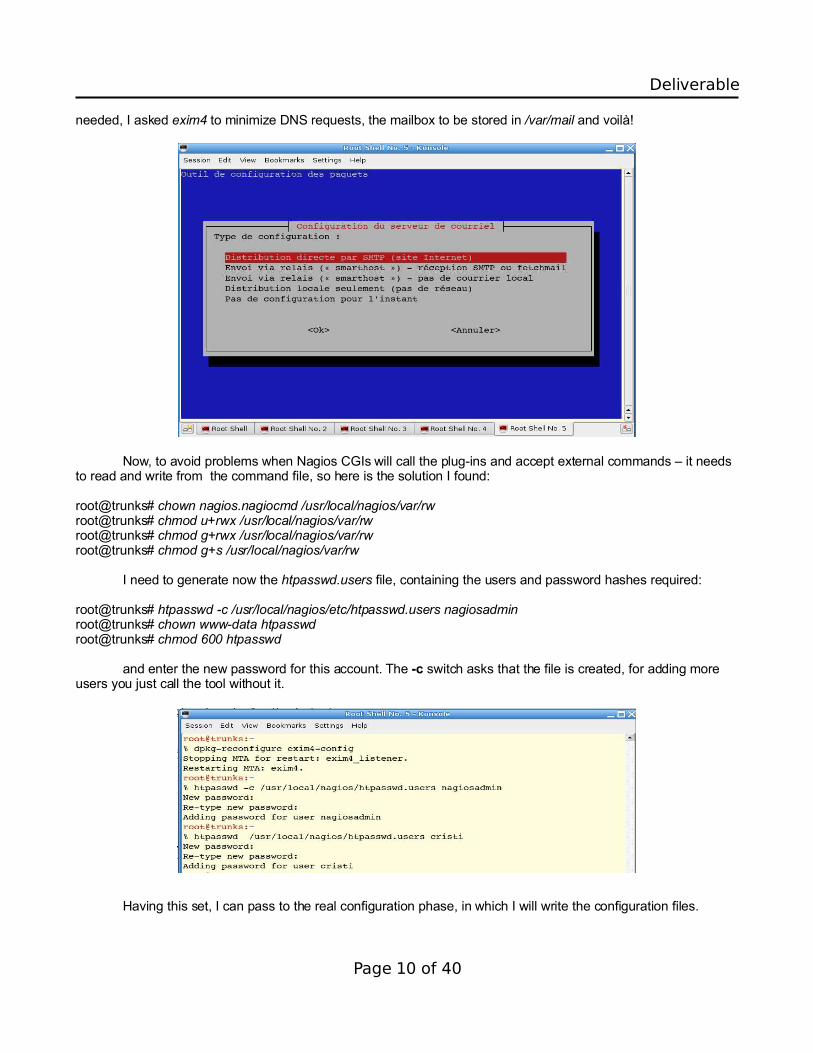
needed, I asked exim4 to minimize DNS requests, the mailbox to be stored in /var/mail and voilà!
Now, to avoid problems when Nagios CGIs will call the plug-ins and accept external commands – it needs to read and write from the command file, so here is the solution I found: root@trunks# chown nagios.nagiocmd /usr/local/nagios/var/rwroot@trunks# chmod u+rwx /usr/local/nagios/var/rwroot@trunks# chmod g+rwx /usr/local/nagios/var/rwroot@trunks# chmod g+s /usr/local/nagios/var/rw
I need to generate now the htpasswd.users file, containing the users and password hashes required:
root@trunks# htpasswd -c /usr/local/nagios/etc/htpasswd.users nagiosadminroot@trunks# chown www-data htpasswdroot@trunks# chmod 600 htpasswd
and enter the new password for this account. The -c switch asks that the file is created, for adding more users you just call the tool without it.
Having this set, I can pass to the real configuration phase, in which I will write the configuration files.
Page 10 of 40
Deliverable
III. Configuration
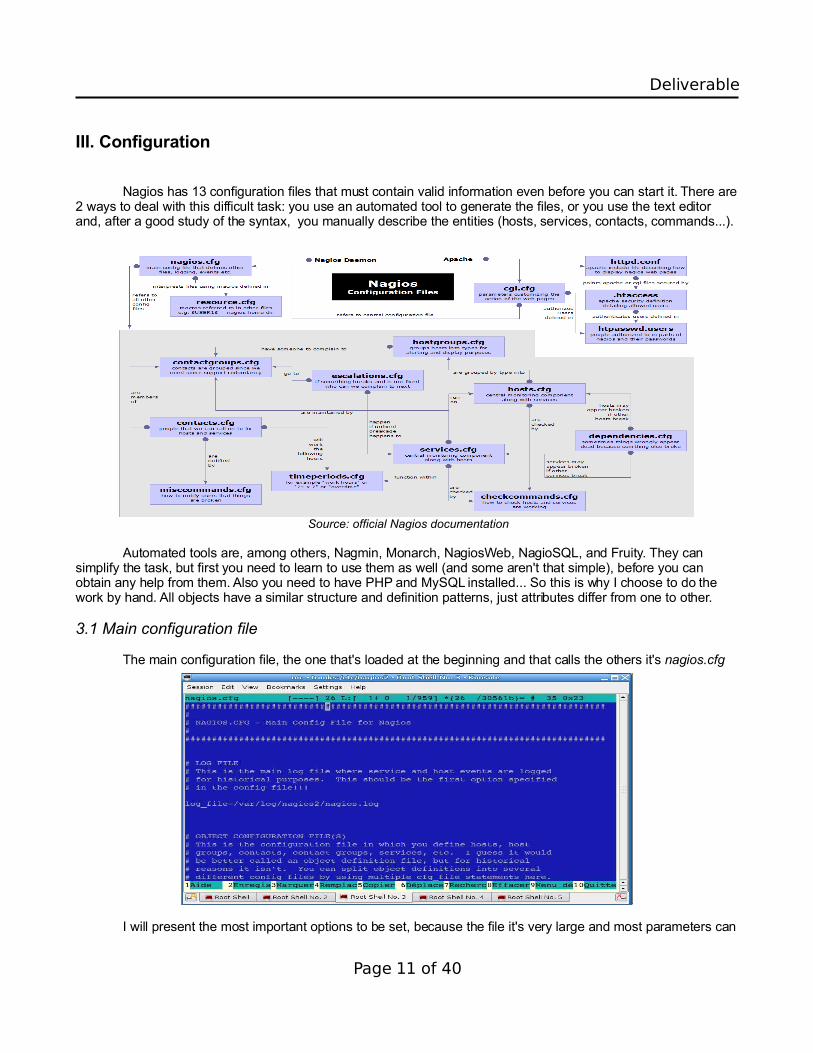
Nagios has 13 configuration files that must contain valid information even before you can start it. There are 2 ways to deal with this difficult task: you use an automated tool to generate the files, or you use the text editor and, after a good study of the syntax, you manually describe the entities (hosts, services, contacts, commands...).
Source: official Nagios documentation
Automated tools are, among others, Nagmin, Monarch, NagiosWeb, NagioSQL, and Fruity. They can simplify the task, but first you need to learn to use them as well (and some aren't that simple), before you can obtain any help from them. Also you need to have PHP and MySQL installed... So this is why I choose to do the work by hand. All objects have a similar structure and definition patterns, just attributes differ from one to other.
3.1 Main configuration file
The main configuration file, the one that's loaded at the beginning and that calls the others it's nagios.cfg
I will present the most important options to be set, because the file it's very large and most parameters can
Page 11 of 40

Deliverable
be used with the default values. Only a few paths and options are important to be changed for my installation.The location of the log file is the first and it should be like this:
log_file=/var/log/nagios2/nagios.log
The config files have special locations on Debian, so you must ensure that they can be found:
cfg_dir=/etc/nagios2/conf.dcfg_dir=/etc/nagios-plugins/configcfg_dir=/usr/local/nagios/etc/serviceext
The command definitions are all in /etc/nagios2 as this one: cfg_file=/etc/nagios2/commands.cfgThe cfg files are all located in /etc/nagios2, like the this: cfg_file=/etc/nagios2/contactgroups.cfgThe cache for objects to be stored on restarts: object_cache_file=/var/cache/nagios2/objects.cacheAnd the file where I defined the macros ($USERx$): resource_file=/etc/nagios2/resource.cfgThe status that Nagios keeps while it's running: status_file=/var/cache/nagios2/status.datThe user and group for Nagios:
nagios_user=nagiosnagios_group=nagios
To allow Nagios receive external commands from other application through a pipe and check often:
check_external_commands=1command_check_interval=-1command_file=/var/lib/nagios2/rw/nagios.cmd
Not so important are these options, given the context:
comment_file=/var/lib/nagios2/comments.datdowntime_file=/var/lib/nagios2/downtime.dat
But this is a must and I have to be sure that the user nagios can actually write to this folder:
lock_file=/var/run/nagios2/nagios2.pid
The temp file is heavily used and must also be writable:
temp_file=/var/cache/nagios2/nagios.tmp
I let this at default because I don't use them: event_broker_options=-1Important for saving valuable disk space are (weekly) log rotation and archiving:
log_rotation_method=wlog_archive_path=/var/log/nagios2/archives
The logging options (what and where) matter only if you use tools that parse the logs and show results:
use_syslog=1log_notifications=1log_service_retries=0log_host_retries=0log_event_handlers=1log_initial_states=1log_external_commands=1
Page 12 of 40

Deliverable
log_passive_checks=1
I won't define any event handlers, so I can comment all concerning lines.For the service inter-check method I can afford to use dumb because there are just a few services and I
want a quick response. Also the spread (time to check all at start) is low, and I let interleave factor at default:
service_inter_check_delay_method=smax_service_check_spread=3service_interleave_factor=shost_inter_check_delay_method=smax_host_check_spread=3max_concurrent_checks=0service_reaper_frequency=10
I will let auto-rescheduling option disabled because I have enough resources to check quite often:
auto_reschedule_checks=0auto_rescheduling_interval=30auto_rescheduling_window=180sleep_time=0.25
The timeouts are let to default also, because the designers have far more experience:
service_check_timeout=60host_check_timeout=30event_handler_timeout=30notification_timeout=30ocsp_timeout=5perfdata_timeout=5
To have the information retained over restarts (with a little delay at startup), at shutdown it must do
retain_state_information=1state_retention_file=/var/lib/nagios2/retention.datretention_update_interval=60use_retained_program_state=1use_retained_scheduling_info=0
A very important option is the interval length, this defines the time measurement unit (a minute here):
interval_length=60
Since it may cause problems, I let aggressiveness not enabled:
use_aggressive_host_checking=0
The Nagios main switch, this option turns off checking of services:
execute_service_checks=1
If you want to allow passive checks to be passed to Nagios you enable:
accept_passive_service_checks=1
And enabled is also the option to execute host checks at startup and accept passive ones:
Page 13 of 40

Deliverable
execute_host_checks=1accept_passive_host_checks=1
As I want the admins to be kept informed about the problems, I set both these to true:
enable_notifications=1enable_event_handlers=1
If I want to have performance graphs to analyze the system activity over time, I have to set
process_performance_data=1host_perfdata_command=process-host-perfdataservice_perfdata_command=process-service-perfdatahost_perfdata_file=/tmp/host-perfdataservice_perfdata_file=/tmp/service-perfdata
host_perfdata_file_template=[HOSTPERFDATA]\t$TIMET$\t$HOSTNAME$\t$HOSTEXECUTIONTIME$\t$HOSTOUTPUT$\t$HOSTPERFDATA$ service_perfdata_file_template=[SERVICEPERFDATA]\t$TIMET$\t$HOSTNAME$\t$SERVICEDESC$\t$SERVICEEXECUTIONTIME$\t$SERVICELATENCY$\t$SERVICEOUTPUT$\t$SERVICEPERFDATA$
The commands will be defined later, and results will be passed to the graph module. To append data:
host_perfdata_file_mode=aservice_perfdata_file_mode=a
And the interval will be a little longer than the one for checking, to allow the time to process:
host_perfdata_file_processing_interval=180service_perfdata_file_processing_interval=180
Distributed monitoring isn't planned, so I simply forget about obsessing:
obsess_over_services=0#ocsp_command=somecommand
There's a good idea to check for orphaned services, to avoid skipping some checks at rescheduling:
check_for_orphaned_services=1
Used just for passive checks, but harmless when they aren't used is the freshness:
check_service_freshness=1service_freshness_check_interval=60check_host_freshness=0host_freshness_check_interval=60
To speed up the show of results I disable the aggregation of the status data (interval becomes useless):
aggregate_status_updates=0status_update_interval=15
The flap detection may be or may be not useful depending on the type of services to be monitored...
enable_flap_detection=0
Page 14 of 40

Deliverable
low_service_flap_threshold=5.0high_service_flap_threshold=20.0low_host_flap_threshold=5.0high_host_flap_threshold=20.0
The date may look US-like if you forget to change it here:
date_format=euro
If the embedded Perl interpreter is enabled (and here isn't), the path to p1 script is set here:
p1_file=/usr/lib/nagios2/p1.pl
To keep the object definitions in allowed range of chars, I blocked the strange-looking ones:
illegal_object_name_chars=`~!$%^&*|'"<>?,()=illegal_macro_output_chars=`~$&|'"<>
And a little bit of regexes, because Perl is present in the plug-ins – but disabled to simplify things:
use_regexp_matching=0use_true_regexp_matching=0
If you want to send yourself mail in case of serious problems with Nagios itself, you use
admin_email=root@trunksadmin_pager=pageroot
For debugging purposes, core dump may be useful:
daemon_dumps_core=1
And that's all! Now, let's define the objects that Nagios will monitor and inform, in the files called above.
3.2 The network specification
Although the order is not important, I start with this because is the most important part of the configuration. You may skip the extended host information (like special OS icon on the status map) or the the contacts to be informed and send them all to view the web interface, but you definitively need to tell Nagios what to look at and what is the architecture of the network to be monitored. This is done by using four files, services.cfg, hosts.cfg, hostgroups.cfg, dependencies.cfg and hostextinfo.cfg. They have a rather similar structure and I will present only one example object from each file, because the rest are identical, except the address and name.
A Nagios object is specified by a type and a list of pairs attribute - value (not all of them are required though), it begins with the keyword define and it has the body written between curly brackets.
All objects are logically connected, you can't have services or dependencies without a host. To reduce the typing, you can use templates, if a group of objects share the same properties. I won't use them here.
Page 15 of 40

Deliverable
3.2.1 Hosts
The main target of Nagios is the service, but the network is built from hosts and connecting devices (switches, routers, etc) so the first to be defined are the servers hosting Asterisk. A host looks like this:
define host{ host_name LORIA
alias Asterisk server address 152.81.114.222
The three elements describing a machine: name to show on the interface, a description and its IP.
parents gateway
When using dependencies, the network is seen like a tree, with parent-children relations.
check_command check-host-alive max_check_attempts 10
The commands will be defined later, and here I put the number of attempts in case of failure.
check_period 24x7
Time periods are in a separate file, here just give the name of the desired one.
event_handler_enabled 1 flap_detection_enabled 1
Since these are disabled in the main config file, they have no effect here, but it's easy to have them.
process_perf_data 1 retain_status_information 1 retain_nonstatus_information 1
For the graphic tools it's a good idea to enable performance data to be collected and retained.
contact_groups testbed_admins
Who to announce in case of failures with the services of this host. They are defined in a separate file.
notification_interval 20
How often to announce the problems detected. It uses the interval defined, i.e. a minute.
notification_period 24x7
You may want to have some information send only in the work hours or only some special days...
notification_options d,u,r
What events to be announced: the states are down, unreachable, and recovery from down state.
Page 16 of 40
Deliverable
notifications_enabled 1
If you want to disable the notifications for this specific host.}
3.2.2 Services
A host by itself can only be checked if it's alive or not, but the main talent of Nagios is to check specific services (like FTP, HTTP, SMTP or even local resources like CPU load or temperature, hard disk free space, fan speed, etc). It has far more capabilities, can check by SSH and even talk to different devices by SNMP but, for this project, only a special plug-in for Asterisk will be used. And, the local resource check to ensure there aren't problems with the server hosting Nagios. I installed lm-sensors but I did not configure Nagios to query them.
A service definition looks like this (for a host there can be many services defined):
define service{ host_name LORIA
service_description ASTERISK LORIA
Same as with hosts, name and description to be shown on the web interface.
is_volatile 0
The default value is 0 for almost all typical services, except those requiring special attention upon restart.
check_command check_asterisk
The most important thing, what plug-in is used to perform the check. Here I used the one for Asterisk.
max_check_attempts 3 normal_check_interval 1 retry_check_interval 1 active_checks_enabled 1 passive_checks_enabled 1 check_period 24x7
These have the same meaning as for the host. It will check every minute, three times before it declares hard state for error and shows it on the interface. It will retry only one time in case of error state.
parallelize_check 1
Weather or not to use more checks at the same time. It could mean less resource usage.
obsess_over_service 1 check_freshness 0 flap_detection_enabled 1 process_perf_data 1 retain_status_information 1 retain_nonstatus_information 1 notification_interval 120 notification_period 24x7 notification_options w,u,c,r,f notifications_enabled 1 contact_groups testbed_admins
Page 17 of 40

Deliverable
And again, parameters with that appear in the host definition and whose names are self explanatory. Here all changes in the service state are to be announced (warning, unknown, critical, recovered and flapping).}
3.2.3 Dependencies
Not mandatory but very useful to help spot the problem quickly, the dependencies describe the network structure, in a tree manner: there are hosts that are independent (which is the case here) and there are nodes that have other sub-nets behind them. It's like a router and it's network, if the router is down, it's useless to check the services on the other computers on that segment, because they will be unreachable – and that's what Nagios says, it doesn't show them as down. They may be very well up and running, but from its position, they cannot be seen.
In this case I have seven independent machines located worldwide and a gateway for the Nagios server, to help diagnose when the problem is within the local network or with the Internet connection.
A dependency looks like this, and the parent appears on the first line (notify when it's down):
define hostdependency{ host_name gateway dependent_host_name localhost, LORIA notification_failure_criteria d}
Page 18 of 40

Deliverable
3.2.4 Host groups
Many hosts can be put together in a single group for the ease of management. It looks like this:
define hostgroup{ hostgroup_name EMANICS_Testbed alias Nagios monitoring targets members LORIA, UPI, UNIZH, IUB, CETIM}
3.2.5 Host extended information
Beside the text-based information, Nagios can draw a nice looking status map of the network using the gd library. On this map all hosts and relations are shown but, as Nagios doesn't have OS fingerprinting capabilities, it will show a question mark icon on every host, regardless of its status. To change that, you can write a special file containing more informations about a specific host. This is optional but helps having a better map. Looks like this:
define hostextinfo{ host_name LORIA
The host for which you define this special data.
notes_url http://152.81.114.222
Here may be an URL to a page with more information about the host, the web interface for a router...
icon_image base/linux40.png icon_image_alt Asterisk LORIA
The icon to show on the services page, and the alternate text.
vrml_image linux400.png
If you want a 3D representation of the network and have a VRML capable browser, choose an icon.
statusmap_image base/linux40.gd2
The normal status map image that Nagios will use for this host. In gd format, and this is where gd is useful.
2d_coords 100,250 3d_coords 100.0,50.0,75.0
If you want a precisely defined position of the host on the map, you can change the default settings.}
If you want special OS images on the status map, you can search for them on the Net, resize them with the Gimp and set the above path, or simply get a pack from the nagiosexchange.org website:
root@trunks# wget http://prdownloads.sourceforge.net/nagios/imagepak-base.tar.gzroot@trunks# tar zxvf imagepak-base.tar.gz
Page 19 of 40

Deliverable
root@trunks# mv base/* /usr/local/nagios/share/images/logos
3.3 The alerting mechanism
Nagios has built-in alerting system that can be configured to send various types of messages to persons designed to react on problems. The most common and the one I used for this project is the e-mail, but it can be set to send instant messages via Jabber, SMS via a mobile gateway or even pager messages. The logic behind is:
Source: official Nagios documentation
The files that are used to define the communication system are contacts.cfg, contactgroups.cfg, escalations.cfg and timeperiods.cfg. The people in charge are known as contacts, they can be grouped and information escalated to upper levels. The time for announcement can be: work hours, weekends, or non-stop.
3.3.1 Contacts
A contact is a person (network administrator, usually) that should be informed when something goes wrong on the network to fix it as soon as possible. A contact definition looks like this:
define contact{contact_name cristialias Cristi Stefan
A name to use in groups and the real name of the person, or whatever information could be useful.
service_notification_period 24x7 host_notification_period 24x7
When should he (or she) be notified, here you enter the name of a defined time period.
service_notification_options w,u,c,r host_notification_options d,u,r
What events should be sent. Here are a all chosen: warning, unknown, critical and recovery.
Page 20 of 40

Deliverable
service_notification_commands notify-by-email host_notification_commands host-notify-by-emailservice_notification_commands notify-by-jabberhost_notification_commands host-notify-by-jabber
The type of alert. Here, the mail command will be used to send a pre-formatted, parametrized message.
email [email protected] [email protected]
The address of the contact. Can also be a Jabber ID, pager or phone number...}
3.3.2 Contact groups
Many contacts can be put together in a group to be easily referred. A group looks like this:
define contactgroup{contactgroup_name testbed_admins alias EMANICS Partners
The name that appears when used in a host or service definition.
members cristi, florin, radu, bala
The contact names, they must be previously defined.}
3.3.3 Time periods
A number of hours can be grouped under a given name, because there are many shifts in a day and there are non-work or short program days. A normal administrator has (usually) 8 hours a day work time. For easy stopping of a chosen alerts source for a short time, there is a “none” period that can be used. The days of the week and hours can be used in combinations as convenient. A time period looks like this:
define timeperiod{timeperiod_name 24x7alias 24 Hours A Day, 7 Days A Week
The name that appears in host or service definitions, and a description of the period.
sunday 00:00-24:00monday 00:00-24:00tuesday 00:00-24:00wednesday 00:00-24:00thursday 00:00-24:00friday 00:00-24:00saturday 00:00-24:00
Page 21 of 40

Deliverable
Each day can have different hours chosen for sending alerts. Here it's designated the full day, all week. }
3.3.4 Escalations
In case the critical status continues to be persistent for a given time, that means that the person in charge can't solve the problem and Nagios can automatically escalate with the alerts, in a defined manner. There can be defined different levels and cases for these escalations. An escalation looks like this:
define hostgroupescalation{hostgroup_name EMANICS_Testbed
The escalations can also be used for an entire group of hosts. Here the name of the group is required.
first_notification 6
The number of hard-state error results returned before escalation.
last_notification 0
The number of times to send the notification. 0 means it will be sent until the problem is fixed.
contact_groups testbed-managers
What contact groups are to be informed in case of this escalation.
notification_interval 5
The interval at which notifications should be sent out while this escalation is valid.
}
3.4 The command definitions
Nagios does all its job by executing commands. There are three command files, i.e. commands.cfg, checkcommands.cfg and misccomands.cfg. These are called by Nagios to execute specific tasks.
3.4.1 General commands
The commands in this file are used for sending notifications, and performance data processing. On Debian, check-host-alive is being defined from within the Nagios plug-ins package. A command looks like this:
define command{command_name notify-by-email
The to call it with in the different files that are using this command.
Page 22 of 40

Deliverable
command_line /usr/bin/printf "%b" "***** EMANICS VoIP Testbed ALERT!! *****\n\nNotification Type: $NOTIFICATIONTYPE$\nHost: $HOSTALIAS$\nState: $HOSTSTATE$ for $HOSTDURATION$\nAddress: $HOSTADDRESS$\nInfo:\n\n$HOSTOUTPUT$\n\nDate/Time: $LONGDATETIME$\n\nACK by: $HOSTACKAUTHOR$\nComment: $HOSTACKCOMMENT$\n" | /usr/bin/mail -s "VoIP Testbed $NOTIFICATIONTYPE$ $NOTIFICATIONNUMBER$ - $HOSTALIAS$ is $HOSTSTATE$ **" $CONTACTEMAIL$
This is the actual command line that will be executed. In this example, the mail Linux binary is called and some parameters sent to it. The macros (already defined) are replaced with the actual values and the formatted text is printed through a pipe to the mail command. The result looks like this:}
3.4.2 Check commands
The check commands are the ones that really do the monitoring work, they call the specific plugins with parameters and receive the results that are than sent to the CGIs to be shown on the web interface. They have the name like check_*, where the * is replaced with the service name to be checked: ftp, http... A check looks like this:
define command{command_name check_asterisk
The name used when it's called in the service definition.
command_line $USER1$/check_asterisk -m $USER3$ -h $HOSTADDRESS$ -u $USER5$ -p $USER5$ -v
The actual command line, it can be a plug-in or simply an ordinary Linux command. Here I used macros.}
3.4.3 Misc commands
Here usually appear special user commands, the ones created for special purposes. All commands can reside in the files mentioned above, but, for clarity, what is defined by yourself it's better stored here for quick finding and to be easily removed (by commenting the line that loads this file in nagios.cfg). Mine looks like this:
Page 23 of 40

Deliverable
define command{command_name notify-by-jabber
The name used to call it where needed.
command_line /usr/local/nagios/libexec/send_jabber.pl $CONTACTPAGER$ $NOTIFICATIONTYPE$ "$HOSTNAME$" "$SERVICEDESC$" "$SERVICESTATE$" "$OUTPUT$" "$DATETIME$"
The plug-in that does the job. Here I invoked a special Perl script that uses XMPP to send instant messages via the Jabber-compatible network. It requires a few more settings and a Jabber client logged in.
3.5 The resource file
The file called resource.cfg contains the definitions of all macros used in other config files. If you don't need special macros, you can use the default one. Macros are strings between dollar signs, like this: $HOSTADDRESS$, and they are replaced at parsing with the actual values obtained by the system. In this file you can have as much as 32 different macros defined, named from $USER1$ to $USER32$. I defined the following:
# Sets $USER1$ to be the path to the plugins$USER1$=/usr/lib/nagios/plugins
# Sets $USER2$ to be the path to event handlers#$USER2$=/usr/lib/nagios/plugins/eventhandlers
# Store modes for check-asterisk plug-in$USER3$=iax$USER4$=mgr
# Store some user names and passwords (hidden from the CGIs)$USER5$=999
3.6 The CGI configuration
The most delicate part in Nagios configuration is in this file... Here are set the parameters for the programs that run in background and show the web interface. These are compiled at installation from their C source code and work like a bridge between plug-ins and the browser. They have special access permission demands and can very easily become a security breach for the network if misconfigured, and, on the other hand, can be inaccessible (showing no results on the web) if the user names and Apache settings aren't well defined. I will discuss the file:
main_config_file=/etc/nagios2/nagios.cfg
at the beginning, CGIs must know where the main config file lives to read some settings from it.
physical_html_path=/usr/share/nagios2/htdocs
This is the path to the static HTML pages that Nagios will show, the documentation included.
url_html_path=/nagios2
Page 24 of 40

Deliverable
The virtual path called by the browser, the same as in nagios.cfg.
show_context_help=1
A very useful option that enables context help to be given on various web interface items, by clicking the ?.
nagios_check_command=/usr/lib/nagios/plugins/check_nagios /var/cache/nagios2/status.dat 5 '/usr/sbin/nagios2'
The command to check if... Nagios itself is operational. Not very useful for a single server architecture.
use_authentication=1
The most important option in the file, enables authentication through Apache for the CGIs. If disabled, can be easily exploited to run arbitrary code and me be a gate to a DoS attack through the external command file.
#default_user_name=guest
Also for security is recommended you don't define a default user name, requiring the guests to enter it.
authorized_for_system_information=nagiosadminauthorized_for_configuration_information=nagiosadminauthorized_for_system_commands=nagiosadminauthorized_for_all_services=nagiosadminauthorized_for_all_hosts=nagiosadminauthorized_for_all_service_commands=nagiosadminauthorized_for_all_host_commands=nagiosadmin
These lines define who is allowed to view what on the web interface. You may have here separate accounts depending on how much you can afford to show to every user. It's a good idea to restrict access to ordinary operators because the status map shows off the complete architecture of the network! If a person is in charge of only one group of hosts (subnet), there's no need for them to have full access. Having a secure infrastructure and the web access to Nagios from outside being blocked, I can use only one mighty admin.
statusmap_background_image=smbackground.gd2
The (plain white) background for the status map. It's in gd2 format and has no impact on the performance.
default_statusmap_layout=3
From the many structures proposed, I've chosen the balanced tree format, because it's more clear.
default_statuswrl_layout=4#statuswrl_include=myworld.wrl
For the 3D status map. Rarely works, and requires VRML-enabled browser. Not used in this project.
ping_syntax=/bin/ping -n -U -c 5 $HOSTADDRESS$
The syntax for the ping command. Can be customized for specific environment requirements. I use default
refresh_rate=90
The time to refresh the informations (reload) the web interface. Here is one and a half minute.
host_down_sound=hostdown.wav
Page 25 of 40
Deliverable
When a problem occurs, Nagios can make an annoying sound (if the browser supports). Better silenced!
xedtemplate_config_file=/etc/nagios2/serviceextinfo.cfg
The template file for extended service information, like the one for NagiosGrapher.
As the check_asterisk plug-in doesn't come with Nagios, I had to manually copy the Perl script to the usr/local/nagios/libexec folder and create a command for it in /etc/nagios2/checkcommands.cfg before use!
That's all! We've finished the configuration of the whole system. Now it's time to start it!
IV. Running the application
4.1 Starting the server
The Nagios system is now ready for takeoff! If I have errors in the config files, it won't start at all, but will say nothing about them. So, to be sure everything is set OK, I verify the settings:
root@trunks# /usr/local/nagios/bin/nagios -v /etc/nagios2/nagios.cfg
If it finds errors, it will show the file and line number. The most common problems are: services defined without hosts, non-existing contacts or contact groups, mistyped names (!!!) and mandatory attributes forgotten.
After correcting all errors and saving the files, we try again. When everything was clear I got:
Total Warnings: 0Total Errors: 0
Things look okay - No serious problems were detected during the pre-flight check
Now, although I could start Nagios safely, I wanted to know if it has some suggestions in improving my configuration, so I ran
root@trunks# /usr/local/nagios/bin/nagios -s /etc/nagios2/nagios.cfg
PERFORMANCE SUGGESTIONS-----------------------I have no suggestions - things look okay.
That's great news, and now it's the time to finally fire up the system. It can be done in two ways:
root@trunks# /etc/init.d/nagios2 start
and the result should be
Starting nagios2 monitoring daemon: nagios2 named pipe exists – removing.
or, to start it like a daemon running in the background, the line is
root@trunks# /usr/local/nagios/bin/nagios -d
Page 26 of 40
Deliverable
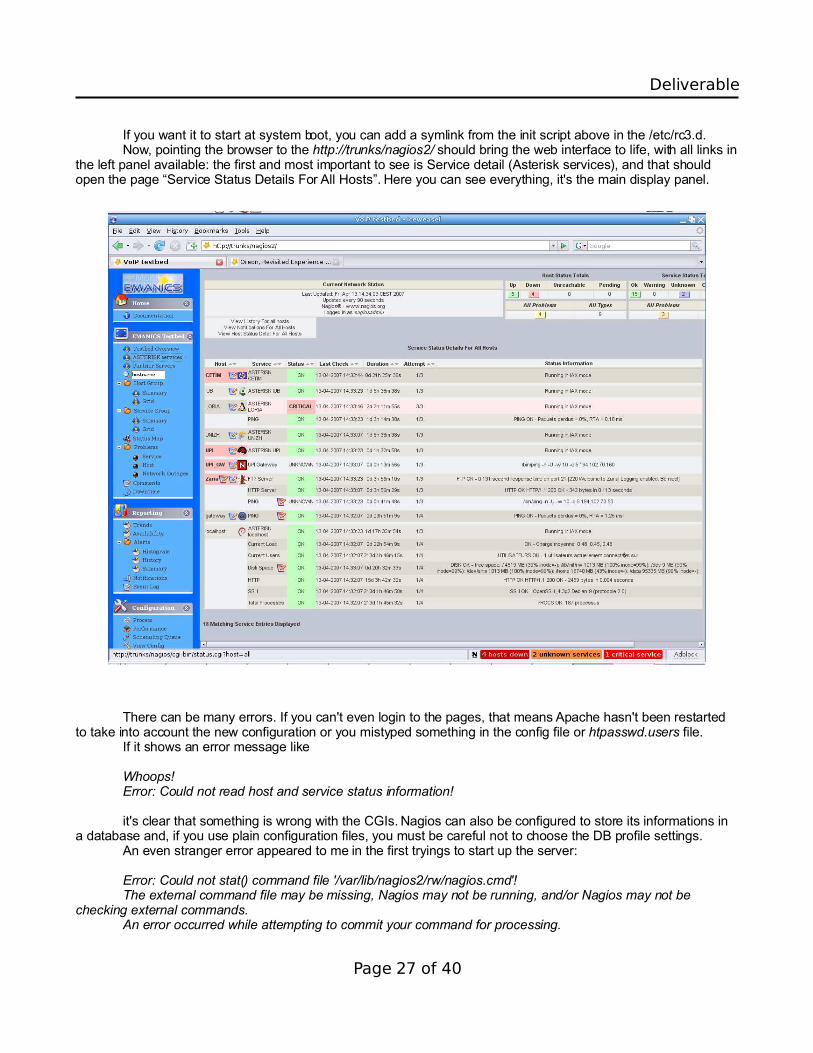
If you want it to start at system boot, you can add a symlink from the init script above in the /etc/rc3.d.Now, pointing the browser to the http://trunks/nagios2/ should bring the web interface to life, with all links in
the left panel available: the first and most important to see is Service detail (Asterisk services), and that should open the page “Service Status Details For All Hosts”. Here you can see everything, it's the main display panel.
There can be many errors. If you can't even login to the pages, that means Apache hasn't been restarted to take into account the new configuration or you mistyped something in the config file or htpasswd.users file.
If it shows an error message like
Whoops!Error: Could not read host and service status information!
it's clear that something is wrong with the CGIs. Nagios can also be configured to store its informations in a database and, if you use plain configuration files, you must be careful not to choose the DB profile settings.
An even stranger error appeared to me in the first tryings to start up the server:
Error: Could not stat() command file '/var/lib/nagios2/rw/nagios.cmd'!The external command file may be missing, Nagios may not be running, and/or Nagios may not be
checking external commands. An error occurred while attempting to commit your command for processing.
Page 27 of 40
Deliverable
Nagios was running at that time, but there was a problem with file permissions, because users nagios and www-data (Apache) must have the permission to write to that file. So what I did was
root@trunks# chmod 777 www-data /var/lib/nagios2/rw/nagios.cmdroot@trunks# chown -R nagios.nagios /usr/local/nagios root@trunks# chmod 700 /usr/local/nagios
And, after that, restart Apache and Nagios to be sure they see the changes and Nagios should become operational. If you encounter problems with adding comments, that means also file permission issues, so change the writing permissions for that file to allow the user nagios.nagios to write it.
4.2 Customizing the interface
Nagios has a pretty annoying black&white interface when it comes out of the box, so it's a good idea to give it a more personal touch by changing the color scheme and text. It's our server, let's show that!
The web interface is plain HTML, and it can be edited easily, but if you want to change also the result's pages, you have to do it by manually altering the plug-ins C source code before compiling it. They print some HTML code out to the default output, so it's search&replace. You can recompile the plugins after install if you want.
I will change just the static content, because the smallest mistake in the source and the compilation fails...The pages that form the web interface are just three files: index.html, side.html and main.html, and they
are located in the /share/htdocs path of your Nagios installation. I have them in /usr/share/nagios2/htdocs but, if you have more copies (like in /usr/local/nagios/share, depending in how you installed Nagios), you must know that Nagios it's using the one defined with the physical_html_path directive from the cgi.cfg file.
The first file you see after login to the interface is, of course, index.html, that calls the other two. From the main.html you can change the whole text, colors (from the CSS section) and logo displayed. The side.html contains the menu shown permanently on the left side, and here you can edit the link text and colors. Be sure not to change the link targets because CGIs won't be called correctly and you will loose access to them.
After saving, you need just to reload the page in your browser (if it's cached, hit the F5 key a few times to force re-downloading). No need to restart Nagios, because it's activity has nothing to do with the interface.
Also, the report background can be changed. They are four graphic files that can be found in /usr/share/nagios2/htdocs/images on my installation, and are called histogram.png, trendshost.png, trendssvc.png and weblogo1.png. The last is the logo showed on index page. When putting new images respect the original size!
If you're not satisfied with what you can obtain from direct coding, you can change the whole interface with a new skin that it's available on the nagiosexchange.org website. It's just download, unpack and copy all content to the /htdocs folder. Be sure to make a backup copy of the original files in case you want to change back. Example:
root@trunks# cd /usr/share/nagios2/htdocsroot@trunks# mkdir bakroot@trunks# mv * bakroot@trunks# wget http://www.nagiosexchange.org/typo3conf/ext/net_nagext/pi1/download.php?file=uploads/tx_netnagext_pi1/Nuvola_Style/nagios-nuvola-1.0.3.tar.gz&ext=.0.3.tar.gzroot@trunks# mv download.php\?file\=uploads%2Ftx_netnagext_pi1%2FNuvola_Style%2Fnagios-nuvola-1.0.3.tar.gz nagios-nuvola-1.0.3.tar.gzroot@trunks# tar zxvf nagios-nuvola-1.0.3.tar.gzroot@trunks# mv html/* /usr/share/nagios2/htdocs
Reload the browser page and there I have it, with a JavaScript menu and nice icons. If you don't like the icons that come in the basic image pack, nagiosexchange.org offers many user supplied images, in the “Logos and Images” -> “Image packs” category. You can download and extract them to the /logos folder and change ext info.
This new interface relays on JavaScript and I need to edit a bigger number of files to change the aspect. The main three HTML files are still present, but the command tree in the left frame stores it's colors in the .dtree
Page 28 of 40
Deliverable
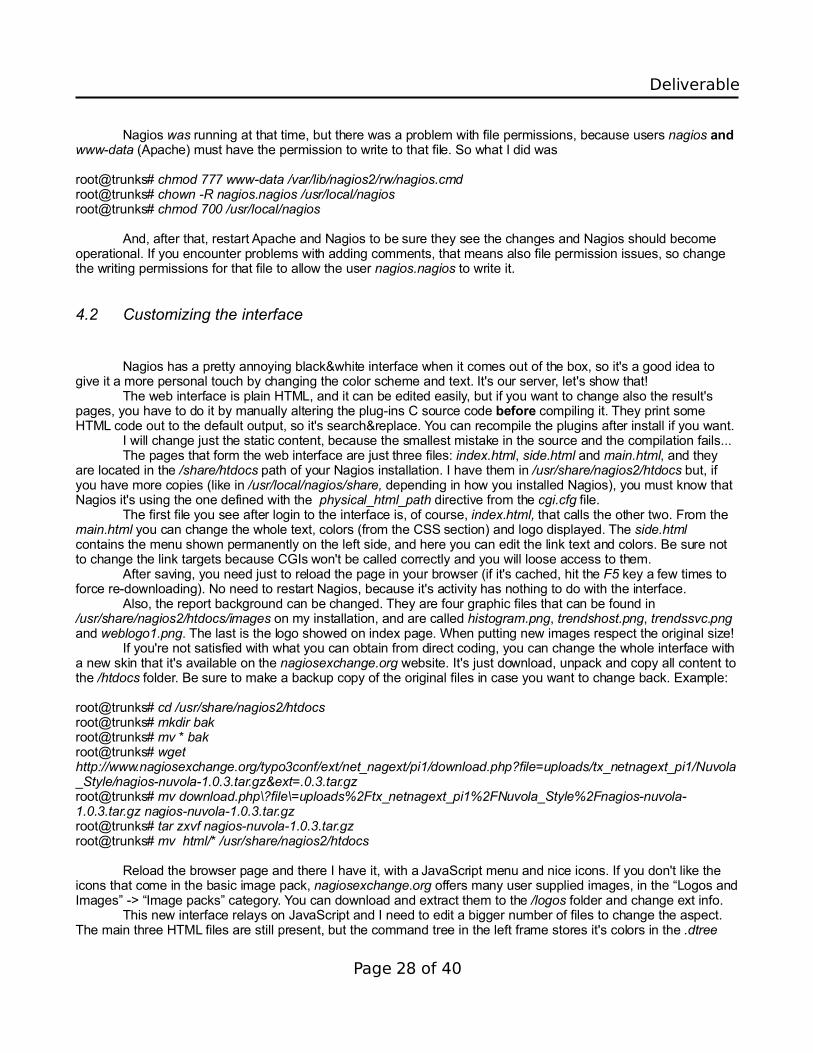
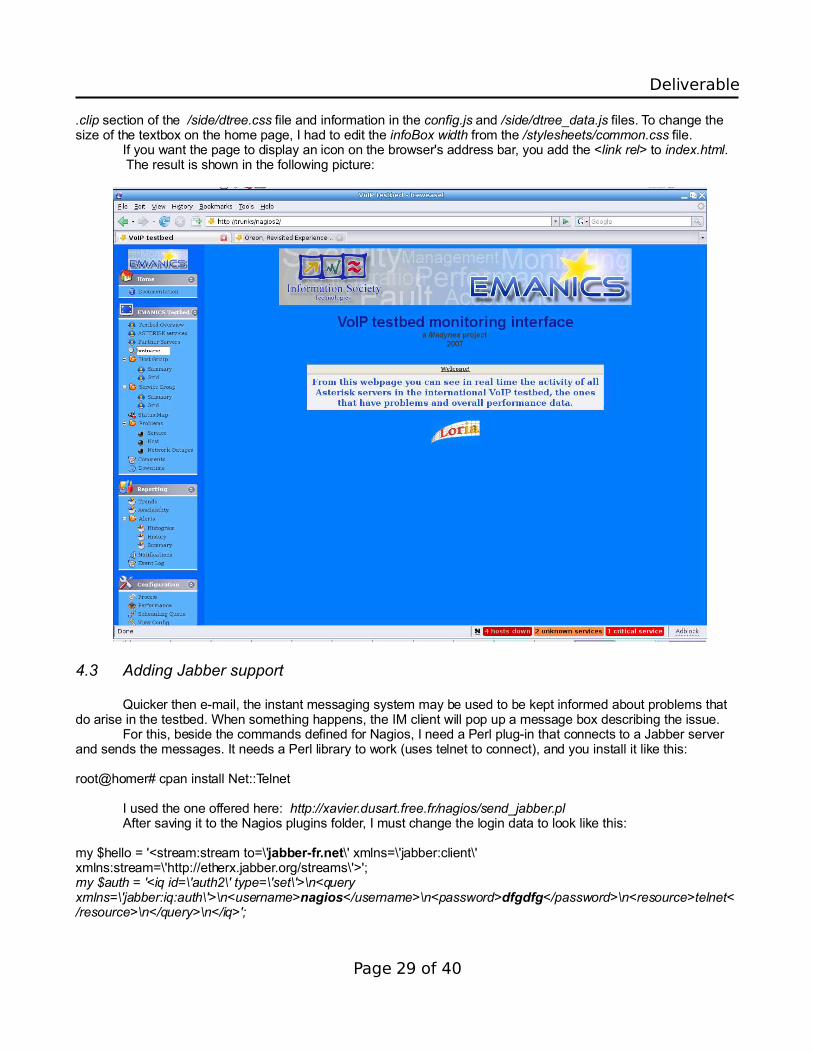
.clip section of the /side/dtree.css file and information in the config.js and /side/dtree_data.js files. To change the size of the textbox on the home page, I had to edit the infoBox width from the /stylesheets/common.css file.
If you want the page to display an icon on the browser's address bar, you add the <link rel> to index.html. The result is shown in the following picture:
4.3 Adding Jabber support
Quicker then e-mail, the instant messaging system may be used to be kept informed about problems that do arise in the testbed. When something happens, the IM client will pop up a message box describing the issue.
For this, beside the commands defined for Nagios, I need a Perl plug-in that connects to a Jabber server and sends the messages. It needs a Perl library to work (uses telnet to connect), and you install it like this:
root@homer# cpan install Net::Telnet
I used the one offered here: http://xavier.dusart.free.fr/nagios/send_jabber.plAfter saving it to the Nagios plugins folder, I must change the login data to look like this:
my $hello = '<stream:stream to=\'jabber-fr.net\' xmlns=\'jabber:client\' xmlns:stream=\'http://etherx.jabber.org/streams\'>';my $auth = '<iq id=\'auth2\' type=\'set\'>\n<query xmlns=\'jabber:iq:auth\'>\n<username>nagios</username>\n<password>dfgdfg</password>\n<resource>telnet</resource>\n</query>\n</iq>';
Page 29 of 40

Deliverable
Items in bold are to be changed according to the user account you wish Nagios to use for sending messages. The contacts to be informed must have the notify-by-jabber option enabled, beside the one for mail.
To receive the messages you must have a Jabber account for yourself and a client installed. I used the Gajim client for Linux. The installation is simple, via apt-get:
root@trunks# apt-get install gajim
and the you add your account from the Edit->Accounts->New menu. You can add Nagios to the Contacts.
V. Installing the Oreon system
5.1 Prerequisites
Installing and configuring Nagios all by hand it's a time-consuming and annoying task. Fortunately, a group of people, that liked a lot automation, developed a very nice looking web interface based on AJAX and offered the chance to do all the configuration from the browser by storing data into a MySQL database and by making PHP automatically generate all configuration files in the background. It's a little bit tricky to install, but it sure worths the effort. Not only that you have a much modern look and feel, but you also have the script automatically install Nagios and configure the web server without any intervention! If you have all packages required, and they are: the LAMP platform (Linux-Apache-PHP-MySQL), the gd, cgi and mysql libraries for PHP, the nmap tool, and some Perl modules: RRDs, SNMP and gd2. Very important is the mod_php module for Apache, or else nothing will work.
The good news is that the script itself installs Freetype, Gd, Libpng, Rrdtool, NetSNMP and Jpeg if you allow it to (which is more than recommended)! And, of course, Nagios 2.5 and the plugins. All with one command!
It's a good idea to install Oreon on another machine, although you can use the same as for the first Nagios, and specify a different path, manually kill Nagios daemon and change Apache alias. But you'll have to be very careful not to mix the settings from the two. The init script has to point to the Nagios that came with Oreon.
root@homer# apt-get install mysql-server-4.1root@homer# apt-get install php4root@homer# apt-get install php4-gd php4-cgi php4-mysql root@homer# apt-get install libapache-mod-php4root@homer# apt-get install nmaproot@homer# apt-get install librrds-perl libnet-snmp-perl libgd-gd2-perl
Having all installed and set up (don't forget the MySQL root password , we'll be needing it) I can
root@homer# wget http://www.oreon-project.org/component/option,com_docman/Itemid,84/task,doc_download/gid,7/root@homer# tar zxvf install_nagios2.5_by_oreon-v1.tar.gzroot@homer# cd install_nagios2.5_by_oreon-v1root@homer# ./install.sh
It's recommended you answer Yes to all installation queries, even if you have them installed, it's better to use these versions to be sure you avoid conflicts. It will create the nagios user and group, and ask the permission to install Nagios, and restart Apache. The script has a small error, on Debian the tool to create the passwords file for Apache it's called htpasswd, not htpasswd2. If you run it as it comes, it will fail to create the file and you will have to do it manually as for the manual Nagios installation. You have to reconfigure the MTA also, Postfix or exim.
Check if the /home/nagios folder exists after the script finishes. In the rare case it doesn't, do
root@homer# mkdir /home/nagiosroot@homer# chown nagios.nagios nagios
Page 30 of 40

Deliverable
root@homer# chmod 775 nagios
Now, it's time to install Oreon itself. But first, I recommend you get PHPMyAdmin, a free easy to use interface for MySQL database, as you may need to do changes to the tables or create new databases.
root@homer# apt-get install phpmyadmin
Now go to http://localhost/phpmyadmin and log in. If it doesn't show the page, it means that the LAMP isn't lit and you need to re-check that you have all packages mentioned (and specially the Apache modules) installed.
It's time to install all 20 PEAR packages mentioned on Oreon web page:
root@homer# pear install -o -f --alldeps Auth_SASL Date DB DB_DataObject DB_DataObject_FormBuilder HTML_Common HTML_QuickForm HTML_QuickForm_advmultiselect HTML_Table Image_Canvas Image_Color Image_Graph Image_GraphViz Mail_Mime MDB2 Net_Ping Net_Traceroute Numbers_Roman Numbers_Words PEAR Validate XML_RPC
Now, I have the system ready to receive the Oreon platform. It comes as a package with auto-install:
root@homer# wget http://www.oreon-project.org/component/option,com_docman/Itemid,84/task,doc_download/gid,10/root@homer# cd oreon-1.4/root@homer# ./install.sh
The script will ask a few questions and it's better to give it the right answers to avoid problems later.
Page 31 of 40
Deliverable
The path to RRDs.pm is (on this Debian Etch) /usr/local/rrdtool-1.0.49/lib/perl.The location of rrdtool binary is /usr/local/rrdtool-1.0.49/bin/rrdtool. PEAR is at the /usr/share/php. The others can be let at default (just press Enter) if you don't have unusual paths for mail, sudo, nagios...After the installations finishes, it will tell you to go to the web interface to finish the setup. Fire up a browser
and type http://localhost/oreon/. If you see the “Welcome to Oreon setup” page, that means everything is okay until now. If not, you should first manually restart Apache so that it reloads configuration files. Nagios will almost sure fail to start because it doesn't have the correct configuration in its files, so don't worry about it for now. After the interface is set up, you can define the objects (hosts, services, contacts) in the web page and send them to Nagios. If the Setup page still doesn't show up, you can relaunch the Oreon install script, tell it not to use parameters from old installation and run through the setup again carefully. Make sure the paths are correct (locate the files).
Assuming you have the setup screen, I'll continue with installation steps. Click Start in the first screen and accept license. In Step 3 make sure everything is correct and choose version 2.x for Nagios. In the steps that follow, you must have everything OK. If something misses install it and restart the Setup from the last step, if the writing permissions aren't how they should be, change them now. In Step 5 all PEAR packages should be found. If not, install the ones missing and hit Recheck. Step 6 configures the access to MySQL database. You need the root password, a name for Oreon's DB (e.g. “oreon” and “ods”) and a password for it. Be careful not to forget them! You can choose a newer MySQL client password style if you don't plan to use old clients.
In Step 7 the answer should also be OK, if you didn't mistyped the password. By default it's empty.Step 8 is for the user credentials. Enter them and choose appropriate language (can be changed later).The LDAP is not necessary if you use localhost as a server. The config file should be generated
successfully (if not, check write permissions to the folder). Step 11 will try to create the database, and should also succeed. If not, use phpmyadmin to check if you can create databases, and you may need to restart MySQL.
That's all with the installation. Login and you should have the blank page of Oreon ready for config.
5.2 Configuration
The settings are the same as for Nagios, but now you don't write configuration files, but complete some fields on the generated web forms and data is stored in the database. After all is set up, you can export the configuration to Nagios and restart it from the tab Configuration->Nagios. Beside already mentioned settings, there are a few differences: the Contacts, Contact Groups, Time Periods and Notification Commands are grouped together under the Users tab; the tabs Commands and Services also host multiple sub-categories. The command definition has two fields: the name and the command line, without “define” keyword, comments or curly brackets.
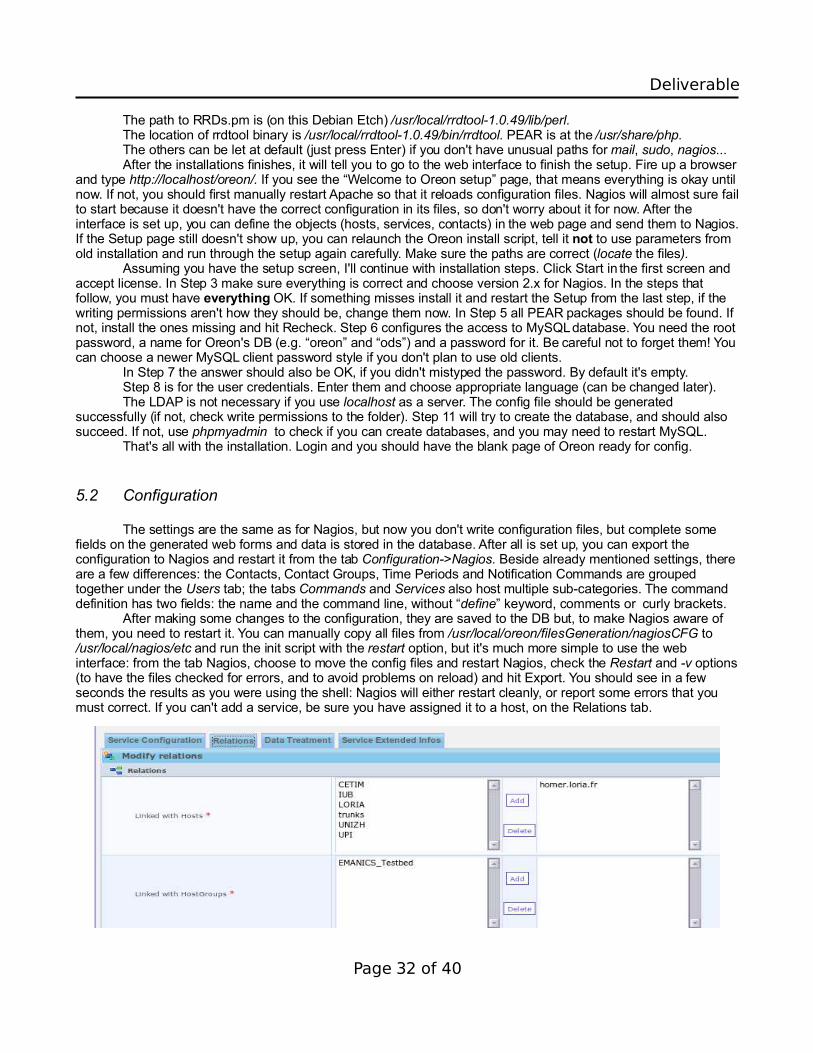
After making some changes to the configuration, they are saved to the DB but, to make Nagios aware of them, you need to restart it. You can manually copy all files from /usr/local/oreon/filesGeneration/nagiosCFG to /usr/local/nagios/etc and run the init script with the restart option, but it's much more simple to use the web interface: from the tab Nagios, choose to move the config files and restart Nagios, check the Restart and -v options (to have the files checked for errors, and to avoid problems on reload) and hit Export. You should see in a few seconds the results as you were using the shell: Nagios will either restart cleanly, or report some errors that you must correct. If you can't add a service, be sure you have assigned it to a host, on the Relations tab.
Page 32 of 40
Deliverable
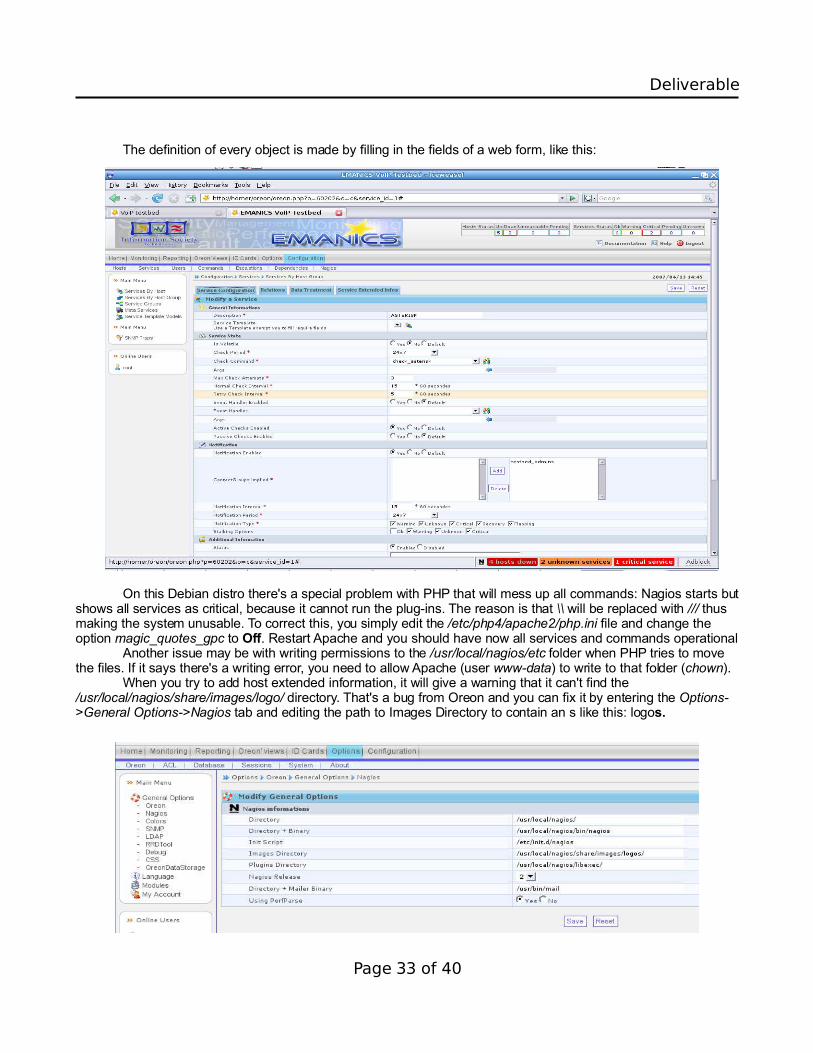
The definition of every object is made by filling in the fields of a web form, like this:
On this Debian distro there's a special problem with PHP that will mess up all commands: Nagios starts but shows all services as critical, because it cannot run the plug-ins. The reason is that \\ will be replaced with /// thus making the system unusable. To correct this, you simply edit the /etc/php4/apache2/php.ini file and change the option magic_quotes_gpc to Off. Restart Apache and you should have now all services and commands operational
Another issue may be with writing permissions to the /usr/local/nagios/etc folder when PHP tries to move the files. If it says there's a writing error, you need to allow Apache (user www-data) to write to that folder (chown).
When you try to add host extended information, it will give a warning that it can't find the /usr/local/nagios/share/images/logo/ directory. That's a bug from Oreon and you can fix it by entering the Options->General Options->Nagios tab and editing the path to Images Directory to contain an s like this: logos.
Page 33 of 40

Deliverable
The PerfParse configuration it's done like this: enter the right database password in Configuration->Nagios ->Perfparse and replace /srv/ with /usr/local/ on the page Options->Oreon->General Options->OreonDataStorage.
5.3 Customization
The interface has a pleasant look, but you may want it to have your own logo and messages. Although is dynamically generated by PHP, you can still change a few elements. Here's how it's done:
The first thing to modify was the color scheme. I have the Colors link in the General Options where I can change the colors for service states and the CSS link for the global pattern. A blue touch always looks better.
Then, the main logo. You can find it at /usr/local/oreon/www/img/LogoOreon.png and replace it at will. The bottom page messages can be edited in the www/footer.php file, to remove the Donate option and add
my copyright notice. The page title is stored in the header.php. The favicon is with the logo, called iconOreon.ico.The login page can be fully customized by editing the text in login.php, and the colors and formatting in the
www/Themes/Basic/login.css file. Reload the page in browser to see the results. I had a very annoying problem with sending e-mail from Oreon, and the only solution was to delete all
contacts and contact groups, and re-enter them, using only one notification command for every contact and not checking the “none” check-box option. After that, Nagios restarted and began sending mail normally.
A very nice help in day to day work with Nagios, if you use the Firefox browser, it's the NagiosChecker add-on. After install and restarting the browser, you will have in the statusbar a small panel that shows permanently the problems present and blinks the new ones for easy spotting. It's freely downloadable from the address: https://addons.mozilla.org/en-US/firefox/downloads/file/13711/nagios_checker-0.8.1-firefox+thunderbird.xpi.
Restart Firefox after installing it, I right-click on it and went to Settings where I added a new Nagios page to watch, filled the fields for web interface address, user and password, and let it locate the status script URL.
I disabled the sounds and filtered disabled hosts and services (Filtering tab), enabled full details from the
Page 34 of 40

Deliverable
Display tab and set a 1 minute update time in the Behavior tab. Now, keeping the mouse over the small tag in the status bar will pop-up a window with all available information. When a new problem appears, it's field will blink.
The window looks like this:
VI. Adding graphical display module
The plug-in recommended for Oreon to display graphs is called PerfParse and, since it doesn't come in the package, Oreon will show an error message even if the password for the database is correct. I need to download and install it from it's web page: http://kent.dl.sourceforge.net/sourceforge/perfparse/perfparse-0.105.6.tar.gz
Before installing it, I need to install the development version of the gd library, like this:
root@homer# apt-get install libgd2-dev
Now, I can unpack and install the package:
root@homer# tar zxvf perfparse-0.105.6.tar.gzroot@homer# cd perfparse-0.105.6root@homer# ./configure --prefix=/usr/local/nagios --with-imagedir=/usr/local/nagios/share/images --with-cgidir=/usr/local/nagios/sbin –with-http_image_path=/nagios/images --with-mysql_config_dir --with-gdlib_config_dir root@homer# makeroot@homer# make install
After installing, I will create and populate the database for storing performance data to be graphed:
root@homer# mysql -u root@trunks -p> create database nagios;> GRANT ALL PRIVILEGES ON nagios.* TO 'nagios'@localhost identified by 'dfgdfg';>quitroot@homer# cat perfparse-0.105.6/scripts/mysql_create.sql | mysql -u nagios -p -D nagios -h 127.0.0.1
And now, Oreon shouldn't show an error message that it can't connect to the PerfParse database. To use it, I have enabled in the Options->Oreon->General Options->Nagios an option called Using PerfParse.
To have data from logs being processed, I will modify the default process-host-perfdata and process-service-perfdata commands to look like this:
/usr/bin/printf "%b" "$TIMET$\t$HOSTNAME$\t$SERVICEDESC$\t$SERVICEOUTPUT$\t$SERVICESTATE$\t$SERVICEPERFDATA$\n" | /usr/local/nagios/bin/perfparse-log2mysql
Page 35 of 40

Deliverable
To see it on the classical web interface, you can add a block like this at the end of the Reporting section from the usr/local/nagios/share/side.html file, to add a new option in the left menu:
<tr> <td width=13><img src="images/greendot.gif" width="13" height="14" name="lo$ <td nowrap><a href="/nagios/cgi-bin/showlog.cgi" target="main" onMouseOver=$ </tr>
And now, by clicking it, you should have the PerfParse main page shown in the main frame, like this:
Not all plug-ins offer performance data, in fact very few of them do it. For example to check the traffic load on the network interface, I need SNMP package installed and configured to be queryable from outside.
root@homer# apt-get install snmp
After that, I must eliminate the localhost from the following line in the /etc/default/snmpd file to look like
SNMPDOPTS='-Lsd -Lf /dev/null -u snmp -I -smux -p /var/run/snmpd.pid '
And then, configure access control for the SNMP daemon, in the /etc/snmp/snmpd.conf, where I define a new community with rights only to read informations, accessing from the local network, by adding a line like this:
com2sec madynesRO 152.81.0.0/16 madynes
Page 36 of 40

Deliverable
and the groups for it, for both SNMP versions :
group madynesROGroup v1 madynesROgroup madynesROGroup v2c madynesRO
Access permissions are given like this (no authorization needed in any context, can read everything):
access madynesROGroup "" any noauth exact all none none
After that, restart snmpd and, by calling a plug-in (being in their folder) from the shell you should get
root@homer# ./check_graph_traffic.pl -H 152.81.6.23 -C madynes -v 2c -i 0Traffic In : 1.38 Mb/s (13.8 %), Out : 548.47 kb/s (5.5 %) - Total RX Bits In : 3.98 GB, Out : 17.82 Gb|traffic_in=1383260,6Bits/s traffic_out=548465,3Bits/s
Now, to integrate it with Oreon you add a new service, let's say for traffic, using the same plugin as command, but here I changed the default syntax, and now looks like this:$USER1$/check_graph_traffic.pl -H 152.81.6.23 -i $ARG1$ -w $ARG2$ -c $ARG3$ -C $ARG4$ -v $ARG5$ -g -f and arguments like !2!2!4!madynes!2c you are ready to display the graph, that can look like this:
Of course, you can draw graphs for any other service that supports it: CPU load, uptime...To draw the graphs, go to Oreon views, choose the desired type (from PerfParse, from the
plug-ins) and choose a host and/or service from the list. Choose the time period to use and Graph.
Page 37 of 40
Deliverable
VI. check_asterisk plug-in source code
The plug-in that checks if the Asterisk PBX is operational it's a Perl script that connects through the IAX protocol. The one I used it's available from the web page http://karlsbakk.net/asterisk/. This isn't the only one, there's also a check_sip plugin available at http://www.bashton.com/downloads/nagios-check_sip-1.01.tar.gz
R. Calicotte offers 2 plug-ins to check Asterisk, located at http://www.callicotte.org/np/index.htmI will briefly present the source code and explain the functionality, just for the IAX part.
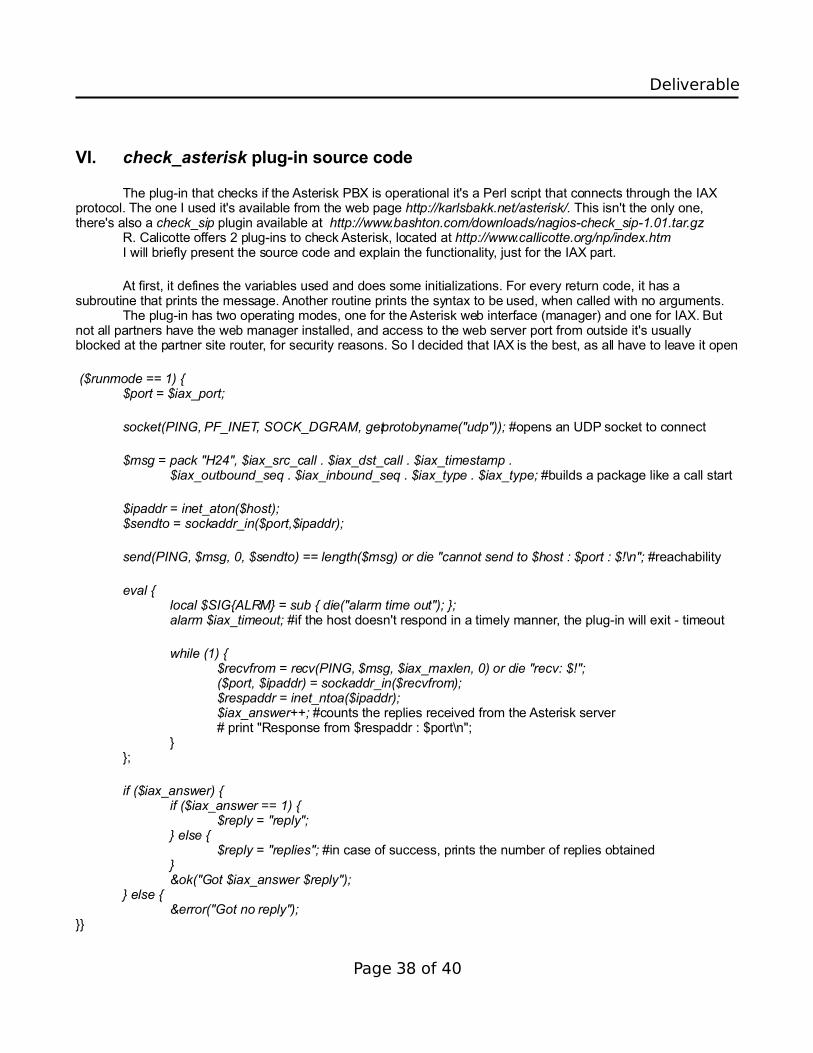
At first, it defines the variables used and does some initializations. For every return code, it has a subroutine that prints the message. Another routine prints the syntax to be used, when called with no arguments.
The plug-in has two operating modes, one for the Asterisk web interface (manager) and one for IAX. But not all partners have the web manager installed, and access to the web server port from outside it's usually blocked at the partner site router, for security reasons. So I decided that IAX is the best, as all have to leave it open
($runmode == 1) {$port = $iax_port;
socket(PING, PF_INET, SOCK_DGRAM, getprotobyname("udp")); #opens an UDP socket to connect
$msg = pack "H24", $iax_src_call . $iax_dst_call . $iax_timestamp .$iax_outbound_seq . $iax_inbound_seq . $iax_type . $iax_type; #builds a package like a call start
$ipaddr = inet_aton($host); $sendto = sockaddr_in($port,$ipaddr);
send(PING, $msg, 0, $sendto) == length($msg) or die "cannot send to $host : $port : $!\n"; #reachability
eval { local $SIG{ALRM} = sub { die("alarm time out"); }; alarm $iax_timeout; #if the host doesn't respond in a timely manner, the plug-in will exit - timeout
while (1) { $recvfrom = recv(PING, $msg, $iax_maxlen, 0) or die "recv: $!"; ($port, $ipaddr) = sockaddr_in($recvfrom); $respaddr = inet_ntoa($ipaddr); $iax_answer++; #counts the replies received from the Asterisk server# print "Response from $respaddr : $port\n";
} };
if ($iax_answer) {if ($iax_answer == 1) {
$reply = "reply";} else {
$reply = "replies"; #in case of success, prints the number of replies obtained}&ok("Got $iax_answer $reply");
} else {&error("Got no reply");
}}
Page 38 of 40
Deliverable
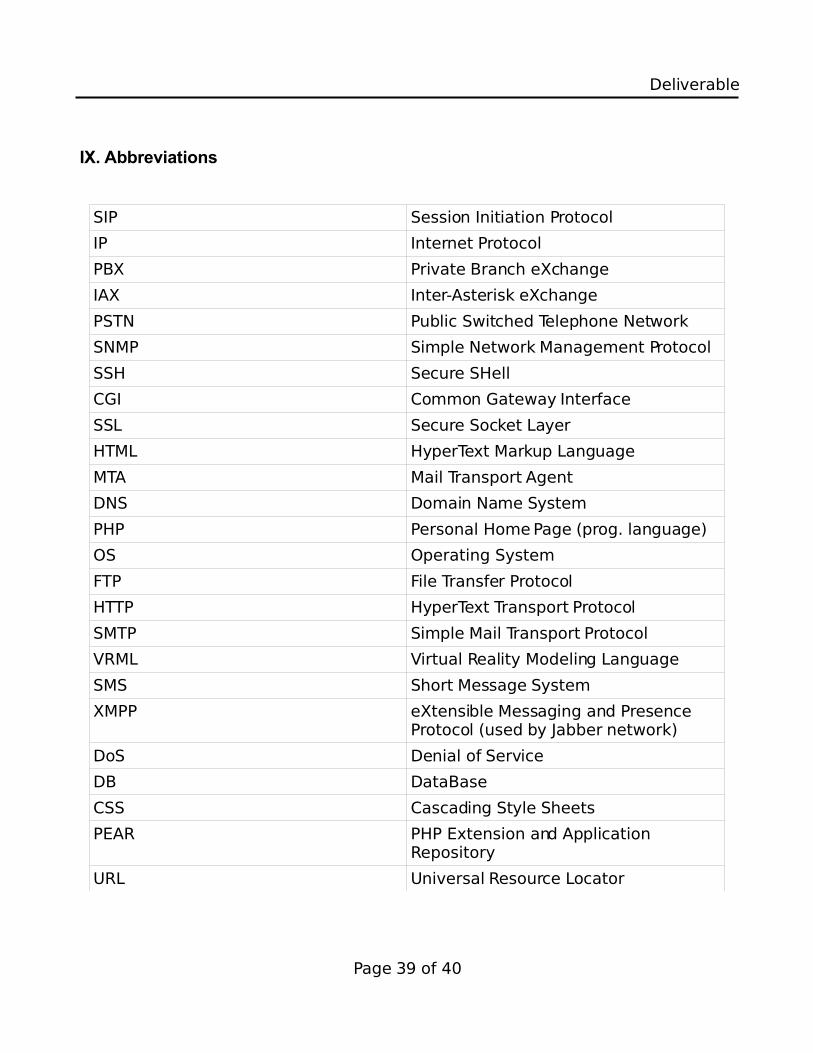
IX. Abbreviations
SIP Session Initiation Protocol
IP Internet Protocol
PBX Private Branch eXchange
IAX Inter-Asterisk eXchange
PSTN Public Switched Telephone Network
SNMP Simple Network Management Protocol
SSH Secure SHell
CGI Common Gateway Interface
SSL Secure Socket Layer
HTML HyperText Markup Language
MTA Mail Transport Agent
DNS Domain Name System
PHP Personal Home Page (prog. language)
OS Operating System
FTP File Transfer Protocol
HTTP HyperText Transport Protocol
SMTP Simple Mail Transport Protocol
VRML Virtual Reality Modeling Language
SMS Short Message System
XMPP eXtensible Messaging and Presence Protocol (used by Jabber network)
DoS Denial of Service
DB DataBase
CSS Cascading Style Sheets
PEAR PHP Extension and Application Repository
URL Universal Resource Locator
Page 39 of 40

Deliverable
Addendum
To install Nagios and have it operational as fast as possible, I suggest the following way: use the distribution designed for Oreon, currently version 2.5. It has a nice install script that will do almost everything automatically. As Oreon requires some configurations too, you can use a package of already written configuration files, like the ones I created for this project, and replace the default interface with the one customized.
You need to manually install
root@homer# apt-get install librrds-perl libnet-snmp-perl libgd-gd2-perl
and let the script install all other pre-requisites. The commands are the same as when I installed Oreon:
root@homer# wget http://www.oreon-project.org/component/option,com_docman/Itemid,84/task,doc_download/gid,7/root@homer# tar zxvf install_nagios2.5_by_oreon-v1.tar.gzroot@homer# cd install_nagios2.5_by_oreon-v1root@homer# ./install.sh
but don't forget to edit the install.sh to replace htpasswd2 with htpasswd, before you run it.
As I have the configuration files collection archived, you need to extract them all to replace the ones existing in the /usr/local/nagios/etc folder. They contain information that work for the machine I used, you will need to change the contact emails and addresses of the hosts to be monitored (contacts.cfg and hosts.cfg).
The web interface, with all customizations, must be extracted as it is in the /usr/local/nagios/share.This works because the script installs Nagios the same way, with the same paths, everywhere.If you use it, for Oreon there's an excellent guide at http://delavergne.free.fr/Doc_Oreon_1_1_fr.pdf
Page 40 of 40