an audio quality evaluation of digital radio system
TRANSCRIPT

AN AUDIO QUALITY EVALUATION OF DIGITAL RADIO SYSTEMS
GUIDED BY; PRESENTED BY;MR. ANOOP CHANDRAN P ROJITH THOMAS
ASST. PROFESSOR MTECH-ECE
CAARMEL ENGG. COLLEGE CAARMEL ENGG. COLLEGE

SCOPE
• It is to provide a Broadcasting Standard for the DigitalAudio Systems designed for delivery of high qualitydigital audio programme and data services formobile,portable and fixed reception from terrestrial orsatellite transmitters in the VHF/UHF as well as fortransmission through cable networks

INTRODUCTION
• Radio has changed the world of communicationduring the last decade and even now remainsrelevant in modern society.
• Nikola Tesla was the first to talk about utilizing these signals for the use of communication.Macroni is the first who introduced the radio system.
• Radio is the medium for communication. It transmitsmessage via Radio waves.And It is a communicationsystem based on broadcasting electromagnetic waves

• Mainly there are two types of radio systems;
a)Analog Radio System
b)Digital Radio System
• Major criteria for designing radio system is;
1)Audio Quality
2)Channel Capacity
• Radio is a democratic medium. So it has wide applications in the field of Education,Entertainment,Medical,News and even for Businesses also.

EXISTING SYSTEM
• The Existing System is Analog radio Systems
• They are divided into two;
>AM Radio Broadcasting Systems.
>FM Radio Broadcasting Systems.
• AM Broadcasting System is mainly divided into;
>Mid frequency:530 to 1600 KHz
>Short Wave 1 &2
SW1:2.3 to 7.0 MHz
SW2:7.0 to 22 MHz
• FM Radio Ranges from 88 to 106 MHz

EVALUATION OF EXISTING
SYSTEM
• Evaluation of analog radio system is mainly done for FMsystem using MUSHRA Method.
• The Audio Quality for Analog Broadcasting systems are;
>FM :72% -Good
>SW2 :63% -Fair
>SW1 :60% -Fair
>MF :40% -Fair
• From this we can conclude that the audio quality ofanalog system is not suitable for providing betterservice.

DISADVANTAGES
• It has Transmission and Reception limitations.
• Due to increase in the usage of number of bands, thecongestion is occurs and it lead to the decline inreception quality.
• It suffers to provide uniform reception qualitythroughput.
• Insufficient use of spectrum; Spectrum Efficiency is low.
• It offers poor audio quality due to less Noise immunity.

PROPOSED SYSTEM
• In order to provide better quality of service, the digitalradio system is introduced.
• The digital radio transmitter compresses the audiosignals using an AUDIO CODEC and it transmits as bitstreams to the terminals
• And at receiver; the reconstruction of signal is occurfrom bit streams.
• Digital system has capability to transfer throughterrestrial, satellite and even through cables.

ADVANTAGES
• More robust than analog and it can be transmittedsuccessfully at lower transmitter power.
• It uses Coded Multi carrier Modulation(PCM) in orderto provide improved reception quality.
• Provides wide coverage area with less implementingcost.
• Spectrum efficiency is improved and also provide highchannel capacity.
• Introduction of data compression techniques help toimprove sound quality at low bit rates.

EVALUATION OF AUDIO QUALITY
• The evaluation is mainly for finding the mean audioquality of all systems.
• In order for that; four terrestrial digital domestic radiosystems are considered. They are;
>DAB
>DAB+
>HD Radio
>T-DMB
• Each system has its own audio codecs.So,the audioquality depends not only on the Bit Rate but also uponthe System type.
• Evaluation is at different bit rates in order to provide areference to determine Optimal Bit Rate for giventarget audio quality.
• The Audio Quality adopted for each system are;
>DAB :MPEG-1 LAYER II(.mp2)
>DAB+ :HE-AAC v2(.aac)
>HD RADIO :HDC(.hd)
>T-DMB :MPEG-4 ER-BSAC(.mp4)
• In order to get accurate results, the evaluations hassetup in the same environment for all systems.
• The evaluation process is conducted in two phasesnamed as;
>PHASE-I >PHASE-II

EVALUATION SETUP
• Evaluation setup mainly consist of;
>Audio Samples
>Digital Radio Equipment
• The evaluation process are;
>Test Signal Acquisition.
>Subjective Evaluation Method(MUSHRA).
>Pre Screening And Post Screening.
AUDIO SAMPLES
• The audio samples used for test should be able torecognize the performance difference between thecodecs and contain the realistic contents for thedigital radio services.
• Nine audio samples are used for evaluation and aresubdivided into different categories.
• The sample length for each sample is 10-15 secondsand in stereo format with sampling frequency of 48KHz.
• In HD Radio, it supports only the sampling rate of44.1KHz.So audio samples with sampling rate of44.1KHz were prepared from 48KHZ.

AUDIO SAMPLES USED IN EVALUATIONNAME TYPE CHARACTERISTICS
SPEECHFEMALE,ENGLISH
MALE,KOREAN
FEMALE ,ENGLISH
SINGING
COLLOQUIAL STYLE
LITERARY STYLE
MUSIC
POP MUSIC
JAZZ
CLASSICAL
VOCAL,GUITAR,DRUM,KEYBOARD
WIND,BRASS,DRUM
STRINGS,PERCUSSION,WIND
MIXED
SPEECH+MUSIC
SPORTS BROADCASTING
SONGS+BACKGROUND
MALE SPEECH,STRINGS,WIND.PERCUSSIONS
FEMALE SPEECH,AUDIENCE SHOUTING
CHILDREN’S SONG,PERCUSSION,SOUND EFFECT

DIGITAL RADIO EQUIPMENT
SYSTEM MANUFACTURE AND ENCODER MODEL
MANUFACTURER AND DECODER MODEL
DAB Factum ElectronicsMAP250E
PNP Network Technologies
PN3021P
DAB+ Factum ElectronicsMAP250E
PNP Network Technologies
PN3021P
HD Radio Broadcast ElectronicsXpi 10
Day SequerraM4.0X
T-DMB PixtreePix VR-E11011
PNP Network Technologies
PN3021P

TEST SIGNAL ACQUISITION
• The test signal for evaluation are acquired directlyfrom digital radio equipment.
• Audio signal is played from computer and transmittedto audio encoder in the form of PCM through audiointerface equipment.
• The sampling rate is selected according to digital radiosystem.
• Audio encoder compress audio signal to bit streamand transmitted through wireless channel usingOFDM.
• In reciever,decoder converts bit streams to audiosignals and saved in computer as PCM format.

BLOCK DIAGRAM
COMPUTER1
DIGITAL
AUDIO
INTERFACE
AUDIO
ENCODER
RF
TRANSMITTER
AUDIO
DECODER
RF
RECEIVERCOMPUTER 2
OF
DM

• In evaluation, the bits rate of encoder is set fordifferent values.
• Therefore,
4 bit rates X 4 Systems X 9 Samples=144 test signals
is used for evaluation.
• Test Bit Rates used for evaluation is ;
SYSTEMS DAB DAB+ HD RADIO T-DMB
BIT RATE
(Kbps)
64
96
128
192
24
48
64
96
24
28
64
96
48
64
96
128

SUBJECTIVE EVALUATION METHOD
• Subjective Evaluation is done by using MUSHRAMethod(Multiple Stimuli With Hidden Reference AndAnchor).
• It uses STEP ver.0.10 Program and which is provided byAudio Research Lab(ARL).
• In this method, the grading system is provided witheach audio samples.
• In this method contains;
>REFERENCE AND HIDDEN REFERENCE SIGNAL.
>ANCHORS.
>TEST SIGNALS.

TESTING ENVIRONMENT

• In phase 1 test, evaluates the audio quality for eachsystem(evaluation of four bit rates of each system).
• On every trials each subjects(listeners) randomlylistens;
1 REF+1 HR+2 ANC+4 SIG(diff. bit rate)=8 SIGNALS
• So it conducts 4 system X 9 audio samples=36 trials.
• In Phase 2 test, evaluates the audio quality as afunction of four systems.
• On every trials each subjects(listeners) randomlylistens;
1 REF+1 HR+2 ANC+4 SIG(diff. system)=8 SIGNALS
• So it conducts 2 groupsX9 audio samples=18 trials.
• After each trial, the listener marks the grade.

PRE SCREENING AND POST SCREENING
• In order to provide a guaranteed audio qualityassessment, each listener must have a normal hearingability. So before main evaluation Pre-screening isconducted.
• Nine different audio samples are impaired(processed)using 3.5 and 7KHz LPF or an HE AAC v2 at 32kbps oran HE-AAC V2 at 28 Kbps.
• Then participants first listen to the original sample andafter a short break again original and impaired signals.Then they ask which is the original.
• This process continues for nine audio samples and passthe test only when they give correct answer for 8 of 9.

• 22 listeners applied for evaluation test and one failedthe pre screening. So the remaining 21 listeners wereselected for final participation.
• After PHASE 1 test, a Post Screening test wasconducted in order to ensure a fair assessment ofquality.
• By analyzing of evaluation result of each listener, thelisteners who are believed to make consistent gradingand appropriate quality discrimination are selected.
• Six listeners failed in post screening, thereforeevaluation results of 15 were collected and statisticalanalysis is performed for each subject data.

EVALUATION RESULTS
A.PHASE 1 TEST
• This figure shows the mean audio quality of each system as a function of bit rates.

• It helps us to determine necessary bit rate for a giventarget audio quality for each sub system.
• The quality of DAB at 64 and DAB+ at 24 kbps arelow. The reason is for this is encoders used areoptimized for higher bit rates.
• And also HD Radio at 96 kbps does not showexpected quality; the reason might be the nonoptimized encoder.
B.PHASE 2 TEST
• It is to confirm evaluation consistency of PHASE 1.
• Two groups of similar audio quality were determinedfrom all of the members in each system.
> MID QUALITY >HIGH QUALITY

TEST SIGNAL SET IN A SINGLE TRIAL OF PHASE 1 AND 2
- Test Signal for Phase 1 test.
- Test Signal for Phase 2 test.
GROUP OF TEST CASES USED IN PHASE 2 TEST
SYSTEM DAB DAB+ HD Radio T-DMB
BIT RATE
(Kbps)
64 24 24 48
96 48 48 64
128 64 64 96
192 96 96 128
GROUP DAB DAB+ HD Radio T-DMB
MID QUALITYHIGH QUALITY
128Kbps192Kbps
48Kbps96Kbps
48Kbps96Kbps
64Kbps128Kbps

• The mean audio quality of each groups;

C.ANALYSIS
• Comparing audio quality of the systems that was intwo phases.
• If the two grades of a system are in the range ofequality, then evaluation consistency between twophases are guaranteed.
• The results of comparison is as;

• This unsatisfactory condition are occur due to;
>MUSHRA method measures the relative qualityamong the test signals in each trial.
• In First Case: HD radio(High Quality Group)
>Each signals in the phase 2 test are higher valuesignals in the PHASE 1.
>It can be explained as;
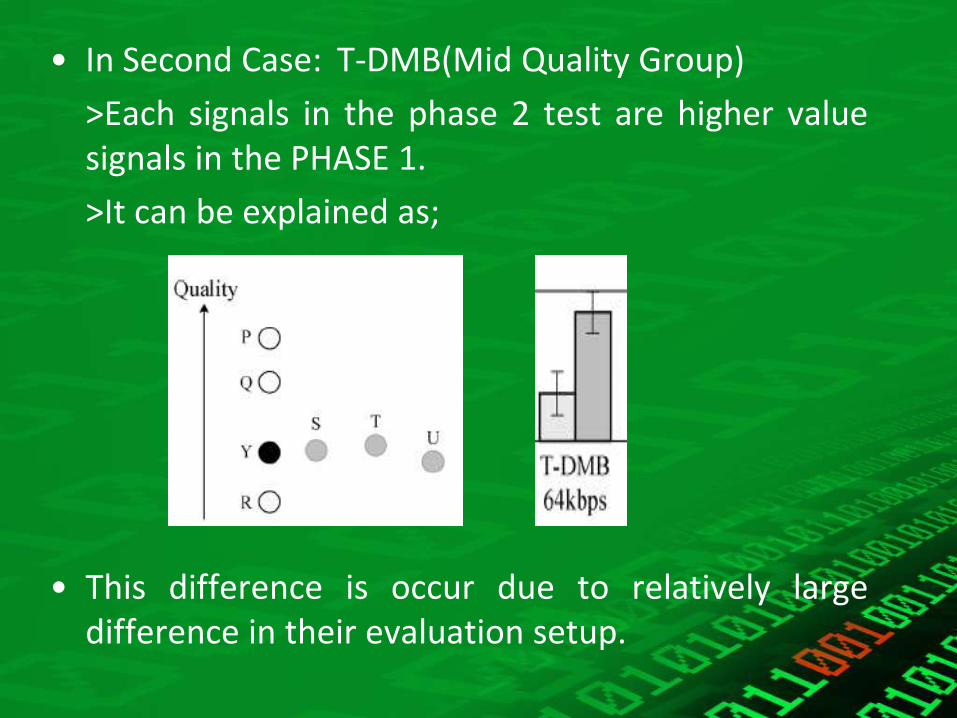
• In Second Case: T-DMB(Mid Quality Group)
>Each signals in the phase 2 test are higher valuesignals in the PHASE 1.
>It can be explained as;
• This difference is occur due to relatively largedifference in their evaluation setup.

• From this; the mean audio quality of system is givenas;
• DAB 128,HD RADIO 48,DAB+ 48,HD RADIO 64 provide better audio quality than FM.
• DAB 64,T-DMB 96,DAB+ 96,T-DMB 128,DAB 192 can provide better audio quality like CD.
FM

CONCLUSION
• Subjective audio quality of 4 digital systems areevaluated using MUSHRA METHOD using nine audiosamples.
• Evaluation process consist of two phases. Phase 1 isfor evaluating quality on the basis of function of bitrates. Phase 2 is for evaluating on the basis offunctions of system.
• The results are compared and finally mean audioquality is calculated.
• This results can be used as a reference to determinethe optimal channel capacity for a given target audioquality.

REFERENCE
• F.HOFMANN,C.HANSEN AND W.SCHAFER,”DIGITAL RADIOMONDIALE (DRM) DIGITAL SOUND BROADCASTING IN THE AMBANDS , ”IEEEE TRANS. BROADCAST.,VOL.49,NO.,PP.319-328,SEP . 2003.
• RADIO BROADCASTING SYSTEMS: DIGITAL AUDIOBROADCASTING TO MOBILE , PORTABLE AND FIXED RECEIVERS ,ETSI EN 300 401 VER 1.4.1.JAN 2006.
• “METHOD OF SUBJECTIVE ASSESSMENT OF INTERMIDATEQUALITY LEVEL OF CODING SYSTEMS”,ITU-R BS.1534,2003.
• “SUBJECTIVE TRAINING EVALUATION PROGRAM”,ARL 2004.
• “EBU EVALUATION OF MULTICHANNEL AUDIO CODECS”,EBU2007.
• “EBU LISTENING TEST ON INTERNET CODECS”,EBU TECHNICALREVIEW 2000.
