an audio recording of this webinar (5/22/17) can be found...
TRANSCRIPT

Children’s Access to Opportunity: Using diversitydatakids.org to teach about
neighborhood opportunity and child wellbeing
May 22, 2017
Presenters: Nancy McArdle & Lindsay Rosenfeld 2

Welcome & Introductions SSDAN
diversitydatakids.org
Please chat in your role, what you
teach, where (as relevant).
3

Agenda
- Welcome & Introductions
- diversitydatakids.org overview
- Using diversitydatakids.org for teaching - Featuring: Child Opportunity Index
- Questions & Discussion
4

What is diversitydatakids.org? Brief Overview – Site Features
5

Diversitydatakids.org
motivated by 3 “meta”
knowledge gaps
1: What do the numbers tell us
about the state of child equity
in US?
2: What is the state of equity of
neighborhood opportunity for
children?
3: In key policy areas that can
address inequities, what’s
helping/hurting?

Demographics Education Health Neighbor-
hoods
Economic
Status
Racial composition of
under age 6 and 18
populations
Racial composition by
school level
Pre-term births, by
education, nativity
Residential segregation Number of children in
poverty
Percent of population that
are children
Segregation of
students
Low birth weight births,
by education, nativity
Share living in high-
poverty neighborhoods
Child poverty rates
Change in number and
racial composition of
children
Exposure to high-
poverty schools
Births to teen or single
mothers, by education,
nativity
Share of children living
in neighborhoods of
differing opportunity
levels
Children with working
parents
Household composition
and living arrangements
Achievement levels
and gaps
Infant mortality Working parents by
job quality and FMLA
eligibility
Head Start
participation and
composition; Eligible
Head Start
Population
Adolescent Health
Issues
(obesity, asthma,
substance abuse)
A Sampling of diversitydatakids.org indicators (All Provided by Race/Ethnicity)
*Not all indicators available for all levels of geography

8

45% of Black children
in Detroit metro are
poor, but:
Avg. school poverty
rate for Black kids
is 76%
70% of Black kids
live in a high
poverty
neighborhood
(poverty rate >
20%)
9

10

11

Area poverty rates for
Black children in
Detroit City: 52%
(rank #12)
For White children:
59% (rank #1)
For Hispanic children:
51% (rank #6)
For Asian children:
80% (rank #1)
12

13

National patterns in low birthweight rates for
Hispanic mothers (native- and foreign-born)
14

Compare counties within NM
Benchmark to national
Explore patterns for nativity subgroups
Localized patterns in low birthweight rates for
Hispanic mothers (native- and foreign-born)
15

Child Opportunity
Maps
2: What is the state of equity of
neighborhood opportunity for
children?

3: In key policy areas that can
address inequities, what’s
helping/hurting? 17
Policy: Policy Equity Assessments

18

19

20

21

One-pagers: Data-for-Action fact sheets
22

• 25 US metro areas
• Visuals and
narrative text
summarizing main
child opportunity
equity patterns
http://www.diversitydatakids.org/d
ata/library/24/coi-metro-profiles
One-pagers:
COI metro area
fact sheets
23
Using diversitydatakids.org
for Teaching Featuring: Child Opportunity Index
24

1) Pose Concepts
2) Create Questions &
Hypotheses
3) Test Hypotheses
4) Explain Findings 25
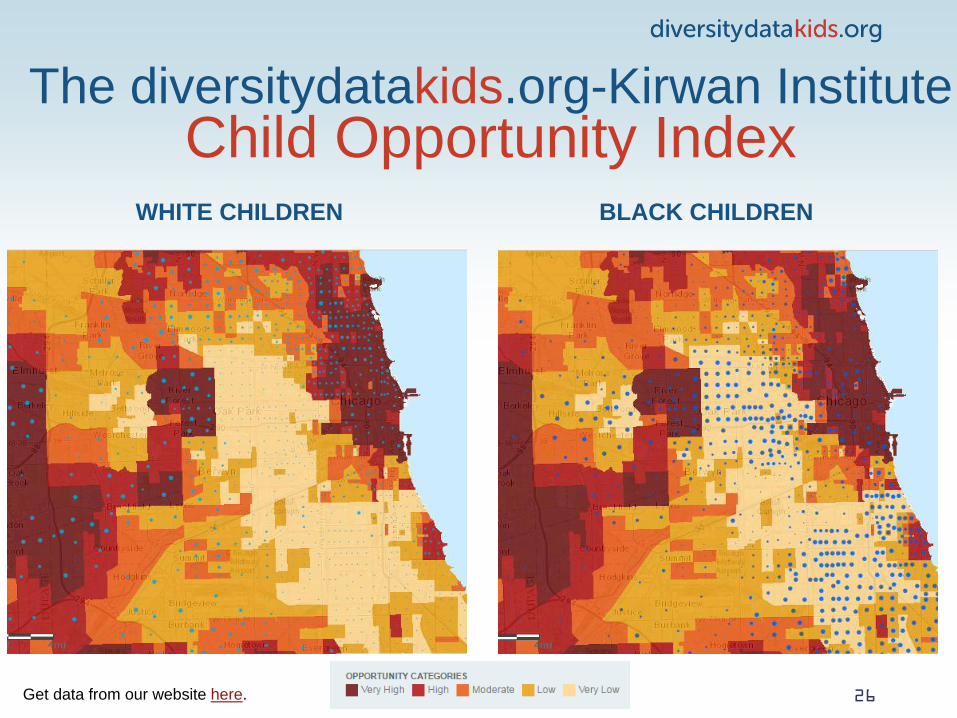
The diversitydatakids.org-Kirwan Institute Child Opportunity Index
WHITE CHILDREN BLACK CHILDREN
Get data from our website here. 26

Child Opportunity Index
Background
27

Child Opportunity Index
Child Neighborhood Opportunity: the context of neighborhood-based opportunities that influence children’s health and development.
The Child Opportunity Index (COI): a measure of relative opportunity across all neighborhoods (i.e., census tracts) in a metropolitan area.
Each neighborhood is assessed relative to the “geography of opportunity” in its metropolitan area. For example, a given neighborhood may have relatively higher educational opportunities (such as having a greater number of high-quality early childhood education centers) than other neighborhoods in the same metropolitan area.
28
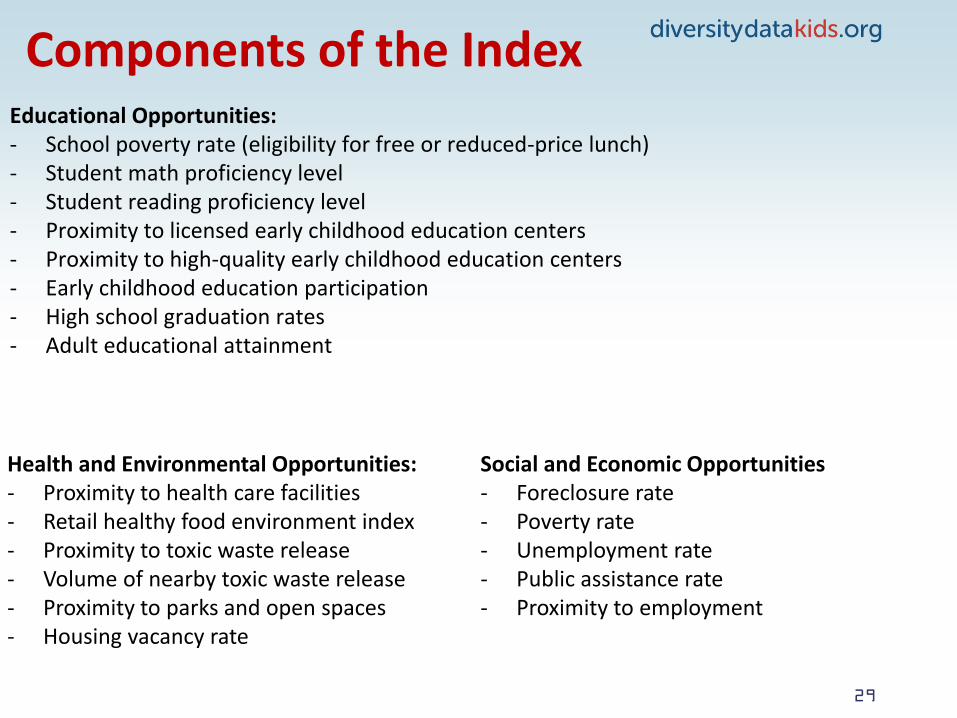
Components of the Index Educational Opportunities: - School poverty rate (eligibility for free or reduced-price lunch) - Student math proficiency level - Student reading proficiency level - Proximity to licensed early childhood education centers - Proximity to high-quality early childhood education centers - Early childhood education participation - High school graduation rates - Adult educational attainment
29
Social and Economic Opportunities - Foreclosure rate - Poverty rate - Unemployment rate - Public assistance rate - Proximity to employment
Health and Environmental Opportunities: - Proximity to health care facilities - Retail healthy food environment index - Proximity to toxic waste release - Volume of nearby toxic waste release - Proximity to parks and open spaces - Housing vacancy rate

Index Interpretation
- The final “opportunity index” for each census tract is based on the (non-weighted) average of all z-scores for all indicators by category.
- The corresponding level of opportunity (very low, low, moderate, high, very high) is determined by sorting all census tracts into quintiles based on their opportunity index scores.
This allows us to overlay a population, for instance – child population by race/ethnicity – and see where children are (or are not).
30

1) Pose Concepts
2) Create Questions &
Hypotheses
3) Test Hypotheses
4) Explain Findings 31

32
Conceptual Foundation #1: Access to Opportunity Matters
Conceptual Foundation #2:
Systems Perspective

33

1) Pose Concepts
2) Create Questions &
Hypotheses
3) Test Hypotheses
4) Explain Findings 34
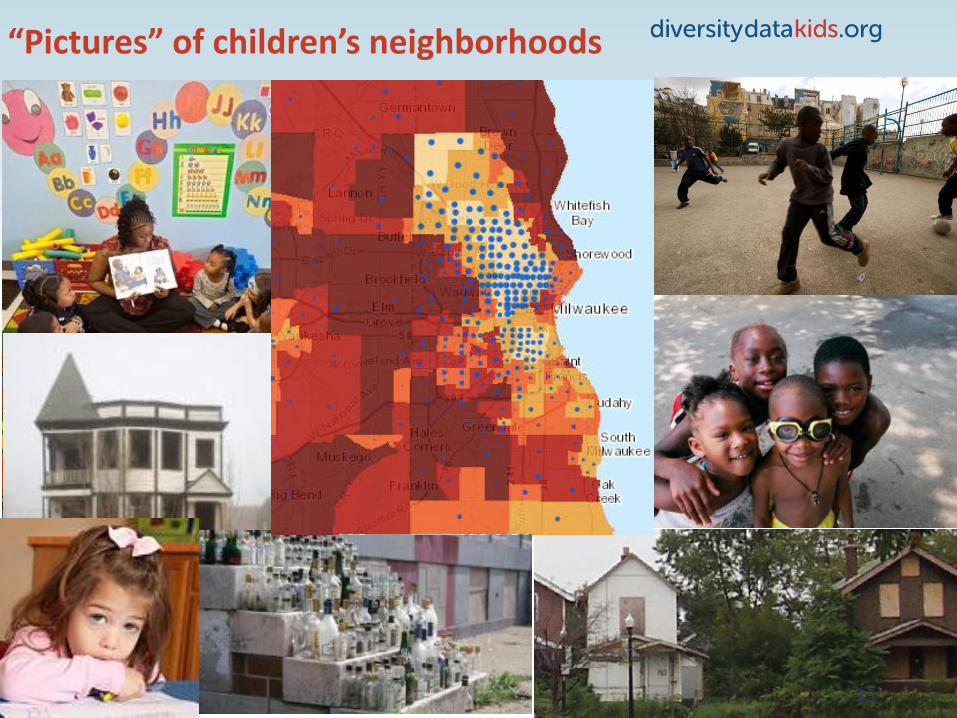
“Pictures” of children’s neighborhoods
35

Broad questions born of the concepts: Are neighborhood structure, social organization, and institutional capacity related? How? Can institutional capacity (e.g. social service interactions) mitigate the effects of structural disadvantage? Specific questions & hypotheses to tackle these larger questions: How is child opportunity structured in the 100 largest metros? How is child opportunity structured in Metro Milwaukee? Are children of different races/ethnicities distributed equally across lower opportunity neighborhoods? Theoretical Hypotheses: Child opportunity is not structured by place. Children of differing races/ethnicities are distributed relatively equally across lower opportunity neighborhoods.
36

1) Pose Concepts
2) Create Questions &
Hypotheses
3) Test Hypotheses
4) Explain Findings 37

How is child opportunity structured in the 100 largest metros? - How is child opportunity structured in Metro Milwaukee? - Are children of different races/ethnicities distributed equally across lower opportunity neighborhoods?
38
Using the Child Opportunity Index Mapping and Interactive
Visualizations to Test Hypotheses about Geography
and Equity of Opportunity
www.diversitydatakids.org
39

Select “Child Opportunity Maps” from Main Menu

Select Metro Area
See Technical
Documentation
Here


See Child Opportunity Index Map
Tracts are grouped into 5 equal categories by opportunity level

Click on a tract to bring up a pop-up showing
opportunity level for overall index and 3 sub indices.
To change/add layers, click on “Customize Map”

Map opens in ArcGIS Online Click on “Content” for Opportunity and Demographic Layers

Click on race group to overlay child demographic layer
Relative size of dot reflects size of population
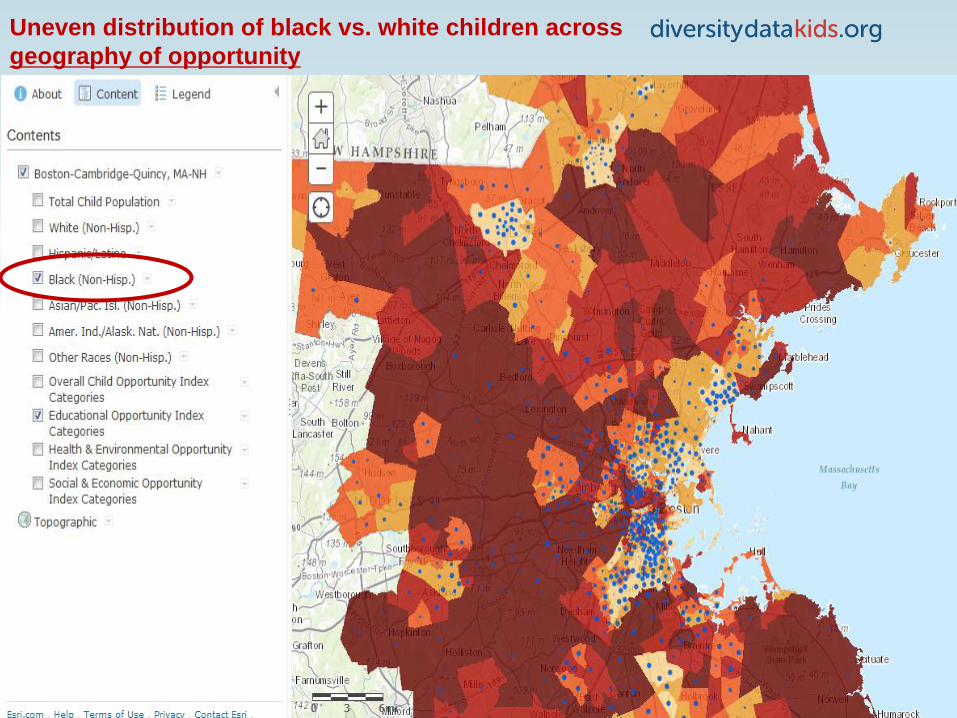
Uneven distribution of black vs. white children across
geography of opportunity

Click on dot on map to bring up pop-up with
underlying child population data for that tract

Important: Only turn on one opportunity layer and one demographic layer at a time
Relative size of dots will be different for different race groups

Can download most underlying data (at census tract
level) into a spreadsheet

What the Child Opportunity Index
shows us:
Children of different races/ethnicities face
vastly different geographies of opportunity,
with black and Hispanic children concentrated
in very-low opportunity neighborhoods

To Obtain Summary Stats and Visualization:
From DDK Homepage, Select Interactive Visualizations

Choose first option listed under visualizations

Interactive Bar Charts Present Aggregate Data
You can change Metro Area, Index, and Racial/Ethnic groups to compare

Pop-Up Shows Underlying Data

Interactive Activity http://www.diversitydatakids.org/data/library/52/distribution-of-children-by-raceethnicity-across-neighborhood-opportunity-levels
Step 1: Scroll down to interactive bar chart.
Step 2: Choose metro area.
Step 3: Choose “overall index”.
Step 4: Select one or more race/ethnicity to explore.
Chat in your observation. For example:
In Detroit, we see that black children are almost 12 times as likely to live in very low opportunity neighborhoods than are white children (47% vs. 4%).
56

What did we discover?
How is child opportunity structured in Metro Milwaukee?
Hypothesis: Child opportunity is not structured by place.
False. Child opportunity is structured by place. Different places have different levels of opportunity.
Are children of different races/ethnicities distributed equally across lower opportunity neighborhoods?
Hypothesis: Children of differing races/ethnicities are distributed relatively equally across lower opportunity neighborhoods.
False. Black and Hispanic children are much more likely to live in lower opportunity areas than are white (non-Hispanic) children.
57

1) Pose Concepts
2) Create Questions &
Hypotheses
3) Test Hypotheses
4) Explain Findings 58

Use Findings for Assignments:
59
- Large Group Class Discussion - Discussion Groups - Oral Presentation - Debate - Poster Presentation - Data Memo - Policy Brief - Research Paper - Mapping Presentation

Child Opportunity Index: Other Applications • Boston Medical Center and Vital Village Network developing child
health indicators of child obesity, hypertension, and asthma in
relation to neighborhood opportunity and violent crime prevalence
• Chicago Department of Public Health examining the relationship
between the Index and indicators such as life expectancy at birth,
teen births, obesity in children, elevated blood lead levels, diabetes-
related mortality, diet-related mortality, non-fatal shootings
• Juvenile Welfare Board/University of South Florida, (Pinellas
County, Florida) exploring the relative contributions of place, school,
and individual/family variables on student absenteeism
• Good Shepherd Services, NYC created report on Geography of
Opportunity in NYC and uses Index to explore relationship between
their program offerings and child neighborhood opportunity
Help meet community data
reporting requirements e.g., Affordable Care Act, HUD Affirmatively Furthering Fair
Housing Assessments
61

Questions?
62

Questions?
Thank you!
We look forward to hearing how you use
diversitydatakids.org in your
teaching - - and we’re happy to
brainstorm further with you!
63
