an autoignition performance comparison of chemical kinetics models for n-heptane
TRANSCRIPT

An autoignition performance comparison of chemical
kinetics models for n-heptane Kyle Niemeyer
Oregon State University
WSSCI Spring 2016 Meeting 21 March 2016
Contact: [email protected]

Motivation
2

Motivation1. Establish performance of various published models for n-heptane
2

Motivation1. Establish performance of various published models for n-heptane
➡ PRF, TRF, & TRF+ethanol mixtures
2

Motivation1. Establish performance of various published models for n-heptane
➡ PRF, TRF, & TRF+ethanol mixtures
2. Enable more robust performance testing of models
2

Motivation1. Establish performance of various published models for n-heptane
➡ PRF, TRF, & TRF+ethanol mixtures
2. Enable more robust performance testing of models
➡ Open-source validation software, and publish full set of experimental data used
2

Motivation1. Establish performance of various published models for n-heptane
➡ PRF, TRF, & TRF+ethanol mixtures
2. Enable more robust performance testing of models
➡ Open-source validation software, and publish full set of experimental data used
3. Encourage openness in combustion/chemical kinetics research
2

Similar work
3

Similar work• Sheen & Tsang (2014)1: comparison of n-heptane
models
• Only three experimental ignition datasets
• Four models considered; LLNL model also here
• Olm et al. (2014 & 2015): comprehensive performance comparison of models for hydrogen2 and syngas3 combustion
3

Models
4

Models
4
Name Coverage # Species # Reactions Ar? ReferenceTsurushima-2009 PRF 33 48 4
ERC-2013 PRF 73 454 5Ogura-2007 PRF+EtOH 634 3724 ✓ 6
Saisirirat-2011 PRF+EtOH 1046 8576 7CNRS-2009 TRF 536 2987 ✓ 8Dalian-2013 TRF 56 191 9Andrae-2013 TRF 138 641 ✓ 10
LLNL-2012 TRF 1388 10479 ✓ 11Princeton-2009 TRF+EtOH 469 1267 ✓ 12Cancino-2011 TRF+EtOH 1130 9158 ✓ 13
Tsinghua-2014 TRF+EtOH 91 411 ✓ 14CRECK-2014 TRF+EtOH 317 12353 ✓ 15Aachen-2015 TRF+EtOH 339 1693 ✓ 16

Experimental data
5

Experimental data
5
Study P (atm) T (K) ϕVermeer et al.17 1.4–4.1 1270–1580 1.0Burcat et al.18 2.0–11.8 1137–1661 0.5–2.0
Ciezki & Adomeit19 3.16–41.5 660–1350 0.5–3.0Fieweger et al.20 39.5 700–1200 1.0
Colket & Spadaccini21 4.1–7.8 1229–1427 0.5Horning et al.22 1.15–5.71 1329–1547 0.5–2.0Gauthier et al.23 2–60 800–1400 1.0
Smith et al.24 1, 2 1150–1700 0.5–2.0Herzler et al.25 49.3 720–1130 0.1–0.4Sakai et al.26 2 1319–1567 1.0Shen et al.27 10.5–53.6 786–1396 0.25–1.0
Hartmann et al.28 39.5 692–1275 0.5, 1.0Vandersickel et al.29 19.7–64.2 700–1100 0.5–1.0
Karwat et al.30 9 660–707 1.0

6

Approach
7

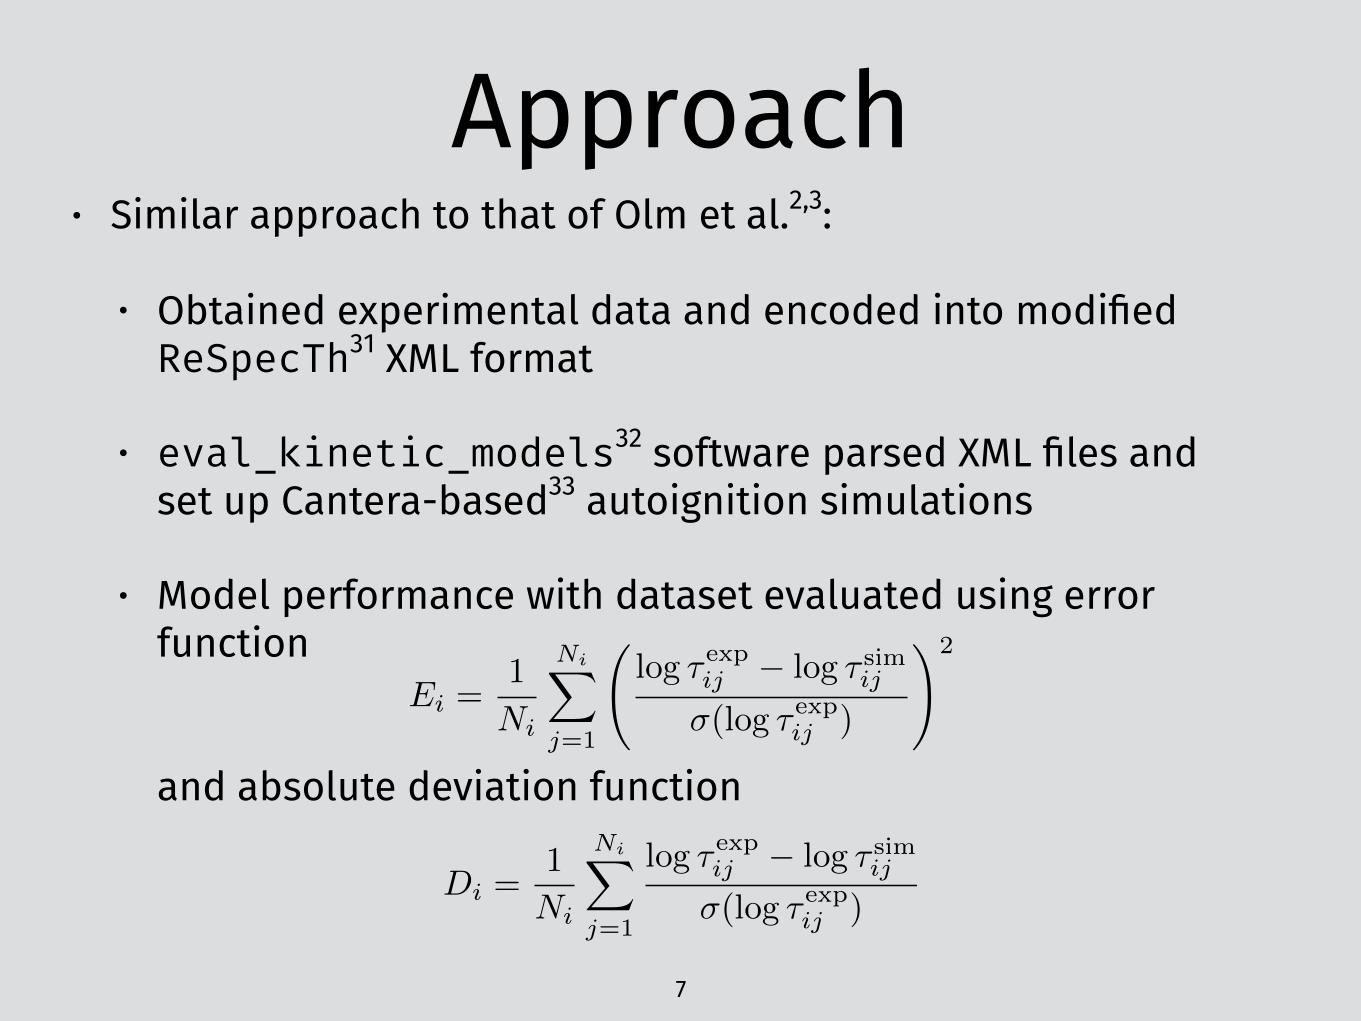
Approach• Similar approach to that of Olm et al.2,3:
7

Approach• Similar approach to that of Olm et al.2,3:
• Obtained experimental data and encoded into modified ReSpecTh31 XML format
7

Approach• Similar approach to that of Olm et al.2,3:
• Obtained experimental data and encoded into modified ReSpecTh31 XML format
• eval_kinetic_models32 software parsed XML files and set up Cantera-based33 autoignition simulations
7
Approach• Similar approach to that of Olm et al.2,3:
• Obtained experimental data and encoded into modified ReSpecTh31 XML format
• eval_kinetic_models32 software parsed XML files and set up Cantera-based33 autoignition simulations
• Model performance with dataset evaluated using error function and absolute deviation function
7
Ei =1
Ni
NiX
j=1
log ⌧ expij � log ⌧ simij
�(log ⌧ expij )
!2
Di =1
Ni
NiX
j=1
log ⌧ expij � log ⌧ simij
�(log ⌧ expij )

The details: uncertainty
Dataset standard deviation σi: • Spline fit of
experimental data2,3 • σi = standard deviation
of difference between data and fit
• Minimum allowable: 10%
8

The details: ignition modeling
9

The details: ignition modeling
• Most shock tube experiments: modeled as adiabatic constant volume reactor
9

The details: ignition modeling
• Most shock tube experiments: modeled as adiabatic constant volume reactor
• Cases with preignition pressure increase: reported dP/dt employed using
9
P (t) = P0 +
Z tend
0
✓dP
dt
◆dt
v(t) = v0⇢0⇢(t)
����s0

The details: ignition modeling
• Most shock tube experiments: modeled as adiabatic constant volume reactor
• Cases with preignition pressure increase: reported dP/dt employed using
9
P (t) = P0 +
Z tend
0
✓dP
dt
◆dt
v(t) = v0⇢0⇢(t)
����s0
then volume history applied as reactor wall velocity

The details: ReSpecTh
10
# n-heptane ignition delay from Colket and Spadaccini 2001 # P (atm), T (K), Ignition Delay (µs) # Mole Fraction nC7H16 O2 Ar : 0.00192 0.04224 0.95584 7.72 ,1393 ,85 7.78 ,1299 ,345 7.04 ,1235 ,631 6.38 ,1299 ,348 7.53 ,1372 ,134 6.08 ,1236 ,678 7.35 ,1340 ,148 6.63 ,1328 ,211 6.94 ,1395 ,89
CSV file21

The details: ReSpecTh
10
Obtaining experimental data:
PDF table18
SELF-IGNITION OF nIHEPTANE-AIR MIXTURES 425
B E N Z E N E ¢ = 1 . 0
Ps =13 bar
P [bar] strong ignition T s =1080 K \
Aps mild ignition Ts=1040 K
I I I I
t [ms3
M
I Fig. 2. Pressure- t ime histories for a s~oichio- ~- metric benzene-a i r mixture.
region the dependence of the ignition delay time upon temperature can be expressed ap- proximately by straight lines in the Arrhenius plot. The corresponding global activation ener- gies decrease with increasing pressure.
For Ps around 13.5 bar the dependence be- comes strongly nonlinear in a temperature range between 950 and 700 K. In this interme- diate temperature region a decrease in ignition delay time is observed with decreasing temper- atures. This leads to an S-shaped curve with a maximum and a minimum. Between both ex- termal values the dependence possesses a neg- ative temperature coefficient. The position of this transition region shifts to higher tempera-
tures with increasing pressures Ps- In the low- temperature region--below approximately 700 K-- the dependence of the ignition delay time upon temperature can again be expressed by a linear dependence. Because the measuring time of the shock tube is limited, the delay times could be determined only above 660 K, so that only a short part of the low-temperature region could be investigated in our experiments. The influence of pressure on the ignition delay is most pronounced in the transition region, smallest for low temperatures and of varying degree in the high-temperature region, where with increasing temperature this dependence becomes smaller.
"1~ z
[ms]
101
100
1o-1
16 2
,, 3.2 bar , , . / - - ~ - ~ . ~ / . - '~ o 6.s ,, . / \ ' - - - J . / /
O I£3 " / ' / n [] \ . . ~ - / 30 ,,,, . o
, ~ _ D,,- x i< \ 3 bar 1 Comoufofion ~o/"°E~/" × ~+.---+-.---L_._.+_.~..~" ~ X13 " ,, [ , " ,
t / ~ / / " !.ine of /+0 " j el'. a[. / .z~ ~ / . / pressure variation , / ~ / / T= 9/,0 K (Fig.11) T
/ 1200 1000 800 [K] I I I i I I I I I l I
0:8 1.o 1.2 114 loooK T
Fig. 3. Ignition delay times.
Figure19# n-heptane ignition delay from Colket and Spadaccini 2001 # P (atm), T (K), Ignition Delay (µs) # Mole Fraction nC7H16 O2 Ar : 0.00192 0.04224 0.95584 7.72 ,1393 ,85 7.78 ,1299 ,345 7.04 ,1235 ,631 6.38 ,1299 ,348 7.53 ,1372 ,134 6.08 ,1236 ,678 7.35 ,1340 ,148 6.63 ,1328 ,211 6.94 ,1395 ,89
CSV file21 Email plea

The details: ReSpecTh
11
<commonProperties> <property name="initial composition"> <component><speciesLink preferredKey="nC7H16" InChI="1S/C7H16/c1-3-5-7-6-4-2/h3-7H2,1-2H3"/> <amount units="mole fraction">0.010</amount> </component> <component><speciesLink preferredKey="O2" InChI="1S/O2/c1-2"/> <amount units="mole fraction">0.110</amount> </component> <component><speciesLink preferredKey="Ar" InChI="1S/Ar"/> <amount units="mole fraction">0.880</amount> </component> </property> </commonProperties> <dataGroup id="dg1" label="ignition delay"> <dataGroupLink dataGroupID="" dataPointID=""/> <property id="x1" label="T" name="temperature" units="K" description="Temperature behind reflected shock wave"/> <property id="x2" label="P" name="pressure" units="atm" description="Pressure behind reflected shock wave"/> <property id="x3" label="tau" name="ignition delay" units="us" description="Ignition delay time"/> <dataPoint><x2>4.6600e+00</x2><x1>1.2600e+03</x1><x3>3.2300e+02</x3></dataPoint> <dataPoint><x2>5.1700e+00</x2><x1>1.4100e+03</x1><x3>7.0000e+01</x3></dataPoint> <dataPoint><x2>4.5200e+00</x2><x1>1.3230e+03</x1><x3>1.7000e+02</x3></dataPoint> <dataPoint><x2>2.0300e+00</x2><x1>1.2680e+03</x1><x3>6.4700e+02</x3></dataPoint> <dataPoint><x2>3.1500e+00</x2><x1>1.3410e+03</x1><x3>1.5500e+02</x3></dataPoint> <dataPoint><x2>3.0800e+00</x2><x1>1.6020e+03</x1><x3>2.5000e+01</x3></dataPoint> <dataPoint><x2>9.2300e+00</x2><x1>1.3610e+03</x1><x3>8.7000e+01</x3></dataPoint> <dataPoint><x2>8.3400e+00</x2><x1>1.2860e+03</x1><x3>2.0000e+02</x3></dataPoint> <dataPoint><x2>1.1810e+01</x2><x1>1.5650e+03</x1><x3>1.0000e+00</x3></dataPoint> </dataGroup> <ignitionType target="p" type="d/dt max" />
ReSpecTh XML

Model performance
12

13
Error function

14
Absolute deviation

15
Analysis of Aachen-2015

16
Analysis of Aachen-2015
*Outliers not displayed

17
Aachen-2015 absolute deviation

Discussion
18

Discussion• Best performing models: Cancino-2011,
Tsurushima-2009, ERC-2013, Dalian-2013, & Aachen-2015
18

Discussion• Best performing models: Cancino-2011,
Tsurushima-2009, ERC-2013, Dalian-2013, & Aachen-2015
• Tsurushima-2009, ERC-2013, & Dalian-2013: reduced models, with optimized rate parameters based on experimental data.
18

Discussion• Best performing models: Cancino-2011,
Tsurushima-2009, ERC-2013, Dalian-2013, & Aachen-2015
• Tsurushima-2009, ERC-2013, & Dalian-2013: reduced models, with optimized rate parameters based on experimental data.
• Aachen-2015: calibrated using uncertainty quantification technique
18

Discussion• Best performing models: Cancino-2011,
Tsurushima-2009, ERC-2013, Dalian-2013, & Aachen-2015
• Tsurushima-2009, ERC-2013, & Dalian-2013: reduced models, with optimized rate parameters based on experimental data.
• Aachen-2015: calibrated using uncertainty quantification technique
• Room for improvement in all models
18

Future work
19

Future work• This work is first step towards comparison of
models for ignition of PRFs, TRFs, and TRF+EtOH mixtures.
19

Future work• This work is first step towards comparison of
models for ignition of PRFs, TRFs, and TRF+EtOH mixtures.
• Explore alternate means to estimate experimental variability
19

Future work• This work is first step towards comparison of
models for ignition of PRFs, TRFs, and TRF+EtOH mixtures.
• Explore alternate means to estimate experimental variability
• All experimental data in XML format and automatic analysis software eval_kinetic_models will be released openly.
19

Thank you! Questions?
20
Acknowledgements: Dr. Bryan Weber; OSU School of Mechanical, Industrial, and Manufacturing Engineering

Thank you! Questions?
20
?Acknowledgements: Dr. Bryan Weber; OSU School of Mechanical,
Industrial, and Manufacturing Engineering

Thank you! Questions?
20
?Acknowledgements: Dr. Bryan Weber; OSU School of Mechanical,
Industrial, and Manufacturing Engineering

References (1)1. Sheen DA, Tsang W. A comparison of literature models for the oxidation of normal heptane. Combust Flame 2014;161:1984–92. doi:10.1016/j.combustflame.
2014.01.014. 2. Olm C, Zsély IG, Varga T, Curran HJ, Turányi T. Comparison of the performance of several recent syngas combustion mechanisms. Combust Flame
2015;162:1793–812. doi:10.1016/j.combustflame.2014.12.001 3. Olm C, Zsély IG, Pálvölgyi R, Varga T, Nagy T, Curran HJ, et al. Comparison of the performance of several recent hydrogen combustion mechanisms.
Combust Flame 2014;161:2219–34. doi:10.1016/j.combustflame.2014.03.006 4. Tsurushima T. A new skeletal PRF kinetic model for HCCI combustion. Proc Combust Inst 2009;32:2835–41. doi:10.1016/j.proci.2008.06.018. 5. Wang H, Yao M, Reitz RD. Development of a Reduced Primary Reference Fuel Mechanism for Internal Combustion Engine Combustion Simulations.
Energy Fuels 2013;27:7843–53. doi:10.1021/ef401992e 6. Ogura T, Sakai Y, Miyoshi A, Koshi M, Dagaut P. Modeling of the Oxidation of Primary Reference Fuel in the Presence of Oxygenated Octane Improvers:
Ethyl Tert-Butyl Ether and Ethanol. Energy Fuels 2007;21:3233–9. doi:10.1021/ef700321e 7. Saisirirat P, Togbe C, Togbe C, Chanchaona S, Foucher F, Foucher F, et al. Auto-ignition and combustion characteristics in HCCI and JSR using 1-butanol/n-
heptane and ethanol/n-heptane blends. Proc Combust Inst 2011;33:3007–14. doi:10.1016/j.proci.2010.07.016 8. Anderlohr JM, Bounaceur R, Da Cruz AP, Battin-Leclerc F. Modeling of autoignition and NO sensitization for the oxidation of IC engine surrogate fuels.
Combust Flame 2009;156:505–21. doi:10.1016/j.combustflame.2008.09.009 9. Liu Y-D, Jia M, Xie M-Z, Pang B. Development of a New Skeletal Chemical Kinetic Model of Toluene Reference Fuel with Application to Gasoline Surrogate
Fuels for Computational Fluid Dynamics Engine Simulation. Energy Fuels 2013;27:4899–909. doi:10.1021/ef4009955 10. Andrae JCG. Comprehensive chemical kinetic modeling of toluene reference fuels oxidation. Fuel 2013;107:740–8. doi:10.1016/j.fuel.2013.01.070 11. Mehl M, Sitz WJ, Westbrook CK, Curran HJ, LLNL gasoline surrogate v1.0, https://combustion.llnl.gov/mechanisms/surrogates/gasoline-surrogate,
Accessed: 2016-01-13 (March 2012). 12. Haas FM, Chaos M, Chaos M, Dryer FL, Dryer FL. Low and intermediate temperature oxidation of ethanol and ethanol–PRF blends: An experimental and
modeling study. Combust Flame 2009;156:2346–50. doi:10.1016/j.combustflame.2009.08.012 13. Cancino LR, Fikri M, Oliveira AAM, Schulz C, Schulz C. Ignition delay times of ethanol-containing multi-component gasoline surrogates: Shock-tube
experiments and detailed modeling. Fuel 2011;90:1238–44. doi:10.1016/j.fuel.2010.11.003 14. Zhong B-J, Zheng D. A chemical mechanism for ignition and oxidation of multi-component gasoline surrogate fuels. Fuel 2014;128:458–66. doi:10.1016/
j.fuel.2014.03.044 15. CRECK Modeling Group, Primary Reference Fuels (PRF) + PAH + alcohols + ethers (version 1412), http://www.chem.polimi.it/CRECKModeling, accessed:
2016-01-11 (December 2014). 16. Cai L, Pitsch H. Optimized chemical mechanism for combustion of gasoline surrogate fuels. Combust Flame 2015;162:1623–37. doi:10.1016/j.combustflame.
2014.11.018
21
References (2)17. Vermeer DJ, Meyer JW, Oppenheim AK. Auto-ignition of hydrocarbons behind reflected shock waves. Combust Flame 1972;18:327–36. doi:10.1016/
S0010-2180(72)80183-4 18. Burcat A, Farmer RF, Matula RA. Shock initiated ignition in heptane-oxygen-argon mixtures. 13th Int. Symp. Shock Tubes Waves, 1981, 826–33. 19. Ciezki HK, Adomeit G. Shock-tube investigation of self-ignition of n-heptane–air mixtures under engine relevant conditions. Combust Flame
1993;93:421–33. doi:10.1016/0010-2180(93)90142-P 20. Fieweger K, Blumenthal R, Adomeit G. Self-ignition of SI engine model fuels: a shock tube investigation at high pressure. Combust Flame
1997;109:599–619. doi:10.1016/S0010-2180(97)00049-7 21. Colket MB, Spadaccini LJ. Scramjet fuels autoignition study. J. Propul. Power 17 (2) (2001) 315–323. doi:10.2514/2.5744 22. Horning DC, Davidson DF, Hanson RK. Study of the High-Temperature Autoignition of n-Alkane/O2/Ar Mixtures. J Propul Power 2002;18:363–71. 23. Gauthier BM, Davidson DF, Hanson RK. Shock tube determination of ignition delay times in full-blend and surrogate fuel mixtures. Combust
Flame 2004;139:300–11. doi:10.1016/j.combustflame.2004.08.015 24. Smith JM, Simmie JM, Curran HJ. Autoignition of heptanes; experiments and modeling. Int J Chem Kinet 2005;37:728–36. doi:10.1002/kin.20120 25. Herzler J, Jerig L, Roth P. Shock tube study of the ignition of lean n-heptane/air mixtures at intermediate temperatures and high pressures. Proc
Combust Inst 2005;30:1147–53. doi:10.1016/j.proci.2004.07.008 26. Sakai Y, Ozawa H, Ogura T, Miyoshi A, Koshi M, Pitz WJ. Effects of Toluene Addition to Primary Reference Fuel at High Temperature. Warrendale, PA:
SAE International; 2007. doi:10.4271/2007-01-4104 27. Shen H-PS, Steinberg J, Vanderover J, Oehlschlaeger MA. A Shock Tube Study of the Ignition of n-Heptane, n-Decane, n-Dodecane, and n-
Tetradecane at Elevated Pressures. Energy Fuels 2009;23:2482–9. doi:10.1021/ef8011036 28. Hartmann M, Gushterova I, Gushterova I, Fikri M, Schulz C, Schulz C, et al. Auto-ignition of toluene-doped n-heptane and iso-octane/air mixtures:
High-pressure shock-tube experiments and kinetics modeling. Combust Flame 2011;158:172–8. doi:10.1016/j.combustflame.2010.08.005 29. Vandersickel A, Hartmann M, Vogel K, Wright YM, Fikri M, Starke R, et al. The autoignition of practical fuels at HCCI conditions: High-pressure
shock tube experiments and phenomenological modeling. Fuel 2012;93:492–501. doi:10.1016/j.fuel.2011.10.062 30. Karwat DMA, Wagnon SW, Wooldridge MS, Westbrook CK. Low-temperature speciation and chemical kinetic studies of n-heptane. Combust Flame
2013;160:2693–706. doi:10.1016/j.combustflame.2013.06.029 31. Varga T, ReSpecTh kinetics data format specification, Documentation version v1.0, http://respecth.hu/ (Mar. 2015). 32. Niemeyer KE. eval_kinetic_models, GitHub. https://github.com/kyleniemeyer/eval_kinetic_models 33. Goodwin DG, Moffat HK, Speth RL. Cantera: An object-oriented software toolkit for chemical kinetics, thermodynamics, and transport processes.
http://www.cantera.org, version 2.2.0 (2015).
22