an economic analysis of the u.s. rotary wing air...
TRANSCRIPT
Final Report
An Economic Analysis of the U.S. Rotary Wing Air Medical Transport Industry
Prepared for:
The MedEvac Foundation International and the Association of Air Medical Services
Prepared by:
Economic & Planning Systems, Inc.
August 2014
EPS #21889
Table of Contents
1. FORWARD .......................................................................................................... 1
2. EXECUTIVE SUMMARY ............................................................................................ 2
Overview ................................................................................................................. 2
Industry Background ................................................................................................. 3
Rotary Wing Industry Benefit ..................................................................................... 5
3. ECONOMIC FRAMEWORK ......................................................................................... 7
Health Care Spending ................................................................................................ 7
Employment & Population .......................................................................................... 7
Overall Air Medical Transport Industry Trends ............................................................ 10
4. ROTARY WING INDUSTRY STRUCTURE ....................................................................... 12
Survey .................................................................................................................. 12
Operational Costs ................................................................................................... 18
Industry Activity Factors .......................................................................................... 22
5. ROTARY WING INDUSTRY BENEFIT ........................................................................... 25
Definitions ............................................................................................................. 25
Total Economic Benefit ............................................................................................ 26
Operational Benefit ................................................................................................. 27
Capital Purchase Benefit .......................................................................................... 29
Regional Benefit ..................................................................................................... 30
6. INPUT-OUTPUT MODEL LIMITATIONS ......................................................................... 34
Source Data ........................................................................................................... 34
General Assumptions ............................................................................................... 35
Interpretation of Employment Benefit ........................................................................ 37
A P P E N D I X A : R O T A R Y W I N G I N D U S T R Y D E F I N I T I O N ....................................... 38
A P P E N D I X B : S U P P O R T I N G M A T E R I A L S ............................................................ 45

List of Tables
Table 1 General Statistics by Rotary Wing Program Type ................................................ 16
Table 2 Frequency of Capital Purchase ......................................................................... 21
Table 3 Total Economic Benefit of Rotary Wing Industry Operations & Capital Purchases .... 27
Table 4 Economic Benefits of Rotary Wing Industry Operations ....................................... 28
Table 5 Economic Benefits of Rotary Wind Industry Capital Purchases .............................. 30
Table 6 Operational Economic Benefit per Rotary Wing Aircraft by Region......................... 33
List of Figures
Figure ES-1 Study Geographic Representation ................................................................ 3
Figure ES-2 Rotary Wing Patient Transport Trends, 1980-2011 ......................................... 4
Figure ES-3 Range of Average Annual Costs per Rotary Wing Base, 2011 .......................... 5
Figure 1 Historical Healthcare Spending ........................................................................... 7
Figure 2 U.S. Job Trends, 2000-2011 .............................................................................. 8
Figure 3 U.S. Job Trends, 2000-2011 .............................................................................. 8
Figure 4 Ambulatory Health Care Services, 2000-2011 ...................................................... 9
Figure 5 Ambulance Services Trends, 2000-2011 .............................................................. 9
Figure 6 U.S. Population Change, 2000-2011 ................................................................. 10
Figure 7 Overall Air Medical Transport Programs, 1990-2011 ........................................... 11
Figure 8 Historical Rotary Wing Aircraft Counts............................................................... 11
Figure 9 Survey Response by Region............................................................................. 13
Figure 10 Rotary Wing Aircraft per State per Program ....................................................... 14
Figure 11 Distribution of Programs Responding to Survey .................................................. 15
Figure 12 Rotary Wing Program Staffing Portions ............................................................. 17
Figure 13 Average Jobs per Rotary Wing Aircraft .............................................................. 17
Figure 14 Annual Rotary Wing Program Cost Proportions ................................................... 18
Figure 15 Average Rotary Wing Pilot Salaries and Regional Labor Costs .............................. 19
Figure 16 Rotary Wing Aircraft Flight Hours and Regional Fuel Costs ................................... 20
Figure 17 Estimated Annual Capital Purchases ................................................................. 21
Figure 18 Distribution of Annual Base (per Aircraft) Operational Costs ................................ 23
Figure 19 Distribution of Annual Average Capital Purchases per Base .................................. 24
Figure 20 Distribution of Jobs per Aircraft ........................................................................ 24
Figure 21 Distribution of Jobs per Million Dollars in Rotary Wing Industry Final Demand ........ 32
Figure 22 Jobs per Rotary Wing Aircraft .......................................................................... 37
Appendix B List of Tables
Table B-1 U.S. Wage and Salary Job Trends, 2000-2011 ................................................... 46
Table B-2 Population Trends by Age, 2000-2010 .............................................................. 47
Table B-3 Rotary Wing Aircraft Staffing by Program Type .................................................. 47
Table B-4 Rotary Wing Industry Non-Staff Expenditure and Regional Metrics Correlation ....... 48
Table B-5 Rotary Wing Industry Non-Staff Expenditure and Regional Metrics Correlation ....... 48
Table B-6 Final Demand Employment Multipliers, Type I .................................................... 51
Table B-7 Final Demand Employment Multipliers, Type II ................................................... 51
Table B-8 Final Demand Output Multipliers, Type I ............................................................ 52
Table B-9 Final Demand Output Multipliers, Type II .......................................................... 52
Table B-10 Final Demand Wages and Benefits Multipliers, Type I .......................................... 53
Table B-11 Final Demand Wages and Benefits Multipliers, Type II ........................................ 53
Table B-12 Final Demand Value Added Multipliers, Type I .................................................... 54
Table B-13 Final Demand Value Added Multipliers, Type II ................................................... 54
Table B-14 Direct Effect Multipliers ................................................................................... 55
Appendix B List of Figures
Figure B-1 Rotary Wing Industry Direct Spending Composition ............................................ 48
Figure B-2 Indirect Jobs from Rotary Wing Industry Operational Impacts .............................. 49
Figure B-3 Induced Jobs from Rotary Wing Industry Operational Impact ............................... 49
Figure B-4 Indirect Jobs from Rotary Wing Industry Capital Purchase Impacts ....................... 50
Figure B-5 Induced Jobs from Rotary Wing Industry Capital Purchase Impacts ...................... 50
Economic & Planning Systems, Inc. 1 21889-Final Report 082114
1. FORWARD
Following the release of an earlier version of this report dated June 2013, Economic & Planning Systems (EPS) discovered that there were errors and inconsistencies in the underlying survey data used to report the economic benefits. This report is a revision of that study. After attention was brought to the fact that primary data collected and used from air medical transport (AMT) programs throughout the U.S. contained flaws in reported operational costs and volume (i.e. number of patient transports), EPS requested that the link to the existing study be removed from the MedEvac Foundation’s website until a revision could be prepared.
Specifically, it was discovered that the flaws in these underlying cost and volume data made reliably reporting average cost per patient transport factors and average patient transports per aircraft factors impossible at the national and regional levels. After closer analysis, it was determined that these flawed data were not essential to the larger purpose of demonstrating or assessing the industry’s national economic impact. Thus, this revised study excludes these factors from the report and provides a revised methodology with regard to the estimation of national industry economic impacts.1
1 Also a result, EPS believes that the validity and findings of two older studies, referenced in the report, concerning two individual AMT programs’ operational costs and activity structures, are also called into question.

An Economic Analysis of the U.S. Rotary Wing Air Medical Transport Industry August 2014
Economic & Planning Systems, Inc. 2 Final Report
2. EXECUTIVE SUMMARY
Overv iew
Rotary wing air medical transport (AMT) is a substantial part of the larger AMT industry (which includes fixed-wing transport) and an integral part of our national emergency health care system. AMT services speed, optimize, and integrate the critical care received by patients from the start of their emergency through treatment at a hospital. In addition to providing valuable health benefits to patients, AMT makes a significant contribution to the economy by supporting quality jobs and generating spending on goods and services.
The health care industry employs millions of people in a variety of supporting sectors, including AMT. Moreover, the health care industry saw strong growth while total U.S. employment stagnated over the past decade. While many industries suffered substantial job losses during this period, health care added jobs at a rate of 2 percent per year (as did ambulance services at 4 percent per year).
This study details the economic benefit specifically of the rotary wing component of the AMT industry (hereinafter referred to as the “rotary wing industry” or the “industry”), including its spending, jobs, salaries and benefits, and contribution to Gross Domestic Product (GDP). This economic benefit includes the successive “rounds” of activity (also called the “ripple effect”) attributable to the industry’s operations and capital purchases. The study considers direct, indirect, and induced economic benefits.
Specifically, providing patient transports is the rotary wing industry’s direct economic activity, supporting staffed and contract jobs for pilots, nurses, paramedics, and other functions. Industries that supply goods or services to AMT operations, such as helicopter manufacturers, are characterized as indirect activity. Beyond that, induced economic activity results from employee spending on household goods and services.
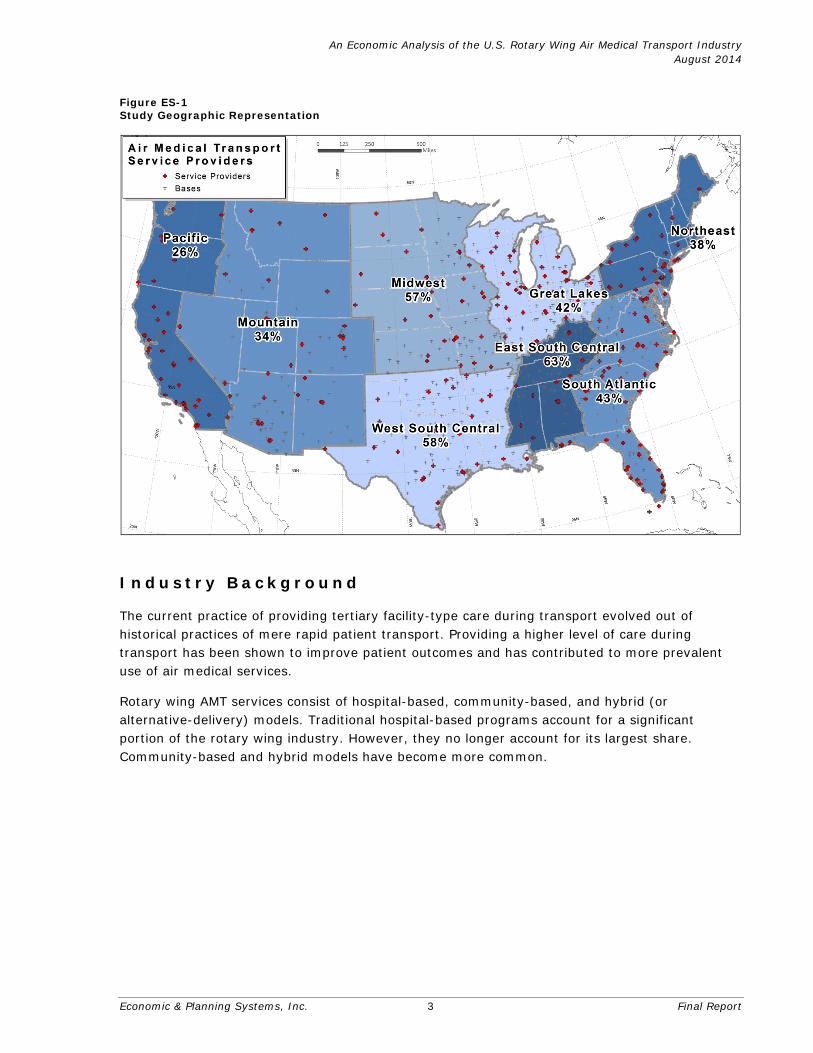
Data on operational costs, capital purchases, and program structures were collected through a nationwide survey of rotary wing providers. The results, illustrated in Figure ES-1, are also representative of the diversity of program types found throughout the U.S. Survey responses ranged from a representation of 26 percent of aircraft in the Pacific region to a representation of 63 percent of aircraft in East South Central.2
2 It is important to note that the percentages shown represent survey response rate by region, not air medical transport coverage by region.
An Economic Analysis of the U.S. Rotary Wing Air Medical Transport Industry August 2014
Economic & Planning Systems, Inc. 3 Final Report
Figure ES-1 Study Geographic Representation
Indus t ry Background
The current practice of providing tertiary facility-type care during transport evolved out of historical practices of mere rapid patient transport. Providing a higher level of care during transport has been shown to improve patient outcomes and has contributed to more prevalent use of air medical services.
Rotary wing AMT services consist of hospital-based, community-based, and hybrid (or alternative-delivery) models. Traditional hospital-based programs account for a significant portion of the rotary wing industry. However, they no longer account for its largest share. Community-based and hybrid models have become more common.

An Economic Analysis of the U.S. Rotary Wing Air Medical Transport Industry August 2014
Economic & Planning Systems, Inc. 4 Final Report
Rotary Wing Aircraft Trends
Figure ES-2 illustrates the growth in the AMT industry between 1980 and 2011, during which the industry added approximately eight new programs a year and grew from 39 to 929 rotary wing aircraft. While this study has not evaluated the statistical significance of the causal relationship between rural hospital closures and the increase in AMT service, according to a General Accounting Office study3,200 or more rural hospitals and more than 200 urban hospitals closed during the 1980s, and it has been cited that rural hospitals continued to close during the 1990s as well4. As such the increase in AMT service not only reflects a response to the degradation of availability of hospital care particularly in rural areas of the country, but an increasingly dispersed population, roadway congestion, and sprawling land use development.
Figure ES-2 Rotary Wing Patient Transport Trends, 1980-2011
39 231293
400
753
929
1350
200
400
600
800
1000
1980 1985 1990 1995 2000 2005 2011
Rotary W
ing Aircraft
[Note 1]: 1985 is interpolated from the data as the midpoint between 1980 and 1990.Source: Economic & Planning Systems
Annual Rotary Wing Aircraft Costs
Based on information collected through an industry survey, labor accounts for 56 percent of total annual costs, while other costs such as lease payments, fuel, and insurance account for 30 percent of spending, and average capital purchases account for the remaining 13 percent. Today, many rotary wing programs use contract services for a variety of functions, such as pilots, maintenance, program direction, or specialty care to achieve a range of budgetary goals.
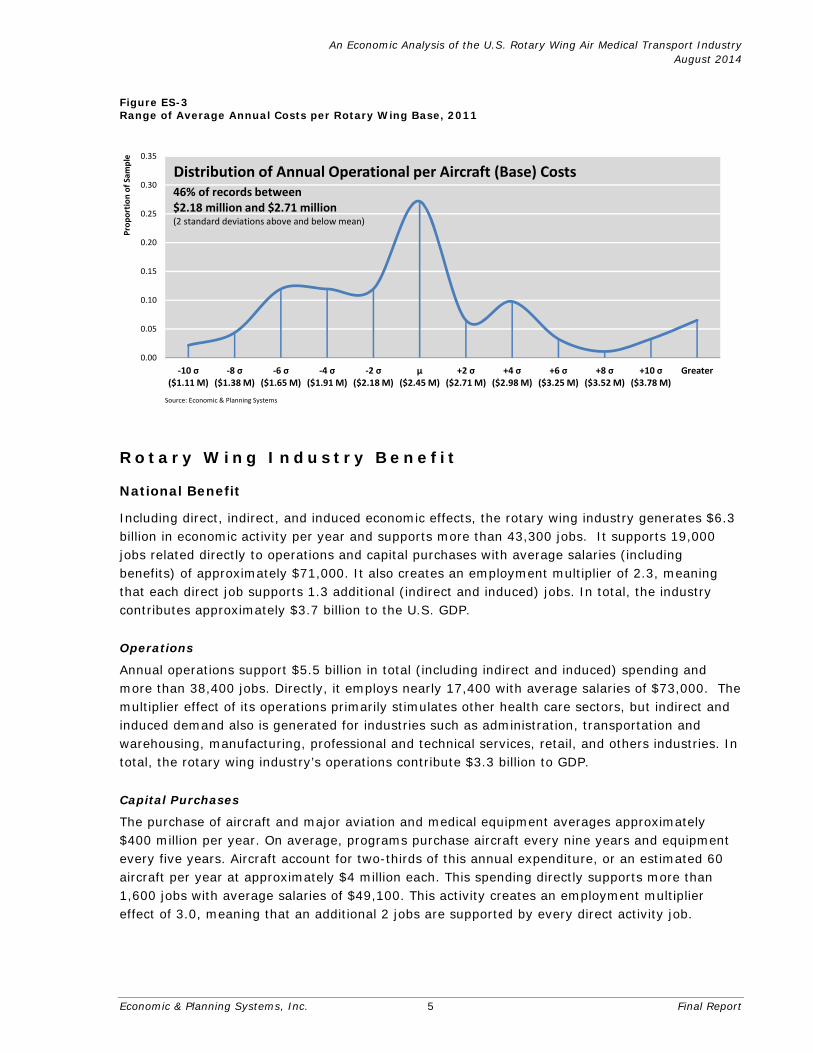
According to the 2011 survey results, annual average operational (not “fully-loaded”) costs per rotary wing aircraft base ranged between approximately $2.2 and $2.7 million, as illustrated in Figure ES-3, including operational and maintenance expenses, insurance, building and lease payments, and salaries, but excluding annualized capital purchases. While this range generally represents 46 percent of the survey results, annual per-rotary wing aircraft costs can exceed as much as $8.0 million per year because costs are highly dependent on the type of aircraft used, staffing types and levels, general business and operational model variations, level of administrative support, as well as regional economic factors.
3 General Accounting Office. Rural Hospitals: Federal Hospitals Should Target Areas Where Closures Would Threaten Access to Care. Report GAO/HRD-91-41, February 1991. 4 DesHarnais S, Reif S, Bernard S, Randolph R. Effects of Rural Hospital Closure on Access to Care: Data Analysis. Cecil G. Sheps Center for Health Services Research. University of North Carolina, Chapel Hill, 1998.
An Economic Analysis of the U.S. Rotary Wing Air Medical Transport Industry August 2014
Economic & Planning Systems, Inc. 5 Final Report
Figure ES-3 Range of Average Annual Costs per Rotary Wing Base, 2011
0.00
0.05
0.10
0.15
0.20
0.25
0.30
0.35
‐10 σ($1.11 M)
‐8 σ($1.38 M)
‐6 σ($1.65 M)
‐4 σ($1.91 M)
‐2 σ($2.18 M)
μ($2.45 M)
+2 σ($2.71 M)
+4 σ($2.98 M)
+6 σ($3.25 M)
+8 σ($3.52 M)
+10 σ($3.78 M)
Greater
Proportion of Sample
Distribution of Annual Operational per Aircraft (Base) Costs
Source: Economic & Planning Systems
46% of records between$2.18 million and $2.71 million(2 standard deviations above and below mean)
Ro ta ry Wing Indus t ry Bene f i t
National Benefit
Including direct, indirect, and induced economic effects, the rotary wing industry generates $6.3 billion in economic activity per year and supports more than 43,300 jobs. It supports 19,000 jobs related directly to operations and capital purchases with average salaries (including benefits) of approximately $71,000. It also creates an employment multiplier of 2.3, meaning that each direct job supports 1.3 additional (indirect and induced) jobs. In total, the industry contributes approximately $3.7 billion to the U.S. GDP.
Operations
Annual operations support $5.5 billion in total (including indirect and induced) spending and more than 38,400 jobs. Directly, it employs nearly 17,400 with average salaries of $73,000. The multiplier effect of its operations primarily stimulates other health care sectors, but indirect and induced demand also is generated for industries such as administration, transportation and warehousing, manufacturing, professional and technical services, retail, and others industries. In total, the rotary wing industry’s operations contribute $3.3 billion to GDP.
Capital Purchases
The purchase of aircraft and major aviation and medical equipment averages approximately $400 million per year. On average, programs purchase aircraft every nine years and equipment every five years. Aircraft account for two-thirds of this annual expenditure, or an estimated 60 aircraft per year at approximately $4 million each. This spending directly supports more than 1,600 jobs with average salaries of $49,100. This activity creates an employment multiplier effect of 3.0, meaning that an additional 2 jobs are supported by every direct activity job.
An Economic Analysis of the U.S. Rotary Wing Air Medical Transport Industry August 2014
Economic & Planning Systems, Inc. 6 Final Report
Regional Benefit
Economic benefits vary with urban and rural settings, operational scale, and local and regional employment industry composition. At a national level, nearly 8 jobs are created for every $1 million of direct industry spending. On average, each rotary wing aircraft is staffed directly with approximately 18.7 full- and part-time jobs (staffed or contracted labor), and each direct job generates demand for an additional 22.6 indirect and induced jobs—a total of 41.3 jobs per aircraft. Overall, the annual operation of each rotary wing aircraft supports total salaries and benefits of $2.6 million and $5.9 million in total spending.

Economic & Planning Systems, Inc. 7 21889-Final Report 082114
3. ECONOMIC FRAMEWORK
Rotary wing AMT services are a subcomponent of the larger air medical transport (AMT) services sector and part of the very large and growing health care industry. This chapter contains general trends in health care spending, U.S. employment–specifically health care jobs, population, and trends within AMT, specifically rotary wing AMT, programs.
Hea l th Care Spend ing
Health care job growth during the decade was supported by increases in health care spending. As illustrated in Figure 1, total spending increased at a rate of 6.3 percent per year from 2000 to 2011. The share that insurance represents (including private health insurance, Medicare, Medicaid, and others), has increased from 67 percent in 2000 to 73 percent by 2011. Expenditures for insurance have risen at an annual rate of more than 7 percent, and out-of-pocket expenditure on health care has increased at nearly 4.0 percent per year.
Figure 1 Historical Healthcare Spending
$0
$500
$1,000
$1,500
$2,000
$2,500
$3,000
$3,500
2000 2001 2002 2003 2004 2005 2006 2007 2008 2009 2010 2011
Spending in Billions ($)
Health Insurance
Investment
Public Health Activity
Other Third Party Payers and Programs
Out of pocket
Source: Centers for Medicare and Medicaid Services; Economic & Planning Systems
Emp loyment & P opu la t ion
Employment
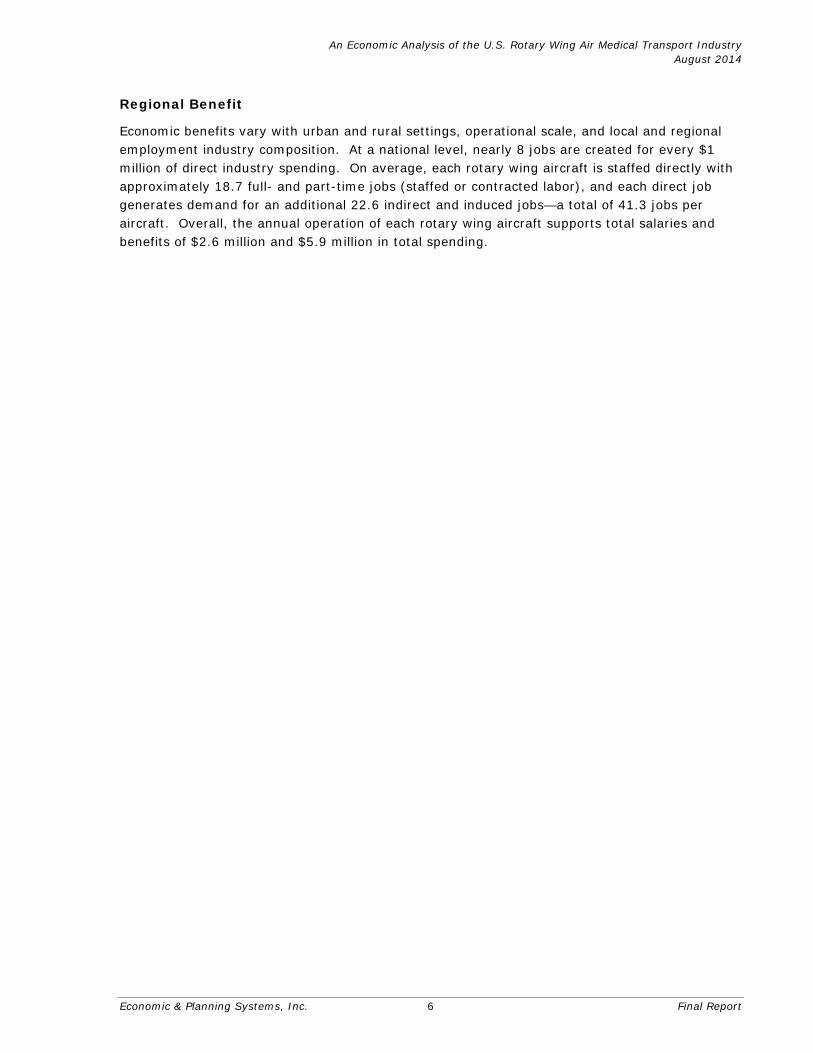
For 2011, the U.S. Bureau of Labor Statistics estimated there were approximately 130 million wage and salary positions in the United States, not including sole proprietors (Figure 2). Since employment peaked in 2007, the U.S. economy has sustained significant losses of manufacturing jobs (nearly 6 million), construction jobs (1 million), and information jobs (approximately 1 million). The housing boom and bust contributed to losses in construction, followed by a financial crisis, which precipitated losses in other industries.
An Economic Analysis of the U.S. Rotary Wing Air Medical Transport Industry August 2014
Economic & Planning Systems, Inc. 8 Final Report
Figure 2 U.S. Job Trends, 2000-2011
124
126
128
130
132
134
136
2000 2001 2002 2003 2004 2005 2006 2007 2008 2009 2010 2011
Total W
age & Salary Jobs (M
illions)
Source: Bureau of Labor Statistics; Economic & Planning Systems
129.9 million 129.4 million
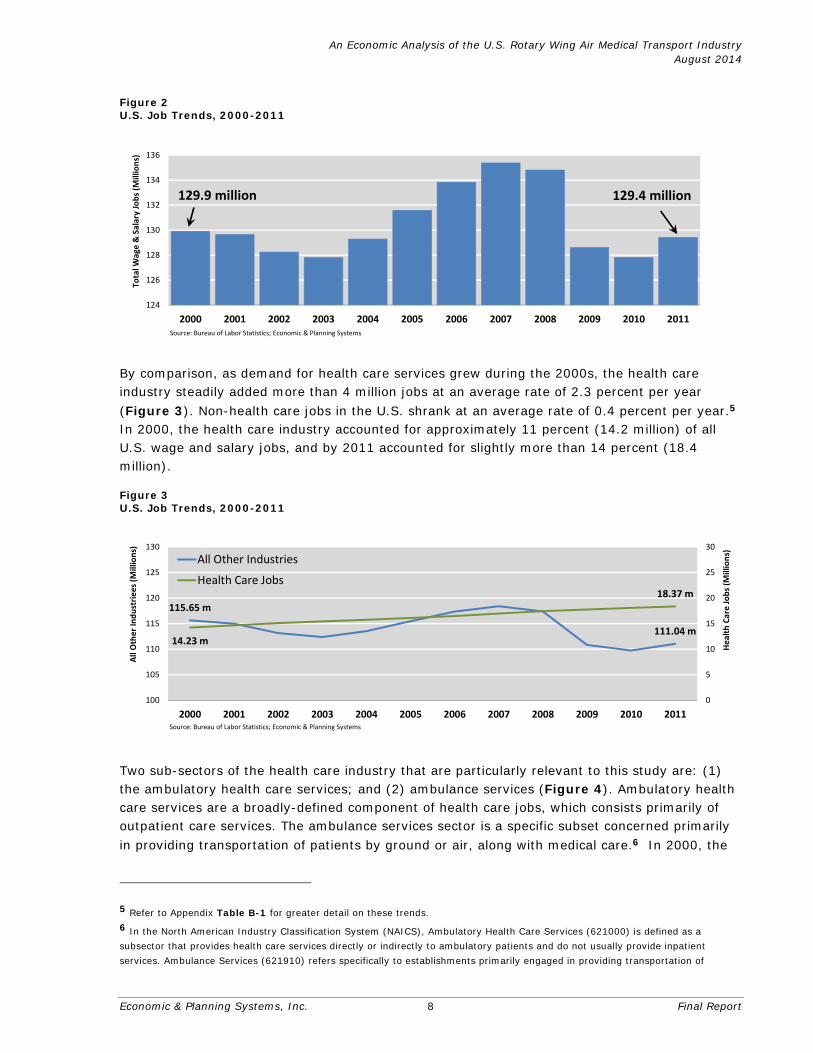
By comparison, as demand for health care services grew during the 2000s, the health care industry steadily added more than 4 million jobs at an average rate of 2.3 percent per year (Figure 3). Non-health care jobs in the U.S. shrank at an average rate of 0.4 percent per year.5 In 2000, the health care industry accounted for approximately 11 percent (14.2 million) of all U.S. wage and salary jobs, and by 2011 accounted for slightly more than 14 percent (18.4 million).
Figure 3 U.S. Job Trends, 2000-2011
115.65 m
111.04 m14.23 m
18.37 m
0
5
10
15
20
25
30
100
105
110
115
120
125
130
2000 2001 2002 2003 2004 2005 2006 2007 2008 2009 2010 2011Health Care Jobs (M
illions)
All Other Industriees (M
illions)
All Other Industries
Health Care Jobs
Source: Bureau of Labor Statistics; Economic & Planning Systems
Two sub-sectors of the health care industry that are particularly relevant to this study are: (1) the ambulatory health care services; and (2) ambulance services (Figure 4). Ambulatory health care services are a broadly-defined component of health care jobs, which consists primarily of outpatient care services. The ambulance services sector is a specific subset concerned primarily in providing transportation of patients by ground or air, along with medical care.6 In 2000, the
5 Refer to Appendix Table B-1 for greater detail on these trends. 6 In the North American Industry Classification System (NAICS), Ambulatory Health Care Services (621000) is defined as a subsector that provides health care services directly or indirectly to ambulatory patients and do not usually provide inpatient services. Ambulance Services (621910) refers specifically to establishments primarily engaged in providing transportation of

An Economic Analysis of the U.S. Rotary Wing Air Medical Transport Industry August 2014
Economic & Planning Systems, Inc. 9 Final Report
ambulatory health care services industry accounted for 30 percent (approximately 4.4 million) of all health care jobs, and by 2011 accounted for approximately 34 percent (approximately 6.3 million jobs). By comparison to general health care jobs, ambulatory health care services grew at an average rate of 3.3 percent per year over the decade, while other non-ambulatory services grew at 1.9 percent per year.
Figure 4 Ambulatory Health Care Services, 2000-2011
9,836,761
12,113,447
4,397,005
6,255,059
3,500,000
4,000,000
4,500,000
5,000,000
5,500,000
6,000,000
6,500,000
7,000,000
7,000,000
8,000,000
9,000,000
10,000,000
11,000,000
12,000,000
13,000,000
14,000,000
2000 2001 2002 2003 2004 2005 2006 2007 2008 2009 2010 2011
All Other Health Care Jobs
Ambulatory Health Care Services Jobs (621000)
Source: Bureau of Labor Statistics; Economic & Planning Systems
Ambulance services (North American Industry Classification System 621910) accounts for a very small portion (on average, approximately 2 percent) of the ambulatory health care services industry, but it grew by more than 60,000 jobs during the decade (Figure 5). On average, the ambulance services sector grew by 4.2 percent per year, adding more than 5,600 jobs per year.
Figure 5 Ambulance Services Trends, 2000-2011
4,397,005
6,255,059
108,776
170,569
80,000
100,000
120,000
140,000
160,000
180,000
2,000,000
3,000,000
4,000,000
5,000,000
6,000,000
7,000,000
2000 2001 2002 2003 2004 2005 2006 2007 2008 2009 2010 2011
Ambulatory Health Care Services (621000)
Ambulance Services (621910)
Source: Bureau of Labor Statistics; Economic & Planning Systems
patients by ground or air, along with medical care. For more detail of the definition of these subsectors, refer to Appendix A, “Industry Definition.”
An Economic Analysis of the U.S. Rotary Wing Air Medical Transport Industry August 2014
Economic & Planning Systems, Inc. 10 Final Report
Population
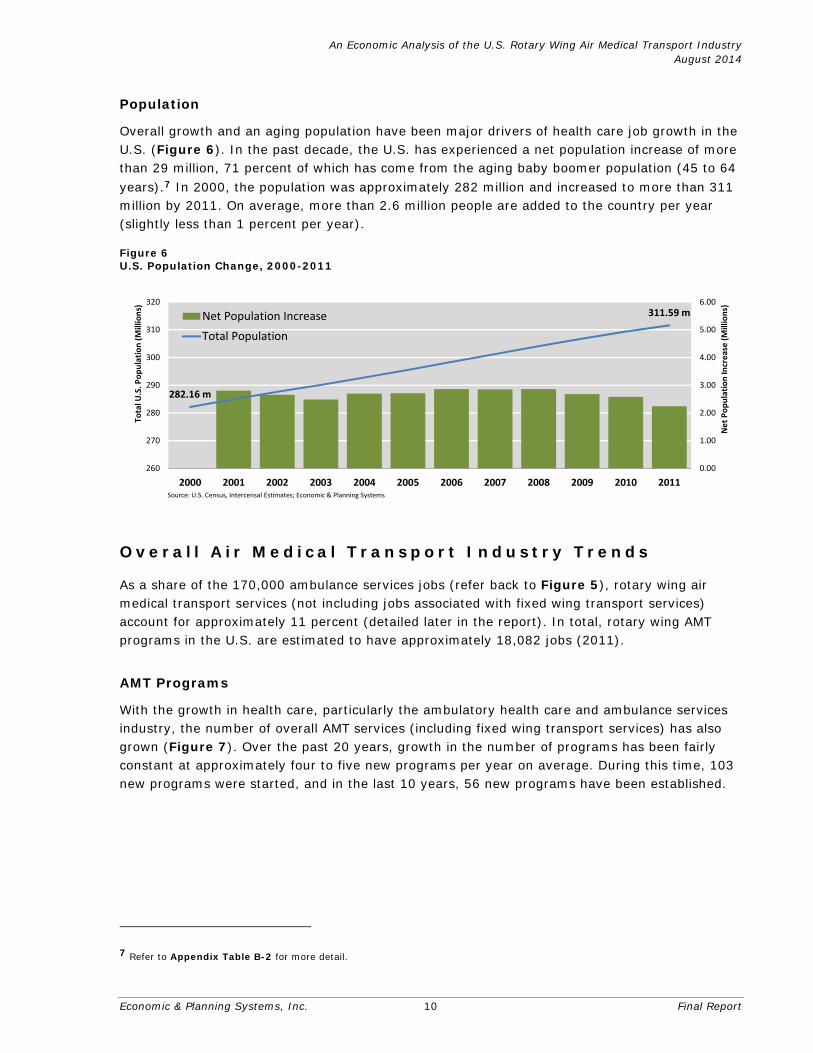
Overall growth and an aging population have been major drivers of health care job growth in the U.S. (Figure 6). In the past decade, the U.S. has experienced a net population increase of more than 29 million, 71 percent of which has come from the aging baby boomer population (45 to 64 years).7 In 2000, the population was approximately 282 million and increased to more than 311 million by 2011. On average, more than 2.6 million people are added to the country per year (slightly less than 1 percent per year).
Figure 6 U.S. Population Change, 2000-2011
282.16 m
311.59 m
0.00
1.00
2.00
3.00
4.00
5.00
6.00
260
270
280
290
300
310
320
2000 2001 2002 2003 2004 2005 2006 2007 2008 2009 2010 2011
Net Population In
crease (Millions)
Total U
.S. P
opulation (Millions)
Net Population Increase
Total Population
Source: U.S. Census, Intercensal Estimates; Economic & Planning Systems
Ove ra l l A i r M ed i ca l T ra nspor t Indus t ry T rends
As a share of the 170,000 ambulance services jobs (refer back to Figure 5), rotary wing air medical transport services (not including jobs associated with fixed wing transport services) account for approximately 11 percent (detailed later in the report). In total, rotary wing AMT programs in the U.S. are estimated to have approximately 18,082 jobs (2011).
AMT Programs
With the growth in health care, particularly the ambulatory health care and ambulance services industry, the number of overall AMT services (including fixed wing transport services) has also grown (Figure 7). Over the past 20 years, growth in the number of programs has been fairly constant at approximately four to five new programs per year on average. During this time, 103 new programs were started, and in the last 10 years, 56 new programs have been established.
7 Refer to Appendix Table B-2 for more detail.

An Economic Analysis of the U.S. Rotary Wing Air Medical Transport Industry August 2014
Economic & Planning Systems, Inc. 11 Final Report
Figure 7 Overall Air Medical Transport Programs, 1990-2011
0
5
10
15
20
25
30
0
50
100
150
200
250
300
1980
1981
1982
1983
1984
1985
1986
1987
1988
1989
1990
1991
1992
1993
1994
1995
1996
1997
1998
1999
2000
2001
2002
2003
2004
2005
2006
2007
2008
2009
2010
2011
New Programs Existing Programs
Source: Center for Transportation Injury Research, ADAMS database 2011; Economic & Planning Systems
Aircraft Trends
The overall AMT industry has evolved over time to offer increasing levels of tertiary facility-type care during transport.8 The capability to provide higher levels of care during transport has been shown to improve patient outcomes, and along with other factors–such as recent changes in the national healthcare system–have likely contributed to more prevalent use of rotary wing (and fixed wing) AMT services, and thus, an increase in the number of service providers.
Among rotary wing service providers in 1980, there were 39 rotary wing aircraft, and by 2011 that count had increased to 929 aircraft, an increase of 29 new aircraft per year (Figure 8). Among the factors contributing to this trend has been the expansion of the industry into previously unserved areas, particularly rural and remote parts of the country.
Figure 8 Historical Rotary Wing Aircraft Counts
39 231293
400
753
929
1350
200
400
600
800
1000
1980 1985 1990 1995 2000 2005 2011
Rotary W
ing Aircraft
[Note 1]: 1985 is interpolated from the data as the midpoint between 1980 and 1990.Source: Economic & Planning Systems
8 Judge T, McGinnis K, Nemitz B. Air Medical Services: Future Development as an Integrated Component of the Emergency Medical Services (EMS) System. Prehospital Emergency Care. 2007 Oct-Dec;11(4):353-68.

Economic & Planning Systems, Inc. 12 21889-Final Report 082114
4. ROTARY WING INDUSTRY STRUCTURE
This chapter provides a picture of the rotary wing industry’s composition and cost structure using information collected through a nationwide survey of all AMT programs (including those with fixed wing services). The primary data from the survey represent a full spectrum of program models, information on aircraft, program activity, staffing, and annual operational and capital purchases. It forms a solid platform on which to construct the economic benefit analysis in the following chapter.
Survey
The findings of this study are based on a nationwide survey to members and non-members of the Association of Air Medical Services (AAMS). EPS administered the survey to an estimated 230 programs in 2012 and conducted a targeted follow-up effort with hospital-based programs in early 2013. Follow-up efforts were made to improve the survey response rate. The survey research effort yielded 66 responses (29 percent response rate). To the greatest degree practicable, EPS conducted additional follow-up with respondents to clarify data reported.9 Some responses were excluded from the analysis due to insufficient or unintelligible reporting; the analysis is based on 44 of the 66 responses.10
Program Activity – The survey collected information on program type, ownership of aircraft (i.e. holder of FAA Part 135 Certificate), state(s) of operation, number of aircraft (rotary wing and fixed wing) and vehicles (ground ambulances), number of flight hours, loaded patient miles, patient transports, and payroll vs. contract staff (part-time and full-time). It also collected detailed annual operating and capital costs for the fiscal year 2011.11
Labor – This included contract costs, and wages and benefits for pilots, RNs, EMT-Ps, EMTs, aircraft technicians and mechanics, dispatch or air traffic controllers, and any other position (such as managerial positions, medical direction, respiratory therapists, etc.).
Non-labor – Expenditures included items for all lease payments (i.e. hangar, aircraft, and land lease payments, not including contract expenses), fuel, insurance, aircraft parts, medical supplies, maintenance and equipment update costs, training and development, annual depreciation, and other non-staffing expenditure.
Capital – This included information on the frequency and cost of purchases, such as aircraft, aviation and medical equipment, and any other equipment.
9 Entries in the surveys that appeared to be mistyped, inaccurate, or questionable were flagged for follow-up and efforts were made to contact the program director. Data in this analysis represent all corrections and refinements to data originally provided. 10 Reasons for not including responses include: incomplete responses; questionable information resulting in cost or staffing factor outliers. 11 Specifically, the flaws in these underlying cost and volume data make reliably reporting average cost per patient transport factors and average patient transports per aircraft factors impossible at the national and regional levels. As a result, EPS excluded these factors from the report and revised the methodology with regard to the estimation of industry economic impacts.
An Economic Analysis of the U.S. Rotary Wing Air Medical Transport Industry August 2014
Economic & Planning Systems, Inc. 13 Final Report
Survey Response by Region
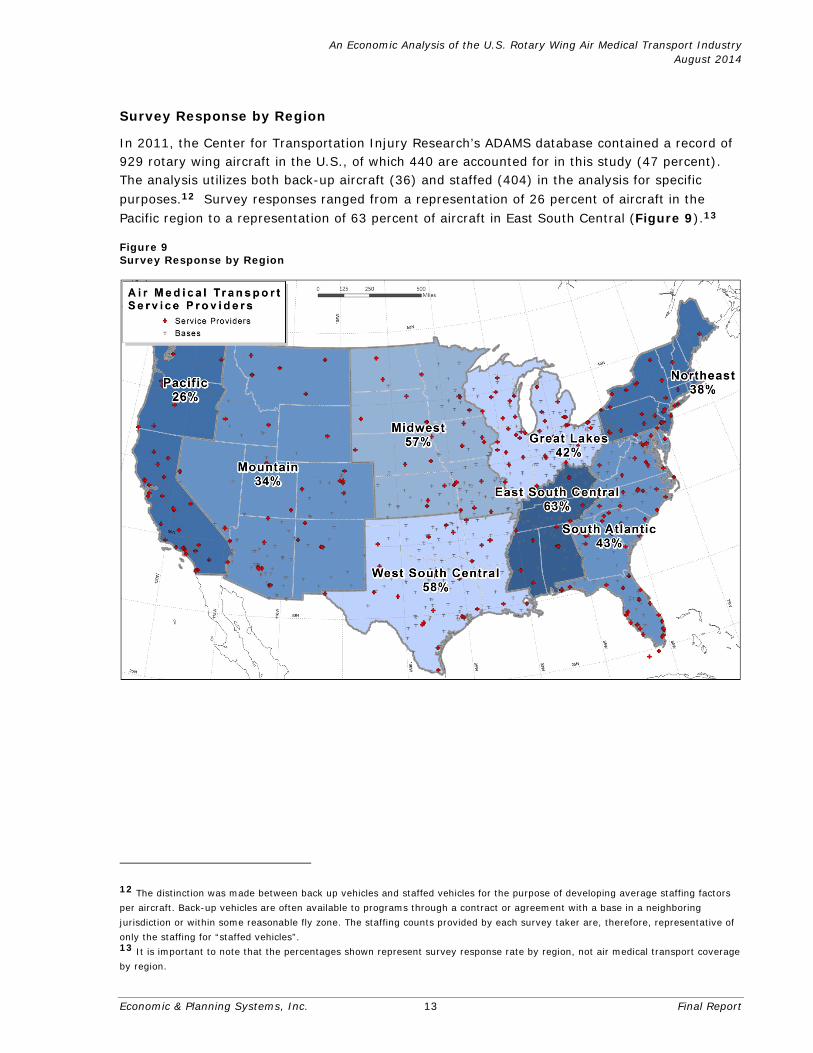
In 2011, the Center for Transportation Injury Research’s ADAMS database contained a record of 929 rotary wing aircraft in the U.S., of which 440 are accounted for in this study (47 percent). The analysis utilizes both back-up aircraft (36) and staffed (404) in the analysis for specific purposes.12 Survey responses ranged from a representation of 26 percent of aircraft in the Pacific region to a representation of 63 percent of aircraft in East South Central (Figure 9).13
Figure 9 Survey Response by Region
12 The distinction was made between back up vehicles and staffed vehicles for the purpose of developing average staffing factors per aircraft. Back-up vehicles are often available to programs through a contract or agreement with a base in a neighboring jurisdiction or within some reasonable fly zone. The staffing counts provided by each survey taker are, therefore, representative of only the staffing for “staffed vehicles”. 13 It is important to note that the percentages shown represent survey response rate by region, not air medical transport coverage by region.

An Economic Analysis of the U.S. Rotary Wing Air Medical Transport Industry August 2014
Economic & Planning Systems, Inc. 14 Final Report
Program Scale
Responses came from programs in 40 states representative of different scales of operation. A majority of programs (33) operate in a single state, while the remaining seven operate in two or more states. Nearly half of all programs operate between two and five rotary wing aircraft per state (Figure 10). Less than 30 percent operate a single aircraft, but more than 20 percent operate six or more rotary wing aircraft per state.
Figure 10 Rotary Wing Aircraft per State per Program
11 programs
19 programs
7 programs 2 programs
0
5
10
15
20
1 aircraft per state 2 to 5 6 to 10 More than 10 aircraft per stateSource: Economic & Planning Systems
Types of Programs
A wide variety of AMT program models operate across the U.S. today. Whereas traditional hospital-based programs still account for a portion of the rotary wing industry, they no longer account for its largest portion. Community-based models and hybrids (or alternative-delivery models) have become more prevalent, where, for example, aircraft under these business models may serve any number of regional facilities and in some cases, may serve a consortium of facilities. Under these different program models, ownership structures differ, staffing structures differ, and, as a result, cost structures can differ.
Community-Based Model – Many of the bases to be established in the last decade can be described as community-based programs, i.e. not associated with a particular hospital or facility. Often they are located in independent locations, such as airports or stand-alone locations.
Hospital-Based Model – These are the most traditional of programs, though there are currently multiple models within this program type. Usually, a hospital-based aircraft serves exclusively its parent hospital or consortium of associated regional hospitals. In terms of staffing, the most traditional hospital-based program employ their medical staff based at the hospital, but not necessarily their pilots or mechanics/technicians. Some programs may own and operate their aircraft, but may still not employ their own pilots. In other cases, the medical crew may not be employed by the hospital.
Alternative Delivery Model – Sometimes called “hybrid” models, these programs are commonly a cross between hospital- and community-based models, and include non-profits and government entities, as well as for-profit models. Some describe themselves as consortiums of hospitals in multiple local jurisdictions, i.e. not aligned with a particular facility. With such a program, a patient could be transported to the medically appropriate or
An Economic Analysis of the U.S. Rotary Wing Air Medical Transport Industry August 2014
Economic & Planning Systems, Inc. 15 Final Report
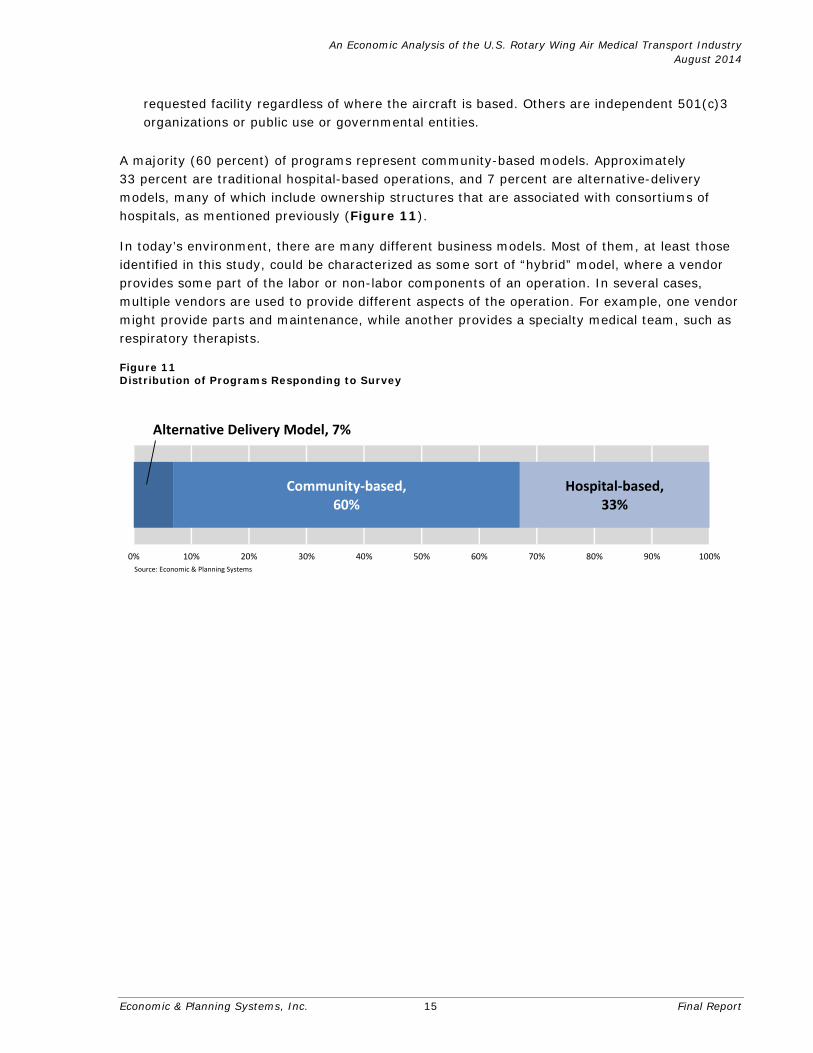
requested facility regardless of where the aircraft is based. Others are independent 501(c)3 organizations or public use or governmental entities.
A majority (60 percent) of programs represent community-based models. Approximately 33 percent are traditional hospital-based operations, and 7 percent are alternative-delivery models, many of which include ownership structures that are associated with consortiums of hospitals, as mentioned previously (Figure 11).
In today’s environment, there are many different business models. Most of them, at least those identified in this study, could be characterized as some sort of “hybrid” model, where a vendor provides some part of the labor or non-labor components of an operation. In several cases, multiple vendors are used to provide different aspects of the operation. For example, one vendor might provide parts and maintenance, while another provides a specialty medical team, such as respiratory therapists.
Figure 11 Distribution of Programs Responding to Survey
Community‐based, 60%
Hospital‐based, 33%
0% 10% 20% 30% 40% 50% 60% 70% 80% 90% 100%
Source: Economic & Planning Systems
Alternative Delivery Model, 7%

An Economic Analysis of the U.S. Rotary Wing Air Medical Transport Industry August 2014
Economic & Planning Systems, Inc. 16 Final Report
Other Characteristics
The survey instrument included several questions regarding other general characteristics of programs (Table 1). From a funding perspective, programs identified whether they received any public funding. Only a handful identified that this was among their sources of funds (7 percent of programs overall and none of the community-based programs). Programs also identified whether they owned their own aircraft, and whether they held the FAA Part 135 certificate. More than three-quarters of programs indicated owning their aircraft with community-based programs at nearly 90 percent, but the portion of those programs also holding Part 135 certificates was usually less. Except for community-based programs, where all own their aircraft and hold the Part 135 certificates, only 75 percent and 20 percent of alternative-delivery models and hospital-based models, respectively, also hold their Part 135 certificates.
Table 1 General Statistics by Rotary Wing Program Type
Responses
Funding from Public Revenue
(i.e. taxes)Programs Owning
Aircraft Part 135 Holder
Rotary Wing Program TypesAlternative Delivery Model 6 17% 67% 50%Community-based 9 0% 89% 89%Hospital-based 26 8% 77% 15%Total 41 7% 78% 37%
Source: Economic & Planning Systems
H:\21889-Economic Impact of Air M edical Industry\Data\[21889-Survey DATA-M arch 2013.xlsx] t1.9_Other_Quest ions (2)
Programs Responding "Yes"
Staffing Models
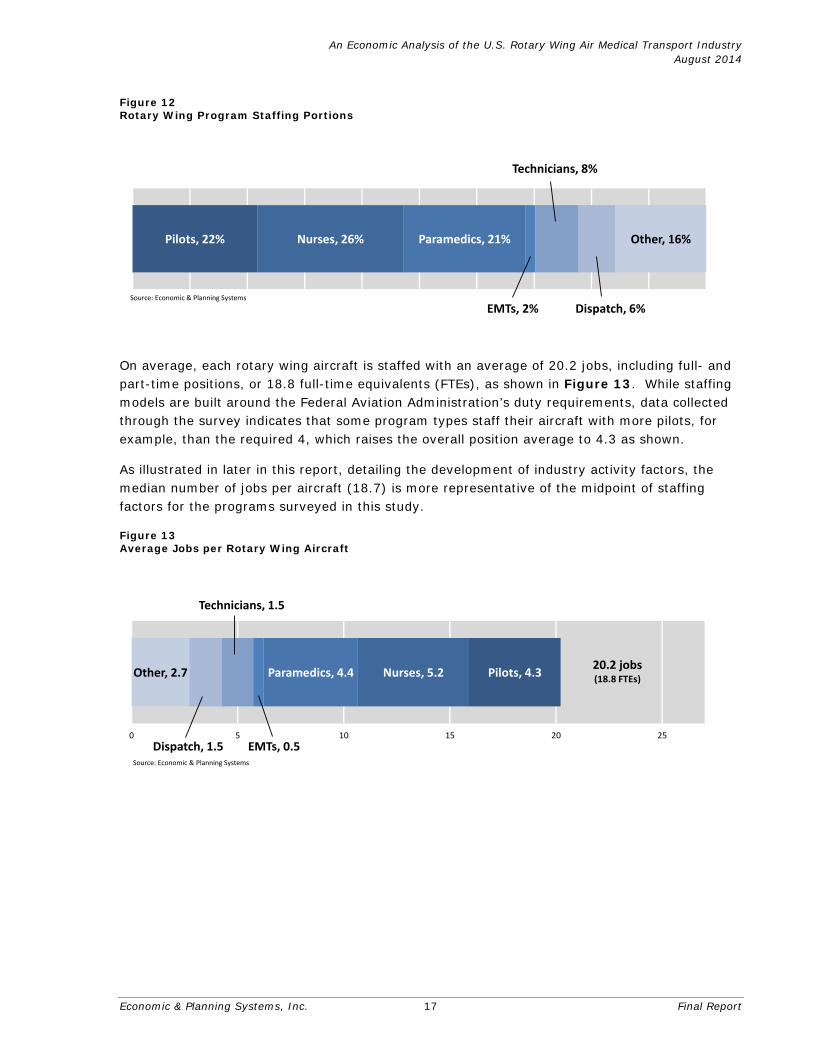
The survey represents 8,570 jobs (full-time and part-time, as well as payroll versus contract positions) and 8,176 full-time equivalents.14 The following categories of positions were decided as most representative of an air medical transport program: pilots, nurses, paramedics, EMTs, aircraft technicians or mechanics, dispatch or air traffic control, other.15 Nurses, pilots, and paramedics generally comprise the largest portion of aircraft staffing (Figure 12).
14 Defined as the sum of full-time jobs and a factor of 0.5 part-time positions. See also Appendix Table B-3. 15 Can include management, administrative support, program direction, flight director, or other medical personnel, such as respiratory therapists.
An Economic Analysis of the U.S. Rotary Wing Air Medical Transport Industry August 2014
Economic & Planning Systems, Inc. 17 Final Report
Figure 12 Rotary Wing Program Staffing Portions
Pilots, 22% Nurses, 26% Paramedics, 21%
EMTs, 2%
Technicians, 8%
Dispatch, 6%
Other, 16%
Source: Economic & Planning Systems
On average, each rotary wing aircraft is staffed with an average of 20.2 jobs, including full- and part-time positions, or 18.8 full-time equivalents (FTEs), as shown in Figure 13. While staffing models are built around the Federal Aviation Administration’s duty requirements, data collected through the survey indicates that some program types staff their aircraft with more pilots, for example, than the required 4, which raises the overall position average to 4.3 as shown.
As illustrated in later in this report, detailing the development of industry activity factors, the median number of jobs per aircraft (18.7) is more representative of the midpoint of staffing factors for the programs surveyed in this study.
Figure 13 Average Jobs per Rotary Wing Aircraft
Other, 2.7
Dispatch, 1.5
Technicians, 1.5
EMTs, 0.5
Paramedics, 4.4 Nurses, 5.2 Pilots, 4.3
0 5 10 15 20 25
Source: Economic & Planning Systems
20.2 jobs(18.8 FTEs)

An Economic Analysis of the U.S. Rotary Wing Air Medical Transport Industry August 2014
Economic & Planning Systems, Inc. 18 Final Report
As for contract labor, programs contract for a variety of staffing needs, though typically for pilots and mechanics. Programs in this study also indicated they contract for medical direction, aviation leadership, management, specialty teams (such as respiratory therapists), nurses, paramedics, and dispatch services. Of the 28 programs that identified themselves as utilizing contract services, 18 of them have a contract that covers pilots (or aviation staff), mechanics and maintenance costs (including aircraft parts).
Opera t iona l C os ts
Annual operational costs of rotary wing programs include labor, the purchase of goods and services (non-labor), and capital purchases.16 Information presented in this section was gathered from each program in aggregate and apportioned by state of activity and delineated by type of aircraft operations. It was anticipated that estimating costs geographically (for those operations serving multiple states) would be too difficult. (A full description of the methodology is found in Appendix B).
Operational costs are divided into two major categories. Labor, a fairly fixed component of operational costs, accounts for the largest part of a program’s budget—on average, 57 percent (Figure 14). Non-labor (e.g. lease payments, fuel, insurance, etc.) accounts for 30 percent, and annual average capital purchases account for the remaining 13 percent. In total, operational costs for the 44 rotary wing programs responding was more than $1.4 billion.17
Figure 14 Annual Rotary Wing Program Cost Proportions
$770,003,737 $421,252,825 $185,107,013
0% 10% 20% 30% 40% 50% 60% 70% 80% 90% 100%
Labor Non‐Labor CapitalSource: Economic & Planning Systems
Regional Cost Variation
This section highlights some features of a regional analysis of the data collected to validate its utility in applying the underlying labor and non-labor cost information to the entire U.S. rotary wing AMT industry later in the report. The following two charts illustrate an evaluation of the variation that exists between regional labor and non-labor costs and illustrate whether these variations comport to independent measures of regional costs. The basis for the analysis is the reality that operational costs can vary regionally depending on availability of labor, production of goods, and the availability of services. The analysis depicts the relative robustness of the data collected from a regional perspective.
16 Except for a question on the survey to understand whether a program is funded in part by public revenue sources, this study did not collect information on charges per transport or any other revenue source. 17 Does not include bad debt or depreciation.

An Economic Analysis of the U.S. Rotary Wing Air Medical Transport Industry August 2014
Economic & Planning Systems, Inc. 19 Final Report
Labor Cost Variation
Salary information provided by individual programs throughout the U.S. generally clustered around averages for each position (i.e. pilots, nurses, mechanics, etc.). Some regional variations existed; however, to ensure these variations were reasonable, regional wages and benefits averages were evaluated using a correlation test against regional average wage data from the U.S. Bureau of Labor Statistics (BLS).18 For example, pilot wages and benefits, which correlate well to BLS averages, reveal an acceptable degree of variation between labor rates (Figure 15).19
Figure 15 Average Rotary Wing Pilot Salaries and Regional Labor Costs
East South Central
Great Lakes
Midwest
Mountain
Northeast
Pacific
South Atlantic
West South Central
Overall U.S.
R² = 0.8329
$35,000
$40,000
$45,000
$50,000
$55,000
$80,000 $85,000 $90,000 $95,000 $100,000 $105,000 $110,000 $115,000 $120,000
Average AnnualWages
for NAICS 62(Health Care) Jobs
Average Annual Wages & Benefitsfor Pilots
Source: Bureau of Labor Statistics; Economic & Planning SystemsCorrelation Coefficient: 0.92
P‐value = 0.0014
Non-Labor Costs
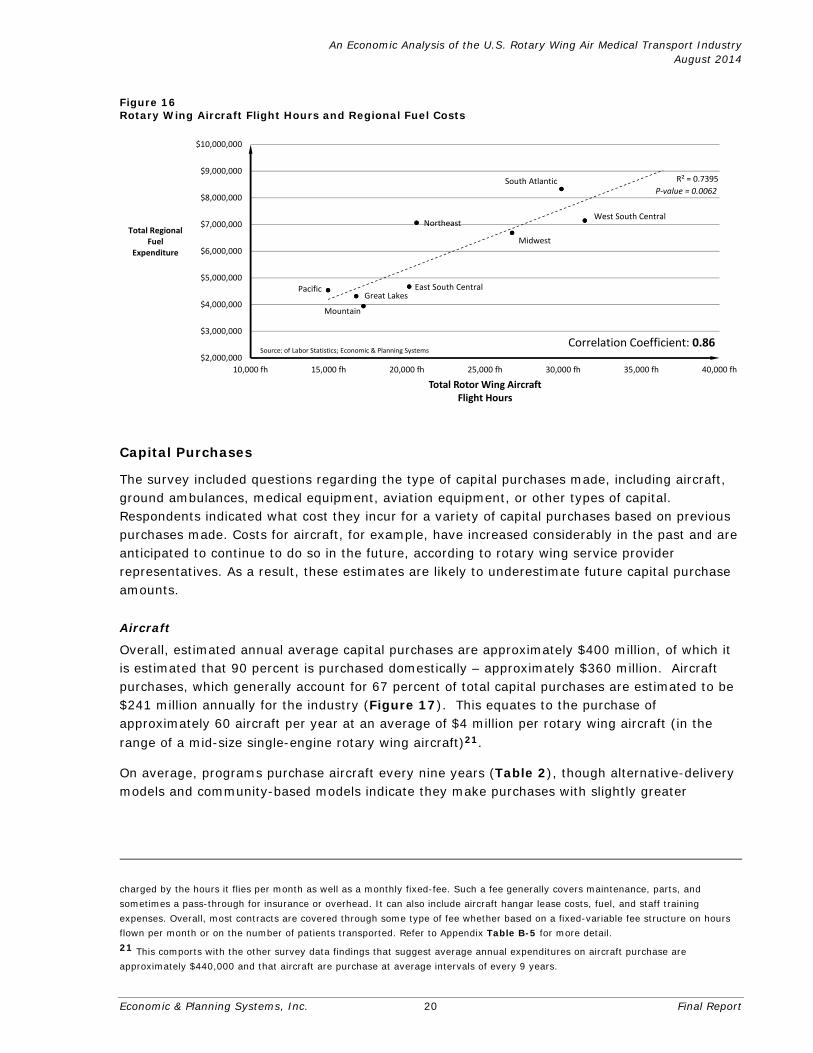
Similarly, there are variations between regional cost averages for non-labor aspects of operations. As with labor costs, while each component is clustered around an average, there is variation that can be evaluated against other metrics to ensure reasonableness of variation. For each component of non-labor cost (e.g. fuel, insurance, aircraft parts, medical supplies, etc.), metrics such as flight activity, hours flown, loaded patient miles, and patient transports were used to measure linearity between regional cost averages and program statistics. As an example, there is a relative linearity between total regional fuel costs and total regional flight hours (Figure 16). The correlation here is strong, although some variation here is likely due also to the scale of contracts by which programs purchase fuel.20
18 The correlation coefficient, which ranges from 0 to 1, is used to gauge how well a set of values (pilot earnings in this example) fall in line with independent values (regional salaries). The closer the coefficient is to 1, the greater the positive correlation. 19 In the event that a program contracted for pilots and exact expenditure amounts for contracted positions were unavailable, program directors were either contacted to identify average salaries for these positions or regional industry averages for such positions were applied using secondary sources. The Critical Care Transport Workplace and Salary Survey for 2011 and 2012 were used to identify benchmark salary ranges, as well as NAICS Industry 62 (Health Care and Social Assistance). Benefits are estimated as 25 percent of total wages. Refer to Appendix Table B-4 for more detail. 20 Further variation in this and other non-labor costs is the result of a wide variety of methods by which programs are charged for contracts by vendors. Many programs have some variation on the “power-by-the-hour” fee structure, whereby the program is
An Economic Analysis of the U.S. Rotary Wing Air Medical Transport Industry August 2014
Economic & Planning Systems, Inc. 20 Final Report
Figure 16 Rotary Wing Aircraft Flight Hours and Regional Fuel Costs
East South CentralGreat Lakes
Midwest
Mountain
Northeast
Pacific
South Atlantic
West South Central
R² = 0.7395
$2,000,000
$3,000,000
$4,000,000
$5,000,000
$6,000,000
$7,000,000
$8,000,000
$9,000,000
$10,000,000
10,000 fh 15,000 fh 20,000 fh 25,000 fh 30,000 fh 35,000 fh 40,000 fh
Total RegionalFuel
Expenditure
Total Rotor Wing AircraftFlight Hours
Source: of Labor Statistics; Economic & Planning SystemsCorrelation Coefficient: 0.86
P‐value = 0.0062
Capital Purchases
The survey included questions regarding the type of capital purchases made, including aircraft, ground ambulances, medical equipment, aviation equipment, or other types of capital. Respondents indicated what cost they incur for a variety of capital purchases based on previous purchases made. Costs for aircraft, for example, have increased considerably in the past and are anticipated to continue to do so in the future, according to rotary wing service provider representatives. As a result, these estimates are likely to underestimate future capital purchase amounts.
Aircraft
Overall, estimated annual average capital purchases are approximately $400 million, of which it is estimated that 90 percent is purchased domestically – approximately $360 million. Aircraft purchases, which generally account for 67 percent of total capital purchases are estimated to be $241 million annually for the industry (Figure 17). This equates to the purchase of approximately 60 aircraft per year at an average of $4 million per rotary wing aircraft (in the range of a mid-size single-engine rotary wing aircraft)21.
On average, programs purchase aircraft every nine years (Table 2), though alternative-delivery models and community-based models indicate they make purchases with slightly greater
charged by the hours it flies per month as well as a monthly fixed-fee. Such a fee generally covers maintenance, parts, and sometimes a pass-through for insurance or overhead. It can also include aircraft hangar lease costs, fuel, and staff training expenses. Overall, most contracts are covered through some type of fee whether based on a fixed-variable fee structure on hours flown per month or on the number of patients transported. Refer to Appendix Table B-5 for more detail. 21 This comports with the other survey data findings that suggest average annual expenditures on aircraft purchase are approximately $440,000 and that aircraft are purchase at average intervals of every 9 years.

An Economic Analysis of the U.S. Rotary Wing Air Medical Transport Industry August 2014
Economic & Planning Systems, Inc. 21 Final Report
frequency (8.0 and 7.3 years respectively).22 Hospital-based programs, on the other hand, purchase aircraft an average of every 10.3 years.
Figure 17 Estimated Annual Capital Purchases
$400,018,263$360,016,437$241,211,012
$0 $50,000,000 $100,000,000 $150,000,000 $200,000,000 $250,000,000 $300,000,000 $350,000,000 $400,000,000 $450,000,000 $500,000,000
Aircraft Domestic Purchase Component Estimated Annual Capital PurchaseSource: Economic & Planning Systems
Other Capital Purchase
Some programs indicated major capital purchases were made infrequently, e.g. every 20 years or more, and others indicated purchases as frequently as once a year. As with operational costs, the magnitude and frequency of capital purchases are reflective of many factors, such as the scale and type of operation and geographic setting.
A much smaller portion of the survey respondents indicated they purchased ground ambulances. For those that did, the average frequency was slightly less than every five years. Here, there was little variation between hospital-based and community-based programs, but alternative delivery models indicated purchase of ground ambulances less frequently.23 The purchase of medical equipment had the least amount of divergence in periodicity, averaging approximately every five years.
Table 2 Frequency of Capital Purchase
Aircraft AmbulancesMedical
EquipmentAviation
Equipment Other
Average Frequency Every 9.0 yrs Every 4.7 yrs Every 5.1 yrs Every 4.3 yrs Every 3.8 yrs
FrequencyEvery 1 to 4 years 10% 40% 40% 40% 40%Every 5 to 9 years 30% 60% 53% 30% 30%Every 10 to 14 years 40% 0% 7% 30% 30%Every 15 or more years 20% 0% 0% 0% 0%Total 100% 100% 100% 100% 100%
Source: Economic & Planning Systems
H:\21889-Economic Impact of Air M edical Industry\Data\[21889-Survey DATA-M arch 2013.xlsx]F.5 Table (2)
Capital Purhcase Category
22 These averages are highly influenced by the formation rate of programs described as Alternative Delivery and Community-Based models. As such, these programs seem to have been purchasing aircraft with greater frequency than hospital-based programs. 23 The data are too thin here to be conclusive on the periodicity of ground ambulance purchase.

An Economic Analysis of the U.S. Rotary Wing Air Medical Transport Industry August 2014
Economic & Planning Systems, Inc. 22 Final Report
Indus t ry Ac t i v i t y Fac to rs
The rotary wing industry’s primary (or “direct”, as referred to in the following sections) activity is defined as transporting patients with aircraft and supporting jobs per aircraft. The cost of providing this service is defined as the industry’s direct spending, also detailed in the following section, which includes labor and non-labor costs, such as management, administration, accounting, legal, maintenance, and capital purchases.
This section presents information regarding the cost of the industry’s direct spending, which is used to calibrate industry activity inputs to the economic impact analysis. These metrics are estimated as ranges of costs to account for the variety and differences in programs and geographies represented by the survey data, as well as the distribution of program types, levels of service, and the variations in program ownership structures. Specifically, ranges of direct operational costs were determined on a per rotary wing aircraft (or per base) basis.
Direct Spending (Output)
Annual operational costs per rotary wing aircraft base generally ranges between $2.2 million and $2.7 million, including operations and maintenance, insurance, building and lease payments, and salaries, but excluding the costs of annualized capital purchases, as illustrated in the distribution of aggregated data presented in Figure 1824. While on average, annual operational costs per aircraft are approximately $2.45 million, annual operational costs can exceed as much as $8.0 million per aircraft per year because they are highly dependent on the type of aircraft used, staffing types and levels, general business and operational model variations, level of administrative support, as well as regional economic factors.
Using this cost information as the basis for extrapolation, it is estimated that total annual direct spending (output) for the rotary wing industry is approximately $2.28 billion25, ranging between $2.18 billion and $2.52 billion. (Note: This estimate excludes bad debt and depreciation.) As a point of comparison, in 1991, total revenues (not costs) for the industry (rotary and fixed wing aircraft) were estimated to be approximately $422 million (in 2011 dollars).26
24 The range defined here reflects a distribution of annual operational costs that are not normally distributed around the mean, as are data which fit a conventional Bell curve. The distribution of annual costs presented here reflect not only the broad spectrum of program types but also the inconsistency among programs’ operational efficiencies and scale, particularly given that programs responding ranged from single aircraft programs to multi-state operations. 25 Based on a total of 929 rotary wing aircraft in the U.S. in 2011. 26 Weil, Thomas P: Health care reform and air medical transport services. Journal of Emergency Medicine. 1995; 13:381-387. At the time, there were significantly fewer aircraft operating.

An Economic Analysis of the U.S. Rotary Wing Air Medical Transport Industry August 2014
Economic & Planning Systems, Inc. 23 Final Report
Figure 18 Distribution of Annual Base (per Aircraft) Operational Costs
0.00
0.05
0.10
0.15
0.20
0.25
0.30
0.35
‐10 σ($1.11 M)
‐8 σ($1.38 M)
‐6 σ($1.65 M)
‐4 σ($1.91 M)
‐2 σ($2.18 M)
μ($2.45 M)
+2 σ($2.71 M)
+4 σ($2.98 M)
+6 σ($3.25 M)
+8 σ($3.52 M)
+10 σ($3.78 M)
Greater
Proportion of Sample
Distribution of Annual Operational per Aircraft (Base) Costs
Source: Economic & Planning Systems
46% of records between$2.18 million and $2.71 million(2 standard deviations above and below mean)
Annual costs associated with capital purchases reflect a variety of factors, including the age of the program (i.e. the extent of its existing capital and equipment), the scale of the program (i.e. the number of bases), and the operational or ownership structure of the program (i.e. whether its pilots and/or aircraft operations are contracted). Furthermore, each type of capital purchase, as detailed in the previous chapter, occurs at different intervals. For example, aircraft are generally purchased every 9 years, according to data collected through this survey. Other aviation equipment is purchased every 5 years, for example.
As such, the aggregated survey results indicate that the average annual average capital purchase amount per base is approximately $750,000 per year (illustrated in Figure 19)27. As illustrated, 90 percent of programs spend less than this amount per year, whereas the median annual average capital purchase amount is approximately $410,000, a figure more representative of the industry’s capital purchase activity. Using this cost information as the basis for extrapolation, it is estimated that total annual direct spending (output) related to capital purchases is approximately $444.9 million, ranging between $192.9 million and $697.0 million.
27 This amount is weighted according to the number of rotary wing aircraft/bases a program has, as well as how frequently each type of capital purchase is made.

An Economic Analysis of the U.S. Rotary Wing Air Medical Transport Industry August 2014
Economic & Planning Systems, Inc. 24 Final Report
Figure 19 Distribution of Annual Average Capital Purchases per Base
0
0.1
0.2
0.3
0.4
0.5
0.6
‐4 σ($208,000)
‐2 σ($479,000)
μ($750,000)
+2 σ($1.02 M)
+4 σ($1.29 M)
Greater
Proportion of Sample
Distribution of Average Annual Capital Purchases per Aircraft (Base)
Source: Economic & Planning Systems
90% of records between$208,000 and $750,000(4 standard deviations below mean to mean)
Direct Industry Employment
Based on the information collected from the survey, rotary wing aircraft are staffed with an average of 20.2 jobs per aircraft, as illustrated in Figure 20. The median jobs per aircraft, however, is 18.7, a number more accurately representative of the midpoint of the distribution. Using the median, it is estimated that the entire industry has approximately 17,400 full- and part-time employees.
Figure 20 Distribution of Jobs per Aircraft
0
0.05
0.1
0.15
0.2
0.25
0.3
0.35
‐10 σ(13.0)
‐8 σ(14.5)
‐6 σ(15.9)
‐4 σ(17.3)
‐2 σ(18.8)
μ(20.2)
+2 σ(21.7)
+4 σ(23.1)
+6 σ(24.5)
+8 σ(26.0)
+10 σ(27.4)
Greater
Proportion of Sample
Distribution of Jobs per Aircraft (Base)
Source: Economic & Planning Systems
47% of records between17.3 jobs and 20.2 jobs(4 standard deviations below mean to the mean)
Median jobs per Aircraft = 18.7

Economic & Planning Systems, Inc. 25 21889-Final Report 082114
5. ROTARY WING INDUSTRY BENEFIT
The rotary wing industry is an integral part of the national emergency health care system. Its services speed, optimize, and integrate the critical care received by patients from the start of their emergency through treatment at a hospital. In addition to providing valuable health benefits to patients, the industry makes a significant contribution to the economy by supporting quality jobs and generating spending on goods and services.
The economic benefits of this industry are presented in this chapter in terms of its direct, indirect, and induced economic activity. The benefits are described at a national and regional level, providing guiding information about interpreting the findings at a more localized level.
Def in i t i ons
Economic Multiplier Effect
The basic concept of a “multiplier effect” or “ripple effect” is that an initial purchase of a good or service (i.e. a patient transport) generates additional economic activity associated with spending on upstream suppliers (inputs to production) and employee household spending. For example, demand for a patient transport generates demand for purchase of fuel for aircraft, which in turn generates demand for petroleum production, as well as oil and gas exploration. In addition, demand for household purchases (e.g. groceries, clothing, housing, etc.) is generated by the wages and benefits of employee households.
The “direct benefit” is the value of inputs (i.e. labor and non-labor costs) purchased by the final demand industry.
The “indirect benefit” is the value of inputs (i.e. also labor and non-labor costs) purchased by supporting industries.
The “induced benefit” is the value of goods and services purchased by all workers whose wages and benefits are affected by a change in final demand to the industry.
Economic Effects
Economic effects are expressed in multiple terms, such as output (i.e., sales or spending), earnings (salaries plus employer-paid benefits, including proprietor income), employment (jobs), and value-added (equivalent to GDP).
Output – This is the sum of all value-added and intermediate inputs, which are goods and services used by an industry to produce output.
Wages and Benefits – This is the wages and salaries of employees, including employment benefits paid by the employer.
Employment – This includes the number of full- and part-time jobs.
Value-Added – This is comparable to Gross Domestic Product (GDP). It includes the total value of income generated from production, employee compensation, payments to government (taxes), and measures of profit or return on investment.
An Economic Analysis of the U.S. Rotary Wing Air Medical Transport Industry August 2014
Economic & Planning Systems, Inc. 26 Final Report
Tota l E conom ic Bene f i t
The operational and capital purchase activity of the rotary wing industry nationwide is an integral part of health care and social services. While a small portion (19,000 direct jobs related to operations and capital purchases) of the overall health care industry, its economic activity carries a high employment multiplier (i.e. ripple effect) of over 2.3 (Table 3). Specifically, demand for more than 24,300 indirect and induced jobs28 is generated.
In total, the rotary wing industry supports wages and benefits of approximately $2.6 billion, averaging annual salaries (plus benefits) of $60,600.29 Total value-added (GDP) is nearly $3.7 billion, and the industry’s total output (i.e. total spending) is $6.3 billion per year. The following are breakdowns of the direct, indirect, and induced benefits of the industry.
Direct Benefit: The operational and capital purchase activity of the rotary wing industry supports more than 19,000 jobs per year with total wages and benefits of approximately $1.4 billion, averaging salaries (plus benefits) of more than $71,000 per year. The industry’s direct value-added (GDP) is estimated at $1.5 billion, and total output (spending) is approximately $2.7 billion.30
Indirect Benefit: Indirectly, the rotary wing industry direct economic activity supports more than 9,300 jobs with wages and benefits of approximately $520 million with average salaries (plus benefits) of more than $55,800 per year. Total value-added of the indirect activity is approximately $772 million, and total indirect output is approximately $1.3 billion. Breakdowns of indirect employment are provided later in this section.
Induced Benefit: The induced economic activity, which results from employee’s spending (i.e. households), results in an additional 15,000 jobs with wages and benefits of approximately $759 million. In addition to notable portion of these jobs occurring in the retail sector, which encompass a wide range of industries, many of these jobs also fall in other manufacturing industries. Average salaries (plus benefits) of these jobs is approximately $50,600 per year, and the total indirect value-added is estimate to be $1.3 billion. Total induced output is approximately $2.3 billion per year.
28 43,353 total jobs – 19,037 direct jobs. 29 U.S. median income in 2011 was $50,054. 30 This estimate excludes the figures of annual total depreciation estimated for the industry. Depreciation is estimated to be approximately $285 million per year for the rotary wing AMT industry. See also Appendix Figure B-1 for a breakdown of direct spending by industries.

An Economic Analysis of the U.S. Rotary Wing Air Medical Transport Industry August 2014
Economic & Planning Systems, Inc. 27 Final Report
Table 3 Total Economic Benefit of Rotary Wing Industry Operations & Capital Purchases
Direct Benefit Indirect Benefit Induced Benefit Total Benefit
Direct BenefitJobs 19,037 9,312 15,004 43,353Wages & Benefits $1,350,603,405 $519,949,342 $758,706,716 $2,629,259,464Value-Added (See Note 1) $1,542,820,545 $772,488,436 $1,346,911,918 $3,662,220,898Spending / Output $2,673,577,860 $1,345,504,713 $2,308,612,968 $6,327,695,541
per Job FactorsWages & Benefits $70,948 $55,836 $50,566 $60,648Value-Added $81,045 $82,956 $89,768 $84,475Spending / Output $140,445 $144,491 $153,863 $145,958
Source: Economic & Planning Systems
H:\2011 Projects\21889-Economic Impact of Air M edical Industry\M odels\[21889-M ODEL-June 2014.xlsx]12.1B_US_Total_Impact (2)
Economic Activity
[Note 1]: Value-added is defined as the total income generated from production. It consists of employee compensation, government payments (i.e. taxes on production and imports), and returns of investments (i.e. operating surplus). This measure is equivalent to GDP.
Opera t iona l Bene f i t
The largest component of the rotary wing industry economic activity is its operations. This section describes the benefit of the industry from that standpoint. Operations are defined as the spending on labor and non-labor activity, excluding annual depreciation and capital purchases. The benefits of the industry’s spending on capital purchases are discussed independently.
In total, the rotary wing industry generates more than $5.5 billion in total annual output (Table 4). In addition to its direct employment base of more than 17,400 jobs, the industry supports a total of 38,400 jobs per year. Including its own payroll, wages and benefits for these jobs totals approximately $2.4 billion, averaging salaries (plus benefits) of $62,800 per year. Annually, value-added totals approximately $3.3 billion.31
Viewed differently, the industry’s economic activity generates a total of nearly 41 jobs per rotary wing aircraft (including the 18.7 directly-staffed jobs per aircraft). Each aircraft in operation supports nearly $2.6 million in wages and benefits, more than $3.5 million in value-added, and approximately $5.9 million in total spending.
Direct Benefit: As stated previously, the direct effects are those that describe the employment, wages and benefits, value-added, and output within the rotary wing industry. With employment of approximately 17,400 direct jobs with wages and benefits of approximately $1.4 billion, average salaries (plus benefits) are approximately $73,000 per year. Direct value-added (GDP) is estimated to be approximately $1.4 billion, and the industry’s direct output is approximately $2.3 billion.32,33
31 U.S. GDP is currently approximately $15 trillion. The Rotary Wing AMT industry contributes approximately 0.02 percent. 32 The industry’s output is measured in terms of spending (i.e. purchases or sales) related to patient transports. 33 Total spending on health care in the U.S., as indicated in Chapter 2 “Economic Framework”, was $2.7 trillion in 2011. Direct spending (i.e. the purchase of patient transports) in the Rotary Wing AMT industry accounts for approximately 0.1 percent of total U.S. healthcare spending.

An Economic Analysis of the U.S. Rotary Wing Air Medical Transport Industry August 2014
Economic & Planning Systems, Inc. 28 Final Report
Indirect Benefit: The indirect benefits describe the employment, wages and benefits, output or spending, and value-added of all industries from which the rotary wing industry makes purchases of goods and services (i.e. the supporting or downstream industries). Purchases can include such things as aircraft parts from manufacturers or insurance policies from carriers or through brokers, and it includes the workers those supporting industries employ for their operations, wages and benefits, output and value-added. Approximately 7,800 jobs are indirectly supported by its operations with total wages and benefits of approximately $445 million, averaging to approximately $57,200 per year per job.34 Total value-added (GDP) is approximately $662 million and total output is nearly $1.1 billion per year.
Table 4 Economic Benefits of Rotary Wing Industry Operations
Direct Benefit Indirect Benefit Induced Benefit Total Benefit
Direct BenefitJobs 17,372 7,782 13,208 38,362Wages & Benefits $1,268,820,109 $444,738,585 $695,613,792 $2,409,172,486Value-Added (See Note 1) $1,353,469,041 $661,951,979 $1,240,112,567 $3,255,533,587Spending / Output $2,273,130,005 $1,111,737,956 $2,082,749,586 $5,467,617,547
per Job FactorsWages & Benefits $73,037 $57,153 $52,666 $62,801Value-Added $77,910 $85,067 $93,891 $84,864Spending / Output $130,848 $142,869 $157,689 $142,528
Source: Economic & Planning Systems
H:\2011 Projects\21889-Economic Impact of Air M edical Industry\M odels\[21889-M ODEL-June 2014.xlsx]12.2B_US_Total_Ops (2)
Economic Activity
[Note 1]: Value-added is defined as the total income generated from production. It consists of employee compensation, government payments (i.e. taxes on production and imports), and returns of investments (i.e. operating surplus). This measure is equivalent to GDP.
Induced Benefit: Induced benefits can be characterized as the third round of spending. These effects are the result of employees in the direct and indirect industries spending their earnings on purchases of goods and services, also referred to as household spending on a variety of items, such as retail (i.e. groceries, clothing, recreational and sporting goods, restaurants/bars, automobiles, etc.), housing, investment, and also health care.35 The induced benefit is an additional 13,200 jobs, $696 million in wages and benefits (equating to approximately $52,700 per job per year), $1.2 billion in value-added, and approximately $2.1 billion in total output.36
34 Most of the indirect benefit (44 percent) is felt in other areas of the health care and social services industry, such as hospitals. More than 11 percent of the indirect benefit is created in the administrative services sector, along with approximately 11 percent in transportation and warehousing. Approximately 7 percent of the indirect employment generated is manufacturing jobs, and approximately 6 percent are in the field of professional and technical services. Real estate sale, rental and leasing, management, finance and insurance, and wholesale trade comprise an additional 16 percent, and the remaining 5 percent is made up of other industries. Refer to Appendix Figure B-2. 35 To avoid double-counting resulting from spending by households on goods and services, the induced jobs, earnings, value-added, and output attributable to the health care and social services industry (NAICS 62, which comprises 60 percent of the rotary wing AMT industry) is excluded from these “induced benefit” totals. 36 The largest portion (20 percent) of induced jobs is generated in the retail industry specifically, followed by food service/eating and drinking places (approximately 11 percent) (which in NAICS categories are not disaggregated), real estate and rental and leasing (11 percent), and finance and insurance (10 percent). (Refer to Appendix Figure B-3 for more detail.)

An Economic Analysis of the U.S. Rotary Wing Air Medical Transport Industry August 2014
Economic & Planning Systems, Inc. 29 Final Report
Cap i ta l Purc hase Bene f i t
Total capital purchases are estimated to be approximately $445 million per year, of which it was assumed that 90 percent would be realized domestically, translating to approximately $400 million per year, as shown in Table 5.37 Aircraft purchases, which account for two-thirds of the annual average purchases, totals approximately $241 million ($445 million x 90 percent capture x 67 percent) and averages 60 aircraft purchases per year.38 Overall, total capital purchases generate demand for nearly 5,000 jobs with wages and benefits of $220 million (averaging salaries plus benefits of $44,100 per year). Total value-added (GDP) is $407 million, and total spending is approximately $860 million per year.
Direct Benefit: There are approximately 1,700 direct jobs generated by the purchase of aircraft, ambulances, and other major medical and aviation equipment with total wages and benefits of $82 million (average salaries of $49,100 per year). These industries value-added (GDP) is approximately $189 million, and their total output is approximately $400 million.
Indirect Benefit: The producers of aircraft, ambulances and other equipment purchase supplies from other downstream suppliers, such as steel, composite materials, electronics and computer equipment. There are an estimated 1,500 indirect (supplier) jobs generated with total wages and benefits of $75 million, averaging salaries (plus benefits) of approximately $49,100 per year.39 Total value-added (GDP) is approximately $111 million and total output is nearly $234 million per year.
37 This assumes that 10 percent of all capital purchases are made from non-domestic sources. 38 One limitation is called “cross-hauling”, described also in Chapter 6 “Input-Output Model Limitations”, when a good or service is both an import and an export of a region. Specifically, aircraft are not manufactured in all regions of the U.S. If a program purchases an aircraft manufactured outside the region, but an aircraft manufacturer is based in the region, the model assumes that the aircraft is “purchased” in the region rather than outside the region. In this case, multipliers at a regional level are likely to be inflated. 39 Approximately two-thirds of the indirect employment is represented by other manufacturing businesses. Administrative services, professional and technical services, management, and health care and social services comprise another 20 percent of the indirect economic benefit. Another 10 percent is made up of other industries such as wholesale trade, transportation and warehousing, real estate sale, rental and leasing, finance and insurance, and information. The remaining indirect industries are miscellaneous industries such as retail, construction, arts and entertainment, accommodations, agriculture, and educational services. Refer to Appendix Figure B-4 for more detail.

An Economic Analysis of the U.S. Rotary Wing Air Medical Transport Industry August 2014
Economic & Planning Systems, Inc. 30 Final Report
Table 5 Economic Benefits of Rotary Wind Industry Capital Purchases
Direct Benefit Indirect Benefit Induced Benefit Total Benefit
Direct BenefitJobs 1,664 1,530 1,796 4,991Wages & Benefits $81,783,296 $75,210,756 $63,092,925 $220,086,977Value-Added (See Note 1) $189,351,504 $110,536,456 $106,799,351 $406,687,311Spending / Output $400,447,855 $233,766,757 $225,863,382 $860,077,994
per Job FactorsWages & Benefits $49,142 $49,142 $35,123 $44,096Value-Added $113,777 $72,223 $59,453 $81,483Spending / Output $240,620 $152,740 $125,734 $172,323
Source: Economic & Planning Systems
H:\2011 Projects\21889-Economic Impact of Air M edical Industry\M odels\[21889-M ODEL-June 2014.xlsx]12.3B_US_Total_Cap (2)
Economic Activity
[Note 1]: Value-added is defined as the total income generated from production. It consists of employee compensation, government payments (i.e. taxes on production and imports), and returns of investments (i.e. operating surplus). This measure is equivalent to GDP.
Induced Benefit: As described previously, induced benefits can be characterized as the third round of spending, also referred to as household spending. The induced benefit of employee household spending from the direct and indirect industries generate demand for an additional 1,800 jobs, $63 million in wages and benefits (equating to approximately $35,100 per job per year), $107 million in value-added, and $226 million in total output.40
Reg iona l Bene f i t
The following provides a high level guide to understanding how the results of this economic impact analysis can be interpreted at a regional level.41
Multiplier Effect
There are many ways to view the multiplier effects of an industry. Below are several perspectives on the rotary wing industry’s direct-effect jobs, wages and benefits, and output multipliers (e.g. a ratio of indirect jobs generated per one direct industry job). Another commonly used metric in economic impact analysis is the number of jobs (including both full- and part-time jobs) created per $1 million in final demand changes (i.e. patient transport spending).
40 Jobs in retail account for the largest portion (18 percent), followed by arts, entertainment, and recreation (11 percent), real estate sales, rental and leasing (10 percent), and other services (10 percent). Finance and insurance, administrative services, manufacturing, and professional and technical services comprise an additional 25 percent of the induced economic benefit. Refer to Appendix Figure B-5 for more detail. 41 Detailed multipliers can be found in Appendix Table B-6 through Table B-13.

An Economic Analysis of the U.S. Rotary Wing Air Medical Transport Industry August 2014
Economic & Planning Systems, Inc. 31 Final Report
Direct-Effect Multipliers
The direct effect multiplier is a metric that quantifies the how many total (direct, indirect, and induced) jobs are supported by the industry’s direct employment. At the national level, the direct effect employment multiplier is 2.2, meaning for every one job in the rotary wing industry (and the manufacturing jobs resulting from capital purchases), 1.2 additional jobs are supported elsewhere in the economy.42 That is, the industry’s 19,000 direct jobs support 24,300 indirect and induced jobs (19,000 x 1.3 jobs). Indirectly, each job related to the industry’s direct activity supports 0.5 jobs in other industries. And for each direct and indirect job (approximately 28,300 jobs), demand for an additional 0.5 jobs are induced by employee household spending (approximately 15,000 jobs).
While regional differences exist between direct-effect multipliers43, the regional benefit of any rotary wing AMT base is dependent on its scale of operation, its geography, the presence and distribution of various indirect employment industries in the local and regional economy, and to what extent the program uses contract labor, among other factors.
Final Demand Multipliers
Another metric in economic impact assessment is the final demand multiplier, which characterizes the number of additional jobs generated for each additional $1 million in final demand change for the rotary wing industry. As for the industry’s operational impact, an estimated 7.6 jobs are created for every increase of $1 million in U.S rotary wing AMT operations. A distribution of jobs per $1 million in total direct spending, illustrated in Figure 21, illustrates a median at 7.7 but a wide range of job factors. As mentioned throughout this report, the differences between industry activity factors are due to differences in geography and scale of the local and regional economies. As for the industry’s average capital purchase activity, for every additional $1 million spent on capital, demand for more than 4 jobs is generated.
As with other elements of the economic benefit analysis, these multiplier effects are relevant to the rotary wing industry profile from 2011 (labor and non-labor spending components, average patient transports per aircraft, etc.), the distribution of jobs in the national and regional economic areas, as well as other socio-economic and demographic factors.44
42 A high employment multiplier, however, does not necessarily predict high earnings, value-added, or output multipliers. 43 Refer to Appendix Table B-14. 44 When any of these conditions change, particularly crucial factors used to develop the economic impact estimates, interpreting these results should be done cautiously.
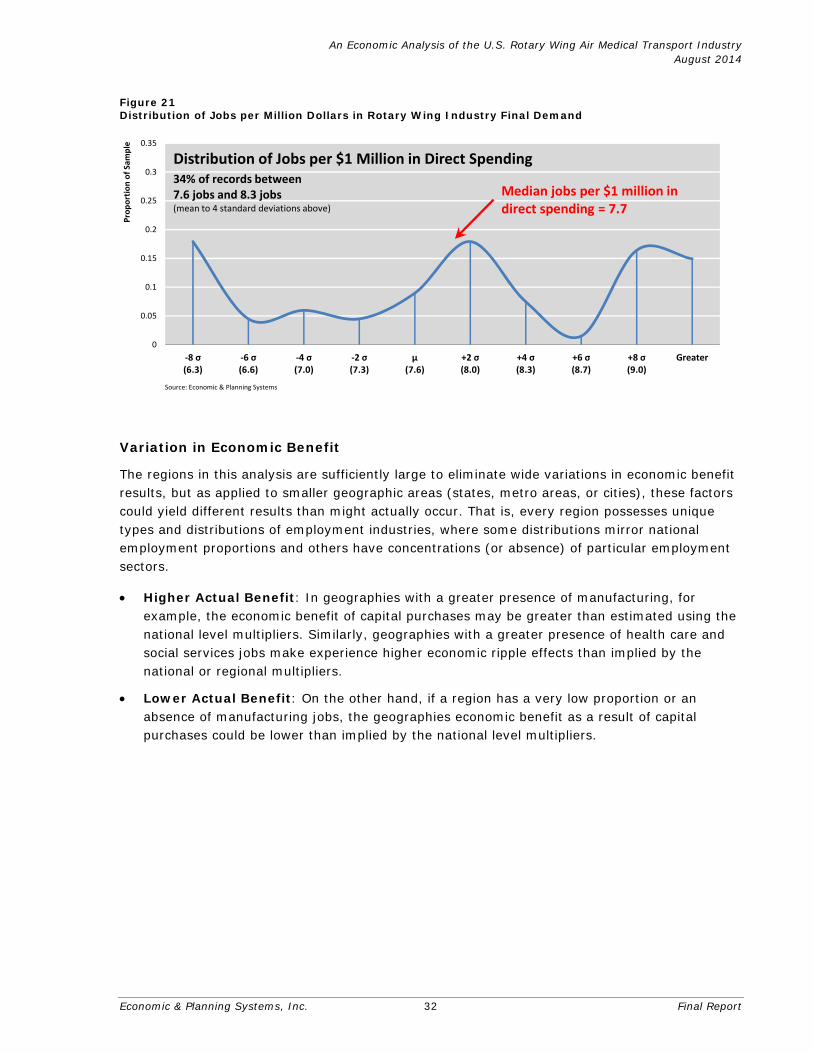
An Economic Analysis of the U.S. Rotary Wing Air Medical Transport Industry August 2014
Economic & Planning Systems, Inc. 32 Final Report
Figure 21 Distribution of Jobs per Million Dollars in Rotary Wing Industry Final Demand
0
0.05
0.1
0.15
0.2
0.25
0.3
0.35
‐8 σ(6.3)
‐6 σ(6.6)
‐4 σ(7.0)
‐2 σ(7.3)
μ(7.6)
+2 σ(8.0)
+4 σ(8.3)
+6 σ(8.7)
+8 σ(9.0)
Greater
Proportion of Sample
Distribution of Jobs per $1 Million in Direct Spending
Source: Economic & Planning Systems
34% of records between7.6 jobs and 8.3 jobs(mean to 4 standard deviations above)
Median jobs per $1 million in direct spending = 7.7
Variation in Economic Benefit
The regions in this analysis are sufficiently large to eliminate wide variations in economic benefit results, but as applied to smaller geographic areas (states, metro areas, or cities), these factors could yield different results than might actually occur. That is, every region possesses unique types and distributions of employment industries, where some distributions mirror national employment proportions and others have concentrations (or absence) of particular employment sectors.
Higher Actual Benefit: In geographies with a greater presence of manufacturing, for example, the economic benefit of capital purchases may be greater than estimated using the national level multipliers. Similarly, geographies with a greater presence of health care and social services jobs make experience higher economic ripple effects than implied by the national or regional multipliers.
Lower Actual Benefit: On the other hand, if a region has a very low proportion or an absence of manufacturing jobs, the geographies economic benefit as a result of capital purchases could be lower than implied by the national level multipliers.

An Economic Analysis of the U.S. Rotary Wing Air Medical Transport Industry August 2014
Economic & Planning Systems, Inc. 33 Final Report
Economic Benefit per Aircraft
Economic benefit can be estimated at a more “localized” level using per-aircraft benefit factors, but with some caution. As with variation in economic benefit identified above, this approach will be most accurate where local industry presence, types, and distributions mirror those at the regional and national scales.
Total direct employment per aircraft, as presented earlier in the report, is 18.7 full- and part-time jobs, but supports 41.3 full- and part-time jobs in total. Total wages and benefits per aircraft are estimated at approximately $2.5 million per aircraft, and total spending is approximately $5.6 million, as shown in Table 6.45
Table 6 Operational Economic Benefit per Rotary Wing Aircraft by Region
Direct Benefit Indirect Benefit Induced Benefit Total Benefit
Direct BenefitJobs 17,372 7,782 13,208 38,362Wages & Benefits $1,268,820,109 $444,738,585 $695,613,792 $2,409,172,486Value-Added (See Note 1) $1,353,469,041 $661,951,979 $1,240,112,567 $3,255,533,587Spending / Output $2,273,130,005 $1,111,737,956 $2,082,749,586 $5,467,617,547
per Aircraft FactorsWages & Benefits $1,365,791 $478,728 $748,777 $2,593,297Value-Added $1,456,910 $712,542 $1,334,890 $3,504,342Spending / Output $2,446,857 $1,196,704 $2,241,926 $5,885,487
Source: Economic & Planning Systems
H:\2011 Projects\21889-Economic Impact of Air M edical Industry\M odels\[21889-M ODEL-June 2014.xlsx]12.2B_US_Total_Ops (2)
Economic Activity
[Note 1]: Value-added is defined as the total income generated from production. It consists of employee compensation, government payments (i.e. taxes on production and imports), and returns of investments (i.e. operating surplus). This measure is equivalent to GDP.
45 More accurate measures of economic impact at a local level, however, must consider the presence of industries in the area, the presence of suppliers, as well as indirect business (such as the presence of retail or other industries that benefit from household purchases). The most accurate localized benefit would be estimated through a separate analysis.

Economic & Planning Systems, Inc. 34 21889-Final Report 082114
6. INPUT-OUTPUT MODEL LIMITATIONS
The following is a general overview of the limitations of interpreting the results of an economic impact analysis using an input-output structure.
Source Data
The Bureau of Economic Analysis (BEA) makes two data series available to analysts: an annual series, which includes 62 industries; and a benchmark series, which includes 406 industries. This study uses the benchmark series. The following are brief descriptions of each:
Annual Series – Multipliers from this series are based on more current but less detailed national annual input-output data. In this case, multipliers are based on 2010 benchmark input-output table for the nation and 2010 regional data.
Benchmark Series – Multipliers from this series are based on more detailed but less current national benchmark input-output data. In this case, multipliers are based on 2002 benchmark input-output table for the nation and 2010 regional data.
It was determined that the detail afforded by the benchmark series outweighed the fact that the annual series use more recent input-output data. Moreover, both 2002 and 2010 bear some similarity in that they both followed recessions. These advantages were weighed against the fact that at the beginning of the 2000s, the distribution of employment by sector was different than by the end of the decade (i.e. manufacturing lost nearly 5.6 million jobs during the decade, construction lost 1.1 million, but health care gained 4.1 million jobs).46
Overall, choosing the benchmark series allowed for application of more detailed multipliers (with no extra data acquisition cost). On one hand, the estimates of manufacturing impacts could be slightly overstated (though aircraft manufacturing accounts for a very small portion of the overall manufacturing industry employment). On the other hand, the increase in healthcare industry jobs over time implies that the estimates of the rotary wing industry’s operating impacts could be understated.
Multipliers
Data from the BEA come in the form of “multipliers”, constructed from a series of national macroeconomic accounts.47 First, three tables are used to estimate a domestic direct requirements table, which represents domestic leakage (i.e. imported commodities). From the domestic direct requirements table is created a regional direct requirements table, which accounts for leakage at a regional level. In addition, a regional total requirements table is estimated to account for the purchase of goods and services used by industries and households within a region. With the combination of these tables are generated two types of multipliers:
46 Refer to Appendix Table B-1 for more detail. 47 In general, these multipliers are the result of multiple calculations to three national input-output accounts called the “make table”, “use table”, and “import table”.

An Economic Analysis of the U.S. Rotary Wing Air Medical Transport Industry August 2014
Economic & Planning Systems, Inc. 35 Final Report
Type I multipliers for estimating the direct and indirect impacts; and Type II multipliers for estimating direct, indirect, and induced (i.e. household spending) impacts. Between the two types of multipliers available for analysis, there are two subsets of multipliers available:
Final Demand Multipliers – These are ratios of total change in economic activity to a dollar (or million dollar) change in an industry’s (i.e. the rotary wing industry) final demand. These multipliers are used to estimate total changes in output, value-added, wages and benefits, and employment.
Direct Effect Multipliers – These are ratios of total change in household earnings per dollar change in the final-demand industry (i.e. the rotary wing industry). For employment, these are ratios of total change in jobs per change in jobs in the final-demand industry.
Genera l Ass umpt ions
RIMS II multipliers are based on the average relationships between the inputs and outputs produced in a local economy. The multipliers are a useful tool for studying the potential impacts of changes in economic activity, but there is always the risk that they can produce “upper-bound” estimates. The BEA encourages analysts to carefully evaluate how closely these assumptions apply to their projects and consider collecting additional information specific to their project to adjust their results.
In this study’s case, considerable additional information has been collected to verify all the results generated through the RIMS II multipliers. In this study, EPS has relied on the primary data collected through surveys to make estimates of direct economic benefit, because the rotary wing industry represents a sub-component of the industry identifier (621B00) used to generate the multipliers, which is an aggregation of many ambulatory service sectors and would result in inaccurate measures of wages and benefits, jobs, and output. General model assumptions include:
No Supply Constraints – Multipliers assume that industries can increase demand for inputs and labor as needed to meet additional demand. If a business is already operating at full capacity, then additional inputs may need to come from outside the region, thereby reducing the local impact.
Fixed Purchase Patterns – Multipliers assume that an industry must double its inputs to double its output. If a firm can increase its output without hiring additional employees and without purchasing additional inputs, then the impact of the change on the local economy will be smaller than the impact that is estimated using a full multiplier.
Local Inputs – The method used by RIMS II to develop regional multipliers assumes that firms will purchase inputs from firms in the region before using imports. For example, if a rotary wing AMT base is relocated or opened in a specific region, it is assumed that purchases of most goods and services from supplier (indirect) industries will come from inside the region.
Local Supply Conditions, Leakage, and Cross-Hauling – RIMS II multipliers are adjusted to account for local supply conditions, i.e. the fact that local industries often do not supply all of the intermediate inputs. That is, some purchases must be made from suppliers outside the region, which are called “leakages”, because it represents money that no longer circulates in
An Economic Analysis of the U.S. Rotary Wing Air Medical Transport Industry August 2014
Economic & Planning Systems, Inc. 36 Final Report
the local economy. One limitation is when a good or service is both an import and an export of a region, called “cross-hauling”. For example, aircraft are not manufactured in all regions of the U.S. If a program purchases an aircraft manufactured outside the region, but its own region actually contains an aircraft manufacturer, the model assumes that the aircraft is “purchased” in the region rather than outside the region. In this case, using the capital purchase multipliers at a regional level is likely to produce inflated impact estimates.
Regional Feedback – The model does not account for feedback that may exist among regions. For example, a rotary wing AMT program may purchase aircraft parts from outside its own region, but that aircraft parts manufacturer may contract for accounting or legal services within the first region. As a result, the economic benefit to the first region will be under-stated. The BEA encourages analysts to choose a region that are large enough to encompass a group of interrelated industries.
Industry Homogeneity – Input-output models assume that all businesses in an industry use the same production process. That is, if the production process of a business initially affected by a change in economic activity is not consistent with those implied in the national accounts used to construct RIMS II multipliers, the results will be inaccurate. Such inaccurate results, however, can be avoided with more detailed industry data.

An Economic Analysis of the U.S. Rotary Wing Air Medical Transport Industry August 2014
Economic & Planning Systems, Inc. 37 Final Report
In te rp re ta t ion o f E mp loyment Bene f i t
The BEA also encourages the analyst to collect sufficiently detailed information in order to interpret results of the impact analysis properly. Specifically, this example illustrates the relevance of understanding the composition of the final demand industry’s (i.e. the rotary wing industry) workforce in terms of part-time and full-time jobs, as well as the portion of jobs that may be filled by workforce outside the region.
While it is the case that this study applies a national framework of input-output data to a range of activity metrics collected programs throughout the country, thus ruling out the possibility of operations that “import” labor from outside the U.S., there is good reason to interpret the results cautiously when interpolating the results to a regional level. That is, there are many multi-state operators (i.e. vendors) who have centralized services for a variety of services such as maintenance and dispatch, in particular.
In the event that a new rotary wing aircraft base is opened in one region, but its dispatch functions are contracted and located in the vendor’s central location (i.e. a different region), the jobs estimated using the multipliers will need to be adjusted accordingly. That is, out of 18.7 jobs, if 1.5 dispatch jobs are associated with aircraft, these jobs would need to be credited to the appropriate location (Figure 22). The same could be true of some of the “Other” positions as well.48
Figure 22 Jobs per Rotary Wing Aircraft
4.3 jobs
5.2 jobs
4.4 jobs
0.5 jobs1.5 jobs 1.5 jobs
2.7 jobs
0.0
1.0
2.0
3.0
4.0
5.0
6.0
Pilots Nurses Paramedics EMT Mechanics /Technicians
Dispatch Other
Source: Economic & Planning Systems
18.7 Jobs per Rotary Wing Aircraft
Jobs (Full‐
and Part‐Time Labor)
48 Note that “Other” positions, while not also described by the respondent in the open-ended questions, included a considerable number of various other health-practitioner positions, such as respiratory therapists, medical direction, or program direction. Many respondents indicated some number of jobs in the “Other” category, but a few indicated zero. To the extent that a new operation opens with a full staffing complement, as indicated here, the results of the economic impact assessment would be most relevant.

Append i x A : Ro t a r y W ing I ndus t r y De f i n i t i on
Economic & Planning Systems, Inc. 39 Appendix A: Industry Definition
Def in i t i on
The following industry subsectors are defined by the Office of Management and Budget’s “North American Industry Classification System” (2002). In general, NAICS are built on the conceptual framework of production-oriented or supply-oriented framework that groups establishments into similar categories based on the goods or services they produce. NAICS codes are used by the United States, Canada, and Mexico. The numbering system is hierarchical, the first two digits of a code being associated with one of the 20 high-level sectors:
11 – Agriculture, Forestry, Fishing and Hunting 21 – Mining 22 – Utilities 23 – Construction 31-33 – Manufacturing 42 – Wholesale Trade 44-45 – Retail Trade 48-49 – Transportation and Warehousing 51 – Information 52 – Finance and Insurance 53 – Real Estate and Rental and Leasing 54 – Professional, Scientific, and Technical Services 55 – Management of Companies and Enterprises 56 – Administrative and Support and Waste Management and Remediation Services 61 – Educational Services 62 – Health Care and Social Services 71 – Arts, Entertainment, and Recreation 72 – Accommodation and Food Services 81 – Other Services (except Public Administration) 92 – Public Administration
Alignment of Industry Categories
The following industries are identified at the six-digit level of detail. Where possible, RIMS II categories (of which there are 406) were identified that were either identical to the NAICS category or properly included it.
NAICS 621910: Air Ambulance Services
This industry accounts for establishment primarily engaged in providing transportation of patients by ground or air, along with medical care. These services are often provided during a medical emergency but are not restricted to emergencies. The vehicles are equipped with lifesaving equipment operated by medically trained personnel.
RIMS II Category: 621B00 Costs affected: all labor costs, except mechanics/technicians and dispatch; some non-labor
costs, including other capital purchases

An Economic Analysis of the U.S. Rotary Wing Air Medical Transport Industry August 2014
Economic & Planning Systems, Inc. 40 Appendix A: Industry Definition
NAICS 424720: Business Support Services
This industry comprises establishments primarily engaged in the merchant wholesale distribution of petroleum and petroleum products (except from bulk liquid storage facilities).
RIMS II Category: 420000 Costs affected: non-labor costs, including fuel
NAICS 488: Support Activities for Transportation
Industries in the Support Activities for Transportation subsector provide services which support transportation. These services may be provided to transportation carrier establishments or to the general public. This subsector includes a wide array of establishments, including air traffic control services, marine cargo handling, and motor vehicle towing.
NAICS 488190: Other Support Activities for Air Transportation
This industry comprises establishments primarily engaged in providing specialized services for air transportation (except air traffic control and other airport operations). Examples include aircraft services, aircraft maintenance and repair services (except factory conversions, overhauls, rebuilding).
RIMS II Category: 48A000 Costs affected: labor costs, including mechanics/technicians and dispatch; non-labor costs,
including aircraft hangar rental, maintenance and equipment updates
NAICS 5241: Insurance Carriers
This industry group comprises establishments primarily engaged in underwriting (assuming the risk, assigning premiums, and so forth) annuities and insurance policies and investing premiums to build up a portfolio of financial assets to be used against future claims. Direct insurance carriers are establishments that are primarily engaged in initially underwriting and assuming the risk of annuities and insurance policies.
RIMS II Category: 524100 Costs affected: non-labor costs, including a large portion of insurance costs
NAICS 5242: Agencies, Brokerages, and Other Insurance Related Activities
This industry group comprises establishment primarily engaged in (1) acting as agents (i.e. brokers) in selling annuities and insurance policies or (2) providing other employee benefits and insurance related services, such as claims adjustment and third party administration.
RIMS II Category: 524200 Costs affected: non-labor costs, including a small portion of insurance costs
An Economic Analysis of the U.S. Rotary Wing Air Medical Transport Industry August 2014
Economic & Planning Systems, Inc. 41 Appendix A: Industry Definition
NAICS 531000: Real Estate
This industry group comprises establishments that are primarily engaged in renting or leasing real estate to others; managing real estate for others; selling, buying, or renting real estate for others; and providing other real estate related services, such as appraisal services.
RIMS II Category: 531000 Costs affected: non-labor costs, including real estate purchase or leasing
NAICS 550000: Management of Companies and Enterprises
This industry group comprises 1) establishments that hold the securities of (or other equity interests in) companies and enterprises for the purpose of owning a controlling interest or influencing management decisions or 2) establishments (except government establishments) that administer, oversee, and manage establishments of the company or enterprise and that normally undertake the strategic or organizational planning and decision-making role of the company or enterprise. Establishments that administer, oversee, and manage may hold the securities of the company or enterprise.
RIMS II Category: 531000 Costs affected: labor costs, including management positions
NAICS 561100: Office Administrative Services
This industry comprises establishments primarily engaged in providing a range of day-to-day office administrative services, such as financial planning; billing and recordkeeping; personnel; and physical distribution and logistics for others on a contract or fee basis. These establishments do not provide operating staff to carry out the complete operations of a business.
RIMS II Category: 561100 Costs affected: labor costs, including administrative staff
NAICS 561210: Facilities Support Services
This industry comprises establishments primarily engaged in providing operating staff to perform a combination of support service within a client’s facilities. Establishments in this industry typically provide a combination of services, such as janitorial; maintenance; trash disposal; guard and security; mail routing; reception; laundry; and related services to support operations within facilities.
RIMS II Category: 561200 Costs affected: labor costs, including support staff

An Economic Analysis of the U.S. Rotary Wing Air Medical Transport Industry August 2014
Economic & Planning Systems, Inc. 42 Appendix A: Industry Definition
NAICS 561410: Business Support Services
This industry comprises establishments primarily engaged in performing activities that are ongoing routine business support functions that businesses and organizations traditionally do for themselves.
RIMS II Category: 561400 Costs affected: labor costs, including support staff
NAICS 5324: Commercial and Industrial Machinery and Equipment Rental and Leasing
“This industry group comprises establishments primarily engaged in renting or leasing commercial-type and industrial-type machinery and equipment. The types of establishments included in this industry group are generally involved in providing capital or investment-type equipment that clients use in their business operations. These establishments typically cater to a business clientele and do not generally operate a retail-like or store-front facility.”
RIMS II Category: 532400 Costs affected: non-labor costs, including a portion of all lease payments (aircraft,
equipment, etc.)
NAICS 532411: Commercial Air, Rail, and Water Transportation Equipment Rental and Leasing
This industry comprises establishments primarily engaged in renting or leasing off-highway transportation equipment without operators, such as aircraft, railroad cars, steamships, or tugboats.
RIMS II Category: 532400 Costs affected: non-labor costs, including aircraft leasing
NAICS 541100: Offices of Lawyers
This industry comprises offices of legal practitioners known as lawyers or attorneys (i.e., counselors-at-law) primarily engaged in the practice of law. Establishments in this industry may provide expertise in a range or in specific areas of law, such as criminal law, corporate law, family and estate law, patent law, real estate law, or tax law.
RIMS II Category: 541100 Costs affected: labor costs, including legal services
NAICS 541200: Accounting, Tax Preparation, Bookkeeping, and Payroll Services
This industry comprises offices of establishments primarily engaged in providing services, such as auditing of accounting records, designing accounting systems, preparing financial statements, developing budgets, preparing tax returns, processing payrolls, bookkeeping, and billing.
RIMS II Category: 541100 Costs affected: labor costs, including accounting services

An Economic Analysis of the U.S. Rotary Wing Air Medical Transport Industry August 2014
Economic & Planning Systems, Inc. 43 Appendix A: Industry Definition
NAICS 336112: Light Truck and Utility Vehicle Manufacturing
This industry comprises establishment primarily engaged in: 1) manufacturing complete light trucks and utility vehicles (i.e. body and chassis) or 2) manufacturing light truck and utility vehicle chassis only. Vehicles made include light duty vans, pick-up trucks, minivans, and sport utility vehicles. The Federal Highway Administration classifies ambulances as “medium duty” vehicles (see http://ops.fhwa.dot.gov/publications/fhwahop10014/long_f21.htm), but NAICS codes distinguish only between light and heavy duty vehicle manufacturing.
RIMS II Category: 336112 Costs affected: non-labor costs, including purchase of ambulances
NAICS 336411: Aircraft Manufacturing
This industry comprises establishment primarily engaged in one or more of the following: 1) manufacturing or assembling complete aircraft; 2) developing and making aircraft prototypes; 3) aircraft conversion (i.e. major modifications to systems); and 4) complete aircraft overhaul and rebuilding (i.e., periodic restoration of aircraft to original design specifications).
RIMS II Category: 336411 Costs affected: non-labor costs, including purchase of aircraft
NAICS 336412: Aircraft Engine and Engine Parts Manufacturing
This industry comprises establishment primarily engaged in one or more of the following: 1) manufacturing aircraft engines and engine parts; 2) developing and making prototypes of aircraft engines and engine parts; 3) aircraft propulsion system conversion (i.e., major modifications to systems); and 4) aircraft propulsion systems overhaul and rebuilding (i.e. periodic restoration of aircraft propulsion system to original design specifications).
RIMS II Category: 336412 Costs affected: non-labor costs, including purchase of aircraft parts, and aviation equipment
capital purchases
NAICS 336413: Other Aircraft Parts and Auxiliary Equipment Manufacturing
This industry comprises establishments primarily engaged in 1) manufacturing aircraft parts or auxiliary equipment (except engines and aircraft fluid power subassemblies) and/or 2) developing and making prototypes of aircraft parts and auxiliary equipment. Auxiliary equipment includes such items as crop dusting apparatus, armament racks, inflight refueling equipment, and external fuel tanks.
RIMS II Category: 336413 Costs affected: non-labor costs, including purchase of aircraft parts

An Economic Analysis of the U.S. Rotary Wing Air Medical Transport Industry August 2014
Economic & Planning Systems, Inc. 44 Appendix A: Industry Definition
NAICS 334511: Search, Detection, Navigation, Guidance, Aeronautical, and Nautical System and Instrument Manufacturing
This industry comprises establishments primarily engaged in manufacturing search, detection, navigation, guidance, aeronautical, and nautical systems and instruments. Examples of products made by these establishments are aircraft instruments (except engine), flight recorders, navigational instruments and systems, radar systems and equipment, and sonar systems and equipment.
RIMS II Category: 334511 Costs affected: non-labor costs, including avionics
NAICS 339112: Surgical and Medical Instrument Manufacturing
This industry comprises establishments primarily engaged in manufacturing medical, surgical, ophthalmic, and veterinary instruments and apparatus (except electrotherapeutic, electromedical and irradiation apparatus). Examples of products made by these establishments are syringes, hypodermic needles, anesthesia apparatus, blood transfusion equipment, catheters, surgical clamps, and medical thermometers.
RIMS II Category: 339112 Costs affected: non-labor costs, including medical supplies, and medical equipment capital
purchases
NAICS 325412: Pharmaceutical Preparation Manufacturing
This industry comprises establishments primarily engaged in manufacturing in-vivo diagnostic substances and pharmaceutical preparations (except biological) intended for internal and external consumption in dose forms, such as ampoules, tablets, capsules, vials, ointments, powders, solutions, and suspensions.
RIMS II Category: 325412 Costs affected: non-labor costs, including pharmaceuticals
NAICS 611430: Professional and Management Development Training
This industry comprises establishments primarily engaged in offering an array of short duration courses and seminars for management and professional development. Training for career development may be provided directly to individuals or through employers’ training programs; and courses may be customized or modified to meet the special needs of customers. Instruction may be provided in diverse settings, such as the establishment’s or client’s training facilities, educational institutions, the workplace, or the home, and through correspondence, television, Internet, or other means.”
RIMS II Category: 611B00 Costs affected: labor costs, including training and development

Append i x B : Suppo r t i ng Ma t e r i a l s
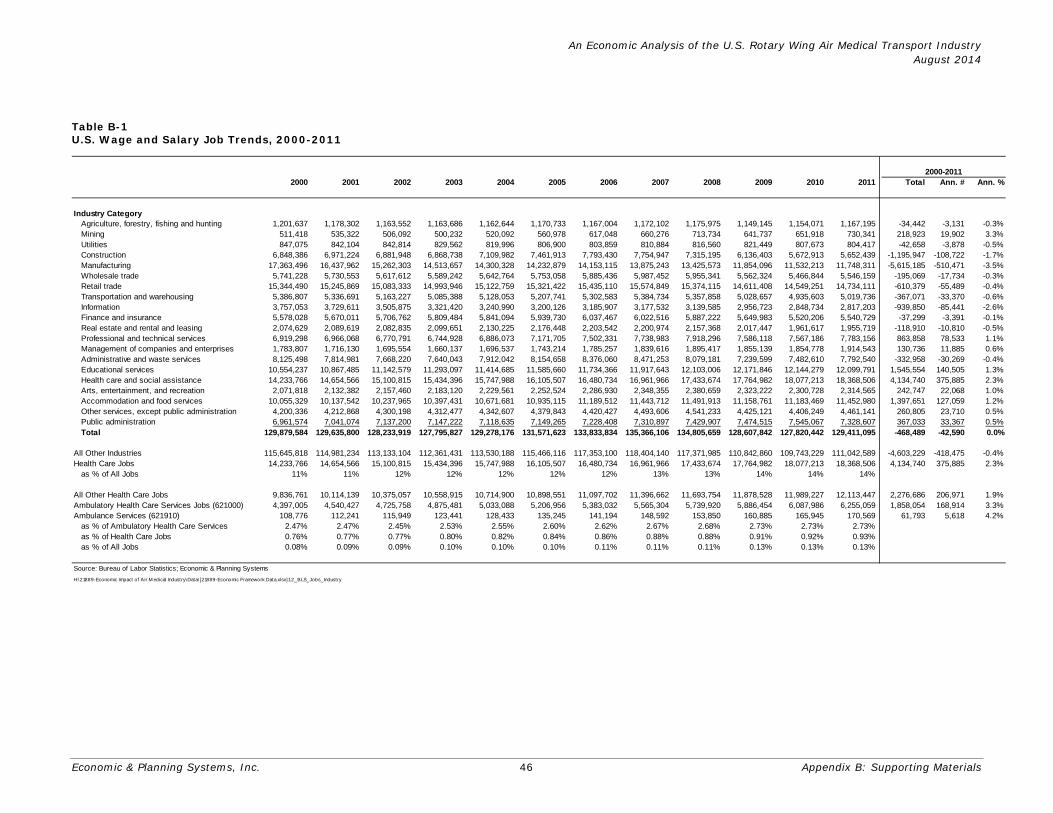
An Economic Analysis of the U.S. Rotary Wing Air Medical Transport Industry August 2014
Economic & Planning Systems, Inc. 46 Appendix B: Supporting Materials
Table B-1 U.S. Wage and Salary Job Trends, 2000-2011
2000 2001 2002 2003 2004 2005 2006 2007 2008 2009 2010 2011 Total Ann. # Ann. %
Industry CategoryAgriculture, forestry, fishing and hunting 1,201,637 1,178,302 1,163,552 1,163,686 1,162,644 1,170,733 1,167,004 1,172,102 1,175,975 1,149,145 1,154,071 1,167,195 -34,442 -3,131 -0.3%Mining 511,418 535,322 506,092 500,232 520,092 560,978 617,048 660,276 713,734 641,737 651,918 730,341 218,923 19,902 3.3%Utilities 847,075 842,104 842,814 829,562 819,996 806,900 803,859 810,884 816,560 821,449 807,673 804,417 -42,658 -3,878 -0.5%Construction 6,848,386 6,971,224 6,881,948 6,868,738 7,109,982 7,461,913 7,793,430 7,754,947 7,315,195 6,136,403 5,672,913 5,652,439 -1,195,947 -108,722 -1.7%Manufacturing 17,363,496 16,437,962 15,262,303 14,513,657 14,300,328 14,232,879 14,153,115 13,875,243 13,425,573 11,854,096 11,532,213 11,748,311 -5,615,185 -510,471 -3.5%Wholesale trade 5,741,228 5,730,553 5,617,612 5,589,242 5,642,764 5,753,058 5,885,436 5,987,452 5,955,341 5,562,324 5,466,844 5,546,159 -195,069 -17,734 -0.3%Retail trade 15,344,490 15,245,869 15,083,333 14,993,946 15,122,759 15,321,422 15,435,110 15,574,849 15,374,115 14,611,408 14,549,251 14,734,111 -610,379 -55,489 -0.4%Transportation and warehousing 5,386,807 5,336,691 5,163,227 5,085,388 5,128,053 5,207,741 5,302,583 5,384,734 5,357,858 5,028,657 4,935,603 5,019,736 -367,071 -33,370 -0.6%Information 3,757,053 3,729,611 3,505,875 3,321,420 3,240,990 3,200,126 3,185,907 3,177,532 3,139,585 2,956,723 2,848,734 2,817,203 -939,850 -85,441 -2.6%Finance and insurance 5,578,028 5,670,011 5,706,762 5,809,484 5,841,094 5,939,730 6,037,467 6,022,516 5,887,222 5,649,983 5,520,206 5,540,729 -37,299 -3,391 -0.1%Real estate and rental and leasing 2,074,629 2,089,619 2,082,835 2,099,651 2,130,225 2,176,448 2,203,542 2,200,974 2,157,368 2,017,447 1,961,617 1,955,719 -118,910 -10,810 -0.5%Professional and technical services 6,919,298 6,966,068 6,770,791 6,744,928 6,886,073 7,171,705 7,502,331 7,738,983 7,918,296 7,586,118 7,567,186 7,783,156 863,858 78,533 1.1%Management of companies and enterprises 1,783,807 1,716,130 1,695,554 1,660,137 1,696,537 1,743,214 1,785,257 1,839,616 1,895,417 1,855,139 1,854,778 1,914,543 130,736 11,885 0.6%Administrative and waste services 8,125,498 7,814,981 7,668,220 7,640,043 7,912,042 8,154,658 8,376,060 8,471,253 8,079,181 7,239,599 7,482,610 7,792,540 -332,958 -30,269 -0.4%Educational services 10,554,237 10,867,485 11,142,579 11,293,097 11,414,685 11,585,660 11,734,366 11,917,643 12,103,006 12,171,846 12,144,279 12,099,791 1,545,554 140,505 1.3%Health care and social assistance 14,233,766 14,654,566 15,100,815 15,434,396 15,747,988 16,105,507 16,480,734 16,961,966 17,433,674 17,764,982 18,077,213 18,368,506 4,134,740 375,885 2.3%Arts, entertainment, and recreation 2,071,818 2,132,382 2,157,460 2,183,120 2,229,561 2,252,524 2,286,930 2,348,355 2,380,659 2,323,222 2,300,728 2,314,565 242,747 22,068 1.0%Accommodation and food services 10,055,329 10,137,542 10,237,965 10,397,431 10,671,681 10,935,115 11,189,512 11,443,712 11,491,913 11,158,761 11,183,469 11,452,980 1,397,651 127,059 1.2%Other services, except public administration 4,200,336 4,212,868 4,300,198 4,312,477 4,342,607 4,379,843 4,420,427 4,493,606 4,541,233 4,425,121 4,406,249 4,461,141 260,805 23,710 0.5%Public administration 6,961,574 7,041,074 7,137,200 7,147,222 7,118,635 7,149,265 7,228,408 7,310,897 7,429,907 7,474,515 7,545,067 7,328,607 367,033 33,367 0.5%Total 129,879,584 129,635,800 128,233,919 127,795,827 129,278,176 131,571,623 133,833,834 135,366,106 134,805,659 128,607,842 127,820,442 129,411,095 -468,489 -42,590 0.0%
All Other Industries 115,645,818 114,981,234 113,133,104 112,361,431 113,530,188 115,466,116 117,353,100 118,404,140 117,371,985 110,842,860 109,743,229 111,042,589 -4,603,229 -418,475 -0.4%Health Care Jobs 14,233,766 14,654,566 15,100,815 15,434,396 15,747,988 16,105,507 16,480,734 16,961,966 17,433,674 17,764,982 18,077,213 18,368,506 4,134,740 375,885 2.3%
as % of All Jobs 11% 11% 12% 12% 12% 12% 12% 13% 13% 14% 14% 14%
All Other Health Care Jobs 9,836,761 10,114,139 10,375,057 10,558,915 10,714,900 10,898,551 11,097,702 11,396,662 11,693,754 11,878,528 11,989,227 12,113,447 2,276,686 206,971 1.9%Ambulatory Health Care Services Jobs (621000) 4,397,005 4,540,427 4,725,758 4,875,481 5,033,088 5,206,956 5,383,032 5,565,304 5,739,920 5,886,454 6,087,986 6,255,059 1,858,054 168,914 3.3%Ambulance Services (621910) 108,776 112,241 115,949 123,441 128,433 135,245 141,194 148,592 153,850 160,885 165,945 170,569 61,793 5,618 4.2%
as % of Ambulatory Health Care Services 2.47% 2.47% 2.45% 2.53% 2.55% 2.60% 2.62% 2.67% 2.68% 2.73% 2.73% 2.73%as % of Health Care Jobs 0.76% 0.77% 0.77% 0.80% 0.82% 0.84% 0.86% 0.88% 0.88% 0.91% 0.92% 0.93%as % of All Jobs 0.08% 0.09% 0.09% 0.10% 0.10% 0.10% 0.11% 0.11% 0.11% 0.13% 0.13% 0.13%
Source: Bureau of Labor Statistics; Economic & Planning Systems
H:\21889-Economic Impact of Air M edical Indust ry\Data\ [21889-Economic Framework Data.xlsx]1.2_BLS_Jobs_Industry
2000-2011

An Economic Analysis of the U.S. Rotary Wing Air Medical Transport Industry August 2014
Economic & Planning Systems, Inc. 47 Appendix B: Supporting Materials
Table B-2 Population Trends by Age, 2000-2010
2000 2010 2000 2010Total
Change Ann. # Ann. %
Age CategoryUnder 18 years 72,295,030 74,195,760 26% 24% 1,900,730 190,073 0.3%18 to 24 years 27,141,150 30,708,214 10% 10% 3,567,064 356,706 1.2%25 to 44 years 85,042,691 82,228,500 30% 27% -2,814,191 -281,419 -0.3%45 to 64 years 61,953,535 81,779,634 22% 26% 19,826,099 1,982,610 2.8%65 years and older 34,992,194 40,437,581 12% 13% 5,445,387 544,539 1.5%Total 281,424,600 309,349,689 100% 100% 27,925,089 2,792,509 1.0%
Source: U.S. Census; Economic & Planning Systems
H:\21889-Economic Impact of Air M edical Industry\Data\[21889-Populat ion.xlsx]Sheet3
Population as % of Total 2000-2010
Table B-3 Rotary Wing Aircraft Staffing by Program Type
Alt
ern
ativ
e D
eliv
ery
Mo
del
Co
mm
un
ity-
bas
ed
Ho
spit
al-b
ased
Ove
rall
Alt
ern
ativ
e D
eliv
ery
Mo
del
Co
mm
un
ity-
bas
ed
Ho
spit
al-b
ased
Ove
rall
Total StaffTotal Jobs (See Note [1])
Pilots 100 1,345 428 1,873 21% 23% 20% 22%Nurses 158 1,468 558 2,184 33% 25% 26% 25%Paramedics 33 1,332 444 1,809 7% 22% 21% 21%EMTs 25 25 97 147 5% 0% 5% 2%Mechanics / Technicians 48 468 131 647 10% 8% 6% 8%Dispatch / Air Traffic Control 14 291 249 554 3% 5% 12% 6%Other 106 1,039 213 1,357 22% 17% 10% 16%Subtotal 484 5,966 2,119 8,570 100% 100% 100% 100%
Full-Time Equivalents (See Note [2])Pilots 98 1,345 422 1,865 21% 23% 22% 23%Nurses 150 1,404 515 2,068 33% 24% 27% 25%Paramedics 25 1,267 367 1,658 5% 22% 19% 20%EMTs 23 13 70 105 5% 0% 4% 1%Mechanics / Technicians 48 461 127 636 10% 8% 7% 8%Dispatch / Air Traffic Control 14 281 232 526 3% 5% 12% 6%Other 104 1,032 182 1,318 23% 18% 10% 16%Subtotal 460 5,801 1,915 8,176 100% 100% 100% 100%
[Note 1]: Total jobs includes full-time and part-time staff .
[Note 2]: Part-time staff are assumed on average to be 0.5 full-time positions.
Source: Economic & Planning Systems
H:\21889-Economic Impact of Air M edical Industry\Data\ [21889-Survey DATA-M arch 2013.xlsx]1.4_Staff_Stats_Prog
Jobs by Programs Type as % of Total
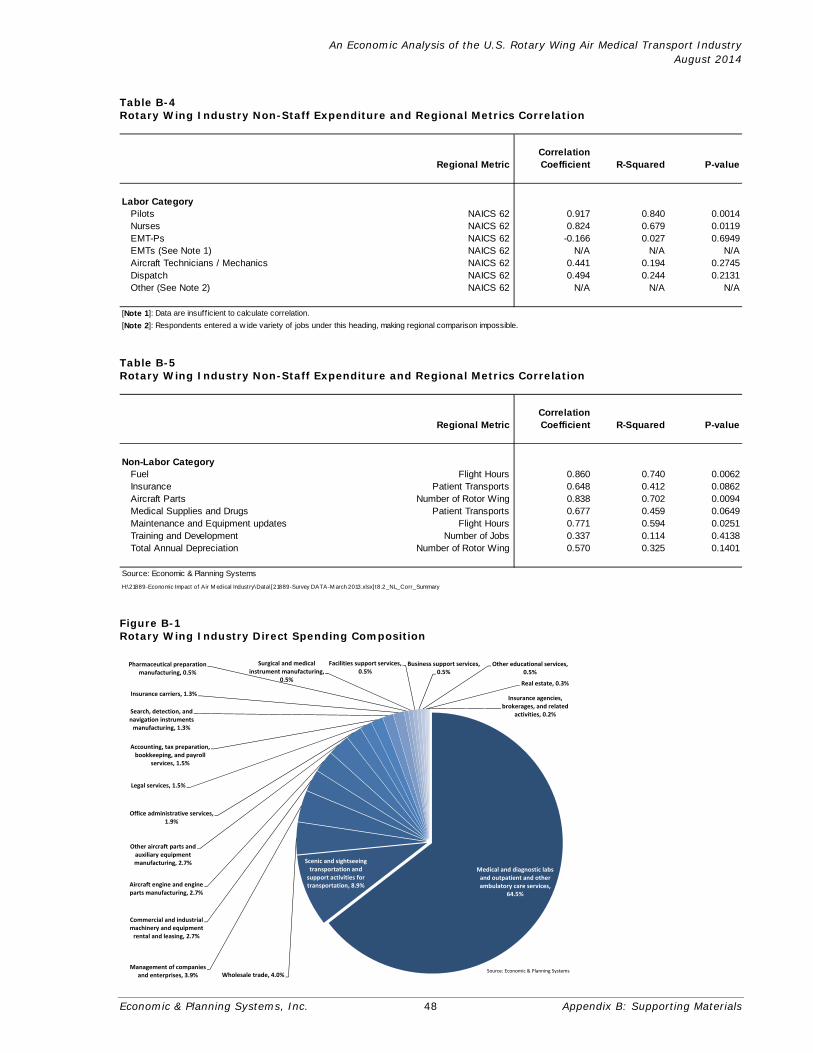
An Economic Analysis of the U.S. Rotary Wing Air Medical Transport Industry August 2014
Economic & Planning Systems, Inc. 48 Appendix B: Supporting Materials
Table B-4 Rotary Wing Industry Non-Staff Expenditure and Regional Metrics Correlation
Regional MetricCorrelation Coefficient R-Squared P-value
Labor CategoryPilots NAICS 62 0.917 0.840 0.0014Nurses NAICS 62 0.824 0.679 0.0119EMT-Ps NAICS 62 -0.166 0.027 0.6949EMTs (See Note 1) NAICS 62 N/A N/A N/AAircraft Technicians / Mechanics NAICS 62 0.441 0.194 0.2745Dispatch NAICS 62 0.494 0.244 0.2131Other (See Note 2) NAICS 62 N/A N/A N/A
[Note 1]: Data are insufficient to calculate correlation.
[Note 2]: Respondents entered a w ide variety of jobs under this heading, making regional comparison impossible.
Table B-5 Rotary Wing Industry Non-Staff Expenditure and Regional Metrics Correlation
Regional MetricCorrelation Coefficient R-Squared P-value
Non-Labor CategoryFuel Flight Hours 0.860 0.740 0.0062Insurance Patient Transports 0.648 0.412 0.0862Aircraft Parts Number of Rotor Wing 0.838 0.702 0.0094Medical Supplies and Drugs Patient Transports 0.677 0.459 0.0649Maintenance and Equipment updates Flight Hours 0.771 0.594 0.0251Training and Development Number of Jobs 0.337 0.114 0.4138Total Annual Depreciation Number of Rotor Wing 0.570 0.325 0.1401
Source: Economic & Planning Systems
H:\21889-Economic Impact of Air M edical Industry\Data\[21889-Survey DATA-M arch 2013.xlsx]t8.2_NL_Corr_Summary
Figure B-1 Rotary Wing Industry Direct Spending Composition
Medical and diagnostic labs and outpatient and other ambulatory care services,
64.5%
Scenic and sightseeing transportation and support activities for transportation, 8.9%
Wholesale trade, 4.0%Management of companies
and enterprises, 3.9%
Commercial and industrial machinery and equipment rental and leasing, 2.7%
Aircraft engine and engine parts manufacturing, 2.7%
Other aircraft parts and auxiliary equipment manufacturing, 2.7%
Office administrative services, 1.9%
Legal services, 1.5%
Accounting, tax preparation, bookkeeping, and payroll
services, 1.5%
Search, detection, and navigation instruments manufacturing, 1.3%
Insurance carriers, 1.3%
Pharmaceutical preparation manufacturing, 0.5%
Surgical and medical instrument manufacturing,
0.5%
Facilities support services, 0.5%
Business support services, 0.5%
Other educational services, 0.5%
Real estate, 0.3%
Insurance agencies, brokerages, and related
activities, 0.2%
Source: Economic & Planning Systems

An Economic Analysis of the U.S. Rotary Wing Air Medical Transport Industry August 2014
Economic & Planning Systems, Inc. 49 Appendix B: Supporting Materials
In the following charts, the asterisk (*) denotes the inclusion of governmental enterprises.
Figure B-2 Indirect Jobs from Rotary Wing Industry Operational Impacts
Health care and social assistance, 71.8%
Administrative and waste management services, 9.0%
Real estate and rental and leasing, 4.4%
Professional, scientific, and technical services, 3.5%
Finance and insurance, 1.7%
Manufacturing, 1.7%
Food services and drinking places, 1.4%
Transportation and warehousing*, 1.3%
Management of companies and enterprises, 1.3%
Information, 0.8%
Wholesale trade, 0.7%
Other services*, 0.7%
Retail trade, 0.6%
Construction, 0.3%
Accommodation, 0.2%
Arts, entertainment, and recreation, 0.2%
Utilities*, 0.1% Mining, 0.0% Educational services, 0.0% Agriculture, forestry, fishing, and hunting, 0.0%
Source: Economic & Planning SystemsNote: Asterisk (*) denotes the industry include governmental enterprises.
Figure B-3 Induced Jobs from Rotary Wing Industry Operational Impact
Retail trade, 20.3%
Real estate and rental and leasing, 10.8%
Food services and drinking places, 10.7%
Finance and insurance, 9.6%
Administrative and waste management services, 7.2%
Manufacturing, 6.5%
Other services*, 6.3%
Professional, scientific, and technical services, 5.0%
Transportation and warehousing*, 3.9%
Wholesale trade, 3.8%
Educational services, 3.3%
Arts, entertainment, and recreation, 3.3%
Information, 3.0%
Accommodation, 1.8%
Management of companies and enterprises, 1.2%
Construction, 1.1% Agriculture, forestry, fishing, and hunting, 1.1%
Utilities*, 0.8% Mining, 0.2%
Source: Economic & Planning Systems
Note: Asterisk (*) denotes the industry include governmental enterprises.

An Economic Analysis of the U.S. Rotary Wing Air Medical Transport Industry August 2014
Economic & Planning Systems, Inc. 50 Appendix B: Supporting Materials
Figure B-4 Indirect Jobs from Rotary Wing Industry Capital Purchase Impacts
Manufacturing, 65.9%
Administrative and waste management services, 5.7%
Professional, scientific, and technical services, 5.3%
Management of companies and enterprises, 4.8%
Health care and social assistance, 4.7%
Wholesale trade, 2.5%
Transportation and warehousing*, 2.3%
Real estate and rental and leasing, 2.2%
Finance and insurance, 1.6%
Information, 1.3%
Food services and drinking places, 0.9%
Other services*, 0.6%
Retail trade, 0.6%
Construction, 0.4% Arts, entertainment, and recreation, 0.3%
Utilities*, 0.3% Accommodation, 0.3% Mining, 0.2% Agriculture, forestry, fishing, and hunting, 0.0%
Educational services, 0.0%
Source: Economic & Planning SystemsNote: Asterisk (*) denotes the industry include governmental enterprises.
Figure B-5 Induced Jobs from Rotary Wing Industry Capital Purchase Impacts
Retail trade, 17.9%
Arts, entertainment, and recreation, 17.0%
Real estate and rental and leasing, 9.8%
Other services*, 9.5%Finance and insurance, 8.4%
Administrative and waste management services, 6.5%
Manufacturing, 5.6%
Professional, scientific, and technical services, 4.5%
Transportation and warehousing*, 3.5%
Wholesale trade, 3.3%
Accommodation, 2.9%
Educational services, 2.9%
Information, 2.6%
Food services and drinking places, 1.6%
Management of companies and enterprises, 1.1%
Construction, 1.0% Agriculture, forestry, fishing, and hunting, 1.0%
Utilities*, 0.7% Mining, 0.2%
Source: Economic & Planning SystemsNote: Asterisk (*) denotes the industry include governmental enterprises.
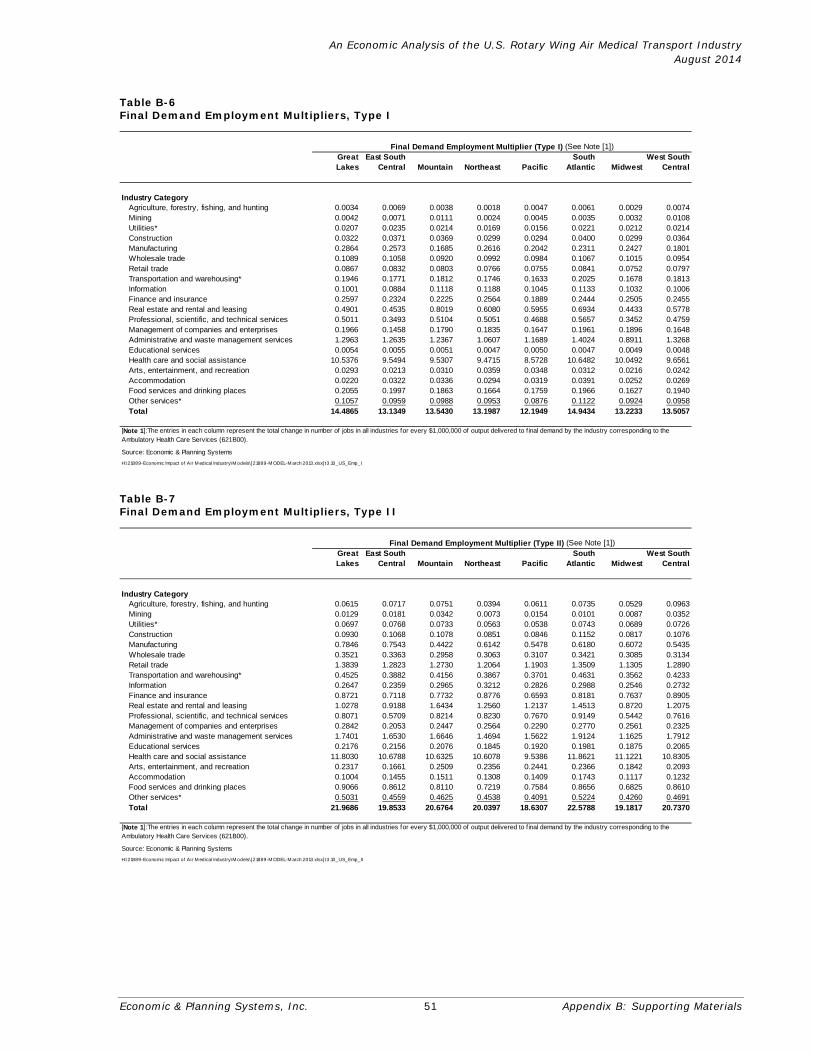
An Economic Analysis of the U.S. Rotary Wing Air Medical Transport Industry August 2014
Economic & Planning Systems, Inc. 51 Appendix B: Supporting Materials
Table B-6 Final Demand Employment Multipliers, Type I
Great Lakes
East South Central Mountain Northeast Pacific
South Atlantic Midwest
West South Central
Industry CategoryAgriculture, forestry, fishing, and hunting 0.0034 0.0069 0.0038 0.0018 0.0047 0.0061 0.0029 0.0074Mining 0.0042 0.0071 0.0111 0.0024 0.0045 0.0035 0.0032 0.0108Utilities* 0.0207 0.0235 0.0214 0.0169 0.0156 0.0221 0.0212 0.0214Construction 0.0322 0.0371 0.0369 0.0299 0.0294 0.0400 0.0299 0.0364Manufacturing 0.2864 0.2573 0.1685 0.2616 0.2042 0.2311 0.2427 0.1801Wholesale trade 0.1089 0.1058 0.0920 0.0992 0.0984 0.1067 0.1015 0.0954Retail trade 0.0867 0.0832 0.0803 0.0766 0.0755 0.0841 0.0752 0.0797Transportation and warehousing* 0.1946 0.1771 0.1812 0.1746 0.1633 0.2025 0.1678 0.1813Information 0.1001 0.0884 0.1118 0.1188 0.1045 0.1133 0.1032 0.1006Finance and insurance 0.2597 0.2324 0.2225 0.2564 0.1889 0.2444 0.2505 0.2455Real estate and rental and leasing 0.4901 0.4535 0.8019 0.6080 0.5955 0.6934 0.4433 0.5778Professional, scientific, and technical services 0.5011 0.3493 0.5104 0.5051 0.4688 0.5657 0.3452 0.4759Management of companies and enterprises 0.1966 0.1458 0.1790 0.1835 0.1647 0.1961 0.1896 0.1648Administrative and waste management services 1.2963 1.2635 1.2367 1.0607 1.1689 1.4024 0.8911 1.3268Educational services 0.0054 0.0055 0.0051 0.0047 0.0050 0.0047 0.0049 0.0048Health care and social assistance 10.5376 9.5494 9.5307 9.4715 8.5728 10.6482 10.0492 9.6561Arts, entertainment, and recreation 0.0293 0.0213 0.0310 0.0359 0.0348 0.0312 0.0216 0.0242Accommodation 0.0220 0.0322 0.0336 0.0294 0.0319 0.0391 0.0252 0.0269Food services and drinking places 0.2055 0.1997 0.1863 0.1664 0.1759 0.1966 0.1627 0.1940Other services* 0.1057 0.0959 0.0988 0.0953 0.0876 0.1122 0.0924 0.0958Total 14.4865 13.1349 13.5430 13.1987 12.1949 14.9434 13.2233 13.5057
Source: Economic & Planning Systems
H:\21889-Economic Impact of Air M edical Industry\M odels\[21889-M ODEL-M arch 2013.xlsx]t3.10_US_Emp_I
Final Demand Employment Multiplier (Type I) (See Note [1])
[Note 1]:The entries in each column represent the total change in number of jobs in all industries for every $1,000,000 of output delivered to f inal demand by the industry corresponding to the Ambulatory Health Care Services (621B00).
Table B-7 Final Demand Employment Multipliers, Type II
Great Lakes
East South Central Mountain Northeast Pacific
South Atlantic Midwest
West South Central
Industry CategoryAgriculture, forestry, fishing, and hunting 0.0615 0.0717 0.0751 0.0394 0.0611 0.0735 0.0529 0.0963Mining 0.0129 0.0181 0.0342 0.0073 0.0154 0.0101 0.0087 0.0352Utilities* 0.0697 0.0768 0.0733 0.0563 0.0538 0.0743 0.0689 0.0726Construction 0.0930 0.1068 0.1078 0.0851 0.0846 0.1152 0.0817 0.1076Manufacturing 0.7846 0.7543 0.4422 0.6142 0.5478 0.6180 0.6072 0.5435Wholesale trade 0.3521 0.3363 0.2958 0.3063 0.3107 0.3421 0.3085 0.3134Retail trade 1.3839 1.2823 1.2730 1.2064 1.1903 1.3509 1.1305 1.2890Transportation and warehousing* 0.4525 0.3882 0.4156 0.3867 0.3701 0.4631 0.3562 0.4233Information 0.2647 0.2359 0.2965 0.3212 0.2826 0.2988 0.2546 0.2732Finance and insurance 0.8721 0.7118 0.7732 0.8776 0.6593 0.8181 0.7637 0.8905Real estate and rental and leasing 1.0278 0.9188 1.6434 1.2560 1.2137 1.4513 0.8720 1.2075Professional, scientific, and technical services 0.8071 0.5709 0.8214 0.8230 0.7670 0.9149 0.5442 0.7616Management of companies and enterprises 0.2842 0.2053 0.2447 0.2564 0.2290 0.2770 0.2561 0.2325Administrative and waste management services 1.7401 1.6530 1.6646 1.4694 1.5622 1.9124 1.1625 1.7912Educational services 0.2176 0.2156 0.2076 0.1845 0.1920 0.1981 0.1875 0.2065Health care and social assistance 11.8030 10.6788 10.6325 10.6078 9.5386 11.8621 11.1221 10.8305Arts, entertainment, and recreation 0.2317 0.1661 0.2509 0.2356 0.2441 0.2366 0.1842 0.2093Accommodation 0.1004 0.1455 0.1511 0.1308 0.1409 0.1743 0.1117 0.1232Food services and drinking places 0.9066 0.8612 0.8110 0.7219 0.7584 0.8656 0.6825 0.8610Other services* 0.5031 0.4559 0.4625 0.4538 0.4091 0.5224 0.4260 0.4691Total 21.9686 19.8533 20.6764 20.0397 18.6307 22.5788 19.1817 20.7370
Source: Economic & Planning Systems
H:\21889-Economic Impact of Air M edical Industry\M odels\[21889-M ODEL-M arch 2013.xlsx]t3.10_US_Emp_II
Final Demand Employment Multiplier (Type II) (See Note [1])
[Note 1]:The entries in each column represent the total change in number of jobs in all industries for every $1,000,000 of output delivered to f inal demand by the industry corresponding to the Ambulatory Health Care Services (621B00).
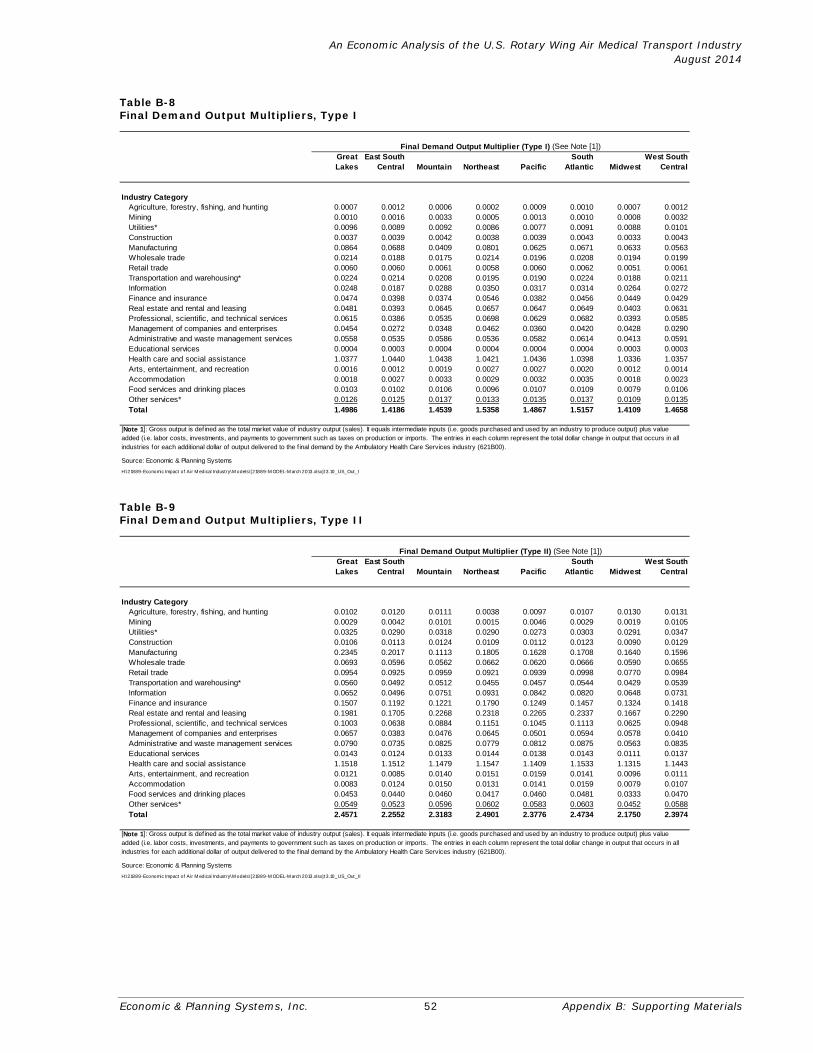
An Economic Analysis of the U.S. Rotary Wing Air Medical Transport Industry August 2014
Economic & Planning Systems, Inc. 52 Appendix B: Supporting Materials
Table B-8 Final Demand Output Multipliers, Type I
Great Lakes
East South Central Mountain Northeast Pacific
South Atlantic Midwest
West South Central
Industry CategoryAgriculture, forestry, fishing, and hunting 0.0007 0.0012 0.0006 0.0002 0.0009 0.0010 0.0007 0.0012Mining 0.0010 0.0016 0.0033 0.0005 0.0013 0.0010 0.0008 0.0032Utilities* 0.0096 0.0089 0.0092 0.0086 0.0077 0.0091 0.0088 0.0101Construction 0.0037 0.0039 0.0042 0.0038 0.0039 0.0043 0.0033 0.0043Manufacturing 0.0864 0.0688 0.0409 0.0801 0.0625 0.0671 0.0633 0.0563Wholesale trade 0.0214 0.0188 0.0175 0.0214 0.0196 0.0208 0.0194 0.0199Retail trade 0.0060 0.0060 0.0061 0.0058 0.0060 0.0062 0.0051 0.0061Transportation and warehousing* 0.0224 0.0214 0.0208 0.0195 0.0190 0.0224 0.0188 0.0211Information 0.0248 0.0187 0.0288 0.0350 0.0317 0.0314 0.0264 0.0272Finance and insurance 0.0474 0.0398 0.0374 0.0546 0.0382 0.0456 0.0449 0.0429Real estate and rental and leasing 0.0481 0.0393 0.0645 0.0657 0.0647 0.0649 0.0403 0.0631Professional, scientific, and technical services 0.0615 0.0386 0.0535 0.0698 0.0629 0.0682 0.0393 0.0585Management of companies and enterprises 0.0454 0.0272 0.0348 0.0462 0.0360 0.0420 0.0428 0.0290Administrative and waste management services 0.0558 0.0535 0.0586 0.0536 0.0582 0.0614 0.0413 0.0591Educational services 0.0004 0.0003 0.0004 0.0004 0.0004 0.0004 0.0003 0.0003Health care and social assistance 1.0377 1.0440 1.0438 1.0421 1.0436 1.0398 1.0336 1.0357Arts, entertainment, and recreation 0.0016 0.0012 0.0019 0.0027 0.0027 0.0020 0.0012 0.0014Accommodation 0.0018 0.0027 0.0033 0.0029 0.0032 0.0035 0.0018 0.0023Food services and drinking places 0.0103 0.0102 0.0106 0.0096 0.0107 0.0109 0.0079 0.0106Other services* 0.0126 0.0125 0.0137 0.0133 0.0135 0.0137 0.0109 0.0135Total 1.4986 1.4186 1.4539 1.5358 1.4867 1.5157 1.4109 1.4658
Source: Economic & Planning Systems
H:\21889-Economic Impact of Air M edical Industry\M odels\ [21889-M ODEL-M arch 2013.xlsx]t3.10_US_Out_I
Final Demand Output Multiplier (Type I) (See Note [1])
[Note 1]: Gross output is defined as the total market value of industry output (sales). It equals intermediate inputs (i.e. goods purchased and used by an industry to produce output) plus value added (i.e. labor costs, investments, and payments to government such as taxes on production or imports. The entries in each column represent the total dollar change in output that occurs in all industries for each additional dollar of output delivered to the f inal demand by the Ambulatory Health Care Services industry (621B00).
Table B-9 Final Demand Output Multipliers, Type II
Great Lakes
East South Central Mountain Northeast Pacific
South Atlantic Midwest
West South Central
Industry CategoryAgriculture, forestry, fishing, and hunting 0.0102 0.0120 0.0111 0.0038 0.0097 0.0107 0.0130 0.0131Mining 0.0029 0.0042 0.0101 0.0015 0.0046 0.0029 0.0019 0.0105Utilities* 0.0325 0.0290 0.0318 0.0290 0.0273 0.0303 0.0291 0.0347Construction 0.0106 0.0113 0.0124 0.0109 0.0112 0.0123 0.0090 0.0129Manufacturing 0.2345 0.2017 0.1113 0.1805 0.1628 0.1708 0.1640 0.1596Wholesale trade 0.0693 0.0596 0.0562 0.0662 0.0620 0.0666 0.0590 0.0655Retail trade 0.0954 0.0925 0.0959 0.0921 0.0939 0.0998 0.0770 0.0984Transportation and warehousing* 0.0560 0.0492 0.0512 0.0455 0.0457 0.0544 0.0429 0.0539Information 0.0652 0.0496 0.0751 0.0931 0.0842 0.0820 0.0648 0.0731Finance and insurance 0.1507 0.1192 0.1221 0.1790 0.1249 0.1457 0.1324 0.1418Real estate and rental and leasing 0.1981 0.1705 0.2268 0.2318 0.2265 0.2337 0.1667 0.2290Professional, scientific, and technical services 0.1003 0.0638 0.0884 0.1151 0.1045 0.1113 0.0625 0.0948Management of companies and enterprises 0.0657 0.0383 0.0476 0.0645 0.0501 0.0594 0.0578 0.0410Administrative and waste management services 0.0790 0.0735 0.0825 0.0779 0.0812 0.0875 0.0563 0.0835Educational services 0.0143 0.0124 0.0133 0.0144 0.0138 0.0143 0.0111 0.0137Health care and social assistance 1.1518 1.1512 1.1479 1.1547 1.1409 1.1533 1.1315 1.1443Arts, entertainment, and recreation 0.0121 0.0085 0.0140 0.0151 0.0159 0.0141 0.0096 0.0111Accommodation 0.0083 0.0124 0.0150 0.0131 0.0141 0.0159 0.0079 0.0107Food services and drinking places 0.0453 0.0440 0.0460 0.0417 0.0460 0.0481 0.0333 0.0470Other services* 0.0549 0.0523 0.0596 0.0602 0.0583 0.0603 0.0452 0.0588Total 2.4571 2.2552 2.3183 2.4901 2.3776 2.4734 2.1750 2.3974
Source: Economic & Planning Systems
H:\21889-Economic Impact of Air M edical Industry\M odels\ [21889-M ODEL-M arch 2013.xlsx]t3.10_US_Out_II
Final Demand Output Multiplier (Type II) (See Note [1])
[Note 1]: Gross output is defined as the total market value of industry output (sales). It equals intermediate inputs (i.e. goods purchased and used by an industry to produce output) plus value added (i.e. labor costs, investments, and payments to government such as taxes on production or imports. The entries in each column represent the total dollar change in output that occurs in all industries for each additional dollar of output delivered to the f inal demand by the Ambulatory Health Care Services industry (621B00).

An Economic Analysis of the U.S. Rotary Wing Air Medical Transport Industry August 2014
Economic & Planning Systems, Inc. 53 Appendix B: Supporting Materials
Table B-10 Final Demand Wages and Benefits Multipliers, Type I
Great Lakes
East South Central Mountain Northeast Pacific
South Atlantic Midwest
West South Central
Industry CategoryAgriculture, forestry, fishing, and hunting 0.0001 0.0002 0.0001 0.0000 0.0002 0.0002 0.0001 0.0002Mining 0.0002 0.0003 0.0007 0.0001 0.0003 0.0002 0.0002 0.0007Utilities* 0.0021 0.0020 0.0020 0.0018 0.0017 0.0021 0.0019 0.0022Construction 0.0014 0.0015 0.0016 0.0015 0.0015 0.0016 0.0012 0.0017Manufacturing 0.0173 0.0133 0.0089 0.0165 0.0128 0.0135 0.0135 0.0106Wholesale trade 0.0069 0.0059 0.0056 0.0069 0.0064 0.0067 0.0062 0.0065Retail trade 0.0021 0.0021 0.0021 0.0020 0.0021 0.0022 0.0018 0.0021Transportation and warehousing* 0.0090 0.0082 0.0084 0.0083 0.0080 0.0092 0.0075 0.0085Information 0.0055 0.0040 0.0063 0.0080 0.0072 0.0070 0.0057 0.0059Finance and insurance 0.0137 0.0110 0.0105 0.0163 0.0112 0.0128 0.0127 0.0122Real estate and rental and leasing 0.0071 0.0058 0.0095 0.0095 0.0095 0.0095 0.0059 0.0093Professional, scientific, and technical services 0.0284 0.0173 0.0252 0.0329 0.0296 0.0316 0.0182 0.0274Management of companies and enterprises 0.0185 0.0108 0.0143 0.0189 0.0147 0.0170 0.0172 0.0118Administrative and waste management services 0.0287 0.0270 0.0301 0.0269 0.0302 0.0312 0.0205 0.0304Educational services 0.0002 0.0001 0.0002 0.0002 0.0002 0.0002 0.0001 0.0001Health care and social assistance 0.4848 0.4809 0.4898 0.4901 0.4913 0.4851 0.4805 0.4869Arts, entertainment, and recreation 0.0006 0.0004 0.0007 0.0009 0.0010 0.0007 0.0005 0.0005Accommodation 0.0006 0.0008 0.0010 0.0009 0.0010 0.0011 0.0005 0.0007Food services and drinking places 0.0033 0.0032 0.0034 0.0031 0.0034 0.0035 0.0025 0.0034Other services* 0.0040 0.0039 0.0044 0.0042 0.0043 0.0044 0.0035 0.0043Total 0.6345 0.5987 0.6248 0.6490 0.6366 0.6398 0.6002 0.6254
Source: Economic & Planning Systems
H:\21889-Economic Impact of Air M edical Industry\M odels\[21889-M ODEL-M arch 2013.xlsx]t3.10_US_Earn_I
Final Demand Earnings Multiplier (Type I) (See Note [1])
[Note 1]: The entries in each column represent the total dollar change in earnings of households employed by all industries for each additional dollar of output delivered to the f inal demand by the Ambulatory Health Care Services industry (621B00).
Table B-11 Final Demand Wages and Benefits Multipliers, Type II
Great Lakes
East South Central Mountain Northeast Pacific
South Atlantic Midwest
West South Central
Industry CategoryAgriculture, forestry, fishing, and hunting 0.0015 0.0020 0.0019 0.0007 0.0019 0.0020 0.0018 0.0020Mining 0.0006 0.0009 0.0021 0.0003 0.0009 0.0007 0.0004 0.0022Utilities* 0.0070 0.0063 0.0069 0.0061 0.0057 0.0068 0.0061 0.0074Construction 0.0041 0.0042 0.0048 0.0042 0.0043 0.0047 0.0034 0.0050Manufacturing 0.0426 0.0353 0.0211 0.0346 0.0301 0.0314 0.0304 0.0278Wholesale trade 0.0223 0.0187 0.0182 0.0214 0.0201 0.0214 0.0188 0.0212Retail trade 0.0332 0.0316 0.0335 0.0322 0.0329 0.0347 0.0265 0.0344Transportation and warehousing* 0.0207 0.0175 0.0193 0.0179 0.0177 0.0209 0.0158 0.0200Information 0.0141 0.0104 0.0162 0.0209 0.0189 0.0180 0.0138 0.0156Finance and insurance 0.0433 0.0325 0.0337 0.0537 0.0366 0.0406 0.0369 0.0395Real estate and rental and leasing 0.0148 0.0117 0.0193 0.0194 0.0191 0.0196 0.0114 0.0193Professional, scientific, and technical services 0.0470 0.0291 0.0422 0.0548 0.0498 0.0523 0.0293 0.0451Management of companies and enterprises 0.0267 0.0152 0.0196 0.0264 0.0204 0.0240 0.0232 0.0167Administrative and waste management services 0.0388 0.0355 0.0404 0.0372 0.0404 0.0426 0.0268 0.0411Educational services 0.0059 0.0051 0.0055 0.0059 0.0057 0.0058 0.0045 0.0057Health care and social assistance 0.5389 0.5310 0.5395 0.5436 0.5375 0.5387 0.5265 0.5387Arts, entertainment, and recreation 0.0045 0.0030 0.0050 0.0055 0.0058 0.0052 0.0036 0.0042Accommodation 0.0025 0.0037 0.0045 0.0040 0.0043 0.0048 0.0024 0.0032Food services and drinking places 0.0145 0.0138 0.0148 0.0134 0.0148 0.0154 0.0106 0.0151Other services* 0.0175 0.0163 0.0186 0.0185 0.0180 0.0188 0.0142 0.0184Total 0.9005 0.8238 0.8671 0.9207 0.8849 0.9084 0.8064 0.8826
Source: Economic & Planning Systems
H:\21889-Economic Impact of Air M edical Industry\M odels\[21889-M ODEL-M arch 2013.xlsx]t3.10_US_Earn_II
Final Demand Earnings Multiplier (Type II) (See Note [1])
[Note 1]: The entries in each column represent the total dollar change in earnings of households employed by all industries for each additional dollar of output delivered to the f inal demand by the Ambulatory Health Care Services industry (621B00).

An Economic Analysis of the U.S. Rotary Wing Air Medical Transport Industry August 2014
Economic & Planning Systems, Inc. 54 Appendix B: Supporting Materials
Table B-12 Final Demand Value Added Multipliers, Type I
Great Lakes
East South Central Mountain Northeast Pacific
South Atlantic Midwest
West South Central
Industry CategoryAgriculture, forestry, fishing, and hunting 0.0002 0.0004 0.0002 0.0001 0.0003 0.0004 0.0002 0.0004Mining 0.0005 0.0009 0.0017 0.0003 0.0007 0.0005 0.0004 0.0016Utilities* 0.0062 0.0059 0.0059 0.0054 0.0048 0.0060 0.0056 0.0063Construction 0.0018 0.0020 0.0021 0.0019 0.0019 0.0021 0.0016 0.0022Manufacturing 0.0335 0.0245 0.0167 0.0329 0.0256 0.0265 0.0248 0.0193Wholesale trade 0.0145 0.0127 0.0118 0.0145 0.0133 0.0140 0.0131 0.0135Retail trade 0.0039 0.0039 0.0040 0.0038 0.0039 0.0041 0.0034 0.0040Transportation and warehousing* 0.0130 0.0125 0.0120 0.0117 0.0112 0.0132 0.0111 0.0121Information 0.0134 0.0101 0.0157 0.0190 0.0173 0.0170 0.0145 0.0149Finance and insurance 0.0281 0.0239 0.0225 0.0324 0.0228 0.0274 0.0267 0.0258Real estate and rental and leasing 0.0366 0.0296 0.0492 0.0504 0.0495 0.0497 0.0307 0.0481Professional, scientific, and technical services 0.0425 0.0268 0.0369 0.0482 0.0435 0.0470 0.0272 0.0405Management of companies and enterprises 0.0282 0.0169 0.0216 0.0286 0.0224 0.0261 0.0266 0.0180Administrative and waste management services 0.0401 0.0385 0.0418 0.0376 0.0416 0.0436 0.0292 0.0422Educational services 0.0002 0.0002 0.0002 0.0002 0.0002 0.0002 0.0002 0.0002Health care and social assistance 0.6150 0.6187 0.6186 0.6176 0.6185 0.6163 0.6126 0.6138Arts, entertainment, and recreation 0.0010 0.0007 0.0012 0.0016 0.0017 0.0012 0.0007 0.0008Accommodation 0.0012 0.0018 0.0022 0.0019 0.0021 0.0023 0.0011 0.0015Food services and drinking places 0.0053 0.0053 0.0055 0.0050 0.0056 0.0057 0.0041 0.0055Other services* 0.0073 0.0072 0.0079 0.0074 0.0076 0.0078 0.0063 0.0078Total 0.8925 0.8425 0.8777 0.9205 0.8945 0.9111 0.8401 0.8785
Source: Economic & Planning Systems
H:\21889-Economic Impact of Air M edical Industry\M odels\[21889-M ODEL-M arch 2013.xlsx]t3.10_US_VA_I
Final Demand Value Added Multiplier (Type I) (See Note [1])
[Note 1]: The entries in each column represent the total dollar change in value added that occurs in all industries for each additional dollar of output delivered to the f inal demand by the Ambulatory Health Care Services industry (621B00).
Table B-13 Final Demand Value Added Multipliers, Type II
Great Lakes
East South Central Mountain Northeast Pacific
South Atlantic Midwest
West South Central
Industry CategoryAgriculture, forestry, fishing, and hunting 0.0038 0.0041 0.0042 0.0018 0.0042 0.0043 0.0040 0.0041Mining 0.0015 0.0022 0.0051 0.0008 0.0023 0.0015 0.0010 0.0053Utilities* 0.0205 0.0188 0.0198 0.0176 0.0163 0.0198 0.0180 0.0212Construction 0.0053 0.0056 0.0062 0.0054 0.0056 0.0061 0.0045 0.0064Manufacturing 0.0809 0.0665 0.0382 0.0709 0.0578 0.0638 0.0556 0.0494Wholesale trade 0.0468 0.0402 0.0380 0.0447 0.0419 0.0450 0.0399 0.0442Retail trade 0.0625 0.0606 0.0628 0.0603 0.0615 0.0654 0.0504 0.0645Transportation and warehousing* 0.0301 0.0269 0.0273 0.0251 0.0246 0.0297 0.0235 0.0284Information 0.0353 0.0267 0.0411 0.0507 0.0462 0.0445 0.0354 0.0399Finance and insurance 0.0884 0.0718 0.0716 0.1038 0.0727 0.0866 0.0781 0.0834Real estate and rental and leasing 0.1459 0.1246 0.1683 0.1725 0.1683 0.1736 0.1226 0.1698Professional, scientific, and technical services 0.0691 0.0440 0.0608 0.0792 0.0720 0.0767 0.0432 0.0656Management of companies and enterprises 0.0407 0.0238 0.0295 0.0400 0.0311 0.0368 0.0359 0.0254Administrative and waste management services 0.0554 0.0517 0.0575 0.0533 0.0568 0.0608 0.0390 0.0583Educational services 0.0082 0.0071 0.0076 0.0082 0.0079 0.0082 0.0063 0.0078Health care and social assistance 0.6850 0.6846 0.6825 0.6866 0.6780 0.6859 0.6727 0.6805Arts, entertainment, and recreation 0.0074 0.0051 0.0086 0.0092 0.0098 0.0087 0.0060 0.0068Accommodation 0.0054 0.0080 0.0097 0.0084 0.0091 0.0102 0.0051 0.0069Food services and drinking places 0.0235 0.0229 0.0239 0.0217 0.0240 0.0250 0.0173 0.0245Other services* 0.0290 0.0273 0.0311 0.0309 0.0302 0.0316 0.0239 0.0308Total 1.4447 1.3225 1.3938 1.4911 1.4203 1.4842 1.2824 1.4232
Source: Economic & Planning Systems
H:\21889-Economic Impact of Air M edical Industry\M odels\[21889-M ODEL-M arch 2013.xlsx]t3.10_US_VA_II
Final Demand Value Added Multiplier (Type II) (See Note [1])
[Note 1]: The entries in each column represent the total dollar change in value added that occurs in all industries for each additional dollar of output delivered to the f inal demand by the Ambulatory Health Care Services industry (621B00).

An Economic Analysis of the U.S. Rotary Wing Air Medical Transport Industry August 2014
Economic & Planning Systems, Inc. 55 Appendix B: Supporting Materials
Table B-14 Direct Effect Multipliers
East South Central
Great Lakes Midwest Mountain Northeast Pacific
South Atlantic
West South Central
MultipliersDirect + Indirect Multiplier 1.4357 1.4260 1.3596 1.4829 1.4517 1.4844 1.4587 1.4482Direct + Indirect + Induced Multiplier 2.1812 2.1754 1.9841 2.2767 2.2193 2.2860 2.2152 2.2387
Source: Economic & Planning Systems
H:\2011 Projects\21889-Economic Impact of Air M edical Industry\M odels\ [21889-M ODEL-June 2014.xlsx]Sheet6
Direct Effect Employment Multipliers (Type I) (See Note [1])
[Note 1]: The entries in each column represent the total employment that results from the Ambulatory Health Care Services industry (621B00) direct employment.