an economic assessment of government incentives
TRANSCRIPT

i
An Economic Assessment Of Government Incentives
Economic Assessment of Government Incentives required for the Promotion of Wide-Scale Utilization and Local Manufacture of Hermetic Storage Technologies
FEBRUARY 2020

ii
An Economic Assessment Of Government Incentives
Correct citation AGRA. (2020). Economic Assessment of Government Incentives Required for the Promotion of Wide-Scale Utilization and Local Manufacture of Hermetic Storage Technologies
Copyright ©2020, Alliance for a Green Revolution in Africa (AGRA) All rights reserved.
The publisher encourages fair use of this material provided proper citation is made.
Alliance for a Green Revolution in Africa (AGRA), West End Towers, 4th Floor, Kanjata Road, off Muthangari Drive, Off Waiyaki Way, PO Box 66773, Westlands 00800, Nairobi, Kenya.
The opinions expressed in this publication are those of the authors and do not necessarily reflect the policies or position of Alliance for a Green Revolution in Africa (AGRA) or its employees. Although AGRA has made every effort to ensure accuracy and completeness of information entered into this book, we assume no responsibilities for errors, inaccuracies, omissions or inconsistencies included herein.
The mention of specific companies, manufacturers or their products, whether or not these have been patented, does not imply endorsement or recommendation or approval by AGRA in preference to others of a similar nature that are not mentioned.
The descriptions, charts and maps used do not imply the expression of any opinion whatsoever on the part of AGRA concerning the development, legal or constitutional status of any country.
Authors: Dr. Josaphat Kweka - Team Leader, Talanta International Dr. Martin Chegere - Lecturer, University of Dar-es-Salaam Mr. Solomon Michael - Research Analyst, Talanta International

iii
An Economic Assessment Of Government Incentives
TABLE OF CONTENTS
LIST OF FIGURES iii
ACRONYMS iv
EXECUTIVE SUMMARY v
1.0 INTRODUCTION 1
1.1 Background and Motivation1.2 Objectives and Research Questions1.3 Structure of the Report
123
2.0 HERMETIC STORAGE TECHNOLOGIES SUB-SECTOR IN TANZANIA 4
2.1 Overview of the HST Sub-sector in Tanzania2.2 Review of the Literature
2.2.1 Theoretical and Empirical Studies on the Role of HST2.2.2 Key Challenges Identified in the Literature Review
4669
3.0 APPROACH AND METHODOLOGY 11
3.1 Overview: Approach and Study design3.2 Regulatory Impact Assessment
3.2.1 Main Steps3.2.2 Analytical Framework for RIA3.2.3 Data
1111111214
3.3 Field Survey3.3.1 Structured Interviews3.3.2 Stakeholder Consultations3.3.3 Execution of the Field Work
14151516
3.4 A CGE Analysis3.4.1 Introduction3.4.2 The CGE Model3.4.3 SAM for Tanzania3.4.4 Model Simulations3.4.5 Model Sensitivity Analysis
171717212122
4.0 RESULTS AND FINDINGS 23
4.1 Descriptive Analysis of the Survey Data4.1.1 Insights From Farmers4.1.2 Insights from NGOs and Agricultural and Extension Officers4.1.3 Insights from Distributors4.1.4 Insights from Manufacturers of HSTs4.1.5 Synopsis
232328282933

iv
An Economic Assessment Of Government Incentives
4.2 Regulatory Impact Assessment: Results of the Cost Benefit Analysis4.2.1 Introduction4.2.2 Cost Estimates4.2.3 Benefits Estimates4.2.4 Net Benefits Estimates4.2.5 Changes in Demand and Willingness to Pay after VAT Removal4.2.6 Conclusion of the Cost Benefit Analysis
35353637393943
4.3 Economy-wide Impact of Removing VAT on HSTs4.3.1 Introduction4.3.2 Impact of Removal of VAT on HSTs4.3.3 Comparison of Impact of Alternative Policy Options to support HSTs4.3.4 Assumptions Governing Interpretation of the Findings
4444444650
5.0 CONCLUSION AND POLICY RECOMMENDATIONS 51
5.1 Summary of Main Findings5.2 Policy Recommendations5.3 Areas for Further Research5.4 Next Steps
51535354
REFERENCES 55
APPENDICEs 57
Appendix A: Terms of References for the Study 57
Appendix B: Questionnaires and Guiding Questions 61

1
An Economic Assessment Of Government Incentives
LIST OF TABLES
Table 2.1: Findings from HST in OAF (2016) 8
Table 3.1: Sample and Response rate for Structured Interviews 15
Table 4.1: Impact of VAT removal on Price and Production volume by firm 30
Table 4.2: Proposed policy measures for promoting HSTs 32
Table 4.3: Cost structure of producing one hermetic bag (percentage of unit price) 33
Table 4.4: The main crops grown by farmers 35
Table 4.5: Proportions of farmers using different storage method by crops 35
Table 4.6: Proportions of farmers using HST by type 36
Table 4.7: Criteria for choosing a storage method 36
Table 4.8: Price and use of Hermetic bags 37
Table 4.9: Estimation of extra costs related to adoption of HST 37
Table 4.10: The marginal value gained by average farmer using hermetic bags 38
Table 4.11: Average duration of storage 39
Table 4.12: Demand gap for HST by farmers 39
Table 4.13: Reasons why farmers had a demand gap for HST 39
Table 4.14: Willingness to buy HST 40
Table 4.15: Household welfare impact of Removal of VAT on Plastics used in Agriculture HST 45
Table 4.16: Impacts of agricultural policy on price and foreign trade 46
Table 4.17: Aggregate external competitiveness impacts 47
Table 4.18: Changes in demand and supply in the economy 48
Table 4.19: Change in household income 48
Table 4.20: Change in demand for factors 48
Table 4.21: Macroeconomic changes 49
Table 4.22: Welfare impact 49
2
An Economic Assessment Of Government Incentives
LIST OF FIGURES
Figure 2.1: Hermetic storage bags produced in Tanzania 7
Figure 2.2: Sample of International Trade Database on Hermetic Bags 10
Figure 3.1: Circular flow of the economy 18
Figure 4.1: Age profile of interviewed farmers 23
Figure 4.2: Educational profile of interviewed farmers 23
Figure 4.3: Gender profile of interviewed farmers 23
Figure 4.4: Storage incidence among interviewed farmers 24
Figure 4.5: Main method of storage 24
Figure 4.6.: Main crops farmed 24
Figure 4.7: Main method of storage 24
Figure 4.8: Criteria for selecting the main storage method 25
Figure 4.9: Use of HST 25
Figure 4.10: Which HST is used (note PICs = any hermetic bag) 25
Figure 4.11: Willingness to pay for HST next season 26
Figure 4.12: Average price (value) of stored produce per kg 26
Figure 4.13: Average price of produce at the harvest season per kg 26
Figure 4.14: Proportion of produce sold during harvest period 26
Figure 4.15: Units of HST used last season 27
Figure 4.16: Adequacy of used hermetic bags vs. needs 27
Figure 4.17: Strategies to promote utilization of HST 27
Figure 4.18: NGOs awareness of HST 28
Figure 4.19: NGO perspectives on the Challenges faced by farmers in using HSTs 28
Figure 4.20: All Distributors have capacity to supply more Hermetic bags 28
Figure 4.21: Factors limiting Distributors capacity to supply more HSTs 28
Figure 4.22: Approaches proposed by Distributors for promoting HST 29
Figure 4.23: Distributors’ main Customers for Hermetic Bags 29
Figure 4.24: All distributors refute presence of counterfeit HSTs 29
Figure 4.25: Distribution of Willingness to pay (n=203) 40
Figure 4.26: Willingness to Pay for Hermetic Bags 41
Figure 4.27: Impact of Removal of VAT on Plastics used in Agriculture HST by Products 44
Figure 4.28: Consumption and Production effects of Removal of VAT on HSTs by Products 44

3
An Economic Assessment Of Government Incentives
ACRONYMS
AfDB African Development Bank
AMCOs Agricultural Marketing Co-operative Societies
ASDP Agriculture Sector Development Plan
BCA Benefit Cost Analysis
CBA Cost Benefit Analysis
CGE Computable General Equilibrium Model
CRS Catholic Relief Services
CSO Civil Society Organization
DFID Department for International Development
EU European Union
FANRPAN Food Agriculture and Natural Resource Policy Network
FAO Food and Agriculture Organization
GDP Gross Domestic Product
HST Hermetic Storage Technology
IRR Internal Rate of Return
LGB Larger Grain Borer
MOA Ministry of Agriculture
MT Metric Ton
NBS National Bureau of Statistics
NGOs Non-Governmental Organizations
NPV Net Present Value
PHL Post-Harvest Loss
PHLM Post-Harvest Loss Management
PHM Post-Harvest Management
PHS Post Harvest Storage
PHSM Post Harvest Storage Management
PHT Post Harvest Technology
PICS Purdue Improved Crop Storage
PO-RALG President’s Office Rural Administration and Local Government
R&D Research and Development
RIA Regulatory Impact Assessment
SADC Southern Africa Development Committee
SSA Sub-Saharan Africa
TBS Tanzania Bureau of Standards

4
An Economic Assessment Of Government Incentives
TIC Tanzania Investment Centre
UN United Nations
USAID United States Agency for International Development
WFP World Food Program

5
An Economic Assessment Of Government Incentives
EXECUTIVE SUMMARY
Summary of Main Findings
Post-harvest losses in cereals and other staple food crops has been identified as a huge challenge and threat to food security in Africa. Total food losses in sub-Saharan Africa (SSA) are estimated at $4 billion per year, an amount that can feed 48 million people (FAO, 2013). Furthermore, FAO predicts that globally, about 1.3 billion tons of food either goes to waste or is lost annually, and is responsible for economic costs estimated at US $750 billion (Gustavasson, et al. 2011). Indeed, post-harvest losses is one of the priority issues for development agencies as well as a topical issue for innovation and policy research. In response, various post-harvest storage technologies have been developed to counter post-harvest loss. One of the increasingly popular technologies is hermetic storage technologies (HSTs) which include hermetic bags, cocoons, silos or metal canisters.
However, a review of policy documents and literature indicate that both the utilization and local manufacture of hermetic storage technologies (HSTs) is very low in Tanzania, implying that the uptake for the technology is far less than desired. Indeed, all stakeholders attribute the low uptake to the high cost of the technology. Other reasons, such as low levels of awareness and business environment challenges, limit the extent of manufacture and uptake. Subsequently, most stakeholders have advocated for the removal of value added tax (VAT) on the manufacture of HSTs as one of the effective means to promote wide-scale local manufacturing and utilization of HST. But fiscally, is this feasible? What will be the benefit to the economy and costs to the Government? What are the policy options for incentives that can be considered?
The Alliance for a Green Revolution in Africa (AGRA) commissioned a study to support the Government of Tanzania’s policy initiatives to alleviate post-harvest losses by examining possible fiscal incentives for the promotion of wide-scale utilization and local manufacture of hermetic storage technologies. This objective was achieved by collecting data and information through field surveys from various stakeholders of HSTs (farmers, distributors, and manufacturers, NGOs, Extension Officers and Government MDAs) for conducting a Regulatory Impact Assessment (RIA) of the proposed removal of 18% VAT charged in

6
An Economic Assessment Of Government Incentives
the production of hermetic technologies. Furthermore, using a Computable General Equilibrium (CGE) model, the study examined the economy-wide impacts of three alternatively policy instruments for promoting wide-scale manufacture and utilization of HSTs. These are: (i) removal of taxation on storage materials of agricultural goods; (ii) subsidization of storage materials on agriculture; and (iii) increase in agricultural productivity as a whole. The study revealed several interesting findings.
First, the demand for HST is increasing as awareness increase amongst farmers. In particular, hermetic bags are mainly used compared to other HSTs because of availability, suitability and affordability. The increasing demand raises the challenge of production response. Policies for promoting the increased manufacture of hermetic bags are therefore fundamental to containment of the high prices. Clearly, compared to metal silos and cocoons, only HST bags have a real potential for wide-scale manufacturing due to their usefulness to smallholder farmers. However, farmers are constrained by the relatively higher price of hermetic bags compared to their desire to use them, thus creating a demand gap. Manufacturers are also producing at capacity with room to produce more bags and farmers are willing to buy more of the hermetic bags if the price is lowered. Indeed, manufacturers and distributors are willing to fully pass through the benefits of tax removal by lowering prices by the same proportion of the tax.
Second, the benefits from implementing the policy change dramatically exceed the costs. Removal of VAT on HST will have significant impact on the economy and on the incomes of farmers. Considering a wide range of possible benefits and costs of the hermetic bags, the gains accrued by farmers from using hermetic bags outweigh the costs of the bags and the extra costs associated with the adoption of the bags which amounts to the net benefit of US$ 28.05 million (equivalent to Tshs 65.9 Billion) per season before tax removal. With tax removal, demand for hermetic bags will increase by 1.5 times thus increasing the benefits, net of costs of the bags and the extra costs associated with the adoption of the bags, to US$ 42.1 million. The revenue loss from removing VAT on HST is US$ 3.15 million, which is dramatically small compared to the benefits accrued from using HST. This means that the total net benefit to the society for implementing the VAT removal is US$ 38.9 million per season. Therefore, compared to the situation with VAT removal will increase the total net benefit to the society by US$ 10.9 million per season, equivalent to Tshs 25.6 Billion per season.
Third, the economy-wide impacts of removing 18% VAT on the manufacture of HST bags are generally positive albeit small in size. The removal of 18% VAT on agricultural storage bags has a positive albeit small increase in GDP (0.02 percent) due to a decrease in the price of HSTs bought by farmers, and ultimately a decrease in the final price faced by consumers. The reduced price of output prompts much larger demand, hence increased production leading to higher incomes and welfare of farmers. Overall change in welfare following removal of VAT is very minimal. Farmers are able to sell more due to increased demand (hence more income) resulting from consumers’ responses to the decreased price of agricultural output (as a result of the removal of post-harvest costs).
Fourth, the impacts of removing 18% VAT appears to be favorable in the output of other sectors especially the manufacturing firms that depend on input from the agriculture sector. Owing to the decrease in input prices and increased production, manufacturing sector experience increased competitiveness from purchasing cheaper agriculture output. In turn, the cost of manufacturing goods is decreased across the three simulations. The cost of manufacturing goods decreases by 2.3% in the first simulation, and 4.7% in the final simulation due to an increase in agricultural productivity. The competitiveness stems from the depreciation of currency and improved Terms of Trade, which leads to an increase (albeit small) in exports and a decrease in imports.
Fifth, only if they are farmers, rural households gain more, by 6.4%, when taxes are removed, and this rises to 8.2% when overall agricultural productivity increases. Rural non-farm incomes increase by 2%, 2.6% and 5% in the first, second and third simulations respectively. This reveals that that the benefits to farming communities are larger compared to other activities, when there are policy changes that reduce post-harvest losses or increase agricultural productivity. Urban households gain through reductions in the prices of goods and services (expenditure saving).
Sixth and finally, for most macroeconomic indicators, we find removal of tax appears to be a more

7
An Economic Assessment Of Government Incentives
favorable policy option compared to subsidies. While subsidization is found to reduce investment, aggregate investment in the economy increases with removal of taxes and increase in productivity. GDP increases by 0.02% and 0.04% in the first and third simulations respectively. However, both tax removal and introduction of subsidies lowers government tax revenues, and productivity increase leads to higher (albeit small) government tax revenue.
The above findings strongly support the proposed removal of 18% VAT on production of HSTs to promote their wide-scale uptake and manufacture in Tanzania. Indeed, the benefits of implementing the policy change (removal of VAT) has dramatic positive impacts on the economy and significantly increases farmers’ income. However, it is important to note that, VAT removal is not the only factor that will trigger increased demand of hermetic bags. Other important factors include awareness-raising and business environment issues (including access to reliable power).
Policy Recommendations
Following these findings, we recommend that the Government:1) Remove VAT on all HST products to ensure wide-scale use and promote further investment into
the HST manufacturing sector. Treat HST products like all other agro- inputs such as fertilizer or seeds to garner policy support.
2) Establish a full-fledged HST unit in the department of Post-Harvest Loss Management of the Ministry of Agriculture to oversee the development, regulation and promotion of HSTs.
3) Deliberately support capacity building programs for Extension/Agricultural Officers specifically on the development, regulation and utilization of HSTs. The program should be equipped with demonstration of successful cases highlighting utilization of HSTs for public awareness campaigns.
4) Improve regulatory and institutional frameworks governing HSTs sector. This includes, among other objectives, measures to establish industry quality standards and rationalize the quality benchmarks by working with Tanzania Bureau of Standards (TBS). Furthermore, there is a need to enhance better identification of the innovations in HSTs by working with the Business Registrations and Licensing Agency (BRELA) and other relevant Agencies to clarify the regulatory environment and support its effective enforcement.
5) Create reforms to streamline the distribution system for HSTs by reviewing the need for licensing agro-dealers and promoting small-scale agriculture dealers at the ward level through the work of primary cooperatives or Agricultural Marketing Co-operative Societies (AMCOs). Organizations like Yara Tanzania offer good examples of how to support farmer profitability with knowledge, quality crop nutrition products and improved productivity.
Next Steps
Following completion of the study, we propose a couple of next steps as follows. The first one is to organize a stakeholder validation meeting to allow various stakeholders to review the findings and the recommendations. Such workshops will also serve as one of the mechanisms for enhancing stakeholder ownership of the identified recommendations. Second is to carry out in-depth consultations with key policy actors, especially the Ministries of Agriculture, Finance and Planning, Industry and Trade; as well as specific Agencies, and in particular, the Tanzania Revenue Authority (TRA). The third step is to organize a presentation to the Ministry of Finance’s Task Force on tax proposals for discussion and to consider the possibility of implementing the proposed removal of VAT on the manufacture of HSTs. The fourth step will be to organize a dissemination event, where the report could be presented and the findings shared across a wide range of stakeholders. The fifth and final stage is for AGRA to develop a policy brief out of the report, highlighting the key messages arising from the study findings and recommendations. The policy brief is intended for a much wider distribution and for public consumption, including publication on AGRA’s website and online platforms.

8
An Economic Assessment Of Government Incentives
1.0 INTRODUCTION
1.1 Background and Motivation
According to a FANRPAN (2017) report, post-harvest losses in cereals and other staple food crops contribute significantly to food, income and nutrition insecurity in sub-Saharan Africa, and that food producers, consumers, their national governments and other food value chain players are failing to prevent staple food losses after harvest. Furthermore, according to the report, losses range between 1% and 30% of harvest depending on the country, food commodity, capacity of farmers, post-harvest handling and storage technologies and the processes used. For example, post-harvest losses in cereals are estimated at about 25% of the total crop harvested, while for perishables such as fruit and vegetables, this can reach 50%. Currently, total food losses in sub-Saharan Africa are estimated to be worth $4 billion per year, an amount which can feed 48 million people (FAO, 2013). Furthermore, FAO estimates that globally about 1.3 billion tons of food is either wasted or lost per year, leading to economic costs estimated at US $750 billion (Gustavasson, et al. 2011). Indeed, post-harvest loses have become one of the priority issues for development agencies as well as an increasingly topical issue for innovation and policy researches.
In response, various storage technologies have been developed to reduce post-harvest loss, including silos, metal canisters/drums, cold chain storage containers, woven bags, plastic bags, insect-proof containers, and adaptations to traditional storage technologies. However, according to a study by the Massachusetts Institute of Technology (undated), many of these technologies have been piloted in small-scale programs in developing countries but have not scaled up to reach broad market penetration. Furthermore, Aulakh, J. and A. Regmi (undated) note that, although significant focus and resources worldwide have been allocated to increase food production, only 5% of the resources are directed towards reducing losses, compared to 95% devoted to increasing productivity.
It is on this basis that AGRA commissioned a study to support the Government of Tanzania’s policy initiatives to alleviate post-harvest losses by examining possible fiscal incentives needed to promote wide-scale utilization and the local manufacture of hermetic storage technologies in Tanzania. The study aims to conduct analysis of the benefits and costs that would result from the increased use of hermetic storage technologies (PICs bags, metal silos, cocoons) and recommend government incentives required for the promotion of the wide-scale adoption and manufacture of these technologies.
Through her Agricultural Sector Development Programme Phase Two (ASDP II), the Government of Tanzania has identified post-harvest losses as a priority requiring urgent attention. The programme asserts that post-harvest losses in Tanzania is a huge problem, and estimates the losses to reach 25% to 35% depending on crop, type and region. The ASDP II document attributes large post-harvest losses to poor support systems, limited use of storage technologies and limited handling capacity. It suggests a number of approaches for cutting down post-harvest losses including training farmers in post-harvest handling, especially about aflatoxin, and,the promotion and dissemination of technologies that promote better handling and better preservation of food. The programme also proposes investments in post-harvest technology as being amongst the key strategic actions to promote agricultural growth, rural development, food security and nutrition.
As documented in Masters and Alvarez (2018), a newer approach to post-harvest protection is hermetic storage, especially with hermetic bags by which oxygen barriers limit the growth of insects or microbes inside the storage unit. Hermetic bags can be defined as bags made up of ultra-high barrier specialty blend of polymers . Hermetic storage bags come with a quality assurance of airtight and gas-tight storage which helps in locking the freshness and the aroma of the product. Hermetic Storage Bags protect vitamin content and sensitive food.
The popular type of hermetic bags in Africa was the Purdue Improved Crops Storage (PICS) bags developed at Purdue University in the 1990s and widely distributed across various African countries, including Tanzania, with the help of development assistance programs (Murdock, 2016). Overtime, however, a couple of manufacturing firms have been established in response to market demand. The literature shows three somewhat different styles of hermetic storage bags by GrainPro, a U.S.-

9
An Economic Assessment Of Government Incentives
based firm specialized in post-harvest handling whose manufacturing facilities are in the Philippines (GrainPro, 2017); ZeroFly bags from Vestergaard, a Danish firm that also makes mosquito nets and water purification devices; and AgroZ bags made by A to Z Textile Mills in Tanzania. Nonetheless, in the specific case of Tanzania, a new factory dealing with manufacture of animal (chicken) feeds and general storage bags has also introduced a production line for HST bags branded as Harsho Ghala.
Clearly, although academic literature is quite definitive about the benefits of hermetic storage bags, awareness among the stakeholders is less developed and utilization among farmers is unreasonably low. Indeed, policy initiatives and responses in Africa have not been that dramatic relative to the market needs. A few examples of campaigns obtained from literature review emanate from industry associations such as Kenya Agribusiness and Agroindustry Alliance (KAAA, 2017), donor funded programs (a typical case of the PICS bag in Tanga) or private marketing initiatives (the case of Harsho Ghala in Moshi). Ironically, despite limited policy initiatives to promote wide-scale manufacture and utilization of hermetic storage technologies, policy makers, Development Partners and Industry Associations (representing farmers) are increasingly concerned about the impact of post-harvest losses and are actively seeking possible interventions to alleviate the negative impact. This is because the literature is clear about the extent of losses, and the staggering impact to farmers’ welfare and potential economic and health benefits that could be obtained with such interventions as the use of hermetic storage technologies.
Promoting the manufacture and use of hermetic storage technologies is important for Tanzania, not only as a strategy for managing post-harvest losses and increasing the level of productivity in Agriculture but also as a way of safeguarding the health of consumers. Indeed, promoting the local manufacture of HSTs is consistent with the prevailing policy priority on industrialization to achieve the broader policy objectives for economic transformation and generating much needed jobs in Tanzania.
1.2 Objectives and Research Questions
Based on the Terms of References (see Appendix A), the main objective of the study is to identify, categorize and predict the costs and benefits associated with the increased use of hermetic storage technologies (the cost-benefit analysis (CBA)). This includes examining the incidence and burden of government incentives over at least five years or a longer period using Regulatory Impact Assessment, partial or general equilibrium modelling or some other appropriate methods. The study will also highlight the cost and process required for the government to implement a possible policy change.
Key research questions:I) What is the current level of awareness and utilization of hermetic storage technologies (HSTs) in
Tanzania?II) How significant is the high price of HSTs a major barrier to a wide-scale utilization of HSTs?III) What are the most effective incentive or policy options (subsidy, VAT, awareness campaigns etc.)
for encouraging wide-scale manufacturing and utilization of HSTs?IV) What are the costs and benefits from increased wide-scale manufacturing and utilization of HSTs?
To what extent do the benefits exceed costs?V) What are the costs and revenue losses to the Government in implementing VAT removal in the
production and utilization of HSTs?VI) What is the impact of the needed policy changes (removal of VAT) to encourage wide-scale
utilization of HSTs and reduced post-harvest loses?
1.3 Structure of the Report
Following the introduction, chapter 2 reviews the literature, policy and regulatory frameworks, including existing knowledge about the industry and practice of HSTs (and other post-harvest losses interventions) in Tanzania. Chapter three outlines the approach and methodology employed for achieving the study objectives, including the design of RIA, field survey and the CGE analysis. Chapter four presents the study results by outlining and discussing findings of the descriptive analysis of the survey data, Regulatory Impact Analysis (RIA) and the Computable general equilibrium (CGE) model. Finally, chapter five outlines the main conclusions and identifies the policy recommendations, including areas for further research.

10
An Economic Assessment Of Government Incentives
2.0 HERMETIC STORAGE TECHNOLOGIES SUB-SECTOR IN TANZANIA
2.1 Overview of the HST Sub-sector in Tanzania
Hermetic storage technologes (HSTs) are air-tight containers that prevent or minimize gas exchange (Murdock et al., 2012). This technology does not require the use of insecticides. Additionally, hermetic storage can impede the growth of fungi, as these organisms also need oxygen to proliferate (Quezada et al., 2006). This technique can maintain seed quality for up to one year of storage. Although the adoption of the technology is growing in Tanzania, it has not received the desired attention from both the government and private sector. Based on the size of output being stored, there are two types of HSTs, i.e. for small quantities and large quantities. Small quantities are stored in hermetic storage bags. For instance, the pioneer technology in Tanzania (PICS bags) have been easily adopted by farmers, and many studies have revealed their effectiveness in reducing post-harvest losses. Grainpro Super Bags are used to store grains of up to 1,000 Kg. Unlike local woven bags which simply “organize” grain without providing protection against insects, hermetic bags provide full protection against insects without the need for any additional treatment.
Post-Harvest loss has been on the Government’s agenda since the 1980s, having been identified as a danger to food security. This gave rise to a number of initiatives and strategies regarding food security and the reduction of post-harvest losses (PHL). Some of the strategies adopted included the establishment of the Strategic Grain Reserve (SGR), and the establishment of the National Milling Cooperation (NMC). In 2000, the National Food Security Department was established under the Ministry of Agriculture (MOA), that included the Post-Harvest Management section that is mandated to oversee all post-harvest loss issues to ensure food security.
As shown in the literature review section, post-harvest management technologies, and hermetic storage technologies in particular, have had multiple benefits to farmers. However, the sub-sector faces several challenges related to the nature of hermetic bags and the low level of adoption by farmers (the main users of the technology). Further, the effectiveness of the HST depends upon several factors, including; air-tightness of the seal, nature of the stored commodity, climatic conditions, etc. However, the industrial sector in Tanzania, and its governing policies and strategies provides a strong support to the development of industries, and especially those that provide a strong linkage to agricultural activities. HST is one of the industries that has a high linkage to rural households and their farming activities, and hence, has a strong potential for government support. In addition to Government efforts, Development Partners such as AGRA and other stakeholders in the HST value chains also have a role to play to enhance the private sector’s participation in the adoption and manufacture of HSTs.
A review of policy frameworks indicates that the manufacture of HSTs is not wide-spread in Tanzania, and hence, it is not addressed in the existing industrial policy. The key raw material is plastic bags, which is a small sub-sector currently producing 6 tons per year, and importing 170 tons. While little is documented concerning the manufacture of plastic bags in Tanzania, a comparison of domestically produced bags and imports shows a huge deficit (164 tones).
Three types of hermetic bags are produced in Tanzania; the Purdue Improved Crop Storage (PICS) bags, AgroZ Bags, Harsho Ghala, and Hermetic Cocoons. Other common hermetic storage technologies include Metal Silos. The Purdue Improved Crop Storage (PICS) bags are the most popular, and are manufactured by Pee Pee Tanzania Limited (PPTL) in Tanga with financing from the UK Government (through the Food Trade East and Southern Africa Program). The bags are currently supplied and available in four key areas in Tanzania: Lake Zone, Northern Zone, Southern Highlands, and East and Central Zone. AgroZ Bags are manufactured by AtoZ Textile Mills in Arusha. AtoZ started producing hermetic bags in 2016, using its brand AgroZ bags. Harsho Group started producing hermetic bags from 2015 through its brand “Harsho Ghala”. Although a relatively small factory and a recent entrant in HST manufacturing, Harsho Ghala appears to be gaining significant momentum in its marketing and awareness raising campaigns. GrainPro Inc. manufactures hermetic cocoons. Metal silos are fabricated by Intermech Engineering TZ Ltd. Metal silos are constructed from galvanized iron sheet and hermetically sealed, to kill all insect pests that may be present (Tefera et a., 2010).

11
An Economic Assessment Of Government Incentives
A Review of policy documents show that, ASDP II provides strong support for post-harvest loss management issues. According to the ASDP II document, post-harvest management issues are integrated in various agriculture policies and strategies. Specifically, the government articulates its objectives in the ASDP II on storage and minimization of post-harvest losses by;
• Rolling out the operations of the Warehouse Receipt System (WRS) for appropriate commodities by empowering farmers’ organizations and collaborating with commercial banks and other financial institutions;
• Supporting increased storage capacity for grains along with promotion of WRS; • Promoting improved household level and village-level storage of grains (e.g. granaries and
mini-silos);• Supporting the establishment of a network of milk collections and cooling centres, building on
already registered successes in Tanga, Iringa, Kibaha and Musoma;
Supporting an increased number and capacity of cold storage and cold chains to service dairy and fish products, building on successes such as the Lake Victoria Fisheries Organization (LVFO) for fresh water fish products.
Further, the Marketing Infrastructure, Value Addition and Rural Finance (MIVARF) Program supports the establishment and sustainable maintenance of improved marketing infrastructure. Through Collective Warehouse Based Marketing Schemes (COWABAMA), the storage of maize and paddy was encouraged to address smallholders’ lack of access to warehousing facilities to reduce post-harvest losses. The COWABAMA program rehabilitated and developed 123 warehouses. Other initiatives carried out under the program include th provision of training to extension officers and farmers, as well as preparation and dissemination of post-harvest management training manuals. In addition to these programs, the Government has also developed a National Post Harvest Management Strategy (NPHMS), and supported the implementation of Tanzania Initiative for Prevention of Aflatoxin Contaminations (TANIPAC). At the regional level, post-harvest management issues are addressed in the EAC Food Security and Nutrition Strategy (2018-2022), and the EAC Food Security Action Plan (2017-2021).
Apart from government initiatives, there are initiatives by the private sector and other stakeholders, including; HELVETAS Swiss Inter-cooperation in Tanzania, AGRA, ANSAF, WFP, FAO, EAGC, and RCT. Assessment of these policies and strategies reveals that, implementation of various PHL reduction initiatives have been left to private sector while the Government focuses on establishing and improving a better environment for implementation. For instance, while the private sector could produce technology, it would require sufficient support from the government in the form of tax incentives, subsidies, and awareness raising. Apart from the producers of PHT, the users (farmers) would require enough financial resources to access technologies produced by the private sector.
Finally, a review of the agricultural policy shows that the document has covered PHL rather lightly, posing a potential challenge of relatively weak policy support. However, this does not denote the lack of Government support on the PHL agenda. On the contrary, the Government has continued to strengthen the PHL agenda by establishing a PHL Management Unit and carrying out a number of measures for implementation. It can be concluded that post-harvest policies in Tanzania are clear on paper and less so in the actual support extended to the private sector or farmers. Indeed, the government can take initiatives to facilitate development, adoption, and use of HST by practically supporting such activities as research, knowledge and awareness creation.
2.2 Review of the Literature
This section reviews literature on studies conducted on post-harvest losses and post-harvest management technologies. In particular, it summarizes key issues and findings from previous studies including on the benefits of hermetic storage technologies to farmers. In addition, a literature review is also a reliable source of data and information on comparative studies or similar experiences from other countries as lessons for Tanzania.

12
An Economic Assessment Of Government Incentives
2.2.1 Theoretical and Empirical Studies on the Role of HSTPost-harvest losses are common among smallholder farmers in sub-Saharan Africa. FAO estimates an average of 37% loss in SSA between production and consumption, out of which 8% is lost during post-harvest and storage only. Post-harvest losses occur due to multiple reasons, most of which are preventable with various storage technologies. These technologies vary from country to country and from farmer to farmer.
Adoption of proper storage technologies allow farmers to produce their output, store for a required period of time, and sell when the market prices are favorable, or to consume when prevailing market prices do not allow them to purchase grain.
Ndegwa et al., (2016) conducted a randomized control trial experiment on over 300 maize farmers in Kenya to assess the effectiveness of hermetic storage technology. The experiment was conducted to assess the extent of maize loss after four months of storage. The findings revealed that, hermetic storage was effective in preserving both the
Box 2.1: Technical aspects of Hermetic Storage Bags
The rate of loss with PICS bags ranges from 0% to 5% after five months, depending on local conditions and the level of initial infestation. The most common pests are the maize weevil Sitophilus zeamais and the larger grain borer Prostephanus truncatus (Meikle, 2000; Tefera, 2012; IGENAES, 2016). As noted by CIMMYT (2011), the bags’ hermetic seal can be broken by the larger grain borer and other pests, thus longer term efficacy requires protection against perforation. Beyond loss of weight, grain quality is often compromised by mold growth, especially when grain is damaged by insects.
Hermetic storage limits growth of mold as well as insects, thereby limiting the release of mycotoxins, especially aflatoxins produced by Aspergillus flavus and Aspergillus parasiticus (IARC, 2012). It is common for many types of toxin-producing mold to grow together on maize, groundnuts, and other crops, with the most common type in Malawi being aflatoxins (Matumba et al., 2009; Monyo, 2012; Matumba et al., 2014; Mwalwayo, 2016). For example, a study of stored maize in villages in Lilongwe detected aflatoxin in 45.3% of the samples analyzed (Matumba, 2009). Another study of processed foods produced in Malawi examined locally produced instant baby cereals and found that 100% of the samples had levels of aflatoxin above the EU maximum tolerable level (Matumba et al., 2014).
Chronic aflatoxin consumption carries significant health consequences. The International Agency for Research on Cancer classifies aflatoxin as a Group-1 carcinogen based on strong evidence that aflatoxin causes liver cancer, especially in people with hepatitis B (IARC, 2012). Aflatoxin has also been linked to immunosuppression and increased disease susceptibility (Gong, 2016). Consumption of aflatoxin can be especially harmful for young children, and has been linked to child stunting (Gong, 2002; Smith, 2015). De Groote (2016) finds that consumers notice mold and are willing to pay less for damaged grain. Other studies compare the Hermetic vs. Traditional storage technologies (see for example, Walker, S. et al (2018) on Kenya.
Source: Masters, W.A and G. Alvarez (2018).
Figure 2.1: Hermetic storage bags produced in Tanzania

13
An Economic Assessment Of Government Incentives
quality and quantity of maize. For instance, after four months, grain damage was 14% in the control and 4% in treatment group. Weight loss resulting from insect pests was 1.7% in the control group, and 0.4% in the treatment group. Analysis further reveals that, hermetic bags last for more than four seasons, thus enhancing their economic value and profit.
Ideas42 (2017) study on PHL conducted a behavioral analysis in the adoption of post-harvest management (PHM) in Tanzania. The study identified the uptake of technology as a key hindrance to efficient adoption of PHM techniques. Farmers are unable to afford hermetic (PICS) bags, which are sold at Tshs 5,000/-, a cost which is on average, five times higher than the cost of ordinary poly bags (Tshs 1,000/-). Further, they find that, investment to purchase PICS bags does not pay off during the first season, but this improves in the second or third seasons. PICS bags start to deliver benefits after six months of use, and the net benefits keep increasing throughout the three-year life span of the bags. Meanwhile, farmers are normally concerned about the high initial costs for any investment, and do not see the longer-term benefits of the project.
Using the desk review and key informant interviews, Chisvo and Jaka (2017) conducted a CBA analysis of innovation in post-harvest technology in Benin. Cash flows were estimated using the expected life span of the storage technology, i.e. metal silos (20 years) and hermetic bags (2 years). The study estimated both the treatment and counterfactual scenarios in its CBA analysis based on production, marketing and storage practices. Scenarios assumed that, some farmers with poor storage technology sell their products immediately upon production, while those with technology store and sell in the future when prices are high. Findings revealed little gain, if any, from the use of HST.
Tefere (2012) estimated that, due to weevils, farmers lose between 20% and 30% of their output, while losses could go up to 40%. These losses affect farmers’ incomes (when prices fall) due to loss of product quality and even quantity, thus threatening food insecurity in the long run. The use of hermetic bags, hermetic cocoons, metal and plastic silos developed to curb post-harvest losses is well covered in Helvetas and Ansaf (2016). Since its introduction in the country by AGRA/Rockefeller Foundation, the use of hermetic bags is gaining acceptance among farmers in Tanzania, and a couple of studies have been carried out to assess its effectiveness. One Acre Fund (2016) conducted a study to identify the quality of hermetic storage technology among farmers in Iringa. The study found that, maize stored using PICS bags had only 1% rot damage and 0% pest damage, compared to control farmers who had 8% pest damage and 1% rot damage, and storage bundle farmers who had 3% pest damage and 1% rot damage. The final outcome of their study is summarized in the Table 2.1. The findings show that farmers using PICS bags and those that do not use improved storage technology had a loss difference of $7.47.
Table 2.1: Findings from HST in OAF (2016)
Treatment Cost of Intervention
Total Kgs Stored
Assumed 3 bags
Percent of Maize Damaged by Pests
Percent of Maize Damaged
by Rot
Total Kgs Lost to Pest
and Rot
Value of Lost
Kgs
PICS $5.50 330 0.00% 0.70% 2.388 $0.60
Storage Bundle $3.00 390 2.70% 1.00% 14.44 $3.61
Control 0 390 7.90% 0.60% 33.344 $8.34
One Acre Fund (2016)
Other studies have documented the benefits of HST including increased incomes among farmers. Moussa (2006) found that PICS bag adoption led to more than 500,000 additional tons of cowpea conserved per year, resulting in US$ 100 million in additional cowpea income. These benefits created a need to adapt the technology for other crops, including maize, beans, etc. For instance, it has also been used to store cassava, resulting in lower losses, of about 50% compared to use of polypropylene bags (Ognakossan et al., 2010). The technology is also estimated to have led to a significant decrease

14
An Economic Assessment Of Government Incentives
in maize storage losses, currently estimated at 0.5% after six months, and 0.6% dry weight loss in beans. Apart from enhancing rural incomes for farmers and ensuring food security, metal silos and other hermetic storage technologies are a crucial source of income and job opportunities for metal silo fabricators and distributors.
Mwaijande (2017) conducted a study in five regions in Tanzania to assess farmers’ willingness to adopt and pay for post-harvest technology (PHT). Farmers’ awareness was found to have increased, especially on HST, although price and availability of such technologies limits the extent of their adoption. The farmers’ willingness to pay for HST is Tshs 4,000 (for a bag with a capacity of 100 Kg), although the prevailing market prices were reported to be higher (ranging between Tshs 3,600 and 6,000; and averaging Tshs 5,000 for a 300-400 Kg bag). Further, PICS bags were found to be the most preferred storage technology due to their availability and popularity, implying that any initiative to reduce the price may result in a significant increase in utilization (hence manufacture).
Despite the appealing evidence on the benefits of HSTs, some studies found the investment in HST to be less worthwhile. Others find that, farmers who have a habit of storing maize for some time before using it, gain more than those who store for a short time and sell. However, in their CBA conducted in Benin, Chisvo and Jaka (2017) find very little gain (if any) for farmers, and encouraged farmers to sell immediately if they wished to.
2.2.2 Key Challenges Identified in the Literature ReviewA number of chal lenges appear consistently across the various studies on HST or PHLM. The most appealing is the fact that farmers and the economy as a whole lose significantly from PHL. The main cause of PHL include: low awareness on handling practices and technology among farmers, limited access to cost effective PHM technologies, poor marketing and storage systems, lack of adequate government efforts to support PHS and handling technology/ practices and low financing of PHM practices. Despite various efforts to reduce PHL, a majority of farmers still use traditional storage techniques. Adoption of modern PHT is poor due to low education amongst smallholder farmers, misinformation in the market, high distribution costs of HST, high prices of HST (currently at Tshs 5,000 per bag).
Clearly, an unfavorable business environment prevents targeted policies from supporting the manufacture of Hermetic Bags. AtoZ Company, the manufacturers of AgroZ Hermetic Bags, report various policy challenges hindering effective adoption and use of HST in Tanzania, including high value added tax, and the presence of counterfeits. Note that, VAT is applicable on hermetic bags, metal silos, plastic silos, and cocoons. However, it is not applicable on other agro inputssuch as seed, agro-chemicals, and fertilizer. Regarding counterfeits, genuine bags are normally branded, certified in quality, and have a structured distribution network, unlike the counterfeits. The company calls on the government to define standards, branding, and provide trainings for farmers. A review of various agricultural policies in Tanzania reveals that most food security issues are handled and addressed from a perspective of increasing food production (and diversification), and less on managing post-harvest losses. It can be concluded that, PHLM issues are given far less priority than on-farm issues.
Other challenges in addressing PHL include the lack of current and comprehensive data on PHL and PHMT in Tanzania, inconsistent methodologies and a low level of awareness and knowledge among stakeholders, including policy actors. Furthermore, the regulatory environment has not been developed to support the manufacture of HSTs (including issues of standards and quality). Indeed, there is lack of clear optimal price for Hermetic bags in the market that would incentivize farmers to use the technology while allowing manufacturers and dealers to gain margins that allow them to scale up their activities. The government should exploit economies of scale in production or importation and possibly encourage co-investing by lowering import taxes on bags.
Finally, a review of the literature reveals multiple analytical and data gaps that might have limited policy developments in HSTs. For instance, there are no nationally collected datasets on the use or manufacture of HSTs (including information from farmers, manufacturers, distributors, import or export trade etc.). The national statistical agency has not developed a focus on HST. For instance, the agricultural survey data do not appear to contain the specific information on HSTs. At the same time, the manufacturing

15
An Economic Assessment Of Government Incentives
industry is taking the challenge to respond to the market needs, although the standard data on industry production such as Annual Survey of Industrial Production (ASIP) of CSP are yet to incorporate the manufacture of HSTs in the list of sub-sectors or products.
Nonetheless, in response to a deficit in domestic production, a sizable amount of HSTs (hermetic bags in particular) are imported. During the field survey for this study, some stakeholders noted that the Southern regions use hermetic bags manufactured in Malawi. More generally, data on international trade on hermetic bags exists albeit it is not well developed in terms of data base. Our internet search shows that, a more elaborate information on international trade in hermetic bags is available in Zauba, a platform that helps businesses reduce risks involved in import and export trade Trade (see https://www.zauba.com/customs-import-duty/storage-bag-/india.html). According to Zauba, HST Bags are traded using HS code 6305 – Sacs and bags of a kind used for the packing of goods; and Customs Import Duty of storage bag under HS Code 39269099.
Figure 2.2: Sample of International Trade Database on Hermetic Bags
Source: https://www.zauba.com/customs-import-duty/storage-bag-/india.html

16
An Economic Assessment Of Government Incentives
3.0 APPROACH AND METHODOLOGY
3.1 Overview: Approach and Study design
We propose two approaches to assess the potential benefits to the economy of government’s removal of the 18% VAT charged on hermetic storage technologies (PICS bags, metal silos, cocoons). First, we will use the Regulatory Impact Assessment (RIA); and second, we will use the economy wide Computable General Equilibrium (CGE) Model. Owing to the ToRs for the study (Annex A), the two analytical frameworks are complementary in some ways. First, the RIA will document the cost and benefit of using HST (CBA analysis). In addition, the RIA will provide more general views in favour or otherwise of the proposed policy change, and qualitative conclusion about its suitability. The CBA is useful in establishing commercial incentives of using the innovation (HSTs) and provide the basis for estimating the benefits to farmers, optimal prices, demand and willingness to pay.
However, the RIA is less suitable to assessing impact of the proposed policy on other sectors or economic agents. This is why a computable general equilibrium (CGE) is necessary for establishing such impacts. Indeed, removal of VAT on a product has both immediate short term and longer-term impacts on the economy. Policy makers need to be aware of such impacts in order to provide a more comprehensive picture of the costs and benefits to the economy. In addition, the anticipated productivity change in agriculture is likely to have far reaching macroeconomic and sectoral impacts that cannot be established by RIA or partial equilibrium models.
The two models are described below.
3.2 Regulatory Impact Assessment
3.2.1 Main StepsRIA is a process of systematically identifying and assessing the expected effects of regulatory proposals, using a consistent analytical method, such as benefit-cost analysis (BCA). RIA is a comparative process: it is based on determining the underlying regulatory objectives sought and identifying all the policy interventions that are capable of achieving them.
In conducting RIA, the first step is to specify the policy objective to be attained which in this case is already specified. The proposed change in regulation is to remove the 18% VAT charged on hermetic storage technologies in order to promote widespread manufacture, distribution, and use of the technology.
The second step is to outline different ways of achieving the objectives for the purpose of comparison. The terms of reference for the assignment required us to provide evidence of the benefits that would accrue to the society if the 18% VAT were removed and compare that to the costs the government would incur by forfeiting the tax. So, the main comparison was on two scenarios: the first when you have VAT in place which is the current status and second, when the 18% VAT is removed.
The third step involves assessing the nature and the size of the policy problem that is intended to be solved by the regulation or policy action. This involved identifying: (i) what groups in society are affected; (ii) the size of each group; (iii) the nature of the impact on each group; (iv) the size of the effects to each group; the life spans these effects persist.
The fourth step is consultation which aims at getting opinions, information, and data from parties involved in the economic life. In this case information was collected from manufacturers, distributors, and users of hermetic storage technology. Consultations will also be done with the tax revenue authority (TRA), NGOs and policy activists. The information obtained may significantly improve the quality of the planned solutions, even if the intervention is abandoned.
1.2.
3.4.

17
An Economic Assessment Of Government Incentives
The fifth and final step entailed conducting a cost benefit analysis. Once all the possible options and the relevant information were obtained, the RIA approach required comparison in terms of their benefits and costs. That is, to try to identify all the likely impacts of the different options and list the positive and negative direct and indirect impacts. The task should consider the likely economic, social and environmental impacts of each of the options. It should also include an assessment of administrative burden. Also, important to consider are implementation risks, uncertainties and obstacles to compliance. Investigating the costs and benefits resulting from the particular options makes it possible to reduce the risk of adopting such regulations which produce little effect for the price of a high financial, social, and economic burden. The comparison in terms of benefits and costs provides information about how effective and efficient an option is likely to be. All the steps of RIA were conducted, and whose analytical framework is described below.
3.2.2 Analytical Framework for RIAInformation on benefits and costs can be categorized into two types: quantitative and qualitative. Quantitative information is that which is expressed in numerical (sometimes monetary) terms. The consultants made all efforts to obtain both types of information to complement each other in the analysis. It is very common in RIA to find that important benefits and costs cannot be quantified. However, in such cases, a “partial” CBA is generated. This is still very useful as it narrows the range of issues that must be dealt with through more subjective, qualitative analysis.
Quantifying costsThe most effective approach we used for calculating what costs a new regulation is likely to have was to obtain via surveys and other consultations, estimates of the amount of a particular identified cost for an individual (or a business firm) and then combine this with:
• An estimate of the number of individuals or firms likely to be affected, and• The knowledge of the number of times the regulation is likely to require an individual or firm to
incur the costs (i.e. per year).Annual cost=Cost per individual×Number of individuals affected× the average number of times that cost is incurred per year
In order to estimate the total costs of the regulation, both the one-off and the recurrent costs identified were combined. The costs and benefits incurred in the future periods were discounted to arrive at a single monetary figure.
Identifying and Quantifying BenefitsThe task of identifying benefits is usually much easier than that of identifying costs, since the expected benefits constitute the reasons that the regulations were proposed in the first place. However, determining the size of these benefits and, in particular, trying to express them in monetary terms is always challenging. This task considered the immediate and partial effects of widespread use of hermetic technologies namely lowering post-harvest losses, better prices from opportunistic sales and higher prices due to high quality products from improved storage. The general equilibrium effects which take into account the indirect and spill over effects were analyzed using a CGE model.
Discounting and Internal Rate of ReturnTo obtain a reasonable estimate of the total costs of a regulation, it is usually necessary to compare the impacts over a long period. This is because both one-off and recurrent costs must be accounted for and because benefits and costs often occur at different times. The effect of time on money makes a unit of money received or spent today worth more than a unit of money received (or spent) in the future.
Differences in the times at which benefits and costs occur have been dealt with through the process of discounting. This is a way of adjusting the values of benefits and costs occurring at different times by a given percentage rate to make them directly comparable by the measure of the value of today’s
5.

18
An Economic Assessment Of Government Incentives
currency. By adding all benefits and costs that arise over a set number of years and applying discounting, a “Net Present Value” (NPV) can be calculated. This is a single figure that summarises the present-day value of the overall impact of the regulation. If it is positive, the benefits are greater than the costs. If it is negative, the costs are greater than the benefits.
Where B are benefits accrued at time t C C are costs incurred at time t r is the discount rate t is time period
The NPV is therefore an essential decision tool which enables you to determine whether a regulatory proposal is of benefit to society and to compare the regulatory proposals with costs and benefits occurring at different times to see which one will provide the greatest benefit to society.
Internal rate of return (IRR) is a discount rate that makes the net present value (NPV) of all cash flows from a particular project equal to zero. IRR calculations rely on the same formula as NPV does. The IRR can be compared to the rate of return investment, normally risk free investment, to measure how good the investment in question is.
Estimating the changes in supply and demand for hermetic storage technologyThe obvious assumption in this task is that the removal of 18% VAT charged on hermetic storage technologies will increase production and utilization of hermetic storage technologies. However, the most important task is to estimate by how much this production and use of hermetic storage technologies will increase after VAT removal. To analyze that, the following steps were followed.
• Estimating by how much the cost of production is lowered after the tax removal and by how much the price which users of hermetic storage technology face is reduced.
• Estimating the elasticities of supply and demand. Elasticity is the percentage change in supply or demand due to a percentage in price. ε=∆Q/∆P x P/Q
• Using elasticities and the changes in price allowed us to calculate the changes in supply and demand of hermetic storage technology.
• Using the supply and demand changes allowed us to estimate the volumes of hermetic storage technology utilized after the policy change.
3.2.3 DataThe data collected and used for RIA should contain information about the direct costs such as the wholesale and retail prices of the hermetic storage technologies and the indirect costs such as the extra costs associated with the use of the new technologies compared to the traditional storage technologies. To be able to ascertain the total costs, we also needed to obtain the estimates of the current total volumes of hermetic storage technologies sold (or bought).
Another category of costs involves those accruing to the government to implement the policy change such as the revenue loss from removing the tax, employing additional staff to work on the new policy action, employing consultants or other sources of expertise to help with regulatory compliance and implementation of the policy action, information campaigns for stakeholders to learn about the new policy, and collecting and storing information that the new regulations require them to report or keep. Other costs are those emanating from a large-scale use of hermetic technologies in the form of the negative externalities they bring, such as to the environment or general market price levels. Data related to the levels of post-harvest losses which can be mitigated by the use of HSTs were also collected, alongside with information on the price difference of agricultural products stored in hermetic storages compared to other storages due to opportunistic sales and higher quality.

19
An Economic Assessment Of Government Incentives
This information was obtained through a review of literature on HSTs, key informants’ interviews, and consultations with experts and manufactures on the expected costs and benefits of the HSTs.
3.3 Field SurveyThe survey to inform RIA collected information from the following groups of stakeholders: manufacturers, distributors, and farmers (users of hermetic storage technology), agricultural officers, the tax revenue authority, NGOs working with farmers and policy activists. The field work was conducted in five regions, namely: Kilimanjaro, Njombe, Arusha, Rukwa and Tanga.
3.3.1 Structured Interviews
Sampling method and sampleConsultations involved collecting information from the following: (i) 206 farmers, including those that are using and those not using hermetic storage technologies; (ii) 10 NGOs; (iii) 30 agricultural and extension officers; (iv) 26 distributors; and (v) 3 manufactures of hermetic storage bags. Given the fact that, hermetic bags are the most popular amongst farmers, and given their relatively wider use compared to other HSTs such as metal silos and cocoons, the study opted to focus manufacturing sample to manufacture of hermetic bags. Furthermore, since there are a few manufacturers of hermetic storage technologies, the sample covered all the three currently existing manufacturers (AtoZ for AgroZ, IPPTL for PICS bags and Harsho Group for Harsho Ghala). The study aimed to interview the marketing and/or production managers of these manufacturing firms.
To optimize location for time efficiency consideration, the same regions selected for field work will cover structured interviews with all the listed stakeholders, i.e. farmers, manufacturers, distributors and institutional actors (NGOs, Agricultural Officers in the LGAs and Policy activists). Finally, the field work included consultations with national level MDAs, particularly TRA and the Ministry of Agriculture. However, the consultations could not take place at the high officials’ level as desired, because of the need to complete and share the findings of the study ahead of soliciting their views. Nonetheless, the study relied on technical or anecdotal information on the necessary process needed to implement the proposed policy change.
Table 3.1 Sample and Response rate for Structured Interviews
Category of Respondents
Njombe Arusha Tanga Rukwa Kilimanjaro Total Planned Response Rate (%)
Farmers 52 53 51 50 N/A 206 200 103
Extension Officers
7 8 7 8 N/A 30 32 94
NGOs 5 2 2 1 N/A 10 8 125
Distributors 6 4 3 13 N/A 26 40 65
Manufacturers 0 1 1 1 3 3 100
Total 70 67 63 72 272 280 97
N/A – Not Applicable
Source: AGRA HST Study (2019)
Instrument/questionnaireDifferent questionnaires and interview guides were developed for each category of respondents depending on the type of information sought from each group (see Appendix B).

20
An Economic Assessment Of Government Incentives
3.3.2 Stakeholder ConsultationsGetting opinions, information, and data from stakeholders does significantly improve the quality of the analysis and planned solutions. Probing the opinions of stakeholders and partners offers valuable information on the possible improvements in the planned regulations. It also helps to strengthen the democratic legitimacy of administrative measures and increase accountability for the undertaken action. Consultations should include all the stakeholders to whom the planned regulation is addressed, those of wider interests to the policy agenda, and those that are affected by the regulation in different ways.
The list of stakeholders included, but is not limited to; (a) Ministry of Industry and Trade, (b) TRA, (c) TIC, (d) Ministry of Agriculture, (e) Private sector actors (manufacturers of HST, dealers of HST), (f) NGOs/CSOs, (g) Development Partners (e.g. Helvetas, AGRA, etc.). However, not all the listed stakeholders were consulted during the field work, as others will have more useful inputs during discussion of the study findings during validation or dissemination events.
The stakeholder consultations aimed to ensure: (i) Valuable information about the subjects potentially affected by the regulation (e.g., their number, size, market share) is gathered (ii) Better public information about the plans (iii) Understanding of the perception about the problem by various groups of interested parties (iv) Precise definition of priorities (v) Quick information about emerging problems before they grow to a large scale (vi) Increasing the acceptance level of the introduced solutions (vii) Preparing public partners for an efficient implementation of the regulation and for taking co-responsibility for them.
During data collection, the above-mentioned stakeholders were consulted to provide their knowledge, opinion, and experience on PHL, PHLM, and HST. During validation, they were consulted to review the study findings and recommendations based on their experience and respective positions. During dissemination, the stakeholders will be involved to enhance influence and impact. During each stage of the project, the research team will ensure the following regarding key stakeholders;
•Clear clarification of objectives of study to stakeholders and need for their engagement•Embedding stakeholders in research model•Identifying necessary resources needed to engage various stakeholders, and where
to find them•Consulting the identified stakeholders on an ongoing basis•Inviting stakeholders in presentation and dissemination of the research findings for
their views and implementation.
3.3.3 Execution of the Field WorkThe field work was implemented from 7th January 2019 to 15th February 2019 spanning different activities. The preparation for the survey took place during 7th – 18th January 2019; and included recruitment of Enumerators, training (with mock pilot), searching for basic contacts of the targeted stakeholders, seeking the appropriate approvals and research permits. The actual survey took place from 21st January to 15th February 2019.
Implementation involved seeking approvals for conducting the survey from the appropriate Government Authority including (i) the National Bureau of Statistics, (ii) President’s Office – Regional Administration and Local Government (PO-RALG – TAMISEMI), (iii) Regional Administrative Secretaries (RASs) of the sampled regions, and (iv) Local Government Authorities (usually DED of the sampled district) and Ward level (WEO of the sampled Wards). The Team Leader coordinated the entire exercise of obtaining all the clearance letters and research permission, copies of which are available if needed.
Consultations should include all the stakeholders to whom the planned regulation is addressed, those of wider interests to the policy agenda, and those that are affected by the regulation in different ways.

21
An Economic Assessment Of Government Incentives
The questionnaires were administered using Tablets software (available upon request), where the survey responses were entered into a GPS programmed electronic questionnaires and data would be seamlessly viewed by the supervisors in another location (Dar-es-Salaam). This tool substantially improved the efficiency of implementing the survey, including minimization of errors in data entry and concomitant data analysis. Each Enumerator was responsible for implementing the structured questionnaires in the respective region. The Principle Investigators interviewed the three Manufacturers, whose data did not need to be programmed in the Tablets since it is only 3 data points. It should be noted that, the structured survey took place in the four regions but interview with Manufacturers included one factor that was based in Hai District, Kilimanjaro region; hence making a total of five regions covered by the field work. In addition, the consultations would include visits to Dodoma and Dar-es-Salaam given locations of the respective organizations and MDAs. Finally, overall, it is useful to note that, the field work was implemented without any major challenges.
3.4 A CGE Analysis
3.4.1 IntroductionComputable General Equilibrium (CGE) models have been widely used to assess economy-wide impacts of various policy changes, in both developing and developed countries. Despite multiple studies conducted on taxation policy and agricultural productivity using this approach, none of the studies has attempted to model PHL management technologies, and specifically, adoption and use of HST technologies in storage of agro-output. This follows the fact that, HST is a new technology in post-harvest management, hence, most of the studies conducted have focused on descriptive and cost-benefit analysis (CBA). CGE has not been common in this field mainly due to the lack of disaggregation of HST (or its related inputs) in the systems of national accounts. In addition, ascertaining inputs used in HST manufacturing is less straightforward (i.e. it is difficult to apportion share of inputs that go into production of HST vs. other plastic and metal products since firms producing HST also produce other plastic and metal goods). This difficulty compromises the efficient targeting of HST if Government wants to provide specific incentive (e.g. VAT exemption) to the HST.
Owing to these challenges, we apply CGE analysis by estimating the impact of removing VAT on storage bags more generally than specifically on HST. In particular, we employ a static CGE model of a small open economy to analyze various economy-wide impacts of removal of taxation on inputs used to manufacture storage bags. We also show the impact of subsidy as an alternative policy option for promoting HST adoption on the economy. Finally, we show how the gained agriculture productivity from increased use of modern technology such as HST impacts the economy. The model is calibrated using the Social Accounting Matrix (2015) for Tanzania.
3.4.2 The CGE ModelGeneral Equilibrium owes its origin from Walras (1834-1910), entailing a set of economic relationships that determine prices of goods and services produced, and returns to factors of production (ensuring market clearing). CGE modeling emerged in 1970s, following a growing need to provide a mechanism through which these interactions could be modeled, in such a way that changes in some economic aspects (shocks) could bring the economy to a new equilibrium, forming a basis for impact analysis. Hence, theoretical equations are used to determine the behavior of producers, consumers, government, other economic institutions, and the rest of the world (Charney, 2003). Since their inception, they have been used in various analyses, including; taxation (e.g., Fullerton et al, 1981; Kehoe-Serra-Puche, 1983), and international trade (Shields and Francois, 1994; Martin and Winters, 1996; Harrison et al, 1997), among other fields.
Figure 3.1 reveals the circular flow model, showing the mechanisms through which direct and indirect taxation enters the model. Households pay various indirect taxes to the government when they purchase final commodities, while producers (firms) pay indirect taxes when they purchase intermediate inputs. These taxes add to the total final prices of goods (for instance a case of VAT). Hence, removal of VAT on any good has an immediate impact on reduction of input price (if the good is an intermediate input in production) and ultimately, final price if the product is a final product.

22
An Economic Assessment Of Government Incentives
Figure 3.1: Circular flow of the economy
The model employed in this analysis owes its origin to the IFPRI model (Lofgren et al., 2002), which combines works and techniques from different modelling approaches. For instance, it is a single country model, owing its origin from Dervis et al., (2002), implemented in GAMS software, following an approach by Deverajan (1994) and Robinson et al., (1990), and is calibrated using a SAM approach (Pyatt, 1988). The model is constructed in four blocks; production and trade, price block, institution block, and system constraint block.
The production block details the system involved along the value chain from the production of a good to its consumption. Producers are modeled as agents that maximize profits from production, employing both primary factors and intermediate inputs using a Constant Elasticity of Substitution (CES) function. The CES function used in the IFPRI model combines these two factors to produce a given unit of output as shown below;
………………………………….. (1)
Where, is the quantity of value-added, and is the total intermediate consumption. Solving this equation for the value added aggregate intermediate ratio (proportion of firm use of its inputs) gives;
………………………………….. (2)
Which is the proportion of firm use of its inputs. Inputs used to produce are dependent on relative prices of such inputs (PINTA and PVA), and not level of output. What this means is, as relative prices of inputs decrease, their use in production increases. Materials used to produce agricultural storage materials enter the model as inputs to production. This entails that, a decrease in their price (from changes such as taxation removal) will eventually lead to their increased use in production. This will further trigger an increase in their supply. Households maximize utility by consuming products subject to their income levels and ruling prices in the economy.
In the trade block, a Constant Elasticity of Transformation (CET) function is used to describe the ease with which product mix can be adjusted to respond to changes in prices. Producers minimize cost of both domestic supply ( ), i.e. quantity and price of domestic supply, and export supply ( ), i.e. price and

23
An Economic Assessment Of Government Incentives
quantity of export, using the following equation;
………………………………….. (3)
Equation 3 is minimized subject to the CET function, which entails that; producer’s output is a function of domestic ( ) and export supply ( ), as shown in equation 4.
………………………………….. (4)
Incomes and savings of various institutions in the economy are captured in the institution block. These institutions are households, enterprises, government, and the rest of the world. Households derive their incomes as a sum of incomes from the supply of factors, transfer from the government, and transfer from the rest of the world. Income is summarized as;
………………. (5)
These equations are summarized in Lofgren et al., (2002). The government obtains its revenue from taxes, and factors and transfers from the rest of the world, and this revenue is summarized in the following equation;
………………. (6)
What this equation implies is that; government revenue = direct taxes from institutions + direct taxes from factors + value added tax + activity tax +import tariffs + export taxes + sales tax + factor income +transfers from ROW.
Taxation in a CGE ModelOur approach to modelling indirect taxation (such as VAT) in the model takes into account unique issues related to manufacturing of storage materials. It hinges on the theory that, consumers are the final payers of indirect tax (such as VAT), and that, the effective tax rate for producers is zero (Kehoe et al., 1998). While VAT is paid on consumption of goods, some goods are exempt from tax due to their sensitivity and demand nature. For instance, agro-inputs and produces are normally exempted from indirect taxes such as VAT, and so are medicines and other social services (such as education, health, etc.).
While the production of HST may be exempted from indirect taxation (VAT), the inputs used in its production are not VAT exempt, for instance, plastics, metals, etc. These charges eventually raise the final price of the storage materials produced from these inputs. While the needs to eliminate such a tax (VAT) on these inputs is eminent, its practical implementation is complex. In the model, detailed aggregation of HST is not specified clearly, due to multiple reasons noted earlier. For instance, producers of HST technology are few in the country, currently three of them, accounting for very little demand of inputs (such as metal and plastics), specifically used in manufacturing of HST. Secondly, these firms are engaged in production of other goods and packaging materials, not related to agriculture, hence, it is difficult to discern how to exempt their inputs. Thirdly, it is not clear to what extent production of HST requires various inputs (e.g. plastics, metals, etc.). Owing to this, we extend our analysis to include an assessment of alternative government measures to support HST, i.e. using subsidization of HST materials to farmers, as is the case with fertilizers and other pre-production inputs.
Taxation is thus modelled by making the following assumptions; • Firms produce more than one commodity, and hence, commodity shares are represented as 〖OS〖_
(c,j) which is the share of commodity c in the total output of industry j. For instance, share of plastic output or storage materials in the total output of firm j.
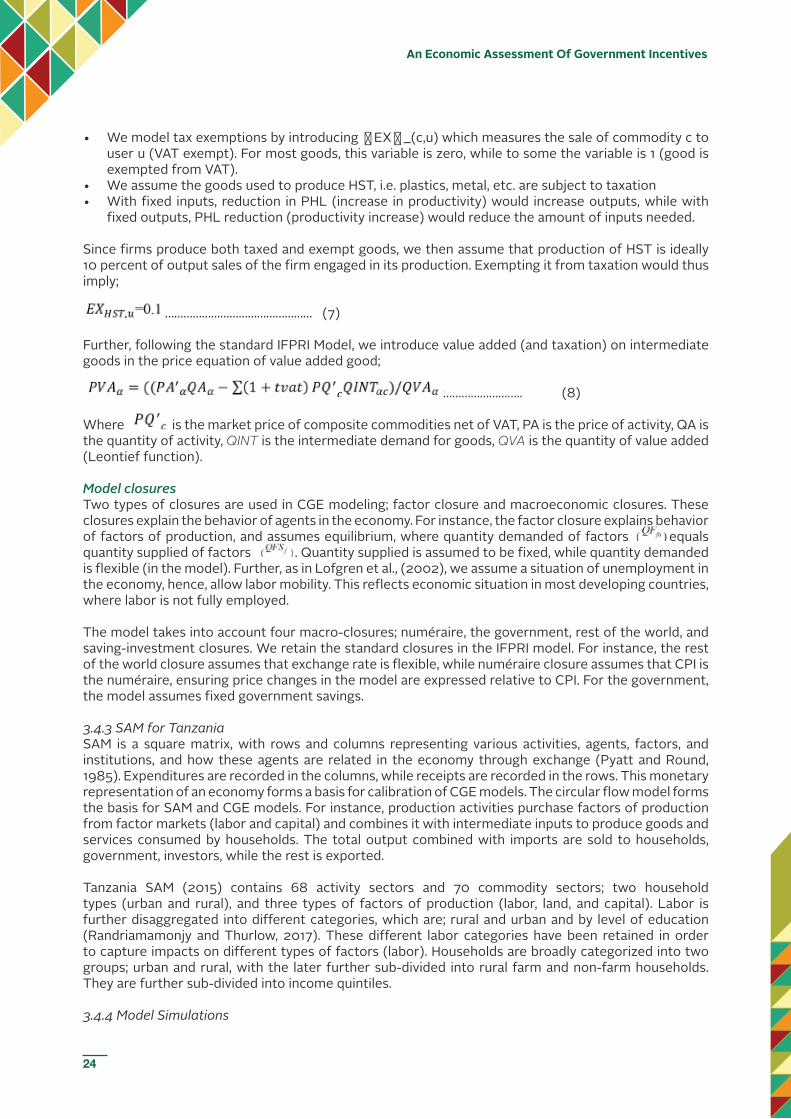
24
An Economic Assessment Of Government Incentives
• We model tax exemptions by introducing 〖EX〖_(c,u) which measures the sale of commodity c to user u (VAT exempt). For most goods, this variable is zero, while to some the variable is 1 (good is exempted from VAT).
• We assume the goods used to produce HST, i.e. plastics, metal, etc. are subject to taxation • With fixed inputs, reduction in PHL (increase in productivity) would increase outputs, while with
fixed outputs, PHL reduction (productivity increase) would reduce the amount of inputs needed.
Since firms produce both taxed and exempt goods, we then assume that production of HST is ideally 10 percent of output sales of the firm engaged in its production. Exempting it from taxation would thus imply;
………………………………………… (7)
Further, following the standard IFPRI Model, we introduce value added (and taxation) on intermediate goods in the price equation of value added good;
…………………….. (8)
Where is the market price of composite commodities net of VAT, PA is the price of activity, QA is the quantity of activity, QINT is the intermediate demand for goods, QVA is the quantity of value added (Leontief function).
Model closuresTwo types of closures are used in CGE modeling; factor closure and macroeconomic closures. These closures explain the behavior of agents in the economy. For instance, the factor closure explains behavior of factors of production, and assumes equilibrium, where quantity demanded of factors equals quantity supplied of factors . Quantity supplied is assumed to be fixed, while quantity demanded is flexible (in the model). Further, as in Lofgren et al., (2002), we assume a situation of unemployment in the economy, hence, allow labor mobility. This reflects economic situation in most developing countries, where labor is not fully employed.
The model takes into account four macro-closures; numéraire, the government, rest of the world, and saving-investment closures. We retain the standard closures in the IFPRI model. For instance, the rest of the world closure assumes that exchange rate is flexible, while numéraire closure assumes that CPI is the numéraire, ensuring price changes in the model are expressed relative to CPI. For the government, the model assumes fixed government savings.
3.4.3 SAM for TanzaniaSAM is a square matrix, with rows and columns representing various activities, agents, factors, and institutions, and how these agents are related in the economy through exchange (Pyatt and Round, 1985). Expenditures are recorded in the columns, while receipts are recorded in the rows. This monetary representation of an economy forms a basis for calibration of CGE models. The circular flow model forms the basis for SAM and CGE models. For instance, production activities purchase factors of production from factor markets (labor and capital) and combines it with intermediate inputs to produce goods and services consumed by households. The total output combined with imports are sold to households, government, investors, while the rest is exported.
Tanzania SAM (2015) contains 68 activity sectors and 70 commodity sectors; two household types (urban and rural), and three types of factors of production (labor, land, and capital). Labor is further disaggregated into different categories, which are; rural and urban and by level of education (Randriamamonjy and Thurlow, 2017). These different labor categories have been retained in order to capture impacts on different types of factors (labor). Households are broadly categorized into two groups; urban and rural, with the later further sub-divided into rural farm and non-farm households. They are further sub-divided into income quintiles.
3.4.4 Model Simulations

25
An Economic Assessment Of Government Incentives
Upon construction of the model, three conditions (market clearance, zero profit, and income balance) are tested to ensure a simultaneous solution to the set of prices and allocations of goods and factors in the economy (base model solution). Market clearance ensures that, factors demanded equals factors endowed by households, while income balance ensures factors endowment are fully employed in production and factor incomes are spent on purchase of commodities and remaining part is saved. With the base solution, three simulations are reported, all assessing various policy options in the development of agriculture sector, from PHM point of view. These simulations are agriculture-based, due to hurdles in estimating actual share of HST in the manufacturing sector.
Simulations conducted include:
1. Removal of taxation on storage materials of agricultural goodsWe simulate the impact of 18 percent removal of taxation on materials used to manufacture storage materials for agriculture products. Note that, we specify only materials that go to agriculture sector, as opposed to all materials in the economy (say plastic and metal), as this would overestimate the impact. While this does not reflect the actual HST sector in the economy, since it is not modeled or aggregated in the SAM or national accounts, it shows the magnitude and direction of impacts when taxation is waived on inputs used to produce them.
2. Subsidization of storage materials on agricultureWhile taxation could be a good policy to enhance use and production of storage materials (HST), its actual implementation is complex due to issues discussed earlier. We simulate the impact of 18 percent subsidy on production of storage materials used in agriculture. This is implemented to replicate the usual government intervention in subsidizing inputs in agriculture (e.g. fertilizer, herbicides, etc.).
3. Increase in agricultural productivity as a wholeWe finally simulate the impacts of enhanced/improved total productivity in agriculture, to reflect overall technology improvement in the sector. While this is general, it reflects the extent to which productivity in the whole value chain of agriculture impacts the economy. We simulate a 10% increase in productivity.
3.4.5 Model Sensitivity AnalysisThe model was tested for consistency and stability to ensure the equilibrium is unique, stable, and consistent. Two consistency tests were conducted following Condon et al., (1987) approach. First, consistency test to ensure no leakages, i.e. ensuring the sums of rows and columns of the SAM are equal. As well, the base model solution’s CPI is equal to unity. Secondly, stability of the equilibrium is tested by doubling the value of the numeraire. Doubling the numeraire resulted in doubling the absolute prices and nominal magnitudes, with real quantities and relative prices remaining the same, which means that the model has a unique equilibrium (Condon et al., 1987).

26
An Economic Assessment Of Government Incentives
4.0 RESULTS AND FINDINGS
4.1 Descriptive Analysis of the Survey Data
The survey to inform RIA collected information from 206 farmers, both those using and those not using hermetic storage technologies (HST); 10 NGOs, 30 agricultural and extension officers; 26 distributors and 3 manufactures of hermetic storage technologies (mainly the hermetic bags). Below we present descriptive analysis of the survey by showing insights from each of the respondent groups.
4.1.1 Insights From FarmersThe study team interviewed a sample of 206 farmers. The profiles of interviewed farmers show that the majority are men and have a basic level of education (completed primary school).
Figure 4.3: Gender profile of interviewed farmers
Clearly, the survey data show that, over 85% of farmers stored their produce mainly using conventional methods. Maize is the most-grown produce in the sampled areas, hence the main candidate crop for storage. Although most of the farmers use sacks or open drums (47%) as the main storage method, the use of hermetic bags is gaining momentum (40%). This indicates how popular the use of HST has become over time.
Figure 4.4: Storage incidence among interviewed farmers

27
An Economic Assessment Of Government Incentives
Figure 4.5: Main method of storage
Figure 4.6.: Main crops farmed
Figure 4.7: Main method of storage
The main criteria farmers use to select the main storage methods are the cost of purchasing the storage technology, the ability of the method to preserve quality of the food stored and its availability. While HST preserve quality and may be available, the cost of purchasing them appears to be the biggest hindrance to their use.
Figure 4.8: Criteria for selecting the main storage method

28
An Economic Assessment Of Government Incentives
Figure 4.9: Use of HST
Of the 179 farmers who stored their crop products, 86 (equivalent to 48%) have used HST. This figure is interesting when compared to the reported main storage method. Of the 86 farmers who used HST, 83 use them as main storage technology. This implies that a majority of the farmers who decide to adopt HST use them as a main and not subsidiary method.
Farmers mostly use hermetic bags of all the HST; the use of metal or plastic silos is minimal while the use of cocoon barely exists.
Figure 4.10: Which HST is used (note PICs = any hermetic bag)
On average, most of the farmers use less than twenty hermetic bags. However, most of them claim that the number of storage units do not suffice their needs. And the main reason they cannot buy enough is affordability. Most of the farmers are willing to pay between Tshs 2,000 to Tshs 3,000 (which roughly is about the average unit cost of producing the hermetic bag).
Figure 4.11: Willingness to pay for HST next season
From the information provided by Farmers, the value of stored produce (Figure 4.12) is certainly much larger compared to the value at the harvest period (Figure 4.13). However, a majority of farmers end up missing the opportunity due to a number of challenges including lack of storage capacity. As a result, the majority end up selling their produce during harvest period (Figure 4.14).
Figure 4.12: Average price (value) of stored produce per kg

29
An Economic Assessment Of Government Incentives
Figure 4.13: Average price of produce at the harvest season per kg
Figure 4.14: Proportion of produce sold during harvest period
Figure 4.15: Units of HST used last season
Figure 4.16: Adequacy of used hermetic bags vs. needs

30
An Economic Assessment Of Government Incentives
Most farmers advocate for increasing awareness and removing VAT as the best approaches to promoting wide-scale utilization of hermetic storage technologies.
Figure 4.17: Strategies to promote utilization of HST
4.1.2 Insights from NGOs and Agricultural and Extension Officers
Most NGOs and extension/agricultural officers working with farmers perceived that farmers use mainly local structures followed by sacks and hermetic technologies. The discrepancy we observe here is because NGOs deal with farmers who cultivate a variety of crop, some of which cannot be stored using hermetic storage technologies. This groups identifies advantages for farmers using hermetic bags as that they can minimize losses from storage insects and can store the produce for a longer period at good quality, thus improving food security. They perceive the main challenges facing the use of hermetic bags being high prices and awareness and advocate for increasing awareness, removing tax and subsides as a means to promoting wide- scale utilization of HST.
Figure 4.18: NGOs awareness of HST
Figure 4.19: NGO perspectives on the challenges faced by farmers in using HSTs

31
An Economic Assessment Of Government Incentives
4.1.3 Insights from Distributors
On average, most of the distributors supply less than 5,000 bags in a year per distributor, indicating that most are small-scale agri-dealers or retailers. This is less than the capacity they are able to supply. The main reasons they supply below capacity is the limited demand relative to the cost of the technologies. They also advocate for the increase in awareness and removal of VAT to promote wide scale local manufacturing and utilization of hermetic bags.
Figure 4.20: All Distributors have capacity to supply more Hermetic bags
Figure 4.21: Factors limiting Distributors’ capacity to supply more HSTs
Figure 4.22: Approaches proposed by Distributors for promoting HST
Figure 4.23: Distributors’ main Customers for Hermetic Bags
Figure 4.24: All distributors refute presence of counterfeit HSTs
4.1.4 Insights from Manufacturers of HSTs
Three firms were visited for interviews to collect baseline data and information for assessing potential policy measures for promoting wide-scale manufacture of HSTs. The firms are: AtoZ in Arusha

32
An Economic Assessment Of Government Incentives
(producing AgroZ bags); Harsho Group in Hai, Kilimanjaro (producing Harsho Ghala bags) and Pee Pee Tanzania Limited (PPTL), in Kange – Tanga (producing PICS bags). AtoZ started producing hermetic bags in 2016, using its brand AgroZ bags. From the information available in the AtoZ website, AgroZ® Bag is a multi-layered hermetic bag recommended for the storage of grains and pulses for six to nine months (or longer) to protect against insects and pests without using pesticide dusts. Harsho Group started producing hermetic bags from 2015 through its brand “Harsho Ghala”.
Sales Revenue and Installed CapacityAtoZ has an installed capacity to produce over 50 million hermetic bags per year, subject to the availability of the market. The interview with the Marketing Manager indicated that the company produces around 1 million AgroZ bags per year. The sales figures provided by the Enumerator were in the form of a range of total sales per year, and not the exact number of bags. First, the bigger share of the manufactured AgroZ bags are exported, mainly to neighboring Kenya (ranging between 600,000 to 700,000 bags per year), while sales in the Tanzanian market are much smaller, at about 200,000 bags per year; and about 100,000 bags sold to other countries. Second, it appears from the interview that, although the market for hermetic bags is expanding, especially in the neighboring East African countries, the growth of the market in Tanzania is increasing albeit at a slower pace compared to Kenya. Third, despite the AgroZ, the firm produces millions of other types of bags including cement bags per year. In addition to Tanzania, AtoZ exports bags to Mozambique, Zambia, Malawi, Uganda and Rwanda. In total, AtoZ produces over 50 million bags per year. In this respect, the company is the second largest producer of cement bags in Africa after Nigeria. It also exports to Canada, USA, and UK. Finally, AtoZ can produce about 1.5 million bags per year, but has not exhausted this capacity owing to demand constraints.
Table 4.1 summarises the production volumes, sales, cost and price information by firm. Apparently, the firms appear to bear similar characteristics and size. Unlike in the case of AtoZ, the interview with Harsho Group was not adequately supported by reliable data, since most information was qualitative in nature. Instead they provided number of Harsho Ghala bags sold per month, which ranges between 100,000 to 150,000 bags per month. This implies actual demand (number of hermetic bags sold) could range between 1.2 million to 1.8 million per year (closer to AtoZ estimates). Most of the sales are made during the harvesting season. The firm also appeared to be more flexible compared to AtoZ in terms of accessibility and availability of its products to small scale retailers/distributors. According to the Marketing Manager, anybody can walk into the factory and order/buy any amount of hermetic bags starting from a minimum of 250 bags (one bale).
More generally, the two firms differ in terms of market concentration. AtoZ is more focused on the export market than Harsho Group which is investing heavily in marketing its brand for the domestic market. Finally, the Harsho Group.s Marketing Manager affirmed that the company experiences excess demand, especially during the bumper harvest season (May-October), implying that their brand is getting significant market response. Indeed, so far they have active agents/distributors and marketing efforts in most regions of Tanzania including Tunduma, Mbeya, Songea, Rukwa, Tanga, Dar, Kilimanjaro, Manyara, Arusha, Kahama, SIngida, Dodoma, and Shinyanga. Another important difference is that AtoZ is fully ISO 9001 certified but Harsho Group is yet to complete certification.
Demand and CompetitionThe demand for hermetic bags exists but it needs to be harnessed. The AtoZ Company confirmed that the demand for hermetic storage bags is potentially big, and requires awareness- raising and rationalization of prices of the bags. According to estimates by AtoZ, Tanzania has about five million consumers of hermetic bags, which translates to 50 million bags each year (approximating that each farmer would need about 10 bags a year). For instance, over 6.3 million tons of maize is produced per year, out of which 5.3 million tones is consumed, and 1 million sold. Harsho Group organizes at least two seminars per year, and in addition, attends exhibitions. PICS is the largest producer in Tanzania followed by AtoZ. PICS was initially supported as an NGO with Danish assistance, unlike AtoZ which struggled to establish its own brand right from the beginning. Nonetheless, there is no competition given the size of the market for hermetic bags even despite an insignificant amount of bags imported by Ecotac.

33
An Economic Assessment Of Government Incentives
Table 4.1: Impact of VAT removal on Price and Production volume by firm
Company name* “X” “Y” “Z”
Sales Revenue per year Tshs 3.4 Billion Tshs 3.2 Billion Tshs 30 Billion
Cost per unit Tshs 2,500 Tshs 2,800 2,800
Factory price Tshs 3,400 Tshs 3,200 3,900
RRP to farmers Tshs 4,500 Tshs 3,800 5,000
Production (quantity) per year 1,000,000 1,200,000 1,800,000
Demanded (sold) per year 1,000,000 1,200,000 1,800,000
Sale to Domestic Market 200,000 1,200,000 600,000
Sale to Export Market 800,000 0 1,200.000
Percent increase in production if VAT is removed
20% 50% Depends on market response
Percentage reduction in price if VAT is removed
18% 18% 18%
Do you have the capacity to produce more of HSTs
50 million 1,800,000 3,000,000
Why are you not expanding production to that capacity?
A: Limited demandB: High production costs
A: Limited demand A: Limited demand
Source: Firm interviews for the AGRA study (2019)
* The company names are deliberately made anonymous since the information has commercial significance.
Priority Policy Measures for Promoting HSTIn terms of promoting increased production and utilization of hermetic bags, AtoZ proposed only two priority policy measures. The first one is increased awareness and sensitization on the use and utilization of hermetic bags. This is because awareness-raising is a costly activity. Indeed, the firm recommended that raising awareness of hermetic bags should be a shared responsibility involving actors across the wide range of stakeholders (Government, Private Sector, Farmers, Civil Society and Development Partners). AtoZ has a good experience working with multiple stakeholders in promoting the production of goods that protects public health, including malaria mosquito nets. The second priority policy measure is VAT removal, which is a big issue, and for which the firm’s Marketing Manager has attempted to meet officials in the Ministry of Agriculture to raise the issue, and hence welcome the initiative by AGRA to commission a study that will inform this potentially impactful policy decision. Indeed, the firm was categorical that other policy measures such as subsidy and input tax removal were of less importance since they distort prices.
The best way to enhance awareness is by supporting extension officers to play a more active and effective role in educating farmers. However, awareness-raising can only be effective if accompanied by measures to reduce the price (affordability). The combined effect will stimulate further production. It should be noted that the manufacturers strongly feel that the Government ought to consider hermetic bags in the same light as other agricultural inputs such as seeds and pesticides in terms of fiscal incentives and public policy support. There is a strong need to advocate for macroeconomic stability, given the prevailing fall of the Tanzania shilling to the dollar which hurts the competitiveness of the economy. Indeed, the company admitted that they would have considered increasing the price of hermetic bags by now.

34
An Economic Assessment Of Government Incentives
Table 4.2: Proposed policy measures for promoting HSTs*
Priority No. “X” “Y” ”Z”
1 Electricity Input tax removal VAT removal
2 VAT removal Electricity Increase awareness
3 Increase awareness VAT removal Input tax removal
Source: Firm interviews for the AGRA study (2019)
* The company names are deliberately anonymous since the information has commercial significance.
Manufacturing firms are greatly concerned about the reliability of electricity supply more than the VAT issues. However, while awareness raising is paramount, they are confident they can intervene themselves. “Fix the electricity and VAT and we will deal with awareness ourselves,”,says AtoZ’s Marketing Manager. The firm appears to have noted the strategic priority for their future growth is in agriculture. The company official also admitted that “In agriculture we have a lot of room for expansion.” The study team also learnt that GoT is at an advanced stage of preparing a post-harvest strategy and platform. The manufacturers advise the need to have a post-harvest department within the Ministry of Agriculture to facilitate and accelerate way of reaching out to farmers. So far only NGOs have undertaken substantial interventions in this area, which is limited to only a few regions. The post-harvest policy interventions should be backed by a high political will aimed at reducing PHLs. So far, the top priority in using hermetic bags is on awareness raising. Yet there are significant regional variations in terms of the awareness of HST and indeed on PHLs. From the field survey it is evident that Rukwa and Njombe are ahead on HST and PHL awareness, compared with Tanga which is the lowest.
HAtoZ employs a multi-pronged approach to marketing including the use of agro-dealers and distributors, SACCOs and AMCOS (supported by various NGOs, mainly RUDI), direct sale via group training, exhibition and direct exports. Clearly, the company does not rely on retailers, compared to Harsho Group. Furthermore, AtoZ has developed a strong brand due in part to its quality certification and compliance to ISO 90001. Standards compliance has allowed AtoZ to successfully penetrate the export market, and earned it significant growth in sales compared to the domestic market (which awaits much of the awareness building). In addition to domestic sales, AtoZ exports the hermetic bags to Mozambique, Zambia, Malawi, Uganda and Rwanda. Most of the Harsho Ghala bags are sold to distributors/agents (85%), retailers (10%), and direct sales to farmers account for the remaining 5%.
Cost of Production, Margin and PricingThe unit cost per an AgroZ hermetic bag is US$ 1.1 (currently about Tshs 2,600/=). The selling price (off factory) is Tshs 3,400/= for wholesale price and Tshs 4,000/= for retail price. This means that the tax, producer margin, marketing, and distribution cost ranges between Tshs 800/- to Tshs 1,400/= per hermetic bag. In percentage terms, the margins and overheads account for 23% to 35% of the ex-factory prices. From the information provided by the firms, the cost structure of producing one hermetic bag appear as follows (as a % of the sale price).
The AtoZ firm noted that, if VAT in hermetic technologies were to be removed, the firm would increase production by about 20%, and lower the price by an exact 18% equivalent to the VAT rate. Without VAT removal, it would be difficult for the producers of hermetic bags to lower the current off-factory prices. The main reason is that the company enjoys minimum producer margins. Production of AgroZ bags is also supported by the production margins of other (mainly cement) bags, which appear to be much more profitable. Nonetheless, there is a need to ensure people who sell the hermetic products also have a reasonable knowledge of agricultural science so that they can play a first-hand role of educating the end user/buyer of the bags. In this case, a system of recognizing the role or certifying agro-dealers should be introduced. Although the firms agree on the need to improve the quality of the bags, they are also sensitive about a potential increase in cost, which is tantamount to increasing the price of the bags.

35
An Economic Assessment Of Government Incentives
Table 4.3: Cost structure of producing one hermetic bag (percentage of unit price)*
Priority No. “X” “Y” “Z”
Raw materials 40 60 50
Other costs of production 20 10 20
*Total Cost of production 60 70 70
Tax and Other charges 20 10 10
Marketing Costs 5 5 5
Distribution Costs 5 5 5
Producer Margin 10 10 10
Total 100 100 100
* Total cost is equal to the cost of raw materials and other costs of production
Source: Firm interviews for the AGRA study (2019). *The company names are deliberately anonymous since the information has commercial significance.
In the case of Harsho Ghala, if VAT in hermetic technologies were to be removed, the firm would increase production by about 50%, and lower its price by an exact 18% equivalent to the VAT rate and the demand would increase to trigger an increased supply. But unlike AtoZ, Harsho Group would be willing to reduce its price if demand were to increase with widespread awareness. The respondents refuted the claim that there are counterfeit hermetic bags in the market. Instead, the respondents noted that farmers tampered with the hermetic bags (for instance, by removing one lining to make up another bag), hence compromising the product. The company is willing to work with Development Partners in educating the farmers on the appropriate use of the hermetic bags.
4.1.5 SynopsisThe use of HST is becoming popular among farmers who have been exposed to HST and the majority of the farmers use hermetic bags compared to other HST. This could be as a result of the nature of scale at which farmers operate and the cost and convenience of using hermetic bags relative to other HST. The majority of the farmers use HSTs mainly to store the amount they will use for self-consumption. They do not use HST for produce that has been set aside for sale because they believe the profit margins of storing longer to sell later when prices are high are not worth the costs of using HST. They also require more awareness on the use of and benefits of HST.
Most NGOs and extension and agricultural officers working with farmers believe that farmers need to be acquainted with knowledge on post-harvest systems first and to be made aware of the existing storage technologies with their advantages and disadvantages. They have observed that introducing new technologies without adequate training does not produce strong positive impacts.
For farmers to increase their utilization of hermetic storage technologies, the market should also respond in terms of the price differences between products of high quality (from hermetic storage) and low quality. This is not the case currently, since there is a very low margin attributed to information asymmetry. Buyers may see products with a good physical appearance but may still doubt that they have been stored using pesticides, thus attaching a lower value. Indeed, one case was identified during the field survey which provides a strong evidence that, with adequate information and awareness raising, the margin due to use of HST can be identified to provide additional monetary incentive for using HST.
It also becomes tricky for farmers when it comes to selling their products especially in the same sacks they were stored in. With the use of hermetic bags, they would either have to sell them together with the hermetic bags (which is a loss as the bags are expected to be used for at least 3 seasons) or pay for additional labor to exchange from hermetic to normal polypropylene bags.

36
An Economic Assessment Of Government Incentives
All the groups have advocated for the removal of VAT as a means of promoting wide-scale local manufacturing and utilization of HST. However, all the groups have on average ranked the removed of VAT second to increasing awareness on HST. A call has also been made by all the stakeholders to have a specific body to oversee/regulate and enforce standards of the hermetic storage technologies, such that all manufacturers would be required to meet the quality specifications so as to combat the potential for counterfeit incidences, as well as controlling of the price against unscrupulous traders that may benefit from low levels of knowledge of buyers/farmers.
In addition, interviews with manufactures raised the important question of the environmental impact of the hermetic bags. The manufacturers echoed the importance of planning for recycling points for the plastics or using the distributors to collect the bags that are no longer useful.
4.2 Regulatory Impact Assessment: Results of the Cost Benefit Analysis
4.2.1 IntroductionFrom a small survey conducted, which included both small and large scale farmers, most of the farmers cultivate maize or beans as their main crops (the results are qualitatively similar to the proportion recorded in the national agricultural sample survey). In this sample 97% and 55 percent of the farmers grew maize and beans as one of the two main crops respectively as presented in Table 4.4. The proportion of farmers growing cassava and groundnuts were very low; while we did not observe other crops.
Table 4.4: The main crops grown by farmers
Number Proportion growing
Amount harvested
Value/Kg Stored
Maize 200 0.97 10,788 339 0.98
Beans 114 0.55 1,013 1,112 0.43
Cassava 18 0.09 3,450 70 0.017
Groundnuts 3 0.015 833 550 0.006
Source: AGRA HST Survey, January 2019
On average, farmers harvested about 11 tons of maize which were valued at Tshs 339/- per kg. The average amount of beans harvested is 1 ton but at a much higher value, averaging Tshs 1,112/- per kg. HSTs have so far been used mainly for storage of maize and beans. The proportion of farmers growing each crop that uses the HST are almost the same (Table 2). However, maize being the major staple food crop grown by the majority of the farmers, has the widest use of HST in terms of the absolute number of farmers using HST. Due to data and information limitation we use maize as the main reference crop and in some other cases it is beans.
Of the four existing HST in Tanzania, hermetic bags are the most popular. Table 4.5 shows the proportion of farmers using HST by type of HST they use. Thus 95% of the farmers using HST use hermetic bags; while 8% and 6% use metal silos and plastic silos respectively. Our survey did not capture any farmers using cocoons. Given this observation, the analysis will focus more on hermetic bags. Hermetic bags, in comparison to other types of HST are more suitable in terms of size and affordability, particularly for the small-scale farmers who are the majority of farmers in Tanzania.
Table 4.5: Proportions of farmers using different storage method by crops
All crops Maize Beans
Obs Proportion Obs Proportion Obs Proportion
1. Hermetic technologies 179 46% 176 46% 107 50%

37
An Economic Assessment Of Government Incentives
2. Locally made traditional structure
179 6% 176 6% 107 6%
3. Sacks/open drum 179 54% 176 54% 107 69%
4. Unprotected pile 179 3% 176 3% 107 3%
5. Ceiling 179 4% 176 4% 107 1%
6. Other, specify 179 14% 176 14% 107 6%
Source: AGRA HST Survey, January 2019
Table 4.6: Proportions of farmers using HST by type
Type of Hermetic Storage technology No using Proportion
Hermetic bags 82 95%
Metal Silos 7 8%
Cocoons 0 0%
Plastic Silos 5 6%
Source: AGRA HST Survey, January 2019
When choosing a storage method, farmers focus on the price of the storage technology, its ability to maintain the quality of the stored product and its availability (Table 4.7). From these criteria, one would expect that hermetic bags would be commonly used due to being relatively cheap, ability to maintain good quality of the stored product and being relatively easily available (there are three manufacturers of hermetic bags in Tanzania).
Table 4.7: Criteria for choosing a storage method
Obs. Proportion
1. It is cheap 179 56%
2. It maintains the quality of grain for a long time 179 50%
3. It is easily available 179 44%
4. Not easily attacked by storage insects 179 31%
5. It maintains the weight of the product 179 20%
6. Not easily affected by moisture 179 18%
7. Not easily attacked by rodents such as rats 179 12%
8. Others, specify 179 8%
Source: AGRA HST Survey, January 2019
In summary, the focus on the cost benefit analysis is on hermetic bags among farmers who grow maize as the main crop but with the possible inclusion of other crops and other HSTs where reliable data is available. The results, when extrapolated will capture a bigger segment of the market for HST.

38
An Economic Assessment Of Government Incentives
We assume a hypothetical average farmer who uses the hermetic technology for storage. The aim is to estimate the net benefit accrued to this farmer for using HST. Then this net benefit of the average farmer is extrapolated to find the total net benefit accrued to all farmers who adopt or can potentially adopt HST for storage. The study by Chegere (2017) has done a thorough work to estimate the economic benefit of adopting the hermetic bags among maize farmers in Tanzania. We will use the parameter estimates from this study together with the information obtained from the survey conduct in this study to complement each other in the cost benefit analysis.
4.2.2 Cost Estimates
A farmer using HST faces the following costs:i) The cost of purchasing the HST.ii) The extra costs related to using the HST (for example more labor hours involved).
The survey of farmers, distributors and the manufactures indicate that the average cost of the hermetic bags to the farmer is about Tshs 5,000/= (equivalent to US$ 2.5). On average farmers use 10 bags per season.
Table 4.8: Price and use of Hermetic bags
Observations Mean Stdev
Price of hermetic bags 85 4,892 1,024
Units of hermetic bags 85 10.4 14.7
Source: Authors calculations based on the AGRA HST Survey, January 2019
The cost of purchasing the HST =Average Price of HST x Average Units of HST used
=$2.5 x 10=$25
So the total cost of bags per season is US$ 25 (but once bought, the bags can be used up to three seasons)
We will refer to the estimated extra cost of adoption of hermetic bags apart from the bag itself. In Chegere (2017) this figure was calculated by collecting information from farmers on the labor hours, amount of money, or both, required to adopt each of the practices associated with adoption of hermetic bags. These extra costs probably come from having to invest more in proper harvesting, immediate handling of the harvest, sorting, proper drying, storage facility improvement such as installing pallets or controlling rodents etc. We use the parameter estimates from this study for these cost estimations. Farmers stored their produce using 10 hermetic bags on average, which implies that the amount stored in hermetic bags is 1 ton on average. It was found that in one season, a hypothetical average farmer incurs an additional US$ 3.76 in extra costs for adoption compared to farmers that do not use the bags (calculations are shown in Table 4.9).
Table 4.9: Estimation of extra costs related to adoption of HST
[1] [2] [3] [4] [6]
Labor hours per ton
Monetary cost per ton (USD)
Total Monetary cost per
ton (USD) =0.5*[1]+[2]
Marginal effect Cost of adoption
=[3]*[4] (USD)
Harvesting 8.93 4.46 0.076 0.34

39
An Economic Assessment Of Government Incentives
Immediate handling
6.37 6.37 0.204 1.30
Sorting 3.59 1.80 0.118 0.21
Drying 3.35 1.68 1.093 1.84
Storage facility improvement
2.10 4.26 5.31 0.014 0.07
Total 3.76
Source: Authors calculations based on the AGRA HST Survey, January 2019 and the parameters from Chegere (2017).
4.2.3 Benefits Estimates
The benefits which the farmer accrues from using HST come from:i) Lower storage losses compared to not using HST;ii) Higher market value of the produce due to high quality and the possibility of exploiting the
opportunity of selling the products when prices are better;iii) Lower or nil costs of using storage pesticides.
Following the approach and borrowing the estimated parameters from Chegere (2017) we will estimate the above-mentioned benefits in one season, accrued to a farmer who uses hermetic bags. The first benefit from using hermetic bags is the chance of having lower storage losses compared to not using the HST. The study used the marginal effects obtained from the estimations, that is, the mean difference in losses experienced by the farmers who used hermetic bags and those in the control group, in a randomized control setting. Without using hermetic bags, farmers would experience losses at storage stage equivalent to 8.4%. Upon using hermetic bags, this loss is lowered by 5.6% (so on average the storage loss for farmers using hermetic bags is 2.8%). We aim to find the value of this amount of crop which is abated by using hermetic bags of the amount stored.
We find the total amount of crop loss abated by the hypothetical average farmer using hermetic bags by multiplying the marginal effects (the difference in losses between the two scenarios) by the total amount of the crop stored. Then we calculate the monetary value of the amount abated by multiplying the amount abated by the market price . The summary of such a calculation is shown in Table 4.10.
Table 4.10: The marginal value gained by average farmer using hermetic bags
Kgs Amount abated
Value saved
Amount stored 1,000 x Marginal storage loss abated
0.056 = 56 = 11.2
Amount stored 1,000 x Gain from not using insecticides
0.0026 = 2.6
Amount sold 300 x Gain from selling at higher price
0.0130 = 3.9
Total value gained = = 17.7
Source: Authors calculations based on the AGRA HST Survey, January 2019; and the parameters from Chegere (2017)
From this estimation, it is found that per season, a farmer will be able to save US$ 11.2 due to loss

40
An Economic Assessment Of Government Incentives
abatement as a result of using hermetic bags. The second benefit a farmer using hermetic bags can gain is by using less insecticide. The marginal gain, that is, the mean difference between the cost of using storage pesticides incurred by the farmers using hermetic bags and those who do not use hermetic bags from Chegere (2017) are used. Then we multiply this marginal gain by the total amount stored. The estimation is shown in Table 4.10. The marginal gains from using less of storage insecticides is US$ 2.6 per ton.
The third benefit a farmer using hermetic bags can gain is by getting a higher market price for their product because of its high quality after storage and possibility to exploit the opportunity of selling the products when prices are better due to reliable storage. The marginal gain that is, the mean difference between the price obtained by the farmers using hermetic bags and those who do not use hermetic bags from Chegere (2017) are used. Then we multiply this marginal gain by the total amount sold. The estimation is shown in Table 4.10. Assuming that 30 percent of the amount stored in the hermetic bags is sold in the market , the marginal gains from using less of storage insecticides is US$ 3.9 per ton of crop stored. Thus, the total benefits accrued to the farmer using hermetic storage bags is US$ 17.7 per season when compared to a farmer who does not use hermetic bags.
4.2.4 Net Benefits EstimatesIgnoring the cost of the hermetic bags, the net benefit for an average farmer using hermetic bags is US$ 13.94 (17.7 minus 3.76). The survey indicated that farmers stored produce in hermetic bags for an average of eight months as presented in Table 4.11. Therefore, it is also fair to assume that one season represents a year.
Table 4.11: Average duration of storage
Hermetic Sacks/open drums
Duration of storage in months 8.35 6.71
Source: Authors calculations based on the AGRA HST Survey, January 2019
On average, a farmer uses 10 hermetic bags, which cost a total of US$ 25 (at a price of US$ 2.5per bag) that can be treated as the total initial investment. The hermetic bag lasts on average three seasons. Considering the investment horizon of three seasons and assuming the net benefits per season during that period are constant (US$ 13.94) per season, with the initial investment of US$ 25, the internal rate of return (IRR) for this intervention is 30.9%.
We could also estimate the net benefit accrued to the farmers per season taking into account the cost of investment in hermetic bags. Using a conservative approach and spreading the cost of the bags in three seasons, the cost of the bags per season is US$ 8.33 (25/3). Thus the net benefits of using hermetic bags to the farmer per season is US$ 5.61 (13.94 minus 8.33).
Extrapolating these costs to the 5 million consumers of hermetic bags in Tanzania,the total net benefit is US$ 5.61 x 5 million= US$ 28.05 million per season, equivalent to Tshs 65.9 Billion per season.
4.2.5 Changes in Demand and Willingness to Pay after VAT RemovalFrom the survey, about 65 percent of the farmers wished they could buy more of the HST as shown in Table 4.12.
Table 4.12: Demand gap for HST by farmers
Observations Proportion
The number of bags was enough 30 0.35
Wished I could buy more 55 0.65
Source: Authors calculations based on the AGRA HST Survey, January 2019

41
An Economic Assessment Of Government Incentives
As shown in Table 4.13, the main reason for not having more of the HST is due to the higher price of HSTs.
Table 4.13: Reasons why farmers had a demand gap for HST
Observations Proportion
1. I cannot afford to buy more 55 0.78
2. The remaining produce is for immediate sale 55 0.22
3. The remaining produce if for immediate consumption 55 0.07
4. Others (specify) 55 0.04
Source: Authors calculations based on the AGRA HST Survey, January 2019
The assumption we make in this task is that the removal of the 18% VAT charged on hermetic storage technologies would increase production and utilization of hermetic storage technologies. We confirmed this assumption by creating a scenario where farmers would state their willingness to pay for the HST, and how many units of the HST they were willing to buy at that price in the next storage season. We then asked how many units they would be willing to buy if this price was lowered by 18% that would enable us to estimate the elasticity of demand (shown in Table 4.14). We make a firm assumption that the tax removal would be fully passed through (100 percent pass through) to the price. That means that if tax is reduced by 18%, the price of the HST would decline by 18%. We confirmed this assertion from the interviews with manufacturers and distributors who were willing to lower the price by the same proportion.
Elasticity of demand is the percentage change in demand due to a percentage in price.
Table 4.14: Willingness to buy HST
Observations Value
Willingness to pay for hermetic bags (100 kg) 206 2,828
Number of hermetic bags willing to buy 206 103
Number of units willing to buy after TAX removal 206 154
Willingness to pay for silos (1 ton) 206 91,784
Number of silos willing to buy 206 5.2
Number of units willing to buy after TAX removal 206 7.5
Willingness to pay cocoons (5 tons) 206 130,347
Number of cocoons willing to buy 206 4.1
Number of units willing to buy after TAX removal 206 6.1
Source: Authors calculations based on the AGRA HST Survey, January 2019
The distribution of responses on the willingness to pay can be further clarified using figures 4.25 and 4.26.

42
An Economic Assessment Of Government Incentives
Figure 4.25: Distribution of Willingness to pay (n=203)
Source: Authors calculation based on the AGRA HST Survey – January 2019.
Clearly, as shown in figure 4.26, the proportion of farmers willing to pay for hermetic bags declines steadily with increase in prices.
Figure 4.26: Willingness to Pay for Hermetic Bags
Source: Authors calculation based on the AGRA HST Survey, January 2019.
If VAT was to be removed, and the price of hermetic bags declined by 18%, farmers would increase their demand from 103 bags to 154 bags. This implies that VAT removal would increase demand by 1.5 times. With demand currently at five million hermetic bags, if VAT was removed, demand would increase to 7.5 million bags. Assuming that the same net benefit would accrue to farmers. The total net benefit is US$ 5.61 x 7.5 million= US$ 42.08 million per season. However, for each hermetic bag, the government will lose revenue collected by 18%. That is 0.18 x US$ 2.5=US$ 0.45
The total revenue loss is US$ 0.45x 7 million bags= US$ 3.15 million per season

43
An Economic Assessment Of Government Incentives
Taking into account the individual net benefit to the farmers and the social cost of losing revenue collection, the total net benefit to the society is US$ 42.08-3.15= US$ 38.93 million per season.
Subtracting the net benefits obtained without VAT removal, the total net benefit to the society is US$ 38.93-28.05= US$ 10.88 million per season. Therefore, VAT removal would increase the total net benefit to the society by US$ 10.88 million per season equivalent to Tshs 25.56 Billion per season compared to the situation with tax.
4.2.6 Conclusion of the Cost Benefit Analysis• The use of hermetic storage technologies is gaining popularity as the main storage method among
farmers• Hermetic bags are used more than other Hematic Storage Technologies (HST) due to availability,
suitability and affordability• However, farmers are constrained by the relatively higher price of hermetic bags compared to their
desire to use them, thus creating a demand gap• Manufacturers are also producing at excess capacity with more room to produce more of hermetic
bags• Farmers are willing to buy more of the hermetic bags if the price of hermetic bags is lowered• Manufacturers and distributors are willing to fully pass through fully the tax removal by lowering
price by the same proportion of the tax• The removal of tax will increase demand by 1.5 times considering a wide range of possible benefits
and costs of the hermetic bags, the gains accrued by farmers from using hermetic bags outweigh the costs of the bags and the extra costs associated with the adoption of the bags which amounts to US$ 28.05 million per season, equivalent to Tshs 65.9 Billion per season.
• The revenue loss from removing VAT on HST is outweighed by far by the net benefits accrued from using HST; the total net benefit to the society is US$ 42.08-3.15= US$ 38.93 million per season.
• VAT removal would increase the total net benefit to the society by US$ 10.88 million per season equivalent to Tshs 25.56 Billion per season compared to the situation with VAT.
4.3 Economy-wide Impact of Removing VAT on HSTs
4.3.1 Introduction The results of the Regulatory Impact Assessment show a strong positive case of a cost-benefit analysis in that, the monetary gains far more outweigh the cost of adopting the new technology (hermetic bags). However, the analysis does not inform the policy maker of any possible impact of the proposed policy change on the economy. Indeed, the removal of VAT would entail an immediate short-term revenue loss to the extent of the tax rate (18%) but the gain for farmers and the resulting agricultural productivity are assumed (in theory) to have far-reaching and favorable impacts on the economy in the long run that cannot be determined using CBA.
Using the CGE analysis, this section will outline the economy-wide impacts of removing 18% VAT on the production of hermetic bags. While there are several policy instruments and incentives that could be deployed to promote wide-scale utilization and manufacturing of HSTs, the study focuses on the removal of VAT in the production/consumption of the HSTs. Thus, we will first present the results of the first simulation (removal of 20% VAT on HSTs) before considering or comparing with results of the other two simulations. Indeed, based on stakeholder consultations and the survey undertaken for this study, the removal of VAT has been singled out as the most effective means of providing incentives for the wide-scale utilization and manufacture of HSTs. Other policy instruments for promoting HSTs include the provision of subsidies to manufacturers or directly to farmers. In the survey, stakeholders were less convinced about the usefulness of subsidies owing to the complexity around its implementation. Nonetheless, we implemented this simulation to provide an alternative policy option to VAT removal for the Government to consider. Finally, in the context of an economy-wide framework, the policy maker would be interested to know what happens to the rest of the economy when we reduce post-harvest loses by adopting the use of HSTs. This is an important question, as it would show the extent to which improvements in agricultural productivity affect the rest of the economy. The results will show the impact of productivity shock (10% increase in productivity) in the agriculture sector.

44
An Economic Assessment Of Government Incentives
4.3.2 Impact of Removal of VAT on HSTsThe analysis reveals that the removal of 18% VAT on agricultural storage bags has a positive albeit small increase in GDP (0.02%). This results from a decrease in the prices of HST bought by farmers, and ultimately, a decrease in final price faced by consumers. A decrease in the final price by consumers induces demand (private consumption), which ultimately raises GDP. For instance, we find a large decrease in prices of maize, manufactured goods, and beans, at 2%, 2.3%, and 1.3% respectively. Note that the decrease in the price of maize reflect the impact of the removed VAT, meaning the farmer faces lower prices of inputs and can reduce the price of the output. The reduced price of output prompts a much larger demand, hence increased production leading to higher incomes and welfare of farmers.
However, we need to compare these results with those arising from directly removing VAT on plastics as final products as opposed to inputs to agriculture.
Figure 4.27: Impact of Removal of VAT on Plastics used in Agriculture HST by Product
Changes in prices in other sectors are summarized in the figure below. We include changes witnessed in some of the key sectors/products. Overall, following the removal of VAT we find a very small change in welfare (with an increase of 0.04%). Farmers are able to sell more due to increased demand resulting from consumers’ responses to the decreased price of agricultural output (as a result of removal of Post-Harvest Costs). As the leading crop in terms of demand, maize is found to have the biggest impact, with demand estimated to increase by 3% compared with other agricultural products whose demand increases by 3.2%. Overall, rural households gain more in terms of welfare, especially among the farming households, while urban households gain in the form of reduced prices of agricultural products (since they are the main consumers of agricultural products produced by rural farmers).

45
An Economic Assessment Of Government Incentives
Figure 4.28: Consumption and Production effects of Removal of VAT on HSTs by Product
Indeed, the rural farming households experience a significant increase in incomes (6.4%), while non-farm rural households’ incomes increase rather slightly (2%), and urban households’ incomes remain unchanged. Factor demand remains unchanged in specialized labor, implying that there is no change in employment in urban labor and rural educated labor. Capital demand is also found to remain unchanged.
Table 4.15: Household welfare impact of Removal of VAT on Plastics used in Agriculture HST
Household category % change from base
Urban HH 0.004
Rural-farming 6.4
Rural non-farming 2
We note a depreciation of currency, although by a negligible amount (0.036%). However, it should be noted that currency depreciation is good for enhancing export competitiveness. As clearly witnessed in the model, exports of maize and other cereals increase, although by less than 1%. Imports are seen to increase as well, especially on manufactured goods (0.7%), and fertilizer and herbicides (1.2%). The increase in imports of fertilizer is expected due to increased production (farming), and modernization that follows increased farmers’ incomes.
4.3.3 Comparison of Impact of Alternative Policy Options to support HSTsIn this section we discuss findings from the simulation of a reduction in PHL resulting from the adoption of PHM technologies or other policy instruments. At this initial stage of simulation, we conduct a simulation on the reduction in PHL without accounting for the costs related to the adoption of PHLM Technologies). These costs include; manufacturing of such technologies (e.g. HSTs), subsidies by the government to producers of such technologies, or subsidies to farmers on the purchase of such commodities. Initial findings reveal that first, there is a slight reduction in the final prices of agricultural products. Unlike the first simulation, reduction in PHL results in a decrease in the price of most agricultural products (not just maize and cereals), most likely due to increased supply. Secondly, a reduction in PHLs leads to an increase in the demand for agricultural products, and other manufacturing products. And finally, the simulation results in large gains in household welfare, resulting from an increase in producer and consumer surplus.

46
An Economic Assessment Of Government Incentives
Overall increase in competitiveness in the agriculture sectorThe results show that, in the long run there are significant decreases in the price of key agricultural produce. For instance, maize and beans prices decrease by 2% and 1.3% respectively following the removal of taxation. We find similar decreases in prices from the second and third simulations, although by smaller amounts in some crops (such as maize). The price of agricultural products (farm output) decrease in two ways. First is the decrease in production costs (lower storage material prices). With removal of tax on storage materials (or subsidization of storage inputs), prices of such materials decrease, and hence, so do the final prices of commodities. Subsidization decreases the price of maize and beans by 1.78% and 1.12% respectively, while a productivity increase leads to a 0.36% and 0.1% decrease in price for the same products. The decrease in price reflects an increase in supply as farmers sell their produce in normal periods.
Secondly, farmers respond to changes in the storage technology sub-sector or increased productivity, which induce them to increase production. As a result, this increase in production without a larger increase in demand (see Table 4.16) leads to decreased prices. While decreases in output prices is not generally favorable to farmers, farmers may gain through increases in incomes or a decrease in the cost of food (own consumption).
Table 4.16: Impacts of agricultural policy on price and foreign trade
Product SIM 1: Tax removal
SIM 2: Subsidy introduction
SIM 3: Productivity
increase
Change in Price of selected products
Maize -2 -1.78 -0.36
Beans -1.3 -1.12 -0.1
Rice -0.04 0.1 -0.44
Other agricultural products
-0.1 0.04 -0.2
Other manufacturing
-2.3 -0.3 -4.7
Manufacturing of fertilizer and
herbicides
0 -2 -1.4
Cotton -0.003 -1.02 -0.7
Transportation services
0 0 0.004
Change in Exports
Maize 0.89 0.8 1.2
Beans 0.6 0.23 1.13
Rice 0.07 -0.08 0.5
Other agricultural products
0.2 0.08 2.4

47
An Economic Assessment Of Government Incentives
Other manufacturing
0.22 0.2 2.14
Manufacturing of fertilizer and
herbicides
0 0 0.009
Transportation services
0.03 0.04 0.8
Change in Imports
Maize -2 -0.03 -1.6
Beans -0.2 1.2 -2
Rice -1 0.4 1.2
Other agricultural products
-0.07 0.21 0.8
Other manufacturing
0.7 0.32 1
Manufacturing of fertilizer and
herbicides
1.2 2.2 2
Transportation services
0.4 0.05 1.2
The impacts appear to be favorable in the output of other sectors, especially for the manufacturing firms that depend on input from the agriculture sector. Owing to the decrease in input prices and increased production, the manufacturing sector experiences increased competitiveness from purchasing cheaper agriculture output. In turn, the prices of manufactured goods also decrease across the three simulations. The price of manufactured goods decreases by 2.3% in the first simulation, and 4.7% in the final simulation due to an increase in agricultural productivity.
Furthermore, the removal of tax enhances international competitiveness of the domestically produced goods (both agricultural and non-agricultural). The competitiveness stems from currency depreciation and improved terms of trade. From the first simulation, currency depreciated by 0.036%, resulting in increased exports of agricultural products (especially maize and other cereals), although by a small extent (less than 1%). Imports decreased in all agricultural products, while imports of non-agricultural products increased by 0.7% (manufacturing goods), and 1.2% for fertilizer and herbicides. The increase in imports of fertilizer and herbicides is a supply response to the increased farming activities, and low domestic production of the same.
Table 4.17: Aggregate external competitiveness impacts
SIM 1: Tax removal SIM 2: Subsidy introduction
SIM 3: Productivity increase
Terms of trade 0.12 0.3 0.20
Real aggregate exports 0.46 1.2 1.3
Real aggregate imports 1.62 2.45 1.8

48
An Economic Assessment Of Government Incentives
Increased income for farmers due to increased salesFollowing decreases in the prices of major agricultural products, farmers sell more of the same due to an increased demand. The demand for maize increases significantly, by 3%, while the demand for other agricultural products increased by 3.2% when taxes were removed, while the demand increase in other simulations was slightly lower. Note that production increases at a higher rate than consumption, hence causing a decrease in the prices of both agricultural and non-agricultural goods. However, from the increased demand, farmers sell more of their output, and hence, increased incomes. This increase in incomes may offset the decrease in producer prices, leading to an overall increase in producer surplus and welfare.
One of the unique features of the observed change in incomes is that, income increase is not equally distributed across households. Rural households gain more, and only if they are farmers (involved in farming activities). Their incomes increase by 6.4% when taxes are removed, and this rises to 8.2% when overall agricultural productivity increases. Rural non-farm incomes increase by 2%, 2.6% and 5% in the first, second and third simulations respectively. Urban incomes are found to remain unchanged in the first simulation, while increase by small shares in other simulations. This reveals that the benefits to farming communities are larger compared to other activities when there are policy changes that reduce post-harvest losses or increase agricultural productivity. Urban households gain through reduced prices of goods and services (expenditure saving) and increased wages (from increased demand of urban labor in the second and third simulations).
In the first simulation, factor demand remains unchanged for specialized labor (educated labor) and urban labor (since they are more educated and less involved in agricultural activities). Second and third simulations reveal an increase in demand for all types of labor, although farming labor experiences a larger increase in demand. Capital demand is also found to remain unchanged in the first simulation, while increasing slightly in the other two simulations, and especially when agricultural productivity increases as a whole (1.2%). Note that, the model closure allows for changes in the labor market to reflect the situation in developing countries, where the economy is characterized by unemployment.
Table 4.18: Changes in demand and supply in the economy
Products SIM 1: Tax removal
SIM 2: Subsidy introduction
SIM 3: Productivity
increase
Consumption Maize 3 2.6 2
Beans 1.7 0.82 1
Rice 1.68 1 1.2
Other agricultural products
3.2 7.3 4
Other manufacturing 1.4 0.5 2.3
Fertilizer and herbicides
0.8 1 0.65
Transportation services
1.2 0.7 0.11
Production Maize 4 2.1 3.98
Beans 2.7 3 1.4
Rice 0 1.6 2.3
Other agricultural products
1.3 7.5 6.99

49
An Economic Assessment Of Government Incentives
Other manufacturing 0.2 0.09 2.6
Manufacturing of fertilizer and herbicides
0.4 0 0.1
Table 4.19: Change in household income
SIM 1: Tax removal
SIM 2: Subsidy introduction
SIM 3: Productivity
increase
Income Urban HH 0 0.67 1.3
Rural-farming 6.4 6.1 8.2
Rural non-farming 2 2.6 5
Capital 0 0.07 0.4
Table 4.20: Change in demand for factors
SIM 1: Tax removal
SIM 2: Subsidy introduction
SIM 3: Productivity increase
Factor demand Rural farming labor
4.3 1.78 2.1
Rural educated labor
0 0.88 1.1
Urban labor 0 0.4 0.2
Capital 0 0.65 1.2
Land use 0.9 1.2 0.47
Enhanced Macro economic performanceIn most macroeconomic indicators, we find long term gains as a result of tax removal and productivity increases but negative in the case of the introduction of subsidies to the agriculture sector. For instance, despite changes in sector specific consumption and production, we find an overall increase in private and public consumption in the first and third simulations, although it decreases (by 0.06% and 0.04%) in the case of subsidies on agricultural products. Aggregate investment in the economy also increases in cases of removal of taxes and increase in productivity, while subsidization is found to reduce investment. Changes in private and public consumption, as well as investment have a significant bearing on the overall GDP in the economy. GDP increases by 0.02% and 0.04% in the first and third simulations respectively. However, both tax removal and introduction of subsidies lowers government tax revenues for obvious reasons, and the productivity increase leads to a higher government tax revenue albeit by an insignificant extent. Clearly, changes in prices, consumption, and demand impart significant influence on private sector development (in the form of increased capital accumulation), which has a bearing on national output.

50
An Economic Assessment Of Government Incentives
Table 4.21: Macroeconomic changes
SIM 1: Tax removal
SIM 2: Subsidy introduction
SIM 3: Productivity increase
1. Real GDP 0.02 -0.05 0.04
2. Real private consumption 0.3 -0.06 0.9
3. Real aggregate investment 0.04 -0.06 1.43
4. Real public consumption 0.21 -0.04 2
5. Government revenue -0.002 -0.000.009
Increased welfareWe find an overall increase in households’ welfare in the economy in all simulations, albeit by small margins. Welfare increases due to increased labor demand (hence incomes), and decreased prices in goods and services. From productivity gains, non-farming households are encouraged to venture into farming activities that use agricultural products as intermediate input. Further, non-farming households engage in farming, rather than relying on being absorbed as labor (employed) by farming households. This ultimately increases their incomes on a larger scale than they would have gained from being employed by farming households.
Table 4.22: Welfare impact
SIM 1: Tax (VAT) removal
SIM 2: Subsidy introduction
SIM 3: Productivity increase
Welfare 0.67 0.6 0.04
4.3.4 Assumptions Governing Interpretation of the Findings
Although the above results are generally favorable to policy decisions in favor of policy changes in promoting HSTs, the findings should be interpreted with caution due to assumptions governing the simulated impact and the basic assumptions regarding CGE. The analysis first assumes that there is a perfect price pass-through mechanism in that, upon subsidization or removal of taxes, farmers will respectively receive the storage inputs at the reduced price. This implies that there is efficient distribution of farm inputs including the storage bags, and that there are no incidents of corruption or abuse of the subsidy. Secondly, it is assumed that farmers (who are the main target beneficiaries) are aware of the importance of improved post-harvest losses, such that they are able to widely increase adoption of the storage materials (i.e. hermetic bags) in response to a decrease in price (following tax removal). Third, suppliers of storage materials are assumed to be flexible enough to respond to changes in the demand for such products. And finally, the farmers are assumed to be using the storage products (hermetic bags) for the purposes they were intended for by the policy incentive (i.e. they do not divert them to other uses). These assumptions imply that while the proposed policy changes/incentives are legitimate, its effectiveness may be limited due to the underlying factors. The CGE results assume the economy is in general equilibrium and that markets exists and are functioning effectively. Both assumptions are less realistic in a developing, low-income context such as Tanzania. Nonetheless, the usefulness of the CGE framework outweighs its limitations, given its ability to track the economy-wide ramifications of policy change that are otherwise complex to empirically achieve through partial equilibrium or other analytical models.

51
An Economic Assessment Of Government Incentives
5.0 CONCLUSION AND POLICY RECOMMENDATIONS
5.1 Summary of Main Findings
Post-harvest losses in cereals and other staple food crops has been identified as both a big challenge and threat to food security in Africa. Total food losses in sub-Saharan Africa are estimated to be worth $4 billion per year, an amount which can feed 48 million people (FAO, 2013). Furthermore, FAO estimates that about 1.3 billion tons of food globally are wasted or lost per year, which is responsible for economic costs estimated at US $750 billion (Gustavasson, et al. 2011). Indeed, post-harvest loses has become one of the priority issues for development agencies as well as an increasingly topical issue for innovation and policy research. In response, various storage technologies have been developed to reduce post-harvest loss; and one of the increasingly popular are hermetic storage technologies (HSTs) which include hermetic bags, cocoons, and silos or metal canisters.
However, a review of policy documents and literature indicate that both the utilization and local manufacturing of HSTs is very low in Tanzania, implying that the uptake for the technology is far less than desired. Indeed, all stakeholders attribute the low uptake to the high cost of the technology. Apparently, other reasons such as low level of awareness and business environment challenges limit the extent of manufacture and uptake. Thus, most stakeholders have advocated for the removal of VAT on the manufacture of HSTs as one of the effective means of promoting wide-scale local manufacturing and utilization of HST. But is this fiscally feasible? What will be the benefit to the economy and costs to the Government? What other alternative policy options for providing incentive can be considered?
It is on this basis that the Alliance for a Green Revolution in Africa (AGRA) commissioned a study to support the Government of Tanzania’s policy initiatives to alleviate post-harvest losses by examining possible fiscal incentives needed to promote wide scale utilization and local manufacture of HSTs. This objective was achieved by collecting data and information through field surveys from various stakeholders of HSTs (farmers, distributors, and manufacturers, NGOs, Extension Officers and Government MDAs) for conducting a Regulatory Impact Assessment (RIA) of the proposed removal of 18% VAT charged in the production of hermetic technologies. Furthermore, using a CGE analysis, the study examined the economy-wide impacts of three alternatively policy instruments for promoting wide scale manufacture and utilization of HSTs. The study revealed several interesting findings.
First, the demand for HST is increasing as awareness increases amongst farmers. In particular, hermetic bags are mainly used compared to other Hematic Storage Technologies (HST) because of availability, suitability and affordability. The increasing demand raises the challenge of production response. Policies for promoting increased manufacture of hermetic bags are therefore fundamental if the high price is to be contained. Compared to metal silos and cocoons, only HST bags have a real potential for wide-scale manufacturing due to their usefulness to small scale farmers. However, farmers are constrained by the relatively higher price of hermetic bags in comparison to their desire to use them, creating a demand gap. Manufacturers are also producing at excess capacity with room to produce even more bags. Farmers are willing to buy more of the hermetic bags if the price of is lowered. Indeed, manufacturers and distributors are willing to fully pass through the tax removal by lowering the price by the same proportion of the tax.
Second, the benefits from implementing the policy change dramatically exceed the costs. The removal of VAT on HST will have a significant impact on the economy and on the income of farmers. Considering a wide range of possible benefits and costs of the hermetic bags, the gains accrued by farmers from using hermetic bags outweigh the costs of the bags and the extra costs associated with the adoption of the bags which amount to the net benefit of US$ 28.05 million (equivalent to Tshs 65.9 Billion) per season before the tax removal. With tax removal, the demand for hermetic bags will increase by 1.5 times thus increasing the benefits, net of costs of the bags and the extra costs associated with the adoption of the bags, to US$ 42.1. The revenue loss from removing VAT on HST is US$ 3.15, which is dramatically small compared to the benefits accrued from using HST (which amounts to US$ 42.1). This means that the total net benefit to the society for implementing the VAT removal is US$ 38.9 million per season. Therefore, compared to the situation with VAT, removal will increase the total net benefit to the

52
An Economic Assessment Of Government Incentives
society by US$ 10.9 million per season, equivalent to Tshs 25.6 Billion per season.
Third, the economy-wide impact of removing 18% VAT on the manufacture of HST bags are generally positive albeit small in size. The removal of 18% VAT on agricultural storage bags has a positive albeit small increase in GDP (0.02%) due to a decrease in the prices of HSTs bought by farmers, and ultimately a decrease in the final price faced by consumers. The reduced price of output prompts a much larger demand, hence increased production leading to a higher income and welfare of farmers. Overall a change in welfare following the removal of VAT is very minimal. Farmers are able to sell more due to an increased demand (hence more income) resulting from consumers’ responses to a decreased price of agricultural output (as a result of the removal of post-harvest costs).
Fourth, the impacts of removing 18% VAT appear to be favorable in the output of other sectors especially the manufacturing firms that depend on input from the agriculture sector. Owing to the decrease in input prices and increased production, the manufacturing sector experiences increased competitiveness from purchasing cheaper agriculture output. In turn, the cost of manufacturing goods also decreases across the three simulations. The price of manufactured goods decreased by 2.3% in the first simulation, and 4.7% in the final simulation due to an increase in agricultural productivity. The competitiveness stems from a depreciation of currency and improved terms of trade, which leads to an increase (albeit small) in exports and a decrease in imports.
Fifth, rural households gain more, by 6.4%, only if they are farmers when taxes are removed, and this rises to 8.2% when overall agricultural productivity increases. Rural non-farm incomes increase by 2%, 2.6% and 5% in the first, second and third simulations respectively. This reveals that the benefits to farming communities are larger compared to other activities, when there are policy changes that reduce post-harvest losses or increase agricultural productivity. Urban households gain through reduced prices of goods and services (expenditure savings).
Sixth and finally, for most macroeconomic indicators, we find the removal of tax appears to be a more favorable policy option compared to subsidies. Aggregate investment in the economy increases in the case of removal of taxes and increase in productivity, while subsidization is found to reduce investment. GDP increases by 0.02% and 0.04% in the first and third simulations respectively. However, both tax removal and introduction of subsidies lowers government tax revenues, and productivity increase leads to higher (albeit small) government tax revenue.
The above findings strongly support the proposed removal of 18% VAT on production of HSTs to promote their wide-scale uptake and manufacture in Tanzania. Indeed, the benefits of implementing the policy change (removal of VAT) has dramatic positive impacts on the economy and significantly increases farmers’ income. However, it is important to note that, VAT removal is not the only factor that will trigger increased demand of hermetic bags. Other important factors include awareness raising and business environment issues (including access to reliable power).
5.2 Policy Recommendations
The following preliminary policy recommendations can be discussed and agreed upon with the relevant stakeholders. We recommend that the Government:
1) Remove VAT on all HST products to ensure wide-scale use and promote further investment in the HST manufacturing sector. Treat HST products like any other agro- inputs such as fertilizer or seeds to garner policy support.
2) Establish a fully-fledged HST unit in the Department of Post-Harvest Loss Management of the Ministry of Agriculture to oversee the development, regulation and promotion of HSTs
3) Deliberately support capacity-building programs to Extension/Agricultural officers specifically on the development, regulation and utilization of HSTs. The program should be equipped with demonstrations of successful cases of utilization of HSTs for public awareness campaigns.
4) Improve the regulatory and institutional framework governing the HSTs sector. This includes, among other objectives, measures to establish industry quality standards and rationalize the quality

53
An Economic Assessment Of Government Incentives
benchmarks by working with TBS. Furthermore, there is a need to enhance better identification of the innovations in HSTs by working with BRELA and other relevant Agencies to clarify regulatory environment and support its effective enforcement.
5) Learning from successful cases such as YARA’s crop nutrition products, reform to fix the distribution system for HST by reviewing the need to license agro-dealers and promoting small-scale agriculture dealers at the ward level through the work of primary cooperatives or AMCOs.
5.3 Areas for Further Research
The following are the proposed areas for further research, namely:
• A further understanding of the market structure and competitiveness of the HST sector given the prevailing duopolistic competition.
• Determinants of the optimal pricing of the HSTs include identification of cost drivers such as transport/distribution costs.
• Mapping all alternative uses of HSTs beyond storage.• Disaggregating data on the manufacture of HSTs (hermetic bags), i.e. stripping out HST from the
rest of the manufacturing activity within a firm. • Understanding the environmental implications of increased manufacturing of HST.
5.4 Next Steps
Following completion of the study, we propose a couple of next steps as follows. The first is to organize a stakeholder validation meeting to allow the various stakeholders to review the findings and the recommendations. Such workshops will also serve as one of the mechanisms to enhance stakeholder ownership of the identified recommendations. Second is to carry out in-depth consultations with key policy actors, especially the Ministries of Agriculture, Finance and Planning, Industry and Trade as well as specific agencies, in particular, the TRA. The third step is to organize a presentation for the Ministry of Finance’s Task Force on tax proposals for the Government to discuss and consider the possibility of implementing the proposed removal of VAT on manufacturing HSTs. The fourth step would be to organize a dissemination event, where the report could be presented and the findings shared with a wide range of stakeholders. The fifth and final stage is for AGRA to develop a policy brief out of the report, highlighting the key messages from the study findings and recommendations. The policy brief will be widely distributed for public consumption, including publication on the AGRA website and other online platforms.

54
An Economic Assessment Of Government Incentives
REFERENCES
Blaug, M., 1992. Léon Walras (1834–1910). Books.
Charney, A.H. and Vest, M.J., 2003, October. Modeling Practices and Their Ability to Assess Tax/Expenditure Economic Impacts. In Prepared for the AUBER Conference, New Orleans.
Chegere, M.J. (2018), Post-Harvest Losses, Intimate Partner Violence and Food Security in Tanzania. PhD Thesis, Economic Studies, (230) University of Gothenburg, Sweden.
Chegere, M.J., Eggert, H. and Söderbom, M., (2017). How Economically Effective are Hermetic Bags in Maize Storage? A RCT with Small-Scale Farmers.
Chirwa, E. and Dorward, A., 2013. Agricultural input subsidies: The recent Malawi experience. OUP Oxford.
Chisvo, Munhamo and Ellen Jaka. 2017. Cost Benefit Analysis of Post-Harvest Management Innovations: Benin case study report, 2017.
Condon, T., Dahl, H. and Devarajan, S., 1987. Implementing a Computable General Equilibrium Model. World Bank DRC Papers, (290).
Dervis, K., 2002. de Melo and S. Robinson (1982),“General Equilibrium Models for Development Policy”. Report N, 10173.
Devarajan, S. and Robinson, S., 2005. 15 The Influence of Computable General Equilibrium Models on Policy. This page intentionally left blank, p.402.
Francois, J.F. and Shiells, C.R. eds., 2008. Modeling trade policy: applied general equilibrium assessments of North American free trade. Cambridge University Press.
Fullerton, D., King, A.T., Shoven, J.B. and Whalley, J., 1981. Corporate tax integration in the United States: A general equilibrium approach. The American Economic Review, 71(4), pp.677-691.
Harrison, G.W., Rutherford, T.F. and Tarr, D.G., 1997. Quantifying the Uruguay round. The Economic Journal, 107(444), pp.1405-1430.
Kehoe, T.J. and Serra-Puche, J., 1983. A computational general equilibrium model with endogenous unemployment: An analysis of the 1980 fiscal reform in Mexico. Journal of Public Economics, 22(1), pp.1-26.
Lofgren, H., Harris, R.L. and Robinson, S., 2002. A standard computable general equilibrium (CGE) model in GAMS (Vol. 5). Intl Food Policy Res Inst.
Marušić A. and Radulović B., 2011, Regulatory Impact Analysis (RIA) Manual, USAID – Good Governance Activity in Montenegro, Podgorica, Montenegro.
Masters, W.A and G. Alvarez (2018), “Willingness to Pay for Hermetic Grain Storage Bags in Malawi”, A paper presented at the 30th International Conference of Agricultural Economists; July 28 – August 2, 2018, Vancouver.
Masters, W.A and G. Alvarez (2018), “Willingness to Pay for Hermetic Grain Storage Bags in Malawi”, A paper presented at the 30th International Conference of Agricultural Economists; July 28 – August 2, 2018, Vancouver.
Moussa, B. (2006). Evaluating Impact Assessment of Cowpea Storage Technology. Master of Science

55
An Economic Assessment Of Government Incentives
thesis, Department of Agricultural Economics, Purdue University, West Lafayette, IN, USA, 2006.
Mwaijande, Francis. 2017. Farmers’ adoption and willingness to pay for post-harvest technologies in Tanzania: policy implication for enhancing food security. Journal of Postharvest Technology.
OECD, 2008, Introductory Handbook for Undertaking Regulatory Impact Analysis (RIA), OECD Paris
Ognakossan, K.E., K.E. Adabe, K. Hell, Y. Lamboni, and O. Coulibaly (2010). Use of PICS bags for the control of P. truncatus and Dinoderus spp. on stored cassava chips: First results. Poster presented during the 5th World Cowpea Conference, 27 September to 1 October 2010, Saly, Senegal.
Pyatt, G. and Round, J.I., 1985. Social accounting matrices: A basis for planning. The World Bank.
Pyatt, G., 1988. A SAM approach to modeling. Journal of Policy Modeling, 10(3), pp.327-352.
Randriamamonjy, J. and Thurlow, J., 2017. 2015 Social Accounting Matrix for Tanzania: A Nexus Project SAM. Intl Food Policy Res Inst.
Robinson, S., Kilkenny, M. and Hanson, K., 1990. The USDA/ERS computable general equilibrium (CGE) model of the United States (No. 1486-2018-6356).
Rosentrater, K.A. and Suleiman, R.A., 2015. Current Maize Production, Postharvest Losses and the Risk of Mycotoxins Contamination in Tanzania.
Walker, S., R. Jaime, and V. Kagot (2018) “Comparative effects of hermetic and traditional storage devices on maize grain: Mycotoxin development, insect infestation and grain quality”, Journal of Stored Products Research No. 77 (2018), Elsevier. http://www.acdivoca.org/wp-content/uploads/2018/03/Comparative-Effects-Hermit-Traditional-Storage-Devices-Journal-of-Storage-Products.pdf
Walker, S., R. Jaime, and V. Kagot (2018) “Comparative effects of hermetic and traditional storage devices on maize grain: Mycotoxin development, insect infestation and grain quality”, Journal of Stored Products Research No. 77 (2018), Elsevier. http://www.acdivoca.org/wp-content/uploads/2018/03/Comparative-Effects-Hermit-Traditional-Storage-Devices-Journal-of-Storage-Products.pdf

56
An Economic Assessment Of Government Incentives
APPENDICES
Appendix A: Terms of References for the Study
Consultancy task: To assess the potential benefits to the economy of government incentives on the adoption and manufacture of hermetic storage technologies (PICS bags, metal silos, cocoons)
BackgroundFood waste and loss is a major global problem, but it is particularly acute in developing countries. Based on the Rockefeller Foundation’s estimate, post-harvest losses (PHLs) in developing countries reduce incomes by at least 15% for the 470 million smallholder farmers and downstream value actors. In addition to income losses to farmers, PHL exacerbates the problem of food security and food safety. The global human population is estimated to reach the 9 billion mark by the year 2050, representing an increase of two billion people. If post-harvest losses remain at the current level, food production in developing countries will need to increase by an estimated 70%, requiring an investment of US$ 83 billion per year (Rockefeller, 2015). In Africa, the problem of post-harvest losses is acute and has drawn the attention of the African Union. For example, the Malabo Declaration on Accelerated Agricultural Growth and Transformation for Shared Prosperity and Improved Livelihood has set a target to reduce by at least 50% the present levels of post-harvest losses by the year 2025.
Tanzania, like other developing countries, is also affected by the problem of post-harvest losses. The problem affects food security, household incomes, and food safety. For example, some studies conducted in Tanzania found that 12% of all samples of maize tested had aflatoxin levels that exceeded the safety limit of 10 ppb. The government’s second phase of the Agricultural Sector Development Plan (ASDP II) has captured post-harvest losses as a priority problem that requires urgent attention. The ASDP II plan asserts that post-harvest losses in Tanzania is a huge problem, and estimates the losses to reach 25% to 35% depending on crop type. The ASDP II document attributes large post-harvest losses to poor support systems, limited use of storage technologies and limited handling capacity. Accordingly, some of the suggestions for cutting post-harvest losses suggested in the ASDP II document include training farmers in post-harvest handling, especially about aflatoxin and, the promotion and dissemination of technologies that promote better handling and better preservation of food. Similarly, Rockefeller (2015) also proposes promoting on-farm storage technologies as one of the strategies to reduce post-harvest losses.
Hermetic storage technologies (e.g., PICS bags, metal silos, and cocoons) are available, but so far utilization is still very low. Promoting the manufacture and use of hermetic storage technologies is important for Tanzania, both as a strategy for managing post-harvest losses and also, for supporting key government policies. Other additional benefits of the enhanced utilization of hermetic storage technologies are: (i) to promote opportunities for industrialization to manufacture these products. Build utilization to promote manufacture locally; (ii) Safe storage enables factories to have raw materials stored longer to support industrialization.
Objectives of the AssignmentThe consultant is expected to conduct a thorough economic analysis of the benefits and costs that would result from the increased use of hermetic storage technologies and recommend government incentives needed to promote wide-scale adoption and manufacture of these technologies. The information needs to be objective and verifiable, and it will be disseminated to government policy decision makers to justify the worth and merit of providing financial incentives to promote the wide-scale use, manufacture, and distribution of hermetic storage technologies.
Outputs/Outcomei) Inception report (including proposed methodology, data sources, and initial findings).ii) Presentation of preliminary findings to stakeholders for validation.iii) Final report (including methodology, data sources, and findings).

57
An Economic Assessment Of Government Incentives
Competencies required - FIRM:
AGRA wishes to contract a firm with the following skills and qualifications:i) Proven track record of conducting high-quality economic analysis research;ii) Experience in conducting studies on the impact of fiscal incentives on the adoption of
technologies is an added advantage;iii) Good understanding of policy and regulatory opportunities and challenges in Tanzania’s
agricultural sector.
Key Experts: Team Leader (Please specify)i) Experience in engaging with and presenting policy research to senior government decision
makers.ii) A clear understanding of the policy process: initiation, estimation, selection, implementation,
evaluation, and termination, will be an added advantage.iii) Good understanding of policy and regulatory opportunities and challenges in Tanzania’s
agricultural sector.iv) Higher degree (MA, MSc, Ph.D.) in agricultural economics, economics, public policy &
administration is required.
Expert 2 (Please clarify and add description below)i) Data analysis skills, especially in the area of ex-ante impact assessment of public policy reforms.ii) Strong report writing skills (sample reports prepared by candidate will be required).iii) Experience in designing research methodology and developing data collection instruments.iv) Higher degree in agricultural economics, economics, or public policy & administration is
required.v) The consultant may propose additional staff if deemed necessary for the successful conclusion
of the assignment.
Proposal SubmissionTaking into account the TOR, the consultancy candidate should submit a proposal containing the following elements: -
i) Understanding of the assignment. ii) Outlining experience of the firm/consultant (Please provide a minimum of two concrete
samples of similar work done for other organizations). iii) The methodology proposed for the assignment (including tools proposed for the assignment). iv) The work plan that includes clear timelines for the assignment.v) Summary resume(s) of key staff who will work on the AGRA account.vi) Consultancy fee for undertaking the assignment and budget breakdown.
Evaluation CriteriaUnderstanding of the issue (how well the candidate understands the gap the study intends to fill):
iv) Appropriateness of the proposed methodology. v) Qualifications of the lead investigator(s) (should possess qualifications in one of the following
fields: agricultural economics or economics, finance, public policy & administration or closely related field).
vi) Report writing skills (at least two sample reports from previous studies will be required). vii) Relevant experience (e.g., ex-ante impact assessment of policy reform options, economic
modeling).viii) Current registration of the firm/organization in Tanzania.ix) Understanding of Tanzania’s agricultural policy landscape (e.g., affiliation to a local policy
network, established linkages to private and public activities related to agriculture or agricultural policies in Tanzania).
SubmissionAll interested consultants or consultancy companies are asked to submit their technical and financial proposals as separate documents by close of business on 16th April 2018 at 1700 Hours East Africa

58
An Economic Assessment Of Government Incentives
Time (GMT +3) to the following email address: [email protected]
DisclaimerAGRA reserves the right to determine the structure of the process, number of short-listed participants, the right to withdraw from the proposal process, the right to change this timetable at any time without notice and reserves the right to withdraw this tender at any time, without prior notice and without liability to compensate and/or reimburse any party.

59
An Economic Assessment Of Government Incentives
Appendix B: Questionnaires and Guiding Questions
For illustrative purposes and to conserve space, we only provide the questionnaire for Farmers. However, the other six sets of (distributors, manufacturers, extension officers, NGOs, Ministry of Agriculture and TRA) questionnaires can be made available upon request.
AN ECONOMIC ASSESMENT OF INCENTIVES NEEDED TO PROMOTE WIDE-SCALE UTILIZATION AND LOCAL MANUFACTURE OF HERMETIC STORAGE TECHNOLOIES
QUESTIONNAIRE FOR FARMERS
Introduction
[Enumerator: Start with greetings]
My name is ___________________ and I am representing Talanta International, a company undertaking the study on improving post-harvest technologies.
Thank you for taking part in this survey.
Your household has been selected by chance from all households in this area as part of the sample for this interview. The purpose of this interview is to obtain current information about households in this area; and about crops storage techniques. Your participation is voluntary and the information that you give will be confidential. The information will be used for research purpose only and will not include any specific names. There will be no way to identify that you gave this information. Could you please spare some time (around 45 minutes) for the interview? Consent given:
SECTION 1: IDENTIFICATION PARTICULARS
Household Identification Number: __________________________Date of interview, dd/mm/yy: ______/______/_________Region/District: ______________________________________Village GPS coordinates: a) Latitude______________; b) Longitude_____________Household GPS coordinates: a) Latitude______________; b) Longitude_____________Enumerator’s signature: _____________________________________________Respondent’s name: _____________________________________Respondent’s mobile phone number(s): ________________________________Age: ……………………. (years)Sex: 0. Female ………. 1. Male …………Education: 1. No education…………. 2. Incomplete Primary……………Completed Primary……… 4. Secondary…… 5. Above Secondary……….
SECTION 2: Storage methods and marketing
2.1 Which crops do you mainly grow? (rank the first two)
1. Maize 2.Beans 3. Cowpeas4. Paddy/rice 3. Sorghum 4. Cassava 6. Groundnuts7. Others, specify
A.B.

60
An Economic Assessment Of Government Incentives
2.2 How much did you harvest the last season for the above two most important crops?
Amount in Kgs A: _____B: _____
2.3 What is the value of this harvest per kg for the two most important crops?
Price in Tshs/Kg A: _____B: _____
2.4 Did you store any of your harvest in the previous season?
0. NO ………… go to 2.301. YES
2.5 Which crop harvest did you store?(mention two)
1. Maize2.Beans3. Cowpeas4. Paddy/rice3. Sorghum4. Cassava6. Groundnuts7. Others, specify
2.6 What was your main method of storage?
Hermetic technologiesLocally made traditional structureSacks/open drumUnprotected pileCeiling Other, specify
2.7 Given the main method of storage, what makes you prefer the selected method?(rank the first three)
It’s cheapIt is easily availableIt maintains the quality of grain for long timeIt maintains the weight of the productNot easily attacked by rodents such as ratsNot easily attacked by storage insectsNot easily affected by moistureOthers, specify
A.B.C.
2.8 Do you know of any alternative storage techniques?
0. NO ……… go to 2.111. YES
2.9 If YES, please mention the alternative storage techniques
Hermetic technologiesLocally made traditional structureSacks / open drumUnprotected pileCeiling Other, specify
A.B.C.D.

61
An Economic Assessment Of Government Incentives
2.10 Why are you not using alternative technology (mention the specific one) as the main method?
It’s ExpensiveIt is not easily availableIt affects the quality of grain It cannot maintain the quality of weight for long timeEasily attacked by rodents such as ratsIt is easily attacked by storage insectsIt is easily affected by moistureOthers, specify
A.B.C.
Consider the FIRST main crop only
2.11 How many kilograms of the crop did you store?
2.12 What is the value of this stored product per kg?
Price in Tshs/Kg
2.13 Generally, how long do you store your crops?
2.14 Did you use any of the hermetic storage technologies (PICS bags, metal silos, cocoons)? SHOW THE PICTURES
0. NO (go to 2.27)1. YES
2.15 Which hermetic storage technologies did you mainly use?
PICS bagsMetal silosCocoonsPlastic barrels (silos)
2.16 What was the price of the hermetic storage technology you used?
2.17 How many units of the hermetic storage technology did you use?
2.18 Were these units sufficient for your storage needs?
0. NO 1. YES (go to 2.20)
2.19 If no, why didn’t you buy more?
The remaining produce if for immediate consumptionThe remaining produce if for immediate saleI cannot afford to buy moreOthers (specify)
2.20 How long do you expect these hermetic storage technologies to last since you purchased and started using them?
_________Years_________Months
2.21 When did you buy the hermetic storage technologies you used?
1. Before harvest2. During harvest3. After harvest

62
An Economic Assessment Of Government Incentives
2.22 How did you pay for the hermetic storage technologies?
1. Paid cash in full (one installment)2. Paid cash in installments3. With credit4. Borrowed money to pay
2.23 How many kilograms of your crops did you store using hermetic storage technologies?
2.24 Are there any extra costs associated with the use of hermetic storage technologies?
0. NO …………. go to 2.271. YES
2.25 If yes in 2.14, what are they?
____________________________________________________________________________________________________________________________
2.26 How much extra did it cost you compared to if you used the next alternative method for the amount you stored this time?
2.27 Did you get losses for the stored crop (due to e.g. storage pests etc.)?
0. NO …………. go to 2.291. YES
2.28 What is the value of this loss?
Tshs
2.29 What do you think would be the loss if you used the next best alternative?
Tshs
2.30 What is the average price you would sell your crop during harvest season?
2.31 What is the average price you would sell you products during lean season?
2.32 What is the average price you would sell during the normal period?
2.33 Did you sell any of your crops in the last season?
0. NO …… End of interview1. YES
2.34 What proportion of your harvest did you sell during harvest season?

63
An Economic Assessment Of Government Incentives

64
An Economic Assessment Of Government Incentives

65
An Economic Assessment Of Government Incentives
www.agra.org
Contact Details: West End Towers, 4th Floor | Kanjata Road | P.O. Box 66773-00800, Nairobi, Kenya Tel: +254 703 033000 | Fax: +254 20 3675 401