an economic report to the governor of the state of ...cber.haslam.utk.edu/erg/erg2016.pdf · ut...
TRANSCRIPT

AN ECONOMIC REPORT TO THE GOVERNOR
OF THE STATE OF TENNESSEE
THE STATE’S ECONOMIC OUTLOOKJANUARY2016

Matthew N. Murray, Associate Director and Project DirectorCenter for Business and Economic Research
PREPARED BY THE
Center for Business and Economic ResearchHaslam College of BusinessThe University of Tennessee
Knoxville, Tennessee
IN COOPERATION WITH THE
Appalachian Regional Commission Tennessee Department of Finance and Administration
Tennessee Department of Economic and Community DevelopmentTennessee Department of Revenue
andTennessee Department of Labor and Workforce Development
AN ECONOMIC REPORT TO THE GOVERNOR
OF THE STATE OF TENNESSEE
THE STATE’S ECONOMIC OUTLOOKJANUARY2016

2016 TENNESSEE ECONOMIC REPORT | iiiii | 2016 TENNESSEE ECONOMIC REPORT
CONTRIBUTORS
AUTHORS
UT Center for Business and Economic ResearchMatthew N. Murray, Associate Director and Project DirectorWilliam F. Fox, DirectorCeleste K. Carruthers, Assistant Professor of EconomicsLawrence M. Kessler, Research Assistant ProfessorVickie C. Cunningham, Research AssociateMary Elizabeth Glenn, Graduate Research Assistant
The Agri-Industry Modeling and Analysis Group Kimberly Jensen, Professor of Agricultural EconomicsJamey Menard, Research LeaderBurton English, Professor of Agricultural Economics
Department of Agricultural and Resource Economics, The University of Tennessee Institute of AgricultureAndrew Griffith, Assistant Professor of Agricultural EconomicsAaron Smith, Assistant Professor of Agricultural EconomicsEdward Yu, Associate Professor of Agricultural Economics
PROJECT SUPPORT STAFF
UT Center for Business and Economic ResearchBetty A. Drinnen, Administrative SpecialistCarrie B. McCamey, Communications Coordinator
The preparation of this report was financed in part by the following agencies: the Tennessee Department of Finance and Administration, the Tennessee Department of Economic and Community Development, the Tennessee Department of Revenue, the Tennessee Department of Labor and Workforce Development, and the Appalachian Regional Commission.
This material is the result of tax-supported research and as such is not copyrightable. It may be freely reprinted with the customary crediting of the source.
UT Publication Authorization Number R01-1493-295-002-16.
An Economic Report to the Governor of the State of Tennessee

2016 TENNESSEE ECONOMIC REPORT | iiiii | 2016 TENNESSEE ECONOMIC REPORT
Matthew N. MurrayAssociate Director and Project DirectorCenter for Business and Economic Research
PREFACE
This 2016 volume of An Economic Report to the Governor of the State of Tennessee is the fortieth in a series of annual reports compiled in response to requests by state government officials for assistance in achieving greater interdepartmental consistency in planning and budgeting efforts sensitive to the overall economic environment. Both short-term, or business cycle-sensitive forecasts, and longer-term, or trend forecasts, are provided in this report.
The quarterly state forecast through the first quarter of 2018 and annual forecast through 2025 represent the collective judgment of the staff of the University of Tennessee’s Center for Business and Economic Research in conjunction with the Quarterly and Annual Tennessee Econometric Models. The national forecasts were prepared by IHS Global Insight, Inc. Tennessee forecasts, current as of January 2016, are based on an array of assumptions, particularly at the national level, which are described in Chapter One. Chapter Two details evaluations for major sectors of the Tennessee economy, with an agriculture section provided by The Agri-Industry Modeling and Analysis Group at the University of Tennessee Institute of Agriculture. Chapter Three discusses Tennessee’s role in the international economy and presents the long-run outlook and forecast for the state. Chapter Four presents the background, early results, and challenges of Tennessee’s Drive to 55 program.
The primary purpose of this annual volume—published, distributed, and financed through the Tennessee Department of Finance and Administration, Tennessee Department of Economic and Community Development, the Tennessee Department of Revenue, the Tennessee Department of Labor and Workforce Development, and the Appalachian Regional Commission—is to provide wide public dissemination of the most-current possible economic analysis to planners and decision-makers in the public and private sectors.

2016 TENNESSEE ECONOMIC REPORT | viv | 2016 TENNESSEE ECONOMIC REPORT
CONTENTS
EXECUTIVE SUMMARY ...................................................................................................................................... viii
CHAPTER 1: THE U.S. ECONOMY ....................................................................................................................... 1
1.1 Introduction .......................................................................................................................................................1
1.2. The U.S. Economy: Year in Review ...................................................................................................................2
Components of GDP ......................................................................................................................................2
1.3. The U.S. Forecast ...........................................................................................................................................10
1.4. Alternative Scenarios .....................................................................................................................................17
1.5. Forecast Summary and Conclusions .............................................................................................................17
1.6. References .....................................................................................................................................................18
CHAPTER 2: THE TENNESSEE ECONOMY: SHORT-TERM OUTLOOK ......................................................... 19
2.1. Introduction ....................................................................................................................................................19
2.2. The Current Economic Environment ..............................................................................................................20
The Labor Market .........................................................................................................................................20
Income and Taxable Sales ............................................................................................................................23
2.3. Fiscal Update .................................................................................................................................................26
Federal Government .....................................................................................................................................26
State Finances Across the Nation ................................................................................................................26
The Southeastern States and Tennessee ....................................................................................................27
2.4. Short-Term Outlook ........................................................................................................................................28
2.4. Tennessee Forecast at a Glance ....................................................................................................................33
2.5. Tennessee’s Agricultural and Forest Industries and Rural Economy .............................................................33
Introduction ...................................................................................................................................................33
a. Agriculture and Primary Forestry .............................................................................................................33
b. Food, Fiber, and Forestry Manufacturing in Tennessee ...........................................................................38
c. Rural Economies and Well-Being ............................................................................................................40
d. Governor’s Rural Challenge .....................................................................................................................41
Summary .....................................................................................................................................................42
References Used ..........................................................................................................................................42
CHAPTER 3: THE TENNESSEE ECONOMY: LONG-TERM OUTLOOK ........................................................... 45
3.1. Introduction .....................................................................................................................................................45
3.2. Employment Outlook ......................................................................................................................................46
3.3. Unemployment ...............................................................................................................................................49
3.4. Population.......................................................................................................................................................52
3.5. Personal Income and Taxable Sales .............................................................................................................53
CONTENTS

2016 TENNESSEE ECONOMIC REPORT | viv | 2016 TENNESSEE ECONOMIC REPORT
CONTENTS
3.6. State Gross Domestic Product .......................................................................................................................54
CHAPTER 4: TENNESSEE’S DRIVE TO 55: BACKGROUND, EARLY RESULTS, AND CHALLENGES LYING AHEAD .............................................................................................................................. 57
4.1. Introduction and Key Points ............................................................................................................................57
4.2. The Landscape of College Progression in Tennessee ...................................................................................58
4.3. Will “Free Community College” Make a Difference in Tennessee? Early Indicators .......................................64
4.4. Challenges and Opportunities ........................................................................................................................65
Changing the Culture of College Aspirations ................................................................................................65
Undermatching .............................................................................................................................................66
Readiness and Research .............................................................................................................................67
The Other 45 Percent ...................................................................................................................................68
4.5. Acknowledgements ........................................................................................................................................68
4.6. References .....................................................................................................................................................69
APPENDIX A: FORECAST DATA.......................................................................................................................... 1
Quarterly History Tables ..........................................................................................................................................2
Annual History Tables ............................................................................................................................................26
APPENDIX B: HISTORICAL DATA ..................................................................................................................... 43
Quarterly Forecast Tables ......................................................................................................................................44
Annual Forecast Tables .........................................................................................................................................67

2016 TENNESSEE ECONOMIC REPORT | viivi | 2016 TENNESSEE ECONOMIC REPORT
CONTENTS
CHAPTER 1: THE U.S. ECONOMY ....................................................................................................................... 1
Figure 1.1: Inflation-Adjusted GDP Continued to Grow in 2015 .............................................................................3
Figure 1.2: The Housing Sector Continues to Rebound, but Starts and Sales Remain Below Pre-Recession Levels ...........................................................................................................................5
Figure 1.3: Consumer Energy Prices Drop in 2015 ...............................................................................................8
Figure 1.4: Unemployment Continues Dropping, but the Participation Rate Also Remains Low ............................9
Figure 1.5: The Federal Funds Rate Is Expected to Rise, Which Will Push Mortgage Rates Up .........................12
Figure 1.6: The Trade Deficit Is Expected to Continue as Import Growth Outpaces Export Growth ....................15
Figure 1.7: The Price of Crude Oil Will Begin Rebounding Mid-2016 ...................................................................15
CHAPTER 2: THE TENNESSEE ECONOMY: SHORT-TERM OUTLOOK ......................................................... 19
Figure 2.1: Over Eighty Percent of Tennessee Counties Experienced Job Growth in the Second Quarter Of 2015 ..........................................................................................................21
Figure 2.2: The Labor Force Participation Rate Remains Low in Tennessee and in the Nation ...........................22
Figure 2.3: Tennessee’s Monthly Unemployment Rate Is Near the Middle of the Pack Among Southeast States (December 2015) ...................................................................................................22
Figure 2.4: Eighty-Seven Percent of Tennessee Counties are Reporting Unemployment Rates Above the National Average ................................................................................................................................23
Figure 2.5: Tennessee’s Per Capita Personal Income (in Current Dollars) is Slightly Below the Southeast Average, 2015Q3 ...............................................................................................................................24
Figure 2.6: Per Capita Personal Income Is Lower Than the National Average in Most Tennessee Counties .......24
Figure 2.7: Building Permits Are Still Well Below the Pre-Recession Peaks of 2005 ..........................................25
Figure 2.8: The Federal Deficit Will Increase Slightly in 2016 ...............................................................................26
Figure 2.9: Tennessee Has Fourth Highest Growth Rate in Total Tax Revenues Among Southeastern States, Fiscal Year 2015 (July 2014–June 2015) ................................................................................27
Table 2.1: Selected U.S. and Tennessee Economic Indicators, Seasonally Adjusted ...........................................29
Figure 2.10: Despite Recent Growth, U.S. and Tennessee Manufacturing Employment Are Well Below Pre-Recession Levels From 2008 ....................................................................................................30
Figure 2.11: U.S. and Tennessee Manufacturing Output See Positive Growth ....................................................30
Figure 2.12: Tennessee’s Unemployment Rate Is Projected to Stay Above the National Rate Through 2018 .....31
Figure 2.13: Per Capita Personal Income in Tennessee Has Fallen Relative to the National Average .................32
Table 2.2: Tennessee Cash Farm Receipts and Share of Commodity Exports, 2010-2014 .................................34
Table 2.3: Indicators of the Tennessee Farm Sector’s Financial Well-Being, 2010-2014 ......................................37
Table 2.4: Tennessee Food, Fiber, and Forestry Manufacturing, 2013 .................................................................39
Figure 2.14: Agri-forestry Products Manufacturing Value of Shipments, 2009–2013 ...........................................39
Table 2.5: Household Income, Education Level, and Unemployment and Poverty Rates in Rural and Urban Areas of Tennessee ...................................................................................................................40
Table 2.6: Scorecard Indicators of Positive Progress for Tennessee Agriculture ..................................................41
FIGURES AND TABLES

2016 TENNESSEE ECONOMIC REPORT | viivi | 2016 TENNESSEE ECONOMIC REPORT
CONTENTS
CHAPTER 3: THE TENNESSEE ECONOMY: LONG-TERM OUTLOOK ........................................................... 45
Table 3.1: Tennessee Nonfarm Employment by Broad Sector (Thousands of Jobs) ............................................47
Table 3.2: Tennessee Manufacturing Employment by Sector (Thousands of Jobs) ..............................................47
Figure 3.1: Nonfarm Employment Continues to Grow While Manufacturing Employment Reverts to Trend Contraction Over the Long-Term Forecast Horizon ............................................................................48
Figure 3.2: Total Covered Employment Growth ....................................................................................................48
Figure 3.3: In the Long-Run, Tennessee’s Unemployment Rate Will Trend Downwards but Remain Above the National Rate for Most of the Forecast Horizon ............................................................................49
Figure 3.4: Educational Attainment Levels in Tennessee Are Below the National Average .................................50
Figure 3.5: Unemployment Rates in 2015 Are Comparable to their 2005 Counterparts in Most Tennessee Counties .............................................................................................................................................51
Figure 3.6: Tennessee Population Growth ............................................................................................................53
Table 3.3: Tennessee Inflation-Adjusted Gross Domestic Product by Sector .......................................................55
CHAPTER 4: TENNESSEE’S DRIVE TO 55: BACKGROUND, EARLY RESULTS, AND CHALLENGES LYING AHEAD .............................................................................................................................. 57
Table 4.1: Timely Student Progression Among 2007 and 2008 9th Graders ........................................................60
Table 4.2: High School Progression, Graduation, and College Enrollment Means by Cohort ..............................61
Table 4.3: High School Graduates Who Do Not Go on to College: Workforce Participation, Earnings, and Industry by Cohort ................................................................................................................................61
Figure 4.1: College or Workforce Destinations the Year After High School Graduation, by Region ......................62
Figure 4.2: Seamless College Enrollment Rates by County of First High School ................................................63
Table 4.4: High School Dropouts: Workforce Participation, Earnings, and Industry Five Years After 9th Grade, by Cohort ..............................................................................................................................................63
APPENDIX A: FORECAST DATA.......................................................................................................................... 1
Quarterly History Tables ..........................................................................................................................................2
Annual History Tables ............................................................................................................................................26
APPENDIX B: HISTORICAL DATA ..................................................................................................................... 43
Quarterly Forecast Tables ......................................................................................................................................44
Annual Forecast Tables .........................................................................................................................................67

2016 TENNESSEE ECONOMIC REPORT | ixviii | 2016 TENNESSEE ECONOMIC REPORT
EXECUTIVE SUMMARY
Early estimates indicate that U.S. gross domestic product (GDP) grew 2.4 percent in 2015 compared to 2.4 percent in 2014 and 1.5 percent in 2013.The last year started off slowly, with GDP growing by a meager 0.6 percent (on a seasonally-adjusted basis) in the first quarter of 2015 but rebounding in the subsequent quarters. This makes 2015 the sixth year of recovery since the recession. The continued U.S. recovery is an outlier in a global economy where many countries are experiencing economic slowdown or outright recession. The U.S. economy is predicted to sustain its stable growth through 2016 and 2017 and continue to be a global leader in growth.
The most important milestone of 2014 was that it marked the first year that nonfarm payroll jobs finally reached their pre-recession level. In 2015, significantly more jobs were created and the unemployment rate dropped further. Total nonfarm payrolls increased by 2.9 million for a total of 141.9 million jobs. Unemployment continued to fall reaching 5.0 percent by the fourth quarter, the lowest since the first quarter of 2008. These positive labor market indicators, along with falling food and gas prices, led to increases in consumers’ inflation-adjusted disposable income. The same labor market factors led to consumption growing by a strong 3.1 percent, the highest growth rate since 2006. Nonresidential and residential investment also showed substantial gains and increased by 3.4 and 8.6 percent, respectively. This is a good sign for the housing sector, which experienced double-digit growth in 2012 and 2013 but only grew by 1.8 percent in 2014. Inflation was flat in 2015, and overall prices rose by only 0.2 percent.
In less positive news, the government deficit was $438.9 billion, small when compared to the deficits run during the Great Recession, but 2015 marks the fourth year in a row that total U.S. federal debt was larger than U.S. GDP. The trade deficit widened in 2015, as exports grew minimally due
to the global slowdown and an appreciating U.S. dollar, and imports grew faster due to increased domestic consumption. And despite the strength in many elements of the labor market, the low labor force participation rate and weak earnings growth remain causes of concern.
Despite the global slowdown, the Fed was confident enough in the recovery to raise interest rates in December 2015. The Federal Funds rate rose from zero percent to 0.25 percent. Several subsequent 0.25 percentage point increases are expected in 2016. Other interest rates are also expected to rise. Despite these rising interest rates, rates remain low by historical standards and both residential and nonresidential investment are predicted to continue to grow. Recovering energy prices are expected to contribute to a slight rise in inflation in 2016. The Consumer Price Index (CPI) is expected to reach 1.2 percent.
There are always reasons to be cautious about the next year, but so far the recovery has not been derailed and the U.S. economy has shown considerable resilience. The economy continued to grow last year and is expected to do so in 2016 and 2017 as well. GDP is expected to increase by 2.7 percent, and the unemployment rate is predicted to fall to 4.9 percent. The year is expected to have solid gains each quarter, with GDP increases of 3.0 percent, 3.0 percent, 3.3 percent, and 3.3 percent in the first, second, third, and fourth quarters respectively. Strong domestic demand will continue to be the major driver of these GDP increases. Expectations are that 2017 and 2018 will both register solid economic growth, 2.9 and 2.6 percent in 2017 and 2018, respectively.
There are reasons to be concerned that the global slowdown could impact the U.S. economy, but overall U.S. economic indicators were positive throughout 2015. There are ample reasons to expect this recovery to continue and for there to be sustained and substantial growth in 2016 as well.
EXECUTIVE SUMMARY
The U.S. Economy

2016 TENNESSEE ECONOMIC REPORT | ixviii | 2016 TENNESSEE ECONOMIC REPORT
EXECUTIVE SUMMARY
The Short-Term Economic OutlookThe Tennessee economy continued to expand
in 2015. Inflation-adjusted gross domestic product (GDP) grew by 2.4 percent for the year, matching GDP growth for the U.S., and nonfarm employment increased by 1.9 percent, representing an addition of 54,600 new jobs. Job growth in Tennessee was slightly slower than national job gains of 2.1 percent for 2015. The state unemployment rate fell from 6.6 percent in 2014 to 5.9 percent in 2015, but still rests above the national rate.
Nominal personal income in Tennessee grew by 4.7 percent in 2015, outpacing the national growth rate of 4.5 percent. Nominal taxable sales continued to grow rapidly, increasing by 6.2 percent in 2015. This followed a 4.9 percent gain in 2014.
Tennessee is projected to see slightly slower growth in 2016 and 2017. Inflation-adjusted GDP will rise by 2.3 percent in 2016 and 2.2 percent in 2017. Nonfarm employment should see 1.7 percent growth in 2016 and 1.3 percent growth in 2017. Leisure and hospitality, professional and business services, and natural resources, mining, and construction will experience the largest job gains in both 2016 and 2017. Manufacturing employment will continue to increase but at a slow rate of 0.7 percent in 2016 and 2017. Manufacturing employment growth will occur in the durable goods sector, expanding by 1.5 percent in 2016 and 2017. These gains will offset the losses in the nondurable goods manufacturing sector, where employment is projected to shrink by 0.7 percent in 2016 and 0.8 percent in 2017.
The state unemployment rate will fall to 5.5 percent in 2016 and 5.4 percent in 2017. This would be the first time since 2007 that Tennessee’s unemployment rate fell below 6 percent. The number of unemployed people in Tennessee is projected to fall by 6.2 percent in 2016 and an additional 1.7 percent in 2017. However, Tennessee’s unemployment rate will remain above its national counterpart throughout the short-term forecast window.
Nominal personal income will grow by 4.8 percent in 2016 and 4.7 percent in 2017. All components of personal income in Tennessee will enjoy healthy growth over the next two years. In 2016 wage and salary income will increase by the largest amount, expanding by 5.1 percent, followed by 4.3 percent growth in 2017. Proprietors’ income will increase by 5.0 percent in 2016 and 4.8 percent in 2017, while rent, interest, and dividend income will grow by 4.4 percent in 2016 and 5.2 percent in 2017. Transfer payments are also projected to increase by 3.7 percent in 2016 and 4.1 percent in 2017. On a fiscal year basis, nominal personal income is projected to rise by 4.9 percent in FY 2016 and 3.3 percent in FY 2017. Per capita personal income will increase by 3.7 percent this year and 3.6 percent in 2017. By 2017, per capita income in Tennessee will equal $44,695. However, this will equate to only 86.9 percent of the national average. Nominal taxable sales are projected to rise by 4.7 percent this year and 3.5 percent in 2017. On a fiscal year basis, nominal taxable sales will increase by 6.5 percent in FY 2016 and 3.3 percent in FY 2017.
Long-Term Economic OutlookTennessee’s long-term outlook is based on
a trend forecast which focuses on factors of production such as population and labor force growth as well as productivity. The forecast presented in the body of this report extends out to 2025 and also takes a retrospective look at economic growth between 2005 and the present. One of the underlying assumptions of the trend forecast is that no recessions will occur within the next ten years, but a recession at some point during the long-term forecast horizon is possible if not likely.
From 2005 to 2015, nonfarm employment in Tennessee expanded by only 0.5 percent (compound annual growth rate, CAGR). This was slightly slower than the 0.6 percent (CAGR) growth registered for the nation as a whole. Employment growth during this period was slowed due to the Great Recession, and stronger employment gains are expected over the next
The Tennessee Economy

2016 TENNESSEE ECONOMIC REPORT | xix | 2016 TENNESSEE ECONOMIC REPORT
EXECUTIVE SUMMARY
ten years. In Tennessee, nonfarm employment is projected to increase by 1.1 percent (CAGR) between 2015 and 2025. By comparison, national employment will expand by a slightly slower 1.0 percent compound annual growth rate. Tennessee’s manufacturing sector and other services sector will see a very slight contraction in employment over the next ten years, while all other sectors are projected to grow. Employment growth will be strongest in the professional and business services sector, followed by education and health services and natural resources, mining, and construction. Within the manufacturing sector, durable goods employment is projected to grow by 0.4 percent (CAGR) between 2015 and 2025 while nondurable goods employment will fall by 1.0 percent (CAGR).
Tennessee’s unemployment rate has rested above the national rate for the last ten years, and a similar pattern is projected throughout most of the long-term forecast horizon out to 2025. However, both the state and national unemployment rates will trend downwards over the next ten years. Tennessee’s unemployment rate, which was 5.9 percent in 2015, will fall to 5.1 percent by 2025, while the national unemployment rate is projected to fall from 5.3 percent in 2015 to 5.0 percent in 2025. Despite the state’s declining unemployment rate, Tennessee labor force participation rate continues to fall. In 2005, Tennessee’s labor force participation rate was 62.0 percent and only slightly below the national participation rate of 64.5 percent. In 2015, the state’s labor force participation rate fell to 57.7 percent and is projected to fall even further to 55.1 percent by 2025. The national labor force participation rate has fallen as well and will rest slightly above 60 percent in 2025.
Between 2015 and 2025, nominal personal income is projected to grow by 4.5 percent (CAGR) in Tennessee, outpacing the 3.8 percent
compound annual growth rate that was registered between 2005 and 2015. Per capita income in Tennessee was only 86.8 percent of the national average in 2015. From 2015 to 2025, per capita income growth in the state is expected to grow by 3.5 percent, but lag behind national per capita income growth of 4.0 percent. As a result, state per capita income will drop to 82.5 percent of the national average by 2025. State initiatives such as the Tennessee Promise, which offers two years of tuition-free community college or technical college to all Tennessee high school graduates, and the Drive to 55, with its goal of increasing the percentage of Tennesseans with a college degree or certificate to 55 percent of the Tennessee population by 2025, aim to increase the education status of the state. If the hoped-for gains are realized, this will support a stronger growth trajectory for the state economy. This could support stronger income growth and a narrowing of the gap between the incomes of Tennesseans and other Americans.
Nominal taxable sales in Tennessee are expected to grow by 3.8 percent (CAGR) between 2015 and 2025. This is much stronger than the 2.5 percent compound annual growth rate that took place over the last ten years. Between 2005 and 2015, inflation-adjusted state GDP grew by a sluggish 1.1 percent (CAGR) in Tennessee, which was slightly slower than the 1.4 percent compound annual growth rate that inflation-adjusted GDP registered for the nation. Of course, this time period encapsulates the Great Recession which suppressed output growth in the late 2000’s. Looking ahead ten years, inflation-adjusted state GDP growth will accelerate to 2.2 percent (CAGR) between 2015 and 2025. This is slightly slower than the 2.4 percent compound annual growth rate projected for national GDP.

2016 TENNESSEE ECONOMIC REPORT | xix | 2016 TENNESSEE ECONOMIC REPORT
EXECUTIVE SUMMARY
Tennessee’s Drive to 55: Background, Early Results, and Challenges Lying Ahead
Tennessee’s “Drive to 55” is an effort initiated in 2013 to have 55 percent of working-age Tennesseans hold a higher education credential by 2025. Tennessee Promise is one of the major prongs of this effort. Promise provides last dollar grants – covering tuition and required fees – for any high school graduate in the state who goes straight to a two-year higher education program. The program and its privately funded predecessors motivated similar proposals from several states, the White House, and presidential candidates.
This chapter begins by situating Tennessee Promise in the recent history of student progression from high school to college. Among students who started 9th grade in 2008 or 2009, 54 – 55 percent of high school graduates went straight to college. For those who did not, typical earnings were well under the federal poverty line for a one-person household. Dropouts fared even worse.
The second section reviews what we know about the impact of Tennessee Promise so far, as well as findings from a study by two CBER faculty on the impact of Knox Achieves – an earlier, very similar program limited to Knox County – on college enrollment. In the first year of Tennessee
Promise, first-year college student enrollment rose 10 percent across two-year and four-year public systems. This echoes our estimated impact of Knox Achieves, whose participants were substantially more likely to enroll in college than similar students in ineligible counties.
Last, we review some of the challenges and opportunities facing Tennessee Promise and the Drive to 55. Tennessee Promise has proven to be effective at changing the conversation about going to college, but this conversation need not start in twelfth grade. Free tuition will convince some would-be university freshmen to start at a community college (“undermatching”), and their ultimate success will test the state’s system of transfer pathways. Overmatching is potentially a bigger challenge: most two-year college students require remedial education and fewer than three in ten obtain a degree within six years. More high-quality research is needed to identify what programs or practices are pivotal in helping students through college. Research is also needed to identify factors of success for “the other 45 percent” without a college credential.

2016 TENNESSEE ECONOMIC REPORT | 1xii | 2016 TENNESSEE ECONOMIC REPORT

2016 TENNESSEE ECONOMIC REPORT | 1xii | 2016 TENNESSEE ECONOMIC REPORT
The U.S. Economy | CHAPTER 1
CHAPTER 1: THE U.S. ECONOMY
1.1 Introduction
In 2015, the U.S. recovery from the Great Recession continued for its sixth year while many parts of the world continued reeling from the Great Recession or experienced setbacks related to China and its slowdown. U.S. gross domestic product (GDP) grew by a healthy 2.4 percent in 2015. For comparison, Canada, Japan, and China grew by 1.0 percent, 0.5 percent, and 6.8 percent, respectively. The U.S. was in many dimensions a global economic leader in 2015.
The labor market continued a slow but steady recovery: 2014 was the first year that nonfarm payroll reached its pre-recession level, and in 2015 an additional 2.9 million jobs were created. Only one major sector is predicted to have lost jobs in 2015: natural resources and mining, which lost 66 thousand jobs due to falling energy and commodity prices and a subsequent reduction in drilling activity. In addition, the unemployment rate continued its drop to 5.3 percent for the year and 5.0 percent for the fourth quarter, and inflation-
adjusted disposable income rose by 3.6 percent for the year. Moreover, the housing market recovered from the slow growth of 2014 and spending on residential investment grew by 8.6 percent in 2015. There were some weak spots in the nation’s housing sector, but generally the momentum was in a positive direction. Additionally, the economy experienced almost no inflation due to falling food and energy prices. All of this positive news culminated in the Federal Reserve signaling its confidence in the economy by raising the discount rate from 0.75 percent to 1.0 percent and the Federal Funds rate from the zero bound to 0.25 percent. These were the first increases in many years, driving home the Fed’s faith in the resiliency of the economy and their belief that the U.S. economy is stable enough to withstand rising interest rates and any modest, unforeseen shocks.
The biggest drags and sources of caution were a combination of plummeting commodity and energy prices, an appreciating U.S. dollar, and the
In this chapter—
1.1. Introduction
1.2. The U.S. Economy: Year in Review Components of GDP 1.3. The U.S. Forecast 1.4. Alternative Scenarios
1.5. Forecast Summary and Conclusions
1.6. References

2016 TENNESSEE ECONOMIC REPORT | 32 | 2016 TENNESSEE ECONOMIC REPORT
CHAPTER 1 | The U.S. Economy
global slowdown (especially in China). Falling energy and commodity prices led to a contraction in the natural resources and mining sector and sharp curtailment of drilling activity. (Falling energy prices had a silver lining in the form of significantly lower gasoline prices which freed up purchasing power for other uses.) An appreciating dollar and the global slowdown contributed to a widening U.S. trade deficit. While none of these factors were enough to derail U.S. economic growth, their impact is expected to continue into the next year.
A continuation of growth is expected in 2016. U.S. inflation-adjusted GDP is expected to grow by 2.7 percent, the economy is expected to create 2.4 million jobs, inflation-adjusted disposable income is expected to rise by 3.1 percent, and the global slowdown is expected to continue. Energy and commodity prices are expected to reach bottom in 2016 and affected economies are expected to begin stabilizing. The primary risk is a sharper slowdown in China and the global economy.
1.1. Introduction, continued
1.2. The U.S. Economy: Year in Review
The last year was another stable year for the U.S. expansion. The year started off slow but gained momentum: GDP grew by 0.6 percent on a seasonally-adjusted basis in the first quarter. Afterwards, however, GDP grew by 3.9 percent and 2.0 percent in the second and third quarters; fourth quarter GDP grew at a disappointing 1.2 percent rate. This relatively strong growth for the year as a whole can be attributed to a slowly strengthening housing market, a solid labor market and employment outlook, and robust consumption spending (particularly of durable goods, including automobiles). The Federal Reserve’s December interest rate hike provided evidence of its confidence in the economy.
A continuation of the stable growth seen in 2015 is expected for 2016. Both the labor and housing markets are expected to show sustained improvement and inflation is expected to remain benign. This favorable forecast comes with some caution. The global economy is not faring as well as the U.S. economy: much of the globe is experiencing a slowdown in growth, particularly in China, its trading partners, and other developing nations. This situation is expected to continue in 2016. The global slowdown and an appreciating U.S. dollar, in conjunction with strong domestic consumption, are likely to lead to a widening trade deficit. However, these threats are not viewed as significant enough to unsettle the U.S. economy’s current trajectory.
Components of GDPGDP is composed of personal consumption
expenditures, investment, government purchases, and the balance of international trade (exports minus imports).
ConsumptionPersonal consumption expenditures are by far
the largest component of U.S. GDP, accounting for 68.6 percent of spending in 2015. Consumption grew by 3.1 percent in 2015 compared to 2.7 percent in 2014 and 1.7 percent in 2013. This healthy consumer spending was a major driver of the economy. Increases in consumer spending accounted for 2.1 percentage points of the 2.4 percent growth in GDP in 2015. The strongest consumption growth was recorded in the second quarter, up 3.6 percent compared to 1.8 percent growth in the preceding quarter. The factors that typically help explain consumer spending include disposable income growth, consumer confidence, and the state of the labor market. Inflation-adjusted disposable income increased by 3.6 percent in 2015 compared to growing 2.7 percent in 2014 and falling 1.4 percent in 2013. Some of this disposable income growth was due to falling energy prices, particularly gasoline prices, freeing up income to be spent elsewhere. The unemployment rate and consumer sentiment index also moved in favorable directions. The unemployment rate fell to 5.3 percent for the year,

2016 TENNESSEE ECONOMIC REPORT | 32 | 2016 TENNESSEE ECONOMIC REPORT
The U.S. Economy | CHAPTER 1
1.2. The U.S. Economy: Year in Review, continued
the lowest the unemployment rate has been since 2007. The consumer sentiment index rose to 92.9, up from 84.1 in 2014. On top of these favorable indicators, inflation-adjusted household net worth grew by 3.2 percent compared to 4.8 percent and 12.7 percent in 2014 and 2013, respectively.
Personal consumption has three components: services, nondurable goods, and durable goods. Spending on services is the least volatile of the three components and accounted for 65.5 percent of total consumption spending last year. Services spending grew by 2.7 percent in 2015, the most growth the category has experienced since 2006. Healthcare, transportation, and food services all saw substantial growth of 4.7 percent, 5.1 percent, and 4.5 percent, respectively.
Nondurable goods are the second largest category of consumption with a share of 21.7 percent. Nondurable goods include food, beverages, clothing, medical products, gas, and other similar short-lived products. Spending on
nondurable goods increased by 2.8 percent in 2015 compared to 2.1 percent in 2014 and 1.9 percent in 2013. The categories that account for the largest portions of nondurable goods spending are food and beverages (33.2 percent of total nondurable good consumption), clothing and footwear (14.8 percent), and pharmaceutical and medical products (16.1 percent). Pharmaceutical and medical products experienced strong growth with spending ticking up 4.6 percent. Clothing and footwear also grew 3.5 percent, but food and beverages spending flattened and increased by only 0.2 percent. Worth noting is that spending on tobacco products increased by 3.5 percent, the first time the category has grown since 2006.
Personal spending on durable goods includes motor vehicles, furnishings, recreational goods, computers, and other household equipment. Spending on durable goods is by far the most volatile category of consumption. Spending growth on durables in the recovery has outpaced
Figure 1.1: Inflation-Adjusted GDP Continued to Grow in 2015
Source: Bureau of Economic Analysis and IHS Global Insight, Inc.
-4.0
-3.0
-2.0
-1.0
0.0
1.0
2.0
3.0
4.0
5.0
GDP
Gro
wth
(%)

2016 TENNESSEE ECONOMIC REPORT | 54 | 2016 TENNESSEE ECONOMIC REPORT
CHAPTER 1 | The U.S. Economy
1.2. The U.S. Economy: Year in Review, continued
spending on nondurables and services, and this trend continued in 2015. Spending on durable goods typically sinks during recessions and increases more than any other category during periods of recovery or expansion to satisfy consumers’ pent-up demand. In 2015, durable goods made up 13.1 percent of total consumption spending, and spending on durable goods increased by 6.1 percent. This continues a pattern of strong growth in durable goods spending since the recession: spending on durable goods increased by 5.9 percent, 5.8 percent, and 7.4 percent in 2014, 2013, and 2012, respectively. Spending on computers and peripheral equipment increased by 15.6 percent in 2015, up from 8.1 percent in 2014 and 12.7 percent in 2013.
Strong growth in vehicle purchases was one of the main drivers of durable goods consumption. Purchases of both used and new motor vehicles increased significantly for the year. Net used vehicle sales grew by 5.5 percent and new vehicles sales grew by 3.8 percent. This year marks a peak in both number of new vehicles sold and inflation-adjusted spending on new vehicles: 17.4 million vehicles were sold and $254.2 million was spent in inflation-adjusted dollars. However, new vehicle sales growth belies a sharp division between the growth of new auto sales and light truck sales. New auto sales shrank by 8.0 percent, while new light truck sales rose 10.2 percent. Sales of domestic cars remained steady at 5.6 million units sold in both 2015 and 2014, while sales of foreign cars fell 6.4 percent from 2.1 million units in 2014 to 2.0 million units in 2015. Sales of domestic light trucks rose 9.3 percent in 2015 to 8.1 million units sold, and sales of foreign light trucks rose 29.7 percent to 1.8 million units sold.
InvestmentInvestment made up 17.5 percent of U.S.
inflation-adjusted GDP and contributed 0.8 percentage points towards the total 2.4 percent GDP growth in 2015. Investment includes three subcomponents: nonresidential fixed investment, residential fixed investment (new housing), and the change in business inventories. All three categories contributed positively to GDP in 2015. (Note that
investment, as included in GDP, does not include financial instruments like stocks and bonds.)
Nonresidential fixed investment, the largest component of investment spending, made up 77.8 percent of investment spending in 2015. It includes equipment purchases by firms, acquisition of non-tangible products such as software and licenses, and spending on structures. Nonresidential fixed investment spending grew by 3.4 percent in 2015 compared to 6.2 percent in 2014 and 3.0 percent in 2013. Spending on mining and petroleum structures fell by 34.7 percent, and spending on power and communication fell by 12.1 percent. On the other hand, manufacturing structures capacity increased dramatically with a 49.9 percent gain. This was the fourth year in a row to see an expansion in manufacturing structures.
The second largest sub-component of investment spending is residential fixed investment, which accounted for 18.5 percent of investment spending in 2015. Residential fixed investment contributed 0.3 percentage points towards the 2.4 percent GDP growth in 2015. Residential fixed investment grew by 8.6 percent in 2015, a strong showing after growing only 1.8 percent in 2014. This makes 2015 the fifth consecutive year of growth in the housing market. Despite this consistent growth, residential investment remains substantially below its pre-recession peak. In 2015, inflation-adjusted residential investment increased to $528.4 billion in inflation-adjusted dollars, still only 65.5 percent of the level recorded in 2006. Housing is still trying to recover from the wrenching 24.0 percent, 21.2 percent and 2.5 percent setbacks recorded in 2008, 2009 and 2010.
The number of housing starts grew by 10.9 percent to reach 1.1 million units in 2015 compared to 1.0 million units in 2014 and 928 thousand units in 2013. Nevertheless, 1.1 million housing starts is still significantly below the 1.8 million housing starts recorded in 2006. Sales of new homes increased by 12.7 percent in 2015 and reached 496 thousand units, the highest number since 2007. Sales of existing houses grew by 5.9 percent.

2016 TENNESSEE ECONOMIC REPORT | 54 | 2016 TENNESSEE ECONOMIC REPORT
The U.S. Economy | CHAPTER 1
1.2. The U.S. Economy: Year in Review, continued
House prices have kept their upward trend since 2012. Average and median prices of existing houses increased for the fourth consecutive year to reach $264 thousand and $220 thousand, respectively. The Federal Housing Finance Agency (FHFA) Housing Price Purchase-Only Index also increased for the fourth consecutive year. The housing market continued recovering in the spring and summer, despite stagnating home sales.
As is the case for investment in general, interest rates are one of the key determinants of growth in the housing sector. Interest rates remained low throughout 2015, though many expected interest rate hikes to begin mid-year. The Fed did not raise interest rates until December 2015 because of the global slowdown and a weak Chinese economy. In December, the Federal Reserve announced that it would increase the discount rate from 0.75 percent to 1.0 percent and the Federal Funds rate from zero to 0.25 percent. The Federal Funds increase is expected to be the first of many small
rate increases that will move the economy back to more typical interest rate levels in the years ahead. Because interest rates continued to be low in 2015, the 30-Year Fixed Mortgage Rate remained lower than its historical average, actually dropping from 4.2 percent in 2014 to 3.9 percent in 2015. The average before the recession was above 6.0 percent. The Federal Funds rate and 3-Month Treasury Bill rate both remained close to zero throughout 2015. Meanwhile, the 10-Year Treasury note yield fell from an average of 2.5 percent in 2014 to 2.1 percent in 2015.
Changes in business inventory, the highly-cyclical component of investment, contributed positively to GDP in the first two quarters of 2015 but came in negative in both the third and fourth quarters. The overall effect for GDP was slightly positive: changes in inventory accounted for 0.1 percentage points of the 2.4 percent growth in GDP. Typically, the change in inventories accounts for less than 3 percent of total investment (it
Figure 1.2: The Housing Sector Continues to Rebound, but Starts and Sales Remain Below Pre-Recession Levels
Source: U.S. Census Bureau, FHFA, and IHS Global Insight, Inc.
0.0
50.0
100.0
150.0
200.0
250.0
0.0
0.5
1.0
1.5
2.0
2.5
FHFA HPI -Purchase Only (1991Q
1=100)
New
Hou
se S
ales
/Hou
sing
Sta
rts
(Mill
ions
of U
nits
)
Sales of New Houses (Millions of Units) Housing Starts (Millions of Units)
FHFA HPI - Purchase Only (1991Q1=100)

2016 TENNESSEE ECONOMIC REPORT | 76 | 2016 TENNESSEE ECONOMIC REPORT
CHAPTER 1 | The U.S. Economy
1.2. The U.S. Economy: Year in Review, continued
accounted for 3.1 percent in 2015), yet it can have a strong contribution to overall GDP growth in some quarters due to its cyclical nature. Inventory investment increased by 4.1 percent in 2015 compared to growing 3.1 percent in 2014. Both farm and nonfarm inventory investment increased steadily but not dramatically: farm investment grew by 3.2 percent and nonfarm investment grew by 4.2 percent.
Government PurchasesGovernment purchases, including federal as
well as state and local spending, made up 17.5 percent of GDP in 2015. Federal purchases fell for the fifth consecutive year, down to $1.1 trillion in inflation-adjusted dollars. Federal purchases fell 0.4 percent compared to falling 2.4 and 5.7 percent in 2014 and 2013, respectively. Defense spending continued to fall but more slowly than in previous years: defense spending fell by 1.4 percent in 2015 compared to falling by 3.8 percent in 2014 and 6.7 percent in 2013. Federal nondefense spending grew by 1.2 percent compared to falling by 0.1 percent in 2014 and 4.0 percent in 2013. State
and local purchases grew for the second year in a row and increased to $1.7 trillion in 2015, down from $1.8 trillion in 2010 in inflation-adjusted dollars. State and local spending grew by 1.5 percent compared to growing 0.6 percent in 2014 and shrinking 1.0 percent in 2013. This growth in state and local spending was spurred on by spending on investment: spending on construction increased by 5.6 percent (the first year of growth since 2006) and spending on software increased by 5.6 percent as well. State and local governments are still recovering from the trough of the Great Recession.
The federal government’s deficit remains high at $483.9 billion (nominal dollars) but is small compared to the deficits run during the recession. Sequestration has helped rein in spending. Stronger income taxes and social insurance contributions counterbalanced lower corporate taxes. The total federal debt rose to $18.5 trillion nominal dollars, which makes 2015 the fourth year that federal debt was larger than 100 percent of GDP.
Worldwide Recovery from the Great Recession
Most recessions come and go without leaving a legacy in their aftermath. This was certainly not the case for the
Great Recession where recovery has been prolonged and has varied significantly across the globe. For example, Korea’s
unemployment rate in 2013 was 3.1 percent, 0.3 percentage points lower than its level in 2006. On the other hand, Spain’s
unemployment rate more than tripled during that time period to 26.3 percent in 2013 from 8.6 percent in 2006. GDP growth
has been equally divergent: in 2006, Spain’s GDP growth was 4.2 percent and South Korea’s was 5.2 percent. In 2013,
Spain’s GDP shrank by 1.7 percent from the previous year, while South Korea’s grew 2.9 percent. What factors account for
this uneven recovery? There are country-specific and region-specific factors at play, but there are also broad trends.
Overall, developing nations did much better than developed nations at recovering from the recession. This may be
because many developing nations are net exporters. China, with its insular markets, was not impacted by the Great
Recession as much as many other large economies. Therefore, nations that exported to China were not impacted as
severely by the Great Recession. In fact, Africa and Asia (excluding Japan and China and the Asian Tigers of Hong Kong,
Singapore, South Korea, and Taiwan) had GDP growth of over 50 percent from 2009 to 2014. The Asian Tigers plus Japan
and China, the Middle East, Latin America, and Oceania all recorded GDP growth of over 40 percent from 2009 to 2014
2014 (Arias & Wen, 2015). Unfortunately, this is also why many developing nations have experienced severe setbacks to
growth as China’s growth slows. As a consequence, while developed nations’ contribution to global growth fell in the years
following the Great Recession (2010 – 2014), it is predicted to have risen in 2015.
continued on page 7

2016 TENNESSEE ECONOMIC REPORT | 76 | 2016 TENNESSEE ECONOMIC REPORT
The U.S. Economy | CHAPTER 1
1.2. The U.S. Economy: Year in Review, continued
TradeIn 2015, the U.S. recorded a trade deficit of
$525.4 billion (or 2.9 percent of GDP). Exports amounted to $2.3 trillion, while imports amounted to $2.9 trillion. Typically, purchases of foreign goods and services by U.S. consumers (imports) exceed sales of goods and services produced in the U.S. and sold to other countries (exports). After the recession, there was a three-year period from 2010 to 2012 when exports grew faster than imports. However, in 2015, import growth vastly outpaced export growth. Part of the explanation for this imbalance is the strength of the U.S. dollar. As the dollar strengthens, U.S. exports become more expensive and imports to the U.S. become less expensive. Imports increased in 2015 by 5.0 percent compared to rising by 3.8 and 1.1 percent in 2014 and 2013, respectively. Meanwhile, exports increased by just 1.0 percent compared to growing by 3.4 percent in 2014 and 2.8 percent in 2013. Imports of both goods and services grew
solidly: imports of services grew by 5.7 percent and imports of goods grew by 4.9 percent. On the other hand, exports of goods fell by 0.3 percent, even as exports of services rose by 3.9 percent. Exports of vehicles and parts fell by 4.8 percent, the first time vehicle exports have fallen since 2009.
Inflation and PricesThe most popular measure of the aggregate
level of prices in the economy is the Consumer Price Index or the CPI. As measured by the CPI, overall prices rose by only 0.1 percent in 2015 compared to 1.6 percent in 2014 and 1.5 percent in 2013.
Low energy prices and low import prices (from a strong U.S. dollar) drove overall price indices downward. If energy and food are excluded, overall prices in 2015 still only rose by 1.8 percent. This rate is still below the Fed’s target range for inflation. Food prices rose by 1.9 percent, while
Another important factor is whether a country used effective fiscal or monetary stimulus to respond to the recession.
China used aggressive fiscal stimulus and used its state-owned enterprises to hoist up demand (Wen & Wu, 2014).
European nations responded to the crisis with monetary policy and to varying degrees pursued fiscal austerity. Now, once
we are at a vantage point to see the impact of those decisions, it appears that aggressive Keynesian government policy (i.e.
deficit financed government spending) helped China weather the Great Recession, whereas the mixed fiscal and monetary
policy actions of the U.S. were less effective, and the monetary actions of Europe were even less effective than that of the
U.S. (Arais & Wen, 2015).
Finally, the Great Recession began as a crisis in the financial sector. The more a nation’s financial market was integrated
with global financial markets, the more exposed they were to the immediate financial crisis. Countries with insular and
comparatively small financial markets may have been protected from the full ramifications of the financial crisis (Arais & Wen,
2015). The wilting financial markets had consequences for both the U.S. and European economies that may have made
recovery more difficult.
Europe, and especially a number of members of the European Union, had a particularly challenging time recovering
from the Great Recession. In 2013, European GDP was the same as it was in 2012. Europe was so hard-hit because the
recession launched a debt crisis, including a sovereign debt crisis for nation states. Five nations in the European Union
(EU) required bailouts after the recession: Greece, Ireland, Portugal, Spain, and Cyprus. European nations trade heavily
with each other, and membership in the European Union intensifies this interrelatedness. As Europe was attempting to
recover from the recession, many of the EU member nations experienced crises that then impacted other nations. Further,
the EU suffered from each of the factors listed above: (1) it is made primarily of developed nations, so it could not weather
the Great Recession and its fallout through exports to China and other developing nations, (2) countries practiced monetary
stimulus and in some cases even austerity measures in response to the recession, and (3) its financial markets are globally
connected.
continued from page 6

2016 TENNESSEE ECONOMIC REPORT | 98 | 2016 TENNESSEE ECONOMIC REPORT
CHAPTER 1 | The U.S. Economy
energy prices fell by a staggering 16.7 percent, a much bigger drop than those recorded in 2014 and 2013. Producer prices (finished goods) fell by 3.4 percent in 2015, the first time the category has experienced a price decline since 2009. This decrease was mainly caused by falling energy prices (which impact both producers and consumers) and a huge reduction in crude material prices. Crude material prices fell by 24.2 percent in 2015, mostly driven by declines in the prices of fuels and power. Gas fuels, crude petroleum, and refined petroleum product prices fell by 45.5 percent, 50.8 percent, and 37.8 percent, respectively.
The Federal Reserve is charged with maintaining both price stability and full employment. These goals can often be at odds: price stability requires some minimal level of inflation and some yield of interest on savings. Conversely, the Fed can stimulate demand (and thus hope to increase employment) by keeping interest rates low. This is what the Fed did in response to the Great Recession. The Federal Reserve
kept the Federal Funds rate low (below 0.25 percent) for twenty-eight consecutive quarters by the end of 2015. Finally, in December 2015, the Fed raised the Federal Funds rate from zero to 0.25 percent. The Fed is predicted to slowly increase the Federal Funds rate until it returns to more normal levels. Expect the Federal Funds rate to exceed 1.0 percent by the end of 2016. As noted above, these anticipated increases are viewed by many economists as a signal of the Fed’s belief in the strength of the recovery as well as a necessary step to normalize rates. The Fed had maintained that interest rates would stay low until the unemployment rate was below 6.5 percent and labor market indicators improved. The unemployment rate in 2015 remained below that threshold and continued dropping from 5.7 percent in the fourth quarter of 2014 to 5.0 percent in the fourth quarter of 2015. The Fed previously announced that they would begin raising interest rates in mid-2015, but this did not happen until December 2015 because of the current
1.2. The U.S. Economy: Year in Review, continued
Source: Bureau of Economic Analysis and IHS Global Insight, Inc.
Figure 1.3: Consumer Energy Prices Drop in 2015
90.0
100.0
110.0
120.0
130.0
140.0
150.0
Cons
umer
Ene
rgy
Pric
es (2
009
= 10
0)
Year:Quarter
2016 TENNESSEE ECONOMIC REPORT | 98 | 2016 TENNESSEE ECONOMIC REPORT
The U.S. Economy | CHAPTER 1
global slowdown. The December hike was the first time the Fed has raised rates since 2006. There is some worry that rising interest rates will bolster an already strong dollar and lead to an even larger trade deficit in 2016. However, stronger global growth and rising interest rates in other countries will help temper these possible impacts.
Although inflation is not an imminent concern for the U.S. economy, there are some signs that slightly higher prices are on the horizon. Wages are finally showing some signs of increasing, and the falling unemployment rate means additional tightening in the labor market. Moreover, energy prices have likely bottomed out and, as they recover, will add to inflationary pressures. There have been ongoing concerns since the end of the recession that deflation rather than inflation was a greater risk to the economy. Continued economic growth is reducing the likelihood of deflation. There is an excess of global capacity in the manufacturing and this is where ongoing downward price pressures are expected.
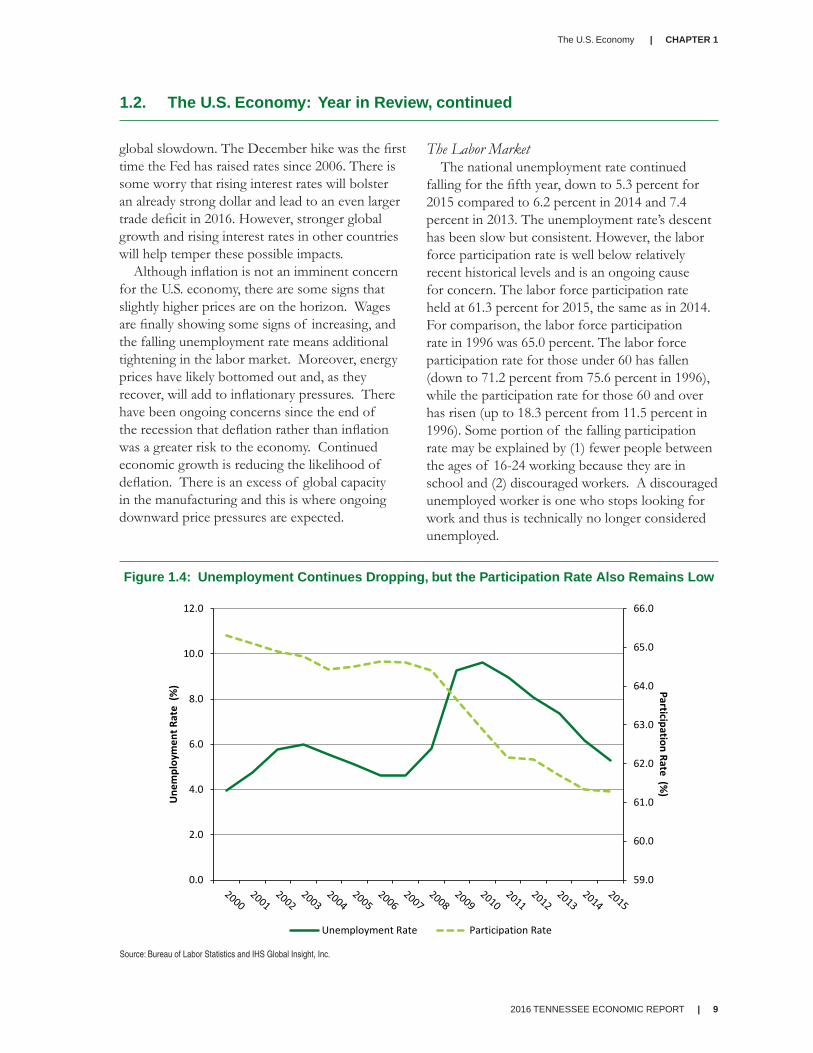
The Labor MarketThe national unemployment rate continued
falling for the fifth year, down to 5.3 percent for 2015 compared to 6.2 percent in 2014 and 7.4 percent in 2013. The unemployment rate’s descent has been slow but consistent. However, the labor force participation rate is well below relatively recent historical levels and is an ongoing cause for concern. The labor force participation rate held at 61.3 percent for 2015, the same as in 2014. For comparison, the labor force participation rate in 1996 was 65.0 percent. The labor force participation rate for those under 60 has fallen (down to 71.2 percent from 75.6 percent in 1996), while the participation rate for those 60 and over has risen (up to 18.3 percent from 11.5 percent in 1996). Some portion of the falling participation rate may be explained by (1) fewer people between the ages of 16-24 working because they are in school and (2) discouraged workers. A discouraged unemployed worker is one who stops looking for work and thus is technically no longer considered unemployed.
1.2. The U.S. Economy: Year in Review, continued
Source: Bureau of Labor Statistics and IHS Global Insight, Inc.
Figure 1.4: Unemployment Continues Dropping, but the Participation Rate Also Remains Low
59.0
60.0
61.0
62.0
63.0
64.0
65.0
66.0
0.0
2.0
4.0
6.0
8.0
10.0
12.0
Participation Rate (%)
Une
mpl
oym
ent R
ate
(%)
Unemployment Rate Participation Rate

2016 TENNESSEE ECONOMIC REPORT | 1110 | 2016 TENNESSEE ECONOMIC REPORT
CHAPTER 1 | The U.S. Economy
Discouraged workers imply that the relatively low participation rate in 2015 is part of the reason the unemployment rate is falling (since the unemployment rate only counts people without jobs who are actively seeking work). Many economists believed that once the recession was over, discouraged workers would re-enter the labor force, and the participation rate would bounce back up. Unfortunately, this has not happened. Janet Yellen, the Chair of the Fed’s Board of Governors, estimates that there are currently two million discouraged workers who are not employed in the current labor market but would be employed in a labor market with higher wages and less slack (Yellen, 2015).
An additional concern is productivity, which has recently stagnated and increased by only 0.7 percent in both 2015 and 2014. Productivity increased significantly in the recession and its immediate aftermath: it rose by 3.2 percent in 2009 and 3.3 percent in 2010. Further, although 2008 experienced low productivity growth, productivity growth has traditionally been high in the modern U.S. economy. Since 1996, no year before the Great Recession had productivity growth of less than 1.6 percent.
More encouragingly, the economy continued creating jobs in 2015, a positive indicator since the economy just reached its pre-recession level of jobs in 2014. The economy added 2.9 million nonfarm payroll jobs in 2015, a 2.1 percent increase. The total number of nonfarm payroll jobs reached 141.9 million, making 2015 the second year that post-recession nonfarm payroll jobs surpassed their pre-recession level. Most of the job gains came from the private sector, which added 2.8 million jobs. The public sector added 91 thousand jobs; 84 thousand of these jobs were added at the state and local level.
Of the major sectors, professional and business services added the most jobs: 653 thousand jobs in 2015. However, both education and health services and trade, transportation, and utilities added large numbers of jobs, 584 thousand and 537 thousand, respectively. Notably, the construction sector continued to grow, adding 249 thousand jobs. The sector that did the poorest was natural resources and mining, the only sector to shed jobs, which lost 59 thousand jobs for a decline in employment of 6.6 percent.
1.2. The U.S. Economy: Year in Review, continued
1.3. The U.S. Forecast
Even amidst uncertainty about the global economy, the U.S. is expected to continue on its trajectory of steady growth in 2016 and 2017. Inflation-adjusted GDP is expected to grow by a robust 2.7 percent in 2016, following 2.4 percent growth recorded in 2015. The fourth quarter of 2015 recorded annualized GDP growth of only 1.2 percent due to unexpectedly slow consumer spending. This followed strong GDP growth in the second and third quarters of 3.9 and 2.0 percent, respectively; growth in these quarters was driven by growing consumer spending. Calendar year 2016 is expected to have solid growth each quarter: 3.0 percent in the first and second quarters and 3.3 percent in the third and fourth.
The factors contributing to this growth in the next year are primarily strong consumer spending,
continuing growth in residential investment, and a healthy pace of job creation. U.S. consumer spending is expected to rise by 3.0 percent, housing starts are expected to reach 1.3 million, and the economy is predicted to create 2.4 million jobs. The U.S. economy’s cornerstone of domestic demand will help shield it from many impacts of the global slowdown, but manufacturing as well as natural resources and mining will be impacted. Manufacturing is expected to continue to suffer from fallen global demand and an appreciating U.S. dollar. Low global commodity and energy prices will continue to depress growth in the natural resources sector. These same low prices will be a boon to consumers.
Both U.S. fiscal and monetary policy are oriented for a year of robust growth. The Fed is expected to
2016 TENNESSEE ECONOMIC REPORT | 1110 | 2016 TENNESSEE ECONOMIC REPORT
The U.S. Economy | CHAPTER 1
1.3. The U.S. Forecast, continued
continue increasing interest rates in 2016 following an increase at the end of 2015. U.S. federal purchases are predicted to rise for the first time since 2010 building on a bipartisan budget accord that was reached before the year’s end. The will help stabilize political influence on the economy through 2016.
ConsumptionConsumer spending was strong throughout
most of 2015, and that pattern is expected to continue into 2016 with an annual growth rate of 2.7 percent. This positive consumer spending depends on continued growth in inflation-adjusted income, automobile sales, and real estate, as well as continuing low inflation rates.
Inflation-adjusted disposable income is expected to grow by 3.1 percent in 2016 compared to 3.6 percent in 2015. Inflation-adjusted household net worth is expected to grow by 3.4 percent in 2016 compared to 3.2 percent in 2015. Consumption growth in 2016 is expected to be relatively stable and grow 3.0 percent, 3.2 percent, 3.4 percent, and 3.4 percent for the first, second, third, and fourth quarters, respectively.
Spending on durable goods should remain strong in 2016 as a result of the recovering economy and job market. Durable goods spending is expected to increase by 6.3 percent compared to increasing by 6.1 percent in 2015. Durable goods spending is expected to continue to outpace both services spending (expected to increase by 2.5 percent) and nondurable goods spending (expected to increase by 3.1 percent). While spending on new light trucks is expected to grow by only 4.0 percent compared to 10.2 percent in 2015, spending on recreational goods and vehicles is predicted to stay strong and increase by 11.2 percent.
The Labor MarketEmployment growth is expected to remain solid
and steady. The unemployment rate is expected to drop through 2016: it was 5.0 percent in the fourth quarter of 2015 and is expected to fall to 4.9 by the fourth quarter of 2016. Based on headline statistics like the overall unemployment rate, the
labor market is getting close to full employment. Other measures—like counts of discouraged workers and the low labor force participation rate—suggest that significant underlying weaknesses remain in the labor market.
The expected 1.7 percent rate of job creation is slower than the recorded rate for 2015 or 2014, which saw increases of 2.1 and 1.9 percent, respectively. Nevertheless, the economy is expected to add 2.4 million more jobs in 2016. The first quarter is expected to be particularly robust with 663 thousand jobs added. The sectors expected to experience the strongest growth are the education and health services sector as well as professional and business services, which are expected to add 600 thousand and 634 thousand jobs, respectively. Only one major sector is expected to cut payrolls: natural resources and mining, the same sector that shed jobs in 2015. Due to plummeting petroleum and natural gas prices, the natural resources and mining sector is expected to cut 93 thousand jobs.
Productivity, which has slumped in recent years, is expected to grow by 1.5 percent in 2016. There is some evidence that productivity has slowed, including the disconnect between very strong rates of job growth and the more modest but still respectable rate of GDP growth. The lack of a rebound in productivity would translate into slower growth for the year.
A major concern in recent years has been the decline in the labor force participation rate, i.e., the share of the adult population employed or unemployed and actively pursuing a job. From 2008 to 2011, the labor force actually shrank by 703 thousand workers. Labor force expansion has not reached 1.0 percent for any year since the recession, but in 2016 it is expected to reach 1.5 percent. This is close to the 1.7 percent rate of job creation expected in 2016.
Investment and Interest RatesThe housing sector is expected to continue its
recovery, despite rising interest rates which increase monthly mortgage payments. Pent-up demand, low housing prices, and a healthy labor market will carry the housing market forward. Residential

2016 TENNESSEE ECONOMIC REPORT | 1312 | 2016 TENNESSEE ECONOMIC REPORT
CHAPTER 1 | The U.S. Economy
fixed investment is expected to grow by 9.5 percent in 2016, marking its sixth year of growth. The first quarter is expected to be particularly strong, with an annualized growth rate of 11.2 percent. Housing starts are expected to increase to 1.3 million units compared to 1.1 million in 2015, notably still below the pre-recession level of 1.8 million in 2006. Sales of existing homes are expected to increase to 5.3 million units, 81.4 percent of their 2006 level.
Housing prices are predicted to continue rising, with a 3.4 percent increase in average existing home prices expected in 2016. The average price of new homes is expected to rise much faster and increase by 7.1 percent, following a significantly smaller increase of 3.2 percent in 2015. The FHFA Purchase-Only Index is projected to rise by 4.8 percent in 2016, following increases of 5.6 percent and 5.5 percent in 2015 and 2014, respectively.
The Fed finally began raising interest rates at the end of 2015. It is expected that the Federal Funds rate will reach 1.3 percent by the fourth quarter of
2016. The 3-Month Treasury Bill rate is expected to increase to 1.2 percent by the fourth quarter of 2016, and the 30-Year Fixed Mortgage rate is expected to increase to 4.6 percent. Some fear that rising interest rates could slow the housing market’s recovery, but the overall consensus is that the housing market has strengthened enough to withstand rising interest rates. The Fed’s interest rate hikes are already incorporated into market considerations.
Nonresidential fixed investment is expected to grow by 5.0 percent in 2016 compared to 3.4 percent in 2015. Equipment investment is expected to account for most of the growth in nonresidential fixed investment, advancing 6.6 percent. Growing equipment investment is dependent on rising oil prices, the global economy gaining momentum, and exchange rates stabilizing. Structures investment is expected to grow by only 2.6 percent.
Business inventory spending is not expected to grow as quickly as it did in 2015; the anticipated gain in 2016 is only 1.5 percent. The first sign of
1.3. The U.S. Forecast, continued
Source: Federal Reserve Bank, Freddie Mac, and IHS Global Insight, Inc.
Figure 1.5: The Federal Funds Rate Is Expected to Rise, Which Will Push Mortgage Rates Up
3.00
3.50
4.00
4.50
5.00
5.50
6.00
6.50
7.00
7.50
8.00
0.00
1.00
2.00
3.00
4.00
5.00
6.00
7.00
30-Year Fixed Mortgage Rate (%
)
Fede
ral F
unds
Rat
e (%
)
Federal Funds Rate 30-Year Fixed Mortgage Rate

2016 TENNESSEE ECONOMIC REPORT | 1312 | 2016 TENNESSEE ECONOMIC REPORT
The U.S. Economy | CHAPTER 1
1.3. The U.S. Forecast, continued
a quickening global economy will be increased changes in inventory, rather than changes in the trade deficit.
Federal BudgetBecause of a bipartisan budget agreement, the
federal budget is expected to experience its first increase since 2010 and grow by 3.6 percent to $1.2 trillion. The deficit is projected to rise to $500.5 billion compared to $438.9 billion in 2015. Any
deficit will add to the overall U.S. debt, which is predicted to hit $19.4 trillion in 2016. This would make 2016 the sixth year that U.S. federal debt has exceeded U.S. GDP.
The Congressional budget deal includes an increase in defense and nondefense spending, as well as cuts to Medicare and Social Security benefits. Defense spending is projected to rise by 3.1 percent and nondefense spending by 4.4 percent. At the state and local level, spending is expected to grow by 1.5 percent.
China’s Slowdown
The economic situation in China is a major concern for the current global economy. The resolution of China’s economic
slowdown or its continuance will impact worldwide growth in the coming year. China now has the largest economy in the
world, with a purchasing power parity GDP of $17.2 trillion in 2014 (compared to $16.6 trillion for the U.S.), even though
China’s GDP per capita was only $8 thousand in 2014 (compared to $55 thousand for the U.S.). It is unsurprising then that
China’s slowdown and shift away from manufacturing and toward services should be felt throughout the world. On January
4, 2016, Chinese markets reopened for the year and subsequently shut down after a seven percent drop in the stock market.
A repeat of this event happened on January 7. Clearly, the Chinese market will continue to contract in early 2016. What is
causing this slowdown and how will it impact the U.S.?
From 2002 to 2011, China enjoyed GDP growth of at least 9 percent per year including peaks of 14 percent. However, in
2012 growth fell to 7.7 percent and growth is expected to have fallen to 6.5 percent in 2015. A primary cause of this slowing
growth is China’s aging population. China ascended to prominence in the global marketplace because of its large supply of
labor and subsequently low manufacturing costs. Once the generation born under the One Child Policy matured, that labor
supply became constrained. Now, with a more slowly growing labor force, wages are rising and a low-cost manufacturing
model for China is no longer viable (Kessler & Murray, 2015).
The Chinese government is aware of this and the economy is intentionally being shifted away from manufacturing to
services. This shift is viewed by many as necessary to China’s economic development and is crucial to it transitioning to an
economy fostered by domestic consumption and not by investment. The transition to a more consumption-dominant economy
is already playing out: the International Monetary Fund estimates that in 2014 consumption contributed 0.1 percentage point
more to China’s GDP than investment did (International Monetary Fund, 2015). Regardless of how necessary this transition
may be, it remains a time of slowed growth and new vulnerabilities within the economy.
The necessity of a lessening dependence on investment was made clear by the contraction of China’s real estate sector.
China’s real estate bubble deflated and prices fell by 6 percent. The popping of the real estate bubble contributes to China’s
economic slowdown on its own, but that is not where its impact on the slowdown stopped. China’s local governments had
a large stake in real estate: they had been selling off local lands or leveraging them. Falling real estate prices also forced
local governments to stop overleveraging and begin investing less, further contributing to the economic slowdown (Kessler &
Murray, 2015).
In addition to all of this, China devalued its currency twice in the past year: once in summer 2015 and again in early 2016.
China is attempting to boost its faltering economy by depreciating its currency, like many other nations in the aftermath of the
Great Recession. However, this has only increased market fragility, since investors now fear that the currency will be
continued on page 14

2016 TENNESSEE ECONOMIC REPORT | 1514 | 2016 TENNESSEE ECONOMIC REPORT
CHAPTER 1 | The U.S. Economy
1.3. The U.S. Forecast, continued
International TradeThe global economy is expected to continue
to move at a sluggish pace, with recessions or slowdowns in many countries. Few of these nations are significant trading partners with the U.S., but the comparably robust U.S. recovery and U.S. dollar (which is expected to continue appreciating until mid-2016) mean that imports are expected to rise much faster than exports. In addition, the Chinese yuan was devalued again in early 2016, continuing its impact of driving down the cost of Chinese goods for exporters and driving up the cost for goods imported into China, including commodities and raw materials.
Inflation-adjusted exports of goods and services are projected to grow by 2.3 percent in 2016 compared to 1.0 percent in 2015. Exports of capital goods excluding automobiles are expected to continue shrinking by 1.6 percent compared to a decrease of 2.8 percent in 2015. Imports are expected to record much faster growth than exports, 4.9 percent in 2016 compared to 5.0 percent in 2015. Imports of petroleum products
are expected to be particularly strong in the wake of low prices: petroleum product imports are expected to grow by 11.1 percent in 2016 compared to 2.1 percent in 2015.
Inflation and PricesInflation is expected to remain low in 2016
with consumer prices expected to increase by only 1.2 percent. This increase is higher than the low inflation of 0.1 percent experienced in 2015, but lower than in any other year since 2009. Consumer energy prices are expected to continue falling and decrease by 7.6 percent in 2016. Oil prices are expected to continue falling into the first quarter of 2016 to $38.48 per barrel but then bounce back and reach $55.52 per barrel in inflation-adjusted terms.
By 2017, inflation is expected to reach 2.6 percent, hitting the Fed’s target range for the first time since 2012. Consumer energy prices are also expected to rise by 8.6 percent, ending a four-year period of price declines.
continued from page 13
devalued further. The Chinese government is now faced with a slowdown with multiple causes. On a global stage, China’s
slowdown is rippling through the world economy. The shift away from manufacturing has lowered demand for commodities
and has exacerbated the drop in commodity prices worldwide. Further, the falling value of the yuan makes Chinese imports
more expensive. Trading partners that China imports commodities from – Brazil, Canada, and Russia – are feeling the direct
impact, contributing to recessions in these countries.
It remains to be seen how China will affect the global economy in 2016 and 2017. On the positive side, the U.S. economy
has limited direct exposure to China in terms of trade. In addition, falling commodity prices have translated into lower costs
of production for producers and importantly lower gasoline prices for consumers. The downside risk depends on the degree
to which China’s slowdown spreads through emerging markets and commodity-exporting nations. Some economies, like
Japan, do have considerable direct exposure to the Chinese slowdown. The best bet at this time is a further slowdown in
China, coupled with ongoing market instability, but sufficient global strength to ward off recession.
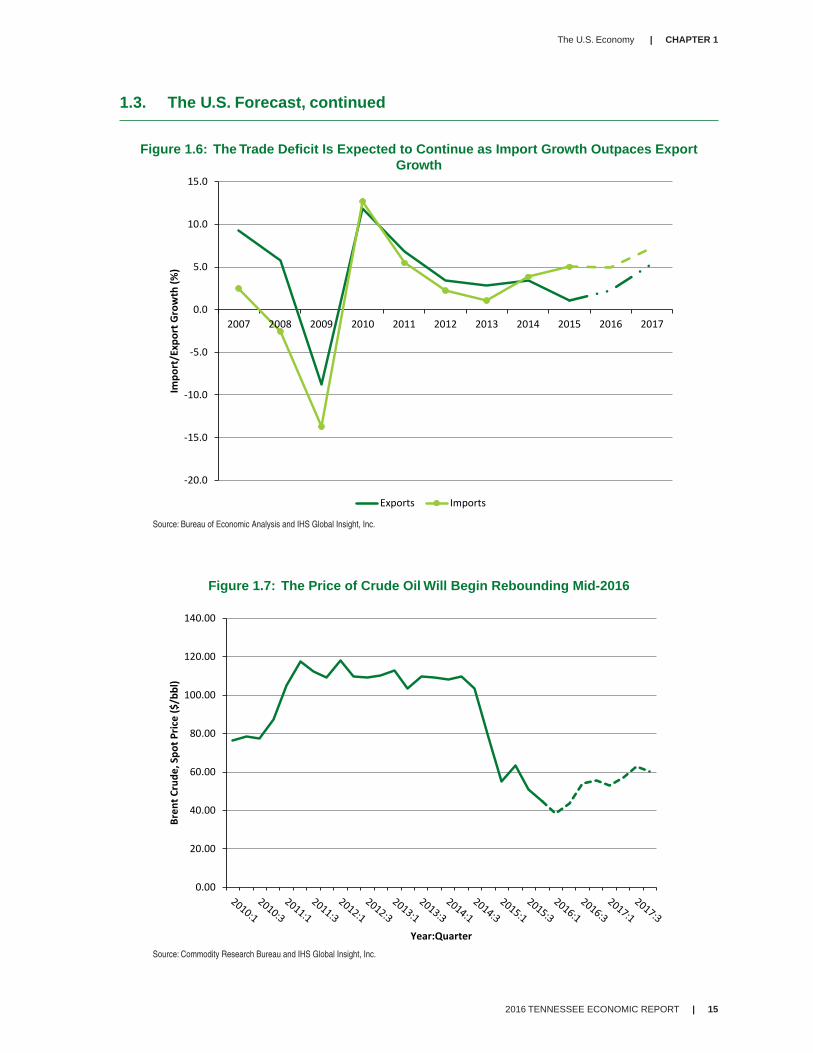
2016 TENNESSEE ECONOMIC REPORT | 1514 | 2016 TENNESSEE ECONOMIC REPORT
The U.S. Economy | CHAPTER 1
1.3. The U.S. Forecast, continued
Source: Bureau of Economic Analysis and IHS Global Insight, Inc.
Figure 1.6: The Trade Deficit Is Expected to Continue as Import Growth Outpaces Export Growth
-20.0
-15.0
-10.0
-5.0
0.0
5.0
10.0
15.0
2007 2008 2009 2010 2011 2012 2013 2014 2015 2016 2017
Impo
rt/E
xpor
t Gro
wth
(%)
Exports Imports
0.00
20.00
40.00
60.00
80.00
100.00
120.00
140.00
Bren
t Cru
de, S
pot P
rice
($/b
bl)
Year:QuarterSource: Commodity Research Bureau and IHS Global Insight, Inc.
Figure 1.7: The Price of Crude Oil Will Begin Rebounding Mid-2016

2016 TENNESSEE ECONOMIC REPORT | 1716 | 2016 TENNESSEE ECONOMIC REPORT
1.3. The U.S. Forecast, continued
Inflation Expectations
In the past year, the U.S. economy experienced very low rates of inflation. The Consumer Price Index (CPI), the most
familiar measure of inflation, only rose by 0.1 percent in 2015. Core-CPI, which excludes energy and food prices (two
sectors known to have price volatility), rose by 1.8 percent, still below the Fed’s benchmark of 2.0 percent inflation. Falling
gasoline and commodity prices, low rates of wage increase, and a strong dollar are all contributing to these low inflation
rates. How inflation behaves in the next year is dependent on all of these factors, and none of them have a clear-cut path.
Gasoline prices are expected to continue falling in early 2016 but begin recovering mid-year. By 2017, gasoline prices
are expected to be $58 per barrel compared to $54 per barrel in 2015. This rebound is contingent on increased oil demand
(spurred on by low prices) outpacing supply. If this happens, prices will begin to increase so that the market can return to
equilibrium. The ongoing global slowdown raises some question about the vitality of demand in the near term and whether
prices will in fact tick back up. As this report goes to press, there is an increased likelihood of still lower gasoline prices.
The path for commodity prices is also tricky since much of their fall has been caused by the global slowdown. As nations’
economies slow, they demand fewer commodities. Lower demand then drives prices downward. This situation is aggravated
because supply had risen during recent years to match increased demand as China’s economy expanded at a booming
pace each year. With a slowing Chinese economy, the commodities market faced a higher supply than usual and lower
demand than anticipated, which led to commodity prices spiraling down to levels not seen since the Great Recession. The
resolution or continuance of the global slowdown will determine how commodity prices behave in 2016 and beyond. The
global slowdown is predicted to continue through 2016; likewise, commodity prices are predicted to remain depressed
through 2016 as well. Low commodity and gasoline prices drive overall prices downward because they are such an important
element of the costs of production.
Additionally, as other economies slow and the U.S. economy expands, the U.S. dollar appreciates relative to other
currencies. As the dollar strengthens, U.S. exports become more expensive and U.S. imports become less expensive.
To exacerbate this state of affairs, many nations that are experiencing slowed growth are responding by devaluing their
currency. This drives the U.S. dollar’s value up further in relative terms and makes imports from those nations even cheaper.
These cheaper import prices also depress inflation. And, like low commodity prices, cheaper imports are expected to
continue into 2016 as the global slowdown lingers.
Finally, low levels of wage growth have put downward pressure on inflation by helping avert a wage-cost spiral. This low
wage growth is tied to a labor market with slack and the low levels of productivity growth seen since the end of the Great
Recession. In 2016, productivity is expected to increase by 1.5 percent compared to 0.7 percent in 2015. There is already
small evidence of upward pressure on wages: hourly wages experienced higher growth rates at the end of 2015 than at its
beginning. Lessening slack in the labor market will also help push inflation upward.
In addition to all these factors, it is important to remember inflation expectations impact inflation itself. Inflation
expectations can create environments where expectations become reality: if firms expect high rates of inflation in the next
period, they may increase their current period demand in order to take advantage of relatively cheaper current period prices,
which in turn will drive prices up.
Consumer surveys in 2015 point to consumers’ inflation expectations falling as 2015 wound to a close. The Survey of
Consumer Finances revealed that consumers’ three-year inflation expectations fell 0.1 percentage points to 2.8 percent from
the October survey to the November survey (Sajdak, 2015).
Janet Yellen, the Chair of the Fed’s Board of Governors, points out that short-run consumer inflation expectations are
often responsive to current inflation levels (Yellen, 2015), and short-run business forecasts may be more indicative of future
short-run inflation. Business inflation expectations (as computed by the Federal Reserve of Atlanta) increased a tenth of
a percentage point from the November survey to the December survey. Surveyed businesses expect to see 1.9 percent
inflation in 2016. Global Insight, Inc., predicts that the core-CPI will reach 2.0 percent by 2016, and overall CPI will reach 2.0
by 2017. This forecast is dependent on rising wages, rising gasoline prices, and the continuation of the global slowdown.

2016 TENNESSEE ECONOMIC REPORT | 1716 | 2016 TENNESSEE ECONOMIC REPORT
The U.S. Economy | CHAPTER 1
Rising employment and consumption were the basis for the U.S. economy’s strength in 2015. It is noteworthy that the national economy performed well in the face of strong headwinds from the global economy. Continued growth will depend on how the global slowdown plays out, commodity and gasoline price trends, the resilience of financial markets, and consumers’ responses to the aforementioned.
In the pessimistic scenario (20 percent probability), the U.S. stock market weakens appreciably in 2016 and the global slowdown continues unabated. Foreign investors buy U.S. securities, driving up the value of the dollar further. The dollar’s appreciation makes U.S. goods more expensive and demand for U.S. manufacturing falls precipitously. These events drive down consumer
and business confidence and thus job creation. The economy contracts and home sales decline. The Fed slows the rate at which it increases interest rates.
In the optimistic scenario (15 percent possibility), the global slowdown relents. Demand for gasoline outpaces supply, thus driving up prices. Structural changes occur in other economies that improve the fundamentals of the global economy. In addition to these positive external events, the stock market recovers from its correction in 2015. Credit conditions soften, which leads to more residential and nonresidential investment. Consumer confidence and spending rise, and the economy speeds up the pace of job creation. The Fed quickens the rate at which it increases interest rates.
1.4. Alternative Scenarios
• Inflation-adjusted GDP will grow at a healthy 2.7 percent rate in 2016, following 2.4 percent growth in 2015.
• The Fed will continue raising interest rates. The Federal Funds rate is expected to reach 1.3 percent by the fourth quarter of 2016, and the 30-Year Fixed Mortgage rate is expected to reach 4.6 percent.
• Consumer spending will continue to bolster the economy and grow by 3.0 percent in 2016 in response to growing disposable income and ongoing job creation.
• Inflation will remain low at 1.2 percent, due to falling energy prices.
• The recovery of the housing market will continue and residential investment will increase by 9.5 percent.
• Exports and imports will continue diverging as the U.S. economy remains strong, the dollar appreciates, and the global economy stumbles. Exports are expected to increase by 2.3 percent while imports increase by 4.9 percent.
1.5. Forecast Summary and Conclusions

2016 TENNESSEE ECONOMIC REPORT | 1918 | 2016 TENNESSEE ECONOMIC REPORT
CHAPTER 1 | The U.S. Economy
1.6. References
Arias, M. A., & Wen, Y. (2015). Recovery from the Great Recession has varied around the world. The Regional Economist: Federal Reserve Bank of St. Louis, 23(4), 10-11.
International Monetary Fund. (2015). IMF Country Report: People’s Republic of China. Retrieved January 13, 2016 from https://www.imf.org/external/pubs/ft/scr/2015/cr15234.pdf.
Kessler, L. & Murray, M. (2015). Domestic economy remains strong in the face of the global slowdown. Report for Tennessee Valley Authority.
Sajdak, K. (2015) Consumers anticipate better labor market, mixed inflation outcomes. Liberty Street Economics: Federal Reserve Bank of New York. Retrieved January 12, 2016 from https://www.newyorkfed.org/newsevents/news/research/2015/an151109.
Wen, Y., & Wu, J. (2014). Withstanding the Great Recession like China. Working Paper, Federal Reserve Bank of St. Louis.
Yellen, J.L. (2015). The economic outlook and monetary policy. Speech given for the Economic Club of Washington, D.C. Retrieved January 12, 2016 from http://www.federalreserve.gov/newsevents/speech/yellen20151202a.htm.

2016 TENNESSEE ECONOMIC REPORT | 1918 | 2016 TENNESSEE ECONOMIC REPORT
The Tennessee Economy: Short-Term Outlook | CHAPTER 2
CHAPTER 2: THE TENNESSEE ECONOMY: SHORT-TERM OUTLOOK
2.1. Introduction
Economic growth in Tennessee has been similar to that of the U.S. in recent years. Both the state and nation have now enjoyed more than six years of growth since the end of the Great Recession. In Tennessee, inflation-adjusted gross domestic product (GDP) expanded by 2.4 percent in 2015 and is projected to advance an additional 2.3 percent in 2016. Similarly, the U.S. economy grew by 2.4 percent in 2015 and growth is projected to accelerate to 2.7 percent in 2016.
In the U.S. there were 292,000 new jobs created last December and 2.7 million new jobs for 2015 as a whole. This was below the 3.1 million new jobs created in 2014, but outpaced job creation for the three years prior (2011-2013). Significant employment growth can also be seen in the Tennessee labor market, where nonfarm
employment increased by 1.9 percent in 2015, representing an additional 54,600 new jobs. Manufacturing employment also expanded by 1.9 percent in 2015, outpacing the 1.1 percent rate of growth seen in the nation. After recording a 6.5 percent unemployment rate during the first quarter of 2015, Tennessee’s unemployment rate finally fell below 6 percent during the second quarter – it had been seven years since the state last registered an unemployment rate under 6 percent (Tennessee’s unemployment rate was 5.7 percent during the first quarter of 2008.) In the second half of 2015, Tennessee’s unemployment hovered between 5.6 and 5.7 percent. The state unemployment rate is projected to fall to 5.5 percent for 2016 which is slightly above the nation’s 4.9 percent unemployment rate projected for 2016. In 2015,
In this chapter—
2.1. Introduction
2.2. The Current Economic Environment The Labor Market Income and Taxable Sales
2.3. Fiscal Update Federal Government State Finances across the Nation The Southeastern States and Tennessee
2.4. Short-Term Outlook
2.4. Tennessee Forecast at a Glance
2.5. Tennessee’s Agricultural and Forest Industries and Rural Economy Introduction Agriculture and Primary Forestry Food, Fiber, and Forestry Manufacturing in Tennessee Rural Economies and Well-Being Governor’s Rural Challenge Summary References Used

2016 TENNESSEE ECONOMIC REPORT | 2120 | 2016 TENNESSEE ECONOMIC REPORT
CHAPTER 2 | The Tennessee Economy: Short-Term Outlook
nominal personal income in Tennessee grew at a faster pace than in the U.S., expanding by 4.7 percent compared to 4.5 percent growth for the nation. State personal income growth will accelerate to 4.8 percent in 2016, compared to only 4.2 percent growth projected for the nation. For nonfarm employees, the average annual wage
was $47,219 in 2015, representing a 3.1 percent increase over the previous year, outstripping the rate of growth in inflation. Nominal taxable sales in Tennessee expanded by 6.2 percent in 2015, and are projected to grow an additional 4.7 percent in 2016.
2.1. Introduction, continued
2.2. The Current Economic Environment
The Labor MarketTennessee nonfarm employment grew at a
healthy 1.9 percent rate during 2015. This was slightly slower than the 2.1 percent growth rate registered one year prior. Job growth in Tennessee was also slower than national employment growth of 2.1 percent for 2015. Tennessee nonfarm employment growth started off slowly in 2015, growing by only 0.5 percent in the first quarter before rebounding to 2.0 percent growth (on a seasonally-adjusted basis) for both the second and third quarters. Similar to what occurred in 2014, the slow start to 2015 was largely due to a cold and snowy winter. For the year, nonfarm employment totaled 2,870,733 which is only slightly above the pre-recession peak of 2,797,781 in 2007. It is rather remarkable that employment in 2015 was so close to the level seen eight years earlier.
In 2015, nonfarm employment growth was led by the leisure and hospitality sector which grew by 3.3 percent. Employment in the natural resources, mining, and construction sector expanded by 3.2 percent, and job growth of 2.8 percent was seen in the professional and business services sector. Three sectors experienced job losses in 2015, including the information sector (-1.3 percent), other services (-1.0 percent), and the federal government (-1.1 percent). This marks the second consecutive year of job losses in Tennessee’s information sector, and the fifth straight year of federal government job losses in Tennessee.
Manufacturing employment in Tennessee grew by 1.9 percent in 2015, outpacing the nation’s 1.1
percent growth rate. This was the fifth consecutive year of manufacturing employment growth for the state following more than a decade of setbacks. Within manufacturing, employment in the durable goods manufacturing sector grew by 3.0 percent in 2015, while nondurable goods manufacturing employment grew by only 0.1 percent. Using the most recent data available, employment growth by county is presented in Figure 2.1. From June 2014 to June 2015, statewide employment grew by 2.8 percent. During this period there were 80 counties that reported employment gains, 44 of which outgained the state average of 2.8 percent. Among the counties to see employment growth, two enjoyed gains that exceeded 13 percent: Van Buren County reported employment growth of 15.3 percent and Pickett County experienced growth of 13.7 percent. By contrast there were 13 counties that faced employment contractions between June 2014 and June 2015. Job losses were the largest in Wayne County at -7.2 percent, followed by Lake County at -4.6 percent. Job growth was generally stronger in and around the state’s metropolitan areas.
Tennessee’s civilian labor force, which includes employed people and unemployed people who are actively seeking work, increased by 2.3 percent in 2015. This was largely driven by a 3.1 percent increase in the number of employed people in Tennessee. The number of unemployed people also fell by 8.0 percent in 2015 and the labor force participation rate (i.e. the percentage of the adult population in the civilian labor force) grew

2016 TENNESSEE ECONOMIC REPORT | 2120 | 2016 TENNESSEE ECONOMIC REPORT
The Tennessee Economy: Short-Term Outlook | CHAPTER 2
2.2. The Current Economic Environment, continued
by 1.1 percent, indicating that more Tennesseans found jobs in 2015 than in 2014. This was the first time since 2010 that Tennessee’s labor force participation rate increased. However, at 57.7 percent, the low labor force participation rate is indicative of ongoing problems in the labor market, paralleling the situation for the national economy (see Chapter 1). Figure 2.2 shows that the labor force participation rates for both the state and the nation have been declining for the last decade, however this trend has been much more pronounced in Tennessee. These declines can be explained, at least in part, by an increase in retirees as the baby boom generation ages out of the workforce, but this number also likely encapsulates discouraged workers who have quit searching for a job. The more serious problem in Tennessee is likely tied to the fact that the state has a more poorly educated workforce than the nation as a whole, as well as a less healthy adult population. Both educational attainment and health status are correlated with labor market participation. It remains to be seen if the turnaround in the labor force participation rate in 2015 is part of a new trend.
Tennessee’s unemployment rate averaged 5.9 percent in 2015, which is higher than the 5.3 percent unemployment rate for the nation. Between 2014 and 2015 Tennessee’s annual unemployment rate has fallen by 0.7 percentage
points, while the U.S. unemployment rate dropped 0.9 percentage points. During the first quarter of 2015 Tennessee’s unemployment rate was pegged at 6.5 percent, but then dropped to 5.8 percent in the second quarter and 5.6 percent by the fourth quarter. This fourth quarter unemployment rate of 5.6 percent was Tennessee’s lowest unemployment rate since the fourth quarter of 2007.
Figure 2.3 presents the seasonally-adjusted unemployment rates of all southeastern states for the month of December. Tennessee’s unemployment rate of 5.6 percent was slightly above the southeast average of 5.5 percent but was lower than 5 of the 12 southeastern states. The highest unemployment rate in the region was in Mississippi (6.4 percent), followed by West Virginia (6.3 percent); the lowest rate in the region was in Virginia (4.2 percent).
Figure 2.4 presents non-seasonally adjusted county-level unemployment rates for November 2015. There were three counties that registered an unemployment rate above 9.0 percent – Hancock County (9.9 percent), Lauderdale County (9.4 percent) and Scott County (9.3 percent). While the unemployment rates in these counties were well above the non-seasonally adjusted state and national averages of 5.4 percent and 4.8 percent respectively, all three of these counties had reported unemployment rates above 10.5 percent one year prior so they are at least trending in the
0.0% or loss
0.1% to 2.7%
2.8% to 6.4%
6.5% or greater
Employment Gain/Loss
Source: U.S. Bureau of Labor Statistics, Quarterly Census of Employment and Wages.
Figure 2.1: Over Eighty Percent of Tennessee Counties Experienced Job Growth in the Second Quarter of 2015
(Year-Over-Year Growth in Total Covered Employment, June 2014- June 2015)
Tennessee: 2.8%

2016 TENNESSEE ECONOMIC REPORT | 2322 | 2016 TENNESSEE ECONOMIC REPORT
CHAPTER 2 | The Tennessee Economy: Short-Term Outlook
2.2. The Current Economic Environment, continued
Figure 2.2: The Labor Force Participation Rate Remains Low in Tennessee and in the Nation
Source: Bureau of Labor Statistics and CBER-UT.
Figure 2.3: Tennessee’s Monthly Unemployment Rate Is Near the Middle of the Pack Among Southeast States (December 2015)
Source: Bureau of Labor Statistics.
6.4% 6.3% 6.2% 6.1%
5.6% 5.6% 5.5% 5.5% 5.5%5.3%
5.0% 5.0%4.8%
4.2%
0.0%
1.0%
2.0%
3.0%
4.0%
5.0%
6.0%
7.0%
Une
mpl
oym
ent R
ate
(%)
54.0
56.0
58.0
60.0
62.0
64.0
66.0
2000 2001 2002 2003 2004 2005 2006 2007 2008 2009 2010 2011 2012 2013 2014 2015
Labo
r For
ce P
artic
ipat
ion
Rate
(%)
TN U.S.

2016 TENNESSEE ECONOMIC REPORT | 2322 | 2016 TENNESSEE ECONOMIC REPORT
The Tennessee Economy: Short-Term Outlook | CHAPTER 2
2.2. The Current Economic Environment, continued
right direction. Conversely, there were 24 counties with unemployment rates below the state average of 5.4 percent. The lowest non-seasonally-adjusted unemployment rate in the state was in Williamson County (3.9 percent) followed by Rutherford County and Davidson County both at 4.2 percent. Each of these county’s rates were below the national average of 4.8 percent.
Income and Taxable SalesNominal personal income in Tennessee grew
by 4.7 percent in 2015, which was slightly faster than the 4.5 percent growth rate registered for the nation. Personal income growth was driven largely by proprietors’ income which increased by 5.1 percent and wages and salary income which grew by 5.0 percent. Transfer payments were up 4.8 percent, and rent, interest, and dividend income increased by 4.1 percent. Nominal personal income per capita grew to $41,603 in 2015, representing a 3.6 percent increase over 2014.
Figure 2.5 presents per capita personal income in current dollars for all southeastern states during the third quarter of 2015. At $42,215 per person, Tennessee ranked fourth among the 12 southeast states. Per capita personal income in Tennessee was slightly below the southeast average of $42,544 and
well below the national average of $48,051. Among the southeastern states, Virginia had the highest per capita personal income ($52,498) and was the only southeastern state where per capita income was above the national average. Per capita personal income was lowest in Mississippi ($35,678) followed by West Virginia ($37,228).
Figure 2.6 reports per capita personal income in current dollars across all Tennessee counties in 2014 (the most recent year for which data are available.) Williamson County continues to have the highest per capita personal income at $71,761 and eclipses per capita income in even the second highest county (Davidson County at $54,307). There were only four Tennessee counties with per capita income above the national average of $46,049 – Williamson, Davidson, Trousdale, and Fayette. Including the aforementioned, there were only four additional counties where per capita income was above the state average of $40,457 – Shelby, Hamilton, Knox, and Wilson. Conversely, per capita income was lowest in Bledsoe County at $21,432, which is less than 50 percent of the national average.
Taxable sales continue to grow rapidly in Tennessee. Compared to a high base where taxable sales increased by 4.9 percent in 2014, taxable sales
Figure 2.4: Eighty-Seven Percent of Tennessee Counties are Reporting Unemployment Rates Above the National Average
(November 2015)
Tennessee: 5.4%United States: 4.8%
Note: Not Seasonally AdjustedSource: U.S. Bureau of Labor Statistics.
4.8% to 5.3%
Less than 4.8%
5.4% to 6.5%
6.6% to 7.7%
7.8% or greater
Non-Seasonally Adjusted Rate

2016 TENNESSEE ECONOMIC REPORT | 2524 | 2016 TENNESSEE ECONOMIC REPORT
CHAPTER 2 | The Tennessee Economy: Short-Term Outlook
2.2. The Current Economic Environment, continued
Source: Bureau of Economic Analysis.
Figure 2.5: Tennessee’s Per Capita Personal Income (in Current Dollars) Is Slightly Below the Southeast Average, 2015Q3
35,678
37,228
38,265
39,115
39,289
39,448
40,791
41,114
42,215
42,544
43,255
44,486
48,051
52,498
$0 $10,000 $20,000 $30,000 $40,000 $50,000 $60,000
Mississippi
West Virginia
South Carolina
Alabama
Kentucky
Arkansas
Georgia
North Carolina
Tennessee
Southeast
Louisiana
Florida
United States
Virginia
Figure 2.6: Per Capita Personal Income Is Lower Than the National Average in Most Tennessee Counties
(2014 Per Capita Personal Income in Current Dollars)
Tennessee: $40,457United States: $46,049
Source: Bureau of Economic Analysis.
$27,000 to $33,250
$33,251 to $40,450
$40,451 to $46,048
Greater than $46,048
Less than $27,000

2016 TENNESSEE ECONOMIC REPORT | 2524 | 2016 TENNESSEE ECONOMIC REPORT
The Tennessee Economy: Short-Term Outlook | CHAPTER 2
grew by an additional 6.2 percent in 2015. On a fiscal year basis, nominal taxable sales grew by 6.1 percent in FY 2015. For a second consecutive year taxable sales growth was strongest in the hotels and motels sector, expanding 12.1 percent in 2015. Light vehicle sales also showed very strong growth, as taxable sales from auto dealers grew by 11.3 percent in 2015. This is likely a continuation of consumer efforts to satisfy the pent-up demand for automobiles since the end of the Great Recession. Lower gasoline prices have also sparked resurgence in light truck sales. In the U.S., light truck sales
reached 9.84 million in 2015, which was the first time in ten years that light truck sales surpassed 9.0 million units.
Building permits (authorizing construction of new privately-owned housing units) in the U.S. and Tennessee continue to grow. For the U.S., building permits have now grown for five straight years (2010 through 2014,) while Tennessee has experienced three consecutive years of growth (2012 through 2014). However, permitting activity is still well below the pre-recession peaks for both Tennessee and the nation (see Figure 2.7).
2.2. The Current Economic Environment, continued
Figure 2.7: Building Permits Are Still Well Below the Pre-Recession Peaks of 2005
Source: Census Bureau Building Permits Survey Data, U.S. Census Bureau.
500,000
700,000
900,000
1,100,000
1,300,000
1,500,000
1,700,000
1,900,000
2,100,000
10,000
15,000
20,000
25,000
30,000
35,000
40,000
45,000
50,000
2001 2002 2003 2004 2005 2006 2007 2008 2009 2010 2011 2012 2013 2014
U.S
. Tot
al P
erm
its
Tenn
esse
e To
tal P
erm
its
TN U.S.

2016 TENNESSEE ECONOMIC REPORT | 2726 | 2016 TENNESSEE ECONOMIC REPORT
CHAPTER 2 | The Tennessee Economy: Short-Term Outlook
2.3. Fiscal Update
Federal GovernmentThe federal budget deficit is expected to increase
from $438.9 billion in 2015 to $500.5 billion in 2016 (see Figure 2.8). This will be the first time since 2011 that the deficit has grown. Despite this increase, the federal deficit is still less than half of its 2011 counterpart. The increased deficit is due to slightly higher government spending, largely attributable to increased Medicare and to a larger extent Medicaid spending. A bipartisan budget accord reached before the first of the year will lead to a larger deficit but reduce the likelihood of a crippling federal government shutdown.
In 2015 the national debt was $18.5 trillion, which is projected to grow to $19.4 trillion in 2016. The amount of debt held by the public peaked at 75.2 percent of GDP in 2014, fell slightly to 74.4 percent of GDP in 2015, and is expected to rise to 74.8 percent in 2016. By comparison, this figure was only 54.4 percent in 2009 and closer to 35.0 percent in 2007. Growing national debt may hinder long-term economic growth by crowding out private sector investment and leaves policymakers
with restricted options if faced with an unexpected economic downturn.
State Finances Across the NationStates collected a total of $912.4 billion in tax
revenues during fiscal year 2015 (July 2014 – June 2015), representing a 5.6 percent increase over FY 2014. All major tax revenue categories grew in FY 2015. Personal income tax revenues saw the largest growth, expanding by 9.0 percent over FY 2014. Corporate income tax revenues advanced 6.2 percent, sales tax revenues grew by 5.4 percent, and motor vehicle fuel tax revenues increased by 2.4 percent.1
State tax revenues grew in all regions of the nation in FY 2015. The Far West region experienced the strongest growth in FY 2015, with revenues expanding by 8.9 percent, followed by the Rocky Mountain region at 7.3 percent. Growth
1Dadayan, Lucy & Boyd, Donald J. (November 2015). “Another Strong Tax Quarter for the States, But Less Promising Forecasts for Fiscal 2016.” The Nelson A. Rockefeller Institute of Government. Retrieved from http://www.rockinst.org/pdf/government_finance/state_revenue_report/2015-11-16-SRR_101.pdf.
1,500
2,000
2,500
3,000
3,500
4,000
4,500
2006 2007 2008 2009 2010 2011 2012 2013 2014 2015 2016* 2017* 2018*
Receipts Deficit Outlays*2016, 2017, and 2018 are projectionsSource: IHS Global Insights Inc.
Figure 2.8: The Federal Deficit Will Increase Slightly in 2016
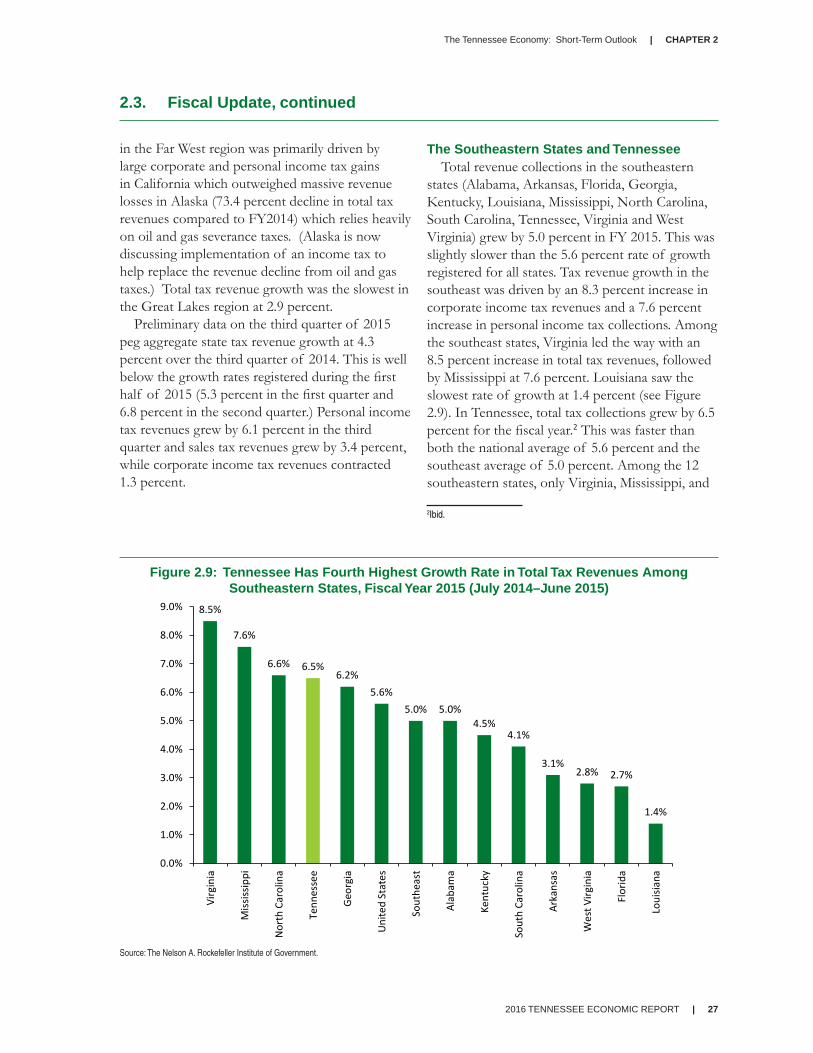
2016 TENNESSEE ECONOMIC REPORT | 2726 | 2016 TENNESSEE ECONOMIC REPORT
The Tennessee Economy: Short-Term Outlook | CHAPTER 2
2.3. Fiscal Update, continued
in the Far West region was primarily driven by large corporate and personal income tax gains in California which outweighed massive revenue losses in Alaska (73.4 percent decline in total tax revenues compared to FY2014) which relies heavily on oil and gas severance taxes. (Alaska is now discussing implementation of an income tax to help replace the revenue decline from oil and gas taxes.) Total tax revenue growth was the slowest in the Great Lakes region at 2.9 percent.
Preliminary data on the third quarter of 2015 peg aggregate state tax revenue growth at 4.3 percent over the third quarter of 2014. This is well below the growth rates registered during the first half of 2015 (5.3 percent in the first quarter and 6.8 percent in the second quarter.) Personal income tax revenues grew by 6.1 percent in the third quarter and sales tax revenues grew by 3.4 percent, while corporate income tax revenues contracted 1.3 percent.
The Southeastern States and TennesseeTotal revenue collections in the southeastern
states (Alabama, Arkansas, Florida, Georgia, Kentucky, Louisiana, Mississippi, North Carolina, South Carolina, Tennessee, Virginia and West Virginia) grew by 5.0 percent in FY 2015. This was slightly slower than the 5.6 percent rate of growth registered for all states. Tax revenue growth in the southeast was driven by an 8.3 percent increase in corporate income tax revenues and a 7.6 percent increase in personal income tax collections. Among the southeast states, Virginia led the way with an 8.5 percent increase in total tax revenues, followed by Mississippi at 7.6 percent. Louisiana saw the slowest rate of growth at 1.4 percent (see Figure 2.9). In Tennessee, total tax collections grew by 6.5 percent for the fiscal year.2 This was faster than both the national average of 5.6 percent and the southeast average of 5.0 percent. Among the 12 southeastern states, only Virginia, Mississippi, and
2Ibid.
8.5%
7.6%
6.6% 6.5%6.2%
5.6%5.0% 5.0%
4.5%4.1%
3.1%2.8% 2.7%
1.4%
0.0%
1.0%
2.0%
3.0%
4.0%
5.0%
6.0%
7.0%
8.0%
9.0%
Virg
inia
Miss
issip
pi
Nor
th C
arol
ina
Tenn
esse
e
Geo
rgia
Uni
ted
Stat
es
Sout
heas
t
Alab
ama
Kent
ucky
Sout
h Ca
rolin
a
Arka
nsas
Wes
t Virg
inia
Flor
ida
Loui
siana
Source: The Nelson A. Rockefeller Institute of Government.
Figure 2.9: Tennessee Has Fourth Highest Growth Rate in Total Tax Revenues Among Southeastern States, Fiscal Year 2015 (July 2014–June 2015)

2016 TENNESSEE ECONOMIC REPORT | 2928 | 2016 TENNESSEE ECONOMIC REPORT
CHAPTER 2 | The Tennessee Economy: Short-Term Outlook
2.3. Fiscal Update, continued
North Carolina enjoyed faster tax revenue growth than Tennessee
As of December 2015, Tennessee Department of Revenue tax collections have totaled $5,113.5 million for the fiscal year-to-date (August 2015 – December 2015), representing a $377.4 million or 8.0 percent increase over last fiscal year-to-date.
Tennessee tax revenue growth has largely been driven by sales tax revenues which are up $222.9 million or 7.1 percent, and franchise and excise tax revenues (corporate income taxes) which have expanded by $146.3 million or 23.8 percent compared to last fiscal year-to-date.
2.4. Short-Term Outlook
The short-term economic outlook for Tennessee calls for solid growth over the next three years. Output and personal income should continue to post healthy gains. Nonfarm employment growth in Tennessee will mimic national employment growth throughout the short-term forecast horizon, while state manufacturing employment will see modest gains. Tennessee’s unemployment rate will continue to trend downwards but remain above the national unemployment rate throughout the short-term forecast window.
Table 2.1 provides a summary of the short-term economic outlook for Tennessee and the nation. Nonfarm employment in Tennessee is projected to increase by 1.7 percent in 2016 and 1.3 percent in 2017. Nonfarm jobs are expected to grow at a similar pace for the nation. Most broad sectors of the Tennessee economy are projected to see employment growth in 2016 and 2017. In 2016, nonfarm job growth will be driven by a 2.8 percent expansion in the professional and business services sector and a 2.6 percent increase in the natural resources, mining, and construction sector’s workforce. Both the information and other services sectors will experience job losses in 2016. The information sector will face a 2.0 percent employment contraction, and employment in the other services sector will fall by 1.1 percent.
Manufacturing employment growth in Tennessee is expected to taper off in 2016. After increasing by 1.9 percent in 2015, manufacturing jobs will advance by 0.7 percent in both 2016 and 2017. As this report goes to press, there are signs of a deepening slowdown in the nation’s
manufacturing sector that could ripple across the state. It is too early to tell whether this recent slowdown is a sign of a fundamental shift in prospects for the manufacturing sector or simply a short-term shock.
Figure 2.10 shows that while manufacturing employment has grown since the Great Recession, employments levels are still well below those prior to the recession. Simultaneously, manufacturing output, as shown in Figure 2.11, has been trending upwards indicating that manufacturing productivity (output per worker) is on the rise. The number of manufacturing jobs in Tennessee will likely remain below pre-recession levels and revert to contraction before the end of the decade.
Employment in durable goods manufacturing is projected to grow by 1.5 percent in both 2016 and 2017. Within durable goods manufacturing, the transportation equipment sector will see the strongest employment gains, growing by 3.7 percent in 2016 and in 2017. Wood products manufacturing will also see job gains of 1.9 percent in 2016 and 1.6 percent in 2017. Conversely, employment in nonmetallic minerals manufacturing will contract in both 2016 and 2017, and computers and electronics, and miscellaneous durable goods manufacturing will face job losses in 2017.
Nondurable goods manufacturing will face job losses of 0.7 percent in 2016 and 0.8 percent in 2017. Among the broad sectors of nondurable goods manufacturing only food manufacturing and plastics and rubber manufacturing will avoid job losses over the next two years while the remaining
continued on page 31

2016 TENNESSEE ECONOMIC REPORT | 2928 | 2016 TENNESSEE ECONOMIC REPORT
The Tennessee Economy: Short-Term Outlook | CHAPTER 2
2.4. Short-Term Outlook, continued
Table 2.1: Selected U.S. and Tennessee Economic Indicators, Seasonally AdjustedTable 2.1: Selected U.S. and Tennessee Economic Indicators, Seasonally Adjusted
2015:3 2015:4 2016:1 2016:2 2016:3 2016:4 2017:1 2017:2 2017:3 2017:4 2018:1 2014 2015 2016 2017
US GDP (Bil2009$) SAAR……………………………………………...........................16414.0 16462.5 16586.4 16708.4 16844.5 16983.1 17096.3 17225.3 17338.9 17437.6 17567.0 15961.7 16346.8 16780.6 17274.5% Chg Prev Qtr SAAR………………………………………………………..................1.98 1.19 3.04 2.98 3.30 3.33 2.69 3.05 2.66 2.30 3.00 2.43 2.41 2.65 2.94% Chg Same Qtr Last Yr………………………………………………2.15 1.93 2.53 2.29 2.62 3.16 3.07 3.09 2.94 2.68 2.75 2.43 2.41 2.65 2.94
US GDP (Bil$) SAAR…………………………………………….......................................18060.2 18181.2 18391.4 18614.9 18860.4 19106.9 19318.4 19560.9 19794.5 20000.1 20259.9 17348.1 17951.1 18743.4 19668.4% Chg Prev Qtr SAAR………………………………………………………..................3.31 2.71 4.70 4.95 5.38 5.33 4.50 5.12 4.86 4.22 5.30 4.11 3.48 4.41 4.94% Chg Same Qtr Last Yr………………………………………………3.07 3.21 4.20 3.91 4.43 5.09 5.04 5.08 4.95 4.67 4.87 4.11 3.48 4.41 4.94
TN PERSONAL INCOME (MIL2009$) SAAR……..................................254215 257680 260384 262090 263075 264591 266717 268147 269586 271585 273120 242848 253482 262535 269009% Chg Prev Qtr SAAR………………………………………………………..................2.55 5.56 4.26 2.65 1.51 2.33 3.25 2.16 2.16 3.00 2.28 2.28 4.38 3.57 2.47% Chg Same Qtr Last Yr………………………………………………4.58 4.56 4.40 3.75 3.48 2.68 2.43 2.31 2.48 2.64 2.40 2.28 4.38 3.57 2.47
US PERSONAL INCOME (BIL2009$) SAAR………….............................14095 14224 14360 14435 14500 14604 14759 14879 14976 15100 15230 13468 14036 14475 14929% Chg Prev Qtr SAAR………………………………………………………..................3.76 3.73 3.88 2.10 1.80 2.90 4.33 3.28 2.65 3.35 3.49 2.98 4.22 3.12 3.14% Chg Same Qtr Last Yr………………………………………………4.41 3.98 3.61 3.36 2.87 2.67 2.78 3.07 3.29 3.40 3.19 2.98 4.22 3.12 3.14
TN PERSONAL INCOME (MIL$) SAAR……………………..........................278958 282614 285656 288832 292132 295513 298903 302294 305795 309386 312604 264965 277316 290533 304095% Chg Prev Qtr SAAR………………………………………………………..................3.84 5.35 4.37 4.52 4.65 4.71 4.67 4.62 4.71 4.78 4.22 3.74 4.66 4.77 4.67% Chg Same Qtr Last Yr………………………………………………4.85 4.89 5.27 4.52 4.72 4.56 4.64 4.66 4.68 4.69 4.58 3.74 4.66 4.77 4.67
US PERSONAL INCOME (BIL$) SAAR……………………..........................15468 15614 15750 15894 16073 16276 16502 16722 16933 17145 17390 14694 15360 15998 16825% Chg Prev Qtr SAAR………………………………………………………..................5.09 3.84 3.52 3.70 4.59 5.14 5.67 5.45 5.14 5.10 5.84 4.45 4.53 4.16 5.17% Chg Same Qtr Last Yr………………………………………………4.69 4.40 4.44 4.04 3.91 4.24 4.77 5.21 5.35 5.34 5.38 4.45 4.53 4.16 5.17
TN NONFARM JOBS (THOUS)……………………………………..........................2874.9 2900.1 2906.8 2914.1 2921.4 2929.6 2940.2 2950.6 2961.5 2972.7 2982.4 2816.1 2870.7 2918.0 2956.2% Chg Prev Qtr SAAR………………………………………………………..................1.97 3.57 0.92 1.01 1.01 1.13 1.45 1.42 1.49 1.53 1.30 2.08 1.94 1.65 1.31% Chg Same Qtr Last Yr………………………………………………1.79 2.00 2.10 1.85 1.62 1.02 1.15 1.25 1.37 1.47 1.43 2.08 1.94 1.65 1.31
US NONFARM JOBS (MIL)……………………………………………..........................142.2 142.9 143.6 144.1 144.6 145.1 145.6 145.9 146.4 146.8 147.2 139.0 141.9 144.3 146.2% Chg Prev Qtr SAAR………………………………………………………..................1.77 1.86 1.87 1.45 1.39 1.32 1.42 1.01 1.20 1.28 1.14 1.93 2.10 1.67 1.29% Chg Same Qtr Last Yr………………………………………………2.05 1.90 1.81 1.74 1.64 1.51 1.39 1.28 1.24 1.23 1.16 1.93 2.10 1.67 1.29
TN MFG JOBS (THOUS)……………………………………………………...................331.5 332.7 333.0 333.4 334.0 334.7 335.3 335.8 336.4 337.0 337.6 325.2 331.5 333.7 336.1% Chg Prev Qtr SAAR………………………………………………………..................1.00 1.53 0.37 0.41 0.71 0.85 0.73 0.68 0.62 0.80 0.70 2.13 1.93 0.68 0.71% Chg Same Qtr Last Yr………………………………………………1.74 1.17 0.60 0.78 0.75 0.58 0.67 0.74 0.72 0.71 0.70 2.13 1.93 0.68 0.71
US MFG JOBS (MIL)…………………………………………………….............................12.3 12.3 12.3 12.3 12.3 12.4 12.4 12.4 12.4 12.5 12.5 12.2 12.3 12.3 12.4% Chg Prev Qtr SAAR………………………………………………………..................-0.05 -0.41 -0.51 -0.40 0.10 1.94 1.36 -0.02 0.80 1.11 0.71 1.41 1.12 -0.14 0.85% Chg Same Qtr Last Yr………………………………………………1.04 0.35 -0.17 -0.34 -0.31 0.28 0.74 0.84 1.02 0.81 0.65 1.41 1.12 -0.14 0.85
TN UNEMPLOYMENT RATE (%)…………………………….............................5.7 5.6 5.6 5.6 5.5 5.5 5.5 5.4 5.4 5.4 5.4 6.6 5.9 5.5 5.4
US UNEMPLOYMENT RATE (%)………………………………...........................5.2 5.0 5.0 4.9 4.9 4.9 4.9 4.9 4.9 4.9 4.9 6.2 5.3 4.9 4.9
CHAINED PRICE INDEX, GDP (2009=100.0)……………...........................………..........………..........………..........110.0 110.4 110.9 111.4 112.0 112.5 113.0 113.6 114.2 114.7 115.3 108.7 109.8 111.7 113.9% Chg Prev Qtr SAAR………………………………………………………..................1.32 1.44 1.61 1.92 2.02 1.93 1.76 2.00 2.14 1.88 2.23 1.64 1.04 1.70 1.94% Chg Same Qtr Last Yr………………………………………………0.91 1.25 1.62 1.57 1.75 1.87 1.91 1.93 1.96 1.95 2.06 1.64 1.04 1.70 1.94
US PERS CONSUMP DEFL (2009=100.0)……………..................................109.7 109.8 109.7 110.1 110.9 111.5 111.8 112.4 113.1 113.5 114.2 109.1 109.4 110.5 112.7% Chg Prev Qtr SAAR………………………………………………………..................1.28 0.11 -0.34 1.57 2.75 2.18 1.28 2.10 2.43 1.69 2.28 1.43 0.29 1.00 1.97% Chg Same Qtr Last Yr………………………………………………0.27 0.41 0.81 0.65 1.01 1.53 1.94 2.08 2.00 1.87 2.12 1.43 0.29 1.00 1.97
CONSUMER PRICE INDEX,ALL-URBAN (82-84=1.000)…………………………….........................................2.379 2.381 2.374 2.386 2.409 2.427 2.435 2.452 2.471 2.483 2.501 2.367 2.370 2.399 2.460% Chg Prev Qtr SAAR………………………………………………………..................1.58 0.33 -1.09 1.95 4.03 2.94 1.44 2.69 3.24 1.98 2.95 1.61 0.13 1.21 2.56% Chg Same Qtr Last Yr………………………………………………0.14 0.43 0.94 0.68 1.28 1.94 2.58 2.77 2.57 2.33 2.71 1.61 0.13 1.21 2.56
BANK PRIME INTEREST RATE (%)………………………………......................3.3 3.3 3.5 3.8 4.0 4.3 4.5 4.8 5.0 5.3 5.5 3.3 3.3 3.9 4.9
FEDERAL FUNDS RATE (% per annum)……………………………....................0.137 0.152 0.483 0.787 1.037 1.290 1.533 1.787 2.037 2.290 2.533 0.089 0.131 0.899 1.912
30-YEAR FIXED MORTGAGE RATE (%)………………………………............4.0 3.9 4.2 4.4 4.5 4.6 4.7 4.7 4.8 4.9 5.0 4.2 3.9 4.4 4.7
TN TAXABLE SALES (MIL2009$)……………………………………….................26228 26353 26392 26580 26635 26708 26795 26878 26954 27127 27230 97036 102746 106315 107755% Chg Prev Qtr SAAR………………………………………………………..................9.46 1.91 0.59 2.88 0.83 1.10 1.31 1.24 1.14 2.59 1.52 3.41 5.88 3.47 1.35% Chg Same Qtr Last Yr………………………………………………7.21 5.48 7.62 3.66 1.55 1.35 1.53 1.12 1.20 1.57 1.62 3.41 5.88 3.47 1.35
TN TAXABLE SALES (MIL$)…………………………………………….......................28781 28903 28953 29292 29577 29829 30028 30301 30575 30903 31167 105877 112414 117652 121807% Chg Prev Qtr SAAR………………………………………………………..................10.84 1.70 0.70 4.76 3.95 3.45 2.70 3.67 3.67 4.37 3.45 4.89 6.17 4.66 3.53% Chg Same Qtr Last Yr………………………………………………7.49 5.82 8.52 4.43 2.77 3.20 3.71 3.44 3.37 3.60 3.79 4.89 6.17 4.66 3.53
TN AVG ANNUAL WAGE, NONFARM(2009$)…………….......................………..............………..............………..............43269 43666 43973 44087 44059 44111 44274 44313 44347 44461 44544 41961 43161 44058 44349% Chg Prev Qtr SAAR………………………………………………………..................-0.11 3.72 2.85 1.04 -0.26 0.48 1.48 0.35 0.30 1.04 0.75 1.18 2.86 2.08 0.66% Chg Same Qtr Last Yr………………………………………………3.46 3.10 3.64 1.86 1.82 1.02 0.68 0.51 0.65 0.79 0.61 1.18 2.86 2.08 0.66
TN AVG ANNUAL WAGE, NONFARM ($)……………….............................47481 47891 48241 48586 48925 49266 49616 49956 50303 50649 50984 45782 47219 48755 50131% Chg Prev Qtr SAAR………………………………………………………..................1.14 3.50 2.96 2.89 2.82 2.82 2.87 2.77 2.81 2.78 2.67 2.62 3.14 3.25 2.82% Chg Same Qtr Last Yr………………………………………………3.73 3.44 4.51 2.62 3.04 2.87 2.85 2.82 2.82 2.81 2.76 2.62 3.14 3.25 2.82
Center for Business and Economic Research, University of Tennessee
History Forecast Data Annual
Tennessee Econometric Model

2016 TENNESSEE ECONOMIC REPORT | 3130 | 2016 TENNESSEE ECONOMIC REPORT
CHAPTER 2 | The Tennessee Economy: Short-Term Outlook
10.0
11.0
12.0
13.0
14.0
15.0
250.0
300.0
350.0
400.0
450.0
TN U.S.
2.4. Short-Term Outlook, continued
Figure 2.10: Despite Recent Growth, U.S. and Tennessee Manufacturing Employment Are Well Below Pre-Recession Levels From 2008
Source: Bureau of Economic Analysis and CBER-UT.
Figure 2.11: U.S. and Tennessee Manufacturing Output See Positive Growth
Source: Bureau of Economic Analysis.
1,000,000
1,100,000
1,200,000
1,300,000
1,400,000
1,500,000
1,600,000
1,700,000
1,800,000
1,900,000
2,000,000
25,000
30,000
35,000
40,000
45,000
50,000
U.S. O
utput (millions of 2009 dollars)TN
Out
put (
mill
ions
of 2
009
dolla
rs)
TN U.S.

2016 TENNESSEE ECONOMIC REPORT | 3130 | 2016 TENNESSEE ECONOMIC REPORT
The Tennessee Economy: Short-Term Outlook | CHAPTER 2
2.4. Short-Term Outlook, continued
six broad sectors will experience contractions. Employment in plastics and rubber manufacturing will increase by 1.6 percent in 2016 and 1.5 percent in 2017, while food manufacturing employment will grow by 0.1 percent in both 2016 and 2017. By contrast, miscellaneous nondurable goods manufacturing will face the steepest job cuts, shrinking by 3.7 percent in 2016 and 5.6 percent in 2017. The textile mills and textile products manufacturing sector will also face significant jobs losses over the next two years, shrinking by 4.1 percent in 2016 and 5.0 percent in 2017.
Tennessee’s unemployment rate is projected to remain at 5.6 percent for the first two quarter of 2016 and then fall to 5.5 percent during the second half of the year. In 2017, the state unemployment rate will drift slightly downward and is projected to average 5.4 percent for the year. The national unemployment rate will also continue its downward trend and as a result the state unemployment rate will remain above the national rate throughout the
short-term forecast horizon (see Figure 2.12).In 2016, Tennessee’s civilian labor force will
effectively remain unchanged, falling by a mere 0.1 percent. This slight drop in the civilian labor force will occur because of a 6.2 percent reduction in the number of unemployment people combined with a relatively small 0.3 percentage increase in employed people. As a result there will be roughly 3,000 fewer Tennesseans in the labor force in 2016 than there were in 2015. In 2017, the civilian labor force will grow by 0.6 percent as the number of unemployed people falls by 1.7 percent and the number of employed people grows by 0.8 percent. However, Tennessee’s labor force participation rate is projected to fall over the next two years, declining from 57.7 percent in 2015 to 57.0 percent in 2016 and 56.7 percent in 2017. By comparison, the national labor force participation rate is expected to hover between 61.6 percent and 61.8 percent over the next two years.
Figure 2.12: Tennessee’s Unemployment Rate Is Projected to Stay Above the National Rate Through 2018
Source: Bureau of Labor Statistics, IHS Global Insights Inc., and CBER-UT.
0
2
4
6
8
10
12
2003 2004 2005 2006 2007 2008 2009 2010 2011 2012 2013 2014 2015 2016 2017 2018
Rate
(%)
TN U.S.

2016 TENNESSEE ECONOMIC REPORT | 3332 | 2016 TENNESSEE ECONOMIC REPORT
CHAPTER 2 | The Tennessee Economy: Short-Term Outlook
Nominal personal income in Tennessee is forecasted to grow by 4.8 percent in 2016 followed by 4.7 percent growth in 2017. All components of personal income in Tennessee will enjoy healthy growth over the next two years. In 2016 wage and salary income will increase by the largest amount, expanding by 5.1 percent, followed by 4.3 percent growth in 2017. Proprietors’ income will increase by 5.0 percent in 2016 and 4.8 percent in 2017, while rent, interest, and dividend income will grow by 4.4 percent in 2016 and 5.2 percent in 2017. Transfer payments are also projected to increase by 3.7 percent in 2016 and 4.1 percent in 2017. Per capita personal income will grow by 3.7 percent in 2016 and 3.6 percent in 2017. By 2017, per capita income in Tennessee will equal $44,695, though this will equate to only 86.9 percent of the national average. This has become a growing concern as per capita personal income in Tennessee was equal to 90.7 percent of the national average in 2004 but has fallen relative to the U.S. average ever since
(see Figure 2.13). The state’s education initiatives, including Tennessee Promise and the Drive to 55 should ultimately help turn this trend around. On a fiscal year basis, nominal personal income is projected to grow by 4.9 percent in FY 2016 and 4.7 percent in FY 2017.
In Tennessee, nominal taxable sales are expected to increase by 4.7 percent in 2016 and 3.5 percent in 2017. All categories of taxable sales will see growth over the next two years. In 2016, taxable sales on miscellaneous durable and nondurable goods, auto dealer sales, other retail and service sales, and purchases from manufacturers will all increase by more than 5.0 percent. Taxable sales at hotels and motels will also see robust growth of 4.6 percent. In 2017, hotels and motels will continue to enjoy strong growth as taxable sales are projected to grow by an additional 6.2 percent. On a fiscal year basis, nominal taxable sales will rise by 6.5 percent in FY 2016 and 3.3 percent in FY 2017.
Figure 2.13: Per Capita Personal Income in Tennessee Has Fallen Relative to the National Average
Source: Bureau of Economic Analysis, IHS Global Insights Inc., CBER-UT.
84.0
85.0
86.0
87.0
88.0
89.0
90.0
91.0
92.0
TN P
er C
apita
Inco
me
Rela
tive
to U
.S. A
vera
ge (%
)
2.4. Short-Term Outlook, continued

2016 TENNESSEE ECONOMIC REPORT | 3332 | 2016 TENNESSEE ECONOMIC REPORT
The Tennessee Economy: Short-Term Outlook | CHAPTER 2
2.4. Tennessee Forecast at a Glance
• In Tennessee, inflation-adjusted gross domestic product is projected to increase by 2.3 percent in 2016 and 2.2 percent in 2017, slightly below the 2.4 percent growth rate for 2015.
• Nonfarm jobs will grow by 1.9 percent in 2016 and 1.7 percent in 2017, as employment in the professional and business services, leisure and hospitality, and natural resources, mining, and construction sectors see healthy employment gains.
• Manufacturing employment will expand by 0.7 percent in 2016 and 2017.
• The state unemployment rate is projected to fall to 5.5 percent in 2016 and 5.4 percent in 2017. This would mark the first time since 2007 that the annual unemployment rate dropped below 6.0 percent.
• Nominal personal income will grow by 4.8 percent in 2016 and 4.7 percent in 2017.
• Nominal taxable sales will expand 4.7 percent in 2016 and 3.5 percent in 2017.
• On a fiscal year basis, nominal personal income will increase by 4.9 percent in FY 2016 and 4.7 percent in FY 2017. Nominal taxable sales will grow 6.5 percent in FY 2016 and 3.3 percent in FY 2017.
2.5. Tennessee’s Agricultural and Forest Industries and Rural Economy
IntroductionThe impacts on Tennessee’s economy from
agriculture and forestry are far ranging, from the farm and forest to food, fiber, and forest products manufacturing. The state’s diverse topography for producing food, fiber, and forestry products is reflected in its agri-forestry industrial complex. This section of the report focuses on economic indicators for three main areas related to the agri-forestry industrial complex1: a) primary agriculture and forestry, which includes farming and first-stage forestry; b) secondary agriculture and forestry, which includes manufacturing and processing facilities; and c) the rural communities that are so important to sustaining agri-forestry within the state. Indicators of progress toward recommendations made in the The Governor’s Rural Challenge are also discussed.
1Defined as the primary industries typically associated with agriculture and forest operations such as growing crops, the breeding and feeding of livestock, and the management and logging of trees. Also included in the industrial complex were input supplying industries and value-added subsectors, which included food and beverage manufacturing, apparel and textiles, and forestry products manufacturing.
a. Agriculture and Primary Forestry
a.1. Agricultural Land Use and Farm SizeIn 2014, 10.9 million acres in Tennessee were
designated as farming operations (USDA/NASS 2015a), constituting over 40 percent of the state’s nearly 27 million acres of land area. Of the land in farms, 5.3 million acres were in cropland and 2.9 million acres were in pasture (USDA/NASS 2012). Tennessee’s farming industry is characterized by two types of farming operations: larger farms that rely primarily on farm income, and small farms, many of which are operated by part-time farmers. Of Tennessee’s 67,300 farming operations, average farm size in 2014 was 162 acres, which is smaller than the average 218 acres of its neighboring states (USDA/NASS 2015a). Tennessee ranks only second to Kentucky among its neighbors in number of farms.
a.2. Tennessee’s Crops and LivestockThe 2014 value of cash farm receipts from
crops and livestock was over $4.2 billion, with $1.8

2016 TENNESSEE ECONOMIC REPORT | 3534 | 2016 TENNESSEE ECONOMIC REPORT
CHAPTER 2 | The Tennessee Economy: Short-Term Outlook
billion from animals and $2.4 billion from crops (Table 2.2). Overall, Tennessee ranks 31st in the U.S. in cash farm receipts. The top ten Tennessee agricultural products in value of cash farm receipts are listed in Table 2.2, along with the state’s ranking for each product. In 2014, the largest value of cash farm receipts was derived from soybeans, followed by cattle and calves. These were followed in magnitude by broilers, corn, cotton, wheat, dairy, hay, tobacco, and vegetables and melons. The top ten commodities in the state accounted for about 86.7 percent of 2014 cash farm receipts. Tennessee ranks in the top ten states in value of cash farm receipts from tobacco and cotton.
Table 2.2 shows cash farm receipts over the past five years. Cash farm receipts from soybeans, cattle and calves, corn, wheat, and hay each exhibited over 10 percent average annual growth from 2010 to 2014. Only cotton cash farm receipts experienced an overall decline during this time period. The market for Tennessee crops and livestock is strongly impacted by trends in
U.S. markets for these products. U.S. soybean prices peaked in 2012/2013 at $14.40/bushel. The strengthening of domestic crush and export markets helped increase the disappearance of soybeans in 2014/15 compared with 2013/2014 (USDA/ERS 2014). U.S. cattle prices rose steadily since 2010, with record retail beef prices in 2014. The U.S. cattle herd inventory declined steadily between 2001 and 2014, and was 88.5 million in 2014, the smallest in half a century (USDA/NASS 2015b; USDA/ERS 2015e). The recent decline in inventory was largely driven by three consecutive drought years in the Southern Plains and the drought of 2012 that negatively impacted grain and oilseed production. Cattle prices set a record in 2014. However, the latter half of 2015 saw Tennessee cattle prices decline 35 to 40 percent. The value of Tennessee broiler production rose from $431 million in 2005 to over $598 million by 2014 (USDA/NASS 2015d). U.S. broiler prices rose from 2010 through 2014. While U.S. broiler production held steady, broiler exports grew
2.5. Tennessee’s Agricultural and Forest Industries and Rural Economy, continued
2
smallest in half a century (USDA/NASS 2015b; USDA/ERS 2015e). The recent decline in inventory was largely driven by three consecutive drought years in the Southern Plains and the drought of 2012 that negatively impacted grain and oilseed production. Cattle prices set a record in 2014. However, the latter half of 2015 saw Tennessee cattle prices decline 35 to 40 percent. The value of Tennessee broiler production rose from $431 million in 2005 to over $598 million by 2014 (USDA/NASS 2015d). U.S. broiler prices rose from 2010 through 2014. While U.S. broiler production held steady, broiler exports grew through 2014 (USDA/ERS 2015e). In 2014 the world’s largest poultry breeder discovered a fertility problem in a key rooster breed. The fertility issue resulted in fewer chicks hatching, which reduced production in 2014. Poultry exports, and consequently poultry prices, in 2015 have been negatively impacted by Highly Pathogenic Avian Influenza (HPAI). The broiler industry was not significantly impacted by HPAI, but its occurrence did result in a decline in exports. U.S. corn prices began declining, from more than $6/bushel in 2013/2014 to less than $4/bushel in 2014/2015 (USDA/ERS 2015d). Higher production of corn relative to demands for fuel and feed uses and exports pushed prices downward during this time period. U.S. cotton production was down in 2013/2014 from 2012/2013 (USDA/NASS 2015c); however, total disappearance decreased sharply in that time period, primarily due to decreased exports. Between 2013/2014 and 2014/2015, average U.S. cotton farm price declined from 82.5 cents per pound to 64.6 cents per pound (USDA/ERS 2015a).
Exports of agricultural products from Tennessee were valued at $1.7 billion in 2014, with the majority of this coming from crops. Over 27 percent of the 2014 export value came from soybeans, followed by cotton at 8.4 percent, wheat at just under 8 percent, soybean meal at 6.3 percent, and corn at 5.4 percent. In 2014, major export destinations by product included soybeans – China, Mexico, Indonesia, Japan, and Taiwan; cotton – China, Turkey, Mexico, Vietnam, Indonesia; wheat-Japan, Mexico, Brazil, Nigeria, and the Philippines; and corn – Japan, Mexico, South Korea, Columbia, and Egypt (USDA/FAS 2015).
Table 1. Tennessee Cash Farm Receipts and Share of Commodity Exports, 2010-2014
Value of Cash Receipts
(Million $)
Avg. Annual Growth
(2010-2014)
Ranking in U.S. 2014
Share of Commodity
Exports 2014
2010 2011 2012 2013 2014 All Commodities 3,084 3,290 3,743 4,091 4,237 8.3% 31 Crops 1,746 1,881 2,225 2,541 2,418 8.8% 26 85.3% Animals & Animal Products 1,337 1,409 1,518 1,550 1,820 8.2% 33 14.7% Top 10 in 2014 Soybeans 499 471 575 815 834 15.2% 15 27.2% Cattle & Calves 545 588 746 626 825 12.6% 23 4.20% Broilers 476 454 436 576 598 6.9% 16 4.3% Corn 272 418 532 573 454 17.0% 20 5.4% Cotton 332 311 357 284 239 -7.0% 10 8.4% Wheat 52 104 147 227 215 47.2% 18 8.0% Dairy Prod, Milk 151 175 157 163 192 6.8% 30 1.6% Hay 82 91 102 119 126 11.5% n/a n/a Tobacco 99 96 111 111 115 4.1% 3 4.2% Vegetables & Melons a 69 48 41 54 76 6.9% 24 0.8% a Ranking and shares of exports are for vegetables only. (Sources: USDA/ERS 2015c and USDA/ERS 2015f) a Ranking and shares of exports are for vegetables only.
Sources: USDA/ERS 2015c and USDA/ERS 2015f.
Table 2.2: Tennessee Cash Farm Receipts and Share of Commodity Exports, 2010–2014

2016 TENNESSEE ECONOMIC REPORT | 3534 | 2016 TENNESSEE ECONOMIC REPORT
The Tennessee Economy: Short-Term Outlook | CHAPTER 2
2.5. Tennessee’s Agricultural and Forest Industries and Rural Economy, continued
through 2014 (USDA/ERS 2015e). In 2014 the world’s largest poultry breeder discovered a fertility problem in a key rooster breed. The fertility issue resulted in fewer chicks hatching, which reduced production in 2014. Poultry exports, and consequently poultry prices, in 2015 have been negatively impacted by Highly Pathogenic Avian Influenza (HPAI). The broiler industry was not significantly impacted by HPAI, but its occurrence did result in a decline in exports. U.S. corn prices began declining, from more than $6/bushel in 2013/2014 to less than $4/bushel in 2014/2015 (USDA/ERS 2015d). Higher production of corn relative to demands for fuel and feed uses and exports pushed prices downward during this time period. U.S. cotton production was down in 2013/2014 from 2012/2013 (USDA/NASS 2015c); however, total disappearance decreased sharply in that time period, primarily due to decreased exports. Between 2013/2014 and 2014/2015, average U.S. cotton farm price declined from 82.5 cents per pound to 64.6 cents per pound (USDA/ERS 2015a).
Exports of agricultural products from Tennessee were valued at $1.7 billion in 2014, with the majority of this coming from crops. Over 27 percent of the 2014 export value came from soybeans, followed by cotton at 8.4 percent, wheat at just under 8 percent, soybean meal at 6.3 percent, and corn at 5.4 percent. In 2014, major export destinations by product included soybeans – China, Mexico, Indonesia, Japan, and Taiwan; cotton – China, Turkey, Mexico, Vietnam, Indonesia; wheat-Japan, Mexico, Brazil, Nigeria, and the Philippines; and corn – Japan, Mexico, South Korea, Columbia, and Egypt (USDA/FAS 2015).
a.3. Commodity Market Trends and Outlook, Infrastructure, Agritourism and Direct Marketing
Livestock, Poultry, and Dairy OutlookMeat protein and dairy product prices will be
driven by export markets. Many industry experts attribute most of the 2015 declines in exports to the significant increase in the dollar’s value relative to other currencies. Meat proteins and
dairy products will continue to find difficulty being absorbed in the world market the first half of 2016. Beef production will continue to increase, resulting in lower beef and cattle prices over the next several years. The pork industry will likely have strong 2016 production numbers, unless the Porcine Epidemic Diarrhea (PED) becomes an issue. Poultry production is likely to continue increasing, as well. Increased production will inherently result in increased exports, but prices for the three major meat proteins will likely decline from 2015 levels. U.S. dairy production will continue to increase in the first half of 2016, resulting in lower prices for the year. The export market and ability to move nonfat dry milk and whey will be critical factors for dairy markets in 2016.
Incentives provided to producers through the Tennessee Agricultural Enhancement Program (TAEP) are targeted at increasing the quality and number of beef heifers statewide. Bringing quality bred heifers into production has represented a significant challenge to profitability of the state’s beef cattle industry. A private-public partnership among the Tennessee Department of Agriculture, the University of Tennessee Institute of Agriculture and the Tennessee Farmer’s Cooperative seeks to develop best management practices for bred heifers and to encourage their adoption by producers.
Crops Outlook. In 2015, two important issues dominated Tennessee row-crop management and marketing. The Agricultural Act of 2014 (the Farm Bill) provided a new direction for domestic farm policy. For Title I (“Commodities”), Direct Payments, Counter-Cyclical Payments, and Average Crop Revenue Election (ACRE) programs were repealed and replaced with two new programs: Agricultural Risk Coverage (ARC) and Price Loss Coverage (PLC). Of the 2.06[2] million base
2 The Agricultural Act of 2014 converted 744,000 cotton base acres in Tennessee, into generic base acres. Generic base acres are not included in this estimate as a unique set of commodity program payment rules apply to generic base acres. Additionally, it should be noted that approximately 20 percent of planted acres in Tennessee have no base and as such do not qualify for commodity program payments.

2016 TENNESSEE ECONOMIC REPORT | 3736 | 2016 TENNESSEE ECONOMIC REPORT
CHAPTER 2 | The Tennessee Economy: Short-Term Outlook
acres of cropland in Tennessee, 94 percent were enrolled in ARC and 6 percent in PLC (USDA/FSA 2015a). Additionally, the Farm Bill increased emphasis on Title II (“Conservation”) and Title XI (“Crop Insurance”). The second major issue faced by row-crop producers in Tennessee was the continued decline in commodity prices. From their price peaks in 2012, corn, wheat, and soybean prices dropped 52 percent, 49 percent, and 36 percent, respectively, and cotton prices fell well below the cost of production resulting in planted acreage decreasing to an all-time low of 155,000 acres in 2015 (USDA/ERS 2015c). A bright spot for row-crop prices this spring was grain sorghum (milo). As a result of beneficial price incentives in the spring, Tennessee producers increased grain sorghum acreage from 33,000 in 2014 to over 120,000 acres in 2015 (USDA/FSA 2015b). Looking toward 2016, a strong U.S. dollar and record global supplies will continue to provide negative price implications for Tennessee row-crop producers. Barring a major production disruption at home or abroad, further reductions in prices should be anticipated. For the 2016 crop, current Tennessee farm-gate price estimates are: wheat – $4.30-$5.30; corn – $3.15-$4.20; grain sorghum – $3.00-$4.10; soybeans – $8.10-$9.60; and cotton – $0.62-$0.74.
Infrastructure. An indicator of growth in on-farm infrastructure is grain storage capacity. In 2012, Tennessee’s on-farm grain storage capacity was 79.3 million bushels, while in 2007, it was 65.1 million bushels (USDA/NASS 2012). In 2013, a total of 17 grain and oilseed milling firms generated payroll of $132.7 million in Tennessee. Among the 17 firms, two were wet corn milling and two were soybean and other oilseed processing. In addition, six cotton ginning companies in Tennessee paid nearly $2 million in payroll. The demand for trucking in grain transportation has continuously increased over the past decade, while the modal share of rail for total grain shipment dropped to less than 30 percent nationwide in 2011. This trend implies
higher demand on local roads and bridges for the agricultural sector in Tennessee. In 2014, 181 projects in 62 counties were been approved by the legislature. An additional 765 projects identified by Tennessee Department of Transportation to address growth and safety in the infrastructure system were proposed in 2015. In addition, The American Society of Civil Engineering recommended expansion of the short-line freight service in rural areas.
Since 2005, the TAEP has invested more than $123.4 million in 41,646 farm projects ranging from genetics and livestock equipment to commodity storage and specialty crops. For each dollar of TAEP investment, an estimated additional $3.89 is generated in local economic activity (Menard, Jensen, and English 2011). Two program areas have helped build on-farm investment for hay and grain storage. Cumulative (FY06 – FY15) TAEP payments for hay storage structures totaled $39.2 million while producer investments totaled an additional $77.3 million. For grain storage, cumulative TAEP payments totaled $10.5 million, while farmer investment was $33.8 million.
Agritourism. Tennessee is uniquely positioned for growth in agritourism, building upon a well-developed tourism industry within the state and farming operations being located near or within tourism areas. The state had 616 agritourism operations with sales totaling over $11.9 million Agriculture (USDA/NASS 2012). Agritourism visitors were estimated to spend $34.4 million statewide in 2012, and with multiplier effects, the economic impacts from these expenditures were estimated at over $54.2 (Jensen, Bruch, Menard, and English 2013). The visitor expenditure impacts represent only a portion of the economic impacts resulting from these farms since many of the operators also rely on other sources of farm income. Provisions passed in 2014 to amend the “Right to Farm Act” have expanded the definition of agriculture to include certain entertainment activities.
2.5. Tennessee’s Agricultural and Forest Industries and Rural Economy, continued

2016 TENNESSEE ECONOMIC REPORT | 3736 | 2016 TENNESSEE ECONOMIC REPORT
The Tennessee Economy: Short-Term Outlook | CHAPTER 2
Direct Marketing. The “local foods” movement, along with technical and financial assistance provided by USDA, TDA, UTIA, and other agencies, have helped increase direct marketing by farmers. An important component of direct marketing is sales through farmers markets. Tennessee has seen a rapid expansion in the number of farmers markets with the number rising from 99 to 119 venues between 2013 and 2014 (USDA/AMS 2016). Current Agricultural Marketing Service directory listings indicate 124 farmers markets across the state.
a.4. Financial Indicators for Tennessee Farming Industries
Several measures can be used to indicate the financial well-being of farms and farm operators in Tennessee. Table 2 presents financial data from 2010-2014 for the Tennessee farming sector. Net cash farm income was just under $740 million in 2014, averaging $10,993 per operation (USDA/ERS 2015b). Net cash farm income on a per acre basis was $67.87/acre.
The net farm income ratio (net farm income/value of production) during 2010 to 2014 suggests about 15 to 30 percent efficiency in converting production to net farm income.[3] However, the interest expense ratios for the farming sector reflect a low debt burden and interest payment level relative to production. Times interest earned is another measure of ability to cover debt payments, specifically interest payments. For all years, the values are greater than one, implying sufficient cash to meet interest payments, and in 2014 the value was 4.69. The state’s capital consumption ratio was relatively low between 2010-1014, ranging between 0.10 and 0.20, suggesting only 10 to 20 percent of production is needed to cover the sector’s capital consumption. In 2014, the state’s farming sector had an operating expense ratio of 0.65, suggesting 65 percent of the value of production was used to cover operating expenses.
The 2014 estimated market value of land and buildings on farms was $39.2 billion or around 3USDA’s Economic Research definitions of farm sector financial ratios were used. A description of these can be found at http://www.ers.usda.gov/data-products/farm-income-and-wealth-statistics/documentation-for-the-farm-sector-financial-ratios.aspx#eff.
2.5. Tennessee’s Agricultural and Forest Industries and Rural Economy, continued
5
a.4 Financial Indicators for Tennessee Farming Industries
Several measures can be used to indicate the financial well-being of farms and farm operators in Tennessee. Table 2 presents financial data from 2010-2014 for the Tennessee farming sector. Net cash farm income was just under $740 million in 2014, averaging $10,993 per operation (USDA/ERS 2015b). Net cash farm income on a per acre basis was $67.87/acre.
The net farm income ratio (net farm income/value of production) during 2010 to 2014 suggests about 15 to 30 percent efficiency in converting production to net farm income.[3] However, the interest expense ratios for the farming sector reflect a low debt burden and interest payment level relative to production. Times interest earned is another measure of ability to cover debt payments, specifically interest payments. For all years, the values are greater than one, implying sufficient cash to meet interest payments, and in 2014 the value was 4.69. The state’s capital consumption ratio was relatively low between 2010-1014, ranging between 0.10 and 0.20, suggesting only 10 to 20 percent of production is needed to cover the sector’s capital consumption. In 2014, the state’s farming sector had an operating expense ratio of 0.65, suggesting 65 percent of the value of production was used to cover operating expenses.
Table 2. Indicators of the Tennessee Farm Sector’s Financial Well-Being, 2010-2014 2010 2011 2012 2013 2014 (Million $) Value of Production
$3,764 $4,343 $4,370 $5,099 $4,916
Net Farm Income $790 $1,180 $752 $1,414 $740 Interest Expense $260 $250 $240 $191 $201 Market Value of Farmland, Buildings, and Equipment
$37,368 $37,908 $38,368 $38,913 $39,240
Capital Consumption $408 $427 $637 $697 $920 Total Expenses $3,127 $3,303 $3,794 $3,834 $4,297 Ratios Net Farm Income Ratio 0.21 0.27 0.17 0.28 0.15 Capital Consumption Ratio 0.11 0.10 0.15 0.14 0.19 Operating Expense Ratio 0.65 0.60 0.67 0.58 0.65 Interest Expense Ratio 0.07 0.06 0.05 0.04 0.04 Times Interest Earned 4.03 5.72 4.13 8.40 4.69 (Source: USDA/ERS 2015b)
The 2014 estimated market value of land and buildings on farms was $39.2 billion or around $583,061 per farm in Tennessee. The 2014 overall value is up from the 2010 value of $37.4 billion. Farms comprising the majority of sales have much larger land and building asset values than other farms. Farms with sales of at least $1 million had average market value of land and buildings of more
[3] USDA’s Economic Research definitions of farm sector financial ratios were used. A description of these can be found at http://www.ers.usda.gov/data-products/farm-income-and-wealth-statistics/documentation-for-the-farm-sector-financial-ratios.aspx#eff.
Source: USDA/ERS 2015b.
Table 2.3: Indicators of the Tennessee Farm Sector’s Financial Well-Being, 2010–2014

2016 TENNESSEE ECONOMIC REPORT | 3938 | 2016 TENNESSEE ECONOMIC REPORT
CHAPTER 2 | The Tennessee Economy: Short-Term Outlook
$583,061 per farm in Tennessee. The 2014 overall value is up from the 2010 value of $37.4 billion. Farms comprising the majority of sales have much larger land and building asset values than other farms. Farms with sales of at least $1 million had average market value of land and buildings of more than $7.3 million per operation and those with $500,000-$999,999 in sales had over $3.1 million in average market value of land and buildings per operation (USDA/NASS 2012). The 2014 average value of land and buildings among our neighboring states was $694,897 per farm.
Tennessee’s farm structure is characterized by many small farming operations; however, a relatively few larger farms make up the majority of farm sales. About 69.8 percent of all farms have sales of less than $10,000. By contrast, 2,303 of the state’s farms accounted for 75 percent of the market value of agricultural products sold in 2012 (USDA/NASS 2012). Just under 42 percent of farmers in Tennessee cite farming as their principal occupation, highlighting the importance of other sources of rural income to economic sustainability of the agricultural sector.
a.5. Primary Forestry in TennesseeIn 2013, among the state’s 143 sawmill
establishments, nearly 2,100 workers were employed with a payroll of close to $61.0 million (US Census Bureau 2013). Logging establishment numbers totaled 135 for the same time period, employing 728 workers with a payroll of close to $20.0 million. From 2009 through 2013, the average annual growth in the numbers of employees, payroll, and establishments for sawmills (NAICS 321113) were 3.1 percent, 7.9 percent, and -5.1 percent, respectively. For logging (NAICS 1133) in this same timeframe, the average annual growth values were 2.5 percent, 6.4 percent, and -1.3 percent, respectively, for employees, payroll, and establishments. According to the Forestry Inventory Analysis by U.S. Forest Service (USFS 2015), an estimated 1.4 billion board feet of sawtimber trees were removed from Tennessee (international ¼ inch rule). Between 2009 and
2013, the average annual growth in sawtimber removals was -2.2 percent. Factors that influenced these trends in the primary forestry sector are: low new housing starts in 2009; slow recovery of new housing starts; and relatively flat U.S. demand for paper, paperboard, and pulp due to declining newsprint, printing and writing paper consumption (Howard and Westby 2013).
b. Food, Fiber, and Forestry Manufacturing in Tennessee b.1. Value of Shipments, Number of Establishments, and Employees.
As seen in Table 2.4, the state’s 1,591 food and fiber processing and manufacturing facilities employed 77,283 workers with a payroll of $3.2 billion in 2013. The value of shipments originating from these industries was $36.1 billion (US Census Bureau 2013). By comparison, the state’s overall manufacturing employments was 290,841 workers in 2013 and the value of shipments was $143.6 billion. This means that food and fiber related manufacturing employed more than 1 in 4 manufacturing workers and generated over 1 in 4 manufacturing shipment dollars. The largest percentage of the values of food and fiber-related manufacturing shipments, 51.3 percent, arose from food processing, followed by beverages at 17.1 percent.
Figure 2.14 displays the growth in value of shipments from 2009 through 2013 for Tennessee’s food, beverage, and tobacco products manufacturing (NAICS 311 and 312 combined) and wood, paper, and furniture products (NAICS 321, 322, and 337 combined). Steady growth in food, beverage, and tobacco products manufacturing was primarily driven by growth in beverage and tobacco products (NAICS 312), which experienced an annual average growth of 7.2 percent from 2009 through 2013. Food processing (NAICS 311) experienced a 3.5 percent annual average growth over this time frame. Growth in forest products manufacturing was primarily driven by growth in wood products (NAICS 321) (8.6
2.5. Tennessee’s Agricultural and Forest Industries and Rural Economy, continued

2016 TENNESSEE ECONOMIC REPORT | 3938 | 2016 TENNESSEE ECONOMIC REPORT
The Tennessee Economy: Short-Term Outlook | CHAPTER 2
2.5. Tennessee’s Agricultural and Forest Industries and Rural Economy, continued
Table 2.4: Tennessee Food, Fiber, and Forestry Manufacturing, 2013a
6
than $7.3 million per operation and those with $500,000-$999,999 in sales had over $3.1 million in average market value of land and buildings per operation (USDA/NASS 2012). The 2014 average value of land and buildings among our neighboring states was $694,897 per farm.
Tennessee’s farm structure is characterized by many small farming operations; however, a relatively few larger farms make up the majority of farm sales. About 69.8 percent of all farms have sales of less than $10,000. By contrast, 2,303 of the state’s farms accounted for 75 percent of the market value of agricultural products sold in 2012 (USDA/NASS 2012). Just under 42 percent of farmers in Tennessee cite farming as their principal occupation, highlighting the importance of other sources of rural income to economic sustainability of the agricultural sector.
a.5 Primary Forestry in Tennessee
In 2013, among the state’s 143 sawmill establishments, nearly 2,100 workers were employed with a payroll of close to $61.0 million (US Census Bureau 2013). Logging establishment numbers totaled 135 for the same time period, employing 728 workers with a payroll of close to $20.0 million. From 2009 through 2013, the average annual growth in the numbers of employees, payroll, and establishments for sawmills (NAICS 321113) were 3.1 percent, 7.9 percent, and -5.1 percent, respectively. For logging (NAICS 1133) in this same timeframe, the average annual growth values were 2.5 percent, 6.4 percent, and -1.3 percent, respectively, for employees, payroll, and establishments. According to the Forestry Inventory Analysis by U.S. Forest Service (USFS 2015), an estimated 1.4 billion board feet of sawtimber trees were removed from Tennessee (international ¼ inch rule). Between 2009 and 2013, the average annual growth in sawtimber removals was -2.2 percent. Factors that influenced these trends in the primary forestry sector are: low new housing starts in 2009; slow recovery of new housing starts; and relatively flat U.S. demand for paper, paperboard, and pulp due to declining newsprint, printing and writing paper consumption (Howard and Westby 2013).
b) Food, Fiber, and Forestry Manufacturing in Tennessee
b.1 Value of Shipments, Number of Establishments, and Employees
Table 3. Tennessee Food, Fiber, and Forestry Manufacturing, 2013a Manufacturing Industry/NAICS
Employees
Payroll
Establish-ments
Value of Shipments
(Number) (Million$) (Number) (Million $) Food (311) 34,430 $1,446 306 $18,530 Animal Slaughtering/Processing (3116)
10,603 $308 59 $3,415
Beverage & Tobacco Products (312) 3,227 $190 91 $6,191 Textile Mills (313) 2,692 $125 55 $987 Textile Product Mills (314) 2,487 $81 138 $601 Apparel (315) 3,449 $93 94 $354 Leather & Allied Products (316) 421 $12 27 D Wood Products (321) 10,909 $351 461 $2,169 Paper (322) 10,856 $599 124 $5,688 Furniture & Related Products (337) 8,812 $322 295 $1,614
Total 77,283 $3,218 1,591 $36,133 a Values for animal slaughtering and processing are imbedded in food manufacturing (311) values D = Data not disclosed
a Values for animal slaughtering and processing are imbedded in food manufacturing (311) valuesD = Data not disclosedSource: US Census Bureau 2013.
Figure 2.14: Agri-forestry Products Manufacturing Value of Shipments, 2009–2013
Food, Beverage & Tobacco Products Wood, Paper & Furniture Products
$19.0
$20.0
$21.0
$22.0
$23.0
$24.0
$25.0
$26.0
2009 2010 2011 2012 2013
Billi
on $
percent) and paper (NAICS 322) manufacturing (5.1 percent), with furniture and related products (NAICS 337) experiencing a 1.5 percent annual average growth. For all agri-forestry products manufacturing between 2009 and 2013, growth averaged 3.6 percent per year. Relatively flat annual average growth occurred for textile mills (NAICS 313) (0.01 percent), with textile product mills (NAICS 314) experiencing a 5.3 percent decrease
in value of shipments. Tennessee‘s share of the national value of shipments for food processing was 2.4 percent, beverage and tobacco products was 4.2 percent, textile mills was 3.2 percent, textile product mills was 2.6 percent, wood products manufacturing was 2.4 percent, paper manufacturing was 3.1 percent, and furniture and related products was 2.3 percent.
$6.0
$7.0
$8.0
$9.0
$10.0
2009 2010 2011 2012 2013
Billi
on $

2016 TENNESSEE ECONOMIC REPORT | 4140 | 2016 TENNESSEE ECONOMIC REPORT
CHAPTER 2 | The Tennessee Economy: Short-Term Outlook
2.5. Tennessee’s Agricultural and Forest Industries and Rural Economy, continued
Tennessee is a significant producer of ethanol in the Southeast U.S. Two major processors located in the state are Green Plains in Obion County and Tate & Lyle in Loudon County. The Energy Information Association lists capacity in Tennessee at 225 million gallons per year (EIA 2015).
b.2. Economic Impacts from the Agri-forestry Industrial Complex
In 2013, the agri-forestry industrial complex directly contributed (without multiplier effects) $49.0 billion in economic activity to the state’s economy, adding 179.7 thousand jobs (Menard, English, and Jensen 2016). The agri-forestry industrial complex contributed $13.9 billion in value-added. When accounting for multiplier effects, the agri-forestry industrial complex added $74.8 billion to Tennessee’s economy, or 12.8 percent of the state’s economic activity, and employed 349,398 individuals, or 9.4 percent of all workers. Agriculture, with multiplier effects, accounted for 9.0 percent of the state’s economy and generated $52.6 billion in output, employing close to 254,000 Tennesseans, with 109,000
employed (both full- and part-time) in agricultural production.
c. Rural Economies and Well-BeingRural communities and their resources are
important contributors to the health of the agri-forestry industrial complex. In 2014, about 22.8 percent of Tennessee’s population was classified as rural. Table 2.5 presents several indicators, including median household income, education level, unemployment rate, and poverty rate across rural and urban counties in Tennessee. The data reflect lower household income, lower percentage of college graduates, and higher unemployment and poverty rates in rural areas of Tennessee than in urban areas. Individuals 25 and over are about half as likely to obtain a college degree as urban individuals. Persons who are part of the rural labor force are nearly 30 percent more likely to be unemployed than persons who are part of the urban labor force. A person residing in a rural area is over 20 percent more likely to fall below the poverty level than a person residing in an urban area.
8
Table 4. Household Income, Education Level, and Unemployment and Poverty Rates in Rural and Urban Areas of Tennessee Measure Rural Urban
Rural/ Urban Ratio
Median Household Income (2013$)
$31,998
$41,810
0.77
2009-2013 Education Level, Persons 25 and Over (5-Yr Avg) (Percent)
Not Completed High School
20.9 13.9 1.50
Completed High School
41.2 30.5 1.35
Completed College 14.0 26.9 0.52 2014 Unemployment Rates (Percent)
8.0 6.3 1.27
2013 Poverty Rate (Percent)
20.6 17.0 1.21
(Source: USDA/ERS 2015g)
c) Rural Economies and Well-Being Rural communities and their resources are important contributors to the health of the agri-forestry
industrial complex. In 2014, about 22.8 percent of Tennessee’s population was classified as rural. Table 4 presents several indicators, including median household income, education level, unemployment rate, and poverty rate across rural and urban counties in Tennessee. The data reflect lower household income, lower percentage of college graduates, and higher unemployment and poverty rates in rural areas of Tennessee than in urban areas. Individuals 25 and over are about half as likely to obtain a college degree as urban individuals. Persons who are part of the rural labor force are nearly 30 percent more likely to be unemployed than persons who are part of the urban labor force. A person residing in a rural area is over 20 percent more likely to fall below the poverty level than a person residing in an urban area.
d) Governor’s Rural Challenge
The Governor’s Rural Challenge set forward four major recommendations for Tennessee agriculture (TDA 2013). These recommendations were:
1. Advance agriculture, natural resources, and rural infrastructure as Tennessee business priorities; 2. Ensure a positive and predictable policy and regulatory environment; 3. Expand market opportunities for Tennessee producers and encourage new production; and 4. Increase the scope and depth of a skilled and educated workforce through career, technical, and
higher education.
Indicators were developed as part of the strategic planning process to gauge progress toward the aforementioned recommendations. While the indicators were developed in 2013, calculations for these indicator measures using recent data can be used as baselines for future growth. Notably, several of the “scorecard indicators” exhibited positive movement toward their goals in recent years. These are listed in Table 5.
Several indicators of progress toward Recommendation 1 showed positive progress. The indicators exhibiting positive outcomes during a 5-year time span between agricultural censuses (2007 to 2012) included reduction in the percentage of idle cropland, and growth in an index of major crop yields. These two indicators suggest that less cropland is sitting idle and that cropland use is resulting in higher crop yields. Data was available to calculate the yield index for 2013 and 2014, with these values being 147.57 and 138.62 respectively, again indicating a growth in yields compared with 2007. As noted
Table 2.5: Household Income, Education Level, and Unemployment and Poverty Rates in Rural and Urban Areas of Tennessee
Source: USDA/ERS 2015g.

2016 TENNESSEE ECONOMIC REPORT | 4140 | 2016 TENNESSEE ECONOMIC REPORT
The Tennessee Economy: Short-Term Outlook | CHAPTER 2
2.5. Tennessee’s Agricultural and Forest Industries and Rural Economy, continued
d. Governor’s Rural ChallengeThe Governor’s Rural Challenge set forward four
major recommendations for Tennessee agriculture (TDA 2013). These recommendations were:
1. Advance agriculture, natural resources, and rural infrastructure as Tennessee business priorities;
2. Ensure a positive and predictable policy and regulatory environment;
3. Expand market opportunities for Tennessee producers and encourage new production; and
4. Increase the scope and depth of a skilled and educated workforce through career, technical, and higher education.
Indicators were developed as part of the strategic planning process to gauge progress
toward the aforementioned recommendations. While the indicators were developed in 2013, calculations for these indicator measures using recent data can be used as baselines for future growth. Notably, several of the “scorecard indicators” exhibited positive movement toward their goals in recent years. These are listed in Table 2.6.
Several indicators of progress toward Recommendation 1 showed positive progress. The indicators exhibiting positive outcomes during a 5-year time span between agricultural censuses (2007 to 2012) included reduction in the percentage of idle cropland, and growth in an index of major crop yields. These two indicators suggest that less cropland is sitting idle and that cropland use is resulting in higher crop yields.
Table 2.6: Scorecard Indicators of Positive Progress for Tennessee Agriculture
9
earlier, the capital consumption ratio was relatively low between 2010-2014 for Tennessee agriculture. TAEP investment assists farmers in expanding on-farm storage and building farm capital. TAEP expenditures investing in productivity and infrastructure of the agricultural sector grew by 180.83 percent from 2007 to 2012 (see Recommendation 2). Positive indicators of progress toward Recommendation 3 include growth in economic activity from farming and associated activities in real terms by 14.91 percent between 2006 and 2011, and economic activity from the food and beverage processing industries growing in real terms by 5.33 percent. For 2012, economic activity from farming and associated activities in real terms was $4.16 billion (36.71 percent greater than 2006) and economic activity from food and beverage processing was $21.6 billion (19.46 percent greater than 2006). While raw commodities exported out of state decreased, the inputs used in food and beverage processing imported from out of state increased, but only by 1.5 percent. Under Recommendation 4, two indicators reflect positive progress toward building a skilled and educated agricultural workforce. Educational programs, such as Master Farmer and Master Gardener, saw over 12,574 Tennesseans participating from 2007-2012. Four-year agricultural degrees awarded annually increased from 516 in 2008/2009 to 621 in 2012/2013. The number of four year agricultural degrees awarded for the 2013-2014 year was 670. This is was 7.9 percent above the 2012-2013 year and 29.8 percent above the 2008-2009 year.
Table 5. Scorecard Indicators of Positive Progress for Tennessee Agriculture
Indicator 2012 2007 Percent Change Goal
Strategic Plan Recomm-endation
Percent of Cropland that is Idled (%) 6.06% 6.88% -0.83% Decrease 1
Index of Crop Yield Per Acre (7 major crops)a
120.60 100.00 20.60% Increase 1
Tennessee Ag Enhancement Program Expenditures (TAEP) (Million $)
$18.31 $6.00 205.14% Increase 2
Inflation Adjusted Values by CPI (2007=100)
$16.85 $6.00 180.83% Increase
2011 2006
Economic Activity from Farming and Associated Activities (Million $)
$3,870 $3,044 27.14% Increase 3
Inflation Adjusted Values by CPI (2006=100)
$3,498 $3,044 14.91% Increase
Economic Activity from Food and Beverage Processing (Million $)
$21,110 $18,114 16.54% Increase 3
Inflation Adjusted Values by CPI (2006=100)
$19,079 $18,114 5.33% Increase
2011 2008
Percent of Agricultural Commodity Exports to Out-of-State (%)
55.10% 59.30% -4.20% Decrease 3
2007-2012 2007-2008
Graduates of Master Farmer/Gardener Programs (Number in total)
12,574 5,826 115.83% Increase 4
2012-2013 2008-2009
Four Year Agricultural Degrees Awarded (Number per Year)b
621 516 20.35% Increase 4
aCorn, Cotton, Hay, Sorghum, Soybeans, Tobacco, and Wheat (USDA/NASS 2012). Yield ratios of 2012 to 2007 for each crop were aCorn, Cotton, Hay, Sorghum, Soybeans, Tobacco, and Wheat (USDA/NASS 2012). Yield ratios of 2012 to 2007 for each crop were share weighted by 2012 acres of each crop.Source: Tennessee Department of Higher Education Fact Books http://www.state.tn.us/ thec/Legislative/Reports.html.

2016 TENNESSEE ECONOMIC REPORT | 4342 | 2016 TENNESSEE ECONOMIC REPORT
CHAPTER 2 | The Tennessee Economy: Short-Term Outlook
Data was available to calculate the yield index for 2013 and 2014, with these values being 147.57 and 138.62 respectively, again indicating a growth in yields compared with 2007. As noted earlier, the capital consumption ratio was relatively low between 2010-2014 for Tennessee agriculture. TAEP investment assists farmers in expanding on-farm storage and building farm capital. TAEP expenditures investing in productivity and infrastructure of the agricultural sector grew by 180.83 percent from 2007 to 2012 (see Recommendation 2). Positive indicators of progress toward Recommendation 3 include growth in economic activity from farming and associated activities in real terms by 14.91 percent between 2006 and 2011, and economic activity from the food and beverage processing industries growing in real terms by 5.33 percent. For 2013, economic activity from farming and associated activities in real terms was $4.1 billion (35.0 percent greater than 2006) and economic activity from food and beverage processing was $21.4 billion (18.0 percent greater than 2006). While raw commodities exported out of state decreased, the inputs used in food and beverage processing imported from out of state increased, but only by 1.5 percent. Under Recommendation 4, two indicators reflect positive progress toward building a skilled and educated agricultural workforce. Educational programs, such as Master Farmer and Master Gardener, saw over 12,574 Tennesseans participating from 2007-2012. Four-year agricultural degrees awarded annually increased from 516 in 2008/2009 to 621 in 2012/2013. The number of four year agricultural degrees awarded for the 2013-2014 year was 670. This is was 7.9 percent above the 2012-2013 year and 29.8 percent above the 2008-2009 year.
Summary The agri-forestry industrial complex
encompasses industries that produce food and fiber and those adding value to these commodities. This industrial complex is important to the state’s economy, particularly to rural areas within the state.
These industries add $49 billion directly to the state’s economy and, with multiplier effects, $74.8 billion in total. About 1 in 4 manufacturing jobs are in food- and fiber-related manufacturing.
The farming sector in Tennessee is quite diverse, which can help prevent large upswings and downswings due to market movements of one or two commodities. However, this diversity means that the state’s farming sector, by and large, is a market-follower at the farm-gate level, heavily impacted by market changes and policies at the national level. Furthermore, increasingly, export markets impact farm pocketbooks. The state’s farming sector is dual in nature, characterized with larger farms supplying the majority of sales and many smaller farms operated by part-time farmers who also rely on off-farm income. Building agricultural technology and infrastructure within the state to increase agricultural productivity and profitability will likely rely on increased rates of capital investment.
Food and beverage manufacturing have sustained steady growth. These industries have proven to be fairly resilient to economic downturns, such as those experienced in the late 2000’s. The forest products sector has seen slower growth, with slowed domestic demands resulting in part from the economic downturn of the late 2000’s. Economic growth and an upward trend in new housing starts may place future positive pressure on the demand for forest products.
Rural communities and counties are very important to the agri-forestry industrial complex, as is agri-forestry industrial complex to the rural economy within the state. However, gaps in income, educational attainments, unemployment, and poverty between rural and urban areas persist.
References UsedHoward, J. and R. Westby. 2013. U.S. Timber
Production, Trade, Consumption and Price Statistics 1965–2011. USDA/USFS Forest Products Laboratory FPL-RP-676, http://www.fpl.fs.fed.us/documnts/fplrp/fpl_rp676.pdf.
2.5. Tennessee’s Agricultural and Forest Industries and Rural Economy, continued

2016 TENNESSEE ECONOMIC REPORT | 4342 | 2016 TENNESSEE ECONOMIC REPORT
The Tennessee Economy: Short-Term Outlook | CHAPTER 2
Jensen, K. M. Bruch, J. Menard, and B. English. 2013. “A Snapshot of Tennessee Agritourism: 2013 Update.” Available at http://aimag.ag.utk.edu/pubs/AgritourismJune2013.pdf.
Menard, R., B. English, and K. Jensen. Economic Contributions of Agriculture and Forestry in Tennessee, 2013. Agri-Industry Modeling & Analysis group Report, Department of Ag. and Resource Economics, The University of Tennessee, Knoxville, forthcoming 2016.
Menard, J., K. Jensen, and B. English. 2011. “An Analysis of the Economic Impacts from the Tennessee Agricultural Enhancement Program (TAEP).” Report to the Tennessee Department of Agriculture (TDA). Available at http://aimag.ag.utk.edu/pubs/TAEPEconomicImpacts.pdf.
Tennessee Department of Agriculture. 2013. Governor’s Rural Challenge a 10-Year Strategic Plan: Increasing Rural Tennessee’s Capacity to Produce. http://www.tn.gov/assets/entities/ agriculture/attachments/AgBusRuralChallenge.pdf.
Tennessee Department of Higher Education. Tennessee Department of Higher Education Fact Books http://www.state.tn.us/ thec/Legislative/Reports.html
US Census Bureau. 2013. Annual Survey of Manufacturers, Geographic Area Statistics, Tennessee. http://www.census.gov/manufacturing/asm/.
U.S. Energy Information Administration (EIA). 2015. Tennessee State Energy Profile. https://www.eia.gov/state/print.cfm?sid=TN.
USDA/AMS. 2016. Farmers Markets and Direct-to-Consumer Marketing. Farmers Market Directory data https://apps.ams.usda.gov/FarmersMarketsExport/ExcelExport.aspx.
USDA/ERS. 2015a. Cotton and Wood Yearbook. http://www.ers.usda.gov/data-products/cotton,-wool,-and-textile-data/cotton-and-wool-yearbook.aspx.
USDA/ERS. 2015b. Farm Income and Wealth Statistics-Farm and Wealth Indicators. http://www.ers.usda.gov/data-products/farm-income-and-wealth-statistics/farm-finance-indicators-state-ranking.aspx#P7026ab87f4204 60ebfb73e2a2d2739b4_4_186iT0R0x16.
USDA/ERS. 2015c. Farm Income and Wealth Statistics-Cash Receipts. http://www.ers.usda.gov/data-products/farm-income-and-wealth-statistics/cash-receipts-by-commodity.aspx.
USDA/ERS. 2015d. Feed Grains Yearbook. http://www.ers.usda.gov/data-products/feed-grains-database/feed-grains-yearbook-tables.aspx.
USDA/ERS. 2015e. Livestock, Poultry, and Dairy Outlook. November. http://www.ers.usda.gov/media/1942630/ldpm257.pdf.
USDA/ERS. 2014. Oil Crops Outlook. http://usda.mannlib.cornell.edu/usda/ers/OCS//2010s/2014/OCS-12-12-2014.pdf.
USDA/ERS. 2015f. State Export Data. http://www.ers.usda.gov/data-products/state-export-data.aspx.
USDA/ERS. 2015g. State Fact Sheets: Tennessee. http://www.ers.usda.gov/data-products/state-fact-sheets/state-data.aspx?StateFIPS=47&Stat eName=Tennessee.
USDA/FAS. 2015. Global Agricultural Trade System. http://apps.fas.usda.gov/gats/default.aspx.
USDA/FSA. 2015a. ARC/PLC Election Data. http://www.fsa.usda.gov/programs-and-services/arcplc_program/.
USDA/FSA. 2015b. Crop Acreage Data Reported to FSA. http://www.fsa.usda.gov/news-room/efoia/electronic-reading-room/frequently-requested-information/crop-acreage-data/index.
USDA/NASS. 2012. Census of Agriculture, Tennessee. http://www.agcensus.usda.gov/Publications/2012/.
2.5. Tennessee’s Agricultural and Forest Industries and Rural Economy, continued
2016 TENNESSEE ECONOMIC REPORT | 4544 | 2016 TENNESSEE ECONOMIC REPORT
CHAPTER 2 | The Tennessee Economy: Short-Term Outlook
USDA/NASS. 2015a. Quick Stats. Tennessee Agricultural Overview. http://www.nass.usda.gov/Quick_Stats/Ag_Overview/stateOverview.php?state=TENNESSEE.
USDA/NASS. 2015b. Quick Stats. U.S. Cattle Inventory. http://quickstats.nass.usda.gov/.
USDA/NASS. 2015c. Quick Stats. Cotton Planted Acreage-Tennessee. http://quickstats.nass.usda.gov/.
USDA/NASS. 2015d. “Poultry Production and Value 2014 Summary.” http://usda.mannlib.cornell.edu/ usda/current/PoulProdVa/PoulProdVa-04-30-2015.pdf
USDA/USFS. 2015. Forest Inventory Analysis. http://apps.fs.fed.us/fia/fido/index.html.
2.5. Tennessee’s Agricultural and Forest Industries and Rural Economy, continued

2016 TENNESSEE ECONOMIC REPORT | 4544 | 2016 TENNESSEE ECONOMIC REPORT
The Tennessee Economy: Long-Term Outlook | CHAPTER 3
CHAPTER 3: THE TENNESSEE ECONOMY: LONG-TERM OUTLOOK
In this chapter—
3.1. Introduction
3.2. Employment Outlook 3.3. Unemployment
3.4. Population
3.5. Personal Income and Taxable Sales
3.6. State Gross Domestic Product
3.1. Introduction
Previous chapters focused on the short-term outlook (10 quarters ahead) using a cyclical forecast which concentrated on the ups and downs of the business cycle. This chapter provides a longer-term view (10 years ahead) of economic growth in Tennessee based on a trend forecast. Typically, the ups and downs of a business cycle have little impact on the long-term trend performance of an economy, although this was certainly not the case with the Great Recession. More generally, long-term growth is driven by growth in factors of production such as population and the labor force, productivity, human capital (i.e. knowledge, education, and on-the-job experience), private sector investments in productive inputs (equipment and structures), and public investments in infrastructure (from broadband to roadways). All else equal, growth in any of these inputs will stimulate economic growth for the state. Recessions and economic booms are not built into the trend forecast as they are unpredictable, but it is likely that both will occur at some point in the next decade.
Between 2005 and 2015, inflation-adjusted state gross domestic product (GDP) in Tennessee grew
at a compound annual growth rate (CAGR) of 1.1 percent. This was slightly slower than the 1.4 percent CAGR for the U.S., but both were largely affected by the Great Recession. By comparison, inflation-adjusted state GDP is projected to advance at a 2.2 percent CAGR between 2015 and 2025 and a 2.4 percent CAGR for the nation. Over the last ten years, Tennessee personal income grew by 3.8 percent (CAGR) and kept pace with national income growth. Looking forward ten years, personal income in Tennessee is expected to increase by 4.5 percent (CAGR) between 2015 and 2025, which is slightly slower than the 4.8 percent CAGR projected for the nation. As a result, Tennessee’s per capita nominal personal income is projected to fall from 87.2 percent of the national average in 2015 to only 83.2 percent by 2025.
Due to the Great Recession, overall employment growth was slow over the last ten years in both Tennessee and the nation. Between 2005 and 2015, nonfarm employment in Tennessee expanded by only 0.5 percent (CAGR), and national employment growth increased by only 0.6 percent (CAGR). A more optimistic employment outlook is projected for the next ten years, as

2016 TENNESSEE ECONOMIC REPORT | 4746 | 2016 TENNESSEE ECONOMIC REPORT
CHAPTER 3 | The Tennessee Economy: Long-Term Outlook
Tennessee employment is forecasted to grow by 1.1 percent (CAGR) between 2015 and 2025 and slightly outpace national employment growth of 1.0 percent (CAGR). Despite these gains, manufacturing employment in Tennessee is still projected to fall over the next ten years, though by only 0.1 percent (CAGR), with some near-term gains being overwhelmed by longer-term setbacks. This is much less severe than the 2.1
percent (CAGR) contraction in manufacturing jobs that occurred in Tennessee between 2005 and 2015. Manufacturing output, on the other hand, is expected to grow as a result of productivity gains between 2015 and 2025.
Subsequent sections of this chapter take a retrospective look at economic growth between 2005 and the present as well as the state’s long-term outlook through 2025.
3.1. Introduction, continued
3.2. Employment Outlook
Between 2005 and 2015 nonfarm employment grew by 4.7 percent in Tennessee, which is equivalent to a meager 0.5 percent CAGR. Employment growth was slightly faster across the nation where jobs expanded by 5.9 percent, yielding a 0.6 percent CAGR. Slow growth during this period was largely due to the Great Recession, but there were still some bright spots in Tennessee’s labor market. Employment in the education and health services sector grew by 24.1 percent, professional and business services employment expanded by 22.6 percent, and leisure and hospitality jobs grew by 16.7 percent. This was counteracted by an 18.9 percent reduction in manufacturing jobs, a 12.2 percent drop in information sector employment, and an 8.6 percent contraction in the natural resources, mining, and construction labor force.
Table 3.1 provides a snapshot of Tennessee’s historical employment situation ten years ago as well as a projection of the state’s employment outlook ten years from now. Over the last ten years the manufacturing sector has suffered the largest losses, losing over 77,000 jobs and contracting by 2.1 percent (CAGR). Table 3.2 provides a more detailed look into the employment dynamics of the manufacturing sector. Between 2005 and 2015 employment in the durable goods sector fell by 1.8 percent (CAGR) or 42,900 jobs, while nondurable goods employment fell by 2.5 percent (CAGR) or 34,400 jobs. All subsectors within manufacturing were on the decline except for transportation equipment which grew by 0.5 percent (CAGR)
or 3,600 jobs and in the beverage and tobacco sector where employment increased by 0.1 percent (CAGR). Employment in the furniture and printing and related support sectors saw the steepest declines, shrinking by 7.1 percent (CAGR) each.
Looking ahead ten years, nonfarm employment in Tennessee is projected to grow by 12.1 percent between 2015 and 2025, representing a compound annual growth rate of 1.1 percent. This is slightly faster than the 10.3 percent growth rate expected for the nation (equivalent to a 1.0 percent compound annual growth rate). The manufacturing sector is expected to see a very slight contraction in employment over the next ten years, while all other sectors are projected to grow or remain stable. Employment growth will be largest in the professional and business services sector, followed by education and health services, and natural resources, mining, and construction. Within the manufacturing sector, durable goods employment is projected to increase by 0.4 percent (CAGR) between 2015 and 2025 while nondurable goods employment will fall by 1.0 percent (CAGR).
Figure 3.1 shows state and national employment growth patterns over the long-term forecast period. Nonfarm employment growth in Tennessee closely mirrors the trend of the national economy, as both are expected to see positive growth throughout the forecast horizon. Of course, since this is a trend forecast the underlying assumption is that no recessions will occur within the next ten years, but a recession at some point during the long-term forecast horizon is possible if not likely.

2016 TENNESSEE ECONOMIC REPORT | 4746 | 2016 TENNESSEE ECONOMIC REPORT
The Tennessee Economy: Long-Term Outlook | CHAPTER 3
Table 3.1: Tennessee Nonfarm Employment by Broad Sector (Thousands of Jobs)
The outlook for manufacturing employment, on the other hand, is not as optimistic. For the nation, manufacturing employment growth will remain positive for most of the forecast horizon but trend towards zero. In Tennessee, manufacturing
employment will see some positive growth over the next four years, and then revert to trend contraction in 2020 and throughout the rest of the long-term outlook.
Figure 3.2 presents employment growth patterns
3.2. Employment Outlook, continued
Table 3.1: Tennessee Nonfarm Employment by Broad Sector (thousands of jobs)
2005 2015 2025 2005 to 2015 2015 to 2025Total Nonfarm 2,743.0 2,870.7 3,217.7 0.5 1.1Natural Resources, Mining & Construction 125.3 114.5 136.4 -0.9 1.8Manufacturing 408.8 331.5 327.3 -2.1 -0.1Trade, Transportation, Utilities 598.0 607.5 651.6 0.2 0.7Information 49.4 43.4 45.0 -1.3 0.4Financial Activities 143.3 144.8 152.1 0.1 0.5Professional & Business Services 312.5 383.0 509.3 2.1 2.9Education & Health Services 330.3 409.8 489.1 2.2 1.8Leisure & Hospitality 262.1 305.9 351.9 1.6 1.4Other Services 100.7 104.8 103.0 0.4 -0.2Government 412.7 425.6 452.0 0.3 0.6
U.S. Nonfarm 134.0 141.9 156.5 0.6 1.0U.S. Manufacturing 14.2 12.3 12.9 -1.4 0.4
*Compound Annual Growth RateSource: Bureau of Labor Statistics and CBER-UT
Growth Rate (%)*Employment
*Compound Annual Growth RateSource: Bureau of Labor Statistics and CBER-UT.
Table 3.2: Tennessee Manufacturing Emplyoment by Sector (thousands of jobs)
2005 2015 2025 2005 to 2015 2015 to 2025Manufacturing 408.8 331.5 327.3 -2.1 -0.1
Total Durable Goods 254.6 211.7 219.3 -1.8 0.4Wood Products 17.7 11.6 12.1 -4.2 0.4Nonmetallic Minerals 15.9 11.7 11.2 -3.0 -0.4Primary Metals 12.0 10.3 10.1 -1.5 -0.2Fabricated Metals 42.6 35.2 34.2 -1.9 -0.3Machinery 33.9 26.2 25.8 -2.5 -0.2Computers & Electronics 10.4 5.1 3.7 -6.9 -3.2Electrical Equipment, Appliances & Components 23.5 19.9 21.2 -1.6 0.6Transportation Equipment 63.9 67.5 78.4 0.5 1.5Furniture 19.2 9.2 7.9 -7.1 -1.5Miscellaneous Durables 15.3 15.1 14.8 -0.1 -0.2
Total Nondurable Goods 154.2 119.8 107.9 -2.5 -1.0Food 34.3 32.9 31.8 -0.4 -0.3Beverage & Tobacco 5.4 5.5 4.8 0.1 -1.4Textile Mills, Textile Mill Products & Apparel 18.0 9.6 6.4 -6.1 -4.0Paper 18.9 14.3 11.8 -2.8 -1.9Printing & Related Support 18.8 9.0 7.7 -7.1 -1.5Chemicals 27.2 25.2 22.2 -0.8 -1.3Plastics & Rubber 29.3 21.3 21.7 -3.1 0.2Miscellaneous Nondurable Goods 2.3 2.1 1.5 -0.9 -3.3
*Compound Annual Growth RateSource: Bureau of Labor Statistics and CBER-UT
Employment Growth Rate (%)*
Table 3.2: Tennessee Manufacturing Employment by Sector (Thousands of Jobs)
*Compound Annual Growth RateSource: Bureau of Labor Statistics and CBER-UT.
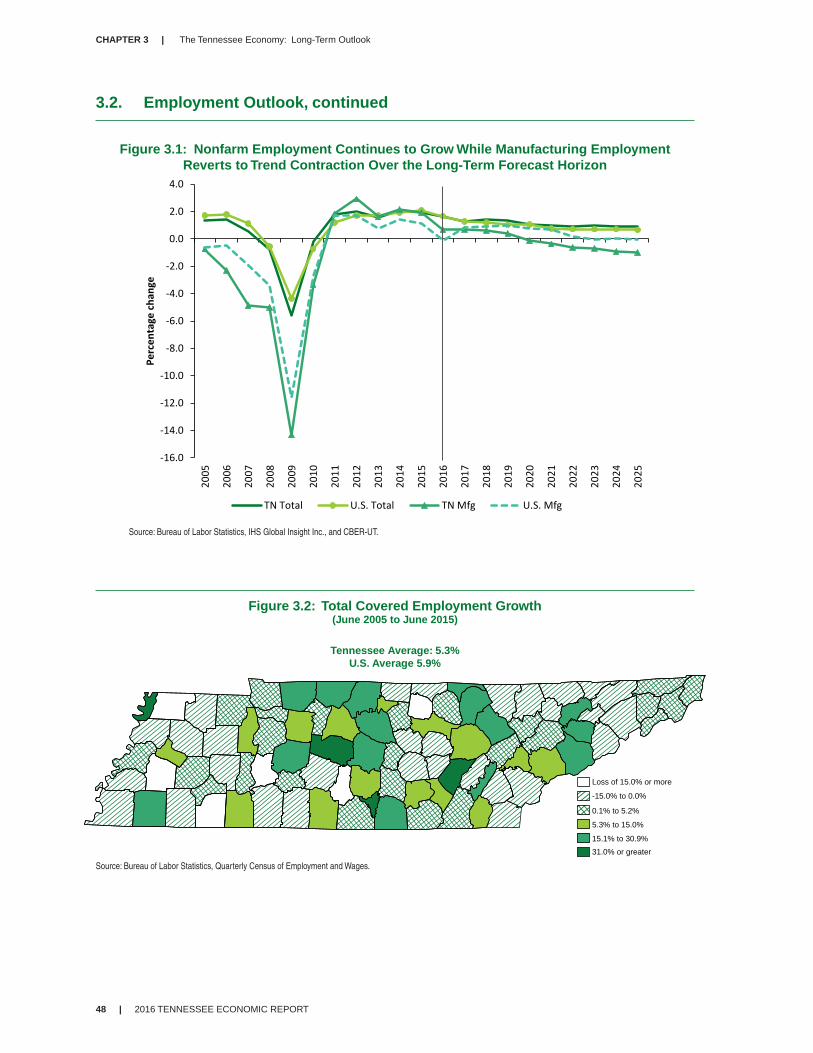
2016 TENNESSEE ECONOMIC REPORT | 4948 | 2016 TENNESSEE ECONOMIC REPORT
CHAPTER 3 | The Tennessee Economy: Long-Term Outlook
-16.0
-14.0
-12.0
-10.0
-8.0
-6.0
-4.0
-2.0
0.0
2.0
4.0
2005
2006
2007
2008
2009
2010
2011
2012
2013
2014
2015
2016
2017
2018
2019
2020
2021
2022
2023
2024
2025
Perc
enta
ge c
hang
e
TN Total U.S. Total TN Mfg U.S. Mfg
3.2. Employment Outlook, continued
Figure 3.1: Nonfarm Employment Continues to Grow While Manufacturing Employment Reverts to Trend Contraction Over the Long-Term Forecast Horizon
Source: Bureau of Labor Statistics, IHS Global Insight Inc., and CBER-UT.
Figure 3.2: Total Covered Employment Growth(June 2005 to June 2015)
Source: Bureau of Labor Statistics, Quarterly Census of Employment and Wages.
Tennessee Average: 5.3%U.S. Average 5.9%
-15.0% to 0.0%
0.1% to 5.2%
5.3% to 15.0%
15.1% to 30.9%
Loss of 15.0% or more
31.0% or greater

2016 TENNESSEE ECONOMIC REPORT | 4948 | 2016 TENNESSEE ECONOMIC REPORT
The Tennessee Economy: Long-Term Outlook | CHAPTER 3
0.0
2.0
4.0
6.0
8.0
10.0
12.0
Rate
(%)
TN US
across all Tennessee counties between 2005 and 2015. There were 36 counties that experienced employment contractions over the last ten years. Jackson County and McNairy County were hit hardest, contracting by 33.1 percent and 31.5 percent respectively. Conversely, there were ten counties which grew by at least 20.0 percent. Lake County saw the strongest employment gains, growing by an astounding 88.6 percent, though due to Lake County’s small size, this only represented an increase of 893 jobs. Williamson
County came in second with employment growth of 54.4 percent, representing an additional 40,697 jobs, followed by Bledsoe County at 47.3 percent or 691 additional jobs. In addition, employment in Rutherford County grew by 22.0 percent or 20,878 jobs, Davidson County employment increased by 5.5 percent or 23,694 jobs, employment in Knox County expanded by 5.2 percent or 11,420 jobs, while in Shelby County employment fell by 2.2 percent or 11,081 jobs.
3.2. Employment Outlook, continued
Figure 3.3: In the Long-Run, Tennessee’s Unemployment Rate Will Trend Downwards but Remain Above the National Rate for Most of the Forecast Horizon
Source: Bureau of Labor Statistics, IHS Global Insight Inc., CBER-UT.
3.3. Unemployment
Over the last ten years the state unemployment rate has generally rested slightly above the national rate. A similar pattern is projected for the next ten years as Tennessee’s unemployment rate will remain just above its national counterpart
throughout most of the long-term forecast (see Figure 3.3). However, the state and national rate are both expected to trend downwards over the next ten years. Tennessee’s unemployment rate was 5.9 percent in 2015 and is projected to fall to
U.S.

2016 TENNESSEE ECONOMIC REPORT | 5150 | 2016 TENNESSEE ECONOMIC REPORT
CHAPTER 3 | The Tennessee Economy: Long-Term Outlook
3.3. Unemployment, continued
5.1 percent by 2025. The national rate is pegged at 5.3 percent in 2015 and is expected to fall to 5.0 percent by 2025.
Tennessee’s labor force participation rate has been severely depressed in recent years, as currently almost half of the state’s adult population is not in the workforce. (The labor force is defined as the share of the adult population that is either employed or actively seeking employment.) In 2005, Tennessee’s labor force participation rate was 62.0 percent and only slightly below the national participation rate of 64.5 percent. In 2015, the state’s labor force participation rate fell to 57.7 percent and is projected to fall even further to 55.1 percent by 2025; the national labor force participation rate has fallen as well and will rest slightly above 60 percent in 2025. There are a number of reasons for this low participation rate in Tennessee. As was suggested in Chapter 2, poor health status and low educational attainment in Tennessee are two potential contributors to low labor force participation. Specifically, in 2013 Tennessee had the fifth highest adult smoking rate (24.3 percent in Tennessee compared to 19.0 percent in the U.S.) and fourth highest obesity rate in the nation (33.7 percent in Tennessee compared to 29.4 percent in the U.S.).1 Moreover, Tennessee’s average life 1Center for Disease Control and Prevention, Behavior Risk Factor Surveillance System.
expectancy (76.3 years)2 is the eight lowest in the nation and well below the national average of 78.8 years.3 Generally Tennesseans have poorer health status than their national counterparts. With regards to educational attainment, the percentage of Tennesseans with at least a high school degree (85.8 percent) is slightly below the national average (86.9 percent), but Tennessee has shown solid gains relative to the nation since 2010 (see Figure 3.4). More importantly, the percentage of Tennesseans with at least a Bachelor’s degree (25.3 percent) lags behind the national average of 30.1 percent and has not shown the same gains relative to the national average as has been the case with high school achievement.
State initiatives such as the Tennessee Promise, which offers two years of tuition-free community college or technical college to all Tennessee high school graduates, and the Drive to 55, with its goal of increasing the percentage of Tennesseans with a college degree or certificate to 55 percent of the Tennessee population by 2025, aim to increase the education status of the state. If the hoped-for gains are realized, this will support a stronger growth trajectory for the state economy. This could support stronger income growth and a narrowing of the gap between the incomes of Tennesseans and other Americans. 2Measure of America 2013-2014.3Center for Disease Control and Prevention, National Center for Health Statistics.
23.125.3
28.230.1
0.0
5.0
10.0
15.0
20.0
25.0
30.0
35.0
2010 2014
Perc
enta
ge o
f the
pop
ulat
ion
aged
25
year
s and
old
er
TN U.S.
Bachelor’s degree or higher
83.6
85.885.6
86.9
81.0
82.0
83.0
84.0
85.0
86.0
87.0
88.0
2010 2014
Perc
enta
ge o
f the
pop
ulat
ion
aged
25
year
s and
old
er
TN U.S.
High school graduates or higher
Figure 3.4: Educational Attainment Levels in Tennessee Are Below the National Average
Source: U.S. Census Bureau.

2016 TENNESSEE ECONOMIC REPORT | 5150 | 2016 TENNESSEE ECONOMIC REPORT
The Tennessee Economy: Long-Term Outlook | CHAPTER 3
3.3. Unemployment, continued
None of these explanations fully explain the labor force participation trends that have taken place in Tennessee and across the country. As the Great Recession unfolded and participation rates began to sag, there was speculation that a stronger labor market and better job opportunities would ultimately draw workers back into the labor force. To date this has not occurred. However, it remains a distinct possibility as labor markets in Tennessee and across the U.S. tighten further and job gains remain robust.
Figure 3.5 reports non-seasonally adjusted unemployment rates across all Tennessee counties for November 2005 and November 2015. In November 2005, the unemployment rate in Tennessee was 5.3 percent (not seasonally-adjusted). There were 29 counties with an unemployment rate at or below the state average and 11 counties with a rate equal to or below the
national average of 4.8 percent (not seasonally-adjusted). Among all Tennessee counties in 2005, Williamson County registered the lowest unemployment rate at 3.9 percent, followed by Rutherford and Cheatham Counties at 4.2 percent, and Knox County at 4.3 percent. Conversely, there were four counties with unemployment rates above 10 percent – Clay County (13.4 percent), Lawrence County (13.4 percent), Wayne County (12.6 percent), and White County (10.2 percent). By comparison, in November 2015 Tennessee’s unemployment rate was 5.4 percent (not seasonally-adjusted), which was slightly above the national rate of 4.8 percent (not seasonally-adjusted). There were 28 counties with an unemployment rate equal to or below the state rate and 12 counties equal to or below the national rate. Once again, the lowest unemployment rate was in Williamson County (3.9 percent), while Rutherford
Figure 3.5: Unemployment Rates in 2015 Are Comparable to Their 2005 Counterparts in Most Tennessee Counties
Source: U.S. Bureau of Labor Statistics.
November 2005Tennessee: 5.3%United States: 4.8%
November 2015Tennessee: 5.4%United States: 4.8%
4.0% to 5.3%
5.4% to 6.7%6.8% to 7.9%8.0% to 9.3%
Less than 4.0%
9.4% or greater

2016 TENNESSEE ECONOMIC REPORT | 5352 | 2016 TENNESSEE ECONOMIC REPORT
CHAPTER 3 | The Tennessee Economy: Long-Term Outlook
3.3. Unemployment, continued
and Davidson Counties had the second lowest rate at 4.2 percent. Moreover, there were zero counties with an unemployment rate above 10 percent. Hancock County, with an unemployment rate of 9.9 percent, had the highest rate among Tennessee counties, followed by Lauderdale County at 9.4 percent.
In comparing county-level unemployment rates between 2005 and 2015, there were 30 counties that saw their unemployment rate fall, six counties that reported no change, and 59 counties that experienced an increase in their unemployment rate. However, in 33 counties the rate change was
less than 0.5 percentage points. Lawrence County saw the biggest drop in its unemployment rate, falling from 13.4 percent in 2005 down to 6.8 percent in 2015, an amazing 6.6 percentage point drop. Four other counties enjoyed unemployment rate drops in excess of 4.0 percentage points (Clay, Warren, Wayne, and White Counties.) Conversely, the largest rate increase was in Obion County where the unemployment rate increased from 5.3 percent in 2005 to 8.4 percent in 2015. Five additional counties saw their unemployment rate increase by 2.0 percentage points or more (Dyer, Hancock, Marion, McNairy, and Scott Counties)
3.4. Population
Over the long-term, population changes will have a large impact on employment and economic activity in Tennessee since population directly affects the size of the state’s labor force. Between 2005 and 2015, Tennessee’s population grew by 12.4 percent, outpacing national population growth of 8.7 percent. These records equate to compound annual growth rates of 1.2 percent for Tennessee and 0.8 percent for the nation. Between 2015 and 2025 population growth for the state and nation are projected to slow down slightly, as Tennessee will see an 11.2 percent growth rate while the U.S. will see 8.1 percent growth.
Figure 3.6 presents historical and projected population growth at the county level for 2005 to 2015 and 2015 to 2025. Between 2005 and 2015, Montgomery, Rutherford, and Williamson
Counties all saw spectacular population growth rates of 30 percent or higher. There were seven additional counties with growth between 20 and 30 percent (Fayette, Loudon, Robertson, Sequatchie, Sevier, Sumner, and Wilson County). Conversely, Clay, Grundy, Hardeman, Haywood, and Obion Counties all saw their populations decline.
Between 2015 and 2025, Williamson County is projected to see the strongest rate of population growth, expanding by 33.7 percent equating to an additional 71,117 residents, followed by Rutherford County at 29.7 percent or 90,689 additional residents. Fayette, Montgomery, and Wilson Counties will also see population growth in excess of 20 percent. Projections indicate that Clay, Hardeman, Haywood, and Obion Counties will experience population contractions.

2016 TENNESSEE ECONOMIC REPORT | 5352 | 2016 TENNESSEE ECONOMIC REPORT
The Tennessee Economy: Long-Term Outlook | CHAPTER 3
3.4. Population, continued
Figure 3.6: Tennessee Population Growth
Source: U.S. Census Bureau and CBER-UT.
3.5. Personal Income and Taxable Sales
Between 2015 and 2025, nominal personal income is projected to grow by 4.5 percent (CAGR) in Tennessee, outpacing the 3.8 percent compound annual growth rate that was registered between 2005 and 2015. Income growth for the nation matched income growth in Tennessee between 2005 and 2015 but will surpass Tennessee income growth between 2015 and 2025.
Long-term income growth in Tennessee will be driven by a 5.4 percent (CAGR) increase in proprietors’ income and a 4.8 percent (CAGR) expansion in rent, interest, and dividend income between 2015 and 2025. Wages and salary income will also grow by 3.8 percent (CAGR) over the next 10 years.
Per capita income in Tennessee was only 86.8 percent of the national average in 2015. From 2015 to 2025, per capita income growth in the state is expected to grow by 3.5 percent, but lag behind national per capita income growth of 4.0 percent. As a result, state per capita income will drop to 82.5 percent of the national average by 2025. Because the state starts with a lower level of per capita income, it must actually realize stronger growth rates to ultimately catch up with the nation. As noted earlier, the state has embarked on a number of initiatives to improve the educational standing of the state’s workforce. If these investments are effective, they can mitigate or even reverse the trends that are projected here.
2005 to 2015Tennessee: 12.4%United States: 8.8%
2015 to 2025Tennessee: 11.2%United States: 8.1%
0.0% to 4.9%
5.0% to 11.1%11.2% to 17.3%17.4% to 23.5%
Less than 0.0%
23.6% or greater

2016 TENNESSEE ECONOMIC REPORT | 5554 | 2016 TENNESSEE ECONOMIC REPORT
CHAPTER 3 | The Tennessee Economy: Long-Term Outlook
3.5. Personal Income and Taxable Sales, continued
Nominal taxable sales in Tennessee are expected to grow by 3.8 percent (CAGR) between 2015 and 2025. This is much stronger than the 2.5 percent compound annual growth rate that took place between 2005 and 2015. Taxable sales growth in Tennessee will be driven by hotel and motel sales which will increase by 5.0 percent (CAGR) over the next ten years, and stronger automobile dealer
sales, which are projected to grow by 4.6 percent (CAGR) between 2015 and 2025, compared to only 2.2 percent (CAGR) over the last ten years. Purchases from manufacturers will also increase by 3.9 percent (CAGR) in the next ten years, compared to only 0.1 percent (CAGR) growth between 2005 and 2015.
3.6. State Gross Domestic Product
Inflation-adjusted state gross domestic product (GDP) grew by only 0.7 percent in 2013 but then rebounded in 2014, growing by 2.3 percent. Growth of 2.4 percent is expected for 2015 and 2.3 percent growth is projected for 2016. Similar growth was seen in the nation as real GDP advanced 2.4 percent in both 2014 and 2015 but is expected to see a faster 2.7 percent growth rate in 2016. Over the long-run forecast horizon, output in Tennessee is expected to continue growing at a similar albeit slightly slower trend, averaging roughly 2.2 percent growth per year over the next ten years.
Table 3.3 presents a summary of the long-run outlook for inflation-adjusted state GDP. Between 2005 and 2015, inflation-adjusted state GDP grew by a sluggish 1.1 percent (CAGR) in Tennessee, which was slightly slower than the 1.4 percent compound annual growth rate that inflation-adjusted GDP registered for the nation. Of course, this time period encapsulates the Great Recession which suppressed output growth in the late 2000’s. Over the last decade, production in the construction sector and other services sector were hit hardest, falling by a compound annual growth rate of 1.5 percent each. The manufacturing sector
grew by a sluggish 0.8 percent (CAGR) between 2005 and 2015, but production has nearly clawed back to the pre-recession peak levels registered in 2006. Conversely, service sectors such as professional and business services and education and health services saw output grow by more than 2.5 percent (CAGR) over the last ten years. Financial activities output also expanded by 2.5 percent (CAGR) and natural resources and mining production grew by 2.3 percent (CAGR).
Looking ahead ten years, inflation-adjusted state GDP will grow by 2.2 percent (CAGR) between 2015 and 2025. This is slightly slower than the 2.4 percent compound annual growth rate projected for national GDP. In Tennessee, professional and business services output is projected to grow the fastest over the next ten years, expanding by 3.7 percent (CAGR), followed by natural resources and mining output at 3.4 percent (CAGR). State manufacturing output will advance 2.3 percent (CAGR), as durable goods manufacturing production increases by 2.8 percent (CAGR) and nondurable goods manufacturing output grows 1.5 percent (CAGR). It is notable that manufacturing output will expand while manufacturing employment is expected to contract.

2016 TENNESSEE ECONOMIC REPORT | 5554 | 2016 TENNESSEE ECONOMIC REPORT
The Tennessee Economy: Long-Term Outlook | CHAPTER 3
3.6. State Gross Domestic Product, continued
Table 3.3: Tennessee Inflation-Adjusted Gross Domestic Product by Sector
*Compound Annual Growth RateSource: Bureau of Economic Analysis and CBER-UT.
Table 3.3: Tennessee Inflation-Adjusted Gross Domestic Product by Sector
2005 2015 2025 2005 to 2015 2015 to 2025State Gross Domestic Product 252,717 281,548 349,209 1.1 2.2
Natural Resources & Mining 2,553 3,216 4,486 2.3 3.4Construction 11,319 9,756 12,058 -1.5 2.1Manufacturing 43,954 47,428 59,291 0.8 2.3
Durable Goods 26,116 27,410 36,122 0.5 2.8Nondurable Goods 17,838 20,017 23,170 1.2 1.5
Trade, Transportation, Utilities 52,831 52,904 65,661 0.0 2.2Wholesale Trade 18,420 18,933 24,685 0.3 2.7Retail Trade 20,139 19,590 23,870 -0.3 2.0Transportation & Utilities 14,272 14,382 17,106 0.1 1.7
Information 7,424 9,068 11,988 2.0 2.8Financial Activities 35,367 45,432 56,876 2.5 2.3Professional & Business Services 25,285 33,169 47,691 2.8 3.7Education & Health Services 22,995 29,853 36,806 2.6 2.1Leisure & Hospitality 11,330 11,960 14,349 0.5 1.8Other Services 7,496 6,477 6,060 -1.5 -0.7Government 32,163 32,285 33,943 0.0 0.5
Federal 8,507 7,582 6,214 -1.1 -2.0State & Local 23,656 24,704 27,729 0.4 1.2
*Compound Annual Growth RateSource: Bureau of Economic Analysis and CBER-UT
Level (millions of 2009 dollars) Growth Rate (%)*

2016 TENNESSEE ECONOMIC REPORT | 5756 | 2016 TENNESSEE ECONOMIC REPORT

2016 TENNESSEE ECONOMIC REPORT | 5756 | 2016 TENNESSEE ECONOMIC REPORT
Tennessee’s Drive to 55: Background, Early Results, and Challenges Lying Ahead | CHAPTER 4
CHAPTER 4: TENNESSEE’S DRIVE TO 55: BACKGROUND, EARLY RESULTS, AND CHALLENGES LYING AHEAD
4.1. Introduction and Key Points
Tennessee’s “Drive to 55” is an effort initiated in 2013 to have 55 percent of working-age Tennesseans hold a higher education credential by 2025. The initiative has three major branches. Tennessee Promise focuses on young adults at the cusp between high school and college, offering state-funded grants to cover the gap between other sources of financial aid and community college tuition and fees. The underlying message, “Free Community College,” has proven to be compelling, in many cases instantly transforming a young person’s view of college. But with around 90,000 18-year old Tennesseans in a given year, Tennessee’s working-age population of 3.5 million will not meet the 55 percent threshold in twelve years by focusing exclusively on young, traditional
college students. With this in mind, the second branch of Drive to 55 applies to older adults who might like to go back to school: if so, Tennessee Reconnect grants offer them free passage through the Tennessee College of Applied Technology system, which provides laser-focused vocational programs. And to ensure that Tennessee Promise and Reconnect do not operate with blinders to actual job opportunities, the relatively newer Tennessee LEAP intends to identify skill gaps in the state and align them with college programs.
Stepping back a moment, why 55 percent? Influential 2012 and 2013 Georgetown University studies projected that by 2020, 55 – 58 percent of Tennessee jobs would require at least some college training, or conversely, that a high school diploma
In this chapter—
4.1. Introduction and Key Points
4.2. The Landscape of College Progression in Tennessee 4.3. Will “Free Community College” Make a Difference in Tennessee? Early Indicators
4.4. Challenges and Opportunities Changing the Culture of College Aspirations Undermatching Readiness and Research The Other 45 percent
4.5. Acknowledgements
4.6. References

2016 TENNESSEE ECONOMIC REPORT | 5958 | 2016 TENNESSEE ECONOMIC REPORT
CHAPTER 4 | Tennessee’s Drive to 55: Background, Early Results, and Challenges Lying Ahead
would suffice for only 42 – 45 percent of jobs. This study, alongside the Lumina Foundation’s claim that 60 percent of Americans should hold a postsecondary credential by 2025 (“Goal 2025”), are typically cited as motivating factors behind Governor Haslam’s choice of 55 percent. This is not as high as the Lumina Foundation’s national target, but higher than the target implied by the Georgetown studies, which considered postsecondary certificates as equivalent to “some college, no degree.” Regardless, the state’s goal to raise postsecondary attainment to at least 55 percent within twelve years is rightly called a “moon launch” given that the starting point was closer to 36 percent.
This chapter focuses on the first branch of Drive to 55, that is, Tennessee Promise efforts that aim to increase the flow of young people into college and through college successfully. If Promise and affiliated programs are able to build and sustain higher rates of college enrollment and completion among traditional-aged students, Drive to 55 efforts will outlive 2025 as new waves of young adults build the base of college-educated workers with each passing year.
Section 1 surveys the pre-Promise landscape of student progression into college or the workforce after high school. Section 2 reviews early evidence on the effect of Promise and its privately-funded predecessors on college enrollment and persistence. Section 3 highlights some of the challenges and opportunities lying ahead. Key findings and points of discussion include:
• Prior to Tennessee Promise, 54 - 55 percent of high school graduates enrolled in college shortly after graduation. Those that did not go to college earned just $8,715 – 8,838 the
year after graduation, on average, if they worked at all. Dropouts earned even less.
• Knox Achieves, one of the privately-funded initiatives that served as a model for Tennessee Promise, is linked to a 2 – 3 percentage-point greater rate of college enrollment among typical high school senior classes and a 3 – 5 percentage-point gain in community college enrollment. Results imply that most – but not all – of the students whose college decisions were swayed by the program chose college over work rather than a two-year college over a four-year college.
• Results from Knox Achieves foreshadowed the first year of Tennessee Promise. First-year student enrollment rose substantially across Tennessee’s public higher education systems, but large growth in two-year programs were possibly offset to a degree by declines in four-year university enrollment.
• Going forward, one challenge for the Tennessee Promise branch of the Drive to 55 will be to ensure that transfer pathways between two-year and four-year college sectors are seamless. At the same time, high rates of remedial education in two-year colleges and low rates of degree or certificate completion call attention to college readiness and persistence. The state has a rich history of education policy research: more is needed now to identify cost-effective policies and programs that help students meet their postsecondary goals. Finally, factors behind economic security and success for “the other 45 percent” warrant closer examination.
4.1. Introduction and Key Points, continued
4.2. The Landscape of College Progression in Tennessee
Before turning to early indicators of success for Tennessee Promise, we first survey the pre-Promise landscape of student progression through high school and into college. These patterns,
which closely reproduce similar data reported by the Harvard Strategic Data Project and the state Department of Education, offer a detailed view of the Drive to 55 starting point as it relates to

2016 TENNESSEE ECONOMIC REPORT | 5958 | 2016 TENNESSEE ECONOMIC REPORT
Tennessee’s Drive to 55: Background, Early Results, and Challenges Lying Ahead | CHAPTER 4
4.2. The Landscape of College Progression in Tennessee, continued
traditional college students. The extent to which these patterns change in the coming years will be one measure of the success of Tennessee Promise and the Drive to 55 more broadly.
Student progression is defined by the education choices students make after reaching the age when they can legally leave school (17 in Tennessee) as well as evident career readiness for students who do not pursue college. Here, we document trends in on-time high school progression, on-time regular high school graduation, seamless college enrollment, and for students who do not go on to college, first-year workforce outcomes. We include timely progression through high school alongside postsecondary benchmarks because over the coming years, student success in high school may reasonably be affected by policies that make college more feasible. More specific definitions for student progression outcomes are as follows:
• On-time 10th grade: enrolling in 10th grade one academic year after starting 9th grade.
• On-time 11th grade: enrolling in 11th grade two academic years after starting 9th grade.
• On-time 12th grade: enrolling in 12th grade three academic years after starting 9th grade.
• On-time regular high school graduation: obtaining a regular high school diploma (not a GED) within four academic years of starting 9th grade.
• Seamless college enrollment: enrolling in any college by October 1st following high school graduation.
• For high school graduates who do not enroll in college the year after high school (by March 1st of the year after graduation), we identify several workforce outcomes from the first calendar year (January through December) after graduation.
o Labor force participation: having any record of earnings in the state Unemployment Insurance (UI) data files. Note that this will exclude out-of- state work, self-employment, some agricultural work, and military enlistment. o For graduates in the UI workforce,
January through December earnings.o For graduates in the UI workforce, the dominant industry of employment.o For dropouts, labor force participation and earnings five years after starting 9th grade.We identified students who enrolled in
Tennessee public schools as 9th graders in 2007-2008 and 2008-2009. Longitudinal data allow us to follow these students as they progressed through high school and into college or the workforce. Data were combined from administrative records held by the Tennessee Department of Education (TDOE), the Tennessee Higher Education Commission (including college enrollment records from the National Student Clearinghouse), and the Tennessee Department of Labor and Workforce Development.1
Table 1 illustrates typical student progression patterns. From here on we refer to cohorts by the academic year they began high school (so, students entering in 2008-2009 represent the cohort of 2009 9th graders) or the academic year in which they graduated (students graduating in 2010-2011 represent the 2011 graduating cohort).
Trends depicted in Table 1 take place during a truly unique time that encompasses the Great Recession and its immediate aftermath. Significant job losses occurred in 2008 and 2009 and significant job gains were not realized until 2011, when the cohort of 2008 9th graders were typically in 12th grade and 2009 9th graders were in 11th grade. The annual state unemployment rate in Tennessee peaked at 10.5 percent in 2009 while the national rate peaked in the following year at 9.6 percent. Significant changes in labor force participation rates and inflation-adjusted earnings also occurred over this period of time. Many of these changes had a disproportionate effect on lower skilled and younger workers. Such patterns may have affected decisions on programs of study, college choice, and the tradeoff between work, college, and unemployment. These dramatic changes in the economy and labor market are
1We exclude students who transferred out of Tennessee public schools prior to high school completion or prior to dropping out, but we include students who transferred in to Tennessee schools after 9th grade. We omit students in alternative or vocational high schools.

2016 TENNESSEE ECONOMIC REPORT | 6160 | 2016 TENNESSEE ECONOMIC REPORT
CHAPTER 4 | Tennessee’s Drive to 55: Background, Early Results, and Challenges Lying Ahead
an important backdrop to all of the descriptive statistics discussed below.2
Table 2 lists descriptive statistics for each progression outcome, along with sample size. High school progression outcomes follow the expected pattern, with on time graduation noticeably less likely than on time 12th grade, which is less likely than on time 11th grade, which is less likely than on time 10th grade. We find that 87 - 88 percent of 9th graders in these cohorts completed high school within four years.3
Among all high school graduates, including on-time and late graduates, 51 – 52 percent seamlessly enrolled in college (whether part-time or full-time is not known) by October 1st of the year they graduated. Just over 1 in 3 graduates went to a four-year college or university and just over 1 in 6 went to a two-year community college or technology center.4
What happened to graduates who did not go straight to college? We find that 3 percent of graduates enrolled after a break from school but no later than March 1st of the year after graduation. The majority of late enrollees attended two-year institutions. For those who did not enroll in college at all the year after graduation, we can get a very short-sighted view of their career readiness by examining Tennessee workforce outcomes. Using statewide records on earnings reported to the 2See Chapter 4 of Murray et al. (2015) for a detailed analysis of structural changes in the labor market over the arc of the Great Recession. 3Not shown in Table 2: another 1 - 2 percent of students graduated one or two years later.4These figures include enrollment at in-state, out-of-state, public, and private institutions. College enrollment data are drawn from the National Student Clearinghouse, a non-profit organization that maintains enrollment records for (as of this writing) well over 90 percent of postsecondary students.
Unemployment Insurance system,5 we find that just 2 out of 3 graduates who did not go straight to college were in the Tennessee workforce the year after graduation (Table 3). Of those who were working, nominal first-year earnings averaged $8,715 for the 2008 cohort (who would have typically graduated in 2011) and $8,838 for the 2009 cohort.6 Note that these low average earnings typically reference 2012 and 2013 calendar years, and thus they must be considered alongside the Great Recession cycle and its uneven impact on younger, lower skilled, less educated individuals.
Three-quarters of graduates who did not go straight to college were found working in one of three industries the year after graduation: food and accommodation services, retail, or business services.7 The “business service” category includes finance, accounting, insurance, real estate, and 5First-year earnings are measured over January – December of the year after high school graduation. Again, we note that Unemployment Insurance records exclude earnings from self-employment, earnings from other states, some forms of agricultural or domestic pay, and some federal earnings (including military pay).6These earnings are not adjusted for inflation, which measured about 1 percent between 2012 and 2013 when, respectively, the 2008 and 2009 9th grade cohorts were typically out of high school and working. The 2008 cohort’s inflation-adjusted earnings of $8,802 were very similar to $8,838 average earnings among the 2009 cohort. We do not observe hours worked, so it is not possible to directly discern who was working part-time and who was working full-time. A very small share of students had earnings that would exceed full-time pay at the minimum wage.7Industry participation is assessed from NAICS codes reported by employers to the Unemployment Insurance system. Individuals can be associated with more than one industry in a given year or in a given quarter. These statistics refer to the primary, or most frequent, industry of occupation in the year after high school, allowing for ties between two or more industries. Accordingly, industry percentages add up to more than 100 percent. NAICS data do not allow identification of an individual’s occupation. The NAICS code that an individual is linked to may change because his or her firm opted to identify under a difference NAICS (following a merger or change in operational focus, perhaps), although these instances are likely rare relative to the more common occurrence of a worker’s movement into a different firm and industry.
4.2. The Landscape of College Progression in Tennessee, continued
Table 4.1: Timely Student Progression Among 2007 and 2008 9th GradersTable 4.1: Timely student progression among 2007 and 2008 9th graders
Grade Spring year 9th 10th 11th 12th Post-secondary 2008 C08 2009 C09 C08 2010 C09 C08 2011 C09 C08 2012 C09 C08 2007 cohort 2013 C09 2008 cohort 2014
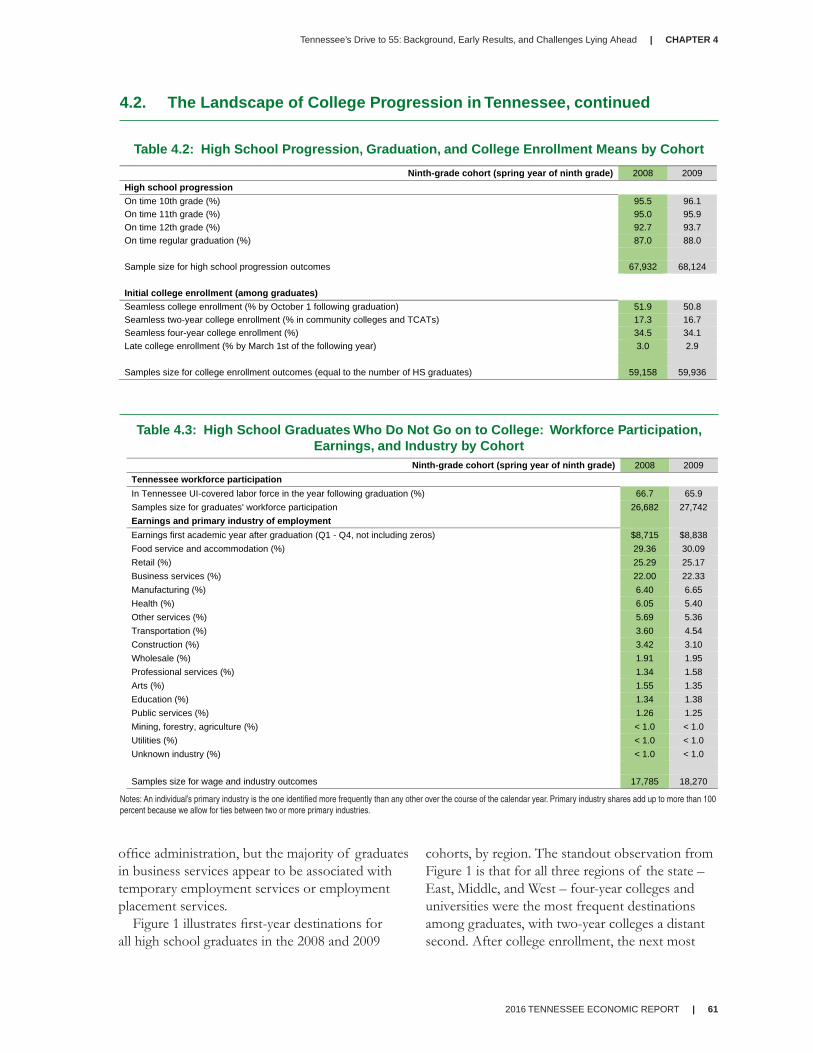
2016 TENNESSEE ECONOMIC REPORT | 6160 | 2016 TENNESSEE ECONOMIC REPORT
Tennessee’s Drive to 55: Background, Early Results, and Challenges Lying Ahead | CHAPTER 4
4.2. The Landscape of College Progression in Tennessee, continued
Table 4.2. High school progression, graduation, and college enrollment means by cohort
Ninth-grade cohort (spring year of ninth grade) 2008 2009 High school progression On time 10th grade (%) 95.5 96.1 On time 11th grade (%) 95.0 95.9 On time 12th grade (%) 92.7 93.7 On time regular graduation (%) 87.0 88.0 Sample size for high school progression outcomes 67,932 68,124 Initial college enrollment (among graduates) Seamless college enrollment (% by October 1 following graduation) 51.9 50.8 Seamless two-year college enrollment (% in community colleges and TCATs) 17.3 16.7 Seamless four-year college enrollment (%) 34.5 34.1 Late college enrollment (% by March 1st of the following year) 3.0 2.9 Samples size for college enrollment outcomes (equal to the number of HS graduates) 59,158 59,936
Table 4.2: High School Progression, Graduation, and College Enrollment Means by Cohort
Table 4.3: High school graduates who do not go on to college: Workforce participation, earnings, and industry by cohort
Ninth-grade cohort (spring year of ninth grade) 2008 2009 Tennessee workforce participation In Tennessee UI-covered labor force in the year following graduation (%) 66.7 65.9 Samples size for graduates' workforce participation 26,682 27,742 Earnings and primary industry of employment Earnings first academic year after graduation (Q1 - Q4, not including zeros) $8,715 $8,838 Food service and accommodation (%) 29.36 30.09 Retail (%) 25.29 25.17 Business services (%) 22.00 22.33 Manufacturing (%) 6.40 6.65 Health (%) 6.05 5.40 Other services (%) 5.69 5.36 Transportation (%) 3.60 4.54 Construction (%) 3.42 3.10 Wholesale (%) 1.91 1.95 Professional services (%) 1.34 1.58 Arts (%) 1.55 1.35 Education (%) 1.34 1.38 Public services (%) 1.26 1.25 Mining, forestry, agriculture (%) < 1.0 < 1.0 Utilities (%) < 1.0 < 1.0 Unknown industry (%) < 1.0 < 1.0 Samples size for wage and industry outcomes 17,785 18,270 Notes: An individual’s primary industry is the one identified more frequently than any other over the course of the calendar year. Primary industry shares add up to more than 100 percent because we allow for ties between two or more primary industries.
Table 4.3: High School Graduates Who Do Not Go on to College: Workforce Participation, Earnings, and Industry by Cohort
Notes: An individual’s primary industry is the one identified more frequently than any other over the course of the calendar year. Primary industry shares add up to more than 100 percent because we allow for ties between two or more primary industries.
office administration, but the majority of graduates in business services appear to be associated with temporary employment services or employment placement services.
Figure 1 illustrates first-year destinations for all high school graduates in the 2008 and 2009
cohorts, by region. The standout observation from Figure 1 is that for all three regions of the state – East, Middle, and West – four-year colleges and universities were the most frequent destinations among graduates, with two-year colleges a distant second. After college enrollment, the next most

2016 TENNESSEE ECONOMIC REPORT | 6362 | 2016 TENNESSEE ECONOMIC REPORT
CHAPTER 4 | Tennessee’s Drive to 55: Background, Early Results, and Challenges Lying Ahead
frequent destination is the workforce, describing almost 40,000 students who we have categorized by primary industry of employment in Figure 1. Over 18,000 students from these two cohorts were not observed in college or in the Tennessee workforce. Across all three regions, the most popular industries for students who did not enroll in college, by far, were food and accommodation services, retail, and business services.
Another observation from Figure 1 is that East Tennessee high schools sent a higher share of graduates to two-year colleges (22 percent) than Middle or West Tennessee schools (13 – 15 percent). That distinction is even clearer in Figure 2, which illustrates 4-year and 2-year seamless college enrollment rates by county of students’
last high school.8 The bottom portion of Figure 2 also illustrates that geographic proximity to a four-year college or university is aligned with four-year enrollment rates. Spatial clusters of relatively high four-year enrollment coincide with the location of Tennessee’s major four-year public institutions in the northwest, southwest, northeast, east-central, and central north parts of the state.
Last, what happened to students who did not complete high school? As we show in Table 4, less than half were found working in the Tennessee workforce five years after starting high school, and of those who were working, average annual
8Figure 2 depicts college enrollment rates by geographic boundaries, not by school district boundaries. City school districts are included with their respective counties.
4.2. The Landscape of College Progression in Tennessee, continued
Notes: The figure depicts the first-year destinations of 119,094 high school graduates from the two cohorts starting 9th grade in 2007-2008 or 2008-2009, by the region of students’ last high school.
Figure 4.1: College or Workforce Destinations the Year After High School Graduation, by Region

2016 TENNESSEE ECONOMIC REPORT | 6362 | 2016 TENNESSEE ECONOMIC REPORT
Tennessee’s Drive to 55: Background, Early Results, and Challenges Lying Ahead | CHAPTER 4
4.2. The Landscape of College Progression in Tennessee, continued
earnings were just $6,000 – 6,100.9 It is worth noting that non-completers conceivably had more time to find employment and work toward pay raises than graduates, and yet dropout earnings were substantially lower at roughly the same
9Non-completers’ primary industries of employment (not shown) followed a very similar pattern as that for graduates who did not go on to college (Table 3).
point in time. And for both graduates and non-completers, annual earnings of $6,000 - $8,838 are well below the federal poverty line for a one-person household ($11,170 in 2012 and $11,490 in 2013).
Notes: Seamless college enrollment is defined as attending college by October 1st after high school graduation. College enrollment includes attendance in any institution identified by the National Student Clearinghouse, including in-state, out-of-state, public, and private institutions. Color codes are aligned with standard deviations on college enrollment rates across counties.
Figure 4.2: Seamless College Enrollment Rates by County of First High School
26.1 to 37.2%19.2 to 26.1%12.3 to 19.2%3.7 to 12.3%Insufficient data
36.6 to 65.5%27.8 to 36.6%19.1 to 27.8%11.1 to 19.1%Insufficient data
A. Two-year college and technology center enrollment rates
B. Four-year college and university enrollment rates
Table 4. High school dropouts: Workforce participation, earnings, and industry five years after 9th grade, by cohort
Ninth-grade cohort (spring year of ninth grade) 2008 2009 In Tennessee UI-covered labor force five years after starting 9th grade (%) 47.7 48.9 Earnings five years after starting 9th grade (Q1 - Q4, not including zeros) $6,100 $6,000 Non-completer sample size 8,773 8,186
Table 4.4: High School Dropouts: Workforce Participation, Earnings, and Industry Five Years After 9th Grade, by Cohort

2016 TENNESSEE ECONOMIC REPORT | 6564 | 2016 TENNESSEE ECONOMIC REPORT
CHAPTER 4 | Tennessee’s Drive to 55: Background, Early Results, and Challenges Lying Ahead
4.3. Will “Free Community College” Make A Difference in Tennessee? Early Indicators
On January 9th, 2015, President Obama proposed “America’s College Promise,” a partnership between states and the federal government that would pay for two years of community college tuition for “everybody who’s willing to work for it.”
The setting for this announcement – Pellissippi State Community College in Knoxville, Tennessee – coincided with the launch of Tennessee Promise. Nearly 58,000 students – the vast majority of eligible seniors – expressed interest in November 2014, and 31,000 were still active in the program as of April 2015. Prospective college students are not alone in their enthusiasm for Tennessee Promise. An astonishing 86 percent of registered voters approved of the initiative in a 2014 Vanderbilt poll.
Will Tennessee Promise push more students into college and fundamentally change some of the patterns presented in the previous section? A CBER study by Celeste Carruthers and William Fox suggests it will.
Tennessee Promise is a “last dollar” grant that covers the gap between state and federal scholarships (including “merit-based” Tennessee HOPE scholarships and “need-based” federal Pell grants) and the tuition and fees that students must pay to enroll. In a state where the median household income is $44,000 and 18 percent of the population lives below the poverty level, many students qualify for Pell grants that cover community college tuition, fees, and more. In-state tuition and fees for Tennessee community colleges amounted to $3,640 in 2013-2014, on average, while Pell grants were worth up to $5,645 in the same year. HOPE scholarships pay an additional $2,000 for eligible two-year students. Critics of last dollar programs are quick to point out that money does not actually flow to the neediest students, and moreover, that the cost of college does not stop at tuition. Books, supplies, transportation, child care, and living expenses are not covered by last dollar scholarships. This raises the question of why 58,000 students would sign up for financial aid that many of them will not receive.
A strong and clear message – “Free Community College” – is surely one piece of that puzzle.
Students are not perfectly aware of their financial aid options, especially if they would be the first in their family to go to college. “Free Community College,” though not strictly correct (economists will tell you that nothing is free), is an attractive banner. In Tennessee, that message is paired with one-on-one mentoring throughout students’ senior year of high school. Mentors are unpaid volunteers from the community who guide students and their families through college and financial aid applications and help students plan for orientation, registration, and basic logistics. Mentors who have “been there” provide critical support and experience. Importantly, mentors alleviate the onerous federal financial aid process.10 The Free Application for Federal Student Aid (FAFSA) was never intended to be a college entrance exam, and yet for many students, it is just that because of its complexity. Researchers have found that helping students complete the FAFSA improves the chance they enroll. Driven by the first Promise cohort, dependent Tennessee students submitted 6.9 percent more FAFSAs in the first half of 2015 than they did in 2014. This was the largest year-over-year growth in the United States.
The first wave of Tennessee Promise students – 16,291 ultimately enrolled, exceeding early expectations and pushing the freshman class up by 10 percent – are now in the midst of their second semester of college. It is too early to assess how many of those Promise students would not have been in college today without the program, or how long they will stay in college because of Tennessee Promise. But our study on the local initiative that inspired Tennessee Promise provides cause for optimism.
Privately-funded Knox Achieves launched in 2008 to support Knox County high school seniors making a seamless transition into community colleges. After three years exclusively serving its home county, Knox Achieves took on the name Tennessee Achieves – and later, tnAchieves – and expanded eligibility to seniors in more than twenty
10Within the largest Tennessee Promise partnering organization, tnAchieves, FAFSA guidance will shift from mentors to staff beginning with the 2015-2016 wave of Promise applicants.

2016 TENNESSEE ECONOMIC REPORT | 6564 | 2016 TENNESSEE ECONOMIC REPORT
Tennessee’s Drive to 55: Background, Early Results, and Challenges Lying Ahead | CHAPTER 4
4.3. Will “Free Community College” Make A Difference in Tennessee? Early Indicators, continued
counties throughout Middle and East Tennessee. We tested whether Knox County college enrollment rates changed after the introduction of Knox Achieves relative to college enrollment rates throughout East Tennessee and relative to Knox County’s own college enrollment rates prior to the class of 2009. Our major findings:
• The share of Knox County high school seniors going straight to a community college (as opposed to work, the military, or a four-year college) rose 3 – 5 percentage points after Knox Achieves began.
• College enrollment rates overall rose 2 – 3 percentage points, which means that most of the change in community college enrollment was coming from students who would not have gone to college otherwise.
• Students who expressed interest in Knox Achieves were 24 percentage points more likely to go to college than similar students in other counties (who were not eligible) and 30 percentage points more likely to go to a community college.
• Participants were also 5 percentage points less likely to enroll in a four-year college or university, and this finding was driven entirely by higher achieving and higher income students.
Substituting away from four-year universities is concerning. Researchers have found that starting
in a two-year college rather than a four-year college reduces the likelihood of completing a bachelor’s degree, even though most states have clearly defined transfer pathways between community colleges and universities. It is too early to tell how likely it is that Knox Achieves students will leave college with an associate’s or bachelor’s degree, or how quickly they will do so. Early signs are positive: participants earned 3 – 6 more college credits (equivalent to 1 – 2 additional classes) during the two years following high school.
The Carruthers and Fox (2015) study suggests that the combination of a strong message, financial aid, and guided mentoring can increase college enrollment immediately after high school. This bodes well for Tennessee Promise as well as at least eleven similar proposals in other states. It is worth emphasizing that our work on Knox Achieves is, by necessity, non-experimental. Knox Achieves participants may have been intent on going to a community college in ways that we could not observe. This would tend to inflate our estimates of the program’s effect on college enrollment. Another caveat to keep in mind is that we focus on the classes of 2009 – 2011, who graduated in the midst of a slow economic recovery when job prospects were very limited for young people. For some, a more robust job market today may be a bigger draw than free community college.
4.4. Challenges and Opportunities
Section I documented baseline college enrollment rates and Section II discussed early results from a program much like Tennessee Promise. Here, we build on this context to point to challenges that may hinder Drive to 55 success as well as actionable policy opportunities that will get ahead of these issues.
Changing the Culture of College AspirationsJanice Gilliam, Northeast State Community
College president, was quoted in a recent Atlantic article about Tennessee Promise:
“We have a lot of students who do not think about going to college. Some of their parents have not even finished high school. This is a huge step to break this cycle,” she says. “A lot of them don’t even know they have talent.”
Local and national media stories about Promise students support Dr. Gilliam’s impression. “I didn’t think college was for me” is a common sentiment among Promise students, followed quickly by their story about how the promise of free community college reversed that notion.

2016 TENNESSEE ECONOMIC REPORT | 6766 | 2016 TENNESSEE ECONOMIC REPORT
CHAPTER 4 | Tennessee’s Drive to 55: Background, Early Results, and Challenges Lying Ahead
4.4. Challenges and Opportunities, continued
What many prospective Promise students do not realize, however, is that in reality the program provides a modest amount of aid, about $1,000 per student per year, typically, and that many of them could pay for community college tuition, fees, and more with federal and state grants and without a dollar from Promise. The high rate of federal Pell grant eligibility is the major reason that the Promise program can contain its cost to Tennessee taxpayers.11
One of the fundamental and underemphasized roles of Tennessee Promise, then, has been to offer a course correction for capable students who overestimate the cost of postsecondary education. The program has proven to be very successful at reshaping the college conversation that students have with their families, teachers, and counselors. Why wait until the senior year of high school to do this? If every high school freshman was more aware of the entry requirements for college – financial and scholastic – they would make more informed choices about life after high school graduation. And with a horizon that includes college, they might make better progress through high school coursework and ultimately require less remedial catch-up after enrolling in college.
The widespread popularity of Tennessee Promise is already affecting the plans of younger students, but the program could go a step further and create an official point of contact prior to senior year. Bridging the information gap that students and families have about college readiness will help to raise college enrollment and smooth transitions into college.
UndermatchingIn the same way that there is an information
gap about college costs and admissions broadly speaking, students are often misinformed about their prospects at different types of colleges. A short time before the higher education policy environment was captivated by free community college, the issue du jour and focus of a January 2014 White House summit was “undermatching,”
11This underscores one potential threat to the fiscal impact of Tennessee Promise. Federal changes to the generosity or scope of the Pell grant program will have a direct bearing on the typical size of Tennessee Promise grants.
that is, the idea that high achieving students are not best served by less selective colleges and universities. Undermatching can happen unintentionally if students are not aware of their admission and financial aid opportunities at more selective (and usually, costlier) schools. One study showed that merely providing students with this information increased the likelihood that they applied to and enrolled in public flagship universities or selective private universities, both of which tend to have more resources for students and higher graduation rates. Of course, undermatching may be deliberate on the part of students who have a strong preference for a particular school or region despite their prospects elsewhere.
State policy may also play a role in undermatching. For some students, Tennessee Promise is certainly a nudge toward a community college rather than a four-year college or university. Although the 2015 freshman class was 10.1 percent greater in Tennessee public postsecondary institutions overall, large gains in two-year colleges and technology centers were offset to a degree by smaller freshman classes in some four-year universities. The 2015 entering class fell 13 percent at both the University of Tennessee-Martin and the University of Tennessee-Chattanooga.
Early indications are that most of the students whose college choices are changed by Tennessee Promise are those who are unsure about going to college at all. For those who decide to start at a community college rather than a four-year college or university, however, a long line of research suggests that their likelihood of completing a bachelor’s degree is substantially lower. One study found that failure to transfer after accumulating 60 credits and the loss of credits upon transfer were two of the chief “choke points” that hindered community college students from attaining a bachelor’s degree.
A broad structural solution to the undermatching problem, therefore, is to make the transition between two-year community colleges and four-year colleges and universities seamless for students who wish to attain a bachelor’s degree

2016 TENNESSEE ECONOMIC REPORT | 6766 | 2016 TENNESSEE ECONOMIC REPORT
Tennessee’s Drive to 55: Background, Early Results, and Challenges Lying Ahead | CHAPTER 4
or greater. Tennessee already has a well-defined system of transfer pathways which are – in principle – the most cost-effective way for students to earn a bachelor’s degree in the state public postsecondary system. Whether this is true in practice, however, remains an open question, and more research and analysis is necessary in order to determine if there are unnecessary hurdles along these pathways.
Another actionable policy response to undermatching is to ensure that Tennessee’s high school students are at least aware of their options in two-year and four-year college sectors. Tennessee already has two opportunities to do so. Tennessee is one of many states that aspires to have all high school students take the ACT. Test takers indicate up to four institutions to receive their official scores for free – additional score reports cost at least $12 and involve further action by students. Official ACT score reports serve as a formal channel between the ACT and college admissions offices, but also as a recruiting tool for colleges. The minor detail of how many schools a test-taker could list has had a remarkable effect on the quality of colleges that students ultimately choose. Tennessee’s ACT test-takers should be encouraged to send their scores to as many schools as they wish, and to include schools that they may incorrectly believe are out of their league.
The second, newer opportunity to make students aware of their college options is a systemic part of Tennessee Promise itself. This initiative provides a new line of communication between students and state officials, partnering organizations, and volunteer mentors who all have the goal of helping more students get to college. This line of communication should include information about college options aside from those institutions eligible to receive Tennessee Promise students. The federal government has developed a valuable new tool for doing just that. The College Scorecard (https://collegescorecard.ed.gov/) allows prospective college students to quickly retrieve information describing U.S. colleges and universities, including costs, typical ACT or SAT scores of entering students, and even the typical
post-college earnings of former students who – much like most Tennessee Promise students – received some form of federal financial aid.
Readiness and ResearchAlthough undermatching is recognized as a
nationwide issue that disproportionately affects lower-income high-achieving students, a far greater number of students find themselves overmatched when they enroll in a community college. In fact, the majority of two-year college students in Tennessee enroll unready for the challenges of postsecondary coursework: 59 percent require at least one remedial class and only 28 percent complete a degree within 6 years.12 The first year of Tennessee Promise has shown that it is remarkably easy to change the conversation about going to college, and student take-up in the program alongside their interest in college has exceeded expectations at each step. But elevating college readiness and the likelihood that students succeed in college will be harder and will require a closer examination of why students who earn a high school diploma and aspire to earn a two-year degree or more nevertheless struggle to do so.
Innovative research is underway to test whether a dual-credit initiative in Tennessee can help students catch up before they leave high school. More research is necessary to identify impactful programs and policies that raise student persistence after enrolling. A wide and growing array of such interventions are already underway, including fresh approaches to mentoring and college coaching within Tennessee Promise partnering organizations, but to date, their effectiveness and cost-effectiveness are speculative.
Tennessee has a strong history of improving on speculative hunches regarding educational practice. In the 1980s, there was considerable uncertainty about the benefits of smaller elementary classes, particularly when measured against the necessary costs of hiring more teachers to lead them. Determining if smaller classes benefitted students was complicated then, as now, by the fact that low student-to-teacher ratios do not arise by
12Tennessee Higher Education Fact Book: 2014-2015.
4.4. Challenges and Opportunities, continued

2016 TENNESSEE ECONOMIC REPORT | 6968 | 2016 TENNESSEE ECONOMIC REPORT
CHAPTER 4 | Tennessee’s Drive to 55: Background, Early Results, and Challenges Lying Ahead
4.4. Challenges and Opportunities, continued
chance. Smaller classes are often intertwined with other district and school advantages. Tennessee’s Project STAR experiment boldly tackled this problem by randomly assigning kindergarteners in 79 urban, suburban, and rural schools across the state to classes with 13 – 17 students or 22 – 25 students. This was one of the first large-scale field experiments in U.S. education, and despite imperfect execution, short-term and long-term results from Project STAR’s forerunning design inform education stakeholders to this day. A new generation of experimental research – this time, set in the state’s community college system – would go a long way toward identifying which higher education initiatives are pivotal in improving student retention and completion, and at what cost.
The Other 45 PercentThis chapter opened with an overview of the
three branches of the Drive to 55. Aspiring to have 55 percent of working-age Tennesseans hold a postsecondary credential is a laudable goal and one that is supported by the best available research on the returns to higher education as well as the skill demands of the modern workforce. But a fourth branch, one that focuses on the other 45 percent, would provide a strong complement to the Drive to 55 strategy.
A college degree is not the only path toward financial security and success for working-age
adults. Some choose to enlist in the military after high school graduation; others choose to work in a skilled trade and earn industry certifications and licensures. There is abundant research on the payoff to enrolling in and completing college, but very little is known about the economic returns to credentials earned in the military or in work, nor is there a clear understanding of how the state and even the public higher education system can support the human capital development and career paths of individuals with no more than a high school diploma.
Tennessee has a demonstrated interest in raising college and career-readiness throughout the state, and state agencies are well positioned to pursue and support research on open questions about workers who stop or fall short of a postsecondary certificate or degree. What are the factors behind financial security aside from college completion? Who succeeds outside of the college track, and why? What are the individual returns to military service? To industry licensure? To “sampling” a college program or enrolling in a MOOC (i.e. a massive, open online course)? Making headway on these and related questions will illuminate the other 45 percent of the Tennessee workforce and sharpen our understanding of success in and outside of college.
4.5. Acknowledgements
The Section I analysis and discussion is drawn from a 2015 CBER report on student progression through high school and into college (Carruthers et al., 2015). That study was made possible by a contract with the Tennessee Consortium on Research, Evaluation, and Development (TNCRED) hosted at Vanderbilt University, and indirectly by Tennessee’s First to the Top award from the U.S. Department of Education. Portions of Section II review work by Carruthers and
Fox (2015), which was made possible by data from tnAchieves, the Tennessee Department of Education, and the Tennessee Higher Education Commission. The opinions expressed in this chapter do not represent those of the U.S. Department of Education or any Tennessee agency.
Additionally, we are indebted to Antoniya Owens and others working with the Harvard Graduate School of Education Strategic Data

2016 TENNESSEE ECONOMIC REPORT | 6968 | 2016 TENNESSEE ECONOMIC REPORT
Tennessee’s Drive to 55: Background, Early Results, and Challenges Lying Ahead | CHAPTER 4
Project for many consultations regarding data processing. Their research on college-going in Tennessee has greatly informed our own. We are also grateful to staff members in tnAchieves, the Tennessee Department of Education, and
the Tennessee Higher Education Commission for discussions related to data and policy. Jilleah Welch, Okila Elboeva, James Sheffield, and Marcus Bansah provided outstanding research assistance.
4.5. Acknowledgements, continued
4.6. References
Anderson, K. (2015). “Tennessee Promise ups enrollment at Chattanooga State, Cleveland State: University of Tennessee at Chattanooga enrollment declines.” Chattanooga Times Free Press. October 4th, 2015.
Bettinger, E. P., Long, B. T., Oreopoulos, P., & Sanbonmatsu, L. (2012). The role of application assistance and information in college decisions: Results from the h&r block fafsa experiment*. The Quarterly Journal of Economics, 127(3), 1205-1242.
Bound, J., Lovenheim, M. F., & Turner, S.. (2010). Why Have College Completion Rates Declined? An Analysis of Changing Student Preparation and Collegiate Resources. American Economic Journal: Applied Economics, 2(3), 129–157.
Carnevale, A. P., and N. Smith. (2012). A Decade Behind: Breaking Out of the Low-Skill Trap in the Southern Economy. Center on Education and the Workforce, Georgetown Public Policy Institute, Georgetown University.
Carnevale, Anthony P., Nicole Smith, and Jeff Strohl. (2013). Recovery: Job Growth and Education Requirements through 2020. State Report. Center on Education and the Workforce, Georgetown Public Policy Institute, Georgetown University.
Carruthers, Celeste K., Donald J. Bruce, William F. Fox, Matthew N. Murray (2015). Student Progression in the Wake of First to the Top. Prepared for the Tennessee Consortium on Research, Evaluation, and Development. Center for Business and Economic Research, University of Tennessee.
Carruthers, C.K. and W.F. Fox (2015) “Aid for All: College coaching, financial aid, and postsecondary persistence in Tennessee.” Forthcoming in Economics of Education Review.
Chetty, R., Friedman, J. N., Hilger, N., Saez, E., Schanzenbach, D. W., & Yagan, D. (2011). How does your kindergarten classroom affect your earnings? Evidence from Project STAR. Quarterly Journal of Economics 126: 1593-1660.
Cook, Nancy. (2015). “The Power of Free Community College.” The Atlantic, September 5, 2015. Available online: http://www.theatlantic.com/business/archive/2015/09/free-college-in-tennessee/403945/
Center for the Study of Democratic Institutions, (May 2014), “Ninth Vanderbilt University Poll.”
Dynarski, D., S. Hemelt, N. Schwartz. (2014). “Dual Credit Courses and the Road to College: Experimental Evidence from Tennessee.” Grant No. R305H140028, Institute of Education Sciences, U.S. Department of Education.
Dynarski, S., J. Scott-Clayton, and M. Wiederspan. (2013). “Simplifying tax incentives and aid for college: Progress and prospects.” National Bureau of Economic Research Working Paper No. 18707.
Farmer, Blake. (2013). “Average Wage for TN High School Grads Drops $4,000 in Five Years; Governor Sees Moral Responsibility to Intervene.” WPLN Public Radio News Archive: September 4, 2013.

2016 TENNESSEE ECONOMIC REPORT | 170 | 2016 TENNESSEE ECONOMIC REPORT
CHAPTER 4 | Tennessee’s Drive to 55: Background, Early Results, and Challenges Lying Ahead
Federal Student Aid (2015). FAFSA® Volume Reports. U.S. Department of Education.
Goodman, J., M. Hurwitz, and J. Smith (2015). “College access, initial college choice and degree completion.” National Bureau of Economic Research Working Paper No. 20996.
House, E. (2015). “Tennessee Promise: Fall 2015 Update.” Tennessee Higher Education Commission Fall Quarterly Meeting: November 19, 2015.
Hoxby, C. and S. Turner. (2013). Expanding College Opportunities for High-Achieving, Low Income Students. SIEPR Discussion Paper 12-014.
Lee, Jessica A. (9/17/2105). “Rethinking community college to boost enrollment and completion.” Brookings Institution.
Lumina Foundation. (2013). A Stronger Nation through Higher Education: Visualizing data to help us achieve a big goal for college attainment. Lumina Foundation for Education, Inc.
Monaghan, D. B., & Attewell, P. (2015). The community college route to the bachelor’s degree. Educational Evaluation and Policy Analysis, 37(1), 70-91.
Mosteller, F. (1995). The Tennessee Study of Class Size in the Early School Grades. The Future of Children Summer/Fall: 113-127.
Murray, Matthew N., and William F. Fox, Lawrence M. Kessler, Matthew C. Harris, Vickie C. Cunningham, and Mary Elizabeth Glenn. (2015). An Economic Report to the Governor of the State of Tennessee. University of Tennessee Center for Business and Economic Research. http://cber.bus.utk.edu/erg/erg2015.pdf
Pallais, A. (2015). Small Differences That Matter: Mistakes in Applying to College. Journal Of Labor Economics, 33(2), 493-520.
Smith, A. (2015). “Promise Provides Enrollment Boost.” Inside Higher Ed. November 24, 2015.
Smith, J. and K. Stange. (2015). A New Measure of College Quality to Study the Effects of College Sector and Peers on Degree Attainment. National Bureau of Economic Research Working Paper No. 21605.
SDP College-Going Diagnostic: Tennessee Department of Education (2015). Strategic Data Project, Center for Education Policy Research, Harvard University.
Tamburin, A. (2015). “College enrollment jumps under TN Promise.” The Tennessean. September 12, 2015.
Tennessee Higher Education Fact Book: 2014-2015. (2015). Tennessee Higher Education Commission.
4.6. References, continued

2016 TENNESSEE ECONOMIC REPORT | 170 | 2016 TENNESSEE ECONOMIC REPORT
Forecast Data | APPENDIX A
APPENDIX A: FORECAST DATA
Quarterly Forecast Tables
Table 1: Selected U.S. and Tennessee Economic Indicators, Seasonally Adjusted .....................................................................................................2Table 2: Selected Per Capita U.S. and Tennessee Economic Indicators, Seasonally Adjusted ...................................................................................4Table 3: Tennessee Personal Income Components, Seasonally Adjusted (millions of 2009 dollars) ..........................................................................5Table 4: Tennessee Personal Income Components, Seasonally Adjusted Annual Rates (millions of current dollars) .................................................6Table 5: Tennessee Nonfarm Employment by Sector, Not Seasonally Adjusted (thousands of jobs) ..........................................................................7Table 6: Tennessee Durable Goods Manufacturing Employment, Not Seasonally Adjusted (thousands of jobs) ........................................................8Table 7: Tennessee Nondurable Goods Manufacturing Employment, Not Seasonally Adjusted (thousands of jobs) ..................................................9Table 8: Tennessee Nonfarm Employment by Sector, Seasonally Adjusted (thousands of jobs) ..............................................................................10Table 9: Tennessee Durable Goods Manufacturing Employment, Seasonally Adjusted (thousands of jobs) ............................................................12Table 10: Tennessee Nondurable Goods Manufacturing Employment, Seasonally Adjusted (thousands of jobs) ......................................................13Table 11: Tennessee Average Annual Wage and Salary Rate by Sector, Not Seasonally Adjusted (2009 dollars) .....................................................14Table 12: Tennessee Average Annual Wage and Salary Rate by Sector, Seasonally Adjusted (2009 dollars) ...........................................................15Table 13: Tennessee Average Annual Wage and Salary Rate by Sector, Not Seasonally Adjusted (current dollars) ..................................................17Table 14: Tennessee Average Annual Wage and Salary Rate by Sector, Seasonally Adjusted (current dollars) ........................................................18Table 15: Tennessee Civilian Labor Force and Unemployment Rate, Not Seasonally Adjusted..................................................................................20Table 16: Tennessee Civilian Labor Force and Unemployment Rate, Seasonally Adjusted ........................................................................................21Table 17: Tennessee Taxable Sales, Not Seasonally Adjusted (millions of 2009 dollars) ............................................................................................22Table 18: Tennessee Taxable Sales, Seasonally Adjusted (millions of 2009 dollars) ...................................................................................................23Table 19: Tennessee Taxable Sales, Not Seasonally Adjusted (millions of current dollars) .........................................................................................24Table 20: Tennessee Taxable Sales, Seasonally Adjusted (millions of current dollars) ...............................................................................................25
Annual Forecast Tables
Table 1: Selected U.S. and Tennessee Economic Indicators, Seasonally Adjusted ...................................................................................................26Table 2: Selected Per Capita U.S. and Tennessee Economic Indicators ....................................................................................................................27Table 3: Tennessee Personal Income Components (millions of 2009 dollars) ...........................................................................................................28Table 4: Tennessee Personal Income Components (millions of current dollars) ........................................................................................................29Table 5: Tennessee Nonfarm Employment by Sector (thousands of jobs) .................................................................................................................30Table 6: Tennessee Durable Goods Manufacturing Employment (thousands of jobs) ...............................................................................................31Table 7: Tennessee Nondurable Goods Manufacturing Employment (thousands of jobs) .........................................................................................32Table 8: Tennessee Average Annual Wage and Salary Rate by Sector (2009 dollars) ..............................................................................................33Table 9: Tennessee Average Annual Wage and Salary Rate by Sector (current dollars) ...........................................................................................34Table 10: Tennessee Civilian Labor Force and Unemployment Rate ...........................................................................................................................35Table 11: Tennessee Taxable Sales (millions of 2009 dollars) .....................................................................................................................................36Table 12: Tennessee Taxable Sales (millions of current dollars) ..................................................................................................................................37Table 13: Tennessee Gross Domestic Product by Sector (millions of 2009 dollars) ....................................................................................................38Table 14: Tennessee Gross Domestic Product by Sector (millions of current dollars) .................................................................................................40
In this section—
Appendix A: Forecast Data Quarterly pages 2–25 (2015:4 to 2018:1) Annual pages 26–40 (2015 to 2025)

2016 TE
NN
ES
SE
E E
CO
NO
MIC
RE
PO
RT
| 32 | 2016 T
EN
NE
SS
EE
EC
ON
OM
IC R
EP
OR
T
AP
PE
ND
IX A
| Forecast D
ata
Table 1: Selected U.S. and Tennessee Economic Indicators, Seasonally Adjusted
2015:3 2015:4 2016:1 2016:2 2016:3 2016:4 2017:1 2017:2 2017:3 2017:4 2018:1 2014 2015 2016 2017
US GDP (Bil2009$) SAAR……………………… 16414.0 16462.5 16586.4 16708.4 16844.5 16983.1 17096.3 17225.3 17338.9 17437.6 17567.0 15961.7 16346.8 16780.6 17274.5% Chg Prev Qtr SAAR………………………… 1.98 1.19 3.04 2.98 3.30 3.33 2.69 3.05 2.66 2.30 3.00 2.43 2.41 2.65 2.94% Chg Same Qtr Last Yr……………………… 2.15 1.93 2.53 2.29 2.62 3.16 3.07 3.09 2.94 2.68 2.75 2.43 2.41 2.65 2.94
US GDP (Bil$) SAAR………………………………18060.2 18181.2 18391.4 18614.9 18860.4 19106.9 19318.4 19560.9 19794.5 20000.1 20259.9 17348.1 17951.1 18743.4 19668.4% Chg Prev Qtr SAAR………………………… 3.31 2.71 4.70 4.95 5.38 5.33 4.50 5.12 4.86 4.22 5.30 4.11 3.48 4.41 4.94% Chg Same Qtr Last Yr……………………… 3.07 3.21 4.20 3.91 4.43 5.09 5.04 5.08 4.95 4.67 4.87 4.11 3.48 4.41 4.94
TN PERSONAL INCOME (MIL2009$) SAAR… 254215 257680 260384 262090 263075 264591 266717 268147 269586 271585 273120 242848 253482 262535 269009% Chg Prev Qtr SAAR………………………… 2.55 5.56 4.26 2.65 1.51 2.33 3.25 2.16 2.16 3.00 2.28 2.28 4.38 3.57 2.47% Chg Same Qtr Last Yr……………………… 4.58 4.56 4.40 3.75 3.48 2.68 2.43 2.31 2.48 2.64 2.40 2.28 4.38 3.57 2.47
US PERSONAL INCOME (BIL2009$) SAAR…… 14095 14224 14360 14435 14500 14604 14759 14879 14976 15100 15230 13468 14036 14475 14929% Chg Prev Qtr SAAR………………………… 3.76 3.73 3.88 2.10 1.80 2.90 4.33 3.28 2.65 3.35 3.49 2.98 4.22 3.12 3.14% Chg Same Qtr Last Yr……………………… 4.41 3.98 3.61 3.36 2.87 2.67 2.78 3.07 3.29 3.40 3.19 2.98 4.22 3.12 3.14
TN PERSONAL INCOME (MIL$) SAAR…………278958 282614 285656 288832 292132 295513 298903 302294 305795 309386 312604 264965 277316 290533 304095% Chg Prev Qtr SAAR………………………… 3.84 5.35 4.37 4.52 4.65 4.71 4.67 4.62 4.71 4.78 4.22 3.74 4.66 4.77 4.67% Chg Same Qtr Last Yr……………………… 4.85 4.89 5.27 4.52 4.72 4.56 4.64 4.66 4.68 4.69 4.58 3.74 4.66 4.77 4.67
US PERSONAL INCOME (BIL$) SAAR………… 15468 15614 15750 15894 16073 16276 16502 16722 16933 17145 17390 14694 15360 15998 16825% Chg Prev Qtr SAAR………………………… 5.09 3.84 3.52 3.70 4.59 5.14 5.67 5.45 5.14 5.10 5.84 4.45 4.53 4.16 5.17% Chg Same Qtr Last Yr……………………… 4.69 4.40 4.44 4.04 3.91 4.24 4.77 5.21 5.35 5.34 5.38 4.45 4.53 4.16 5.17
TN NONFARM JOBS (THOUS)………………… 2874.9 2900.1 2906.8 2914.1 2921.4 2929.6 2940.2 2950.6 2961.5 2972.7 2982.4 2816.1 2870.7 2918.0 2956.2% Chg Prev Qtr SAAR………………………… 1.97 3.57 0.92 1.01 1.01 1.13 1.45 1.42 1.49 1.53 1.30 2.08 1.94 1.65 1.31% Chg Same Qtr Last Yr……………………… 1.79 2.00 2.10 1.85 1.62 1.02 1.15 1.25 1.37 1.47 1.43 2.08 1.94 1.65 1.31
US NONFARM JOBS (MIL)……………………… 142.2 142.9 143.6 144.1 144.6 145.1 145.6 145.9 146.4 146.8 147.2 139.0 141.9 144.3 146.2% Chg Prev Qtr SAAR………………………… 1.77 1.86 1.87 1.45 1.39 1.32 1.42 1.01 1.20 1.28 1.14 1.93 2.10 1.67 1.29% Chg Same Qtr Last Yr……………………… 2.05 1.90 1.81 1.74 1.64 1.51 1.39 1.28 1.24 1.23 1.16 1.93 2.10 1.67 1.29
TN MFG JOBS (THOUS)………………………… 331.5 332.7 333.0 333.4 334.0 334.7 335.3 335.8 336.4 337.0 337.6 325.2 331.5 333.7 336.1% Chg Prev Qtr SAAR………………………… 1.00 1.53 0.37 0.41 0.71 0.85 0.73 0.68 0.62 0.80 0.70 2.13 1.93 0.68 0.71% Chg Same Qtr Last Yr……………………… 1.74 1.17 0.60 0.78 0.75 0.58 0.67 0.74 0.72 0.71 0.70 2.13 1.93 0.68 0.71
US MFG JOBS (MIL)……………………………… 12.3 12.3 12.3 12.3 12.3 12.4 12.4 12.4 12.4 12.5 12.5 12.2 12.3 12.3 12.4% Chg Prev Qtr SAAR………………………… -0.05 -0.41 -0.51 -0.40 0.10 1.94 1.36 -0.02 0.80 1.11 0.71 1.41 1.12 -0.14 0.85% Chg Same Qtr Last Yr……………………… 1.04 0.35 -0.17 -0.34 -0.31 0.28 0.74 0.84 1.02 0.81 0.65 1.41 1.12 -0.14 0.85
TN UNEMPLOYMENT RATE (%)……………… 5.7 5.6 5.6 5.6 5.5 5.5 5.5 5.4 5.4 5.4 5.4 6.6 5.9 5.5 5.4
US UNEMPLOYMENT RATE (%)……………… 5.2 5.0 5.0 4.9 4.9 4.9 4.9 4.9 4.9 4.9 4.9 6.2 5.3 4.9 4.9
January 2016
History Forecast Data Annual
(CONTINUED ON NEXT PAGE)

2016 TE
NN
ES
SE
E E
CO
NO
MIC
RE
PO
RT
| 32 | 2016 T
EN
NE
SS
EE
EC
ON
OM
IC R
EP
OR
T
Forecast D
ata | AP
PE
ND
IX A
Table 1: Selected U.S. and Tennessee Economic Indicators, Seasonally Adjusted
2015:3 2015:4 2016:1 2016:2 2016:3 2016:4 2017:1 2017:2 2017:3 2017:4 2018:1 2014 2015 2016 2017
January 2016
History Forecast Data Annual
CHAINED PRICE INDEX, GDP (2009=100.0)……………...........................… 110.0 110.4 110.9 111.4 112.0 112.5 113.0 113.6 114.2 114.7 115.3 108.7 109.8 111.7 113.9% Chg Prev Qtr SAAR………………………… 1.32 1.44 1.61 1.92 2.02 1.93 1.76 2.00 2.14 1.88 2.23 1.64 1.04 1.70 1.94% Chg Same Qtr Last Yr……………………… 0.91 1.25 1.62 1.57 1.75 1.87 1.91 1.93 1.96 1.95 2.06 1.64 1.04 1.70 1.94
US PERS CONSUMP DEFL (2009=100.0)…… 109.7 109.8 109.7 110.1 110.9 111.5 111.8 112.4 113.1 113.5 114.2 109.1 109.4 110.5 112.7% Chg Prev Qtr SAAR………………………… 1.28 0.11 -0.34 1.57 2.75 2.18 1.28 2.10 2.43 1.69 2.28 1.43 0.29 1.00 1.97% Chg Same Qtr Last Yr……………………… 0.27 0.41 0.81 0.65 1.01 1.53 1.94 2.08 2.00 1.87 2.12 1.43 0.29 1.00 1.97
CONSUMER PRICE INDEX,ALL-URBAN (82-84=1.000)…………………… 2.379 2.381 2.374 2.386 2.409 2.427 2.435 2.452 2.471 2.483 2.501 2.367 2.370 2.399 2.460% Chg Prev Qtr SAAR………………………… 1.58 0.33 -1.09 1.95 4.03 2.94 1.44 2.69 3.24 1.98 2.95 1.61 0.13 1.21 2.56% Chg Same Qtr Last Yr……………………… 0.14 0.43 0.94 0.68 1.28 1.94 2.58 2.77 2.57 2.33 2.71 1.61 0.13 1.21 2.56
BANK PRIME INTEREST RATE (%)…………… 3.3 3.3 3.5 3.8 4.0 4.3 4.5 4.8 5.0 5.3 5.5 3.3 3.3 3.9 4.9
FEDERAL FUNDS RATE (% per annum)……… 0.137 0.152 0.483 0.787 1.037 1.290 1.533 1.787 2.037 2.290 2.533 0.089 0.131 0.899 1.912
30-YEAR FIXED MORTGAGE RATE (%)……… 4.0 3.9 4.2 4.4 4.5 4.6 4.7 4.7 4.8 4.9 5.0 4.2 3.9 4.4 4.7
TN TAXABLE SALES (MIL2009$)……………… 26228 26353 26392 26580 26635 26708 26795 26878 26954 27127 27230 97036 102746 106315 107755% Chg Prev Qtr SAAR………………………… 9.46 1.91 0.59 2.88 0.83 1.10 1.31 1.24 1.14 2.59 1.52 3.41 5.88 3.47 1.35% Chg Same Qtr Last Yr……………………… 7.21 5.48 7.62 3.66 1.55 1.35 1.53 1.12 1.20 1.57 1.62 3.41 5.88 3.47 1.35
TN TAXABLE SALES (MIL$)…………………… 28781 28903 28953 29292 29577 29829 30028 30301 30575 30903 31167 105877 112414 117652 121807% Chg Prev Qtr SAAR………………………… 10.84 1.70 0.70 4.76 3.95 3.45 2.70 3.67 3.67 4.37 3.45 4.89 6.17 4.66 3.53% Chg Same Qtr Last Yr……………………… 7.49 5.82 8.52 4.43 2.77 3.20 3.71 3.44 3.37 3.60 3.79 4.89 6.17 4.66 3.53
TN AVG ANNUAL WAGE, NONFARM(2009$)…………….......................………..... 43269 43666 43973 44087 44059 44111 44274 44313 44347 44461 44544 41961 43161 44058 44349% Chg Prev Qtr SAAR………………………… -0.11 3.72 2.85 1.04 -0.26 0.48 1.48 0.35 0.30 1.04 0.75 1.18 2.86 2.08 0.66% Chg Same Qtr Last Yr……………………… 3.46 3.10 3.64 1.86 1.82 1.02 0.68 0.51 0.65 0.79 0.61 1.18 2.86 2.08 0.66
TN AVG ANNUAL WAGE, NONFARM ($)……… 47481 47891 48241 48586 48925 49266 49616 49956 50303 50649 50984 45782 47219 48755 50131% Chg Prev Qtr SAAR………………………… 1.14 3.50 2.96 2.89 2.82 2.82 2.87 2.77 2.81 2.78 2.67 2.62 3.14 3.25 2.82% Chg Same Qtr Last Yr……………………… 3.73 3.44 4.51 2.62 3.04 2.87 2.85 2.82 2.82 2.81 2.76 2.62 3.14 3.25 2.82
Center for Business and Economic Research, University of Tennessee Tennessee Econometric Model

2016 TE
NN
ES
SE
E E
CO
NO
MIC
RE
PO
RT
| 54 | 2016 T
EN
NE
SS
EE
EC
ON
OM
IC R
EP
OR
T
AP
PE
ND
IX A
| Forecast D
ata
Table 2: Selected Per Capita U.S. and Tennessee Economic Indicators, Seasonally Adjusted
2015:2 2015:3 2015:4 2016:1 2016:2 2016:3 2016:4 2017:1 2017:2 2017:3 2017:4 2018:1 2014 2015 2016 2017
US GDP (2009$) SAAR………………….…… 50798 50944 50990 51270 51542 51857 52178 52420 52709 52950 53145 53432 49964 50787 51712 52807% Chg Prev Qtr SAAR………………… 3.08 1.16 0.37 2.21 2.14 2.46 2.50 1.87 2.23 1.84 1.48 2.18 1.68 1.65 1.82 2.12% Chg Same Qtr Last Yr……………… 1.95 1.39 1.14 1.70 1.47 1.79 2.33 2.24 2.26 2.11 1.85 1.93 1.68 1.65 1.82 2.12
US GDP ($) SAAR…………………………… 55712 56053 56314 56849 57423 58063 58703 59233 59856 60449 60954 61623 54304 55771 57761 60125% Chg Prev Qtr SAAR………………… 5.27 2.47 1.87 3.86 4.10 4.53 4.48 3.66 4.27 4.02 3.39 4.46 3.35 2.70 3.57 4.09% Chg Same Qtr Last Yr……………… 2.95 2.31 2.41 3.36 3.07 3.59 4.24 4.19 4.24 4.11 3.84 4.03 3.35 2.70 3.57 4.09
TN PERSONAL INCOME (2009$) SAAR…… 37949 38089 38509 38812 38966 39013 39137 39352 39462 39574 39767 39892 36816 38028 38982 39539% Chg Prev Qtr SAAR………………… 4.14 1.49 4.47 3.19 1.60 0.47 1.28 2.21 1.13 1.14 1.96 1.26 1.20 3.29 2.51 1.43% Chg Same Qtr Last Yr……………… 3.39 3.49 3.47 3.32 2.68 2.42 1.63 1.39 1.27 1.44 1.61 1.37 1.20 3.29 2.51 1.43
US PERSONAL INCOME (2009$) SAAR…… 43433 43746 44058 44389 44530 44638 44868 45254 45529 45735 46021 46324 42157 43609 44607 45635% Chg Prev Qtr SAAR………………… 2.22 2.92 2.89 3.04 1.27 0.97 2.07 3.49 2.45 1.83 2.52 2.66 2.23 3.44 2.29 2.31% Chg Same Qtr Last Yr……………… 3.50 3.63 3.18 2.76 2.53 2.04 1.84 1.95 2.24 2.46 2.57 2.36 2.23 3.44 2.29 2.31
TN PERSONAL INCOME ($) SAAR………… 41512 41797 42235 42579 42942 43322 43711 44100 44488 44889 45302 45659 40168 41603 43139 44695% Chg Prev Qtr SAAR………………… 6.44 2.77 4.26 3.30 3.45 3.58 3.64 3.61 3.56 3.66 3.73 3.19 2.65 3.57 3.69 3.61% Chg Same Qtr Last Yr……………… 3.65 3.77 3.81 4.18 3.44 3.65 3.50 3.57 3.60 3.62 3.64 3.53 2.65 3.57 3.69 3.61
US PERSONAL INCOME ($) SAAR………… 47512 48007 48363 48684 49029 49482 50005 50597 51169 51711 52252 52893 45996 47720 49301 51434% Chg Prev Qtr SAAR………………… 4.48 4.24 3.00 2.69 2.87 3.75 4.29 4.82 4.60 4.30 4.26 5.00 3.69 3.75 3.31 4.33% Chg Same Qtr Last Yr……………… 3.76 3.91 3.60 3.60 3.19 3.07 3.40 3.93 4.37 4.50 4.49 4.54 3.69 3.75 3.31 4.33
TN TAXABLE SALES (2009$)……………… 3852 3930 3938 3934 3952 3950 3951 3953 3956 3957 3972 3977 14710 15414 15786 15838% Chg Prev Qtr SAAR………………… 18.31 8.33 0.86 -0.44 1.83 -0.20 0.07 0.29 0.22 0.13 1.56 0.51 2.32 4.78 2.42 0.33% Chg Same Qtr Last Yr……………… 6.59 6.09 4.38 6.51 2.59 0.51 0.31 0.49 0.09 0.17 0.55 0.60 2.32 4.78 2.42 0.33
TN TAXABLE SALES ($)…………………… 4214 4312 4319 4316 4355 4386 4412 4430 4459 4488 4525 4552 16050 16864 17469 17903% Chg Prev Qtr SAAR………………… 20.93 9.69 0.65 -0.33 3.69 2.89 2.40 1.66 2.63 2.63 3.32 2.42 3.78 5.07 3.59 2.48% Chg Same Qtr Last Yr……………… 6.86 6.38 4.72 7.40 3.35 1.71 2.15 2.66 2.39 2.33 2.56 2.75 3.78 5.07 3.59 2.48
Center for Business and Economic Research, University of Tennessee
January 2016
History Forecast Data Annual
Tennessee Econometric Model

2016 TE
NN
ES
SE
E E
CO
NO
MIC
RE
PO
RT
| 54 | 2016 T
EN
NE
SS
EE
EC
ON
OM
IC R
EP
OR
T
Forecast D
ata | AP
PE
ND
IX A
Table 3: Tennessee Personal Income Components, Seasonally Adjusted Annual Rates (millions of 2009 dollars)
2015:2 2015:3 2015:4 2016:1 2016:2 2016:3 2016:4 2017:1 2017:2 2017:3 2017:4 2018:1 2014 2015 2016 2017
TN PERSONAL INCOME…………...………252618 254215 257680 260384 262090 263075 264591 266717 268147 269586 271585 273120 242848 253482 262535 269009% Chg Prev Qtr SAAR……………… 5.23 2.55 5.56 4.26 2.65 1.51 2.33 3.25 2.16 2.16 3.00 2.28 2.28 4.38 3.57 2.47% Chg Same Qtr Last Yr…………… 4.47 4.58 4.56 4.40 3.75 3.48 2.68 2.43 2.31 2.48 2.64 2.40 2.28 4.38 3.57 2.47
WAGES AND SALARIES………………124682 125258 126977 128451 129300 129704 130334 131279 131841 132409 133239 133940 119019 124639 129447 132192% Chg Prev Qtr SAAR……………… 10.39 1.86 5.60 4.73 2.67 1.25 1.96 2.93 1.72 1.74 2.53 2.12 3.26 4.72 3.86 2.12% Chg Same Qtr Last Yr…………… 5.48 5.29 4.71 5.60 3.70 3.55 2.64 2.20 1.97 2.09 2.23 2.03 3.26 4.72 3.86 2.12
OTHER LABOR INCOME……………… 27756 27846 28123 28407 28563 28654 28811 29041 29208 29365 29561 29715 27148 27759 28609 29294% Chg Prev Qtr SAAR……………… 6.70 1.30 4.04 4.10 2.21 1.28 2.21 3.23 2.32 2.16 2.70 2.10 -2.03 2.25 3.06 2.39% Chg Same Qtr Last Yr…………… 2.38 3.13 3.42 4.02 2.91 2.90 2.44 2.23 2.26 2.48 2.60 2.32 -2.03 2.25 3.06 2.39
PROPRIETORS INCOME……………… 33497 33913 34440 34721 35009 35158 35347 35655 35796 36004 36351 36635 32225 33781 35059 35952% Chg Prev Qtr SAAR……………… 2.70 5.07 6.35 3.31 3.37 1.71 2.17 3.53 1.59 2.34 3.91 3.17 4.11 4.83 3.78 2.55% Chg Same Qtr Last Yr…………… 4.11 4.93 4.69 4.35 4.52 3.67 2.63 2.69 2.25 2.41 2.84 2.75 4.11 4.83 3.78 2.55
RENT, INTEREST, DIVIDENDS……… 35625 35876 36259 36619 36802 36926 37203 37574 37857 38109 38441 38738 34428 35754 36888 37995% Chg Prev Qtr SAAR……………… 4.24 2.84 4.34 4.03 2.02 1.36 3.03 4.04 3.05 2.69 3.53 3.13 2.64 3.85 3.17 3.00% Chg Same Qtr Last Yr…………… 3.64 4.16 4.19 3.86 3.30 2.93 2.60 2.61 2.87 3.20 3.33 3.10 2.64 3.85 3.17 3.00
TRANSFER PAYMENTS……………… 52135 52411 53076 53500 53742 53907 54151 54482 54732 54944 55241 55415 50249 52529 53825 54850% Chg Prev Qtr SAAR……………… -2.71 2.14 5.18 3.23 1.82 1.24 1.82 2.46 1.85 1.56 2.18 1.26 0.91 4.54 2.47 1.90% Chg Same Qtr Last Yr…………… 4.14 3.72 4.53 1.92 3.08 2.86 2.02 1.83 1.84 1.92 2.01 1.71 0.91 4.54 2.47 1.90
LESS: PERS CONT FOR SOC INS… 19797 19829 19936 20054 20071 20028 20013 20075 20056 20020 20027 20107 19059 19736 20042 20045% Chg Prev Qtr SAAR……………… 8.83 0.66 2.16 2.40 0.34 -0.85 -0.29 1.24 -0.37 -0.73 0.14 1.62 2.52 3.55 1.55 0.01% Chg Same Qtr Last Yr…………… 4.39 4.29 3.30 3.47 1.39 1.00 0.39 0.10 -0.07 -0.04 0.07 0.16 2.52 3.55 1.55 0.01
RESIDENCE ADJUSTMENT…………… -1280 -1259 -1259 -1260 -1255 -1247 -1241 -1238 -1231 -1225 -1221 -1216 -1163 -1243 -1251 -1229% Chg Prev Qtr SAAR……………… 40.83 -6.30 -0.01 0.18 -1.45 -2.67 -1.96 -0.99 -2.00 -2.05 -1.30 -1.67 -5.89 6.94 0.58 -1.75% Chg Same Qtr Last Yr…………… 10.80 9.00 6.60 7.22 -1.93 -0.99 -1.48 -1.77 -1.91 -1.75 -1.58 -1.75 -5.89 6.94 0.58 -1.75
PER CAPITA PERSONAL INCOME ($)… 37949 38089 38509 38812 38966 39013 39137 39352 39462 39574 39767 39892 36816 38028 38982 39539% Chg Prev Qtr SAAR……………… 4.14 1.49 4.47 3.19 1.60 0.47 1.28 2.21 1.13 1.14 1.96 1.26 1.20 3.29 2.51 1.43% Chg Same Qtr Last Yr…………… 3.39 3.49 3.47 3.32 2.68 2.42 1.63 1.39 1.27 1.44 1.61 1.37 1.20 3.29 2.51 1.43
Center for Business and Economic Research, University of Tennessee Tennessee Econometric Model
January 2016
History Forecast Data Annual

2016 TE
NN
ES
SE
E E
CO
NO
MIC
RE
PO
RT
| 76 | 2016 T
EN
NE
SS
EE
EC
ON
OM
IC R
EP
OR
T
AP
PE
ND
IX A
| Forecast D
ata
Table 4: Tennessee Personal Income Components, Seasonally Adjusted Annual Rates (millions of current dollars)
2015:2 2015:3 2015:4 2016:1 2016:2 2016:3 2016:4 2017:1 2017:2 2017:3 2017:4 2018:1 2014 2015 2016 2017
TN PERSONAL INCOME…………...……… 276341 278958 282614 285656 288832 292132 295513 298903 302294 305795 309386 312604 264965 277316 290533 304095% Chg Prev Qtr SAAR………………… 7.56 3.84 5.35 4.37 4.52 4.65 4.71 4.67 4.62 4.71 4.78 4.22 3.74 4.66 4.77 4.67% Chg Same Qtr Last Yr………………… 4.74 4.85 4.89 5.27 4.52 4.72 4.56 4.64 4.66 4.68 4.69 4.58 3.74 4.66 4.77 4.67
WAGES AND SALARIES………………… 136391 137449 139264 140918 142493 144030 145565 147121 148630 150194 151784 153303 129859 136360 143252 149432% Chg Prev Qtr SAAR………………… 12.83 3.14 5.38 4.84 4.55 4.38 4.33 4.34 4.17 4.27 4.30 4.06 4.73 5.01 5.05 4.31% Chg Same Qtr Last Yr………………… 5.75 5.57 5.05 6.48 4.47 4.79 4.52 4.40 4.31 4.28 4.27 4.20 4.73 5.01 5.05 4.31
OTHER LABOR INCOME………………… 30362 30556 30845 31164 31477 31819 32178 32545 32928 33309 33676 34011 29620 30369 31659 33114% Chg Prev Qtr SAAR………………… 9.05 2.58 3.83 4.21 4.08 4.41 4.59 4.65 4.78 4.71 4.48 4.04 -0.63 2.53 4.25 4.60% Chg Same Qtr Last Yr………………… 2.64 3.40 3.75 4.89 3.67 4.13 4.32 4.43 4.61 4.68 4.65 4.50 -0.63 2.53 4.25 4.60
PROPRIETORS INCOME………………… 36642 37214 37772 38091 38581 39041 39478 39958 40355 40840 41411 41932 35161 36957 38798 40641% Chg Prev Qtr SAAR………………… 4.97 6.39 6.13 3.42 5.25 4.85 4.55 4.95 4.03 4.90 5.71 5.13 5.60 5.11 4.98 4.75% Chg Same Qtr Last Yr………………… 4.38 5.21 5.03 5.22 5.29 4.91 4.52 4.90 4.60 4.61 4.90 4.94 5.60 5.11 4.98 4.75
RENT, INTEREST, DIVIDENDS………… 38971 39368 39768 40173 40557 41005 41551 42108 42678 43228 43791 44338 37563 39116 40822 42951% Chg Prev Qtr SAAR………………… 6.55 4.13 4.13 4.14 3.88 4.49 5.43 5.47 5.53 5.25 5.32 5.09 4.10 4.13 4.36 5.22% Chg Same Qtr Last Yr………………… 3.90 4.44 4.53 4.73 4.07 4.16 4.48 4.82 5.23 5.42 5.39 5.30 4.10 4.13 4.36 5.22
TRANSFER PAYMENTS………………… 57031 57512 58212 58692 59225 59862 60479 61056 61702 62323 62930 63426 54826 57466 59565 62003% Chg Prev Qtr SAAR………………… -0.56 3.42 4.96 3.34 3.68 4.37 4.19 3.87 4.30 4.09 3.95 3.19 2.35 4.82 3.65 4.09% Chg Same Qtr Last Yr………………… 4.40 3.99 4.87 2.77 3.85 4.09 3.89 4.03 4.18 4.11 4.05 3.88 2.35 4.82 3.65 4.09
LESS: PERS CONT FOR SOC INS…… 21656 21759 21865 22001 22119 22240 22352 22498 22611 22709 22814 23014 20795 21592 22178 22658% Chg Prev Qtr SAAR………………… 11.23 1.93 1.95 2.51 2.17 2.21 2.03 2.63 2.02 1.75 1.87 3.55 3.98 3.83 2.72 2.16% Chg Same Qtr Last Yr………………… 4.65 4.57 3.63 4.33 2.14 2.21 2.23 2.26 2.22 2.11 2.07 2.29 3.98 3.83 2.72 2.16
RESIDENCE ADJUSTMENT……………… -1400 -1382 -1381 -1382 -1383 -1384 -1386 -1387 -1388 -1389 -1391 -1392 -1268 -1360 -1384 -1389% Chg Prev Qtr SAAR………………… 43.94 -5.12 -0.22 0.29 0.35 0.34 0.32 0.37 0.35 0.40 0.41 0.20 -4.55 7.24 1.73 0.36% Chg Same Qtr Last Yr………………… 11.08 9.29 6.95 8.12 -1.20 0.19 0.33 0.34 0.35 0.36 0.38 0.34 -4.55 7.24 1.73 0.36
PER CAPITA PERSONAL INCOME ($)…… 41512 41797 42235 42579 42942 43322 43711 44100 44488 44889 45302 45659 40168 41603 43139 44695% Chg Prev Qtr SAAR………………… 6.44 2.77 4.26 3.30 3.45 3.58 3.64 3.61 3.56 3.66 3.73 3.19 2.65 3.57 3.69 3.61% Chg Same Qtr Last Yr………………… 3.65 3.77 3.81 4.18 3.44 3.65 3.50 3.57 3.60 3.62 3.64 3.53 2.65 3.57 3.69 3.61
Center for Business and Economic Research, University of Tennessee Tennessee Econometric Model
January 2016
History Forecast Data Annual

2016 TE
NN
ES
SE
E E
CO
NO
MIC
RE
PO
RT
| 76 | 2016 T
EN
NE
SS
EE
EC
ON
OM
IC R
EP
OR
T
Forecast D
ata | AP
PE
ND
IX A
Table 5: Tennessee Nonfarm Employment by Sector, Not Seasonally Adjusted (thousands of jobs)
2015:3 2015:4 2016:1 2016:2 2016:3 2016:4 2017:1 2017:2 2017:3 2017:4 2018:1 2014 2015 2016 2017
TOTAL NONFARM……………………………………………… 2869.0 2927.8 2881.0 2919.4 2915.6 2957.6 2914.0 2956.0 2955.7 3001.1 2955.6 2815.4 2871.3 2918.4 2956.7% Chg Same Qtr Last Yr........................................... 1.90 2.01 2.09 1.86 1.62 1.02 1.14 1.25 1.38 1.47 1.43 2.05 1.98 1.64 1.31
NATURAL RESOURCES, MINING & CONSTRUCTION… 115.7 117.1 111.8 118.0 120.8 120.2 115.0 121.5 124.5 123.9 118.3 111.0 114.6 117.7 121.2% Chg Same Qtr Last Yr........................................... 2.21 1.91 1.10 2.39 4.43 2.62 2.92 2.99 3.05 3.11 2.84 2.92 3.26 2.66 3.02
MANUFACTURING…………………………………………… 331.6 333.8 332.1 333.1 334.0 335.8 334.3 335.6 336.4 338.2 336.7 325.2 331.5 333.8 336.1% Chg Same Qtr Last Yr........................................... 1.71 1.21 0.60 0.77 0.75 0.59 0.68 0.74 0.71 0.71 0.70 2.14 1.93 0.68 0.71
DURABLE GOODS………………………………………… 211.8 213.4 213.1 214.2 215.1 216.8 216.4 217.7 218.3 220.0 219.6 205.5 211.7 214.8 218.1% Chg Same Qtr Last Yr........................................... 2.97 1.89 1.40 1.35 1.56 1.58 1.56 1.59 1.51 1.46 1.49 3.36 2.99 1.47 1.53
NONDURABLE GOODS…………………………………… 119.8 120.4 119.0 118.9 119.0 119.0 117.9 117.9 118.1 118.2 117.0 119.7 119.8 119.0 118.0% Chg Same Qtr Last Yr........................................... -0.44 0.03 -0.80 -0.25 -0.68 -1.17 -0.91 -0.81 -0.72 -0.67 -0.75 0.10 0.10 -0.73 -0.77
TRADE, TRANSPORTATION, UTILITIES………………… 610.0 624.6 609.7 618.1 618.6 629.7 615.4 624.4 625.9 637.5 622.9 591.6 607.6 619.0 625.8% Chg Same Qtr Last Yr........................................... 2.95 3.07 2.82 2.52 1.41 0.81 0.93 1.02 1.17 1.24 1.22 1.64 2.70 1.87 1.09
WHOLESALE TRADE……………………………………… 127.8 130.1 129.0 130.2 130.5 130.4 129.5 131.0 131.6 131.7 130.8 123.3 127.0 130.0 131.0% Chg Same Qtr Last Yr........................................... 3.20 4.41 3.86 3.54 2.16 0.21 0.40 0.59 0.82 0.99 0.96 1.18 3.01 2.42 0.70
RETAIL TRADE…………………………………………… 328.4 337.3 326.6 332.4 332.3 340.2 329.8 335.6 335.9 343.9 333.1 320.5 327.9 332.9 336.3% Chg Same Qtr Last Yr........................................... 2.56 2.59 2.30 1.77 1.19 0.86 0.95 0.97 1.08 1.09 1.02 1.76 2.32 1.52 1.03
TRANSPORTATION & UTILITIES……………………… 153.8 157.2 154.0 155.5 155.8 159.1 156.1 157.8 158.3 161.9 159.0 147.9 152.8 156.1 158.5% Chg Same Qtr Last Yr........................................... 3.59 3.01 3.09 3.27 1.25 1.21 1.33 1.46 1.66 1.78 1.86 1.76 3.28 2.19 1.56
INFORMATION………………………………………………… 42.9 42.5 42.4 42.5 42.1 42.7 42.6 42.8 42.2 42.8 42.7 43.9 43.3 42.5 42.6% Chg Same Qtr Last Yr........................................... -2.06 -4.35 -3.91 -2.78 -1.70 0.46 0.48 0.47 0.21 0.27 0.21 -0.30 -1.37 -2.01 0.36
FINANCIAL ACTIVITIES…………………………………… 145.4 147.9 147.0 147.5 147.9 148.2 147.6 148.5 149.3 149.9 149.1 141.4 144.8 147.6 148.8% Chg Same Qtr Last Yr........................................... 1.99 3.74 3.49 2.42 1.72 0.18 0.44 0.66 0.92 1.14 1.02 2.41 2.39 1.94 0.79
PROFESSIONAL & BUSINESS SERVICES……………… 382.8 396.4 387.2 392.2 393.2 401.9 394.7 401.4 404.2 414.4 406.4 372.4 382.9 393.6 403.7% Chg Same Qtr Last Yr........................................... 2.28 2.93 4.18 3.02 2.71 1.38 1.93 2.34 2.78 3.12 2.98 5.43 2.82 2.80 2.55
EDUCATION & HEALTH SERVICES……………………… 406.6 416.5 414.4 416.4 416.4 424.5 422.2 424.2 424.3 432.8 430.1 402.8 409.8 417.9 425.8% Chg Same Qtr Last Yr........................................... 1.30 1.68 1.68 1.89 2.42 1.91 1.86 1.88 1.88 1.94 1.88 1.09 1.75 1.97 1.89
LEISURE & HOSPITALITY………………………………… 316.7 307.5 299.8 320.5 321.5 312.9 305.3 326.6 327.5 318.6 310.8 296.3 305.9 313.7 319.5% Chg Same Qtr Last Yr........................................... 3.44 3.63 4.23 2.73 1.51 1.76 1.84 1.89 1.89 1.84 1.79 3.64 3.25 2.53 1.87
OTHER SERVICES…………………………………………… 105.4 104.2 103.2 105.2 103.6 102.6 101.5 103.6 102.5 102.1 101.5 105.9 104.8 103.6 102.4% Chg Same Qtr Last Yr........................................... -0.85 -0.86 -0.61 -0.57 -1.71 -1.53 -1.57 -1.52 -1.09 -0.56 -0.06 0.27 -1.00 -1.11 -1.19
GOVERNMENT……………………………………………… 412.0 437.2 433.5 425.8 417.4 439.1 435.3 427.4 419.0 440.9 437.1 424.8 425.9 429.0 430.7% Chg Same Qtr Last Yr........................................... 0.62 0.34 0.42 0.77 1.30 0.44 0.41 0.39 0.39 0.40 0.41 -0.07 0.26 0.73 0.40
FEDERAL, CIVILIAN……………………………………… 47.6 47.8 46.5 45.9 46.8 47.4 46.0 45.2 46.1 46.6 45.2 48.1 47.6 46.7 46.0% Chg Same Qtr Last Yr........................................... 0.71 0.84 -1.74 -3.65 -1.53 -0.83 -1.17 -1.45 -1.54 -1.56 -1.63 -2.65 -1.16 -1.93 -1.43
STATE & LOCAL…………………………………………… 364.4 389.4 387.0 379.9 370.6 391.8 389.4 382.2 372.9 394.3 391.9 376.6 378.3 382.3 384.7% Chg Same Qtr Last Yr........................................... 0.61 0.27 0.70 1.34 1.68 0.60 0.61 0.62 0.62 0.64 0.66 0.27 0.44 1.07 0.62
Center for Business and Economic Research, University of Tennessee Tennessee Econometric Model
January 2016History Forecast Data Annual

2016 TE
NN
ES
SE
E E
CO
NO
MIC
RE
PO
RT
| 98 | 2016 T
EN
NE
SS
EE
EC
ON
OM
IC R
EP
OR
T
AP
PE
ND
IX A
| Forecast D
ata
Table 6: Tennessee Durable Goods Manufacturing Employment, Not Seasonally Adjusted (thousands of jobs)
2015:3 2015:4 2016:1 2016:2 2016:3 2016:4 2017:1 2017:2 2017:3 2017:4 2018:1 2014 2015 2016 2017
TOTAL DURABLE GOODS…………………………… 211.8 213.4 213.1 214.2 215.1 216.8 216.4 217.7 218.3 220.0 219.6 205.5 211.7 214.8 218.1% Chg Same Qtr Last Yr……………………… 2.97 1.89 1.40 1.35 1.56 1.58 1.56 1.59 1.51 1.46 1.49 3.36 2.99 1.47 1.53
WOOD PRODUCTS……………………………… 11.8 11.8 11.6 11.8 12.0 12.0 11.8 12.0 12.2 12.1 11.9 11.2 11.6 11.8 12.0% Chg Same Qtr Last Yr……………………… 3.22 2.92 2.23 1.82 1.87 1.68 1.66 1.60 1.51 1.44 1.43 3.45 3.41 1.90 1.55
NONMETALLIC MINERAL PRODUCTS………… 11.7 11.7 11.5 11.6 11.7 11.6 11.4 11.5 11.5 11.5 11.3 11.9 11.7 11.6 11.5% Chg Same Qtr Last Yr……………………… -2.49 -1.68 -1.37 -0.85 -0.61 -1.10 -0.99 -1.00 -0.99 -0.90 -0.83 -1.92 -1.68 -0.98 -0.97
PRIMARY METALS………….…………………… 10.2 10.4 10.3 10.4 10.4 10.4 10.4 10.4 10.4 10.5 10.5 10.1 10.3 10.4 10.4% Chg Same Qtr Last Yr……………………… 1.32 2.30 1.29 1.26 1.34 0.41 0.50 0.57 0.67 0.83 0.87 1.00 1.90 1.07 0.64
FABRICATED METAL PRODUCTS…………… 35.1 35.1 35.1 35.3 35.2 35.4 35.4 35.5 35.4 35.5 35.4 34.4 35.2 35.3 35.4% Chg Same Qtr Last Yr……………………… 2.13 1.35 -0.56 0.45 0.29 0.98 0.86 0.53 0.46 0.03 0.02 1.35 2.28 0.29 0.47
MACHINERY……………………………………… 26.2 25.7 26.2 26.4 26.0 25.9 26.5 26.6 26.3 26.2 26.8 25.7 26.2 26.1 26.4% Chg Same Qtr Last Yr……………………… 2.21 -2.90 -0.45 -1.36 -0.56 0.88 0.96 1.02 1.05 1.13 1.21 1.41 1.98 -0.38 1.04
COMPUTER & ELECTRONIC PRODUCTS…… 5.1 5.2 5.1 5.1 5.1 5.0 5.0 5.0 4.9 4.9 4.9 5.0 5.1 5.1 5.0% Chg Same Qtr Last Yr……………………… 1.99 3.33 2.73 1.46 -0.99 -2.94 -2.71 -2.66 -2.61 -2.57 -2.46 -3.67 1.16 0.04 -2.64
ELECTRICAL EQUIPMENT, APPLIANCES & COMPONENTS…………..…………………… 20.0 20.1 20.0 20.1 20.4 20.4 20.3 20.4 20.6 20.7 20.6 19.4 19.9 20.2 20.5
% Chg Same Qtr Last Yr……………………… 2.39 2.55 1.44 1.75 2.00 1.48 1.38 1.31 1.22 1.52 1.52 4.49 2.58 1.67 1.36
TRANSPORTATION EQUIPMENT……………… 67.4 69.1 68.9 69.1 70.0 71.8 71.5 71.8 72.5 74.3 74.0 64.0 67.5 70.0 72.5% Chg Same Qtr Last Yr……………………… 5.76 4.38 3.70 3.36 3.91 3.85 3.68 3.90 3.63 3.47 3.61 7.55 5.39 3.71 3.67
FURNITURE………………………………………… 9.2 9.2 9.2 9.3 9.2 9.2 9.3 9.4 9.3 9.3 9.3 9.1 9.2 9.3 9.3% Chg Same Qtr Last Yr……………………… 1.85 1.47 0.87 1.28 0.43 0.17 0.88 1.21 0.92 0.62 -0.04 3.52 1.38 0.68 0.91
MISCELLANEOUS DURABLE GOODS………… 15.1 15.2 15.0 15.1 15.1 15.0 14.9 15.0 15.1 15.0 14.9 14.7 15.1 15.1 15.0% Chg Same Qtr Last Yr……………………… 1.34 1.34 0.54 0.20 0.23 -0.89 -0.70 -0.72 -0.43 -0.10 -0.13 1.26 2.38 0.02 -0.49
Center for Business and Economic Research, University of Tennessee Tennessee Econometric Model
January 2016
History Annual

2016 TE
NN
ES
SE
E E
CO
NO
MIC
RE
PO
RT
| 98 | 2016 T
EN
NE
SS
EE
EC
ON
OM
IC R
EP
OR
T
Forecast D
ata | AP
PE
ND
IX A
Table 7: Tennessee Nondurable Goods Manufacturing Employment, Not Seasonally Adjusted (thousands of jobs)
2015:3 2015:4 2016:1 2016:2 2016:3 2016:4 2017:1 2017:2 2017:3 2017:4 2018:1 2014 2015 2016 2017
TOTAL NONDURABLE GOODS…………………… 119.8 120.4 119.0 118.9 119.0 119.0 117.9 117.9 118.1 118.2 117.0 119.7 119.8 119.0 118.0% Chg Same Qtr Last Yr……………………… -0.44 0.03 -0.80 -0.25 -0.68 -1.17 -0.91 -0.81 -0.72 -0.67 -0.75 0.10 0.10 -0.73 -0.77
FOOD……………………………………………… 33.0 33.1 32.8 32.7 33.0 33.2 32.8 32.8 33.1 33.2 32.9 32.7 32.9 32.9 33.0% Chg Same Qtr Last Yr……………………… 0.41 0.20 0.05 0.31 0.04 0.09 0.12 0.11 0.12 0.12 0.09 0.95 0.54 0.12 0.12
BEVERAGE & TOBACCO………………………… 5.5 5.5 5.4 5.5 5.5 5.4 5.4 5.4 5.4 5.4 5.3 5.4 5.5 5.5 5.4% Chg Same Qtr Last Yr……………………… 0.00 1.85 0.90 0.67 0.02 -1.37 -1.14 -1.05 -0.94 -0.83 -0.85 1.88 0.77 0.05 -0.99
TEXTILE MILLS, TEXTILE MILL PRODUCTS & APPAREL……………………… 9.6 9.6 9.3 9.2 9.2 9.1 8.8 8.8 8.7 8.6 8.4 10.0 9.6 9.2 8.7
% Chg Same Qtr Last Yr……………………… -3.68 -2.71 -3.44 -3.59 -4.21 -5.12 -4.80 -4.93 -5.09 -5.17 -5.25 -4.54 -4.09 -4.09 -5.00
PAPER……………………………………………… 14.4 14.3 13.9 14.0 14.1 13.8 13.6 13.7 13.7 13.5 13.3 14.6 14.3 14.0 13.6% Chg Same Qtr Last Yr……………………… -2.92 -2.06 -2.01 -1.68 -2.34 -3.09 -2.74 -2.51 -2.28 -2.05 -2.07 -0.51 -2.22 -2.28 -2.39
PRINTING & RELATED SUPPORT……………… 9.0 8.9 8.8 8.9 8.8 8.8 8.8 8.8 8.7 8.8 8.7 9.4 9.0 8.8 8.8% Chg Same Qtr Last Yr……………………… -4.61 -4.63 -3.88 -2.24 -1.79 -1.03 -0.43 -0.52 -0.65 -0.76 -1.43 -1.73 -4.32 -2.25 -0.59
CHEMICALS………………………………………… 25.3 25.3 25.1 25.0 25.0 24.9 24.8 24.7 24.7 24.6 24.5 25.3 25.2 25.0 24.7% Chg Same Qtr Last Yr……………………… -0.79 -0.39 -0.72 -0.59 -1.21 -1.57 -1.32 -1.16 -0.99 -0.90 -0.93 2.12 -0.39 -1.02 -1.09
PLASTICS & RUBBER…………………………… 21.3 21.5 21.6 21.6 21.6 21.7 21.8 21.9 21.9 22.1 22.2 20.7 21.3 21.6 21.9% Chg Same Qtr Last Yr……………………… 1.59 1.74 1.56 2.55 1.54 0.86 1.20 1.47 1.64 1.73 1.62 2.40 2.90 1.62 1.51
MISCELLANEOUS NONDURABLE GOODS…… 1.8 2.2 2.0 2.0 1.9 2.1 1.9 1.9 1.8 2.0 1.8 1.5 2.1 2.0 1.9% Chg Same Qtr Last Yr……………………… 30.95 36.73 -8.97 -1.72 2.50 -5.88 -5.70 -5.47 -5.62 -5.78 -6.18 -27.45 35.68 -3.84 -5.64
Tennessee Econometric Model
Annual
January 2016
Center for Business and Economic Research, University of Tennessee
History

2016 TE
NN
ES
SE
E E
CO
NO
MIC
RE
PO
RT
| 1110 | 2016 T
EN
NE
SS
EE
EC
ON
OM
IC R
EP
OR
T
AP
PE
ND
IX A
| Forecast D
ata
Table 8: Tennessee Nonfarm Employment by Sector, Seasonally Adjusted (thousands of jobs)
2015:3 2015:4 2016:1 2016:2 2016:3 2016:4 2017:1 2017:2 2017:3 2017:4 2018:1 2014 2015 2016 2017
TOTAL NONFARM………………………………… 2874.8 2900.1 2906.8 2914.1 2921.4 2929.6 2940.2 2950.6 2961.5 2972.7 2982.4 2816.1 2870.7 2918.0 2956.2% Chg Prev Qtr SAAR………..…………… 1.94 3.57 0.92 1.01 1.01 1.13 1.45 1.42 1.49 1.53 1.30 2.08 1.94 1.65 1.31% Chg Same Qtr Last Yr………………… 1.79 2.00 2.10 1.85 1.62 1.02 1.15 1.25 1.37 1.47 1.43 2.08 1.94 1.65 1.31
NATURAL RESOURCES, MINING AND CONSTRUCTION……………………… 112.9 115.7 116.3 117.1 117.9 118.8 119.7 120.6 121.5 122.5 123.1 110.9 114.5 117.5 121.0
% Chg Prev Qtr SAAR………..…………… -5.03 10.55 1.87 2.78 2.76 3.09 3.07 3.04 3.02 3.33 1.97 2.87 3.20 2.63 3.02% Chg Same Qtr Last Yr………………… 2.08 1.91 1.10 2.39 4.43 2.62 2.92 2.99 3.05 3.11 2.84 2.87 3.20 2.63 3.02
MANUFACTURING……………………………… 331.5 332.7 333.0 333.4 334.0 334.7 335.3 335.8 336.4 337.0 337.6 325.2 331.5 333.7 336.1% Chg Prev Qtr SAAR………..…………… 0.81 1.53 0.37 0.41 0.71 0.85 0.73 0.68 0.62 0.80 0.70 2.13 1.93 0.68 0.71% Chg Same Qtr Last Yr………………… 1.74 1.17 0.60 0.78 0.75 0.58 0.67 0.74 0.72 0.71 0.70 2.13 1.93 0.68 0.71
DURABLE GOODS…………………………… 211.9 212.8 213.6 214.2 215.2 216.2 216.9 217.7 218.4 219.3 220.1 205.5 211.7 214.8 218.1% Chg Prev Qtr SAAR………..…………… 0.92 1.86 1.39 1.26 1.74 1.89 1.35 1.42 1.39 1.67 1.49 3.36 2.99 1.47 1.53% Chg Same Qtr Last Yr………………… 3.00 1.86 1.40 1.36 1.56 1.57 1.56 1.60 1.51 1.46 1.49 3.36 2.99 1.47 1.53
NONDURABLE GOODS…………………… 119.6 119.9 119.4 119.1 118.8 118.5 118.4 118.2 117.9 117.7 117.5 119.7 119.8 119.0 118.0% Chg Prev Qtr SAAR………..…………… 0.61 0.95 -1.42 -1.10 -1.11 -1.03 -0.40 -0.67 -0.78 -0.79 -0.76 0.09 0.10 -0.72 -0.77% Chg Same Qtr Last Yr………………… -0.42 -0.02 -0.81 -0.25 -0.68 -1.17 -0.91 -0.80 -0.72 -0.66 -0.75 0.09 0.10 -0.72 -0.77
TRADE, TRANSPORTATION, UTILITIES…… 610.9 615.9 616.9 618.3 619.5 620.9 622.7 624.6 626.8 628.7 630.3 592.1 607.5 618.9 625.7% Chg Prev Qtr SAAR………..…………… 5.27 3.34 0.65 0.87 0.80 0.94 1.13 1.21 1.42 1.22 1.03 1.71 2.60 1.88 1.09% Chg Same Qtr Last Yr………………… 2.85 3.06 2.82 2.52 1.41 0.81 0.93 1.02 1.17 1.24 1.22 1.71 2.60 1.88 1.09
WHOLESALE TRADE……………………… 127.3 129.9 130.0 130.0 130.1 130.2 130.5 130.8 131.1 131.5 131.7 123.3 127.0 130.1 131.0% Chg Prev Qtr SAAR………..…………… 5.75 8.42 0.09 0.16 0.21 0.39 0.84 0.93 1.12 1.07 0.74 1.22 2.99 2.42 0.70% Chg Same Qtr Last Yr………………… 3.02 4.42 3.86 3.54 2.16 0.21 0.40 0.59 0.82 0.99 0.96 1.22 2.99 2.42 0.70
RETAIL TRADE……………………………… 329.3 331.1 331.7 332.5 333.2 334.0 334.8 335.7 336.8 337.6 338.3 320.8 327.8 332.8 336.3% Chg Prev Qtr SAAR………..…………… 3.22 2.25 0.67 0.98 0.87 0.94 1.02 1.07 1.30 0.98 0.73 1.86 2.19 1.53 1.03% Chg Same Qtr Last Yr………………… 2.31 2.56 2.30 1.77 1.19 0.86 0.95 0.97 1.08 1.09 1.02 1.86 2.19 1.53 1.03
TRANSPORTATION & UTILITIES………… 154.3 154.9 155.3 155.8 156.2 156.7 157.4 158.0 158.8 159.5 160.3 148.0 152.7 156.0 158.4% Chg Prev Qtr SAAR………..…………… 9.42 1.56 1.09 1.22 1.14 1.38 1.59 1.73 1.94 1.86 1.92 1.81 3.15 2.19 1.56% Chg Same Qtr Last Yr………………… 3.86 3.02 3.09 3.27 1.25 1.21 1.33 1.46 1.66 1.78 1.86 1.81 3.15 2.19 1.56
INFORMATION………………………………… 43.2 42.4 42.4 42.5 42.5 42.6 42.6 42.7 42.6 42.7 42.7 43.9 43.4 42.5 42.6% Chg Prev Qtr SAAR………..…………… -3.91 -7.78 0.39 0.42 0.45 0.58 0.49 0.37 -0.60 0.81 0.26 -0.36 -1.27 -2.01 0.36% Chg Same Qtr Last Yr………………… -1.52 -4.36 -3.91 -2.78 -1.70 0.46 0.48 0.47 0.21 0.27 0.21 -0.36 -1.27 -2.01 0.36
FINANCIAL ACTIVITIES……………………… 145.1 147.5 147.5 147.6 147.6 147.8 148.2 148.6 149.0 149.4 149.7 141.5 144.8 147.6 148.8% Chg Prev Qtr SAAR………..…………… 2.90 6.68 0.04 0.21 0.12 0.35 1.07 1.10 1.16 1.22 0.59 2.41 2.34 1.94 0.79% Chg Same Qtr Last Yr………………… 2.06 3.68 3.49 2.42 1.72 0.18 0.44 0.66 0.92 1.14 1.02 2.41 2.34 1.94 0.79
January 2016
History Annual
(CONTINUED ON NEXT PAGE)

2016 TE
NN
ES
SE
E E
CO
NO
MIC
RE
PO
RT
| 1110 | 2016 T
EN
NE
SS
EE
EC
ON
OM
IC R
EP
OR
T
Forecast D
ata | AP
PE
ND
IX A
Table 8: Tennessee Nonfarm Employment by Sector, Seasonally Adjusted (thousands of jobs)
2015:3 2015:4 2016:1 2016:2 2016:3 2016:4 2017:1 2017:2 2017:3 2017:4 2018:1 2014 2015 2016 2017
January 2016
History Annual
PROFESSIONAL & BUSINESS SERVICES… 384.0 390.7 391.8 393.0 394.4 396.1 399.3 402.2 405.4 408.4 411.2 372.6 383.0 393.8 403.8% Chg Prev Qtr SAAR………..…………… 2.65 7.20 1.09 1.27 1.41 1.74 3.32 2.92 3.16 3.08 2.75 5.54 2.80 2.81 2.55% Chg Same Qtr Last Yr………………… 2.13 2.95 4.18 3.02 2.71 1.38 1.93 2.34 2.78 3.12 2.98 5.54 2.80 2.81 2.55
EDUCATION & HEALTH SERVICES………… 409.0 412.8 415.0 417.0 418.9 420.7 422.7 424.8 426.8 428.9 430.7 402.6 409.8 417.9 425.8% Chg Prev Qtr SAAR………..…………… -0.26 3.84 2.09 1.94 1.84 1.78 1.89 2.01 1.85 2.02 1.64 1.05 1.78 1.98 1.89% Chg Same Qtr Last Yr………………… 1.41 1.67 1.68 1.89 2.42 1.91 1.86 1.88 1.88 1.94 1.88 1.05 1.78 1.98 1.89
LEISURE & HOSPITALITY…………………… 309.6 310.3 311.6 312.9 314.3 315.8 317.4 318.8 320.2 321.6 323.1 296.1 305.9 313.6 319.5% Chg Prev Qtr SAAR………..…………… 6.82 0.95 1.67 1.59 1.85 1.93 1.99 1.78 1.86 1.74 1.80 3.62 3.28 2.54 1.86% Chg Same Qtr Last Yr………………… 3.73 3.62 4.23 2.73 1.51 1.76 1.84 1.89 1.89 1.84 1.79 3.62 3.28 2.54 1.86
OTHER SERVICES……………………………… 105.2 104.6 104.2 103.9 103.4 103.0 102.6 102.4 102.3 102.4 102.5 105.8 104.8 103.6 102.4% Chg Prev Qtr SAAR………..…………… 2.71 -2.51 -1.31 -1.07 -1.95 -1.79 -1.47 -0.87 -0.22 0.34 0.51 0.21 -0.97 -1.11 -1.19% Chg Same Qtr Last Yr………………… -0.47 -0.85 -0.61 -0.57 -1.71 -1.53 -1.57 -1.52 -1.09 -0.56 -0.06 0.21 -0.97 -1.11 -1.19
GOVERNMENT………………………………… 423.5 427.5 428.0 428.6 429.0 429.4 429.8 430.2 430.7 431.1 431.6 425.2 425.6 428.7 430.4% Chg Prev Qtr SAAR………..…………… -1.68 3.83 0.54 0.49 0.39 0.36 0.42 0.40 0.39 0.39 0.46 0.00 0.10 0.73 0.40% Chg Same Qtr Last Yr………………… -0.18 0.32 0.42 0.77 1.30 0.44 0.41 0.39 0.39 0.40 0.41 0.00 0.10 0.73 0.40
FEDERAL, CIVILIAN………………………… 47.2 46.6 46.6 46.6 46.4 46.2 46.1 45.9 45.7 45.5 45.3 47.9 47.4 46.5 45.8% Chg Prev Qtr SAAR………..…………… -9.56 -4.45 0.07 -0.33 -1.34 -1.70 -1.33 -1.45 -1.66 -1.80 -1.62 -3.33 -1.06 -1.95 -1.43% Chg Same Qtr Last Yr………………… -1.19 0.58 -1.74 -3.65 -1.53 -0.83 -1.17 -1.45 -1.54 -1.56 -1.63 -3.33 -1.06 -1.95 -1.43
STATE & LOCAL……………………………… 376.3 380.8 381.4 382.0 382.5 383.1 383.7 384.3 384.9 385.6 386.2 377.3 378.2 382.3 384.6% Chg Prev Qtr SAAR………..…………… -0.64 4.91 0.60 0.59 0.61 0.61 0.63 0.63 0.63 0.65 0.71 0.44 0.24 1.07 0.62% Chg Same Qtr Last Yr………………… -0.05 0.29 0.70 1.34 1.66 0.60 0.61 0.62 0.63 0.64 0.66 0.44 0.24 1.07 0.62
STATISTICAL DISCREPANCY (% )……… 0.01 -0.01 0.00 0.00
Tennessee Econometric ModelCenter for Business and Economic Research, University of Tennessee
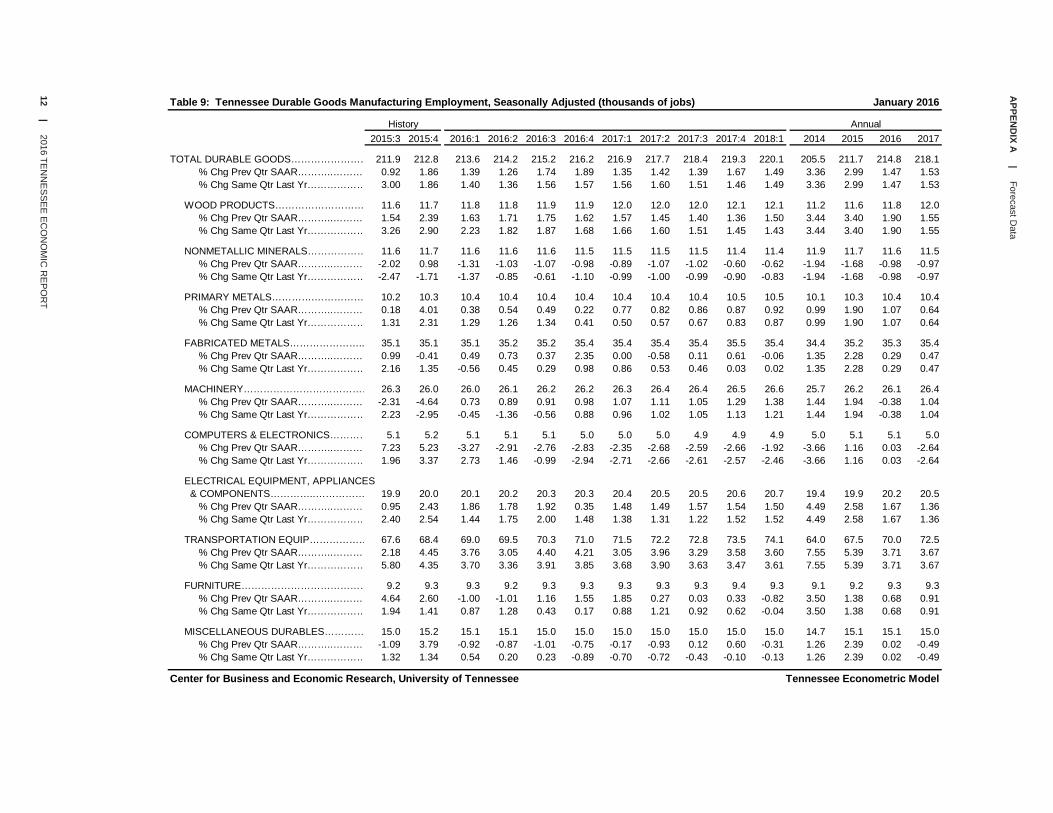
2016 TE
NN
ES
SE
E E
CO
NO
MIC
RE
PO
RT
| 1312 | 2016 T
EN
NE
SS
EE
EC
ON
OM
IC R
EP
OR
T
AP
PE
ND
IX A
| Forecast D
ata
Table 9: Tennessee Durable Goods Manufacturing Employment, Seasonally Adjusted (thousands of jobs)
2015:3 2015:4 2016:1 2016:2 2016:3 2016:4 2017:1 2017:2 2017:3 2017:4 2018:1 2014 2015 2016 2017
TOTAL DURABLE GOODS…………………… 211.9 212.8 213.6 214.2 215.2 216.2 216.9 217.7 218.4 219.3 220.1 205.5 211.7 214.8 218.1% Chg Prev Qtr SAAR………..………… 0.92 1.86 1.39 1.26 1.74 1.89 1.35 1.42 1.39 1.67 1.49 3.36 2.99 1.47 1.53% Chg Same Qtr Last Yr……………… 3.00 1.86 1.40 1.36 1.56 1.57 1.56 1.60 1.51 1.46 1.49 3.36 2.99 1.47 1.53
WOOD PRODUCTS……………………… 11.6 11.7 11.8 11.8 11.9 11.9 12.0 12.0 12.0 12.1 12.1 11.2 11.6 11.8 12.0% Chg Prev Qtr SAAR………..………… 1.54 2.39 1.63 1.71 1.75 1.62 1.57 1.45 1.40 1.36 1.50 3.44 3.40 1.90 1.55% Chg Same Qtr Last Yr……………… 3.26 2.90 2.23 1.82 1.87 1.68 1.66 1.60 1.51 1.45 1.43 3.44 3.40 1.90 1.55
NONMETALLIC MINERALS……………… 11.6 11.7 11.6 11.6 11.6 11.5 11.5 11.5 11.5 11.4 11.4 11.9 11.7 11.6 11.5% Chg Prev Qtr SAAR………..………… -2.02 0.98 -1.31 -1.03 -1.07 -0.98 -0.89 -1.07 -1.02 -0.60 -0.62 -1.94 -1.68 -0.98 -0.97% Chg Same Qtr Last Yr……………… -2.47 -1.71 -1.37 -0.85 -0.61 -1.10 -0.99 -1.00 -0.99 -0.90 -0.83 -1.94 -1.68 -0.98 -0.97
PRIMARY METALS………….…………… 10.2 10.3 10.4 10.4 10.4 10.4 10.4 10.4 10.4 10.5 10.5 10.1 10.3 10.4 10.4% Chg Prev Qtr SAAR………..………… 0.18 4.01 0.38 0.54 0.49 0.22 0.77 0.82 0.86 0.87 0.92 0.99 1.90 1.07 0.64% Chg Same Qtr Last Yr……………… 1.31 2.31 1.29 1.26 1.34 0.41 0.50 0.57 0.67 0.83 0.87 0.99 1.90 1.07 0.64
FABRICATED METALS………………….. 35.1 35.1 35.1 35.2 35.2 35.4 35.4 35.4 35.4 35.5 35.4 34.4 35.2 35.3 35.4% Chg Prev Qtr SAAR………..………… 0.99 -0.41 0.49 0.73 0.37 2.35 0.00 -0.58 0.11 0.61 -0.06 1.35 2.28 0.29 0.47% Chg Same Qtr Last Yr……………… 2.16 1.35 -0.56 0.45 0.29 0.98 0.86 0.53 0.46 0.03 0.02 1.35 2.28 0.29 0.47
MACHINERY………………………………… 26.3 26.0 26.0 26.1 26.2 26.2 26.3 26.4 26.4 26.5 26.6 25.7 26.2 26.1 26.4% Chg Prev Qtr SAAR………..………… -2.31 -4.64 0.73 0.89 0.91 0.98 1.07 1.11 1.05 1.29 1.38 1.44 1.94 -0.38 1.04% Chg Same Qtr Last Yr……………… 2.23 -2.95 -0.45 -1.36 -0.56 0.88 0.96 1.02 1.05 1.13 1.21 1.44 1.94 -0.38 1.04
COMPUTERS & ELECTRONICS………… 5.1 5.2 5.1 5.1 5.1 5.0 5.0 5.0 4.9 4.9 4.9 5.0 5.1 5.1 5.0% Chg Prev Qtr SAAR………..………… 7.23 5.23 -3.27 -2.91 -2.76 -2.83 -2.35 -2.68 -2.59 -2.66 -1.92 -3.66 1.16 0.03 -2.64% Chg Same Qtr Last Yr……………… 1.96 3.37 2.73 1.46 -0.99 -2.94 -2.71 -2.66 -2.61 -2.57 -2.46 -3.66 1.16 0.03 -2.64
ELECTRICAL EQUIPMENT, APPLIANCES & COMPONENTS…………..…………… 19.9 20.0 20.1 20.2 20.3 20.3 20.4 20.5 20.5 20.6 20.7 19.4 19.9 20.2 20.5
% Chg Prev Qtr SAAR………..………… 0.95 2.43 1.86 1.78 1.92 0.35 1.48 1.49 1.57 1.54 1.50 4.49 2.58 1.67 1.36% Chg Same Qtr Last Yr……………… 2.40 2.54 1.44 1.75 2.00 1.48 1.38 1.31 1.22 1.52 1.52 4.49 2.58 1.67 1.36
TRANSPORTATION EQUIP……………… 67.6 68.4 69.0 69.5 70.3 71.0 71.5 72.2 72.8 73.5 74.1 64.0 67.5 70.0 72.5% Chg Prev Qtr SAAR………..………… 2.18 4.45 3.76 3.05 4.40 4.21 3.05 3.96 3.29 3.58 3.60 7.55 5.39 3.71 3.67% Chg Same Qtr Last Yr……………… 5.80 4.35 3.70 3.36 3.91 3.85 3.68 3.90 3.63 3.47 3.61 7.55 5.39 3.71 3.67
FURNITURE………………………………… 9.2 9.3 9.3 9.2 9.3 9.3 9.3 9.3 9.3 9.4 9.3 9.1 9.2 9.3 9.3% Chg Prev Qtr SAAR………..………… 4.64 2.60 -1.00 -1.01 1.16 1.55 1.85 0.27 0.03 0.33 -0.82 3.50 1.38 0.68 0.91% Chg Same Qtr Last Yr……………… 1.94 1.41 0.87 1.28 0.43 0.17 0.88 1.21 0.92 0.62 -0.04 3.50 1.38 0.68 0.91
MISCELLANEOUS DURABLES………… 15.0 15.2 15.1 15.1 15.0 15.0 15.0 15.0 15.0 15.0 15.0 14.7 15.1 15.1 15.0% Chg Prev Qtr SAAR………..………… -1.09 3.79 -0.92 -0.87 -1.01 -0.75 -0.17 -0.93 0.12 0.60 -0.31 1.26 2.39 0.02 -0.49% Chg Same Qtr Last Yr……………… 1.32 1.34 0.54 0.20 0.23 -0.89 -0.70 -0.72 -0.43 -0.10 -0.13 1.26 2.39 0.02 -0.49
Center for Business and Economic Research, University of Tennessee Tennessee Econometric Model
January 2016
History Annual

2016 TE
NN
ES
SE
E E
CO
NO
MIC
RE
PO
RT
| 1312 | 2016 T
EN
NE
SS
EE
EC
ON
OM
IC R
EP
OR
T
Forecast D
ata | AP
PE
ND
IX A
Table 10: Tennessee Nondurable Goods Manufacturing Employment, Seasonally Adjusted (thousands of jobs)
2015:3 2015:4 2016:1 2016:2 2016:3 2016:4 2017:1 2017:2 2017:3 2017:4 2018:1 2014 2015 2016 2017
TOTAL NONDURABLE GOODS………………… 119.6 119.9 119.4 119.1 118.8 118.5 118.4 118.2 117.9 117.7 117.5 119.7 119.8 119.0 118.0% Chg Prev Qtr SAAR………..…………… 0.61 0.95 -1.42 -1.10 -1.11 -1.03 -0.40 -0.67 -0.78 -0.79 -0.76 0.09 0.10 -0.72 -0.77% Chg Same Qtr Last Yr…………………… -0.42 -0.02 -0.81 -0.25 -0.68 -1.17 -0.91 -0.80 -0.72 -0.66 -0.75 0.09 0.10 -0.72 -0.77
FOOD……………………………………………… 32.9 32.9 32.9 32.9 32.9 32.9 32.9 33.0 33.0 33.0 33.0 32.7 32.9 32.9 33.0% Chg Prev Qtr SAAR………..…………… 1.18 -0.09 0.04 0.12 0.09 0.10 0.17 0.10 0.12 0.10 0.06 0.95 0.54 0.12 0.12% Chg Same Qtr Last Yr…………………… 0.40 0.19 0.05 0.31 0.04 0.09 0.12 0.11 0.12 0.12 0.09 0.95 0.54 0.12 0.12
BEVERAGE & TOBACCO……………………… 5.4 5.5 5.5 5.5 5.4 5.4 5.4 5.4 5.4 5.4 5.4 5.4 5.5 5.5 5.4% Chg Prev Qtr SAAR………..…………… 1.25 4.48 -1.72 -1.19 -1.37 -1.21 -0.79 -0.84 -0.90 -0.77 -0.87 1.89 0.77 0.05 -0.99% Chg Same Qtr Last Yr…………………… 0.03 1.87 0.90 0.67 0.02 -1.37 -1.14 -1.05 -0.94 -0.83 -0.85 1.89 0.77 0.05 -0.99
TEXTILE MILLS, TEXTILE MILL PRODUCTS & APPAREL…………………… 9.5 9.5 9.4 9.2 9.1 9.0 8.9 8.8 8.7 8.6 8.4 10.0 9.6 9.2 8.7
% Chg Prev Qtr SAAR………..…………… -2.36 -1.35 -5.64 -4.97 -4.83 -5.02 -4.39 -5.49 -5.45 -5.35 -4.72 -4.53 -4.10 -4.09 -5.00% Chg Same Qtr Last Yr…………………… -3.66 -2.76 -3.44 -3.59 -4.21 -5.12 -4.80 -4.93 -5.09 -5.17 -5.25 -4.53 -4.10 -4.09 -5.00
PAPER…………………………………………… 14.2 14.3 14.1 14.0 13.9 13.8 13.7 13.7 13.6 13.5 13.5 14.6 14.3 14.0 13.6% Chg Prev Qtr SAAR………..…………… -0.30 0.24 -3.55 -3.07 -2.93 -2.81 -2.13 -2.16 -2.03 -1.88 -2.20 -0.53 -2.23 -2.28 -2.40% Chg Same Qtr Last Yr…………………… -2.89 -2.07 -2.01 -1.68 -2.34 -3.09 -2.74 -2.51 -2.28 -2.05 -2.07 -0.53 -2.23 -2.28 -2.40
PRINTING & RELATED SUPPORT…………… 9.0 8.9 8.9 8.9 8.8 8.8 8.8 8.8 8.8 8.7 8.7 9.5 9.0 8.8 8.8% Chg Prev Qtr SAAR………..…………… -2.85 -4.00 -1.19 -0.88 -1.05 -1.01 1.24 -1.23 -1.59 -1.41 -1.47 -1.73 -4.32 -2.25 -0.59% Chg Same Qtr Last Yr…………………… -4.61 -4.63 -3.88 -2.24 -1.79 -1.03 -0.43 -0.52 -0.65 -0.76 -1.43 -1.73 -4.32 -2.25 -0.59
CHEMICALS……………………………………… 25.2 25.2 25.1 25.0 24.9 24.8 24.8 24.7 24.7 24.6 24.5 25.3 25.2 25.0 24.7% Chg Prev Qtr SAAR………..…………… 0.95 -0.01 -1.79 -1.47 -1.55 -1.48 -0.79 -0.81 -0.89 -1.10 -0.91 2.12 -0.40 -1.02 -1.09% Chg Same Qtr Last Yr…………………… -0.79 -0.40 -0.72 -0.59 -1.21 -1.57 -1.32 -1.16 -0.99 -0.90 -0.93 2.12 -0.40 -1.02 -1.09
PLASTICS & RUBBER………………………… 21.3 21.5 21.5 21.6 21.6 21.7 21.8 21.9 22.0 22.1 22.1 20.7 21.3 21.6 21.9% Chg Prev Qtr SAAR………..…………… 5.00 3.86 0.54 0.87 0.91 1.14 1.88 1.94 1.60 1.50 1.45 2.39 2.90 1.62 1.51% Chg Same Qtr Last Yr…………………… 1.52 1.75 1.56 2.55 1.54 0.86 1.20 1.47 1.64 1.73 1.62 2.39 2.90 1.62 1.51
MISCELLANEOUS NONDURABLE GOODS… 1.9 2.1 2.1 2.0 2.0 2.0 1.9 1.9 1.9 1.9 1.8 1.5 2.1 2.0 1.9% Chg Prev Qtr SAAR………..…………… -20.70 32.68 -5.85 -5.80 -6.21 -5.65 -5.14 -4.86 -6.83 -6.27 -6.76 -27.54 35.66 -3.74 -5.64% Chg Same Qtr Last Yr…………………… 31.50 35.85 -8.97 -1.72 2.50 -5.88 -5.70 -5.47 -5.62 -5.78 -6.18 -27.54 35.66 -3.74 -5.64
Tennessee Econometric Model
Annual
January 2016
Center for Business and Economic Research, University of Tennessee
History

2016 TE
NN
ES
SE
E E
CO
NO
MIC
RE
PO
RT
| 1514 | 2016 T
EN
NE
SS
EE
EC
ON
OM
IC R
EP
OR
T
AP
PE
ND
IX A
| Forecast D
ata
Table 11: Tennessee Average Annual Wage and Salary Rate by Sector, Not Seasonally Adjusted (2009 dollars)
2015:2 2015:3 2015:4 2016:1 2016:2 2016:3 2016:4 2017:1 2017:2 2017:3 2017:4 2018:1 2014 2015 2016 2017
TOTAL NONFARM…………………………………… 43201 43357 43262 44366 44004 44145 43704 44672 44229 44432 44050 44948 41973 43155 44055 44346% Chg Same Qtr Last Yr…………………… 3.46 3.35 3.11 3.66 1.86 1.82 1.02 0.69 0.51 0.65 0.79 0.62 1.20 2.82 2.08 0.66
NATURAL RESOURCES, MINING AND CONSTRUCTION………………………… 49672 49815 50771 53788 51404 50503 51210 54121 51693 50885 51719 54548 47206 49911 51726 52104
% Chg Same Qtr Last Yr…………………… 5.75 7.83 8.26 8.91 3.49 1.38 0.86 0.62 0.56 0.76 0.99 0.79 3.20 5.73 3.64 0.73
MANUFACTURING……………………………… 52689 53229 53766 54469 54520 54549 54551 55048 54976 55037 55097 55471 51605 52464 54522 55039% Chg Same Qtr Last Yr…………………… 2.34 3.83 2.90 8.57 3.48 2.48 1.46 1.06 0.84 0.89 1.00 0.77 1.40 1.66 3.92 0.95
DURABLE GOODS…………………………… 51051 51364 51833 52365 52332 52446 52380 52818 52719 52904 52935 53270 50494 50846 52381 52844% Chg Same Qtr Last Yr…………………… 1.14 2.27 0.94 6.57 2.51 2.11 1.06 0.86 0.74 0.87 1.06 0.86 2.00 0.70 3.02 0.88
NONDURABLE GOODS……………………… 55594 56527 57212 58245 58469 58347 58511 59141 59144 58974 59130 59602 53509 55329 58393 59097% Chg Same Qtr Last Yr…………………… 4.47 6.54 6.30 12.05 5.17 3.22 2.27 1.54 1.15 1.07 1.06 0.78 0.60 3.40 5.54 1.21
TRADE, TRANSPORTATION, UTILITIES…… 39131 39138 38861 40211 39910 39960 39444 40675 40295 40415 39935 41108 38748 39032 39881 40330% Chg Same Qtr Last Yr…………………… 2.27 1.64 -1.11 3.11 1.99 2.10 1.50 1.16 0.96 1.14 1.24 1.06 1.37 0.73 2.18 1.13
WHOLESALE TRADE………………………… 59725 59131 59738 60835 60521 60464 60701 61509 61066 61030 61304 62048 59172 59361 60630 61227% Chg Same Qtr Last Yr…………………… 2.68 0.33 -0.83 3.37 1.33 2.25 1.61 1.11 0.90 0.94 0.99 0.88 2.55 0.32 2.14 0.98
RETAIL TRADE…………………………………26647 26986 26637 27743 27438 27487 26987 28040 27689 27813 27328 28331 26510 26683 27414 27718% Chg Same Qtr Last Yr…………………… 2.10 2.78 -1.86 4.85 2.97 1.86 1.32 1.07 0.91 1.19 1.26 1.04 1.42 0.65 2.74 1.11
TRANSPORTATION & UTILITIES……………49003 48479 48009 49534 49402 49432 48657 50055 49825 49967 49273 50570 48242 48694 49256 49780% Chg Same Qtr Last Yr…………………… 2.02 1.23 -0.78 0.50 0.81 1.97 1.35 1.05 0.86 1.08 1.27 1.03 0.33 0.94 1.15 1.06
INFORMATION…………………………………… 56909 58773 58666 59235 59304 59875 59247 59567 59588 60342 59859 60058 55891 57841 59416 59839% Chg Same Qtr Last Yr…………………… 0.61 3.84 9.75 3.89 4.21 1.88 0.99 0.56 0.48 0.78 1.03 0.82 3.32 3.49 2.72 0.71
FINANCIAL ACTIVITIES………………………… 64660 64744 65463 66457 66508 66344 66428 67131 67038 66907 67046 67566 63255 64649 66434 67030% Chg Same Qtr Last Yr…………………… 3.13 3.67 2.35 4.28 2.86 2.47 1.47 1.01 0.80 0.85 0.93 0.65 2.66 2.20 2.76 0.90
PROFESSIONAL & BUSINESS SERVICES… 52018 50679 50169 51860 51482 51502 50657 52194 51733 51819 51036 52507 47659 51092 51375 51695% Chg Same Qtr Last Yr…………………… 8.87 6.59 6.89 0.70 -1.03 1.62 0.97 0.64 0.49 0.62 0.75 0.60 -1.55 7.20 0.55 0.62
EDUCATION & HEALTH SERVICES………… 43759 44501 44188 44904 44998 45161 44551 45182 45206 45455 44910 45484 42791 44062 44904 45188% Chg Same Qtr Last Yr…………………… 2.31 3.40 4.28 2.53 2.83 1.48 0.82 0.62 0.46 0.65 0.81 0.67 0.55 2.97 1.91 0.63
LEISURE & HOSPITALITY……………………… 21089 20653 21626 22500 21220 21254 22000 22762 21425 21500 22282 23014 20161 21141 21743 21992% Chg Same Qtr Last Yr…………………… 7.21 5.27 3.92 6.14 0.62 2.91 1.73 1.16 0.97 1.16 1.29 1.10 2.43 4.86 2.85 1.15
OTHER SERVICES……………………………… 40132 40532 41232 41750 40884 41235 41427 41823 40922 41366 41654 42025 38855 40495 41324 41441% Chg Same Qtr Last Yr…………………… 5.62 5.21 3.91 4.16 1.87 1.74 0.47 0.18 0.09 0.32 0.55 0.48 4.37 4.22 2.05 0.28
GOVERNMENT…………………………………… 39702 40934 39273 39816 40570 41267 39178 39567 40240 40980 38955 39282 39475 39721 40208 39936% Chg Same Qtr Last Yr…………………… -0.23 -0.28 2.41 2.16 2.19 0.81 -0.24 -0.63 -0.81 -0.69 -0.57 -0.72 1.44 0.62 1.22 -0.68
FEDERAL, CIVILIAN………………………… 74425 75277 75296 77526 78600 76563 75545 77465 78409 76465 75530 77346 71511 74856 77059 76967% Chg Same Qtr Last Yr…………………… 4.59 4.06 3.73 4.16 5.61 1.71 0.33 -0.08 -0.24 -0.13 -0.02 -0.15 8.59 4.68 2.94 -0.12
STATE & LOCAL……………………………… 35290 36451 34762 35162 35858 36689 34682 34972 35608 36481 34532 34770 35381 35277 35598 35398% Chg Same Qtr Last Yr…………………… -1.06 -1.39 1.72 1.61 1.61 0.65 -0.23 -0.54 -0.70 -0.56 -0.43 -0.58 0.03 -0.29 0.91 -0.56
January 2016History Forecast Data Annual
Center for Business and Economic Research, University of Tennessee Tennessee Econometric Model

2016 TE
NN
ES
SE
E E
CO
NO
MIC
RE
PO
RT
| 1514 | 2016 T
EN
NE
SS
EE
EC
ON
OM
IC R
EP
OR
T
Forecast D
ata | AP
PE
ND
IX A
Table 12: Tennessee Average Annual Wage and Salary Rate by Sector, Seasonally Adjusted (2009 dollars)
2015:2 2015:3 2015:4 2016:1 2016:2 2016:3 2016:4 2017:1 2017:2 2017:3 2017:4 2018:1 2014 2015 2016 2017
TOTAL NONFARM………………………………… 43281 43269 43666 43973 44087 44059 44111 44274 44313 44347 44461 44544 41961 43161 44058 44349% Chg Prev Qtr SAAR………..…………… 8.28 -0.11 3.72 2.85 1.04 -0.26 0.48 1.48 0.35 0.30 1.04 0.75 1.18 2.86 2.08 0.66% Chg Same Qtr Last Yr………………… 3.50 3.46 3.10 3.64 1.86 1.82 1.02 0.68 0.51 0.65 0.79 0.61 1.18 2.86 2.08 0.66
NATURAL RESOURCES, MINING AND CONSTRUCTION……………………… 50063 51066 51367 51699 51808 51770 51811 52019 52100 52162 52326 52429 47214 49991 51772 52152
% Chg Prev Qtr SAAR………..…………… 23.73 8.26 2.38 2.61 0.85 -0.29 0.31 1.62 0.62 0.48 1.26 0.79 3.24 5.88 3.56 0.73% Chg Same Qtr Last Yr………………… 5.91 7.96 8.26 8.91 3.49 1.38 0.86 0.62 0.56 0.76 0.99 0.79 3.24 5.88 3.56 0.73
MANUFACTURING……………………………… 52672 53241 53900 54332 54501 54558 54689 54911 54956 55042 55240 55335 51603 52464 54520 55037% Chg Prev Qtr SAAR………..…………… 22.74 4.39 5.05 3.24 1.25 0.42 0.97 1.63 0.33 0.63 1.45 0.69 1.41 1.67 3.92 0.95% Chg Same Qtr Last Yr………………… 2.32 3.79 2.91 8.57 3.47 2.47 1.46 1.07 0.83 0.89 1.01 0.77 1.41 1.67 3.92 0.95
DURABLE GOODS……………………………51073 51311 51960 52259 52351 52389 52513 52711 52735 52843 53073 53164 50493 50844 52378 52841% Chg Prev Qtr SAAR………..…………… 17.69 1.88 5.16 2.32 0.71 0.29 0.95 1.52 0.18 0.82 1.75 0.69 2.00 0.70 3.02 0.88% Chg Same Qtr Last Yr………………… 1.13 2.23 0.95 6.58 2.50 2.10 1.06 0.87 0.73 0.87 1.07 0.86 2.00 0.70 3.02 0.88
NONDURABLE GOODS…………………… 55504 56665 57360 58047 58374 58489 58661 58943 59047 59117 59280 59405 53507 55333 58393 59097% Chg Prev Qtr SAAR………..…………… 31.76 8.63 5.00 4.88 2.27 0.79 1.18 1.93 0.71 0.47 1.11 0.84 0.60 3.41 5.53 1.21% Chg Same Qtr Last Yr………………… 4.43 6.53 6.31 12.05 5.17 3.22 2.27 1.54 1.15 1.07 1.05 0.78 0.60 3.41 5.53 1.21
TRADE, TRANSPORTATION, UTILITIES…… 39120 39083 39405 39737 39899 39903 39996 40196 40284 40357 40494 40624 38716 39037 39884 40333% Chg Prev Qtr SAAR………..…………… 6.17 -0.38 3.33 3.42 1.64 0.04 0.93 2.02 0.88 0.73 1.36 1.30 1.31 0.83 2.17 1.13% Chg Same Qtr Last Yr………………… 2.58 1.75 -1.11 3.11 1.99 2.10 1.50 1.16 0.96 1.14 1.24 1.06 1.31 0.83 2.17 1.13
WHOLESALE TRADE……………………… 59820 59333 59834 60397 60617 60670 60799 61067 61163 61238 61403 61602 59151 59353 60621 61218% Chg Prev Qtr SAAR………..…………… 9.88 -3.22 3.42 3.82 1.47 0.35 0.85 1.77 0.63 0.49 1.08 1.30 2.51 0.34 2.14 0.98% Chg Same Qtr Last Yr………………… 2.59 0.51 -0.83 3.37 1.33 2.25 1.61 1.11 0.90 0.94 0.99 0.88 2.51 0.34 2.14 0.98
RETAIL TRADE……………………………… 26636 26915 27124 27321 27427 27415 27481 27614 27677 27740 27827 27900 26483 26683 27411 27715% Chg Prev Qtr SAAR………..…………… 9.18 4.25 3.14 2.94 1.56 -0.19 0.97 1.95 0.93 0.91 1.26 1.05 1.36 0.76 2.73 1.11% Chg Same Qtr Last Yr………………… 2.51 3.04 -1.86 4.85 2.97 1.86 1.32 1.07 0.91 1.19 1.26 1.04 1.36 0.76 2.73 1.11
TRANSPORTATION & UTILITIES………… 48927 48343 48732 49128 49325 49293 49390 49645 49748 49827 50015 50156 48212 48721 49284 49809% Chg Prev Qtr SAAR………..…………… 0.36 -4.69 3.26 3.29 1.61 -0.26 0.79 2.08 0.83 0.64 1.52 1.13 0.28 1.06 1.16 1.06% Chg Same Qtr Last Yr………………… 2.44 0.96 -0.78 0.50 0.81 1.97 1.35 1.05 0.86 1.08 1.27 1.03 0.28 1.06 1.16 1.06
INFORMATION………………………………… 57039 58274 58842 59280 59440 59368 59426 59612 59725 59830 60039 60104 55910 57804 59378 59802% Chg Prev Qtr SAAR………..…………… -0.15 8.95 3.95 3.01 1.08 -0.49 0.39 1.26 0.76 0.71 1.41 0.43 3.38 3.39 2.72 0.71% Chg Same Qtr Last Yr………………… 0.68 3.28 9.75 3.89 4.21 1.88 0.99 0.56 0.48 0.78 1.03 0.82 3.38 3.39 2.72 0.71
FINANCIAL ACTIVITIES……………………… 64615 64863 65601 66209 66461 66466 66568 66879 66991 67030 67187 67314 63223 64642 66426 67022% Chg Prev Qtr SAAR………..…………… 7.28 1.54 4.63 3.76 1.54 0.03 0.62 1.88 0.67 0.23 0.94 0.75 2.66 2.24 2.76 0.90% Chg Same Qtr Last Yr………………… 3.05 3.59 2.35 4.28 2.86 2.47 1.47 1.01 0.80 0.85 0.93 0.65 2.66 2.24 2.76 0.90
January 2016
History Forecast Data Annual
(CONTINUED ON NEXT PAGE)

2016 TE
NN
ES
SE
E E
CO
NO
MIC
RE
PO
RT
| 1716 | 2016 T
EN
NE
SS
EE
EC
ON
OM
IC R
EP
OR
T
AP
PE
ND
IX A
| Forecast D
ata
Table 12: Tennessee Average Annual Wage and Salary Rate by Sector, Seasonally Adjusted (2009 dollars)
2015:2 2015:3 2015:4 2016:1 2016:2 2016:3 2016:4 2017:1 2017:2 2017:3 2017:4 2018:1 2014 2015 2016 2017
January 2016
History Forecast Data Annual
PROFESSIONAL & BUSINESS SERVICES… 51918 50530 50914 51258 51383 51350 51408 51587 51634 51666 51793 51897 47621 51066 51350 51670% Chg Prev Qtr SAAR………..…………… 8.22 -10.27 3.07 2.73 0.99 -0.26 0.46 1.40 0.36 0.25 0.99 0.80 -1.63 7.23 0.56 0.62% Chg Same Qtr Last Yr………………… 8.67 6.75 6.89 0.70 -1.03 1.62 0.97 0.64 0.49 0.62 0.75 0.60 -1.63 7.23 0.56 0.62
EDUCATION & HEALTH SERVICES………… 43698 44240 44580 44845 44936 44896 44946 45123 45144 45188 45309 45425 42809 44065 44906 45191% Chg Prev Qtr SAAR………..…………… -0.39 5.05 3.11 2.40 0.81 -0.35 0.44 1.59 0.18 0.39 1.07 1.03 0.58 2.93 1.91 0.63% Chg Same Qtr Last Yr………………… 2.34 3.30 4.28 2.53 2.83 1.48 0.82 0.62 0.46 0.65 0.81 0.67 0.58 2.93 1.91 0.63
LEISURE & HOSPITALITY…………………… 21606 21124 21423 21647 21740 21739 21794 21900 21951 21990 22074 22141 20158 21137 21730 21979% Chg Prev Qtr SAAR………..…………… 25.95 -8.63 5.79 4.25 1.72 -0.02 1.02 1.95 0.93 0.73 1.53 1.23 2.45 4.86 2.81 1.14% Chg Same Qtr Last Yr………………… 7.12 4.98 3.92 6.14 0.62 2.91 1.73 1.16 0.97 1.16 1.29 1.10 2.45 4.86 2.81 1.14
OTHER SERVICES………………………………40619 40596 41102 41325 41379 41300 41296 41398 41418 41431 41523 41598 38866 40498 41325 41442% Chg Prev Qtr SAAR………..…………… 9.86 -0.22 5.08 2.19 0.52 -0.76 -0.04 0.99 0.19 0.13 0.88 0.73 4.44 4.20 2.04 0.28% Chg Same Qtr Last Yr………………… 5.84 4.81 3.91 4.16 1.87 1.74 0.47 0.18 0.09 0.32 0.55 0.48 4.44 4.20 2.04 0.28
GOVERNMENT………………………………… 39444 39826 40161 40326 40306 40149 40064 40074 39979 39870 39836 39786 39409 39726 40211 39940% Chg Prev Qtr SAAR………..…………… -0.32 3.93 3.41 1.66 -0.20 -1.55 -0.85 0.10 -0.95 -1.08 -0.35 -0.50 1.33 0.81 1.22 -0.68% Chg Same Qtr Last Yr………………… -0.25 0.52 2.41 2.16 2.19 0.81 -0.24 -0.63 -0.81 -0.69 -0.57 -0.72 1.33 0.81 1.22 -0.68
FEDERAL, CIVILIAN………………………… 73296 75916 76920 77362 77409 77212 77175 77302 77220 77113 77159 77183 71860 75100 77290 77198% Chg Prev Qtr SAAR………..…………… -5.14 15.08 5.40 2.32 0.24 -1.01 -0.19 0.66 -0.42 -0.55 0.24 0.13 9.38 4.51 2.92 -0.12% Chg Same Qtr Last Yr………………… 1.95 6.05 3.73 4.16 5.61 1.71 0.33 -0.08 -0.24 -0.13 -0.02 -0.15 9.38 4.51 2.92 -0.12
STATE & LOCAL………………………………35100 35302 35553 35683 35665 35535 35471 35489 35416 35334 35317 35285 35292 35267 35588 35389% Chg Prev Qtr SAAR………..…………… -0.17 2.32 2.87 1.47 -0.20 -1.45 -0.72 0.21 -0.82 -0.92 -0.19 -0.36 -0.17 -0.07 0.91 -0.56% Chg Same Qtr Last Yr………………… -0.75 -0.74 1.72 1.62 1.61 0.66 -0.23 -0.54 -0.70 -0.57 -0.43 -0.57 -0.17 -0.07 0.91 -0.56
Tennessee Econometric ModelCenter for Business and Economic Research, University of Tennessee

2016 TE
NN
ES
SE
E E
CO
NO
MIC
RE
PO
RT
| 1716 | 2016 T
EN
NE
SS
EE
EC
ON
OM
IC R
EP
OR
T
Forecast D
ata | AP
PE
ND
IX A
Table 13: Tennessee Average Annual Wage and Salary Rate by Sector, Not Seasonally Adjusted (current dollars)
2015:2 2015:3 2015:4 2016:1 2016:2 2016:3 2016:4 2017:1 2017:2 2017:3 2017:4 2018:1 2014 2015 2016 2017
TOTAL NONFARM…………………………………… 47258 47577 47449 48672 48493 49021 48811 50063 49861 50400 50181 51446 45795 47212 48749 50126% Chg Same Qtr Last Yr…………………… 3.72 3.63 3.44 4.53 2.61 3.04 2.87 2.86 2.82 2.81 2.81 2.76 2.64 3.10 3.26 2.82
NATURAL RESOURCES, MINING AND CONSTRUCTION………………………… 54336 54664 55684 59009 56649 56081 57194 60652 58276 57720 58917 62434 51501 54603 57233 58891
% Chg Same Qtr Last Yr…………………… 6.02 8.12 8.61 9.83 4.26 2.59 2.71 2.78 2.87 2.92 3.01 2.94 4.67 6.02 4.82 2.90
MANUFACTURING…………………………………57637 58410 58969 59756 60083 60574 60926 61690 61977 62429 62766 63490 56304 57400 60335 62216% Chg Same Qtr Last Yr…………………… 2.59 4.10 3.23 9.48 4.24 3.70 3.32 3.24 3.15 3.06 3.02 2.92 2.85 1.95 5.11 3.12
DURABLE GOODS…………………………… 55845 56363 56848 57448 57672 58239 58501 59191 59432 60010 60302 60971 55093 55629 57965 59734% Chg Same Qtr Last Yr…………………… 1.40 2.55 1.26 7.46 3.27 3.33 2.91 3.03 3.05 3.04 3.08 3.01 3.45 0.97 4.20 3.05
NONDURABLE GOODS……………………… 60814 62028 62748 63898 64435 64792 65349 66278 66676 66895 67360 68219 58381 60536 64618 66802% Chg Same Qtr Last Yr…………………… 4.73 6.83 6.65 12.99 5.95 4.45 4.15 3.73 3.48 3.25 3.08 2.93 2.03 3.69 6.74 3.38
TRADE, TRANSPORTATION, UTILITIES……… 42806 42948 42621 44113 43982 44374 44053 45584 45427 45843 45493 47051 42276 42701 44131 45587% Chg Same Qtr Last Yr…………………… 2.53 1.91 -0.79 3.97 2.75 3.32 3.36 3.33 3.28 3.31 3.27 3.22 2.82 1.01 3.35 3.30
WHOLESALE TRADE………………………… 65334 64887 65518 66739 66696 67143 67795 68931 68842 69228 69837 71018 64560 64941 67093 69210% Chg Same Qtr Last Yr…………………… 2.93 0.60 -0.50 4.24 2.09 3.48 3.47 3.28 3.22 3.11 3.01 3.03 4.01 0.59 3.31 3.15
RETAIL TRADE………………………………… 29150 29612 29215 30436 30238 30523 30141 31424 31215 31549 31131 32426 28924 29191 30335 31330% Chg Same Qtr Last Yr…………………… 2.36 3.06 -1.54 5.72 3.73 3.07 3.17 3.25 3.23 3.36 3.28 3.19 2.87 0.92 3.92 3.28
TRANSPORTATION & UTILITIES…………… 53605 53198 52654 54342 54443 54892 54343 56095 56170 56678 56131 57881 52634 53269 54505 56268% Chg Same Qtr Last Yr…………………… 2.27 1.50 -0.46 1.34 1.56 3.18 3.21 3.23 3.17 3.25 3.29 3.18 1.76 1.21 2.32 3.24
INFORMATION…………………………………… 62253 64493 64342 64984 65355 66489 66171 66755 67177 68447 68191 68741 60978 63280 65750 67642% Chg Same Qtr Last Yr…………………… 0.86 4.12 10.10 4.76 4.98 3.09 2.84 2.72 2.79 2.94 3.05 2.97 4.79 3.78 3.90 2.88
FINANCIAL ACTIVITIES………………………… 70732 71046 71797 72908 73294 73672 74191 75231 75575 75893 76378 77334 69014 70727 73516 75769% Chg Same Qtr Last Yr…………………… 3.38 3.94 2.68 5.15 3.62 3.70 3.33 3.19 3.11 3.01 2.95 2.79 4.12 2.48 3.94 3.06
PROFESSIONAL & BUSINESS SERVICES…… 56903 55612 55023 56893 56735 57190 56576 58492 58321 58779 58139 60097 51997 55892 56849 58433% Chg Same Qtr Last Yr…………………… 9.14 6.88 7.24 1.54 -0.29 2.84 2.82 2.81 2.79 2.78 2.76 2.74 -0.15 7.49 1.71 2.79
EDUCATION & HEALTH SERVICES…………… 47868 48832 48464 49262 49589 50150 49757 50634 50963 51560 51161 52060 46687 48204 49690 51080% Chg Same Qtr Last Yr…………………… 2.57 3.67 4.62 3.38 3.60 2.70 2.67 2.78 2.77 2.81 2.82 2.81 1.98 3.25 3.08 2.80
LEISURE & HOSPITALITY……………………… 23069 22663 23718 24684 23385 23601 24571 25509 24154 24387 25384 26341 21996 23128 24060 24859% Chg Same Qtr Last Yr…………………… 7.48 5.55 4.25 7.03 1.37 4.14 3.59 3.34 3.29 3.33 3.31 3.26 3.89 5.15 4.03 3.32
OTHER SERVICES……………………………… 43901 44477 45222 45802 45055 45790 46269 46870 46133 46922 47452 48100 42393 44302 45729 46844% Chg Same Qtr Last Yr…………………… 5.89 5.49 4.25 5.03 2.63 2.95 2.32 2.33 2.39 2.47 2.56 2.62 5.86 4.50 3.22 2.44
GOVERNMENT…………………………………… 43431 44918 43074 43680 44710 45825 43757 44341 45365 46484 44377 44961 43071 43456 44493 45142% Chg Same Qtr Last Yr…………………… 0.02 -0.01 2.74 3.01 2.94 2.02 1.59 1.51 1.47 1.44 1.42 1.40 2.89 0.90 2.38 1.46
FEDERAL, CIVILIAN…………………………… 81414 82604 82582 85050 86620 85020 84374 86813 88394 86735 86042 88527 78025 81893 85266 86996% Chg Same Qtr Last Yr…………………… 4.85 4.33 4.07 5.04 6.39 2.92 2.17 2.07 2.05 2.02 1.98 1.97 10.14 4.96 4.12 2.03
STATE & LOCAL……………………………… 38604 39999 38126 38575 39517 40741 38735 39192 40142 41381 39338 39797 38604 38595 39392 40013% Chg Same Qtr Last Yr…………………… -0.81 -1.13 2.05 2.46 2.36 1.85 1.60 1.60 1.58 1.57 1.56 1.54 1.46 -0.03 2.07 1.58
Center for Business and Economic Research, University of Tennessee Tennessee Econometric Model
January 2016History Forecast Data Annual

2016 TE
NN
ES
SE
E E
CO
NO
MIC
RE
PO
RT
| 1918 | 2016 T
EN
NE
SS
EE
EC
ON
OM
IC R
EP
OR
T
AP
PE
ND
IX A
| Forecast D
ata
Table 14: Tennessee Average Annual Wage and Salary Rate by Sector, Seasonally Adjusted (current dollars)
2015:2 2015:3 2015:4 2016:1 2016:2 2016:3 2016:4 2017:1 2017:2 2017:3 2017:4 2018:1 2014 2015 2016 2017
TOTAL NONFARM……………………………………………….. 47346 47481 47891 48241 48586 48925 49266 49616 49956 50303 50649 50984 45782 47219 48755 50131% Chg Prev Qtr SAAR………..…………………………… 10.68 1.14 3.50 2.96 2.89 2.82 2.82 2.87 2.77 2.81 2.78 2.67 2.62 3.14 3.25 2.82% Chg Same Qtr Last Yr……………………………….. 3.76 3.73 3.44 4.51 2.62 3.04 2.87 2.85 2.82 2.82 2.81 2.76 2.62 3.14 3.25 2.82
NATURAL RESOURCES, MINING & CONSTRUCTION…… 54764 56036 56338 56717 57094 57489 57866 58296 58734 59169 59609 60009 51513 54695 57291 58952% Chg Prev Qtr SAAR………..…………………………… 26.46 9.62 2.17 2.72 2.69 2.79 2.65 3.01 3.04 2.99 3.01 2.71 4.71 6.18 4.75 2.90% Chg Same Qtr Last Yr……………………………….. 6.18 8.25 8.61 9.83 4.26 2.59 2.71 2.78 2.87 2.92 3.01 2.94 4.71 6.18 4.75 2.90
MANUFACTURING…………………………………………… 57619 58423 59116 59605 60062 60584 61081 61537 61954 62435 62929 63334 56302 57400 60333 62214% Chg Prev Qtr SAAR………..…………………………… 25.45 5.70 4.83 3.35 3.10 3.52 3.32 3.02 2.74 3.15 3.20 2.60 2.85 1.95 5.11 3.12% Chg Same Qtr Last Yr……………………………….. 2.58 4.07 3.24 9.48 4.24 3.70 3.32 3.24 3.15 3.06 3.03 2.92 2.85 1.95 5.11 3.12
DURABLE GOODS……………………………………...... 55869 56305 56988 57331 57693 58176 58650 59072 59451 59941 60460 60849 55092 55627 57962 59731% Chg Prev Qtr SAAR………..…………………………… 20.29 3.16 4.94 2.43 2.55 3.39 3.30 2.91 2.59 3.34 3.51 2.60 3.45 0.97 4.20 3.05% Chg Same Qtr Last Yr……………………………….. 1.39 2.50 1.28 7.47 3.26 3.32 2.92 3.04 3.05 3.03 3.09 3.01 3.45 0.97 4.20 3.05
NONDURABLE GOODS…………………………….. 60716 62180 62910 63681 64330 64949 65517 66055 66566 67057 67531 67993 58379 60542 64619 66803% Chg Prev Qtr SAAR………..…………………………… 34.67 10.00 4.78 4.99 4.14 3.91 3.54 3.33 3.13 2.98 2.86 2.76 2.03 3.71 6.73 3.38% Chg Same Qtr Last Yr……………………………….. 4.70 6.82 6.65 12.98 5.95 4.45 4.14 3.73 3.48 3.24 3.07 2.93 2.03 3.71 6.73 3.38
TRADE, TRANSPORTATION, UTILITIES…………. 42794 42887 43218 43594 43970 44311 44670 45047 45414 45778 46130 46497 42242 42707 44136 45592% Chg Prev Qtr SAAR………..…………………………… 8.51 0.87 3.12 3.53 3.50 3.13 3.28 3.42 3.30 3.24 3.11 3.22 2.75 1.10 3.35 3.30% Chg Same Qtr Last Yr……………………………….. 2.84 2.02 -0.79 3.97 2.75 3.32 3.36 3.33 3.28 3.31 3.27 3.22 2.75 1.10 3.35 3.30
WHOLESALE TRADE……………………………………. 65438 65107 65624 66259 66802 67371 67904 68436 68952 69463 69949 70508 64537 64934 67084 69200% Chg Prev Qtr SAAR………..…………………………… 12.31 -2.00 3.21 3.93 3.32 3.45 3.20 3.17 3.05 3.00 2.83 3.23 3.97 0.61 3.31 3.15% Chg Same Qtr Last Yr……………………………….. 2.85 0.78 -0.50 4.24 2.09 3.48 3.47 3.28 3.22 3.10 3.01 3.03 3.97 0.61 3.31 3.15
RETAIL TRADE……………………………………………. 29138 29534 29748 29973 30226 30443 30692 30946 31202 31466 31700 31933 28895 29193 30333 31329% Chg Prev Qtr SAAR………..…………………………… 11.59 5.56 2.93 3.05 3.42 2.90 3.32 3.35 3.35 3.43 3.01 2.97 2.80 1.03 3.91 3.28% Chg Same Qtr Last Yr……………………………….. 2.77 3.31 -1.54 5.72 3.73 3.07 3.17 3.25 3.23 3.36 3.28 3.19 2.80 1.03 3.91 3.28
TRANSPORTATION & UTILITIES……………………………53522 53048 53448 53897 54358 54738 55162 55636 56083 56519 56977 57407 52602 53300 54539 56304% Chg Prev Qtr SAAR………..…………………………… 2.58 -3.49 3.05 3.40 3.47 2.82 3.14 3.48 3.25 3.15 3.28 3.05 1.71 1.33 2.32 3.24% Chg Same Qtr Last Yr……………………………….. 2.70 1.23 -0.46 1.34 1.56 3.18 3.21 3.23 3.17 3.25 3.29 3.18 1.71 1.33 2.32 3.24
INFORMATION…………………………………………………… 62396 63946 64536 65034 65505 65925 66370 66806 67331 67866 68396 68793 60999 63239 65708 67600% Chg Prev Qtr SAAR………..…………………………… 2.06 10.31 3.74 3.12 2.93 2.59 2.73 2.65 3.18 3.22 3.16 2.34 4.85 3.67 3.90 2.88% Chg Same Qtr Last Yr……………………………….. 0.94 3.55 10.10 4.76 4.98 3.09 2.84 2.72 2.79 2.94 3.05 2.97 4.85 3.67 3.90 2.88
FINANCIAL ACTIVITIES…………………………………..... 70683 71177 71949 72635 73243 73807 74348 74950 75522 76033 76539 77045 68979 70721 73508 75761% Chg Prev Qtr SAAR………..…………………………… 9.65 2.82 4.41 3.87 3.39 3.12 2.96 3.28 3.09 2.73 2.69 2.67 4.12 2.52 3.94 3.06% Chg Same Qtr Last Yr……………………………….. 3.31 3.87 2.68 5.16 3.62 3.70 3.33 3.19 3.11 3.01 2.95 2.79 4.12 2.52 3.94 3.06
January 2016
History Forecast Data Annual
(CONTINUED ON NEXT PAGE)

2016 TE
NN
ES
SE
E E
CO
NO
MIC
RE
PO
RT
| 1918 | 2016 T
EN
NE
SS
EE
EC
ON
OM
IC R
EP
OR
T
Forecast D
ata | AP
PE
ND
IX A
Table 14: Tennessee Average Annual Wage and Salary Rate by Sector, Seasonally Adjusted (current dollars)
2015:2 2015:3 2015:4 2016:1 2016:2 2016:3 2016:4 2017:1 2017:2 2017:3 2017:4 2018:1 2014 2015 2016 2017
January 2016
History Forecast Data Annual
PROFESSIONAL & BUSINESS SERVICES………………… 56794 55448 55840 56232 56626 57021 57416 57813 58209 58605 59002 59400 51957 55865 56824 58407% Chg Prev Qtr SAAR………..…………………………… 10.61 -9.15 2.86 2.84 2.83 2.82 2.80 2.79 2.77 2.75 2.74 2.72 -0.22 7.52 1.72 2.79% Chg Same Qtr Last Yr……………………………….. 8.94 7.04 7.24 1.54 -0.29 2.84 2.82 2.81 2.79 2.78 2.76 2.75 -0.22 7.52 1.72 2.79
EDUCATION & HEALTH SERVICES……………………….. 47802 48546 48894 49198 49521 49855 50198 50568 50892 51257 51615 51992 46707 48207 49693 51083% Chg Prev Qtr SAAR………..…………………………… 1.81 6.37 2.90 2.51 2.65 2.73 2.78 2.98 2.59 2.90 2.82 2.95 2.02 3.21 3.08 2.80% Chg Same Qtr Last Yr……………………………….. 2.59 3.57 4.62 3.38 3.60 2.70 2.67 2.78 2.77 2.81 2.82 2.81 2.02 3.21 3.08 2.80
LEISURE & HOSPITALITY……………………………………. 23635 23180 23496 23749 23958 24140 24341 24542 24746 24944 25147 25342 21995 23125 24047 24845% Chg Prev Qtr SAAR………..…………………………… 28.74 -7.48 5.57 4.36 3.58 3.07 3.37 3.35 3.36 3.24 3.29 3.15 3.92 5.14 3.99 3.32% Chg Same Qtr Last Yr……………………………….. 7.39 5.26 4.25 7.03 1.37 4.14 3.59 3.34 3.29 3.33 3.31 3.26 3.92 5.14 3.99 3.32
OTHER SERVICES………………………………………….... 44433 44547 45079 45336 45601 45862 46122 46393 46692 46996 47302 47611 42406 44306 45730 46846% Chg Prev Qtr SAAR………..…………………………… 12.29 1.03 4.86 2.30 2.36 2.31 2.29 2.37 2.60 2.63 2.63 2.64 5.92 4.48 3.22 2.44% Chg Same Qtr Last Yr……………………………….. 6.10 5.09 4.25 5.03 2.63 2.95 2.31 2.33 2.39 2.47 2.56 2.63 5.92 4.48 3.22 2.44
GOVERNMENT……………………………………………….... 43148 43702 44047 44240 44419 44584 44746 44910 45070 45226 45380 45538 42997 43461 44497 45146% Chg Prev Qtr SAAR………..…………………………… 1.89 5.23 3.20 1.76 1.62 1.49 1.46 1.47 1.43 1.39 1.38 1.39 2.78 1.08 2.38 1.46% Chg Same Qtr Last Yr……………………………….. 0.00 0.79 2.74 3.01 2.94 2.02 1.59 1.51 1.47 1.44 1.42 1.40 2.78 1.08 2.38 1.46
FEDERAL, CIVILIAN……………………………………….. 80179 83305 84363 84871 85307 85741 86194 86630 87053 87470 87898 88341 78407 82162 85528 87263% Chg Prev Qtr SAAR………..…………………………… -3.04 16.53 5.18 2.43 2.07 2.05 2.13 2.04 1.97 1.93 1.97 2.03 10.94 4.79 4.10 2.03% Chg Same Qtr Last Yr……………………………….. 2.21 6.33 4.07 5.04 6.39 2.92 2.17 2.07 2.05 2.02 1.98 1.97 10.94 4.79 4.10 2.03
STATE & LOCAL………………………………………….... 38396 38738 38993 39146 39304 39460 39616 39771 39926 40079 40233 40386 38505 38582 39381 40002% Chg Prev Qtr SAAR………..…………………………… 2.03 3.61 2.66 1.58 1.62 1.60 1.59 1.58 1.56 1.55 1.54 1.53 1.25 0.20 2.07 1.58% Chg Same Qtr Last Yr……………………………….. -0.50 -0.48 2.05 2.47 2.36 1.86 1.60 1.60 1.58 1.57 1.56 1.55 1.25 0.20 2.07 1.58
Tennessee Econometric ModelCenter for Business and Economic Research, University of Tennessee

2016 TE
NN
ES
SE
E E
CO
NO
MIC
RE
PO
RT
| 2120 | 2016 T
EN
NE
SS
EE
EC
ON
OM
IC R
EP
OR
T
AP
PE
ND
IX A
| Forecast D
ata
Table 15: Tennessee Civilian Labor Force and Unemployment Rate, Not Seasonally Adjusted
2015:3 2015:4 2016:1 2016:2 2016:3 2016:4 2017:1 2017:2 2017:3 2017:4 2018:1 2014 2015 2016 2017
CIVILIAN LABOR FORCE (THOUS)……………… 3066 3064 3042 3068 3069 3067 3057 3087 3089 3090 3081 3011 3065 3062 3081% Chg Same Qtr Last Yr…………………… 1.61 2.47 0.62 -1.21 0.09 0.13 0.50 0.62 0.67 0.74 0.77 -2.27 1.76 -0.10 0.63
EMPLOYED PERSONS (THOUS)…………… 2883 2899 2875 2899 2891 2905 2892 2921 2915 2930 2918 2811 2884 2893 2915% Chg Same Qtr Last Yr…………………… 2.78 3.45 1.61 -0.93 0.28 0.21 0.62 0.76 0.82 0.87 0.89 -1.10 2.62 0.28 0.77
UNEMPLOYED PERSONS (THOUS)………… 183 164 168 169 177 162 165 165 174 160 163 201 180 169 166% Chg Same Qtr Last Yr…………………… -13.89 -12.10 -13.83 -5.73 -2.88 -1.24 -1.58 -1.88 -1.80 -1.60 -1.33 -16.17 -10.21 -6.17 -1.72
PARTICIPATION RATE (PERCENT)…………… 57.7 57.5 56.9 57.2 57.1 56.9 56.5 56.9 56.8 56.7 56.4 57.4 57.7 57.0 56.7% Chg Same Qtr Last Yr…………………… 0.41 1.26 -0.56 -2.36 -1.06 -1.02 -0.64 -0.51 -0.44 -0.37 -0.32 -3.43 0.55 -1.26 -0.49
UNEMPLOYMENT RATE (PERCENT)…………… 6.0 5.4 5.5 5.5 5.8 5.3 5.4 5.4 5.6 5.2 5.3 6.7 5.9 5.5 5.4
Center for Business and Economic Research, University of Tennessee
History
Tennessee Econometric Model
January 2016
Annual

2016 TE
NN
ES
SE
E E
CO
NO
MIC
RE
PO
RT
| 2120 | 2016 T
EN
NE
SS
EE
EC
ON
OM
IC R
EP
OR
T
Forecast D
ata | AP
PE
ND
IX A
Table 16: Tennessee Civilian Labor Force and Unemployment Rate, Seasonally Adjusted
2015:3 2015:4 2016:1 2016:2 2016:3 2016:4 2017:1 2017:2 2017:3 2017:4 2018:1 2014 2015 2016 2017
CIVILIAN LABOR FORCE (THOUS)………… 3058 3062 3056 3058 3061 3065 3071 3077 3082 3088 3094 2993 3063 3060 3079% Chg Prev Qtr SAAR………………… -4.74 0.42 -0.79 0.35 0.43 0.52 0.69 0.83 0.67 0.73 0.85 -1.97 2.33 -0.10 0.63% Chg Same Qtr Last Yr……………… 2.39 2.63 0.61 -1.21 0.10 0.12 0.49 0.62 0.68 0.73 0.77 -1.97 2.33 -0.10 0.63
EMPLOYED PERSONS (THOUS)………… 2884 2891 2885 2888 2892 2897 2903 2910 2916 2922 2929 2797 2882 2890 2913% Chg Prev Qtr SAAR………………… -4.22 0.97 -0.80 0.42 0.56 0.66 0.83 1.00 0.80 0.83 0.94 -0.84 3.05 0.28 0.77% Chg Same Qtr Last Yr……………… 3.40 3.75 1.61 -0.93 0.28 0.21 0.62 0.76 0.82 0.87 0.89 -0.84 3.05 0.28 0.77
UNEMPLOYED PERSONS (THOUS)…… 174 171 171 170 169 169 168 167 166 166 166 197 181 170 167% Chg Prev Qtr SAAR………………… -12.79 -8.29 -0.48 -0.80 -1.75 -1.93 -1.85 -2.00 -1.44 -1.11 -0.76 -15.69 -7.97 -6.20 -1.72% Chg Same Qtr Last Yr……………… -11.83 -13.30 -13.83 -5.73 -2.88 -1.24 -1.58 -1.88 -1.80 -1.60 -1.33 -15.69 -7.97 -6.20 -1.72
PARTICIPATION RATE (PERCENT)………… 57.5 57.4 57.1 57.0 56.9 56.8 56.8 56.7 56.7 56.6 56.6 57.1 57.7 57.0 56.7% Chg Prev Qtr SAAR………………… -5.87 -0.77 -1.92 -0.80 -0.72 -0.63 -0.42 -0.27 -0.43 -0.37 -0.23 -3.13 1.12 -1.26 -0.49% Chg Same Qtr Last Yr……………… 1.18 1.41 -0.58 -2.36 -1.05 -1.02 -0.64 -0.51 -0.44 -0.37 -0.32 -3.13 1.12 -1.26 -0.49
UNEMPLOYMENT RATE (PERCENT)……… 5.7 5.6 5.6 5.6 5.5 5.5 5.5 5.4 5.4 5.4 5.4 6.6 5.9 5.5 5.4
Center for Business and Economic Research, University of Tennessee
AnnualHistory
Tennessee Econometric Model
Forecast Data

2016 TE
NN
ES
SE
E E
CO
NO
MIC
RE
PO
RT
| 2322 | 2016 T
EN
NE
SS
EE
EC
ON
OM
IC R
EP
OR
T
AP
PE
ND
IX A
| Forecast D
ata
Table 17: Tennessee Taxable Sales, Not Seasonally Adjusted (millions of 2009 dollars)
2015:2 2015:3 2015:4 2016:1 2016:2 2016:3 2016:4 2017:1 2017:2 2017:3 2017:4 2018:1 2014 2015 2016 2017
TOTAL TAXABLE SALES………………………… 26057 25942 27861 24740 27009 26344 28236 25119 27313 26657 28680 25526 97118 102863 106329 107769% Chg Same Qtr Last Yr…………………… 7.72 7.27 5.41 7.55 3.65 1.55 1.35 1.53 1.13 1.19 1.57 1.62 3.48 5.92 3.37 1.35
AUTO DEALERS………………………………… 2750 2870 2592 2717 2865 2953 2650 2805 2855 2925 2690 2900 9683 10748 11185 11275% Chg Same Qtr Last Yr…………………… 13.37 12.91 9.16 7.13 4.20 2.88 2.22 3.26 -0.36 -0.94 1.52 3.39 5.90 11.00 4.06 0.81
PURCHASES FROM MANUFACTURERS…. 1100 1136 1311 957 1164 1149 1319 965 1180 1166 1341 981 4109 4431 4590 4652% Chg Same Qtr Last Yr…………………… 9.19 9.67 5.12 8.26 5.90 1.17 0.58 0.82 1.36 1.46 1.66 1.66 5.64 7.84 3.58 1.36
MISC DURABLE GOODS……………………… 4547 4346 4478 3909 4688 4416 4527 3961 4750 4486 4606 4026 16103 16903 17540 17803% Chg Same Qtr Last Yr…………………… 7.15 5.49 5.83 10.67 3.10 1.61 1.11 1.33 1.31 1.60 1.73 1.64 3.01 4.97 3.77 1.49
EATING AND DRINKING PLACES…………… 2833 2808 2768 2713 2918 2859 2812 2761 2967 2912 2870 2814 10260 10961 11301 11510% Chg Same Qtr Last Yr…………………… 8.68 7.36 6.00 6.30 2.98 1.80 1.59 1.80 1.69 1.85 2.07 1.92 4.35 6.84 3.10 1.85
FOOD STORES………………………………… 2420 2457 2673 2370 2482 2480 2693 2380 2490 2489 2706 2388 9490 9861 10024 10065% Chg Same Qtr Last Yr…………………… 3.91 3.83 3.44 2.57 2.54 0.94 0.73 0.41 0.36 0.36 0.51 0.33 1.29 3.91 1.66 0.41
LIQUOR STORES……………………………… 211 210 262 211 219 214 266 213 222 218 271 218 821 883 909 925% Chg Same Qtr Last Yr…………………… 9.22 8.12 6.18 5.50 3.57 1.90 1.36 1.39 1.52 1.71 2.07 2.01 5.48 7.62 2.95 1.69
HOTELS AND MOTELS………………………… 801 832 757 636 827 827 765 661 859 860 795 685 2647 2965 3055 3174% Chg Same Qtr Last Yr…………………… 12.38 13.97 12.88 10.66 3.20 -0.63 1.07 3.84 3.94 3.95 3.92 3.74 12.27 12.00 3.03 3.92
OTHER RETAIL AND SERVICE……………… 7789 7708 8946 7635 8122 7829 9121 7766 8254 7969 9290 7894 29923 31457 32707 33279% Chg Same Qtr Last Yr…………………… 6.24 8.01 4.73 8.86 4.27 1.56 1.96 1.71 1.63 1.79 1.86 1.65 3.84 5.13 3.97 1.75
MISC NONDURABLE GOODS………………… 2134 2098 2518 2102 2236 2146 2555 2130 2265 2178 2597 2160 8297 8665 9040 9170% Chg Same Qtr Last Yr…………………… 4.37 5.75 5.83 9.74 4.80 2.31 1.47 1.29 1.29 1.50 1.65 1.44 2.66 4.44 4.32 1.44
TRANSPORTATION, COMMUNICATION…… 1472 1476 1556 1491 1488 1471 1529 1477 1471 1454 1513 1460 5786 5989 5978 5915% Chg Same Qtr Last Yr…………………… 13.65 1.21 0.80 0.36 1.10 -0.33 -1.75 -0.93 -1.17 -1.11 -1.01 -1.17 -2.78 3.51 -0.17 -1.05
PER CAPITA ($)…………………………………… 3914 3887 4164 3688 4016 3907 4177 3706 4020 3913 4199 3728 14721 15429 15786 15838% Chg Same Qtr Last Yr…………………… 6.60 6.16 4.32 6.44 2.58 0.51 0.31 0.50 0.10 0.17 0.55 0.60 2.39 4.81 2.31 0.33
Center for Business and Economic Research, University of Tennessee
January 2016
History Forecast Data Annual
Tennessee Econometric Model

2016 TE
NN
ES
SE
E E
CO
NO
MIC
RE
PO
RT
| 2322 | 2016 T
EN
NE
SS
EE
EC
ON
OM
IC R
EP
OR
T
Forecast D
ata | AP
PE
ND
IX A
Table 18: Tennessee Taxable Sales, Seasonally Adjusted (millions of 2009 dollars)
2015:2 2015:3 2015:4 2016:1 2016:2 2016:3 2016:4 2017:1 2017:2 2017:3 2017:4 2018:1 2014 2015 2016 2017
TOTAL TAXABLE SALES………………………… 25642 26228 26353 26392 26580 26635 26708 26795 26878 26954 27127 27230 97036 102746 106315 107755% Chg Prev Qtr SAAR………..…………… 19.55 9.46 1.91 0.59 2.88 0.83 1.10 1.31 1.24 1.14 2.59 1.52 3.41 5.88 3.47 1.35% Chg Same Qtr Last Yr…………………… 7.71 7.21 5.48 7.62 3.66 1.55 1.35 1.53 1.12 1.20 1.57 1.62 3.41 5.88 3.47 1.35
AUTO DEALERS………………………………… 2697 2754 2774 2706 2810 2833 2836 2794 2800 2806 2879 2889 9689 10751 11185 11279% Chg Prev Qtr SAAR………..…………… 29.95 8.67 3.02 -9.45 16.28 3.28 0.39 -5.71 0.84 0.89 10.74 1.43 5.98 10.95 4.04 0.85% Chg Same Qtr Last Yr…………………… 13.53 12.79 9.16 7.13 4.20 2.88 2.22 3.26 -0.36 -0.94 1.52 3.39 5.98 10.95 4.04 0.85
PURCHASES FROM MANUFACTURERS…. 1081 1135 1144 1147 1145 1148 1151 1156 1161 1165 1170 1176 4089 4420 4591 4652% Chg Prev Qtr SAAR………..…………… 8.58 21.27 3.23 1.06 -0.61 1.03 0.86 2.02 1.55 1.41 1.68 2.02 5.42 8.09 3.87 1.33% Chg Same Qtr Last Yr…………………… 9.28 9.81 5.12 8.26 5.90 1.17 0.58 0.82 1.36 1.46 1.66 1.66 5.42 8.09 3.87 1.33
MISC DURABLE GOODS……………………… 4252 4317 4352 4366 4384 4386 4400 4424 4442 4456 4476 4497 16089 16866 17537 17799% Chg Prev Qtr SAAR………..…………… 34.98 6.21 3.30 1.30 1.66 0.18 1.31 2.18 1.58 1.32 1.83 1.81 2.96 4.83 3.98 1.49% Chg Same Qtr Last Yr…………………… 7.15 5.44 5.83 10.67 3.10 1.61 1.11 1.33 1.31 1.60 1.73 1.64 2.96 4.83 3.98 1.49
EATING AND DRINKING PLACES…………… 2741 2779 2796 2808 2823 2829 2841 2859 2870 2882 2899 2914 10259 10958 11301 11510% Chg Prev Qtr SAAR………..…………… 15.86 5.72 2.46 1.73 2.06 0.97 1.61 2.56 1.62 1.59 2.51 1.96 4.35 6.81 3.13 1.85% Chg Same Qtr Last Yr…………………… 8.64 7.36 6.00 6.30 2.98 1.80 1.59 1.80 1.69 1.85 2.07 1.92 4.35 6.81 3.13 1.85
FOOD STORES………………………………… 2445 2483 2489 2503 2507 2507 2507 2513 2516 2516 2520 2522 9487 9858 10024 10065% Chg Prev Qtr SAAR………..…………… 0.82 6.40 0.91 2.24 0.70 -0.09 0.08 0.97 0.48 -0.08 0.67 0.26 1.21 3.91 1.69 0.41% Chg Same Qtr Last Yr…………………… 3.95 3.83 3.44 2.57 2.54 0.94 0.73 0.41 0.36 0.36 0.51 0.33 1.21 3.91 1.69 0.41
LIQUOR STORES……………………………… 219 223 225 226 227 228 228 230 230 231 233 234 819 882 909 924% Chg Prev Qtr SAAR………..…………… 8.75 7.79 3.42 2.17 1.04 1.00 1.24 2.30 1.53 1.76 2.70 2.07 5.36 7.69 3.05 1.67% Chg Same Qtr Last Yr…………………… 9.31 8.05 6.18 5.50 3.57 1.90 1.36 1.39 1.52 1.71 2.07 2.01 5.36 7.69 3.05 1.67
HOTELS AND MOTELS………………………… 737 771 765 753 760 766 773 782 790 796 803 812 2642 2953 3053 3172% Chg Prev Qtr SAAR………..…………… 37.30 19.59 -2.95 -5.90 3.85 2.81 3.86 4.85 4.26 2.84 3.75 4.11 11.91 11.78 3.37 3.91% Chg Same Qtr Last Yr…………………… 12.32 13.88 12.88 10.66 3.20 -0.63 1.07 3.84 3.94 3.95 3.92 3.74 11.91 11.78 3.37 3.91
OTHER RETAIL AND SERVICE……………… 7832 8060 8058 8130 8166 8186 8216 8269 8299 8332 8369 8406 29891 31419 32699 33270% Chg Prev Qtr SAAR………..…………… 20.96 12.16 -0.10 3.62 1.79 0.97 1.49 2.61 1.45 1.60 1.76 1.78 3.72 5.11 4.07 1.75% Chg Same Qtr Last Yr…………………… 6.23 7.99 4.73 8.86 4.27 1.56 1.96 1.71 1.63 1.79 1.86 1.65 3.72 5.11 4.07 1.75
MISC NONDURABLE GOODS………………… 2155 2209 2235 2251 2258 2260 2268 2280 2287 2294 2305 2313 8289 8650 9037 9167% Chg Prev Qtr SAAR………..…………… 21.73 10.46 4.79 2.92 1.24 0.36 1.36 2.23 1.22 1.19 1.95 1.41 2.57 4.36 4.47 1.43% Chg Same Qtr Last Yr…………………… 4.36 5.70 5.83 9.74 4.80 2.31 1.47 1.29 1.29 1.50 1.65 1.44 2.57 4.36 4.47 1.43
TRANSPORTATION, COMMUNICATION…… 1483 1497 1514 1501 1499 1492 1488 1487 1481 1476 1473 1469 5782 5989 5980 5917% Chg Prev Qtr SAAR………..…………… -3.32 4.06 4.60 -3.60 -0.42 -1.72 -1.22 -0.34 -1.40 -1.50 -0.79 -0.99 -2.77 3.59 -0.16 -1.05% Chg Same Qtr Last Yr…………………… 13.72 1.26 0.80 0.36 1.10 -0.33 -1.75 -0.93 -1.17 -1.11 -1.01 -1.17 -2.77 3.59 -0.16 -1.05
PER CAPITA ($)…………………………………… 3852 3930 3938 3934 3952 3950 3951 3953 3956 3957 3972 3977 14710 15414 15786 15838% Chg Prev Qtr SAAR………..…………… 18.31 8.33 0.86 -0.44 1.83 -0.20 0.07 0.29 0.22 0.13 1.56 0.51 2.32 4.78 2.42 0.33% Chg Same Qtr Last Yr…………………… 6.59 6.09 4.38 6.51 2.59 0.51 0.31 0.49 0.09 0.17 0.55 0.60 2.32 4.78 2.42 0.33
Center for Business and Economic Research, University of Tennessee
January 2016
History Forecast Data Annual
Tennessee Econometric Model

2016 TE
NN
ES
SE
E E
CO
NO
MIC
RE
PO
RT
| 2524 | 2016 T
EN
NE
SS
EE
EC
ON
OM
IC R
EP
OR
T
AP
PE
ND
IX A
| Forecast D
ata
Table 19: Tennessee Taxable Sales, Not Seasonally Adjusted (millions of current dollars)
2015:2 2015:3 2015:4 2016:1 2016:2 2016:3 2016:4 2017:1 2017:2 2017:3 2017:4 2018:1 2014 2015 2016 2017
TOTAL TAXABLE SALES………………………… 28505 28466 30557 27142 29764 29253 31536 28150 30792 30237 32671 29216 105976 112554 117695 121850% Chg Same Qtr Last Yr…………………… 7.99 7.56 5.75 8.45 4.42 2.76 3.20 3.72 3.45 3.36 3.60 3.79 4.96 6.21 4.57 3.53
AUTO DEALERS………………………………… 3008 3150 2843 2980 3158 3279 2959 3144 3219 3318 3064 3320 10565 11760 12376 12745% Chg Same Qtr Last Yr…………………… 13.65 13.21 9.51 8.03 4.97 4.11 4.09 5.48 1.93 1.19 3.55 5.60 7.42 11.31 5.24 2.98
PURCHASES FROM MANUFACTURERS…. 1203 1246 1438 1050 1283 1276 1473 1081 1331 1322 1528 1123 4484 4849 5082 5262% Chg Same Qtr Last Yr…………………… 9.46 9.96 5.46 9.17 6.68 2.38 2.43 2.99 3.69 3.64 3.70 3.83 7.15 8.14 4.81 3.54
MISC DURABLE GOODS……………………… 4974 4769 4911 4288 5167 4904 5057 4439 5355 5089 5247 4608 17572 18497 19415 20129% Chg Same Qtr Last Yr…………………… 7.42 5.77 6.17 11.60 3.87 2.82 2.97 3.51 3.64 3.78 3.76 3.80 4.49 5.26 4.96 3.68
EATING AND DRINKING PLACES…………… 3099 3082 3036 2976 3215 3175 3141 3095 3345 3303 3270 3221 11195 11993 12507 13012% Chg Same Qtr Last Yr…………………… 8.95 7.65 6.34 7.19 3.74 3.02 3.45 3.99 4.02 4.03 4.11 4.09 5.84 7.13 4.28 4.04
FOOD STORES………………………………… 2647 2696 2932 2600 2735 2754 3007 2667 2808 2823 3083 2733 10356 10789 11096 11381% Chg Same Qtr Last Yr…………………… 4.17 4.11 3.78 3.43 3.30 2.15 2.57 2.58 2.66 2.51 2.51 2.47 2.74 4.19 2.84 2.57
LIQUOR STORES……………………………… 231 231 287 231 241 238 297 239 250 247 309 249 896 967 1007 1046% Chg Same Qtr Last Yr…………………… 9.49 8.41 6.53 6.38 4.34 3.12 3.22 3.58 3.85 3.89 4.11 4.19 6.97 7.92 4.17 3.87
HOTELS AND MOTELS………………………… 876 913 830 698 911 918 854 740 969 975 905 785 2889 3245 3381 3589% Chg Same Qtr Last Yr…………………… 12.66 14.28 13.25 11.59 3.97 0.56 2.92 6.08 6.33 6.18 6.00 5.95 13.90 12.31 4.21 6.15
OTHER RETAIL AND SERVICE……………… 8521 8459 9811 8376 8950 8693 10187 8703 9305 9039 10583 9035 32652 34421 36207 37631% Chg Same Qtr Last Yr…………………… 6.51 8.30 5.07 9.77 5.04 2.78 3.83 3.90 3.96 3.97 3.89 3.81 5.31 5.42 5.19 3.93
MISC NONDURABLE GOODS………………… 2334 2302 2762 2306 2464 2383 2853 2386 2554 2471 2958 2473 9053 9482 10007 10369% Chg Same Qtr Last Yr…………………… 4.63 6.03 6.17 10.66 5.57 3.54 3.32 3.47 3.61 3.68 3.68 3.60 4.12 4.73 5.54 3.62
TRANSPORTATION, COMMUNICATION…… 1610 1619 1707 1635 1640 1633 1707 1655 1658 1650 1724 1671 6313 6552 6616 6687% Chg Same Qtr Last Yr…………………… 13.94 1.48 1.13 1.20 1.85 0.86 0.05 1.21 1.10 1.01 0.97 0.94 -1.39 3.79 0.98 1.07
PER CAPITA ($)…………………………………… 4282 4265 4566 4046 4425 4338 4665 4153 4532 4439 4784 4267 16063 16883 17474 17907% Chg Same Qtr Last Yr…………………… 6.87 6.44 4.66 7.33 3.35 1.71 2.15 2.66 2.40 2.32 2.56 2.75 3.85 5.10 3.50 2.48
Center for Business and Economic Research, University of Tennessee
January 2016
History Forecast Data Annual
Tennessee Econometric Model

2016 TE
NN
ES
SE
E E
CO
NO
MIC
RE
PO
RT
| 2524 | 2016 T
EN
NE
SS
EE
EC
ON
OM
IC R
EP
OR
T
Forecast D
ata | AP
PE
ND
IX A
Table 20: Tennessee Taxable Sales, Seasonally Adjusted (millions of current dollars)
2015:2 2015:3 2015:4 2016:1 2016:2 2016:3 2016:4 2017:1 2017:2 2017:3 2017:4 2018:1 2014 2015 2016 2017
TOTAL TAXABLE SALES………………………… 28050 28781 28903 28953 29292 29577 29829 30028 30301 30575 30903 31167 105877 112414 117652 121807% Chg Prev Qtr SAAR………..…………… 22.19 10.84 1.70 0.70 4.76 3.95 3.45 2.70 3.67 3.67 4.37 3.45 4.89 6.17 4.66 3.53% Chg Same Qtr Last Yr…………………… 7.98 7.49 5.82 8.52 4.43 2.77 3.20 3.71 3.44 3.37 3.60 3.79 4.89 6.17 4.66 3.53
AUTO DEALERS………………………………… 2950 3022 3043 2969 3097 3146 3167 3131 3157 3183 3279 3307 10572 11762 12378 12751% Chg Prev Qtr SAAR………..…………… 32.82 10.03 2.81 -9.35 18.40 6.47 2.73 -4.42 3.26 3.40 12.65 3.36 7.49 11.26 5.24 3.01% Chg Same Qtr Last Yr…………………… 13.82 13.09 9.51 8.03 4.97 4.11 4.09 5.48 1.93 1.19 3.55 5.60 7.49 11.26 5.24 3.01
PURCHASES FROM MANUFACTURERS…. 1183 1245 1255 1258 1262 1275 1285 1296 1309 1321 1333 1346 4461 4836 5080 5258% Chg Prev Qtr SAAR………..…………… 10.98 22.79 3.02 1.17 1.21 4.15 3.21 3.42 3.99 3.94 3.44 3.96 6.93 8.39 5.06 3.51% Chg Same Qtr Last Yr…………………… 9.55 10.10 5.46 9.17 6.68 2.38 2.43 2.99 3.69 3.64 3.70 3.83 6.93 8.39 5.06 3.51
MISC DURABLE GOODS……………………… 4652 4737 4773 4790 4832 4871 4915 4958 5007 5055 5100 5147 17555 18454 19407 20120% Chg Prev Qtr SAAR………..…………… 37.96 7.54 3.09 1.41 3.52 3.28 3.67 3.58 4.02 3.85 3.59 3.75 4.44 5.12 5.16 3.67% Chg Same Qtr Last Yr…………………… 7.42 5.72 6.17 11.60 3.87 2.82 2.97 3.51 3.64 3.78 3.76 3.80 4.44 5.12 5.16 3.67
EATING AND DRINKING PLACES…………… 2998 3050 3067 3081 3111 3142 3173 3204 3236 3269 3303 3335 11194 11989 12506 13011% Chg Prev Qtr SAAR………..…………… 18.42 7.05 2.25 1.84 3.92 4.09 3.98 3.97 4.06 4.13 4.28 3.90 5.84 7.10 4.31 4.04% Chg Same Qtr Last Yr…………………… 8.92 7.65 6.34 7.19 3.74 3.02 3.45 3.99 4.02 4.03 4.11 4.09 5.84 7.10 4.31 4.04
FOOD STORES………………………………… 2675 2725 2730 2746 2763 2784 2800 2817 2837 2854 2871 2886 10351 10785 11093 11377% Chg Prev Qtr SAAR………..…………… 3.05 7.74 0.71 2.35 2.54 3.00 2.41 2.35 2.89 2.41 2.41 2.16 2.66 4.19 2.86 2.57% Chg Same Qtr Last Yr…………………… 4.21 4.11 3.78 3.43 3.30 2.15 2.57 2.58 2.66 2.52 2.51 2.47 2.66 4.19 2.86 2.57
LIQUOR STORES……………………………… 240 245 247 248 250 253 255 257 260 262 265 268 894 965 1006 1045% Chg Prev Qtr SAAR………..…………… 11.15 9.14 3.21 2.28 2.89 4.12 3.60 3.70 3.97 4.30 4.48 4.01 6.86 7.98 4.24 3.86% Chg Same Qtr Last Yr…………………… 9.58 8.34 6.53 6.38 4.34 3.12 3.22 3.58 3.85 3.89 4.11 4.19 6.86 7.98 4.24 3.86
HOTELS AND MOTELS………………………… 806 846 839 826 838 850 863 877 891 903 915 929 2883 3231 3378 3586% Chg Prev Qtr SAAR………..…………… 40.33 21.10 -3.15 -5.80 5.75 5.99 6.28 6.29 6.76 5.41 5.55 6.09 13.51 12.09 4.55 6.15% Chg Same Qtr Last Yr…………………… 12.60 14.18 13.25 11.59 3.97 0.56 2.92 6.08 6.33 6.18 6.00 5.95 13.51 12.09 4.55 6.15
OTHER RETAIL AND SERVICE……………… 8568 8845 8838 8919 9000 9090 9176 9267 9356 9452 9534 9621 32614 34376 36186 37609% Chg Prev Qtr SAAR………..…………… 23.64 13.57 -0.30 3.73 3.65 4.09 3.85 4.02 3.89 4.14 3.52 3.71 5.20 5.40 5.27 3.93% Chg Same Qtr Last Yr…………………… 6.49 8.28 5.07 9.77 5.04 2.78 3.83 3.90 3.96 3.97 3.89 3.81 5.20 5.40 5.27 3.93
MISC NONDURABLE GOODS………………… 2357 2424 2451 2470 2489 2510 2533 2556 2579 2602 2626 2648 9044 9464 10001 10362% Chg Prev Qtr SAAR………..…………… 24.42 11.85 4.57 3.03 3.09 3.46 3.72 3.63 3.65 3.72 3.71 3.34 4.04 4.64 5.67 3.61% Chg Same Qtr Last Yr…………………… 4.63 5.98 6.17 10.66 5.57 3.54 3.32 3.47 3.61 3.68 3.68 3.60 4.04 4.64 5.67 3.61
TRANSPORTATION, COMMUNICATION…… 1622 1643 1661 1646 1652 1657 1662 1666 1670 1674 1678 1682 6308 6552 6617 6688% Chg Prev Qtr SAAR………..…………… -1.18 5.37 4.39 -3.50 1.40 1.32 1.08 1.03 0.97 0.96 0.93 0.90 -1.38 3.87 0.99 1.07% Chg Same Qtr Last Yr…………………… 14.00 1.53 1.13 1.20 1.85 0.86 0.05 1.21 1.10 1.01 0.97 0.94 -1.38 3.87 0.99 1.07
PER CAPITA ($)…………………………………… 4214 4312 4319 4316 4355 4386 4412 4430 4459 4488 4525 4552 16050 16864 17469 17903% Chg Prev Qtr SAAR………..…………… 20.93 9.69 0.65 -0.33 3.69 2.89 2.40 1.66 2.63 2.63 3.32 2.42 3.78 5.07 3.59 2.48% Chg Same Qtr Last Yr…………………… 6.86 6.38 4.72 7.40 3.35 1.71 2.15 2.66 2.39 2.33 2.56 2.75 3.78 5.07 3.59 2.48
Center for Business and Economic Research, University of Tennessee
January 2016
History Forecast Data Annual

2016 TE
NN
ES
SE
E E
CO
NO
MIC
RE
PO
RT
| 2726 | 2016 T
EN
NE
SS
EE
EC
ON
OM
IC R
EP
OR
T
AP
PE
ND
IX A
| Forecast D
ata
Table 1: Selected U.S. and Tennessee Economic Indicators, Seasonally Adjusted
2015 2016 2017 2018 2019 2020 2021 2022 2023 2024 2025
US GDP (Bil2009$) SAAR……………………………………… 16346.8 16780.6 17274.5 17728.6 18160.0 18600.2 19001.4 19410.7 19846.1 20292.1 20734.5Percentage change…………………………………………… 2.41 2.65 2.94 2.63 2.43 2.42 2.16 2.15 2.24 2.25 2.18
US GDP (Bil$) SAAR…………………………………………… 17951.1 18743.4 19668.4 20597.6 21531.1 22517.9 23499.8 24524.2 25592.8 26693.8 27826.3Percentage change…………………………………………… 3.48 4.41 4.94 4.72 4.53 4.58 4.36 4.36 4.36 4.30 4.24
TN PERSONAL INCOME (MIL2009$) SAAR……................. 253482 262535 269009 275712 282315 289062 295381 301349 307344 313789 320868Percentage change…………………………………………… 4.38 3.57 2.47 2.49 2.39 2.39 2.19 2.02 1.99 2.10 2.26
US PERSONAL INCOME (BIL2009$) SAAR………….......... 14036 14475 14929 15382 15819 16257 16662 17051 17449 17853 18267Percentage change…………………………………………… 4.22 3.12 3.14 3.04 2.84 2.77 2.49 2.33 2.34 2.32 2.32
TN PERSONAL INCOME (MIL$) SAAR…………………….... 277316 290533 304095 317862 331870 346797 362031 377731 394009 411133 429289Percentage change…………………………………………… 4.66 4.77 4.67 4.53 4.41 4.50 4.39 4.34 4.31 4.35 4.42
US PERSONAL INCOME (BIL$) SAAR…………………….... 15360 15998 16825 17707 18591 19505 20424 21375 22372 23394 24446Percentage change…………………………………………… 4.53 4.16 5.17 5.24 4.99 4.92 4.71 4.65 4.66 4.57 4.50
TN NONFARM JOBS (THOUS)………………………………… 2870.7 2918.0 2956.2 2997.7 3037.7 3070.0 3100.8 3130.1 3160.1 3189.6 3217.7Percentage change…………………………………………… 1.94 1.65 1.31 1.40 1.33 1.06 1.00 0.94 0.96 0.93 0.88
US NONFARM JOBS (MIL)……………………………………… 141.9 144.3 146.2 147.9 149.4 151.0 152.2 153.3 154.4 155.5 156.5Percentage change…………………………………………… 2.10 1.67 1.29 1.19 1.03 1.05 0.76 0.73 0.72 0.73 0.67
TN MFG JOBS (THOUS)………………………………………… 331.5 333.7 336.1 338.2 339.6 339.2 338.0 335.9 333.7 330.6 327.3Percentage change…………………………………………… 1.93 0.68 0.71 0.63 0.41 -0.13 -0.36 -0.60 -0.68 -0.92 -1.00
US MFG JOBS (MIL)……………………………………………… 12.3 12.3 12.4 12.5 12.6 12.7 12.8 12.9 12.9 12.9 12.9Percentage change…………………………………………… 1.12 -0.14 0.85 0.92 0.97 0.76 0.73 0.18 0.00 0.00 -0.03
TN UNEMPLOYMENT RATE (%)……………………………... 5.9 5.5 5.4 5.3 5.2 5.2 5.1 5.1 5.1 5.1 5.1
US UNEMPLOYMENT RATE (%)……………………………… 5.3 4.9 4.9 4.9 5.0 5.0 5.0 5.1 5.1 5.0 5.0
CHAINED PRICE INDEX, GDP (2009=100.0)……………..... 109.8 111.7 113.9 116.2 118.6 121.1 123.7 126.3 129.0 131.5 134.2Percentage change…………………………………………… 1.04 1.70 1.94 2.04 2.05 2.11 2.16 2.16 2.07 2.01 2.02
US PERS CONSUMP DEFL (2009=100.0)…………….......... 109.4 110.5 112.7 115.1 117.5 120.0 122.6 125.4 128.2 131.0 133.8Percentage change…………………………………………… 0.29 1.00 1.97 2.14 2.09 2.09 2.16 2.27 2.27 2.20 2.13
CONSUMER PRICE INDEX, ALL-URBAN (82-84=1.000)…… 2.370 2.399 2.460 2.526 2.591 2.655 2.724 2.798 2.874 2.947 3.018Percentage change…………………………………………… 0.13 1.21 2.56 2.68 2.54 2.50 2.58 2.72 2.70 2.56 2.41
BANK PRIME INTEREST RATE (%)…………………………… 3.3 3.9 4.9 5.9 6.3 6.3 6.3 6.3 6.3 6.3 6.3
FEDERAL FUNDS RATE (% per annum)……………………… 0.131 0.899 1.912 2.902 3.250 3.250 3.250 3.250 3.250 3.250 3.250
30-YEAR FIXED MORTGAGE RATE (%)……………………… 3.9 4.4 4.7 5.4 5.8 5.8 5.8 5.8 5.8 5.8 5.8
TN TAXABLE SALES (MIL2009$)……………………………… 102746 106315 107755 109560 111496 113387 115204 116993 118691 120455 122480Percentage change…………………………………………… 5.88 3.47 1.35 1.68 1.77 1.70 1.60 1.55 1.45 1.49 1.68
TN TAXABLE SALES (MIL$)…………………………………… 112414 117652 121807 126307 131066 136033 141197 146646 152158 157821 163864Percentage change…………………………………………… 6.17 4.66 3.53 3.69 3.77 3.79 3.80 3.86 3.76 3.72 3.83
TN AVG ANNUAL WAGE, NONFARM (2009$)……………... 43161 44058 44349 44652 44929 45141 45276 45354 45451 45592 45765Percentage change…………………………………………… 2.86 2.08 0.66 0.68 0.62 0.47 0.30 0.17 0.21 0.31 0.38
TN AVG ANNUAL WAGE, NONFARM ($)………………....... 47219 48755 50131 51477 52814 54155 55490 56848 58265 59733 61227Percentage change…………………………………………… 3.14 3.25 2.82 2.68 2.60 2.54 2.46 2.45 2.49 2.52 2.50
Center for Business and Economic Research, University of Tennessee
January 2016Forecast Data
Tennessee Econometric Model
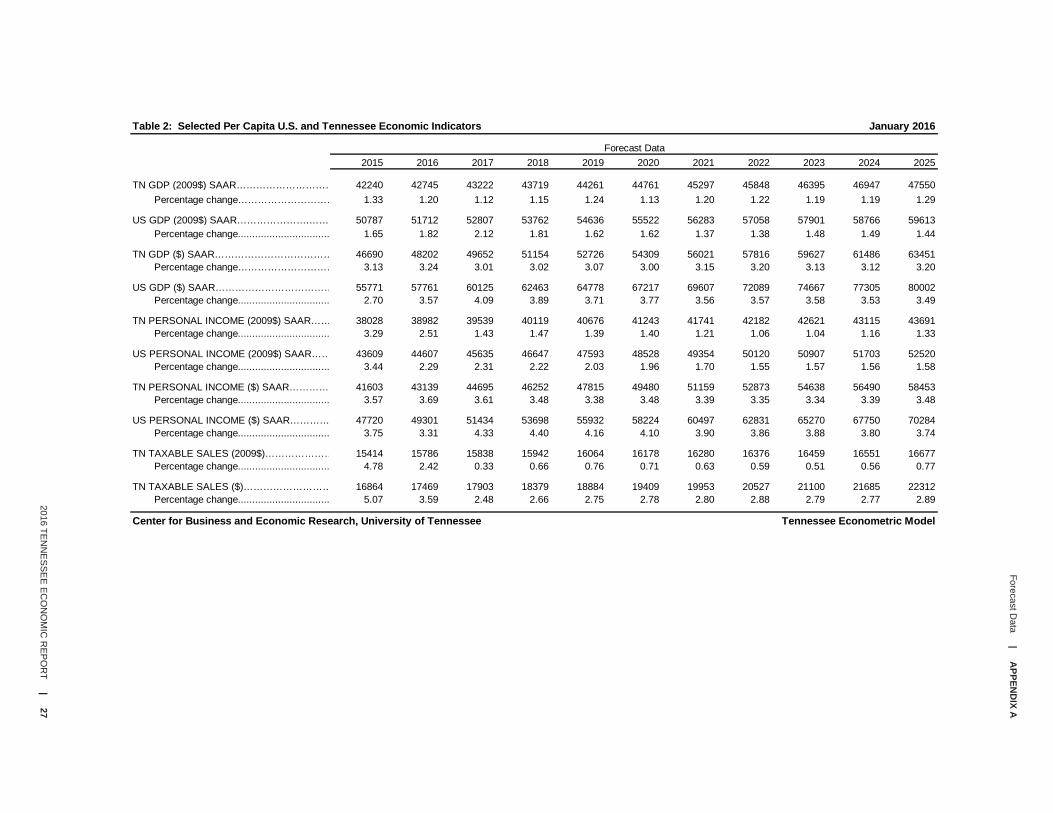
2016 TE
NN
ES
SE
E E
CO
NO
MIC
RE
PO
RT
| 2726 | 2016 T
EN
NE
SS
EE
EC
ON
OM
IC R
EP
OR
T
Forecast D
ata | AP
PE
ND
IX A
Table 2: Selected Per Capita U.S. and Tennessee Economic Indicators
2015 2016 2017 2018 2019 2020 2021 2022 2023 2024 2025
TN GDP (2009$) SAAR………………………… 42240 42745 43222 43719 44261 44761 45297 45848 46395 46947 47550Percentage change………………………… 1.33 1.20 1.12 1.15 1.24 1.13 1.20 1.22 1.19 1.19 1.29
US GDP (2009$) SAAR………………….…… 50787 51712 52807 53762 54636 55522 56283 57058 57901 58766 59613Percentage change................................ 1.65 1.82 2.12 1.81 1.62 1.62 1.37 1.38 1.48 1.49 1.44
TN GDP ($) SAAR……………………………… 46690 48202 49652 51154 52726 54309 56021 57816 59627 61486 63451Percentage change………………………… 3.13 3.24 3.01 3.02 3.07 3.00 3.15 3.20 3.13 3.12 3.20
US GDP ($) SAAR……………………………… 55771 57761 60125 62463 64778 67217 69607 72089 74667 77305 80002Percentage change................................ 2.70 3.57 4.09 3.89 3.71 3.77 3.56 3.57 3.58 3.53 3.49
TN PERSONAL INCOME (2009$) SAAR…… 38028 38982 39539 40119 40676 41243 41741 42182 42621 43115 43691Percentage change................................ 3.29 2.51 1.43 1.47 1.39 1.40 1.21 1.06 1.04 1.16 1.33
US PERSONAL INCOME (2009$) SAAR…… 43609 44607 45635 46647 47593 48528 49354 50120 50907 51703 52520Percentage change................................ 3.44 2.29 2.31 2.22 2.03 1.96 1.70 1.55 1.57 1.56 1.58
TN PERSONAL INCOME ($) SAAR………… 41603 43139 44695 46252 47815 49480 51159 52873 54638 56490 58453Percentage change................................ 3.57 3.69 3.61 3.48 3.38 3.48 3.39 3.35 3.34 3.39 3.48
US PERSONAL INCOME ($) SAAR………… 47720 49301 51434 53698 55932 58224 60497 62831 65270 67750 70284Percentage change................................ 3.75 3.31 4.33 4.40 4.16 4.10 3.90 3.86 3.88 3.80 3.74
TN TAXABLE SALES (2009$)………………… 15414 15786 15838 15942 16064 16178 16280 16376 16459 16551 16677Percentage change................................ 4.78 2.42 0.33 0.66 0.76 0.71 0.63 0.59 0.51 0.56 0.77
TN TAXABLE SALES ($)……………………… 16864 17469 17903 18379 18884 19409 19953 20527 21100 21685 22312Percentage change................................ 5.07 3.59 2.48 2.66 2.75 2.78 2.80 2.88 2.79 2.77 2.89
Center for Business and Economic Research, University of Tennessee Tennessee Econometric Model
January 2016
Forecast Data

2016 TE
NN
ES
SE
E E
CO
NO
MIC
RE
PO
RT
| 2928 | 2016 T
EN
NE
SS
EE
EC
ON
OM
IC R
EP
OR
T
AP
PE
ND
IX A
| Forecast D
ata
Table 3: Tennessee Personal Income Components (millions of 2009 dollars)
2015 2016 2017 2018 2019 2020 2021 2022 2023 2024 2025
TN PERSONAL INCOME…………...…………… 253482 262535 269009 275712 282315 289062 295381 301349 307344 313789 320868Percentage change………………………… 4.38 3.57 2.47 2.49 2.39 2.39 2.19 2.02 1.99 2.10 2.26
WAGES AND SALARIES…………………… 124639 129447 132192 134946 137561 139658 141457 143022 144684 146471 148304Percentage change………………………… 4.72 3.86 2.12 2.08 1.94 1.52 1.29 1.11 1.16 1.23 1.25
OTHER LABOR INCOME…………………… 27759 28609 29294 29927 30459 30949 31355 31705 32057 32391 32759Percentage change………………………… 2.25 3.06 2.39 2.16 1.78 1.61 1.31 1.11 1.11 1.04 1.13
PROPRIETORS INCOME…………………… 33781 35059 35952 37039 37982 39398 40855 42211 43514 44930 46555Percentage change………………………… 4.83 3.78 2.55 3.03 2.55 3.73 3.70 3.32 3.09 3.25 3.62
RENT, INTEREST, DIVIDENDS…………… 35754 36888 37995 39208 40317 41392 42398 43305 44281 45350 46570Percentage change………………………… 3.85 3.17 3.00 3.19 2.83 2.67 2.43 2.14 2.25 2.41 2.69
TRANSFER PAYMENTS…………………… 52529 53825 54850 55886 57238 58876 60456 62134 63711 65423 67331Percentage change………………………… 4.54 2.47 1.90 1.89 2.42 2.86 2.68 2.78 2.54 2.69 2.92
LESS: PERS CONT FOR SOC INS………… 19736 20042 20045 20087 20059 20058 20015 19934 19840 19742 19645Percentage change………………………… 3.55 1.55 0.01 0.21 -0.14 -0.01 -0.21 -0.40 -0.47 -0.49 -0.49
RESIDENCE ADJUSTMENT………………… -1243 -1251 -1229 -1208 -1184 -1155 -1124 -1093 -1063 -1033 -1005Percentage change………………………… 6.94 0.58 -1.75 -1.68 -2.00 -2.48 -2.61 -2.76 -2.80 -2.76 -2.71
PER CAPITA PERSONAL INCOME ($)………… 38028 38982 39539 40119 40676 41243 41741 42182 42621 43115 43691Percentage change………………………… 3.29 2.51 1.43 1.47 1.39 1.40 1.21 1.06 1.04 1.16 1.33
Center for Business and Economic Research, University of Tennessee
January 2016
Forecast Data
Tennessee Econometric Model

2016 TE
NN
ES
SE
E E
CO
NO
MIC
RE
PO
RT
| 2928 | 2016 T
EN
NE
SS
EE
EC
ON
OM
IC R
EP
OR
T
Forecast D
ata | AP
PE
ND
IX A
Table 4: Tennessee Personal Income Components (millions of current dollars)
2015 2016 2017 2018 2019 2020 2021 2022 2023 2024 2025
TN PERSONAL INCOME…………...…………… 277316 290533 304095 317862 331870 346797 362031 377731 394009 411133 429289Percentage change………………………… 4.66 4.77 4.67 4.53 4.41 4.50 4.39 4.34 4.31 4.35 4.42
WAGES AND SALARIES…………………… 136360 143252 149432 155575 161706 167550 173373 179270 185479 191906 198412Percentage change………………………… 5.01 5.05 4.31 4.11 3.94 3.61 3.48 3.40 3.46 3.47 3.39
OTHER LABOR INCOME…………………… 30369 31659 33114 34502 35805 37130 38430 39740 41095 42439 43827Percentage change………………………… 2.53 4.25 4.60 4.19 3.78 3.70 3.50 3.41 3.41 3.27 3.27
PROPRIETORS INCOME…………………… 36957 38798 40641 42702 44650 47269 50074 52911 55785 58869 62287Percentage change………………………… 5.11 4.98 4.75 5.07 4.56 5.87 5.94 5.67 5.43 5.53 5.81
RENT, INTEREST, DIVIDENDS…………… 39116 40822 42951 45203 47395 49660 51964 54282 56768 59419 62307Percentage change………………………… 4.13 4.36 5.22 5.24 4.85 4.78 4.64 4.46 4.58 4.67 4.86
TRANSFER PAYMENTS…………………… 57466 59565 62003 64430 67285 70636 74097 77884 81677 85720 90083Percentage change………………………… 4.82 3.65 4.09 3.91 4.43 4.98 4.90 5.11 4.87 4.95 5.09
LESS: PERS CONT FOR SOC INS………… 21592 22178 22658 23157 23580 24063 24530 24986 25433 25866 26282Percentage change………………………… 3.83 2.72 2.16 2.20 1.82 2.05 1.94 1.86 1.79 1.70 1.61
RESIDENCE ADJUSTMENT………………… -1360 -1384 -1389 -1393 -1392 -1385 -1378 -1370 -1362 -1354 -1345Percentage change………………………… 7.24 1.73 0.36 0.27 -0.08 -0.47 -0.51 -0.55 -0.59 -0.62 -0.65
PER CAPITA PERSONAL INCOME ($)………… 41603 43139 44695 46252 47815 49480 51159 52873 54638 56490 58453Percentage change………………………… 3.57 3.69 3.61 3.48 3.38 3.48 3.39 3.35 3.34 3.39 3.48
Center for Business and Economic Research, University of Tennessee
January 2016
Forecast Data
Tennessee Econometric Model

2016 TE
NN
ES
SE
E E
CO
NO
MIC
RE
PO
RT
| 3130 | 2016 T
EN
NE
SS
EE
EC
ON
OM
IC R
EP
OR
T
AP
PE
ND
IX A
| Forecast D
ata
Table 5: Tennessee Nonfarm Employment by Sector (thousands of jobs)
2015 2016 2017 2018 2019 2020 2021 2022 2023 2024 2025
TOTAL NONFARM………………………………………………… 2870.7 2918.0 2956.2 2997.7 3037.7 3070.0 3100.8 3130.1 3160.1 3189.6 3217.7Percentage change………………………………………… 1.94 1.65 1.31 1.40 1.33 1.06 1.00 0.94 0.96 0.93 0.88
NATURAL RESOURCES, MINING & CONSTRUCTION…… 114.5 117.5 121.0 124.1 126.2 128.7 130.9 132.0 133.3 134.9 136.4Percentage change………………………………………… 3.20 2.63 3.02 2.49 1.75 1.93 1.73 0.87 1.00 1.16 1.14
MANUFACTURING……………………………………………… 331.5 333.7 336.1 338.2 339.6 339.2 338.0 335.9 333.7 330.6 327.3Percentage change………………………………………… 1.93 0.68 0.71 0.63 0.41 -0.13 -0.36 -0.60 -0.68 -0.92 -1.00
DURABLE GOODS…………………………………………… 211.7 214.8 218.1 221.1 223.2 223.8 223.8 223.3 222.6 221.1 219.3Percentage change………………………………………… 2.99 1.47 1.53 1.40 0.94 0.25 0.02 -0.23 -0.31 -0.68 -0.79
NONDURABLE GOODS…………………………………… 119.8 119.0 118.0 117.1 116.4 115.4 114.2 112.6 111.0 109.5 107.9Percentage change………………………………………… 0.10 -0.72 -0.77 -0.79 -0.60 -0.85 -1.08 -1.34 -1.41 -1.41 -1.42
TRADE, TRANSPORTATION, UTILITIES…………………… 607.5 618.9 625.7 632.8 638.1 641.1 642.9 644.9 647.5 649.5 651.6Percentage change………………………………………… 2.60 1.88 1.09 1.13 0.85 0.46 0.29 0.30 0.40 0.31 0.33
WHOLESALE TRADE……………………………………… 127.0 130.1 131.0 132.1 133.2 134.2 134.7 135.0 135.4 135.7 136.2Percentage change………………………………………… 2.99 2.42 0.70 0.86 0.83 0.72 0.42 0.23 0.29 0.20 0.36
RETAIL TRADE……………………………………………… 327.8 332.8 336.3 339.4 342.1 342.5 343.0 343.5 344.2 344.7 345.2Percentage change………………………………………… 2.19 1.53 1.03 0.94 0.78 0.13 0.14 0.14 0.21 0.15 0.13
TRANSPORTATION & UTILITIES………………………… 152.7 156.0 158.4 161.2 162.9 164.4 165.2 166.3 167.8 169.1 170.2Percentage change………………………………………… 3.15 2.19 1.56 1.77 1.03 0.92 0.48 0.71 0.90 0.72 0.70
INFORMATION………………………………………………… 43.4 42.5 42.6 42.7 43.0 43.3 43.6 43.9 44.3 44.7 45.0Percentage change………………………………………… -1.27 -2.01 0.36 0.21 0.55 0.72 0.70 0.84 0.77 0.96 0.62
FINANCIAL ACTIVITIES……………………………………… 144.8 147.6 148.8 150.3 151.8 151.7 151.8 152.0 152.0 152.1 152.1Percentage change………………………………………… 2.34 1.94 0.79 0.99 1.03 -0.08 0.10 0.12 0.01 0.05 -0.02
PROFESSIONAL & BUSINESS SERVICES………………… 383.0 393.8 403.8 416.0 429.5 442.8 455.9 468.6 481.9 495.7 509.3Percentage change………………………………………… 2.80 2.81 2.55 3.01 3.26 3.09 2.97 2.78 2.83 2.87 2.74
EDUCATION & HEALTH SERVICES………………………… 409.8 417.9 425.8 433.8 441.9 449.3 457.3 465.3 473.2 481.2 489.1Percentage change………………………………………… 1.78 1.98 1.89 1.88 1.86 1.67 1.80 1.75 1.69 1.68 1.66
LEISURE & HOSPITALITY…………………………………… 305.9 313.6 319.5 325.1 329.9 333.6 337.3 341.6 345.2 349.3 351.9Percentage change………………………………………… 3.28 2.54 1.86 1.75 1.49 1.11 1.12 1.25 1.08 1.17 0.74
OTHER SERVICES……………………………………………… 104.8 103.6 102.4 102.6 102.7 102.7 102.8 102.9 103.2 102.9 103.0Percentage change………………………………………… -0.97 -1.11 -1.19 0.18 0.11 0.00 0.05 0.17 0.29 -0.34 0.10
GOVERNMENT………………………………………………… 425.6 428.7 430.4 432.3 434.9 437.8 440.2 442.8 445.7 448.8 452.0Percentage change………………………………………… 0.10 0.73 0.40 0.42 0.61 0.67 0.56 0.59 0.66 0.69 0.71
FEDERAL, CIVILIAN………………………………………… 47.4 46.5 45.8 45.1 44.4 43.9 43.3 42.9 42.7 42.4 42.1Percentage change………………………………………… -1.06 -1.95 -1.43 -1.65 -1.58 -1.09 -1.24 -0.89 -0.63 -0.62 -0.64
STATE & LOCAL……………………………………………… 378.2 382.3 384.6 387.2 390.6 393.9 396.9 399.9 403.1 406.4 409.9Percentage change………………………………………… 0.24 1.07 0.62 0.67 0.87 0.87 0.76 0.75 0.80 0.83 0.85
Tennessee Econometric Model
January 2016
Center for Business and Economic Research, University of Tennessee
Forecast Data

2016 TE
NN
ES
SE
E E
CO
NO
MIC
RE
PO
RT
| 3130 | 2016 T
EN
NE
SS
EE
EC
ON
OM
IC R
EP
OR
T
Forecast D
ata | AP
PE
ND
IX A
Table 6: Tennessee Durable Goods Manufacturing Employment (thousands of jobs) January 2016
2015 2016 2017 2018 2019 2020 2021 2022 2023 2024 2025
TOTAL DURABLE GOODS…………………… 211.7 214.8 218.1 221.1 223.2 223.8 223.8 223.3 222.6 221.1 219.3Percentage change………..…………… 2.99 1.47 1.53 1.40 0.94 0.25 0.02 -0.23 -0.31 -0.68 -0.79
WOOD PRODUCTS……………………… 11.6 11.8 12.0 12.2 12.3 12.3 12.2 12.2 12.1 12.1 12.1Percentage change………..…………… 3.40 1.90 1.55 1.29 0.79 -0.11 -0.34 -0.30 -0.31 -0.38 -0.29
NONMETALLIC MINERALS……………… 11.7 11.6 11.5 11.4 11.4 11.4 11.4 11.4 11.3 11.3 11.2Percentage change………..…………… -1.68 -0.98 -0.97 -0.63 -0.16 -0.06 -0.06 -0.13 -0.34 -0.35 -0.91
PRIMARY METALS………….…………… 10.3 10.4 10.4 10.5 10.6 10.6 10.5 10.5 10.4 10.3 10.1Percentage change………..…………… 1.90 1.07 0.64 0.91 0.90 -0.46 -0.53 -0.46 -0.69 -1.08 -1.48
FABRICATED METALS………………….. 35.2 35.3 35.4 35.5 35.7 35.4 35.1 34.8 34.6 34.3 34.2Percentage change………..…………… 2.28 0.29 0.47 0.16 0.67 -0.93 -0.85 -0.72 -0.70 -0.68 -0.57
MACHINERY………………………………… 26.2 26.1 26.4 26.7 26.9 27.1 27.0 26.7 26.4 26.1 25.8Percentage change………..…………… 1.94 -0.38 1.04 1.12 0.86 0.53 -0.44 -1.09 -0.96 -0.99 -1.14
COMPUTERS & ELECTRONICS………… 5.1 5.1 5.0 4.8 4.7 4.5 4.3 4.1 4.0 3.8 3.7Percentage change………..…………… 1.16 0.03 -2.64 -2.30 -3.35 -4.04 -4.10 -3.74 -4.20 -4.07 -4.15
ELECTRICAL EQUIPMENT, APPLIANCES & COMPONENTS…………..…………… 19.9 20.2 20.5 20.8 21.1 21.2 21.3 21.4 21.4 21.3 21.2
Percentage change………..…………… 2.58 1.67 1.36 1.50 1.15 0.83 0.57 0.09 -0.05 -0.41 -0.48
TRANSPORTATION EQUIPMENT……… 67.5 70.0 72.5 74.9 76.3 77.4 78.2 78.7 79.0 78.8 78.4Percentage change………..…………… 5.39 3.71 3.67 3.23 1.87 1.43 1.09 0.64 0.43 -0.34 -0.52
FURNITURE………………………………… 9.2 9.3 9.3 9.3 9.3 9.1 8.9 8.7 8.5 8.2 7.9Percentage change………..…………… 1.38 0.68 0.91 -0.27 -0.63 -1.76 -2.62 -2.38 -2.30 -2.84 -3.25
MISCELLANEOUS DURABLES………… 15.1 15.1 15.0 15.0 15.0 14.9 15.0 14.9 14.9 14.9 14.8Percentage change………..…………… 2.39 0.02 -0.49 0.02 0.20 -0.63 0.12 -0.10 -0.03 -0.35 -0.23
Center for Business and Economic Research, University of Tennessee Tennessee Econometric Model
Forecast Data

2016 TE
NN
ES
SE
E E
CO
NO
MIC
RE
PO
RT
| 3332 | 2016 T
EN
NE
SS
EE
EC
ON
OM
IC R
EP
OR
T
AP
PE
ND
IX A
| Forecast D
ata
Table 7: Tennessee Nondurable Goods Manufacturing Employment (thousands of jobs) January 2016
2015 2016 2017 2018 2019 2020 2021 2022 2023 2024 2025
TOTAL NONDURABLE GOODS………………… 119.8 119.0 118.0 117.1 116.4 115.4 114.2 112.6 111.0 109.5 107.9Percentage change………..………………… 0.10 -0.72 -0.77 -0.79 -0.60 -0.85 -1.08 -1.34 -1.41 -1.41 -1.42
FOOD……………………………………………… 32.9 32.9 33.0 33.0 33.0 32.9 32.7 32.5 32.3 32.0 31.8Percentage change………..………………… 0.54 0.12 0.12 0.08 0.09 -0.40 -0.53 -0.60 -0.75 -0.71 -0.62
BEVERAGE & TOBACCO……………………… 5.5 5.5 5.4 5.4 5.3 5.2 5.1 5.1 5.0 4.9 4.8Percentage change………..………………… 0.77 0.05 -0.99 -0.89 -0.75 -1.57 -1.49 -1.38 -1.62 -1.75 -1.55
TEXTILE MILLS, TEXTILE MILL PRODUCTS & APPAREL…………………… 9.6 9.2 8.7 8.3 8.0 7.7 7.4 7.1 6.9 6.6 6.4
Percentage change………..………………… -4.10 -4.09 -5.00 -4.85 -3.57 -3.64 -3.82 -4.00 -3.86 -3.72 -3.27
PAPER…………………………………………… 14.3 14.0 13.6 13.4 13.1 12.8 12.6 12.4 12.2 12.0 11.8Percentage change………..………………… -2.23 -2.28 -2.40 -2.04 -2.00 -1.85 -1.84 -1.72 -1.64 -1.60 -1.54
PRINTING & RELATED SUPPORT…………… 9.0 8.8 8.8 8.7 8.6 8.4 8.3 8.1 8.0 7.8 7.7Percentage change………..………………… -4.32 -2.25 -0.59 -1.52 -1.03 -1.97 -1.67 -1.62 -1.54 -1.93 -1.97
CHEMICALS……………………………………… 25.2 25.0 24.7 24.4 24.2 23.9 23.5 23.2 22.9 22.6 22.2Percentage change………..………………… -0.40 -1.02 -1.09 -1.00 -0.92 -1.30 -1.51 -1.48 -1.42 -1.38 -1.62
PLASTICS & RUBBER………………………… 21.3 21.6 21.9 22.2 22.5 22.7 22.8 22.6 22.3 22.0 21.7Percentage change………..………………… 2.90 1.62 1.51 1.32 1.08 1.25 0.30 -1.02 -1.29 -1.34 -1.48
MISCELLANEOUS NONDURABLE GOODS… 2.1 2.0 1.9 1.8 1.7 1.7 1.7 1.6 1.6 1.6 1.5Percentage change………..………………… 35.66 -3.74 -5.64 -6.17 -3.23 -1.90 -2.05 -2.01 -2.08 -1.88 -2.07
Center for Business and Economic Research, University of Tennessee Tennessee Econometric Model
Forecast Data

2016 TE
NN
ES
SE
E E
CO
NO
MIC
RE
PO
RT
| 3332 | 2016 T
EN
NE
SS
EE
EC
ON
OM
IC R
EP
OR
T
Forecast D
ata | AP
PE
ND
IX A
Table 8: Tennessee Average Annual Wage and Salary Rate by Sector (2009 dollars)
2015 2016 2017 2018 2019 2020 2021 2022 2023 2024 2025
TOTAL NONFARM………………………………… 43161 44058 44349 44652 44929 45141 45276 45354 45451 45592 45765Percentage change………..……………… 2.86 2.08 0.66 0.68 0.62 0.47 0.30 0.17 0.21 0.31 0.38
NATURAL RESOURCES, MINING AND CONSTRUCTION……………………… 49991 51772 52152 52564 52937 53223 53442 53667 53843 53983 54215
Percentage change………..……………… 5.88 3.56 0.73 0.79 0.71 0.54 0.41 0.42 0.33 0.26 0.43
MANUFACTURING……………………………… 52464 54520 55037 55472 55749 56050 56195 56361 56717 56899 57077Percentage change………..……………… 1.67 3.92 0.95 0.79 0.50 0.54 0.26 0.30 0.63 0.32 0.31
DURABLE GOODS…………………………… 50844 52378 52841 53308 53596 53812 53902 54070 54332 54495 54627Percentage change………..……………… 0.70 3.02 0.88 0.89 0.54 0.40 0.17 0.31 0.48 0.30 0.24
NONDURABLE GOODS…………………… 55333 58393 59097 59559 59877 60388 60690 60903 61496 61753 62054Percentage change………..……………… 3.41 5.53 1.21 0.78 0.53 0.85 0.50 0.35 0.97 0.42 0.49
TRADE, TRANSPORTATION, UTILITIES…… 39037 39884 40333 40792 41238 41525 41801 41995 42212 42497 42877Percentage change………..……………… 0.83 2.17 1.13 1.14 1.09 0.69 0.67 0.46 0.52 0.67 0.89
WHOLESALE TRADE……………………… 59353 60621 61218 61845 62478 62735 63129 63209 63453 63985 64510Percentage change………..……………… 0.34 2.14 0.98 1.03 1.02 0.41 0.63 0.13 0.39 0.84 0.82
RETAIL TRADE……………………………… 26683 27411 27715 28022 28385 28692 28939 29191 29409 29610 29966Percentage change………..……………… 0.76 2.73 1.11 1.11 1.30 1.08 0.86 0.87 0.75 0.68 1.20
TRANSPORTATION & UTILITIES………… 48721 49284 49809 50346 50765 50860 51025 51124 51242 51441 51666Percentage change………..……………… 1.06 1.16 1.06 1.08 0.83 0.19 0.32 0.20 0.23 0.39 0.44
INFORMATION………………………………… 57804 59378 59802 60193 60385 60658 60855 61009 61114 61196 61434Percentage change………..……………… 3.39 2.72 0.71 0.65 0.32 0.45 0.32 0.25 0.17 0.13 0.39
FINANCIAL ACTIVITIES……………………… 64642 66426 67022 67485 67889 68196 68390 68477 68761 68995 69196Percentage change………..……………… 2.24 2.76 0.90 0.69 0.60 0.45 0.29 0.13 0.42 0.34 0.29
PROFESSIONAL & BUSINESS SERVICES… 51066 51350 51670 52043 52406 52766 53030 53289 53490 53760 54017Percentage change………..……………… 7.23 0.56 0.62 0.72 0.70 0.69 0.50 0.49 0.38 0.51 0.48
EDUCATION & HEALTH SERVICES………… 44065 44906 45191 45568 46026 46433 46733 46930 47088 47432 47756Percentage change………..……………… 2.93 1.91 0.63 0.83 1.01 0.88 0.65 0.42 0.34 0.73 0.68
LEISURE & HOSPITALITY…………………… 21137 21730 21979 22205 22371 22532 22578 22591 22588 22689 22813Percentage change………..……………… 4.86 2.81 1.14 1.03 0.75 0.72 0.21 0.06 -0.01 0.45 0.55
OTHER SERVICES……………………………… 40498 41325 41442 41671 41670 41405 41122 40808 40499 40220 39979Percentage change………..……………… 4.20 2.04 0.28 0.55 0.00 -0.64 -0.68 -0.76 -0.76 -0.69 -0.60
GOVERNMENT………………………………… 39726 40211 39940 39706 39465 39201 38884 38529 38169 37827 37506Percentage change………..……………… 0.81 1.22 -0.68 -0.59 -0.61 -0.67 -0.81 -0.91 -0.93 -0.90 -0.85
FEDERAL, CIVILIAN………………………… 75100 77290 77198 77218 77314 77352 77323 77202 77062 76962 76907Percentage change………..……………… 4.51 2.92 -0.12 0.03 0.12 0.05 -0.04 -0.16 -0.18 -0.13 -0.07
STATE & LOCAL……………………………… 35267 35588 35389 35230 35062 34849 34587 34276 33952 33646 33358Percentage change………..……………… -0.07 0.91 -0.56 -0.45 -0.48 -0.61 -0.75 -0.90 -0.94 -0.90 -0.85
January 2016Forecast Data
Center for Business and Economic Research, University of Tennessee Tennessee Econometric Model

2016 TE
NN
ES
SE
E E
CO
NO
MIC
RE
PO
RT
| 3534 | 2016 T
EN
NE
SS
EE
EC
ON
OM
IC R
EP
OR
T
AP
PE
ND
IX A
| Forecast D
ata
Table 9: Tennessee Average Annual Wage and Salary Rate by Sector (current dollars)
2015 2016 2017 2018 2019 2020 2021 2022 2023 2024 2025
TOTAL NONFARM……………………………………………… 47219 48755 50131 51477 52814 54155 55490 56848 58265 59733 61227Percentage change………..…………………………… 3.14 3.25 2.82 2.68 2.60 2.54 2.46 2.45 2.49 2.52 2.50
NATURAL RESOURCES, MINING & CONSTRUCTION… 54695 57291 58952 60598 62228 63852 65499 67268 69023 70728 72532Percentage change………..…………………………… 6.18 4.75 2.90 2.79 2.69 2.61 2.58 2.70 2.61 2.47 2.55
MANUFACTURING………………………………………… 57400 60333 62214 63951 65533 67243 68873 70645 72707 74548 76361Percentage change………..…………………………… 1.95 5.11 3.12 2.79 2.47 2.61 2.42 2.57 2.92 2.53 2.43
DURABLE GOODS…………………………………….... 55627 57962 59731 61456 63001 64558 66062 67773 69650 71398 73083Percentage change………..…………………………… 0.97 4.20 3.05 2.89 2.51 2.47 2.33 2.59 2.77 2.51 2.36
NONDURABLE GOODS…………………………….. 60542 64619 66803 68662 70385 72448 74382 76338 78835 80908 83020Percentage change………..…………………………… 3.71 6.73 3.38 2.78 2.51 2.93 2.67 2.63 3.27 2.63 2.61
TRADE, TRANSPORTATION, UTILITIES…………. 42707 44136 45592 47027 48475 49817 51232 52638 54114 55679 57363Percentage change………..…………………………… 1.10 3.35 3.30 3.15 3.08 2.77 2.84 2.74 2.80 2.89 3.03
WHOLESALE TRADE…………………………………… 64934 67084 69200 71298 73442 75264 77371 79228 81343 83833 86306Percentage change………..…………………………… 0.61 3.31 3.15 3.03 3.01 2.48 2.80 2.40 2.67 3.06 2.95
RETAIL TRADE…………………………………………… 29193 30333 31329 32305 33367 34422 35468 36589 37701 38795 40090Percentage change………..…………………………… 1.03 3.91 3.28 3.12 3.29 3.16 3.04 3.16 3.04 2.90 3.34
TRANSPORTATION & UTILITIES……………………… 53300 54539 56304 58041 59674 61017 62536 64081 65689 67397 69122Percentage change………..…………………………… 1.33 2.32 3.24 3.09 2.81 2.25 2.49 2.47 2.51 2.60 2.56
INFORMATION……………………………………………… 63239 65708 67600 69393 70983 72772 74584 76471 78344 80177 82190Percentage change………..…………………………… 3.67 3.90 2.88 2.65 2.29 2.52 2.49 2.53 2.45 2.34 2.51
FINANCIAL ACTIVITIES………………………………….... 70721 73508 75761 77800 79803 81814 83819 85830 88148 90396 92574Percentage change………..…………………………… 2.52 3.94 3.06 2.69 2.58 2.52 2.45 2.40 2.70 2.55 2.41
PROFESSIONAL & BUSINESS SERVICES……………… 55865 56824 58407 59997 61603 63303 64994 66794 68571 70436 72267Percentage change………..…………………………… 7.52 1.72 2.79 2.72 2.68 2.76 2.67 2.77 2.66 2.72 2.60
EDUCATION & HEALTH SERVICES……………………… 48207 49693 51083 52533 54104 55706 57276 58823 60364 62145 63891Percentage change………..…………………………… 3.21 3.08 2.80 2.84 2.99 2.96 2.82 2.70 2.62 2.95 2.81
LEISURE & HOSPITALITY………………………………… 23125 24047 24845 25599 26297 27031 27672 28317 28956 29727 30520Percentage change………..…………………………… 5.14 3.99 3.32 3.04 2.73 2.79 2.37 2.33 2.26 2.66 2.67
OTHER SERVICES………………………………………… 44306 45730 46846 48041 48982 49673 50398 51149 51917 52695 53486Percentage change………..…………………………… 4.48 3.22 2.44 2.55 1.96 1.41 1.46 1.49 1.50 1.50 1.50
GOVERNMENT……………………………………………… 43461 44497 45146 45774 46390 47029 47656 48292 48930 49560 50177Percentage change………..…………………………… 1.08 2.38 1.46 1.39 1.35 1.38 1.33 1.34 1.32 1.29 1.24
FEDERAL, CIVILIAN……………………………………… 82162 85528 87263 89019 90881 92799 94766 96766 98788 100833 102890Percentage change………..…………………………… 4.79 4.10 2.03 2.01 2.09 2.11 2.12 2.11 2.09 2.07 2.04
STATE & LOCAL………………………………………… 38582 39381 40002 40614 41214 41808 42389 42961 43524 44081 44628Percentage change………..…………………………… 0.20 2.07 1.58 1.53 1.48 1.44 1.39 1.35 1.31 1.28 1.24
January 2016
Forecast Data
Center for Business and Economic Research, University of Tennessee Tennessee Econometric Model

2016 TE
NN
ES
SE
E E
CO
NO
MIC
RE
PO
RT
| 3534 | 2016 T
EN
NE
SS
EE
EC
ON
OM
IC R
EP
OR
T
Forecast D
ata | AP
PE
ND
IX A
Table 10: Tennessee Civilian Labor Force and Unemployment Rate
2015 2016 2017 2018 2019 2020 2021 2022 2023 2024 2025
CIVILIAN LABOR FORCE (THOUS)………… 3063 3060 3079 3103 3124 3148 3170 3191 3209 3226 3243Percentage change……………………… 2.33 -0.10 0.63 0.78 0.66 0.78 0.69 0.66 0.57 0.52 0.51
EMPLOYED PERSONS (THOUS)………… 2882 2890 2913 2938 2960 2985 3007 3028 3046 3063 3078Percentage change……………………… 3.05 0.28 0.77 0.89 0.73 0.84 0.74 0.70 0.59 0.56 0.49
UNEMPLOYED PERSONS (THOUS)…… 181 170 167 165 164 163 163 163 163 163 165Percentage change……………………… -7.97 -6.20 -1.72 -1.07 -0.61 -0.41 -0.14 -0.03 0.17 -0.11 0.95
PARTICIPATION RATE (PERCENT)……… 57.7 57.0 56.7 56.5 56.3 56.2 56.0 55.8 55.5 55.3 55.1Percentage change……………………… 1.12 -1.26 -0.49 -0.30 -0.41 -0.27 -0.34 -0.36 -0.43 -0.43 -0.39
UNEMPLOYMENT RATE (PERCENT)……… 5.9 5.5 5.4 5.3 5.2 5.2 5.1 5.1 5.1 5.1 5.1
Center for Business and Economic Research, University of Tennessee Tennessee Econometric Model
January 2016
Forecast Data

2016 TE
NN
ES
SE
E E
CO
NO
MIC
RE
PO
RT
| 3736 | 2016 T
EN
NE
SS
EE
EC
ON
OM
IC R
EP
OR
T
AP
PE
ND
IX A
| Forecast D
ata
Table 11: Tennessee Taxable Sales (millions of 2009 dollars)
2015 2016 2017 2018 2019 2020 2021 2022 2023 2024 2025
TOTAL TAXABLE SALES………………………… 102746 106315 107755 109560 111496 113387 115204 116993 118691 120455 122480Percentage change………..………………… 5.88 3.47 1.35 1.68 1.77 1.70 1.60 1.55 1.45 1.49 1.68
AUTO DEALERS………………………………… 10751 11185 11279 11615 11865 12159 12495 12841 13150 13453 13766Percentage change………..………………… 10.95 4.04 0.85 2.98 2.15 2.48 2.76 2.78 2.40 2.31 2.33
PURCHASES FROM MANUFACTURERS…. 4420 4591 4652 4729 4807 4899 4967 5040 5114 5186 5274Percentage change………..………………… 8.09 3.87 1.33 1.66 1.65 1.90 1.40 1.46 1.47 1.41 1.70
MISC DURABLE GOODS……………………… 16866 17537 17799 18085 18449 18828 19247 19687 20056 20471 20906Percentage change………..………………… 4.83 3.98 1.49 1.61 2.01 2.06 2.22 2.29 1.87 2.07 2.12
EATING AND DRINKING PLACES…………… 10958 11301 11510 11762 12057 12312 12605 12885 13180 13443 13786Percentage change………..………………… 6.81 3.13 1.85 2.19 2.51 2.12 2.38 2.22 2.29 1.99 2.55
FOOD STORES………………………………… 9858 10024 10065 10101 10209 10329 10414 10518 10654 10766 10917Percentage change………..………………… 3.91 1.69 0.41 0.36 1.06 1.18 0.82 1.00 1.30 1.05 1.40
LIQUOR STORES……………………………… 882 909 924 946 974 1001 1020 1041 1058 1079 1102Percentage change………..………………… 7.69 3.05 1.67 2.38 2.97 2.71 1.91 2.03 1.66 1.96 2.19
HOTELS AND MOTELS………………………… 2953 3053 3172 3299 3425 3497 3573 3648 3733 3836 3949Percentage change………..………………… 11.78 3.37 3.91 4.02 3.81 2.10 2.17 2.10 2.31 2.78 2.94
OTHER RETAIL AND SERVICE……………… 31419 32699 33270 33858 34432 34948 35363 35712 36041 36424 36869Percentage change………..………………… 5.11 4.07 1.75 1.77 1.70 1.50 1.19 0.99 0.92 1.06 1.22
MISC NONDURABLE GOODS………………… 8650 9037 9167 9310 9454 9599 9729 9846 9962 10091 10236Percentage change………..………………… 4.36 4.47 1.43 1.57 1.55 1.53 1.35 1.21 1.18 1.29 1.44
TRANSPORTATION, COMMUNICATION…… 5989 5980 5917 5854 5823 5814 5792 5776 5743 5706 5675Percentage change………..………………… 3.59 -0.16 -1.05 -1.07 -0.51 -0.16 -0.39 -0.27 -0.56 -0.66 -0.54
PER CAPITA ($)…………………………………… 15414 15786 15838 15942 16064 16178 16280 16376 16459 16551 16677Percentage change………..………………… 4.78 2.42 0.33 0.66 0.76 0.71 0.63 0.59 0.51 0.56 0.77
Center for Business and Economic Research, University of Tennessee
January 2016
Forecast Data
Tennessee Econometric Model

2016 TE
NN
ES
SE
E E
CO
NO
MIC
RE
PO
RT
| 3736 | 2016 T
EN
NE
SS
EE
EC
ON
OM
IC R
EP
OR
T
Forecast D
ata | AP
PE
ND
IX A
Table 12: Tennessee Taxable Sales (millions of current dollars)
2015 2016 2017 2018 2019 2020 2021 2022 2023 2024 2025
TOTAL TAXABLE SALES………………………… 112414 117652 121807 126307 131066 136033 141197 146646 152158 157821 163864Percentage change………..………………… 6.17 4.66 3.53 3.69 3.77 3.79 3.80 3.86 3.76 3.72 3.83
AUTO DEALERS………………………………… 11762 12378 12751 13391 13947 14588 15314 16097 16858 17627 18418Percentage change………..………………… 11.26 5.24 3.01 5.02 4.16 4.59 4.98 5.11 4.73 4.56 4.49
PURCHASES FROM MANUFACTURERS…. 4836 5080 5258 5452 5651 5877 6088 6317 6556 6795 7056Percentage change………..………………… 8.39 5.06 3.51 3.68 3.65 4.00 3.59 3.76 3.78 3.64 3.85
MISC DURABLE GOODS……………………… 18454 19407 20120 20850 21687 22589 23590 24677 25711 26822 27970Percentage change………..………………… 5.12 5.16 3.67 3.63 4.02 4.16 4.43 4.61 4.19 4.32 4.28
EATING AND DRINKING PLACES…………… 11989 12506 13011 13560 14173 14771 15449 16150 16897 17613 18444Percentage change………..………………… 7.10 4.31 4.04 4.22 4.52 4.22 4.59 4.54 4.62 4.24 4.72
FOOD STORES………………………………… 10785 11093 11377 11645 12001 12392 12764 13183 13658 14106 14605Percentage change………..………………… 4.19 2.86 2.57 2.35 3.05 3.26 3.00 3.29 3.60 3.28 3.54
LIQUOR STORES……………………………… 965 1006 1045 1091 1145 1201 1250 1304 1356 1413 1475Percentage change………..………………… 7.98 4.24 3.86 4.41 5.00 4.82 4.11 4.35 3.97 4.21 4.35
HOTELS AND MOTELS………………………… 3231 3378 3586 3804 4027 4196 4380 4573 4785 5026 5283Percentage change………..………………… 12.09 4.55 6.15 6.08 5.85 4.20 4.38 4.42 4.64 5.04 5.11
OTHER RETAIL AND SERVICE……………… 34376 36186 37609 39033 40475 41928 43341 44763 46203 47723 49326Percentage change………..………………… 5.40 5.27 3.93 3.79 3.69 3.59 3.37 3.28 3.22 3.29 3.36
MISC NONDURABLE GOODS………………… 9464 10001 10362 10733 11114 11516 11923 12341 12771 13221 13695Percentage change………..………………… 4.64 5.67 3.61 3.58 3.54 3.62 3.54 3.51 3.48 3.52 3.58
TRANSPORTATION, COMMUNICATION…… 6552 6617 6688 6748 6845 6975 7098 7239 7363 7475 7592Percentage change………..………………… 3.87 0.99 1.07 0.90 1.44 1.90 1.76 1.99 1.70 1.53 1.56
PER CAPITA ($)…………………………………… 16864 17469 17903 18379 18884 19409 19953 20527 21100 21685 22312Percentage change………..………………… 5.07 3.59 2.48 2.66 2.75 2.78 2.80 2.88 2.79 2.77 2.89
Center for Business and Economic Research, University of Tennessee
January 2016
Forecast Data
Tennessee Econometric Model

2016 TE
NN
ES
SE
E E
CO
NO
MIC
RE
PO
RT
| 3938 | 2016 T
EN
NE
SS
EE
EC
ON
OM
IC R
EP
OR
T
AP
PE
ND
IX A
| Forecast D
ata
Table 13: Tennessee Gross Domestic Product by Sector (millions of 2009 dollars)
2015 2016 2017 2018 2019 2020 2021 2022 2023 2024 2025GROSS DOMESTIC PRODUCT..........................................................................281,548 287,872 294,064 300,449 307,195 313,710 320,540 327,536 334,562 341,669 349,209 Percentage change………………………………………………………………………..2.40 2.25 2.15 2.17 2.25 2.12 2.18 2.18 2.15 2.12 2.21
NATURAL RESOURCES & MINING......................................................................................................3,216 3,343 3,468 3,594 3,721 3,850 3,978 4,106 4,229 4,353 4,486 Percentage change………………………………………………………………………..6.03 3.95 3.74 3.63 3.53 3.46 3.33 3.23 2.98 2.94 3.06
CONSTRUCTION................................................................................9,756 10,036 10,248 10,458 10,671 10,879 11,109 11,340 11,568 11,814 12,058 Percentage change………………………………………………………………………..3.12 2.87 2.11 2.05 2.03 1.95 2.12 2.08 2.01 2.12 2.07
MANUFACTURING.............................................................................47,428 48,617 49,807 51,005 52,249 53,379 54,554 55,781 57,041 58,101 59,291 Percentage change………………………………………………………………………..2.86 2.51 2.45 2.41 2.44 2.16 2.20 2.25 2.26 1.86 2.05
DURABLE GOODS........................................................................27,410 28,262 29,134 30,039 30,971 31,773 32,629 33,532 34,465 35,245 36,122 Percentage change………………………………………………………………………..3.63 3.11 3.08 3.11 3.10 2.59 2.69 2.77 2.78 2.26 2.49
WOOD PRODUCTS………………………………………….............575 583 591 600 608 617 625 633 642 651 660 Percentage change………………………………………………………………………..1.01 1.49 1.37 1.48 1.29 1.50 1.27 1.34 1.41 1.40 1.47
NONMETALLIC MINERAL PRODUCTS……………………………..1,038 1,042 1,046 1,049 1,053 1,057 1,061 1,065 1,066 1,067 1,070 Percentage change………………………………………………………………………..0.49 0.36 0.42 0.28 0.35 0.40 0.39 0.33 0.12 0.10 0.23
PRIMARY METALS………….…………………………….................1,240 1,251 1,260 1,272 1,281 1,293 1,301 1,312 1,323 1,330 1,341 Percentage change………………………………………………………………………..0.98 0.93 0.67 0.95 0.75 0.88 0.63 0.83 0.84 0.55 0.81
FABRICATED METAL PRODUCTS………………….. 3,616 3,643 3,677 3,701 3,743 3,725 3,711 3,701 3,692 3,684 3,680 Percentage change………………………………………………………………………..2.09 0.75 0.94 0.63 1.14 -0.47 -0.39 -0.26 -0.24 -0.22 -0.11
MACHINERY…………………………………………………………3,119 3,176 3,239 3,299 3,351 3,404 3,455 3,510 3,563 3,610 3,665 Percentage change………………………………………………………………………..1.93 1.82 1.98 1.86 1.57 1.59 1.49 1.59 1.50 1.32 1.53
COMPUTER & ELECTRONIC PRODUCTS…………… 1,539 1,626 1,710 1,799 1,895 1,993 2,102 2,212 2,329 2,448 2,585 Percentage change………………………………………………………………………..5.73 5.66 5.17 5.22 5.32 5.20 5.47 5.22 5.31 5.09 5.58
ELECTRICAL EQUIPMENT, APPLIANCES & COMPONENTS.............................................................................3,218 3,283 3,370 3,452 3,539 3,613 3,711 3,803 3,911 4,000 4,111
Percentage change………………………………………………………………………..2.51 2.03 2.65 2.44 2.52 2.08 2.71 2.50 2.83 2.28 2.78
MOTOR VEHICLES, BODIES & TRAILERS, & PARTS.............................................................................10,107 10,616 11,134 11,699 12,269 12,764 13,264 13,805 14,373 14,815 15,296
Percentage change………………………………………………………………………..6.12 5.04 4.88 5.07 4.88 4.03 3.92 4.08 4.11 3.08 3.24
OTHER TRANSPORTATION EQUIPMENT………………………………………………………………………………………………………………385 392 401 408 416 421 428 435 440 447 454 Percentage change………………………………………………………………………..2.12 1.81 2.17 1.89 1.87 1.38 1.61 1.48 1.26 1.64 1.51
FURNITURE……………………………………………………………..473 479 484 487 488 483 475 468 461 452 444 Percentage change………………………………………………………………………..2.09 1.22 1.07 0.61 0.17 -0.89 -1.76 -1.52 -1.44 -1.98 -1.76
MISCELLANEOUS DURABLE GOODS……………… 2,101 2,171 2,222 2,274 2,329 2,402 2,496 2,588 2,665 2,740 2,817 Percentage change………………………………………………………………………..2.02 3.33 2.35 2.33 2.42 3.14 3.92 3.69 2.96 2.83 2.79
NONDURABLE GOODS…………………………………. 20,017 20,355 20,673 20,966 21,278 21,606 21,925 22,249 22,576 22,856 23,170 Percentage change………………………………………………………………………..1.82 1.68 1.56 1.42 1.49 1.54 1.47 1.48 1.47 1.24 1.37
FOOD AND BEVERAGE & TOBACCO......................... 6,815 6,966 7,101 7,233 7,371 7,470 7,562 7,652 7,731 7,812 7,903 Percentage change………………………………………………………………………..2.46 2.21 1.94 1.86 1.90 1.34 1.24 1.19 1.03 1.05 1.16
Forecast DataJanuary 2016
Table 14: Tennessee Average Annual Wage and Salary Rate by Sector, Seasonally Adjusted (current dollars)
2015:2 2015:3 2015:4 2016:1 2016:2 2016:3 2016:4 2017:1 2017:2 2017:3 2017:4 2018:1 2014 2015 2016 2017
TOTAL NONFARM……………………………………………….. 47346 47481 47891 48241 48586 48925 49266 49616 49956 50303 50649 50984 45782 47219 48755 50131% Chg Prev Qtr SAAR………..…………………………… 10.68 1.14 3.50 2.96 2.89 2.82 2.82 2.87 2.77 2.81 2.78 2.67 2.62 3.14 3.25 2.82% Chg Same Qtr Last Yr……………………………….. 3.76 3.73 3.44 4.51 2.62 3.04 2.87 2.85 2.82 2.82 2.81 2.76 2.62 3.14 3.25 2.82
NATURAL RESOURCES, MINING & CONSTRUCTION…… 54764 56036 56338 56717 57094 57489 57866 58296 58734 59169 59609 60009 51513 54695 57291 58952% Chg Prev Qtr SAAR………..…………………………… 26.46 9.62 2.17 2.72 2.69 2.79 2.65 3.01 3.04 2.99 3.01 2.71 4.71 6.18 4.75 2.90% Chg Same Qtr Last Yr……………………………….. 6.18 8.25 8.61 9.83 4.26 2.59 2.71 2.78 2.87 2.92 3.01 2.94 4.71 6.18 4.75 2.90
MANUFACTURING…………………………………………… 57619 58423 59116 59605 60062 60584 61081 61537 61954 62435 62929 63334 56302 57400 60333 62214% Chg Prev Qtr SAAR………..…………………………… 25.45 5.70 4.83 3.35 3.10 3.52 3.32 3.02 2.74 3.15 3.20 2.60 2.85 1.95 5.11 3.12% Chg Same Qtr Last Yr……………………………….. 2.58 4.07 3.24 9.48 4.24 3.70 3.32 3.24 3.15 3.06 3.03 2.92 2.85 1.95 5.11 3.12
DURABLE GOODS……………………………………...... 55869 56305 56988 57331 57693 58176 58650 59072 59451 59941 60460 60849 55092 55627 57962 59731% Chg Prev Qtr SAAR………..…………………………… 20.29 3.16 4.94 2.43 2.55 3.39 3.30 2.91 2.59 3.34 3.51 2.60 3.45 0.97 4.20 3.05% Chg Same Qtr Last Yr……………………………….. 1.39 2.50 1.28 7.47 3.26 3.32 2.92 3.04 3.05 3.03 3.09 3.01 3.45 0.97 4.20 3.05
NONDURABLE GOODS…………………………….. 60716 62180 62910 63681 64330 64949 65517 66055 66566 67057 67531 67993 58379 60542 64619 66803% Chg Prev Qtr SAAR………..…………………………… 34.67 10.00 4.78 4.99 4.14 3.91 3.54 3.33 3.13 2.98 2.86 2.76 2.03 3.71 6.73 3.38% Chg Same Qtr Last Yr……………………………….. 4.70 6.82 6.65 12.98 5.95 4.45 4.14 3.73 3.48 3.24 3.07 2.93 2.03 3.71 6.73 3.38
TRADE, TRANSPORTATION, UTILITIES…………. 42794 42887 43218 43594 43970 44311 44670 45047 45414 45778 46130 46497 42242 42707 44136 45592% Chg Prev Qtr SAAR………..…………………………… 8.51 0.87 3.12 3.53 3.50 3.13 3.28 3.42 3.30 3.24 3.11 3.22 2.75 1.10 3.35 3.30% Chg Same Qtr Last Yr……………………………….. 2.84 2.02 -0.79 3.97 2.75 3.32 3.36 3.33 3.28 3.31 3.27 3.22 2.75 1.10 3.35 3.30
WHOLESALE TRADE……………………………………. 65438 65107 65624 66259 66802 67371 67904 68436 68952 69463 69949 70508 64537 64934 67084 69200% Chg Prev Qtr SAAR………..…………………………… 12.31 -2.00 3.21 3.93 3.32 3.45 3.20 3.17 3.05 3.00 2.83 3.23 3.97 0.61 3.31 3.15% Chg Same Qtr Last Yr……………………………….. 2.85 0.78 -0.50 4.24 2.09 3.48 3.47 3.28 3.22 3.10 3.01 3.03 3.97 0.61 3.31 3.15
RETAIL TRADE……………………………………………. 29138 29534 29748 29973 30226 30443 30692 30946 31202 31466 31700 31933 28895 29193 30333 31329% Chg Prev Qtr SAAR………..…………………………… 11.59 5.56 2.93 3.05 3.42 2.90 3.32 3.35 3.35 3.43 3.01 2.97 2.80 1.03 3.91 3.28% Chg Same Qtr Last Yr……………………………….. 2.77 3.31 -1.54 5.72 3.73 3.07 3.17 3.25 3.23 3.36 3.28 3.19 2.80 1.03 3.91 3.28
TRANSPORTATION & UTILITIES……………………………53522 53048 53448 53897 54358 54738 55162 55636 56083 56519 56977 57407 52602 53300 54539 56304% Chg Prev Qtr SAAR………..…………………………… 2.58 -3.49 3.05 3.40 3.47 2.82 3.14 3.48 3.25 3.15 3.28 3.05 1.71 1.33 2.32 3.24% Chg Same Qtr Last Yr……………………………….. 2.70 1.23 -0.46 1.34 1.56 3.18 3.21 3.23 3.17 3.25 3.29 3.18 1.71 1.33 2.32 3.24
INFORMATION…………………………………………………… 62396 63946 64536 65034 65505 65925 66370 66806 67331 67866 68396 68793 60999 63239 65708 67600% Chg Prev Qtr SAAR………..…………………………… 2.06 10.31 3.74 3.12 2.93 2.59 2.73 2.65 3.18 3.22 3.16 2.34 4.85 3.67 3.90 2.88% Chg Same Qtr Last Yr……………………………….. 0.94 3.55 10.10 4.76 4.98 3.09 2.84 2.72 2.79 2.94 3.05 2.97 4.85 3.67 3.90 2.88
FINANCIAL ACTIVITIES…………………………………..... 70683 71177 71949 72635 73243 73807 74348 74950 75522 76033 76539 77045 68979 70721 73508 75761% Chg Prev Qtr SAAR………..…………………………… 9.65 2.82 4.41 3.87 3.39 3.12 2.96 3.28 3.09 2.73 2.69 2.67 4.12 2.52 3.94 3.06% Chg Same Qtr Last Yr……………………………….. 3.31 3.87 2.68 5.16 3.62 3.70 3.33 3.19 3.11 3.01 2.95 2.79 4.12 2.52 3.94 3.06
January 2016
History Forecast Data Annual
(CONTINUED ON NEXT PAGE)

2016 TE
NN
ES
SE
E E
CO
NO
MIC
RE
PO
RT
| 3938 | 2016 T
EN
NE
SS
EE
EC
ON
OM
IC R
EP
OR
T
Forecast D
ata | AP
PE
ND
IX A
2015 2016 2017 2018 2019 2020 2021 2022 2023 2024 2025 TEXTILE MILLS & TEXTILE PRODUCT MILLS 441 435 429 422 415 409 402 396 390 385 380 Percentage change………………………………………………………………………..-1.57 -1.49 -1.38 -1.63 -1.56 -1.59 -1.59 -1.47 -1.51 -1.40 -1.34
APPAREL & LEATHER PRODUCTS………………………………………………………………………..303 294 285 277 269 261 254 247 241 235 230 Percentage change………………………………………………………………………..-3.00 -2.95 -2.92 -2.91 -2.84 -2.84 -2.79 -2.68 -2.56 -2.42 -2.08
PAPER………………………………………………………………………..2,776 2,818 2,861 2,904 2,950 3,001 3,053 3,103 3,152 3,201 3,247 Percentage change………………………………………………………………………..1.63 1.54 1.51 1.52 1.58 1.72 1.73 1.64 1.59 1.53 1.44
PRINTING & RELATED SUPPORT………………………………………………………………………..1,158 1,155 1,153 1,152 1,153 1,156 1,160 1,164 1,170 1,175 1,181 Percentage change………………………………………………………………………..1.55 -0.28 -0.19 -0.02 0.04 0.27 0.35 0.37 0.46 0.46 0.48
CHEMICALS………………………………………………………………………..6,157 6,328 6,494 6,634 6,783 6,978 7,163 7,355 7,557 7,705 7,876 Percentage change………………………………………………………………………..2.65 2.79 2.61 2.16 2.25 2.87 2.65 2.68 2.75 1.96 2.22
PLASTICS & RUBBER………………………………………………………………………..1,939 1,931 1,924 1,917 1,911 1,907 1,906 1,906 1,909 1,915 1,923 Percentage change………………………………………………………………………..-0.46 -0.40 -0.37 -0.34 -0.31 -0.21 -0.07 0.00 0.13 0.36 0.41
MISCELLANEOUS NONDURABLE GOODS………………429 428 427 426 425 424 425 425 427 428 430 Percentage change………………………………………………………………………..-0.35 -0.32 -0.23 -0.21 -0.15 -0.14 0.07 0.14 0.37 0.38 0.44
TRADE, TRANSPORTATION & UTILITIES………….....................……..................……..................52,904 54,018 55,058 56,189 57,446 58,646 59,970 61,303 62,635 64,095 65,661 Percentage change………………………………………………………………………..4.33 3.71 3.09 2.88 2.51 2.22 2.00 2.00 2.10 2.00 2.44
WHOLESALE TRADE……………………………………......................18,933 19,382 19,785 20,258 20,855 21,373 22,020 22,646 23,302 23,957 24,685 Percentage change………………………………………………………………………..2.75 2.37 2.08 2.39 2.95 2.48 3.03 2.84 2.90 2.81 3.04
RETAIL TRADE…………………………………………….........................19,590 19,981 20,359 20,784 21,208 21,594 22,020 22,425 22,838 23,331 23,870 Percentage change………………………………………………………………………..2.02 2.00 1.89 2.09 2.04 1.82 1.97 1.84 1.84 2.16 2.31
TRANSPORTATION & UTILITIES…………………………………………….14,382 14,655 14,914 15,147 15,382 15,679 15,929 16,232 16,495 16,807 17,106 Percentage change………………………………………………………………………..1.73 1.90 1.77 1.56 1.55 1.93 1.60 1.90 1.62 1.89 1.78
INFORMATION……………………………………………………....................................9,068 9,333 9,599 9,872 10,161 10,450 10,729 11,028 11,346 11,671 11,988 Percentage change………………………………………………………………………..2.71 2.92 2.86 2.84 2.93 2.84 2.67 2.79 2.88 2.87 2.71
FINANCIAL ACTIVITIES…………………………………............................45,432 46,518 47,644 48,773 49,958 51,017 52,190 53,401 54,581 55,689 56,876 Percentage change………………………………………………………………………..2.53 2.39 2.42 2.37 2.43 2.12 2.30 2.32 2.21 2.03 2.13
PROFESSIONAL & BUSINESS SERVICES………………………….................33,169 34,390 35,679 37,064 38,483 39,965 41,456 42,960 44,451 46,074 47,691 Percentage change………………………………………………………………………..3.99 3.68 3.75 3.88 3.83 3.85 3.73 3.63 3.47 3.65 3.51
EDUCATION & HEALTH SERVICES………………………...........................29,853 30,561 31,251 31,929 32,606 33,245 33,940 34,636 35,322 36,018 36,806 Percentage change………………………………………………………………………..2.47 2.37 2.26 2.17 2.12 1.96 2.09 2.05 1.98 1.97 2.19
LEISURE & HOSPITALITY…………………………………….....................11,960 12,311 12,514 12,737 12,951 13,182 13,398 13,612 13,831 14,090 14,349 Percentage change………………………………………………………………………..3.08 2.94 1.65 1.78 1.68 1.78 1.64 1.60 1.61 1.87 1.84
OTHER SERVICES…………………………………………............................6,477 6,414 6,380 6,325 6,274 6,230 6,186 6,148 6,114 6,082 6,060 Percentage change………………………………………………………………………..-1.01 -0.97 -0.53 -0.85 -0.82 -0.70 -0.70 -0.61 -0.56 -0.52 -0.37
GOVERNMENT………………………………………………..............................32,285 32,331 32,414 32,501 32,675 32,868 33,030 33,219 33,444 33,682 33,943 Percentage change………………………………………………………………………..0.02 0.14 0.26 0.27 0.53 0.59 0.49 0.57 0.68 0.71 0.77
FEDERAL.............................................……………………………………..7,582 7,450 7,274 7,087 6,910 6,771 6,625 6,505 6,403 6,304 6,214 Percentage change………………………………………………………………………..-1.82 -1.74 -2.36 -2.57 -2.50 -2.01 -2.16 -1.81 -1.56 -1.55 -1.43
STATE & LOCAL…………………………………………........................24,704 24,881 25,140 25,414 25,765 26,097 26,405 26,714 27,040 27,378 27,729 Percentage change………………………………………………………………………..0.60 0.72 1.04 1.09 1.38 1.29 1.18 1.17 1.22 1.25 1.28
Table 13: Tennessee Gross Domestic Product by Sector (millions of 2009 dollars)
2015 2016 2017 2018 2019 2020 2021 2022 2023 2024 2025GROSS DOMESTIC PRODUCT..........................................................................281,548 287,872 294,064 300,449 307,195 313,710 320,540 327,536 334,562 341,669 349,209 Percentage change………………………………………………………………………..2.40 2.25 2.15 2.17 2.25 2.12 2.18 2.18 2.15 2.12 2.21
NATURAL RESOURCES & MINING......................................................................................................3,216 3,343 3,468 3,594 3,721 3,850 3,978 4,106 4,229 4,353 4,486 Percentage change………………………………………………………………………..6.03 3.95 3.74 3.63 3.53 3.46 3.33 3.23 2.98 2.94 3.06
CONSTRUCTION................................................................................9,756 10,036 10,248 10,458 10,671 10,879 11,109 11,340 11,568 11,814 12,058 Percentage change………………………………………………………………………..3.12 2.87 2.11 2.05 2.03 1.95 2.12 2.08 2.01 2.12 2.07
MANUFACTURING.............................................................................47,428 48,617 49,807 51,005 52,249 53,379 54,554 55,781 57,041 58,101 59,291 Percentage change………………………………………………………………………..2.86 2.51 2.45 2.41 2.44 2.16 2.20 2.25 2.26 1.86 2.05
DURABLE GOODS........................................................................27,410 28,262 29,134 30,039 30,971 31,773 32,629 33,532 34,465 35,245 36,122 Percentage change………………………………………………………………………..3.63 3.11 3.08 3.11 3.10 2.59 2.69 2.77 2.78 2.26 2.49
WOOD PRODUCTS………………………………………….............575 583 591 600 608 617 625 633 642 651 660 Percentage change………………………………………………………………………..1.01 1.49 1.37 1.48 1.29 1.50 1.27 1.34 1.41 1.40 1.47
NONMETALLIC MINERAL PRODUCTS……………………………..1,038 1,042 1,046 1,049 1,053 1,057 1,061 1,065 1,066 1,067 1,070 Percentage change………………………………………………………………………..0.49 0.36 0.42 0.28 0.35 0.40 0.39 0.33 0.12 0.10 0.23
PRIMARY METALS………….…………………………….................1,240 1,251 1,260 1,272 1,281 1,293 1,301 1,312 1,323 1,330 1,341 Percentage change………………………………………………………………………..0.98 0.93 0.67 0.95 0.75 0.88 0.63 0.83 0.84 0.55 0.81
FABRICATED METAL PRODUCTS………………….. 3,616 3,643 3,677 3,701 3,743 3,725 3,711 3,701 3,692 3,684 3,680 Percentage change………………………………………………………………………..2.09 0.75 0.94 0.63 1.14 -0.47 -0.39 -0.26 -0.24 -0.22 -0.11
MACHINERY…………………………………………………………3,119 3,176 3,239 3,299 3,351 3,404 3,455 3,510 3,563 3,610 3,665 Percentage change………………………………………………………………………..1.93 1.82 1.98 1.86 1.57 1.59 1.49 1.59 1.50 1.32 1.53
COMPUTER & ELECTRONIC PRODUCTS…………… 1,539 1,626 1,710 1,799 1,895 1,993 2,102 2,212 2,329 2,448 2,585 Percentage change………………………………………………………………………..5.73 5.66 5.17 5.22 5.32 5.20 5.47 5.22 5.31 5.09 5.58
ELECTRICAL EQUIPMENT, APPLIANCES & COMPONENTS.............................................................................3,218 3,283 3,370 3,452 3,539 3,613 3,711 3,803 3,911 4,000 4,111
Percentage change………………………………………………………………………..2.51 2.03 2.65 2.44 2.52 2.08 2.71 2.50 2.83 2.28 2.78
MOTOR VEHICLES, BODIES & TRAILERS, & PARTS.............................................................................10,107 10,616 11,134 11,699 12,269 12,764 13,264 13,805 14,373 14,815 15,296
Percentage change………………………………………………………………………..6.12 5.04 4.88 5.07 4.88 4.03 3.92 4.08 4.11 3.08 3.24
OTHER TRANSPORTATION EQUIPMENT………………………………………………………………………………………………………………385 392 401 408 416 421 428 435 440 447 454 Percentage change………………………………………………………………………..2.12 1.81 2.17 1.89 1.87 1.38 1.61 1.48 1.26 1.64 1.51
FURNITURE……………………………………………………………..473 479 484 487 488 483 475 468 461 452 444 Percentage change………………………………………………………………………..2.09 1.22 1.07 0.61 0.17 -0.89 -1.76 -1.52 -1.44 -1.98 -1.76
MISCELLANEOUS DURABLE GOODS……………… 2,101 2,171 2,222 2,274 2,329 2,402 2,496 2,588 2,665 2,740 2,817 Percentage change………………………………………………………………………..2.02 3.33 2.35 2.33 2.42 3.14 3.92 3.69 2.96 2.83 2.79
NONDURABLE GOODS…………………………………. 20,017 20,355 20,673 20,966 21,278 21,606 21,925 22,249 22,576 22,856 23,170 Percentage change………………………………………………………………………..1.82 1.68 1.56 1.42 1.49 1.54 1.47 1.48 1.47 1.24 1.37
FOOD AND BEVERAGE & TOBACCO......................... 6,815 6,966 7,101 7,233 7,371 7,470 7,562 7,652 7,731 7,812 7,903 Percentage change………………………………………………………………………..2.46 2.21 1.94 1.86 1.90 1.34 1.24 1.19 1.03 1.05 1.16
Forecast DataJanuary 2016
2015 2016 2017 2018 2019 2020 2021 2022 2023 2024 2025
Center for Business and Economic Research, University of Tennessee Tennessee Econometric Model
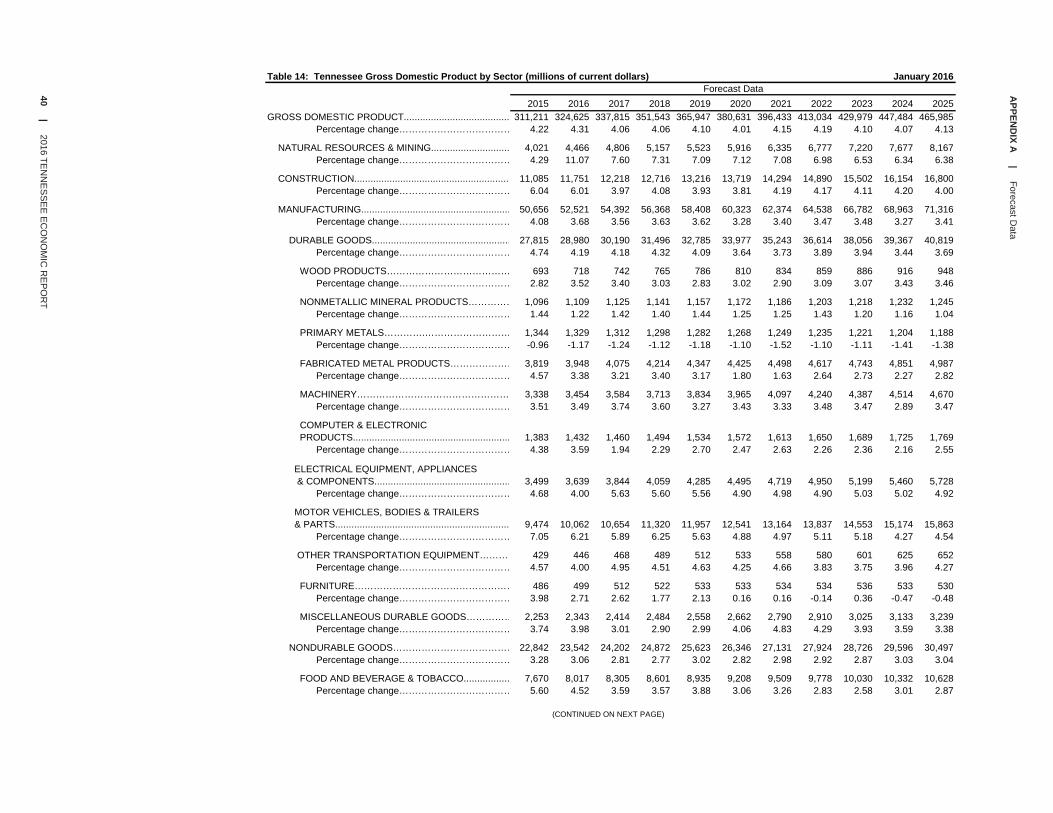
2016 TE
NN
ES
SE
E E
CO
NO
MIC
RE
PO
RT
| 4140 | 2016 T
EN
NE
SS
EE
EC
ON
OM
IC R
EP
OR
T
AP
PE
ND
IX A
| Forecast D
ata
Table 14: Tennessee Average Annual Wage and Salary Rate by Sector, Seasonally Adjusted (current dollars)
2015:2 2015:3 2015:4 2016:1 2016:2 2016:3 2016:4 2017:1 2017:2 2017:3 2017:4 2018:1 2014 2015 2016 2017
TOTAL NONFARM……………………………………………….. 47346 47481 47891 48241 48586 48925 49266 49616 49956 50303 50649 50984 45782 47219 48755 50131% Chg Prev Qtr SAAR………..…………………………… 10.68 1.14 3.50 2.96 2.89 2.82 2.82 2.87 2.77 2.81 2.78 2.67 2.62 3.14 3.25 2.82% Chg Same Qtr Last Yr……………………………….. 3.76 3.73 3.44 4.51 2.62 3.04 2.87 2.85 2.82 2.82 2.81 2.76 2.62 3.14 3.25 2.82
NATURAL RESOURCES, MINING & CONSTRUCTION…… 54764 56036 56338 56717 57094 57489 57866 58296 58734 59169 59609 60009 51513 54695 57291 58952% Chg Prev Qtr SAAR………..…………………………… 26.46 9.62 2.17 2.72 2.69 2.79 2.65 3.01 3.04 2.99 3.01 2.71 4.71 6.18 4.75 2.90% Chg Same Qtr Last Yr……………………………….. 6.18 8.25 8.61 9.83 4.26 2.59 2.71 2.78 2.87 2.92 3.01 2.94 4.71 6.18 4.75 2.90
MANUFACTURING…………………………………………… 57619 58423 59116 59605 60062 60584 61081 61537 61954 62435 62929 63334 56302 57400 60333 62214% Chg Prev Qtr SAAR………..…………………………… 25.45 5.70 4.83 3.35 3.10 3.52 3.32 3.02 2.74 3.15 3.20 2.60 2.85 1.95 5.11 3.12% Chg Same Qtr Last Yr……………………………….. 2.58 4.07 3.24 9.48 4.24 3.70 3.32 3.24 3.15 3.06 3.03 2.92 2.85 1.95 5.11 3.12
DURABLE GOODS……………………………………...... 55869 56305 56988 57331 57693 58176 58650 59072 59451 59941 60460 60849 55092 55627 57962 59731% Chg Prev Qtr SAAR………..…………………………… 20.29 3.16 4.94 2.43 2.55 3.39 3.30 2.91 2.59 3.34 3.51 2.60 3.45 0.97 4.20 3.05% Chg Same Qtr Last Yr……………………………….. 1.39 2.50 1.28 7.47 3.26 3.32 2.92 3.04 3.05 3.03 3.09 3.01 3.45 0.97 4.20 3.05
NONDURABLE GOODS…………………………….. 60716 62180 62910 63681 64330 64949 65517 66055 66566 67057 67531 67993 58379 60542 64619 66803% Chg Prev Qtr SAAR………..…………………………… 34.67 10.00 4.78 4.99 4.14 3.91 3.54 3.33 3.13 2.98 2.86 2.76 2.03 3.71 6.73 3.38% Chg Same Qtr Last Yr……………………………….. 4.70 6.82 6.65 12.98 5.95 4.45 4.14 3.73 3.48 3.24 3.07 2.93 2.03 3.71 6.73 3.38
TRADE, TRANSPORTATION, UTILITIES…………. 42794 42887 43218 43594 43970 44311 44670 45047 45414 45778 46130 46497 42242 42707 44136 45592% Chg Prev Qtr SAAR………..…………………………… 8.51 0.87 3.12 3.53 3.50 3.13 3.28 3.42 3.30 3.24 3.11 3.22 2.75 1.10 3.35 3.30% Chg Same Qtr Last Yr……………………………….. 2.84 2.02 -0.79 3.97 2.75 3.32 3.36 3.33 3.28 3.31 3.27 3.22 2.75 1.10 3.35 3.30
WHOLESALE TRADE……………………………………. 65438 65107 65624 66259 66802 67371 67904 68436 68952 69463 69949 70508 64537 64934 67084 69200% Chg Prev Qtr SAAR………..…………………………… 12.31 -2.00 3.21 3.93 3.32 3.45 3.20 3.17 3.05 3.00 2.83 3.23 3.97 0.61 3.31 3.15% Chg Same Qtr Last Yr……………………………….. 2.85 0.78 -0.50 4.24 2.09 3.48 3.47 3.28 3.22 3.10 3.01 3.03 3.97 0.61 3.31 3.15
RETAIL TRADE……………………………………………. 29138 29534 29748 29973 30226 30443 30692 30946 31202 31466 31700 31933 28895 29193 30333 31329% Chg Prev Qtr SAAR………..…………………………… 11.59 5.56 2.93 3.05 3.42 2.90 3.32 3.35 3.35 3.43 3.01 2.97 2.80 1.03 3.91 3.28% Chg Same Qtr Last Yr……………………………….. 2.77 3.31 -1.54 5.72 3.73 3.07 3.17 3.25 3.23 3.36 3.28 3.19 2.80 1.03 3.91 3.28
TRANSPORTATION & UTILITIES……………………………53522 53048 53448 53897 54358 54738 55162 55636 56083 56519 56977 57407 52602 53300 54539 56304% Chg Prev Qtr SAAR………..…………………………… 2.58 -3.49 3.05 3.40 3.47 2.82 3.14 3.48 3.25 3.15 3.28 3.05 1.71 1.33 2.32 3.24% Chg Same Qtr Last Yr……………………………….. 2.70 1.23 -0.46 1.34 1.56 3.18 3.21 3.23 3.17 3.25 3.29 3.18 1.71 1.33 2.32 3.24
INFORMATION…………………………………………………… 62396 63946 64536 65034 65505 65925 66370 66806 67331 67866 68396 68793 60999 63239 65708 67600% Chg Prev Qtr SAAR………..…………………………… 2.06 10.31 3.74 3.12 2.93 2.59 2.73 2.65 3.18 3.22 3.16 2.34 4.85 3.67 3.90 2.88% Chg Same Qtr Last Yr……………………………….. 0.94 3.55 10.10 4.76 4.98 3.09 2.84 2.72 2.79 2.94 3.05 2.97 4.85 3.67 3.90 2.88
FINANCIAL ACTIVITIES…………………………………..... 70683 71177 71949 72635 73243 73807 74348 74950 75522 76033 76539 77045 68979 70721 73508 75761% Chg Prev Qtr SAAR………..…………………………… 9.65 2.82 4.41 3.87 3.39 3.12 2.96 3.28 3.09 2.73 2.69 2.67 4.12 2.52 3.94 3.06% Chg Same Qtr Last Yr……………………………….. 3.31 3.87 2.68 5.16 3.62 3.70 3.33 3.19 3.11 3.01 2.95 2.79 4.12 2.52 3.94 3.06
January 2016
History Forecast Data Annual
(CONTINUED ON NEXT PAGE)
Table 14: Tennessee Gross Domestic Product by Sector (millions of current dollars)
2015 2016 2017 2018 2019 2020 2021 2022 2023 2024 2025GROSS DOMESTIC PRODUCT..........................................................................311,211 324,625 337,815 351,543 365,947 380,631 396,433 413,034 429,979 447,484 465,985 Percentage change………………………………………………………………………..4.22 4.31 4.06 4.06 4.10 4.01 4.15 4.19 4.10 4.07 4.13
NATURAL RESOURCES & MINING......................................................................................................4,021 4,466 4,806 5,157 5,523 5,916 6,335 6,777 7,220 7,677 8,167 Percentage change………………………………………………………………………..4.29 11.07 7.60 7.31 7.09 7.12 7.08 6.98 6.53 6.34 6.38
CONSTRUCTION................................................................................11,085 11,751 12,218 12,716 13,216 13,719 14,294 14,890 15,502 16,154 16,800 Percentage change………………………………………………………………………..6.04 6.01 3.97 4.08 3.93 3.81 4.19 4.17 4.11 4.20 4.00
MANUFACTURING.............................................................................50,656 52,521 54,392 56,368 58,408 60,323 62,374 64,538 66,782 68,963 71,316 Percentage change………………………………………………………………………..4.08 3.68 3.56 3.63 3.62 3.28 3.40 3.47 3.48 3.27 3.41
DURABLE GOODS........................................................................27,815 28,980 30,190 31,496 32,785 33,977 35,243 36,614 38,056 39,367 40,819 Percentage change………………………………………………………………………..4.74 4.19 4.18 4.32 4.09 3.64 3.73 3.89 3.94 3.44 3.69
WOOD PRODUCTS………………………………………….............693 718 742 765 786 810 834 859 886 916 948 Percentage change………………………………………………………………………..2.82 3.52 3.40 3.03 2.83 3.02 2.90 3.09 3.07 3.43 3.46
NONMETALLIC MINERAL PRODUCTS……………………………..1,096 1,109 1,125 1,141 1,157 1,172 1,186 1,203 1,218 1,232 1,245 Percentage change………………………………………………………………………..1.44 1.22 1.42 1.40 1.44 1.25 1.25 1.43 1.20 1.16 1.04
PRIMARY METALS………….…………………………….................1,344 1,329 1,312 1,298 1,282 1,268 1,249 1,235 1,221 1,204 1,188 Percentage change………………………………………………………………………..-0.96 -1.17 -1.24 -1.12 -1.18 -1.10 -1.52 -1.10 -1.11 -1.41 -1.38
FABRICATED METAL PRODUCTS………………….. 3,819 3,948 4,075 4,214 4,347 4,425 4,498 4,617 4,743 4,851 4,987 Percentage change………………………………………………………………………..4.57 3.38 3.21 3.40 3.17 1.80 1.63 2.64 2.73 2.27 2.82
MACHINERY…………………………………………………………3,338 3,454 3,584 3,713 3,834 3,965 4,097 4,240 4,387 4,514 4,670 Percentage change………………………………………………………………………..3.51 3.49 3.74 3.60 3.27 3.43 3.33 3.48 3.47 2.89 3.47
COMPUTER & ELECTRONIC PRODUCTS.............................................................................1,383 1,432 1,460 1,494 1,534 1,572 1,613 1,650 1,689 1,725 1,769
Percentage change………………………………………………………………………..4.38 3.59 1.94 2.29 2.70 2.47 2.63 2.26 2.36 2.16 2.55
ELECTRICAL EQUIPMENT, APPLIANCES & COMPONENTS.............................................................................3,499 3,639 3,844 4,059 4,285 4,495 4,719 4,950 5,199 5,460 5,728 Percentage change………………………………………………………………………..4.68 4.00 5.63 5.60 5.56 4.90 4.98 4.90 5.03 5.02 4.92
MOTOR VEHICLES, BODIES & TRAILERS & PARTS.............................................................................9,474 10,062 10,654 11,320 11,957 12,541 13,164 13,837 14,553 15,174 15,863
Percentage change………………………………………………………………………..7.05 6.21 5.89 6.25 5.63 4.88 4.97 5.11 5.18 4.27 4.54
OTHER TRANSPORTATION EQUIPMENT………………………………………………………………………………………………………………429 446 468 489 512 533 558 580 601 625 652 Percentage change………………………………………………………………………..4.57 4.00 4.95 4.51 4.63 4.25 4.66 3.83 3.75 3.96 4.27
FURNITURE……………………………………………………………..486 499 512 522 533 533 534 534 536 533 530 Percentage change………………………………………………………………………..3.98 2.71 2.62 1.77 2.13 0.16 0.16 -0.14 0.36 -0.47 -0.48
MISCELLANEOUS DURABLE GOODS……………… 2,253 2,343 2,414 2,484 2,558 2,662 2,790 2,910 3,025 3,133 3,239 Percentage change………………………………………………………………………..3.74 3.98 3.01 2.90 2.99 4.06 4.83 4.29 3.93 3.59 3.38
NONDURABLE GOODS………………………………….22,842 23,542 24,202 24,872 25,623 26,346 27,131 27,924 28,726 29,596 30,497 Percentage change………………………………………………………………………..3.28 3.06 2.81 2.77 3.02 2.82 2.98 2.92 2.87 3.03 3.04
FOOD AND BEVERAGE & TOBACCO.........................7,670 8,017 8,305 8,601 8,935 9,208 9,509 9,778 10,030 10,332 10,628 Percentage change………………………………………………………………………..5.60 4.52 3.59 3.57 3.88 3.06 3.26 2.83 2.58 3.01 2.87
Forecast DataJanuary 2016

2016 TE
NN
ES
SE
E E
CO
NO
MIC
RE
PO
RT
| 4140 | 2016 T
EN
NE
SS
EE
EC
ON
OM
IC R
EP
OR
T
Forecast D
ata | AP
PE
ND
IX A
2015 2016 2017 2018 2019 2020 2021 2022 2023 2024 2025 TEXTILE MILLS & TEXTILE PRODUCT MILLS 464 458 455 452 449 444 441 438 434 432 430 Percentage change………………………………………………………………………..-2.31 -1.23 -0.62 -0.77 -0.65 -1.00 -0.72 -0.61 -0.94 -0.57 -0.38
APPAREL & LEATHER PRODUCTS………………………………………………………………………..296 283 271 261 252 244 235 228 221 214 209 Percentage change………………………………………………………………………..-3.37 -4.28 -4.25 -3.77 -3.42 -3.40 -3.34 -3.26 -3.13 -2.96 -2.62
PAPER………………………………………………………………………..3,151 3,261 3,371 3,491 3,616 3,756 3,905 4,057 4,209 4,362 4,516 Percentage change………………………………………………………………………..3.63 3.49 3.38 3.56 3.60 3.86 3.96 3.89 3.76 3.63 3.53
PRINTING & RELATED SUPPORT………………………………………………………………………..1,099 1,104 1,099 1,097 1,098 1,101 1,104 1,108 1,113 1,118 1,124 Percentage change………………………………………………………………………..2.92 0.47 -0.43 -0.16 0.04 0.25 0.35 0.34 0.44 0.47 0.50
CHEMICALS………………………………………………………………………..859 902 943 983 1,025 1,074 1,123 1,175 1,231 1,281 1,336 Percentage change………………………………………………………………………..4.86 4.95 4.59 4.25 4.23 4.78 4.59 4.59 4.77 4.06 4.32
PLASTICS & RUBBER………………………………………………………………………..7,136 7,311 7,507 7,696 7,912 8,134 8,372 8,630 8,912 9,219 9,530 Percentage change………………………………………………………………………..1.59 2.45 2.68 2.51 2.81 2.80 2.93 3.08 3.27 3.44 3.37
MISCELLANEOUS NONDURABLE GOODS………………2,166 2,206 2,250 2,291 2,337 2,385 2,441 2,510 2,576 2,638 2,724 Percentage change………………………………………………………………………..2.22 1.81 2.03 1.81 1.99 2.09 2.33 2.84 2.60 2.43 3.26
TRADE, TRANSPORTATION & UTILITIES………….....................……..................……..................59,227 61,691 64,147 66,823 69,726 72,730 76,055 79,534 83,067 86,829 90,844 Percentage change………………………………………………………………………..4.18 4.16 3.98 4.17 4.34 4.31 4.57 4.57 4.44 4.53 4.62
WHOLESALE TRADE……………………………………......................21,686 22,786 23,779 24,892 26,199 27,481 29,010 30,576 32,215 33,887 35,713 Percentage change………………………………………………………………………..5.40 5.07 4.36 4.68 5.25 4.89 5.56 5.40 5.36 5.19 5.39
RETAIL TRADE…………………………………………….........................21,375 22,088 22,918 23,826 24,737 25,646 26,643 27,657 28,694 29,846 31,087 Percentage change………………………………………………………………………..3.10 3.33 3.76 3.96 3.82 3.68 3.89 3.81 3.75 4.02 4.16
TRANSPORTATION & UTILITIES…………………………………………….16,166 16,817 17,450 18,105 18,790 19,602 20,402 21,301 22,158 23,096 24,044 Percentage change………………………………………………………………………..4.02 4.03 3.76 3.75 3.79 4.32 4.08 4.41 4.03 4.23 4.11
INFORMATION……………………………………………………....................................8,975 9,191 9,414 9,645 9,889 10,117 10,329 10,569 10,823 11,061 11,311 Percentage change………………………………………………………………………..1.80 2.41 2.43 2.45 2.53 2.31 2.10 2.33 2.40 2.20 2.26
FINANCIAL ACTIVITIES…………………………………............................50,981 53,525 55,905 58,290 60,777 63,198 65,862 68,675 71,509 74,315 77,316 Percentage change………………………………………………………………………..4.86 4.99 4.45 4.27 4.27 3.98 4.22 4.27 4.13 3.92 4.04
PROFESSIONAL & BUSINESS SERVICES………………………….................35,854 37,853 40,074 42,410 44,829 47,458 50,226 53,107 56,011 59,129 62,339 Percentage change………………………………………………………………………..6.14 5.57 5.87 5.83 5.70 5.86 5.83 5.74 5.47 5.57 5.43
EDUCATION & HEALTH SERVICES………………………...........................32,949 34,300 35,640 36,983 38,391 39,762 41,246 42,791 44,379 46,044 47,868 Percentage change………………………………………………………………………..4.23 4.10 3.91 3.77 3.81 3.57 3.73 3.75 3.71 3.75 3.96
LEISURE & HOSPITALITY…………………………………….....................13,245 13,987 14,562 15,167 15,748 16,397 17,082 17,797 18,537 19,341 20,151 Percentage change………………………………………………………………………..5.12 5.61 4.11 4.16 3.83 4.12 4.18 4.19 4.16 4.34 4.19
OTHER SERVICES…………………………………………............................7,560 7,670 7,861 8,013 8,171 8,349 8,534 8,733 8,940 9,146 9,367 Percentage change………………………………………………………………………..1.63 1.46 2.48 1.94 1.98 2.18 2.21 2.34 2.37 2.31 2.41
GOVERNMENT………………………………………………..............................36,657 37,668 38,797 39,971 41,268 42,663 44,097 45,623 47,208 48,824 50,508 Percentage change………………………………………………………………………..2.02 2.76 3.00 3.03 3.25 3.38 3.36 3.46 3.47 3.42 3.45
FEDERAL.............................................……………………………………..8,523 8,532 8,456 8,395 8,346 8,333 8,310 8,322 8,357 8,386 8,419 Percentage change………………………………………………………………………..-0.16 0.10 -0.89 -0.71 -0.59 -0.15 -0.28 0.14 0.42 0.36 0.39
STATE & LOCAL…………………………………………........................28,134 29,136 30,341 31,575 32,922 34,330 35,787 37,301 38,851 40,438 42,089 Percentage change………………………………………………………………………..2.70 3.56 4.13 4.07 4.27 4.28 4.24 4.23 4.15 4.08 4.08
Table 14: Tennessee Gross Domestic Product by Sector (millions of current dollars)
2015 2016 2017 2018 2019 2020 2021 2022 2023 2024 2025GROSS DOMESTIC PRODUCT..........................................................................311,211 324,625 337,815 351,543 365,947 380,631 396,433 413,034 429,979 447,484 465,985 Percentage change………………………………………………………………………..4.22 4.31 4.06 4.06 4.10 4.01 4.15 4.19 4.10 4.07 4.13
NATURAL RESOURCES & MINING......................................................................................................4,021 4,466 4,806 5,157 5,523 5,916 6,335 6,777 7,220 7,677 8,167 Percentage change………………………………………………………………………..4.29 11.07 7.60 7.31 7.09 7.12 7.08 6.98 6.53 6.34 6.38
CONSTRUCTION................................................................................11,085 11,751 12,218 12,716 13,216 13,719 14,294 14,890 15,502 16,154 16,800 Percentage change………………………………………………………………………..6.04 6.01 3.97 4.08 3.93 3.81 4.19 4.17 4.11 4.20 4.00
MANUFACTURING.............................................................................50,656 52,521 54,392 56,368 58,408 60,323 62,374 64,538 66,782 68,963 71,316 Percentage change………………………………………………………………………..4.08 3.68 3.56 3.63 3.62 3.28 3.40 3.47 3.48 3.27 3.41
DURABLE GOODS........................................................................27,815 28,980 30,190 31,496 32,785 33,977 35,243 36,614 38,056 39,367 40,819 Percentage change………………………………………………………………………..4.74 4.19 4.18 4.32 4.09 3.64 3.73 3.89 3.94 3.44 3.69
WOOD PRODUCTS………………………………………….............693 718 742 765 786 810 834 859 886 916 948 Percentage change………………………………………………………………………..2.82 3.52 3.40 3.03 2.83 3.02 2.90 3.09 3.07 3.43 3.46
NONMETALLIC MINERAL PRODUCTS……………………………..1,096 1,109 1,125 1,141 1,157 1,172 1,186 1,203 1,218 1,232 1,245 Percentage change………………………………………………………………………..1.44 1.22 1.42 1.40 1.44 1.25 1.25 1.43 1.20 1.16 1.04
PRIMARY METALS………….…………………………….................1,344 1,329 1,312 1,298 1,282 1,268 1,249 1,235 1,221 1,204 1,188 Percentage change………………………………………………………………………..-0.96 -1.17 -1.24 -1.12 -1.18 -1.10 -1.52 -1.10 -1.11 -1.41 -1.38
FABRICATED METAL PRODUCTS………………….. 3,819 3,948 4,075 4,214 4,347 4,425 4,498 4,617 4,743 4,851 4,987 Percentage change………………………………………………………………………..4.57 3.38 3.21 3.40 3.17 1.80 1.63 2.64 2.73 2.27 2.82
MACHINERY…………………………………………………………3,338 3,454 3,584 3,713 3,834 3,965 4,097 4,240 4,387 4,514 4,670 Percentage change………………………………………………………………………..3.51 3.49 3.74 3.60 3.27 3.43 3.33 3.48 3.47 2.89 3.47
COMPUTER & ELECTRONIC PRODUCTS.............................................................................1,383 1,432 1,460 1,494 1,534 1,572 1,613 1,650 1,689 1,725 1,769
Percentage change………………………………………………………………………..4.38 3.59 1.94 2.29 2.70 2.47 2.63 2.26 2.36 2.16 2.55
ELECTRICAL EQUIPMENT, APPLIANCES & COMPONENTS.............................................................................3,499 3,639 3,844 4,059 4,285 4,495 4,719 4,950 5,199 5,460 5,728 Percentage change………………………………………………………………………..4.68 4.00 5.63 5.60 5.56 4.90 4.98 4.90 5.03 5.02 4.92
MOTOR VEHICLES, BODIES & TRAILERS & PARTS.............................................................................9,474 10,062 10,654 11,320 11,957 12,541 13,164 13,837 14,553 15,174 15,863
Percentage change………………………………………………………………………..7.05 6.21 5.89 6.25 5.63 4.88 4.97 5.11 5.18 4.27 4.54
OTHER TRANSPORTATION EQUIPMENT………………………………………………………………………………………………………………429 446 468 489 512 533 558 580 601 625 652 Percentage change………………………………………………………………………..4.57 4.00 4.95 4.51 4.63 4.25 4.66 3.83 3.75 3.96 4.27
FURNITURE……………………………………………………………..486 499 512 522 533 533 534 534 536 533 530 Percentage change………………………………………………………………………..3.98 2.71 2.62 1.77 2.13 0.16 0.16 -0.14 0.36 -0.47 -0.48
MISCELLANEOUS DURABLE GOODS……………… 2,253 2,343 2,414 2,484 2,558 2,662 2,790 2,910 3,025 3,133 3,239 Percentage change………………………………………………………………………..3.74 3.98 3.01 2.90 2.99 4.06 4.83 4.29 3.93 3.59 3.38
NONDURABLE GOODS………………………………….22,842 23,542 24,202 24,872 25,623 26,346 27,131 27,924 28,726 29,596 30,497 Percentage change………………………………………………………………………..3.28 3.06 2.81 2.77 3.02 2.82 2.98 2.92 2.87 3.03 3.04
FOOD AND BEVERAGE & TOBACCO.........................7,670 8,017 8,305 8,601 8,935 9,208 9,509 9,778 10,030 10,332 10,628 Percentage change………………………………………………………………………..5.60 4.52 3.59 3.57 3.88 3.06 3.26 2.83 2.58 3.01 2.87
Forecast DataJanuary 2016
2015 2016 2017 2018 2019 2020 2021 2022 2023 2024 2025
Center for Business and Economic Research, University of Tennessee Tennessee Econometric Model

2016 TENNESSEE ECONOMIC REPORT | 4342 | 2016 TENNESSEE ECONOMIC REPORT

2016 TENNESSEE ECONOMIC REPORT | 4342 | 2016 TENNESSEE ECONOMIC REPORT
Historical Data | APPENDIX B
APPENDIX B: HISTORICAL DATA
Quarterly History Tables
Table 1: Selected U.S. and Tennessee Economic Indicators, Seasonally Adjusted ...................................................................................................44Table 2: Selected Per Capita U.S. and Tennessee Economic Indicators, Seasonally Adjusted .................................................................................46Table 3: Tennessee Personal Income Components, Seasonally Adjusted Annual Rates (millions of 2009 dollars) ..................................................47Table 4: Tennessee Personal Income Components, Seasonally Adjusted Annual Rates (millions of current dollars))..............................................48Table 5: Tennessee Nonfarm Employment by Sector, Not Seasonally Adjusted (thousands of jobs) ........................................................................49Table 6: Tennessee Durable Goods Manufacturing Employment, Not Seasonally Adjusted (thousands of jobs) ......................................................50Table 7: Tennessee Nondurable Goods Manufacturing Employment, Not Seasonally Adjusted (thousands of jobs) ................................................51Table 8: Tennessee Nonfarm Employment by Sector, Seasonally Adjusted (thousands of jobs) ..............................................................................52Table 9: Tennessee Durable Goods Manufacturing Employment, Seasonally Adjusted (thousands of jobs) ............................................................54Table 10: Tennessee Nondurable Goods Manufacturing Employment, Seasonally Adjusted (thousands of jobs) ......................................................55Table 11: Tennessee Average Annual Wage and Salary Rate by Sector, Not Seasonally Adjusted (2009 dollars) .....................................................56Table 12: Tennessee Average Annual Wage and Salary Rate by Sector, Seasonally Adjusted (2009 dollars) ...........................................................57Table 13: Tennessee Average Annual Wage and Salary Rate by Sector, Not Seasonally Adjusted (current dollars) ..................................................59Table 14: Tennessee Average Annual Wage and Salary Rate by Sector, Seasonally Adjusted (current dollars) ........................................................60Table 15: Tennessee Civilian Labor Force and Unemployment Rate, Not Seasonally Adjusted..................................................................................62Table 16: Tennessee Civilian Labor Force and Unemployment Rate, Seasonally Adjusted ........................................................................................63Table 17: Tennessee Taxable Sales, Not Seasonally Adjusted (millions of 2009 dollars) ............................................................................................64Table 18: Tennessee Taxable Sales, Seasonally Adjusted (millions of 2009 dollars) ...................................................................................................65Table 19: Tennessee Taxable Sales, Not Seasonally Adjusted (millions of current dollars) .........................................................................................66Table 20: Tennessee Taxable Sales, Seasonally Adjusted (millions of current dollars) ...............................................................................................67
Annual History Tables
Table 1: Selected U.S. and Tennessee Economic Indicators......................................................................................................................................68Table 2: Selected Per Capita U.S. and Tennessee Economic Indicators ....................................................................................................................69Table 3: Tennessee Personal Income Components (millions of 2009 dollars) ...........................................................................................................70Table 4: Tennessee Personal Income Components (millions of current dollars) ........................................................................................................71Table 5: Tennessee Nonfarm Employment by Sector (thousands of jobs) .................................................................................................................72Table 6: Tennessee Durable Goods Manufacturing Employment (thousands of jobs) ...............................................................................................73Table 7: Tennessee Nondurable Goods Manufacturing Employment (thousands of jobs) .........................................................................................74Table 8: Tennessee Average Annual Wage and Salary Rate by Sector (2009 dollars) ..............................................................................................75Table 9: Tennessee Average Annual Wage and Salary Rate by Sector (current dollars) ...........................................................................................76Table 10: Tennessee Civilian Labor Force and Unemployment Rate ...........................................................................................................................77Table 11: Tennessee Taxable Sales (millions of 2009 dollars) .....................................................................................................................................78Table 12: Tennessee Taxable Sales (millions of current dollars) ..................................................................................................................................79Table 13: Tennessee Gross Domestic Product by Sector (millions of 2009 dollars) ....................................................................................................80Table 14: Tennessee Gross Domestic Product by Sector (millions of current dollars) .................................................................................................82
In this section—
Appendix B: Historical Data
Quarterly pages 44–67 (2012:2 to 2015:3) Annual pages 68–82 (2003 to 2014)

2016 TE
NN
ES
SE
E E
CO
NO
MIC
RE
PO
RT
| 4544 | 2016 T
EN
NE
SS
EE
EC
ON
OM
IC R
EP
OR
T
AP
PE
ND
IX B
| Historical D
ata
Table 1: Selected U.S. and Tennessee Economic Indicators, Seasonally Adjusted
2012:3 2012:4 2013:1 2013:2 2013:3 2013:4 2014:1 2014:2 2014:3 2014:4 2015:1 2015:2 2015:3 2015:4 2012 2013 2014
US GDP (Bil2009$) SAAR………………………15380.8 15384.3 15457.2 15500.2 15614.4 15761.5 15724.9 15901.5 16068.8 16151.4 16177.3 16333.6 16414.0 16462.5 15354.6 15583.3 15961.7% Chg Prev Qtr SAAR……………………… 0.48 0.09 1.91 1.12 2.98 3.82 -0.93 4.57 4.28 2.07 0.64 3.92 1.98 1.19 2.22 1.49 2.43% Chg Same Qtr Last Yr…………………… 2.39 1.28 1.09 0.90 1.52 2.45 1.73 2.59 2.91 2.47 2.88 2.72 2.15 1.93 2.22 1.49 2.43
US GDP (Bil$) SAAR……………………………16227.9 16297.3 16440.7 16526.8 16727.5 16957.6 16984.3 17270.0 17522.1 17615.9 17649.3 17913.7 18060.2 18181.2 16155.3 16663.2 17348.1% Chg Prev Qtr SAAR……………………… 2.66 1.72 3.57 2.11 4.95 5.62 0.63 6.90 5.97 2.16 0.76 6.13 3.31 2.71 4.11 3.14 4.11% Chg Same Qtr Last Yr…………………… 4.11 3.24 2.92 2.51 3.08 4.05 3.31 4.50 4.75 3.88 3.92 3.73 3.07 3.21 4.11 3.14 4.11
TN PERSONAL INCOME (MIL2009$) SAAR…237772 241833 236631 237037 237691 238407 240048 241798 243093 246452 249416 252618 254215 257680 238054 237442 242848% Chg Prev Qtr SAAR……………………… 0.34 7.01 -8.33 0.69 1.11 1.21 2.78 2.95 2.16 5.64 4.90 5.23 2.55 5.56 3.82 -0.26 2.28% Chg Same Qtr Last Yr…………………… 3.45 4.95 0.68 -0.22 -0.03 -1.42 1.44 2.01 2.27 3.37 3.90 4.47 4.58 4.56 3.82 -0.26 2.28
US PERSONAL INCOME (BIL2009$) SAAR… 13054 13405 12962 13073 13122 13154 13298 13392 13500 13680 13861 13965 14095 14224 13112 13078 13468% Chg Prev Qtr SAAR……………………… 0.22 11.21 -12.56 3.46 1.52 0.98 4.44 2.86 3.28 5.45 5.38 3.06 3.76 3.73 3.03 -0.26 2.98% Chg Same Qtr Last Yr…………………… 2.29 5.01 0.15 0.20 0.53 -1.87 2.59 2.44 2.88 4.00 4.23 4.28 4.41 3.98 3.03 -0.26 2.98
TN PERSONAL INCOME (MIL$) SAAR………252589 258288 253588 254303 256060 257738 260548 263843 266044 269426 271353 276341 278958 282614 252636 255422 264965% Chg Prev Qtr SAAR……………………… 1.66 9.33 -7.08 1.13 2.79 2.65 4.43 5.16 3.38 5.18 2.89 7.56 3.84 5.35 5.79 1.10 3.74% Chg Same Qtr Last Yr…………………… 5.07 6.80 2.21 1.09 1.37 -0.21 2.74 3.75 3.90 4.54 4.15 4.74 4.85 4.89 5.79 1.10 3.74
US PERSONAL INCOME (BIL$) SAAR……… 13867 14317 13891 14025 14136 14221 14434 14613 14775 14956 15080 15277 15468 15614 13915 14068 14694% Chg Prev Qtr SAAR……………………… 1.54 13.62 -11.37 3.91 3.21 2.41 6.12 5.06 4.51 4.99 3.36 5.33 5.09 3.84 4.98 1.10 4.45% Chg Same Qtr Last Yr…………………… 3.89 6.86 1.68 1.53 1.94 -0.67 3.90 4.19 4.52 5.17 4.48 4.55 4.69 4.40 4.98 1.10 4.45
TN NONFARM JOBS (THOUS)……………… 2718.8 2729.8 2739.6 2752.0 2761.6 2781.6 2790.5 2806.3 2824.2 2843.4 2846.8 2860.9 2874.9 2900.1 2715.3 2758.7 2816.1% Chg Prev Qtr SAAR……………………… 0.87 1.63 1.45 1.82 1.40 2.93 1.29 2.29 2.57 2.76 0.47 2.00 1.97 3.57 2.00 1.60 2.08% Chg Same Qtr Last Yr…………………… 1.75 1.73 1.47 1.44 1.58 1.90 1.86 1.97 2.27 2.22 2.02 1.94 1.79 2.00 2.00 1.60 2.08
US NONFARM JOBS (MIL)…………………… 134.3 134.8 135.5 136.1 136.6 137.3 137.8 138.6 139.4 140.2 141.0 141.6 142.2 142.9 134.1 136.4 139.0% Chg Prev Qtr SAAR……………………… 1.23 1.74 2.10 1.65 1.60 1.94 1.60 2.33 2.16 2.46 2.24 1.74 1.77 1.86 1.71 1.71 1.93% Chg Same Qtr Last Yr…………………… 1.65 1.66 1.57 1.68 1.77 1.82 1.70 1.87 2.01 2.14 2.30 2.15 2.05 1.90 1.71 1.71 1.93
TN MFG JOBS (THOUS)……………………… 315.1 316.0 316.9 317.3 318.5 321.1 322.8 323.3 325.8 329.0 330.9 330.7 331.5 332.7 313.4 318.4 325.2% Chg Prev Qtr SAAR……………………… 1.63 1.14 1.16 0.57 1.53 3.26 2.14 0.65 3.14 4.02 2.29 -0.29 1.00 1.53 2.94 1.61 2.13% Chg Same Qtr Last Yr…………………… 3.35 2.97 2.62 1.12 1.10 1.62 1.87 1.89 2.29 2.48 2.52 2.28 1.74 1.17 2.94 1.61 2.13
US MFG JOBS (MIL)…………………………… 12.0 12.0 12.0 12.0 12.0 12.1 12.1 12.2 12.2 12.3 12.3 12.3 12.3 12.3 11.9 12.0 12.2% Chg Prev Qtr SAAR……………………… 0.98 -0.17 1.45 0.33 -0.02 2.04 1.75 1.30 1.51 2.31 1.60 0.30 -0.05 -0.41 1.71 0.78 1.41% Chg Same Qtr Last Yr…………………… 1.69 1.44 1.12 0.65 0.40 0.95 1.02 1.26 1.65 1.72 1.68 1.43 1.04 0.35 1.71 0.78 1.41
TN UNEMPLOYMENT RATE (%)…………… 7.8 7.7 7.9 7.9 7.7 7.1 6.5 6.5 6.6 6.6 6.5 5.8 5.7 5.6 7.8 7.6 6.6
US UNEMPLOYMENT RATE (%)…………… 8.0 7.8 7.7 7.5 7.2 7.0 6.6 6.2 6.1 5.7 5.6 5.4 5.2 5.0 8.1 7.4 6.2
Historical Data
January 2016
Annual
(CONTINUED ON NEXT PAGE)

2016 TE
NN
ES
SE
E E
CO
NO
MIC
RE
PO
RT
| 4544 | 2016 T
EN
NE
SS
EE
EC
ON
OM
IC R
EP
OR
T
Historical D
ata | AP
PE
ND
IX B
Table 1: Selected U.S. and Tennessee Economic Indicators, Seasonally Adjusted
2012:3 2012:4 2013:1 2013:2 2013:3 2013:4 2014:1 2014:2 2014:3 2014:4 2015:1 2015:2 2015:3 2015:4 2012 2013 2014Historical Data
January 2016
Annual
CHAINED PRICE INDEX, GDP((2009=100.0)……………........................... 105.5 105.9 106.3 106.6 107.2 107.6 108.0 108.6 109.0 109.1 109.1 109.7 110.0 110.4 105.2 106.9 108.7% Chg Prev Qtr SAAR……………………… 2.37 1.49 1.50 1.10 2.00 1.79 1.48 2.23 1.59 0.12 0.11 2.12 1.32 1.44 1.84 1.63 1.64% Chg Same Qtr Last Yr…………………… 1.71 1.95 1.79 1.62 1.52 1.60 1.59 1.87 1.77 1.35 1.01 0.98 0.91 1.25 1.84 1.63 1.64
US PERS CONSUMP DEFL (2009=100.0)… 106.2 106.8 107.2 107.3 107.7 108.1 108.5 109.1 109.4 109.3 108.8 109.4 109.7 109.8 106.1 107.6 109.1% Chg Prev Qtr SAAR……………………… 1.32 2.17 1.36 0.44 1.67 1.42 1.61 2.14 1.19 -0.43 -1.91 2.21 1.28 0.11 1.89 1.37 1.43% Chg Same Qtr Last Yr…………………… 1.57 1.76 1.52 1.32 1.41 1.22 1.28 1.71 1.59 1.12 0.23 0.25 0.27 0.41 1.89 1.37 1.43
CONSUMER PRICE INDEX,ALL-URBAN (82-84=1.000)………………… 2.299 2.314 2.322 2.321 2.334 2.342 2.354 2.368 2.375 2.370 2.352 2.369 2.379 2.381 2.296 2.330 2.367% Chg Prev Qtr SAAR……………………… 1.77 2.64 1.38 -0.14 2.27 1.42 2.09 2.44 1.18 -0.85 -3.06 2.98 1.58 0.33 2.08 1.46 1.61% Chg Same Qtr Last Yr…………………… 1.68 1.91 1.69 1.41 1.53 1.23 1.40 2.05 1.78 1.20 -0.10 0.04 0.14 0.43 2.08 1.46 1.61
BANK PRIME INTEREST RATE (%)………… 3.3 3.3 3.3 3.3 3.3 3.3 3.3 3.3 3.3 3.3 3.3 3.3 3.3 3.3 3.3 3.3 3.3
FEDERAL FUNDS RATE (% per annum)…… 0.143 0.160 0.143 0.117 0.083 0.087 0.073 0.093 0.090 0.100 0.110 0.123 0.137 0.152 0.140 0.108 0.089
30-YEAR FIXED MORTGAGE RATE (%)…… 3.6 3.4 3.5 3.7 4.4 4.3 4.4 4.2 4.1 4.0 3.7 3.8 4.0 3.9 3.7 4.0 4.2
TN TAXABLE SALES (MIL2009$)…………… 22878 23007 23361 23472 23389 23615 23780 23807 24465 24985 24523 25642 26228 26353 92389 93837 97036% Chg Prev Qtr SAAR……………………… -1.93 2.28 6.30 1.91 -1.41 3.94 2.81 0.45 11.54 8.76 -7.19 19.55 9.46 1.91 2.77 1.57 3.41% Chg Same Qtr Last Yr…………………… 0.93 1.02 -0.66 2.10 2.23 2.65 1.79 1.43 4.60 5.80 3.12 7.71 7.21 5.48 2.77 1.57 3.41
TN TAXABLE SALES (MIL$)………………… 24303 24572 25035 25181 25196 25530 25811 25977 26775 27314 26679 28050 28781 28903 98041 100943 105877% Chg Prev Qtr SAAR……………………… -0.64 4.50 7.75 2.36 0.23 5.41 4.47 2.60 12.87 8.29 -8.97 22.19 10.84 1.70 4.70 2.96 4.89% Chg Same Qtr Last Yr…………………… 2.51 2.80 0.85 3.45 3.67 3.90 3.10 3.16 6.27 6.99 3.37 7.98 7.49 5.82 4.70 2.96 4.89
TN AVG ANNUAL WAGE, NONFARM (2009$)…………….................................. 41745 42345 41492 41477 41449 41474 41853 41816 41824 42351 42429 43281 43269 43666 41968 41473 41961% Chg Prev Qtr SAAR……………………… -2.20 5.87 -7.81 -0.15 -0.27 0.24 3.71 -0.36 0.07 5.14 0.73 8.28 -0.11 3.72 1.59 -1.18 1.18% Chg Same Qtr Last Yr…………………… 0.60 3.74 -0.74 -1.19 -0.71 -2.06 0.87 0.82 0.90 2.12 1.37 3.50 3.46 3.10 1.59 -1.18 1.18
TN AVG ANNUAL WAGE, NONFARM ($)…… 44347 45226 44466 44498 44652 44837 45427 45628 45772 46299 46160 47346 47481 47891 44537 44613 45782% Chg Prev Qtr SAAR……………………… -0.91 8.17 -6.56 0.29 1.39 1.66 5.38 1.78 1.27 4.68 -1.19 10.68 1.14 3.50 3.52 0.17 2.62% Chg Same Qtr Last Yr…………………… 2.18 5.56 0.77 0.11 0.69 -0.86 2.16 2.54 2.51 3.26 1.61 3.76 3.73 3.44 3.52 0.17 2.62
Center for Business and Economic Research, University of Tennessee Tennessee Econometric Model

2016 TE
NN
ES
SE
E E
CO
NO
MIC
RE
PO
RT
| 4746 | 2016 T
EN
NE
SS
EE
EC
ON
OM
IC R
EP
OR
T
AP
PE
ND
IX B
| Historical D
ata
Table 2: Selected Per Capita U.S. and Tennessee Economic Indicators, Seasonally Adjusted
2012:2 2012:3 2012:4 2013:1 2013:2 2013:3 2013:4 2014:1 2014:2 2014:3 2014:4 2015:1 2015:2 2015:3 2012 2013 2014
US GDP (2009$) SAAR………………….…… 48855 48808 48731 48881 48928 49184 49559 49364 49827 50246 50415 50414 50798 50944 48777 49139 49964% Chg Prev Qtr SAAR…………………… 1.15 -0.38 -0.63 1.24 0.38 2.11 3.09 -1.57 3.81 3.40 1.36 -0.01 3.08 1.16 1.47 0.74 1.68% Chg Same Qtr Last Yr………………… 1.73 1.64 0.53 0.34 0.15 0.77 1.70 0.99 1.84 2.16 1.73 2.13 1.95 1.39 1.47 0.74 1.68
US GDP ($) SAAR……………………………… 51270 51496 51623 51991 52168 52690 53320 53317 54115 54790 54987 55002 55712 56053 51321 52544 54304% Chg Prev Qtr SAAR…………………… 3.01 1.77 0.99 2.89 1.37 4.06 4.87 -0.02 6.12 5.08 1.44 0.11 5.27 2.47 3.34 2.38 3.35% Chg Same Qtr Last Yr………………… 3.51 3.34 2.48 2.16 1.75 2.32 3.29 2.55 3.73 3.99 3.13 3.16 2.95 2.31 3.34 2.38 3.35
TN PERSONAL INCOME (2009$) SAAR…… 36835 36769 37297 36398 36364 36368 36382 36536 36705 36805 37216 37565 37949 38089 36860 36378 36816% Chg Prev Qtr SAAR…………………… 3.26 -0.72 5.88 -9.30 -0.37 0.04 0.15 1.70 1.87 1.09 4.54 3.81 4.14 1.49 2.71 -1.31 1.20% Chg Same Qtr Last Yr………………… 2.91 2.35 3.84 -0.39 -1.28 -1.09 -2.46 0.38 0.94 1.20 2.29 2.82 3.39 3.49 2.71 -1.31 1.20
US PERSONAL INCOME (2009$) SAAR…… 41490 41423 42460 40992 41266 41334 41361 41745 41963 42214 42702 43195 43433 43746 41653 41238 42157% Chg Prev Qtr SAAR…………………… 2.51 -0.64 10.40 -13.13 2.70 0.66 0.26 3.76 2.11 2.41 4.71 4.70 2.22 2.92 2.27 -0.99 2.23% Chg Same Qtr Last Yr………………… 2.12 1.54 4.23 -0.59 -0.54 -0.22 -2.59 1.84 1.69 2.13 3.24 3.47 3.50 3.63 2.27 -0.99 2.23
TN PERSONAL INCOME ($) SAAR………… 39003 39060 39835 39007 39013 39179 39332 39656 40052 40280 40685 40869 41512 41797 39118 39133 40168% Chg Prev Qtr SAAR…………………… 4.53 0.59 8.18 -8.06 0.06 1.71 1.57 3.34 4.05 2.30 4.09 1.82 6.44 2.77 4.66 0.04 2.65% Chg Same Qtr Last Yr………………… 4.73 3.95 5.67 1.12 0.03 0.30 -1.26 1.66 2.66 2.81 3.44 3.06 3.65 3.77 4.66 0.04 2.65
US PERSONAL INCOME ($) SAAR………… 43931 44005 45349 43929 44272 44528 44715 45310 45789 46200 46683 46994 47512 48007 44204 44362 45996% Chg Prev Qtr SAAR…………………… 3.76 0.67 12.80 -11.95 3.15 2.34 1.69 5.43 4.30 3.63 4.25 2.69 4.48 4.24 4.21 0.36 3.69% Chg Same Qtr Last Yr………………… 3.92 3.13 6.07 0.92 0.78 1.19 -1.40 3.14 3.43 3.75 4.40 3.72 3.76 3.91 4.21 0.36 3.69
TN TAXABLE SALES (2009$)………………… 3565 3538 3548 3593 3601 3579 3604 3619 3614 3704 3773 3693 3852 3930 14306 14377 14710% Chg Prev Qtr SAAR…………………… -9.62 -2.97 1.20 5.18 0.83 -2.45 2.85 1.74 -0.60 10.37 7.63 -8.16 18.31 8.33 1.68 0.49 2.32% Chg Same Qtr Last Yr………………… 1.63 -0.14 -0.05 -1.71 1.02 1.15 1.56 0.72 0.36 3.51 4.69 2.05 6.59 6.09 1.68 0.49 2.32
TN TAXABLE SALES ($)……………………… 3774 3758 3790 3851 3863 3855 3896 3928 3943 4054 4125 4018 4214 4312 15181 15465 16050% Chg Prev Qtr SAAR…………………… -8.51 -1.69 3.40 6.61 1.28 -0.82 4.31 3.37 1.53 11.69 7.16 -9.92 20.93 9.69 3.59 1.87 3.78% Chg Same Qtr Last Yr………………… 3.43 1.42 1.71 -0.21 2.35 2.58 2.80 2.01 2.08 5.15 5.87 2.29 6.86 6.38 3.59 1.87 3.78
January 2016
Historical Data Annual
Center for Business and Economic Research, University of Tennessee Tennessee Econometric Model

2016 TE
NN
ES
SE
E E
CO
NO
MIC
RE
PO
RT
| 4746 | 2016 T
EN
NE
SS
EE
EC
ON
OM
IC R
EP
OR
T
Historical D
ata | AP
PE
ND
IX B
Table 3: Tennessee Personal Income Components, Seasonally Adjusted Annual Rates (millions of 2009 dollars)
2012:2 2012:3 2012:4 2013:1 2013:2 2013:3 2013:4 2014:1 2014:2 2014:3 2014:4 2015:1 2015:2 2015:3 2012 2013 2014
TN PERSONAL INCOME…………..………237568 237772 241833 236631 237037 237691 238407 240048 241798 243093 246452 249416 252618 254215 238054 237442 242848% Chg Prev Qtr SAAR……………… 4.37 0.34 7.01 -8.33 0.69 1.11 1.21 2.78 2.95 2.16 5.64 4.90 5.23 2.55 3.82 -0.26 2.28% Chg Same Qtr Last Yr…………… 4.02 3.45 4.95 0.68 -0.22 -0.03 -1.42 1.44 2.01 2.27 3.37 3.90 4.47 4.58 3.82 -0.26 2.28
WAGES AND SALARIES………………114754 114363 116463 114532 114997 115321 116213 117642 118201 118966 121268 121639 124682 125258 114827 115266 119019% Chg Prev Qtr SAAR……………… 3.65 -1.36 7.55 -6.47 1.63 1.13 3.13 5.01 1.92 2.62 7.97 1.23 10.39 1.86 3.59 0.38 3.26% Chg Same Qtr Last Yr…………… 3.84 2.34 5.48 0.71 0.21 0.84 -0.22 2.71 2.79 3.16 4.35 3.40 5.48 5.29 3.59 0.38 3.26
OTHER LABOR INCOME……………… 27863 28087 28240 27971 27787 27602 27479 27288 27110 27001 27194 27310 27756 27846 27860 27710 27148% Chg Prev Qtr SAAR……………… 9.34 3.25 2.21 -3.76 -2.60 -2.64 -1.77 -2.75 -2.57 -1.61 2.88 1.72 6.70 1.30 7.11 -0.54 -2.03% Chg Same Qtr Last Yr…………… 8.08 7.42 7.00 2.65 -0.27 -1.73 -2.70 -2.44 -2.44 -2.18 -1.04 0.08 2.38 3.13 7.11 -0.54 -2.03
PROPRIETORS INCOME……………… 29709 29757 29984 31182 30864 30975 30792 31512 32173 32319 32897 33274 33497 33913 29745 30953 32225% Chg Prev Qtr SAAR……………… 2.44 0.65 3.09 16.96 -4.02 1.45 -2.34 9.68 8.66 1.83 7.35 4.67 2.70 5.07 6.63 4.06 4.11% Chg Same Qtr Last Yr…………… 7.35 5.73 5.11 5.59 3.89 4.09 2.69 1.06 4.24 4.34 6.84 5.59 4.11 4.93 6.63 4.06 4.11
RENT, INTEREST, DIVIDENDS……… 33692 33702 35795 33232 33493 33750 33698 34096 34373 34443 34800 35257 35625 35876 34082 33543 34428% Chg Prev Qtr SAAR……………… 6.85 0.11 27.25 -25.71 3.19 3.11 -0.62 4.80 3.30 0.81 4.21 5.36 4.24 2.84 6.32 -1.58 2.64% Chg Same Qtr Last Yr…………… 5.83 4.99 9.64 0.28 -0.59 0.14 -5.86 2.60 2.63 2.05 3.27 3.41 3.64 4.16 6.32 -1.58 2.64
TRANSFER PAYMENTS……………… 48989 49198 49011 49435 49689 49880 50182 49629 50061 50533 50774 52494 52135 52411 48980 49797 50249% Chg Prev Qtr SAAR……………… 2.22 1.72 -1.52 3.51 2.07 1.55 2.45 -4.33 3.52 3.83 1.92 14.25 -2.71 2.14 -0.83 1.67 0.91% Chg Same Qtr Last Yr…………… -1.00 0.92 -0.39 1.47 1.43 1.39 2.39 0.39 0.75 1.31 1.18 5.77 4.14 3.72 -0.83 1.67 0.91
LESS: PERS CONT FOR SOC INS… 16323 16200 16458 18490 18571 18606 18699 18959 18965 19013 19299 19382 19797 19829 16314 18592 19059% Chg Prev Qtr SAAR……………… 1.16 -2.97 6.51 59.32 1.77 0.76 2.02 5.68 0.12 1.02 6.16 1.73 8.83 0.66 1.07 13.96 2.52% Chg Same Qtr Last Yr…………… 1.13 -0.29 3.02 13.60 13.77 14.85 13.62 2.54 2.12 2.19 3.21 2.23 4.39 4.29 1.07 13.96 2.52
RESIDENCE ADJUSTMENT…………… -1116 -1135 -1203 -1231 -1222 -1231 -1257 -1159 -1155 -1155 -1181 -1175 -1280 -1259 -1126 -1235 -1163% Chg Prev Qtr SAAR……………… 27.25 6.95 26.03 9.68 -2.78 3.05 8.76 -27.87 -1.26 0.06 9.29 -2.12 40.83 -6.30 45.87 9.70 -5.89% Chg Same Qtr Last Yr…………… 46.55 41.83 53.41 17.11 9.49 8.48 4.56 -5.84 -5.48 -6.17 -6.06 1.39 10.80 9.00 45.87 9.70 -5.89
PER CAPITA PERSONAL INCOME ($)… 36835 36769 37297 36398 36364 36368 36382 36536 36705 36805 37216 37565 37949 38089 36860 36378 36816% Chg Prev Qtr SAAR……………… 3.26 -0.72 5.88 -9.30 -0.37 0.04 0.15 1.70 1.87 1.09 4.54 3.81 4.14 1.49 2.71 -1.31 1.20% Chg Same Qtr Last Yr…………… 2.91 2.35 3.84 -0.39 -1.28 -1.09 -2.46 0.38 0.94 1.20 2.29 2.82 3.39 3.49 2.71 -1.31 1.20
Center for Business and Economic Research, University of Tennessee
January 2016
Historical Data Annual
Tennessee Econometric Model

2016 TE
NN
ES
SE
E E
CO
NO
MIC
RE
PO
RT
| 4948 | 2016 T
EN
NE
SS
EE
EC
ON
OM
IC R
EP
OR
T
AP
PE
ND
IX B
| Historical D
ata
Table 4: Tennessee Personal Income Components, Seasonally Adjusted Annual Rates (millions of current dollars)
2012:2 2012:3 2012:4 2013:1 2013:2 2013:3 2013:4 2014:1 2014:2 2014:3 2014:4 2015:1 2015:2 2015:3 2012 2013 2014
TN PERSONAL INCOME…………..………… 251549 252589 258288 253588 254303 256060 257738 260548 263843 266044 269426 271353 276341 278958 252636 255422 264965% Chg Prev Qtr SAAR………………… 5.65 1.66 9.33 -7.08 1.13 2.79 2.65 4.43 5.16 3.38 5.18 2.89 7.56 3.84 5.79 1.10 3.74% Chg Same Qtr Last Yr……………… 5.86 5.07 6.80 2.21 1.09 1.37 -0.21 2.74 3.75 3.90 4.54 4.15 4.74 4.85 5.79 1.10 3.74
WAGES AND SALARIES………………… 121507 121490 124387 122739 123373 124233 125635 127688 128977 130198 132573 132337 136391 137449 121860 123995 129859% Chg Prev Qtr SAAR………………… 4.92 -0.06 9.89 -5.19 2.08 2.82 4.59 6.70 4.10 3.84 7.50 -0.71 12.83 3.14 5.55 1.75 4.73% Chg Same Qtr Last Yr……………… 5.68 3.94 7.34 2.23 1.54 2.26 1.00 4.03 4.54 4.80 5.52 3.64 5.75 5.57 5.55 1.75 4.73
OTHER LABOR INCOME………………… 29503 29837 30162 29976 29811 29735 29707 29618 29582 29550 29729 29712 30362 30556 29566 29807 29620% Chg Prev Qtr SAAR………………… 10.68 4.61 4.43 -2.45 -2.17 -1.02 -0.38 -1.19 -0.49 -0.43 2.44 -0.23 9.05 2.58 9.13 0.81 -0.63% Chg Same Qtr Last Yr……………… 9.99 9.10 8.88 4.21 1.05 -0.34 -1.51 -1.19 -0.77 -0.62 0.07 0.32 2.64 3.40 9.13 0.81 -0.63
PROPRIETORS INCOME……………… 31458 31612 32025 33417 33112 33369 33289 34203 35106 35370 35964 36201 36642 37214 31567 33297 35161% Chg Prev Qtr SAAR………………… 3.70 1.97 5.33 18.56 -3.60 3.14 -0.96 11.44 10.99 3.04 6.88 2.66 4.97 6.39 8.64 5.48 5.60% Chg Same Qtr Last Yr……………… 9.25 7.39 6.96 7.20 5.26 5.56 3.95 2.35 6.02 6.00 8.03 5.84 4.38 5.21 8.64 5.48 5.60
RENT, INTEREST, DIVIDENDS………… 35675 35802 38230 35613 35933 36359 36430 37007 37507 37694 38044 38358 38971 39368 36172 36084 37563% Chg Prev Qtr SAAR………………… 8.16 1.43 30.01 -24.70 3.64 4.83 0.79 6.49 5.51 2.02 3.76 3.34 6.55 4.13 8.34 -0.25 4.10% Chg Same Qtr Last Yr……………… 7.70 6.63 11.57 1.80 0.72 1.55 -4.71 3.92 4.38 3.67 4.43 3.65 3.90 4.44 8.34 -0.25 4.10
TRANSFER PAYMENTS………………… 51872 52264 52345 52977 53308 53735 54251 53868 54625 55304 55507 57110 57031 57512 51978 53568 54826% Chg Prev Qtr SAAR………………… 3.47 3.06 0.62 4.92 2.52 3.24 3.90 -2.80 5.74 5.06 1.48 12.07 -0.56 3.42 1.06 3.06 2.35% Chg Same Qtr Last Yr……………… 0.75 2.50 1.36 3.01 2.77 2.81 3.64 1.68 2.47 2.92 2.32 6.02 4.40 3.99 1.06 3.06 2.35
LESS: PERS CONT FOR SOC INS…… 17283 17210 17577 19815 19924 20044 20216 20579 20694 20808 21099 21087 21656 21759 17313 20000 20795% Chg Prev Qtr SAAR………………… 2.40 -1.69 8.82 61.49 2.22 2.44 3.47 7.38 2.26 2.23 5.70 -0.22 11.23 1.93 2.99 15.52 3.98% Chg Same Qtr Last Yr……………… 2.92 1.27 4.83 15.33 15.28 16.47 15.01 3.85 3.87 3.81 4.37 2.47 4.65 4.57 2.99 15.52 3.98
RESIDENCE ADJUSTMENT…………… -1182 -1206 -1284 -1319 -1311 -1326 -1359 -1258 -1260 -1264 -1291 -1278 -1400 -1382 -1195 -1329 -1268% Chg Prev Qtr SAAR………………… 28.81 8.36 28.76 11.17 -2.35 4.77 10.30 -26.71 0.86 1.26 8.81 -3.99 43.94 -5.12 48.63 11.18 -4.55% Chg Same Qtr Last Yr……………… 49.14 44.05 56.11 18.89 10.94 10.01 5.83 -4.64 -3.86 -4.68 -5.00 1.63 11.08 9.29 48.63 11.18 -4.55
PER CAPITA PERSONAL INCOME ($)…… 39003 39060 39835 39007 39013 39179 39332 39656 40052 40280 40685 40869 41512 41797 39118 39133 40168% Chg Prev Qtr SAAR………………… 4.53 0.59 8.18 -8.06 0.06 1.71 1.57 3.34 4.05 2.30 4.09 1.82 6.44 2.77 4.66 0.04 2.65% Chg Same Qtr Last Yr……………… 4.73 3.95 5.67 1.12 0.03 0.30 -1.26 1.66 2.66 2.81 3.44 3.06 3.65 3.77 4.66 0.04 2.65
Center for Business and Economic Research, University of Tennessee
January 2015
Historical Data Annual
Tennessee Econometric Model

2016 TE
NN
ES
SE
E E
CO
NO
MIC
RE
PO
RT
| 4948 | 2016 T
EN
NE
SS
EE
EC
ON
OM
IC R
EP
OR
T
Historical D
ata | AP
PE
ND
IX B
Table 5: Tennessee Nonfarm Employment by Sector, Not Seasonally Adjusted (thousands of jobs)
2012:3 2012:4 2013:1 2013:2 2013:3 2013:4 2014:1 2014:2 2014:3 2014:4 2015:1 2015:2 2015:3 2015:4 2012 2013 2014
TOTAL NONFARM……………………………………………… 2712.2 2760.4 2711.9 2756.0 2753.6 2813.7 2765.8 2810.3 2815.6 2870.1 2822.1 2866.2 2869.0 2927.8 2715.0 2758.8 2815.4% Chg Same Qtr Last Yr......................................... 1.68 1.87 1.50 1.49 1.53 1.93 1.99 1.97 2.25 2.00 2.04 1.99 1.90 2.01 2.01 1.61 2.05
NATURAL RESOURCES, MINING & CONSTRUCTION…111.3 109.2 103.6 108.3 110.1 109.5 105.0 111.0 113.2 114.9 110.5 115.2 115.7 117.1 108.9 107.9 111.0% Chg Same Qtr Last Yr......................................... -1.62 -2.85 -1.96 -0.91 -1.08 0.21 1.42 2.43 2.78 4.96 5.24 3.84 2.21 1.91 0.19 -0.93 2.92
MANUFACTURING……………………………………………315.6 316.6 315.7 317.4 318.8 321.8 321.8 323.3 326.0 329.8 330.1 330.6 331.6 333.8 313.4 318.4 325.2% Chg Same Qtr Last Yr......................................... 3.28 2.96 2.69 1.13 1.02 1.64 1.93 1.86 2.25 2.50 2.56 2.26 1.71 1.21 2.94 1.61 2.14
DURABLE GOODS…………………………………………196.1 196.8 196.6 197.9 199.2 201.7 203.0 204.0 205.7 209.5 210.1 211.4 211.8 213.4 193.9 198.9 205.5% Chg Same Qtr Last Yr......................................... 5.96 5.17 4.10 2.03 1.56 2.52 3.26 3.08 3.26 3.83 3.53 3.61 2.97 1.89 5.56 2.54 3.36
NONDURABLE GOODS………………………………… 119.5 119.8 119.2 119.4 119.7 120.1 118.9 119.2 120.3 120.4 119.9 119.2 119.8 120.4 119.5 119.6 119.7% Chg Same Qtr Last Yr......................................... -0.83 -0.47 0.45 -0.33 0.14 0.19 -0.25 -0.17 0.56 0.25 0.90 -0.06 -0.44 0.03 -1.04 0.11 0.10
TRADE, TRANSPORTATION, UTILITIES………………… 574.2 588.8 572.7 578.5 580.9 596.3 579.6 588.4 592.5 606.0 592.9 602.9 610.0 624.6 575.1 582.1 591.6% Chg Same Qtr Last Yr......................................... 1.86 2.00 1.40 1.04 1.17 1.27 1.21 1.71 2.00 1.63 2.29 2.47 2.95 3.07 2.05 1.22 1.64
WHOLESALE TRADE…………………………………… 120.9 121.5 120.5 121.9 122.3 122.6 121.6 123.1 123.8 124.6 124.2 125.8 127.8 130.1 120.5 121.8 123.3% Chg Same Qtr Last Yr......................................... 2.05 2.07 1.37 1.05 1.13 0.88 0.89 0.93 1.23 1.69 2.19 2.19 3.20 4.41 2.22 1.11 1.18
RETAIL TRADE…………………………………………… 311.1 321.1 308.7 312.1 313.9 325.1 313.9 319.0 320.2 328.8 319.3 326.6 328.4 337.3 312.8 314.9 320.5% Chg Same Qtr Last Yr......................................... 0.88 1.36 0.43 0.10 0.90 1.22 1.70 2.20 2.02 1.14 1.72 2.38 2.56 2.59 1.18 0.67 1.76
TRANSPORTATION & UTILITIES……………………… 142.1 146.2 143.5 144.5 144.7 148.7 144.2 146.4 148.5 152.6 149.4 150.6 153.8 157.2 141.8 145.4 147.9% Chg Same Qtr Last Yr......................................... 3.90 3.39 3.56 3.14 1.81 1.69 0.44 1.29 2.63 2.65 3.63 2.89 3.59 3.01 3.87 2.53 1.76
INFORMATION……………………………………………… 42.7 43.5 43.8 44.3 44.0 44.2 43.7 43.8 43.8 44.4 44.2 43.8 42.9 42.5 43.2 44.1 43.9% Chg Same Qtr Last Yr......................................... -2.22 0.85 1.94 1.45 3.13 1.45 -0.15 -1.13 -0.53 0.60 1.07 -0.08 -2.06 -4.35 -1.26 1.99 -0.30
FINANCIAL ACTIVITIES…………………………………… 137.2 137.1 136.0 137.7 139.0 139.7 139.3 141.3 142.6 142.6 142.0 144.0 145.4 147.9 137.1 138.1 141.4% Chg Same Qtr Last Yr......................................... -0.10 -0.24 -0.54 0.27 1.34 1.85 2.43 2.61 2.54 2.08 1.91 1.91 1.99 3.74 0.42 0.73 2.41
PROFESSIONAL & BUSINESS SERVICES……………… 339.3 349.3 340.7 348.7 352.4 371.1 359.9 370.4 374.3 385.1 371.7 380.7 382.8 396.4 338.5 353.2 372.4% Chg Same Qtr Last Yr......................................... 4.41 4.10 4.06 3.23 3.86 6.24 5.62 6.22 6.22 3.77 3.28 2.80 2.28 2.93 4.85 4.37 5.43
EDUCATION & HEALTH SERVICES……………………… 393.2 399.5 397.8 398.0 395.7 402.4 399.8 400.4 401.3 409.7 407.6 408.7 406.6 416.5 393.8 398.5 402.8% Chg Same Qtr Last Yr......................................... 2.25 2.27 1.87 1.54 0.65 0.73 0.51 0.62 1.42 1.81 1.95 2.06 1.30 1.68 2.47 1.19 1.09
LEISURE & HOSPITALITY………………………………… 283.9 277.5 270.8 291.8 294.6 286.5 280.0 302.5 306.1 296.7 287.6 312.0 316.7 307.5 276.8 285.9 296.3% Chg Same Qtr Last Yr......................................... 2.92 3.51 3.10 3.02 3.76 3.22 3.41 3.66 3.91 3.57 2.73 3.15 3.44 3.63 3.44 3.28 3.64
OTHER SERVICES………………………………………… 105.0 104.0 103.8 106.7 106.5 105.3 105.0 107.1 106.3 105.1 103.8 105.8 105.4 104.2 104.2 105.6 105.9% Chg Same Qtr Last Yr......................................... 1.97 1.79 0.97 1.52 1.40 1.25 1.16 0.31 -0.19 -0.19 -1.11 -1.18 -0.85 -0.86 2.15 1.29 0.27
GOVERNMENT……………………………………………… 409.8 434.7 427.0 424.6 411.5 437.0 431.6 422.2 409.5 435.7 431.7 422.5 412.0 437.2 424.0 425.0 424.8% Chg Same Qtr Last Yr......................................... -1.39 -0.18 -0.91 0.94 0.42 0.53 1.07 -0.56 -0.50 -0.29 0.02 0.06 0.62 0.34 -0.87 0.24 -0.07
FEDERAL, CIVILIAN……………………………………… 50.1 50.2 49.6 49.6 49.3 49.2 48.9 49.1 47.2 47.4 47.4 47.6 47.6 47.8 50.1 49.5 48.1% Chg Same Qtr Last Yr......................................... -0.86 -0.72 -0.93 -1.06 -1.46 -1.99 -1.48 -1.08 -4.26 -3.79 -3.14 -2.92 0.71 0.84 -0.81 -1.36 -2.65
STATE & LOCAL………………………………………… 359.7 384.5 377.4 375.0 362.2 387.8 382.7 373.2 362.2 388.4 384.3 374.9 364.4 389.4 373.9 375.6 376.6% Chg Same Qtr Last Yr......................................... -1.46 -0.11 -0.91 1.21 0.69 0.86 1.40 -0.49 0.01 0.15 0.43 0.46 0.61 0.27 -0.88 0.45 0.27
Center for Business and Economic Research, University of Tennessee Tennessee Econometric Model
Historical Data
January 2016Annual

2016 TE
NN
ES
SE
E E
CO
NO
MIC
RE
PO
RT
| 5150 | 2016 T
EN
NE
SS
EE
EC
ON
OM
IC R
EP
OR
T
AP
PE
ND
IX B
| Historical D
ata
Table 6: Tennessee Durable Goods Manufacturing Employment, Not Seasonally Adjusted (thousands of jobs)
2012:3 2012:4 2013:1 2013:2 2013:3 2013:4 2014:1 2014:2 2014:3 2014:4 2015:1 2015:2 2015:3 2015:4 2012 2013 2014
TOTAL DURABLE GOODS………………………… 196.1 196.8 196.6 197.9 199.2 201.7 203.0 204.0 205.7 209.5 210.1 211.4 211.8 213.4 193.9 198.9 205.5% Chg Same Qtr Last Yr…………………… 5.96 5.17 4.10 2.03 1.56 2.52 3.26 3.08 3.26 3.83 3.53 3.61 2.97 1.89 5.56 2.54 3.36
WOOD PRODUCTS……………………………… 11.3 11.0 10.7 10.8 10.9 11.0 11.0 11.1 11.4 11.4 11.3 11.6 11.8 11.8 11.0 10.9 11.2% Chg Same Qtr Last Yr…………………… 2.74 0.91 -0.62 -2.11 -3.25 -0.30 2.49 2.77 4.59 3.94 3.34 4.19 3.22 2.92 2.24 -1.59 3.45
NONMETALLIC MINERAL PRODUCTS……… 12.7 12.6 12.4 12.2 12.1 11.9 11.8 11.9 12.0 11.9 11.7 11.7 11.7 11.7 12.5 12.1 11.9% Chg Same Qtr Last Yr…………………… 5.83 4.70 2.48 -2.14 -4.99 -5.80 -5.11 -2.19 -0.28 0.00 -0.85 -1.68 -2.49 -1.68 5.80 -2.67 -1.92
PRIMARY METALS………….…………………… 9.8 9.8 9.9 9.9 10.0 10.1 10.0 10.0 10.1 10.1 10.2 10.2 10.2 10.4 9.7 10.0 10.1% Chg Same Qtr Last Yr…………………… 6.52 3.90 5.69 2.41 1.70 3.07 1.01 1.01 1.34 0.66 2.00 1.99 1.32 2.30 4.89 3.19 1.00
FABRICATED METAL PRODUCTS…………… 34.6 34.3 33.8 33.9 33.9 34.0 34.1 34.4 34.4 34.6 35.3 35.1 35.1 35.1 34.5 33.9 34.4% Chg Same Qtr Last Yr…………………… 2.57 0.78 -1.65 -2.31 -2.02 -0.68 0.79 1.47 1.38 1.76 3.52 2.13 2.13 1.35 2.68 -1.67 1.35
MACHINERY……………………………………… 25.5 25.2 25.7 25.7 25.2 24.9 25.4 25.4 25.6 26.4 26.4 26.7 26.2 25.7 25.5 25.4 25.7% Chg Same Qtr Last Yr…………………… 1.46 2.30 1.18 -1.40 -1.18 -1.32 -1.04 -1.17 1.72 6.30 3.67 5.11 2.21 -2.90 1.66 -0.69 1.41
COMPUTER & ELECTRONIC PRODUCTS…… 5.5 5.3 5.3 5.3 5.2 5.1 5.0 5.1 5.0 5.0 5.0 5.1 5.1 5.2 5.6 5.2 5.0% Chg Same Qtr Last Yr…………………… -2.35 -9.60 -8.62 -9.66 -6.02 -4.38 -5.03 -4.40 -3.21 -1.96 -0.66 0.00 1.99 3.33 0.60 -7.25 -3.67
ELECTRICAL EQUIPMENT, APPLIANCES & COMPONENTS…………..………………… 18.0 18.1 17.8 18.3 18.9 19.2 19.5 19.0 19.5 19.6 19.7 19.8 20.0 20.1 17.9 18.6 19.4
% Chg Same Qtr Last Yr…………………… 0.94 1.87 0.38 2.23 5.19 6.07 9.16 3.83 3.17 2.08 1.37 4.04 2.39 2.55 1.65 3.48 4.49
TRANSPORTATION EQUIPMENT…………… 55.1 57.2 57.8 58.3 59.8 62.2 62.8 63.3 63.7 66.2 66.5 66.9 67.4 69.1 53.6 59.5 64.0% Chg Same Qtr Last Yr…………………… 18.49 17.93 16.36 11.19 8.47 8.62 8.53 8.63 6.58 6.54 5.89 5.58 5.76 4.38 17.02 11.00 7.55
FURNITURE……………………………………… 8.8 8.4 8.6 8.8 8.7 8.9 9.1 9.1 9.0 9.1 9.2 9.2 9.2 9.2 8.7 8.8 9.1% Chg Same Qtr Last Yr…………………… -0.38 -2.69 0.00 -0.38 -1.14 5.93 5.43 3.02 3.83 1.87 1.10 1.10 1.85 1.47 -2.89 1.06 3.52
MISCELLANEOUS DURABLE GOODS……… 14.9 14.7 14.5 14.6 14.6 14.4 14.4 14.6 14.9 15.0 14.9 15.1 15.1 15.2 14.9 14.5 14.7% Chg Same Qtr Last Yr…………………… -2.62 -2.86 -3.12 -2.01 -1.79 -2.04 -0.69 0.00 2.05 3.70 3.70 3.20 1.34 1.34 -2.30 -2.24 1.26
Tennessee Econometric Model
January 2016
Historical Data Annual
Center for Business and Economic Research, University of Tennessee

2016 TE
NN
ES
SE
E E
CO
NO
MIC
RE
PO
RT
| 5150 | 2016 T
EN
NE
SS
EE
EC
ON
OM
IC R
EP
OR
T
Historical D
ata | AP
PE
ND
IX B
Table 7: Tennessee Nondurable Goods Manufacturing Employment, Not Seasonally Adjusted (thousands of jobs)
2012:3 2012:4 2013:1 2013:2 2013:3 2013:4 2014:1 2014:2 2014:3 2014:4 2015:1 2015:2 2015:3 2015:4 2012 2013 2014
TOTAL NONDURABLE GOODS…………………… 119.5 119.8 119.2 119.4 119.7 120.1 118.9 119.2 120.3 120.4 119.9 119.2 119.8 120.4 119.5 119.6 119.7% Chg Same Qtr Last Yr……………………… -0.83 -0.47 0.45 -0.33 0.14 0.19 -0.25 -0.17 0.56 0.25 0.90 -0.06 -0.44 0.03 -1.04 0.11 0.10
FOOD……………………………………………… 33.0 32.7 32.1 32.2 32.5 32.8 32.5 32.4 32.9 33.1 32.8 32.6 33.0 33.1 33.0 32.4 32.7% Chg Same Qtr Last Yr……………………… -0.80 -2.29 -3.50 -2.72 -1.52 0.20 1.04 0.62 1.23 0.92 0.92 0.62 0.41 0.20 -0.25 -1.89 0.95
BEVERAGE & TOBACCO………………………… 5.2 5.3 5.3 5.3 5.3 5.3 5.3 5.4 5.5 5.4 5.4 5.4 5.5 5.5 5.2 5.3 5.4% Chg Same Qtr Last Yr……………………… 1.97 3.27 3.27 2.58 3.23 1.27 1.27 2.52 2.50 1.25 1.25 0.00 0.00 1.85 3.50 2.58 1.88
TEXTILE MILLS, TEXTILE MILL PRODUCTS & APPAREL……………………… 10.7 10.7 10.4 10.4 10.5 10.5 10.2 10.0 10.0 9.8 9.6 9.6 9.6 9.6 10.7 10.5 10.0
% Chg Same Qtr Last Yr……………………… -0.92 -0.62 -1.26 -2.80 -1.86 -1.87 -2.24 -4.47 -5.38 -6.05 -5.88 -4.01 -3.68 -2.71 -0.08 -1.95 -4.54
PAPER……………………………………………… 14.9 14.7 14.7 14.8 14.7 14.6 14.4 14.6 14.8 14.6 14.2 14.3 14.4 14.3 14.7 14.7 14.6% Chg Same Qtr Last Yr……………………… -3.88 -2.00 1.15 -0.45 -0.90 -0.45 -1.59 -0.90 0.68 -0.23 -1.39 -2.51 -2.92 -2.059 -3.76 -0.17 -0.51
PRINTING & RELATED SUPPORT……………… 9.6 9.6 9.6 9.7 9.6 9.6 9.5 9.5 9.4 9.4 9.2 9.1 9.0 8.9 9.6 9.6 9.4% Chg Same Qtr Last Yr……………………… -2.04 -1.70 0.35 0.35 -0.35 0.00 -0.69 -1.72 -1.74 -2.77 -3.50 -4.56 -4.61 -4.626 -3.43 0.09 -1.73
CHEMICALS……………………………………… 24.4 24.5 24.6 24.6 24.9 25.1 25.2 25.3 25.5 25.4 25.3 25.1 25.3 25.3 24.4 24.8 25.3% Chg Same Qtr Last Yr……………………… -1.08 -0.14 1.23 1.23 1.91 2.31 2.30 2.71 2.41 1.06 0.40 -0.79 -0.79 -0.394 -0.68 1.67 2.12
PLASTICS & RUBBER…………………………… 19.9 20.3 20.4 20.3 20.0 20.0 20.2 20.4 20.9 21.1 21.2 21.0 21.3 21.5 20.0 20.2 20.7% Chg Same Qtr Last Yr……………………… 0.67 0.83 4.43 0.83 0.50 -1.48 -1.31 0.49 4.67 5.84 5.29 3.10 1.59 1.735 -2.44 1.04 2.40
MISCELLANEOUS NONDURABLE GOODS…… 1.9 2.1 2.0 2.1 2.2 2.2 1.6 1.6 1.4 1.6 2.2 2.1 1.8 2.2 1.9 2.1 1.5% Chg Same Qtr Last Yr……………………… 12.00 26.00 17.31 12.50 16.07 4.76 -22.95 -25.40 -35.38 -25.76 42.55 31.91 30.95 36.73 14.65 12.33 -27.45
Tennessee Econometric Model
Annual
January 2016
Center for Business and Economic Research, University of Tennessee
Historical Data

2016 TE
NN
ES
SE
E E
CO
NO
MIC
RE
PO
RT
| 5352 | 2016 T
EN
NE
SS
EE
EC
ON
OM
IC R
EP
OR
T
AP
PE
ND
IX B
| Historical D
ata
Table 8: Tennessee Nonfarm Employment by Sector, Seasonally Adjusted (thousands of jobs)
2012:3 2012:4 2013:1 2013:2 2013:3 2013:4 2014:1 2014:2 2014:3 2014:4 2015:1 2015:2 2015:3 2015:4 2012 2013 2014
TOTAL NONFARM………………………………… 2718.7 2729.7 2739.7 2752.1 2761.6 2781.4 2790.6 2806.4 2824.2 2843.3 2846.9 2861.0 2874.8 2900.1 2715.3 2758.7 2816.1% Chg Prev Qtr SAAR………..…………… 0.86 1.62 1.48 1.82 1.38 2.91 1.32 2.29 2.55 2.73 0.52 1.99 1.94 3.57 2.00 1.60 2.08% Chg Same Qtr Last Yr………………… 1.75 1.73 1.48 1.44 1.58 1.90 1.86 1.97 2.27 2.22 2.02 1.94 1.79 2.00 2.00 1.60 2.08
NATURAL RESOURCES, MINING AND CONSTRUCTION……………………… 108.50 107.77 107.90 107.77 107.50 108.17 109.33 110.27 110.57 113.57 115 114.33 112.87 115.73 108.92 107.83 110.93
% Chg Prev Qtr SAAR………..…………… -2.42 -2.68 0.50 -0.49 -0.99 2.50 4.38 3.46 1.09 11.30 5.14 -2.30 -5.03 10.55 0.17 -0.99 2.87% Chg Same Qtr Last Yr………………… -1.72 -2.74 -2.12 -1.28 -0.92 0.37 1.33 2.32 2.85 4.99 5.18 3.69 2.08 1.91 0.17 -0.99 2.87
MANUFACTURING……………………………… 315.0 315.8 316.9 317.4 318.5 320.9 322.9 323.4 325.8 328.9 331.0 330.8 331.5 332.7 313.4 318.4 325.2% Chg Prev Qtr SAAR………..…………… 1.55 1.02 1.39 0.58 1.40 3.09 2.45 0.66 2.98 3.81 2.68 -0.30 0.81 1.53 2.94 1.61 2.13% Chg Same Qtr Last Yr………………… 3.35 2.95 2.63 1.13 1.10 1.61 1.87 1.90 2.29 2.47 2.53 2.28 1.74 1.17 2.94 1.61 2.13
DURABLE GOODS…………………………… 195.8 196.5 197.2 197.9 199.0 201.3 203.5 204.0 205.7 209.0 210.6 211.4 211.9 212.8 193.9 198.9 205.5% Chg Prev Qtr SAAR………..…………… 3.89 1.33 1.46 1.39 2.44 4.68 4.35 0.97 3.41 6.49 3.22 1.45 0.92 1.86 5.55 2.54 3.36% Chg Same Qtr Last Yr………………… 6.05 5.15 4.05 2.01 1.65 2.48 3.21 3.10 3.34 3.79 3.50 3.63 3.00 1.86 5.55 2.54 3.36
NONDURABLE GOODS…………………… 119.2 119.4 119.8 119.5 119.5 119.6 119.4 119.4 120.1 119.9 120.4 119.4 119.6 119.9 119.5 119.6 119.7% Chg Prev Qtr SAAR………..…………… -2.16 0.52 1.26 -0.74 -0.30 0.47 -0.69 0.15 2.24 -0.66 1.75 -3.30 0.61 0.95 -1.04 0.11 0.09% Chg Same Qtr Last Yr………………… -0.79 -0.48 0.38 -0.29 0.18 0.17 -0.32 -0.10 0.54 0.25 0.86 -0.02 -0.42 -0.02 -1.04 0.11 0.09
TRADE, TRANSPORTATION, UTILITIES…… 575.4 578.6 580.2 580.4 582.2 585.7 586.5 590.3 594.0 597.6 600.0 603.1 610.9 615.9 575.1 582.1 592.1% Chg Prev Qtr SAAR………..…………… 0.86 2.27 1.11 0.09 1.29 2.40 0.55 2.64 2.51 2.47 1.59 2.08 5.27 3.34 2.05 1.22 1.71% Chg Same Qtr Last Yr………………… 1.91 1.84 1.40 1.08 1.19 1.22 1.08 1.72 2.02 2.04 2.30 2.16 2.85 3.06 2.05 1.22 1.71
WHOLESALE TRADE……………………… 120.7 121.2 121.3 121.6 122.1 122.2 122.4 122.8 123.6 124.4 125.1 125.6 127.3 129.9 120.5 121.8 123.3% Chg Prev Qtr SAAR………..…………… 1.00 1.56 0.44 0.99 1.54 0.44 0.66 1.09 2.74 2.72 2.27 1.39 5.75 8.42 2.21 1.09 1.22% Chg Same Qtr Last Yr………………… 2.11 1.99 1.36 1.00 1.13 0.85 0.91 0.93 1.23 1.80 2.21 2.28 3.02 4.42 2.21 1.09 1.22
RETAIL TRADE……………………………… 312.6 313.7 313.7 313.4 315.4 317.3 318.2 320.4 321.9 322.9 324.2 326.7 329.3 331.1 312.8 315.0 320.8% Chg Prev Qtr SAAR………..…………… -0.34 1.42 0.00 -0.30 2.58 2.39 1.14 2.75 1.89 1.25 1.70 3.08 3.22 2.25 1.18 0.68 1.86% Chg Same Qtr Last Yr………………… 0.94 1.08 0.45 0.19 0.92 1.16 1.45 2.21 2.04 1.75 1.90 1.98 2.31 2.56 1.18 0.68 1.86
TRANSPORTATION & UTILITIES………… 142.1 143.8 145.2 145.3 144.7 146.2 145.9 147.2 148.5 150.3 150.6 150.8 154.3 154.9 141.8 145.4 148.0% Chg Prev Qtr SAAR………..…………… 3.45 4.77 4.14 0.18 -1.64 4.12 -0.82 3.71 3.67 4.94 0.80 0.53 9.42 1.56 3.89 2.54 1.81% Chg Same Qtr Last Yr………………… 3.95 3.38 3.57 3.12 1.83 1.67 0.44 1.31 2.65 2.85 3.27 2.47 3.86 3.02 3.89 2.54 1.81
INFORMATION………………………………… 42.8 43.3 43.9 44.3 44.2 43.9 43.7 43.7 43.9 44.3 44.1 43.7 43.2 42.4 43.2 44.1 43.9% Chg Prev Qtr SAAR………..…………… -6.28 4.43 5.66 3.38 -0.90 -2.10 -2.11 0.31 1.53 3.69 -1.50 -4.16 -3.91 -7.78 -1.35 2.08 -0.36% Chg Same Qtr Last Yr………………… -2.21 0.54 2.09 1.68 3.11 1.46 -0.46 -1.20 -0.60 0.83 0.99 -0.15 -1.52 -4.36 -1.35 2.08 -0.36
FINANCIAL ACTIVITIES……………………… 136.8 136.8 137.1 137.7 138.6 139.3 140.3 141.3 142.2 142.3 142.5 144.1 145.1 147.5 137.1 138.2 141.5% Chg Prev Qtr SAAR………..…………… -0.68 0.00 0.78 1.86 2.64 2.13 2.71 2.98 2.57 0.19 0.75 4.47 2.90 6.68 0.45 0.78 2.41% Chg Same Qtr Last Yr………………… -0.07 -0.32 -0.53 0.49 1.32 1.85 2.33 2.61 2.60 2.11 1.62 1.98 2.06 3.68 0.45 0.78 2.41
(CONTINUED ON NEXT PAGE)
January 2016
AnnualHistorical DataTable 8: Tennessee Nonfarm Employment by Sector, Seasonally Adjusted (thousands of jobs)
2012:3 2012:4 2013:1 2013:2 2013:3 2013:4 2014:1 2014:2 2014:3 2014:4 2015:1 2015:2 2015:3 2015:4 2012 2013 2014
TOTAL NONFARM………………………………… 2718.7 2729.7 2739.7 2752.1 2761.6 2781.4 2790.6 2806.4 2824.2 2843.3 2846.9 2861.0 2874.8 2900.1 2715.3 2758.7 2816.1% Chg Prev Qtr SAAR………..…………… 0.86 1.62 1.48 1.82 1.38 2.91 1.32 2.29 2.55 2.73 0.52 1.99 1.94 3.57 2.00 1.60 2.08% Chg Same Qtr Last Yr………………… 1.75 1.73 1.48 1.44 1.58 1.90 1.86 1.97 2.27 2.22 2.02 1.94 1.79 2.00 2.00 1.60 2.08
NATURAL RESOURCES, MINING AND CONSTRUCTION……………………… 108.50 107.77 107.90 107.77 107.50 108.17 109.33 110.27 110.57 113.57 115 114.33 112.87 115.73 108.92 107.83 110.93
% Chg Prev Qtr SAAR………..…………… -2.42 -2.68 0.50 -0.49 -0.99 2.50 4.38 3.46 1.09 11.30 5.14 -2.30 -5.03 10.55 0.17 -0.99 2.87% Chg Same Qtr Last Yr………………… -1.72 -2.74 -2.12 -1.28 -0.92 0.37 1.33 2.32 2.85 4.99 5.18 3.69 2.08 1.91 0.17 -0.99 2.87
MANUFACTURING……………………………… 315.0 315.8 316.9 317.4 318.5 320.9 322.9 323.4 325.8 328.9 331.0 330.8 331.5 332.7 313.4 318.4 325.2% Chg Prev Qtr SAAR………..…………… 1.55 1.02 1.39 0.58 1.40 3.09 2.45 0.66 2.98 3.81 2.68 -0.30 0.81 1.53 2.94 1.61 2.13% Chg Same Qtr Last Yr………………… 3.35 2.95 2.63 1.13 1.10 1.61 1.87 1.90 2.29 2.47 2.53 2.28 1.74 1.17 2.94 1.61 2.13
DURABLE GOODS…………………………… 195.8 196.5 197.2 197.9 199.0 201.3 203.5 204.0 205.7 209.0 210.6 211.4 211.9 212.8 193.9 198.9 205.5% Chg Prev Qtr SAAR………..…………… 3.89 1.33 1.46 1.39 2.44 4.68 4.35 0.97 3.41 6.49 3.22 1.45 0.92 1.86 5.55 2.54 3.36% Chg Same Qtr Last Yr………………… 6.05 5.15 4.05 2.01 1.65 2.48 3.21 3.10 3.34 3.79 3.50 3.63 3.00 1.86 5.55 2.54 3.36
NONDURABLE GOODS…………………… 119.2 119.4 119.8 119.5 119.5 119.6 119.4 119.4 120.1 119.9 120.4 119.4 119.6 119.9 119.5 119.6 119.7% Chg Prev Qtr SAAR………..…………… -2.16 0.52 1.26 -0.74 -0.30 0.47 -0.69 0.15 2.24 -0.66 1.75 -3.30 0.61 0.95 -1.04 0.11 0.09% Chg Same Qtr Last Yr………………… -0.79 -0.48 0.38 -0.29 0.18 0.17 -0.32 -0.10 0.54 0.25 0.86 -0.02 -0.42 -0.02 -1.04 0.11 0.09
TRADE, TRANSPORTATION, UTILITIES…… 575.4 578.6 580.2 580.4 582.2 585.7 586.5 590.3 594.0 597.6 600.0 603.1 610.9 615.9 575.1 582.1 592.1% Chg Prev Qtr SAAR………..…………… 0.86 2.27 1.11 0.09 1.29 2.40 0.55 2.64 2.51 2.47 1.59 2.08 5.27 3.34 2.05 1.22 1.71% Chg Same Qtr Last Yr………………… 1.91 1.84 1.40 1.08 1.19 1.22 1.08 1.72 2.02 2.04 2.30 2.16 2.85 3.06 2.05 1.22 1.71
WHOLESALE TRADE……………………… 120.7 121.2 121.3 121.6 122.1 122.2 122.4 122.8 123.6 124.4 125.1 125.6 127.3 129.9 120.5 121.8 123.3% Chg Prev Qtr SAAR………..…………… 1.00 1.56 0.44 0.99 1.54 0.44 0.66 1.09 2.74 2.72 2.27 1.39 5.75 8.42 2.21 1.09 1.22% Chg Same Qtr Last Yr………………… 2.11 1.99 1.36 1.00 1.13 0.85 0.91 0.93 1.23 1.80 2.21 2.28 3.02 4.42 2.21 1.09 1.22
RETAIL TRADE……………………………… 312.6 313.7 313.7 313.4 315.4 317.3 318.2 320.4 321.9 322.9 324.2 326.7 329.3 331.1 312.8 315.0 320.8% Chg Prev Qtr SAAR………..…………… -0.34 1.42 0.00 -0.30 2.58 2.39 1.14 2.75 1.89 1.25 1.70 3.08 3.22 2.25 1.18 0.68 1.86% Chg Same Qtr Last Yr………………… 0.94 1.08 0.45 0.19 0.92 1.16 1.45 2.21 2.04 1.75 1.90 1.98 2.31 2.56 1.18 0.68 1.86
TRANSPORTATION & UTILITIES………… 142.1 143.8 145.2 145.3 144.7 146.2 145.9 147.2 148.5 150.3 150.6 150.8 154.3 154.9 141.8 145.4 148.0% Chg Prev Qtr SAAR………..…………… 3.45 4.77 4.14 0.18 -1.64 4.12 -0.82 3.71 3.67 4.94 0.80 0.53 9.42 1.56 3.89 2.54 1.81% Chg Same Qtr Last Yr………………… 3.95 3.38 3.57 3.12 1.83 1.67 0.44 1.31 2.65 2.85 3.27 2.47 3.86 3.02 3.89 2.54 1.81
INFORMATION………………………………… 42.8 43.3 43.9 44.3 44.2 43.9 43.7 43.7 43.9 44.3 44.1 43.7 43.2 42.4 43.2 44.1 43.9% Chg Prev Qtr SAAR………..…………… -6.28 4.43 5.66 3.38 -0.90 -2.10 -2.11 0.31 1.53 3.69 -1.50 -4.16 -3.91 -7.78 -1.35 2.08 -0.36% Chg Same Qtr Last Yr………………… -2.21 0.54 2.09 1.68 3.11 1.46 -0.46 -1.20 -0.60 0.83 0.99 -0.15 -1.52 -4.36 -1.35 2.08 -0.36
FINANCIAL ACTIVITIES……………………… 136.8 136.8 137.1 137.7 138.6 139.3 140.3 141.3 142.2 142.3 142.5 144.1 145.1 147.5 137.1 138.2 141.5% Chg Prev Qtr SAAR………..…………… -0.68 0.00 0.78 1.86 2.64 2.13 2.71 2.98 2.57 0.19 0.75 4.47 2.90 6.68 0.45 0.78 2.41% Chg Same Qtr Last Yr………………… -0.07 -0.32 -0.53 0.49 1.32 1.85 2.33 2.61 2.60 2.11 1.62 1.98 2.06 3.68 0.45 0.78 2.41
(CONTINUED ON NEXT PAGE)
January 2016
AnnualHistorical Data

2016 TE
NN
ES
SE
E E
CO
NO
MIC
RE
PO
RT
| 5352 | 2016 T
EN
NE
SS
EE
EC
ON
OM
IC R
EP
OR
T
Historical D
ata | AP
PE
ND
IX B
Table 8: Tennessee Nonfarm Employment by Sector, Seasonally Adjusted (thousands of jobs)
2012:3 2012:4 2013:1 2013:2 2013:3 2013:4 2014:1 2014:2 2014:3 2014:4 2015:1 2015:2 2015:3 2015:4 2012 2013 2014
January 2016
AnnualHistorical Data
PROFESSIONAL & BUSINESS SERVICES… 340.7 342.1 346.4 348.6 353.9 363.3 364.6 370.4 376.0 379.5 376.0 381.5 384.0 390.7 338.6 353.1 372.6% Chg Prev Qtr SAAR………..…………… 2.38 1.65 5.12 2.49 6.26 11.06 1.48 6.48 6.15 3.81 -3.60 5.91 2.65 7.20 4.82 4.26 5.54% Chg Same Qtr Last Yr………………… 4.47 3.82 4.05 2.90 3.86 6.19 5.25 6.26 6.24 4.46 3.13 2.99 2.13 2.95 4.82 4.26 5.54
EDUCATION & HEALTH SERVICES………… 394.6 396.5 398.4 398.6 397.5 399.2 400.0 401.1 403.3 406.1 408.1 409.2 409.0 412.8 393.8 398.4 402.6% Chg Prev Qtr SAAR………..…………… 1.67 1.97 1.86 0.23 -1.10 1.76 0.77 1.10 2.21 2.77 2.05 1.08 -0.26 3.84 2.44 1.17 1.05% Chg Same Qtr Last Yr………………… 2.16 2.16 1.82 1.43 0.73 0.68 0.41 0.63 1.46 1.71 2.03 2.03 1.41 1.67 2.44 1.17 1.05
LEISURE & HOSPITALITY…………………… 276.5 279.9 282.7 284.5 287.1 288.9 291.6 295.0 298.5 299.5 299.0 304.5 309.6 310.3 276.8 285.8 296.1% Chg Prev Qtr SAAR………..…………… 0.48 4.96 4.06 2.52 3.75 2.48 3.89 4.65 4.83 1.39 -0.71 7.66 6.82 0.95 3.40 3.26 3.62% Chg Same Qtr Last Yr………………… 2.89 3.26 3.04 2.99 3.82 3.20 3.16 3.69 3.96 3.68 2.51 3.24 3.73 3.62 3.40 3.26 3.62
OTHER SERVICES……………………………… 104.5 104.6 104.8 105.7 105.9 106.0 106.1 106.0 105.7 105.5 104.9 104.5 105.2 104.6 104.3 105.6 105.8% Chg Prev Qtr SAAR………..…………… 1.03 0.26 0.77 3.61 0.76 0.13 0.50 -0.38 -1.00 -1.01 -2.26 -1.27 2.71 -2.51 2.21 1.27 0.21% Chg Same Qtr Last Yr………………… 2.12 1.92 1.03 1.41 1.34 1.31 1.24 0.25 -0.19 -0.47 -1.16 -1.38 -0.47 -0.85 2.21 1.27 0.21
GOVERNMENT………………………………… 423.8 424.2 421.4 427.2 426.1 426.0 425.5 424.9 424.2 426.1 426.2 425.3 423.5 427.5 424.1 425.2 425.2% Chg Prev Qtr SAAR………..…………… 0.70 0.38 -2.61 5.69 -1.03 -0.13 -0.44 -0.56 -0.66 1.77 0.13 -0.90 -1.68 3.83 -0.86 0.25 0.00% Chg Same Qtr Last Yr………………… -0.99 -0.41 -0.98 0.99 0.56 0.43 0.99 -0.54 -0.45 0.02 0.16 0.08 -0.18 0.32 -0.86 0.25 0.00
FEDERAL, CIVILIAN………………………… 50.7 50.4 49.6 49.3 49.9 49.5 49.0 48.6 47.7 46.4 47.5 48.4 47.2 46.6 50.2 49.6 47.9% Chg Prev Qtr SAAR………..…………… 7.43 -2.35 -5.95 -2.66 5.52 -3.69 -3.72 -3.49 -6.69 -10.97 9.83 7.80 -9.56 -4.45 -0.45 -1.23 -3.33% Chg Same Qtr Last Yr………………… -0.78 -0.07 -0.67 -1.00 -1.45 -1.79 -1.21 -1.42 -4.41 -6.27 -3.13 -0.41 -1.19 0.58 -0.45 -1.23 -3.33
STATE & LOCAL……………………………… 373.1 373.8 371.8 378.0 376.2 376.5 376.5 376.4 376.5 379.7 378.8 376.9 376.3 380.8 373.9 375.6 377.3% Chg Prev Qtr SAAR………..…………… -0.18 0.75 -2.16 6.84 -1.86 0.35 0.00 -0.18 0.14 3.48 -1.01 -1.96 -0.64 4.91 -0.91 0.45 0.44% Chg Same Qtr Last Yr………………… -1.02 -0.45 -1.02 1.26 0.83 0.73 1.28 -0.42 0.08 0.85 0.59 0.14 -0.05 0.29 -0.91 0.45 0.44
STATISTICAL DISCREPANCY (% )……… 0.01 -0.01 -0.01 0.01 0.01 -0.01 0.00 0.01 0.01 0.00 -0.04 0.03 0.01 -0.01 -0.01 0.00 0.00
Center for Business and Economic Research, University of Tennessee Tennessee Econometric Model

2016 TE
NN
ES
SE
E E
CO
NO
MIC
RE
PO
RT
| 5554 | 2016 T
EN
NE
SS
EE
EC
ON
OM
IC R
EP
OR
T
AP
PE
ND
IX B
| Historical D
ata
Table 9: Tennessee Durable Goods Manufacturing Employment, Seasonally Adjusted (thousands of jobs)
2012:3 2012:4 2013:1 2013:2 2013:3 2013:4 2014:1 2014:2 2014:3 2014:4 2015:1 2015:2 2015:3 2015:4 2012 2013 2014
TOTAL DURABLE GOODS…………………… 195.8 196.5 197.2 197.9 199.0 201.3 203.5 204.0 205.7 209.0 210.6 211.4 211.9 212.8 193.9 198.9 205.5% Chg Prev Qtr SAAR………..………… 3.89 1.33 1.46 1.39 2.44 4.68 4.35 0.97 3.41 6.49 3.22 1.45 0.92 1.86 5.55 2.54 3.36% Chg Same Qtr Last Yr……………… 6.05 5.15 4.05 2.01 1.65 2.48 3.21 3.10 3.34 3.79 3.50 3.63 3.00 1.86 5.55 2.54 3.36
WOOD PRODUCTS……………………… 11.1 11.0 10.9 10.8 10.8 11.0 11.1 11.1 11.3 11.4 11.5 11.6 11.6 11.7 11.0 10.9 11.2% Chg Prev Qtr SAAR………..………… 1.77 -5.02 -3.40 -1.85 -2.26 6.84 7.11 -0.32 5.29 3.85 4.32 3.36 1.54 2.39 2.25 -1.59 3.44% Chg Same Qtr Last Yr……………… 2.88 1.05 -0.80 -2.16 -3.14 -0.25 2.36 2.76 4.69 3.95 3.26 4.20 3.26 2.90 2.25 -1.59 3.44
NONMETALLIC MINERALS……………… 12.6 12.6 12.6 12.2 12.0 11.9 11.9 11.9 11.9 11.9 11.8 11.7 11.6 11.7 12.5 12.1 11.9% Chg Prev Qtr SAAR………..………… 5.05 1.50 -2.12 -12.01 -6.33 -2.66 0.69 -0.09 1.33 -2.11 -2.65 -3.08 -2.02 0.98 5.80 -2.66 -1.94% Chg Same Qtr Last Yr……………… 5.95 4.70 2.34 -2.11 -4.87 -5.86 -5.19 -2.14 -0.19 -0.06 -0.90 -1.64 -2.47 -1.71 5.80 -2.66 -1.94
PRIMARY METALS………….…………… 9.8 9.7 9.9 9.9 10.0 10.0 10.0 10.0 10.1 10.1 10.2 10.2 10.2 10.3 9.7 10.0 10.1% Chg Prev Qtr SAAR………..………… 4.22 -3.10 8.31 0.28 1.54 2.80 -0.82 0.52 2.99 -0.02 4.49 0.64 0.18 4.01 4.88 3.19 0.99% Chg Same Qtr Last Yr……………… 6.51 4.06 5.65 2.34 1.67 3.19 0.94 1.00 1.36 0.66 1.98 2.01 1.31 2.31 4.88 3.19 0.99
FABRICATED METALS………………….. 34.6 34.3 33.9 33.8 33.9 34.0 34.1 34.3 34.4 34.6 35.3 35.0 35.1 35.1 34.5 33.9 34.4% Chg Prev Qtr SAAR………..………… -1.00 -3.67 -4.19 -0.60 0.73 1.54 1.41 1.98 0.89 2.79 8.43 -3.24 0.99 -0.41 2.66 -1.67 1.35% Chg Same Qtr Last Yr……………… 2.63 0.88 -1.69 -2.38 -1.96 -0.66 0.76 1.41 1.45 1.76 3.48 2.13 2.16 1.35 2.66 -1.67 1.35
MACHINERY………………………………… 25.6 25.6 25.5 25.4 25.3 25.2 25.2 25.2 25.7 26.8 26.2 26.5 26.3 26.0 25.5 25.4 25.7% Chg Prev Qtr SAAR………..………… -3.63 -0.12 -0.38 -1.47 -2.37 -1.19 0.58 -1.41 9.47 17.42 -9.04 4.67 -2.31 -4.64 1.66 -0.70 1.44% Chg Same Qtr Last Yr……………… 1.53 2.37 1.08 -1.41 -1.09 -1.35 -1.12 -1.10 1.77 6.25 3.62 5.18 2.23 -2.95 1.66 -0.70 1.44
COMPUTERS & ELECTRONICS………… 5.5 5.3 5.3 5.3 5.2 5.1 5.0 5.0 5.0 5.0 5.0 5.0 5.1 5.2 5.6 5.2 5.0% Chg Prev Qtr SAAR………..…………-19.67 -12.78 -3.24 -2.26 -5.71 -6.00 -5.71 -0.34 -0.97 -0.40 -0.81 2.03 7.23 5.23 0.58 -7.24 -3.66% Chg Same Qtr Last Yr……………… -2.40 -9.59 -8.47 -9.78 -6.09 -4.32 -4.93 -4.47 -3.29 -1.88 -0.63 -0.05 1.96 3.37 0.58 -7.24 -3.66
ELECTRICAL EQUIPMENT, APPLIANCES & COMPONENTS…………..…………… 17.9 18.0 17.9 18.4 18.8 19.1 19.6 19.1 19.4 19.5 19.8 19.9 19.9 20.0 17.9 18.6 19.4
% Chg Prev Qtr SAAR………..………… -2.13 3.41 -2.56 10.54 10.13 6.72 9.10 -9.34 7.55 1.87 6.37 0.52 0.95 2.43 1.65 3.47 4.49% Chg Same Qtr Last Yr……………… 0.96 1.90 0.38 2.18 5.24 6.07 9.11 3.84 3.22 2.03 1.39 4.04 2.40 2.54 1.65 3.47 4.49
TRANSPORTATION EQUIPMENT……… 55.2 56.7 57.9 58.6 59.9 61.6 62.9 63.7 63.9 65.5 66.5 67.3 67.6 68.4 53.6 59.5 64.0% Chg Prev Qtr SAAR………..………… 19.55 11.71 8.94 4.97 8.90 11.44 8.71 5.58 1.34 10.40 6.39 4.41 2.18 4.45 17.03 11.02 7.55% Chg Same Qtr Last Yr……………… 18.62 17.78 16.37 11.17 8.60 8.54 8.48 8.64 6.70 6.45 5.88 5.59 5.80 4.35 17.03 11.02 7.55
FURNITURE………………………………… 8.8 8.5 8.6 8.8 8.7 9.0 9.1 9.0 9.0 9.2 9.2 9.1 9.2 9.3 8.7 8.8 9.1% Chg Prev Qtr SAAR………..………… -1.57 -12.40 6.21 6.82 -3.03 14.40 3.87 -2.49 1.07 4.77 1.14 -2.60 4.64 2.60 -2.92 1.06 3.50% Chg Same Qtr Last Yr……………… -0.08 -2.69 -0.07 -0.55 -0.92 5.92 5.33 2.96 4.03 1.77 1.09 1.06 1.94 1.41 -2.92 1.06 3.50
MISCELLANEOUS DURABLES………… 14.8 14.7 14.6 14.6 14.5 14.4 14.5 14.6 14.8 15.0 15.0 15.1 15.0 15.2 14.9 14.5 14.7% Chg Prev Qtr SAAR………..………… -2.20 -2.07 -3.38 -0.25 -1.68 -2.79 2.15 2.45 6.53 3.67 2.29 0.46 -1.09 3.79 -2.30 -2.25 1.26% Chg Same Qtr Last Yr……………… -2.68 -2.81 -3.12 -1.98 -1.85 -2.03 -0.66 0.01 2.03 3.69 3.72 3.21 1.32 1.34 -2.30 -2.25 1.26
Tennessee Econometric Model
January 2016
Historical Data Annual
Center for Business and Economic Research, University of Tennessee

2016 TE
NN
ES
SE
E E
CO
NO
MIC
RE
PO
RT
| 5554 | 2016 T
EN
NE
SS
EE
EC
ON
OM
IC R
EP
OR
T
Historical D
ata | AP
PE
ND
IX B
Table 10: Tennessee Nondurable Goods Manufacturing Employment, Seasonally Adjusted (thousands of jobs)
2012:3 2012:4 2013:1 2013:2 2013:3 2013:4 2014:1 2014:2 2014:3 2014:4 2015:1 2015:2 2015:3 2015:4 2012 2013 2014
TOTAL NONDURABLE GOODS………………… 119.2 119.4 119.8 119.5 119.5 119.6 119.4 119.4 120.1 119.9 120.4 119.4 119.6 119.9 119.5 119.6 119.7% Chg Prev Qtr SAAR………..…………… -2.16 0.52 1.26 -0.74 -0.30 0.47 -0.69 0.15 2.24 -0.66 1.75 -3.30 0.61 0.95 -1.04 0.11 0.09% Chg Same Qtr Last Yr…………………… -0.79 -0.48 0.38 -0.29 0.18 0.17 -0.32 -0.10 0.54 0.25 0.86 -0.02 -0.42 -0.02 -1.04 0.11 0.09
FOOD……………………………………………… 32.9 32.5 32.3 32.4 32.4 32.5 32.6 32.6 32.8 32.8 32.9 32.8 32.9 32.9 33.0 32.4 32.7% Chg Prev Qtr SAAR………..…………… -4.74 -4.87 -2.84 1.86 -0.14 1.98 0.46 0.34 2.06 0.78 0.57 -0.90 1.18 -0.09 -0.24 -1.90 0.95% Chg Same Qtr Last Yr…………………… -0.83 -2.27 -3.53 -2.69 -1.53 0.19 1.03 0.66 1.21 0.91 0.94 0.62 0.40 0.19 -0.24 -1.90 0.95
BEVERAGE & TOBACCO……………………… 5.1 5.3 5.3 5.3 5.3 5.3 5.4 5.4 5.4 5.4 5.4 5.4 5.4 5.5 5.2 5.3 5.4% Chg Prev Qtr SAAR………..…………… -2.27 10.49 2.28 0.02 0.73 2.01 2.30 4.87 0.99 -2.88 2.10 -0.29 1.25 4.48 3.51 2.59 1.89% Chg Same Qtr Last Yr…………………… 2.03 3.20 3.30 2.52 3.30 1.26 1.26 2.47 2.53 1.28 1.23 -0.04 0.03 1.87 3.51 2.59 1.89
TEXTILE MILLS, TEXTILE MILL PRODUCTS & APPAREL…………………… 10.6 10.6 10.6 10.4 10.5 10.4 10.3 10.0 9.9 9.8 9.7 9.6 9.5 9.5 10.7 10.5 10.0
% Chg Prev Qtr SAAR………..…………… -3.21 -1.12 -2.01 -4.46 0.54 -1.76 -3.62 -12.11 -3.49 -4.94 -2.96 -4.36 -2.36 -1.35 -0.07 -1.96 -4.53% Chg Same Qtr Last Yr…………………… -0.87 -0.65 -1.38 -2.71 -1.78 -1.94 -2.34 -4.36 -5.33 -6.11 -5.95 -3.94 -3.66 -2.76 -0.07 -1.96 -4.53
PAPER…………………………………………… 14.7 14.6 14.9 14.8 14.6 14.6 14.6 14.6 14.7 14.6 14.4 14.3 14.2 14.3 14.7 14.7 14.6% Chg Prev Qtr SAAR………..…………… -3.80 -1.02 6.54 -3.29 -5.17 0.71 1.13 -0.17 1.29 -3.04 -3.79 -4.36 -0.30 0.24 -3.76 -0.17 -0.53% Chg Same Qtr Last Yr…………………… -3.83 -1.94 1.05 -0.48 -0.83 -0.40 -1.69 -0.91 0.74 -0.21 -1.45 -2.50 -2.89 -2.07 -3.76 -0.17 -0.53
PRINTING & RELATED SUPPORT…………… 9.6 9.6 9.6 9.6 9.6 9.6 9.6 9.5 9.4 9.3 9.2 9.1 9.0 8.9 9.6 9.6 9.5% Chg Prev Qtr SAAR………..…………… 1.04 -1.06 2.19 -0.36 -2.09 0.33 -1.11 -3.59 -2.49 -3.90 -4.23 -7.37 -2.85 -4.00 -3.45 0.08 -1.73% Chg Same Qtr Last Yr…………………… -2.01 -1.68 0.23 0.45 -0.34 0.01 -0.81 -1.63 -1.73 -2.78 -3.56 -4.52 -4.61 -4.63 -3.45 0.08 -1.73
CHEMICALS……………………………………… 24.4 24.5 24.6 24.7 24.8 25.1 25.2 25.4 25.4 25.3 25.3 25.2 25.2 25.2 24.4 24.8 25.3% Chg Prev Qtr SAAR………..…………… -0.04 1.98 2.45 0.70 2.41 3.75 2.23 2.60 1.04 -1.58 -0.50 -2.01 0.95 -0.01 -0.68 1.68 2.12% Chg Same Qtr Last Yr…………………… -1.10 -0.13 1.22 1.27 1.89 2.32 2.27 2.75 2.40 1.06 0.38 -0.77 -0.79 -0.40 -0.68 1.68 2.12
PLASTICS & RUBBER………………………… 20.0 20.3 20.4 20.2 20.1 20.0 20.1 20.4 21.0 21.1 21.2 21.0 21.3 21.5 20.0 20.2 20.7% Chg Prev Qtr SAAR………..…………… -1.82 6.19 3.41 -3.61 -3.70 -1.81 3.64 4.75 12.28 2.93 1.29 -2.99 5.00 3.86 -2.45 1.03 2.39% Chg Same Qtr Last Yr…………………… 0.75 0.89 4.24 0.96 0.48 -1.47 -1.41 0.66 4.60 5.83 5.23 3.23 1.52 1.75 -2.45 1.03 2.39
MISCELLANEOUS NONDURABLE GOODS… 1.9 2.0 2.1 2.1 2.3 2.1 1.6 1.6 1.5 1.5 2.3 2.1 1.9 2.1 1.9 2.1 1.5% Chg Prev Qtr SAAR………..…………… 18.23 23.04 5.63 4.87 40.57 -26.92 -67.39 -6.11 -18.82 16.47 366.98 -30.68 -20.70 32.68 14.54 12.53 -27.54% Chg Same Qtr Last Yr…………………… 13.22 24.21 17.47 12.67 17.65 3.28 -23.01 -25.11 -34.72 -26.65 42.69 32.27 31.50 35.85 14.54 12.53 -27.54
Tennessee Econometric Model
Annual
January 2016
Center for Business and Economic Research, University of Tennessee
Historical Data

2016 TE
NN
ES
SE
E E
CO
NO
MIC
RE
PO
RT
| 5756 | 2016 T
EN
NE
SS
EE
EC
ON
OM
IC R
EP
OR
T
AP
PE
ND
IX B
| Historical D
ata
Table 11: Tennessee Average Annual Wage and Salary Rate by Sector, Not Seasonally Adjusted (2009 dollars)
2012:2 2012:3 2012:4 2013:1 2013:2 2013:3 2013:4 2014:1 2014:2 2014:3 2014:4 2015:1 2015:2 2015:3 2012 2013 2014
TOTAL NONFARM…………………………………41938 41847 41875 41917 41417 41569 41000 42227 41757 41951 41958 42800 43201 43357 41975 41476 41973% Chg Same Qtr Last Yr………………… 1.72 0.67 3.60 -0.76 -1.24 -0.66 -2.09 0.74 0.82 0.92 2.34 1.36 3.46 3.35 1.57 -1.19 1.20
NATURAL RESOURCES, MINING AND CONSTRUCTION……………………… 45180 44064 45129 47622 45052 44612 45684 48760 46969 46199 46897 49386 49672 49815 45973 45742 47206
% Chg Same Qtr Last Yr………………… -2.06 -1.26 4.46 -3.83 -0.28 1.24 1.23 2.39 4.26 3.56 2.65 1.28 5.75 7.83 1.02 -0.50 3.20
MANUFACTURING…………………………… 53288 50255 51676 51249 50615 50846 50852 51414 51486 51268 52252 50170 52689 53229 51672 50890 51605% Chg Same Qtr Last Yr………………… 6.22 -1.59 4.19 -0.43 -5.02 1.18 -1.59 0.32 1.72 0.83 2.75 -2.42 2.34 3.83 1.83 -1.51 1.40
DURABLE GOODS………………………… 53801 49322 50848 49959 49263 49277 49527 49931 50474 50221 51352 49136 51051 51364 51262 49507 50494% Chg Same Qtr Last Yr………………… 10.13 -1.00 3.76 -2.19 -8.43 -0.09 -2.60 -0.06 2.46 1.92 3.68 -1.59 1.14 2.27 3.20 -3.43 2.00
NONDURABLE GOODS…………………… 52457 51785 53036 53378 52854 53456 53079 53945 53217 53056 53820 51982 55594 56527 52342 53192 53509% Chg Same Qtr Last Yr………………… 0.59 -2.26 4.98 2.48 0.76 3.23 0.08 1.06 0.69 -0.75 1.40 -3.64 4.47 6.54 -0.06 1.62 0.60
TRADE, TRANSPORTATION, UTILITIES… 38979 38487 38469 38416 38602 38370 37510 38925 38262 38506 39298 38999 39131 39138 38773 38224 38748% Chg Same Qtr Last Yr………………… 1.13 -0.55 2.13 -1.89 -0.97 -0.30 -2.49 1.32 -0.88 0.35 4.77 0.19 2.27 1.64 0.64 -1.41 1.37
WHOLESALE TRADE………………………58391 56984 61541 57278 58056 57634 57843 59347 58168 58938 60235 58850 59725 59131 58800 57703 59172% Chg Same Qtr Last Yr………………… 1.80 -0.36 8.62 -1.73 -0.57 1.14 -6.01 3.61 0.19 2.26 4.14 -0.84 2.68 0.33 2.48 -1.87 2.55
RETAIL TRADE………………………………27109 26636 25778 26518 26245 26376 25418 26546 26099 26255 27142 26461 26647 26986 26727 26139 26510% Chg Same Qtr Last Yr………………… 1.82 -2.75 -2.54 -3.17 -3.19 -0.98 -1.40 0.11 -0.56 -0.46 6.79 -0.32 2.10 2.78 -0.75 -2.20 1.42
TRANSPORTATION & UTILITIES…………48674 48688 47170 48170 48876 48108 47186 48659 48033 47892 48386 49287 49003 48479 48347 48085 48242% Chg Same Qtr Last Yr………………… -1.22 1.07 0.75 -1.40 0.41 -1.19 0.03 1.01 -1.72 -0.45 2.54 1.29 2.02 1.23 -0.37 -0.54 0.33
INFORMATION………………………………… 54425 55449 55942 53905 54646 54905 52932 56947 56566 56597 53456 57018 56909 58773 55114 54097 55891% Chg Same Qtr Last Yr………………… 0.37 2.96 3.66 -1.35 0.41 -0.98 -5.38 5.64 3.51 3.08 0.99 0.12 0.61 3.84 1.74 -1.85 3.32
FINANCIAL ACTIVITIES……………………… 64773 62827 64496 61642 61501 61126 62205 63905 62700 62454 63963 63729 64660 64744 63321 61619 63255% Chg Same Qtr Last Yr………………… 10.75 3.20 7.12 0.74 -5.05 -2.71 -3.55 3.67 1.95 2.17 2.83 -0.28 3.13 3.67 5.06 -2.69 2.66
PROFESSIONAL & BUSINESS SERVICES 47123 48785 49331 49718 48661 48549 46718 48376 47781 47545 46934 51501 52018 50679 48621 48412 47659% Chg Same Qtr Last Yr………………… 1.35 5.76 11.60 0.96 3.26 -0.48 -5.30 -2.70 -1.81 -2.07 0.46 6.46 8.87 6.59 5.38 -0.43 -1.55
EDUCATION & HEALTH SERVICES……… 42605 42975 42811 42581 42666 42978 42012 42982 42771 43038 42373 43798 43759 44501 42834 42559 42791% Chg Same Qtr Last Yr………………… -1.76 -0.72 1.52 -0.84 0.14 0.01 -1.87 0.94 0.25 0.14 0.86 1.90 2.31 3.40 -0.14 -0.64 0.55
LEISURE & HOSPITALITY……………………19717 19672 20121 20342 19197 19245 19945 20544 19670 19619 20810 21199 21089 20653 20227 19682 20161% Chg Same Qtr Last Yr………………… 2.08 -1.63 1.57 -4.95 -2.64 -2.17 -0.87 1.00 2.47 1.94 4.34 3.19 7.21 5.27 1.14 -2.70 2.43
OTHER SERVICES…………………………… 38018 37130 37470 37187 36508 37294 37921 39219 37997 38525 39681 40082 40132 40532 37500 37228 38855% Chg Same Qtr Last Yr………………… 4.39 0.85 0.97 -0.52 -3.97 0.44 1.21 5.46 4.08 3.30 4.64 2.20 5.62 5.21 0.81 -0.73 4.37
GOVERNMENT…………………………………39061 40783 38079 38805 38941 39804 38108 38707 39794 41047 38350 38975 39702 40934 39121 38914 39475% Chg Same Qtr Last Yr………………… -1.34 1.15 -0.50 0.63 -0.31 -2.40 0.07 -0.25 2.19 3.12 0.64 0.69 -0.23 -0.28 -0.23 -0.53 1.44
FEDERAL, CIVILIAN……………………… 67383 66795 65888 65516 65431 64778 67683 69951 71162 72342 72587 74426 74425 75277 67023 65852 71511% Chg Same Qtr Last Yr………………… -0.60 -1.14 -2.79 -3.69 -2.90 -3.02 2.72 6.77 8.76 11.68 7.25 6.40 4.59 4.06 -1.35 -1.75 8.59
STATE & LOCAL…………………………… 35229 37162 34446 35292 35437 36403 34353 34715 35669 36967 34175 34606 35290 36451 35381 35371 35381% Chg Same Qtr Last Yr………………… -1.54 1.67 0.16 1.75 0.59 -2.04 -0.27 -1.63 0.66 1.55 -0.52 -0.31 -1.06 -1.39 0.05 -0.03 0.03
January 2016Historical Data Annual
Center for Business and Economic Research, University of Tennessee Tennessee Econometric Model

2016 TE
NN
ES
SE
E E
CO
NO
MIC
RE
PO
RT
| 5756 | 2016 T
EN
NE
SS
EE
EC
ON
OM
IC R
EP
OR
T
Historical D
ata | AP
PE
ND
IX B
Table 12: Tennessee Average Annual Wage and Salary Rate by Sector, Seasonally Adjusted (2009 dollars)
2012:2 2012:3 2012:4 2013:1 2013:2 2013:3 2013:4 2014:1 2014:2 2014:3 2014:4 2015:1 2015:2 2015:3 2012 2013 2014
TOTAL NONFARM………………………………… 41978 41745 42345 41492 41477 41449 41474 41853 41816 41824 42351 42429 43281 43269 41968 41473 41961% Chg Prev Qtr SAAR………..…………… 1.69 -2.20 5.87 -7.81 -0.15 -0.27 0.24 3.71 -0.36 0.07 5.14 0.73 8.28 -0.11 1.59 -1.18 1.18% Chg Same Qtr Last Yr………………… 1.70 0.60 3.74 -0.74 -1.19 -0.71 -2.06 0.87 0.82 0.90 2.12 1.37 3.50 3.46 1.59 -1.18 1.18
NATURAL RESOURCES, MINING AND CONSTRUCTION……………………… 45249 45214 45743 45709 45289 45705 46233 46842 47267 47299 47447 47468 50063 51066 45915 45734 47214
% Chg Prev Qtr SAAR………..……………-17.31 -0.31 4.76 -0.30 -3.63 3.73 4.70 5.37 3.68 0.27 1.26 0.17 23.73 8.26 1.09 -0.39 3.24% Chg Same Qtr Last Yr………………… -1.85 -1.16 4.35 -3.67 0.09 1.08 1.07 2.48 4.37 3.49 2.63 1.34 5.91 7.96 1.09 -0.39 3.24
MANUFACTURING………………………………53296 50341 51782 51066 50623 50896 50965 51261 51478 51296 52377 50042 52672 53241 51667 50887 51603% Chg Prev Qtr SAAR………..…………… 16.96 -20.40 11.95 -5.42 -3.42 2.17 0.55 2.34 1.71 -1.41 8.70 -16.67 22.74 4.39 1.83 -1.51 1.41% Chg Same Qtr Last Yr………………… 6.24 -1.66 4.18 -0.36 -5.02 1.10 -1.58 0.38 1.69 0.79 2.77 -2.38 2.32 3.79 1.83 -1.51 1.41
DURABLE GOODS……………………………53820 49385 50928 49812 49294 49288 49624 49811 50501 50190 51470 49035 51073 51311 51259 49504 50493% Chg Prev Qtr SAAR………..…………… 24.98 -29.11 13.10 -8.48 -4.10 -0.05 2.75 1.52 5.66 -2.44 10.59 -17.62 17.69 1.88 3.21 -3.42 2.00% Chg Same Qtr Last Yr………………… 10.19 -1.09 3.77 -2.14 -8.41 -0.20 -2.56 0.00 2.45 1.83 3.72 -1.56 1.13 2.23 3.21 -3.42 2.00
NONDURABLE GOODS…………………… 52448 51912 53185 53130 52823 53577 53221 53733 53147 53191 53957 51806 55504 56665 52336 53188 53507% Chg Prev Qtr SAAR………..…………… 5.10 -4.03 10.17 -0.41 -2.29 5.83 -2.63 3.91 -4.29 0.33 5.89 -15.02 31.76 8.63 -0.05 1.63 0.60% Chg Same Qtr Last Yr………………… 0.55 -2.28 4.94 2.57 0.72 3.21 0.07 1.13 0.61 -0.72 1.38 -3.59 4.43 6.53 -0.05 1.63 0.60
TRADE, TRANSPORTATION, UTILITIES…… 38870 38405 39147 37918 38480 38282 38188 38469 38137 38411 39848 38539 39120 39083 38768 38217 38716% Chg Prev Qtr SAAR………..…………… 2.29 -4.70 7.96 -11.98 6.07 -2.04 -0.98 2.97 -3.41 2.90 15.83 -12.50 6.17 -0.38 0.65 -1.42 1.31% Chg Same Qtr Last Yr………………… 1.10 -0.60 2.29 -1.90 -1.00 -0.32 -2.45 1.45 -0.89 0.34 4.35 0.18 2.58 1.75 0.65 -1.42 1.31
WHOLESALE TRADE……………………… 58505 57078 61693 56885 58199 57728 58000 58927 58310 59033 60332 58427 59820 59333 58788 57703 59151% Chg Prev Qtr SAAR………..…………… 4.40 -9.40 36.48 -27.72 9.57 -3.20 1.90 6.54 -4.12 5.05 9.10 -12.04 9.88 -3.22 2.50 -1.85 2.51% Chg Same Qtr Last Yr………………… 1.80 -0.42 8.70 -1.72 -0.52 1.14 -5.99 3.59 0.19 2.26 4.02 -0.85 2.59 0.51 2.50 -1.85 2.51
RETAIL TRADE……………………………… 27020 26511 26391 26095 26133 26248 26040 26187 25985 26122 27638 26058 26636 26915 26719 26129 26483% Chg Prev Qtr SAAR………..…………… 0.99 -7.32 -1.80 -4.42 0.59 1.77 -3.13 2.28 -3.05 2.13 25.32 -20.98 9.18 4.25 -0.77 -2.21 1.36% Chg Same Qtr Last Yr………………… 1.77 -2.81 -2.27 -3.19 -3.28 -0.99 -1.33 0.35 -0.57 -0.48 6.14 -0.49 2.51 3.04 -0.77 -2.21 1.36
TRANSPORTATION & UTILITIES………… 48398 48700 47969 47606 48607 48108 47993 48091 47761 47881 49116 48883 48927 48343 48338 48078 48212% Chg Prev Qtr SAAR………..…………… 0.94 2.52 -5.87 -2.99 8.68 -4.05 -0.95 0.82 -2.72 1.01 10.72 -1.88 0.36 -4.69 -0.38 -0.54 0.28% Chg Same Qtr Last Yr………………… -1.20 1.02 0.76 -1.40 0.43 -1.22 0.05 1.02 -1.74 -0.47 2.34 1.65 2.44 0.96 -0.38 -0.54 0.28
INFORMATION………………………………… 54592 55233 56244 53741 54687 54698 53213 56947 56652 56425 53617 57061 57039 58274 55156 54085 55910% Chg Prev Qtr SAAR………..…………… 0.26 4.78 7.53 -16.65 7.23 0.08 -10.42 31.16 -2.05 -1.59 -18.47 28.28 -0.15 8.95 1.83 -1.94 3.38% Chg Same Qtr Last Yr………………… 0.52 2.95 3.97 -1.49 0.17 -0.97 -5.39 5.97 3.59 3.16 0.76 0.20 0.68 3.28 1.83 -1.94 3.38
FINANCIAL ACTIVITIES……………………… 64915 63010 64653 61178 61501 61317 62353 63479 62700 62615 64098 63490 64615 64863 63326 61587 63223% Chg Prev Qtr SAAR………..…………… 30.56 -11.23 10.84 -19.83 2.13 -1.19 6.93 7.42 -4.82 -0.54 9.81 -3.74 7.28 1.54 5.04 -2.75 2.66% Chg Same Qtr Last Yr………………… 10.54 3.18 7.20 0.74 -5.26 -2.69 -3.56 3.76 1.95 2.12 2.80 0.02 3.05 3.59 5.04 -2.75 2.66
January 2016
Historical Data Annual
(CONTINUED ON NEXT PAGE)
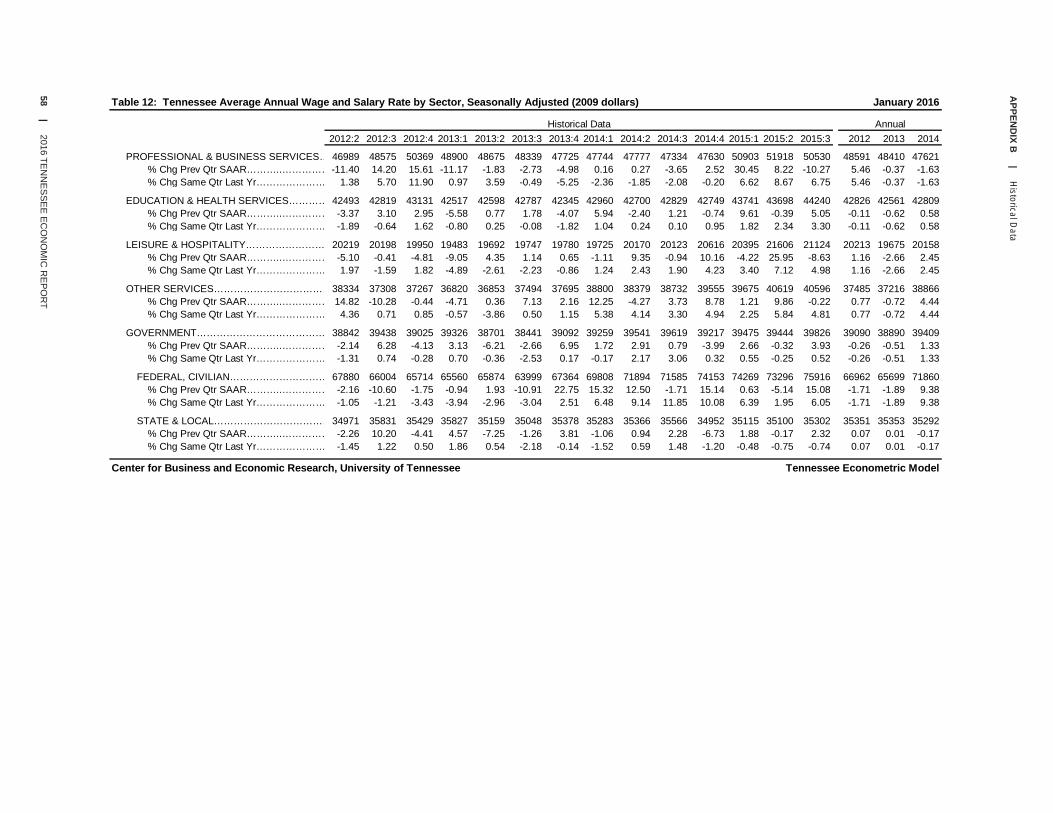
2016 TE
NN
ES
SE
E E
CO
NO
MIC
RE
PO
RT
| 5958 | 2016 T
EN
NE
SS
EE
EC
ON
OM
IC R
EP
OR
T
AP
PE
ND
IX B
| Historical D
ata
Table 12: Tennessee Average Annual Wage and Salary Rate by Sector, Seasonally Adjusted (2009 dollars)
2012:2 2012:3 2012:4 2013:1 2013:2 2013:3 2013:4 2014:1 2014:2 2014:3 2014:4 2015:1 2015:2 2015:3 2012 2013 2014
January 2016
Historical Data Annual
PROFESSIONAL & BUSINESS SERVICES… 46989 48575 50369 48900 48675 48339 47725 47744 47777 47334 47630 50903 51918 50530 48591 48410 47621% Chg Prev Qtr SAAR………..……………-11.40 14.20 15.61 -11.17 -1.83 -2.73 -4.98 0.16 0.27 -3.65 2.52 30.45 8.22 -10.27 5.46 -0.37 -1.63% Chg Same Qtr Last Yr………………… 1.38 5.70 11.90 0.97 3.59 -0.49 -5.25 -2.36 -1.85 -2.08 -0.20 6.62 8.67 6.75 5.46 -0.37 -1.63
EDUCATION & HEALTH SERVICES………… 42493 42819 43131 42517 42598 42787 42345 42960 42700 42829 42749 43741 43698 44240 42826 42561 42809% Chg Prev Qtr SAAR………..…………… -3.37 3.10 2.95 -5.58 0.77 1.78 -4.07 5.94 -2.40 1.21 -0.74 9.61 -0.39 5.05 -0.11 -0.62 0.58% Chg Same Qtr Last Yr………………… -1.89 -0.64 1.62 -0.80 0.25 -0.08 -1.82 1.04 0.24 0.10 0.95 1.82 2.34 3.30 -0.11 -0.62 0.58
LEISURE & HOSPITALITY…………………… 20219 20198 19950 19483 19692 19747 19780 19725 20170 20123 20616 20395 21606 21124 20213 19675 20158% Chg Prev Qtr SAAR………..…………… -5.10 -0.41 -4.81 -9.05 4.35 1.14 0.65 -1.11 9.35 -0.94 10.16 -4.22 25.95 -8.63 1.16 -2.66 2.45% Chg Same Qtr Last Yr………………… 1.97 -1.59 1.82 -4.89 -2.61 -2.23 -0.86 1.24 2.43 1.90 4.23 3.40 7.12 4.98 1.16 -2.66 2.45
OTHER SERVICES………………………………38334 37308 37267 36820 36853 37494 37695 38800 38379 38732 39555 39675 40619 40596 37485 37216 38866% Chg Prev Qtr SAAR………..…………… 14.82 -10.28 -0.44 -4.71 0.36 7.13 2.16 12.25 -4.27 3.73 8.78 1.21 9.86 -0.22 0.77 -0.72 4.44% Chg Same Qtr Last Yr………………… 4.36 0.71 0.85 -0.57 -3.86 0.50 1.15 5.38 4.14 3.30 4.94 2.25 5.84 4.81 0.77 -0.72 4.44
GOVERNMENT………………………………… 38842 39438 39025 39326 38701 38441 39092 39259 39541 39619 39217 39475 39444 39826 39090 38890 39409% Chg Prev Qtr SAAR………..…………… -2.14 6.28 -4.13 3.13 -6.21 -2.66 6.95 1.72 2.91 0.79 -3.99 2.66 -0.32 3.93 -0.26 -0.51 1.33% Chg Same Qtr Last Yr………………… -1.31 0.74 -0.28 0.70 -0.36 -2.53 0.17 -0.17 2.17 3.06 0.32 0.55 -0.25 0.52 -0.26 -0.51 1.33
FEDERAL, CIVILIAN………………………… 67880 66004 65714 65560 65874 63999 67364 69808 71894 71585 74153 74269 73296 75916 66962 65699 71860% Chg Prev Qtr SAAR………..…………… -2.16 -10.60 -1.75 -0.94 1.93 -10.91 22.75 15.32 12.50 -1.71 15.14 0.63 -5.14 15.08 -1.71 -1.89 9.38% Chg Same Qtr Last Yr………………… -1.05 -1.21 -3.43 -3.94 -2.96 -3.04 2.51 6.48 9.14 11.85 10.08 6.39 1.95 6.05 -1.71 -1.89 9.38
STATE & LOCAL………………………………34971 35831 35429 35827 35159 35048 35378 35283 35366 35566 34952 35115 35100 35302 35351 35353 35292% Chg Prev Qtr SAAR………..…………… -2.26 10.20 -4.41 4.57 -7.25 -1.26 3.81 -1.06 0.94 2.28 -6.73 1.88 -0.17 2.32 0.07 0.01 -0.17% Chg Same Qtr Last Yr………………… -1.45 1.22 0.50 1.86 0.54 -2.18 -0.14 -1.52 0.59 1.48 -1.20 -0.48 -0.75 -0.74 0.07 0.01 -0.17
Center for Business and Economic Research, University of Tennessee Tennessee Econometric Model

2016 TE
NN
ES
SE
E E
CO
NO
MIC
RE
PO
RT
| 5958 | 2016 T
EN
NE
SS
EE
EC
ON
OM
IC R
EP
OR
T
Historical D
ata | AP
PE
ND
IX B
Table 13: Tennessee Average Annual Wage and Salary Rate by Sector, Not Seasonally Adjusted (current dollars)
2012:2 2012:3 2012:4 2013:1 2013:2 2013:3 2013:4 2014:1 2014:2 2014:3 2014:4 2015:1 2015:2 2015:3 2012 2013 2014
TOTAL NONFARM……………………………………… 44406 44455 44724 44921 44434 44781 44324 45834 45564 45912 45869 46564 47258 47577 44544 44615 45795% Chg Same Qtr Last Yr……………………… 3.52 2.24 5.42 0.74 0.06 0.73 -0.89 2.03 2.54 2.52 3.49 1.59 3.72 3.63 3.50 0.16 2.64
NATURAL RESOURCES, MINING AND CONSTRUCTION…………………………… 47839 46810 48200 51034 48333 48060 49388 52924 51251 50561 51268 53729 54336 54664 48780 49204 51501
% Chg Same Qtr Last Yr……………………… -0.33 0.28 6.30 -2.37 1.03 2.67 2.47 3.70 6.04 5.20 3.81 1.52 6.02 8.12 2.94 0.87 4.67
MANUFACTURING………………………………… 56424 53387 55192 54922 54301 54775 54975 55804 56180 56108 57123 54583 57637 58410 54834 54743 56304% Chg Same Qtr Last Yr……………………… 8.10 -0.05 6.02 1.09 -3.76 2.60 -0.39 1.61 3.46 2.43 3.91 -2.19 2.59 4.10 3.76 -0.16 2.85
DURABLE GOODS……………………………… 56967 52396 54307 53539 52852 53086 53543 54195 55076 54963 56139 53457 55845 56363 54398 53255 55093% Chg Same Qtr Last Yr……………………… 12.08 0.55 5.58 -0.71 -7.22 1.32 -1.41 1.23 4.21 3.54 4.85 -1.36 1.40 2.55 5.16 -2.10 3.45
NONDURABLE GOODS………………………… 55545 55012 56645 57203 56704 57587 57383 58552 58069 58065 58837 56554 60814 62028 55547 57219 58381% Chg Same Qtr Last Yr……………………… 2.37 -0.73 6.83 4.03 2.09 4.68 1.30 2.36 2.41 0.83 2.53 -3.41 4.73 6.83 1.85 3.01 2.03
TRADE, TRANSPORTATION, UTILITIES…………41272 40886 41086 41169 41414 41335 40551 42249 41751 42141 42961 42428 42806 42948 41145 41117 42276% Chg Same Qtr Last Yr……………………… 2.92 1.01 3.92 -0.40 0.34 1.10 -1.30 2.62 0.81 1.95 5.94 0.42 2.53 1.91 2.55 -0.07 2.82
WHOLESALE TRADE…………………………… 61828 60535 65728 61382 62285 62087 62533 64415 63471 64502 65850 64026 65334 64887 62404 62072 64560% Chg Same Qtr Last Yr……………………… 3.60 1.20 10.53 -0.23 0.74 2.56 -4.86 4.94 1.90 3.89 5.31 -0.60 2.93 0.60 4.44 -0.53 4.01
RETAIL TRADE……………………………………28705 28296 27532 28418 28156 28414 27478 28813 28478 28734 29672 28788 29150 29612 28361 28117 28924% Chg Same Qtr Last Yr……………………… 3.63 -1.23 -0.82 -1.70 -1.91 0.42 -0.19 1.39 1.14 1.12 7.98 -0.09 2.36 3.06 1.12 -0.86 2.87
TRANSPORTATION & UTILITIES………………51539 51723 50380 51622 52436 51825 51012 52814 52412 52413 52897 53622 53605 53198 51303 51724 52634% Chg Same Qtr Last Yr……………………… 0.53 2.65 2.52 0.10 1.74 0.20 1.25 2.31 -0.05 1.13 3.70 1.53 2.27 1.50 1.53 0.82 1.76
INFORMATION……………………………………… 57628 58904 59749 57767 58626 59148 57223 61810 61723 61940 58439 62033 62253 64493 58490 58191 60978% Chg Same Qtr Last Yr……………………… 2.14 4.57 5.48 0.15 1.73 0.41 -4.23 7.00 5.28 4.72 2.12 0.36 0.86 4.12 3.67 -0.51 4.79
FINANCIAL ACTIVITIES…………………………… 68585 66742 68884 66060 65981 65850 67248 69362 68417 68350 69925 69333 70732 71046 67200 66285 69014% Chg Same Qtr Last Yr……………………… 12.72 4.82 9.01 2.27 -3.80 -1.34 -2.37 5.00 3.69 3.80 3.98 -0.04 3.38 3.94 7.06 -1.36 4.12
PROFESSIONAL & BUSINESS SERVICES…… 49896 51826 52688 53281 52206 52301 50506 52508 52137 52034 51309 56030 56903 55612 51599 52073 51997% Chg Same Qtr Last Yr……………………… 3.14 7.41 13.56 2.49 4.63 0.92 -4.14 -1.45 -0.13 -0.51 1.59 6.71 9.14 6.88 7.40 0.92 -0.15
EDUCATION & HEALTH SERVICES………………45113 45653 45723 45632 45774 46299 45418 46652 46670 47102 46323 47650 47868 48832 45455 45781 46687% Chg Same Qtr Last Yr……………………… -0.02 0.83 3.30 0.66 1.46 1.41 -0.67 2.24 1.96 1.73 1.99 2.14 2.57 3.67 1.75 0.72 1.98
LEISURE & HOSPITALITY………………………… 20877 20898 21490 21799 20595 20732 21563 22299 21463 21471 22750 23063 23069 22663 21464 21172 21996% Chg Same Qtr Last Yr……………………… 3.89 -0.09 3.36 -3.50 -1.35 -0.79 0.34 2.29 4.22 3.57 5.51 3.43 7.48 5.55 3.06 -1.36 3.89
OTHER SERVICES………………………………… 40255 39444 40019 39852 39167 40177 40996 42568 41461 42162 43380 43608 43901 44477 39795 40048 42393% Chg Same Qtr Last Yr……………………… 6.23 2.43 2.75 0.99 -2.70 1.86 2.44 6.82 5.85 4.94 5.81 2.44 5.89 5.49 2.73 0.64 5.86
GOVERNMENT……………………………………… 41360 43324 40670 41585 41777 42880 41198 42013 43422 44923 41925 42403 43431 44918 41515 41860 43071% Chg Same Qtr Last Yr……………………… 0.41 2.73 1.25 2.16 1.01 -1.02 1.30 1.03 3.94 4.76 1.77 0.93 0.02 -0.01 1.66 0.83 2.89
FEDERAL, CIVILIAN………………………………71349 70958 70371 70210 70197 69784 73171 75924 77650 79172 79354 80972 81414 82604 71122 70841 78025% Chg Same Qtr Last Yr……………………… 1.16 0.41 -1.08 -2.23 -1.61 -1.65 3.98 8.14 10.62 13.45 8.45 6.65 4.85 4.33 0.52 -0.40 10.14
STATE & LOCAL………………………………… 37302 39478 36790 37821 38018 39216 37138 37679 38921 40457 37360 37650 38604 39999 37546 38048 38604% Chg Same Qtr Last Yr……………………… 0.21 3.27 1.92 3.29 1.92 -0.66 0.95 -0.37 2.38 3.16 0.60 -0.08 -0.81 -1.13 1.94 1.34 1.46
January 2016Historical Data Annual
Center for Business and Economic Research, University of Tennessee Tennessee Econometric Model
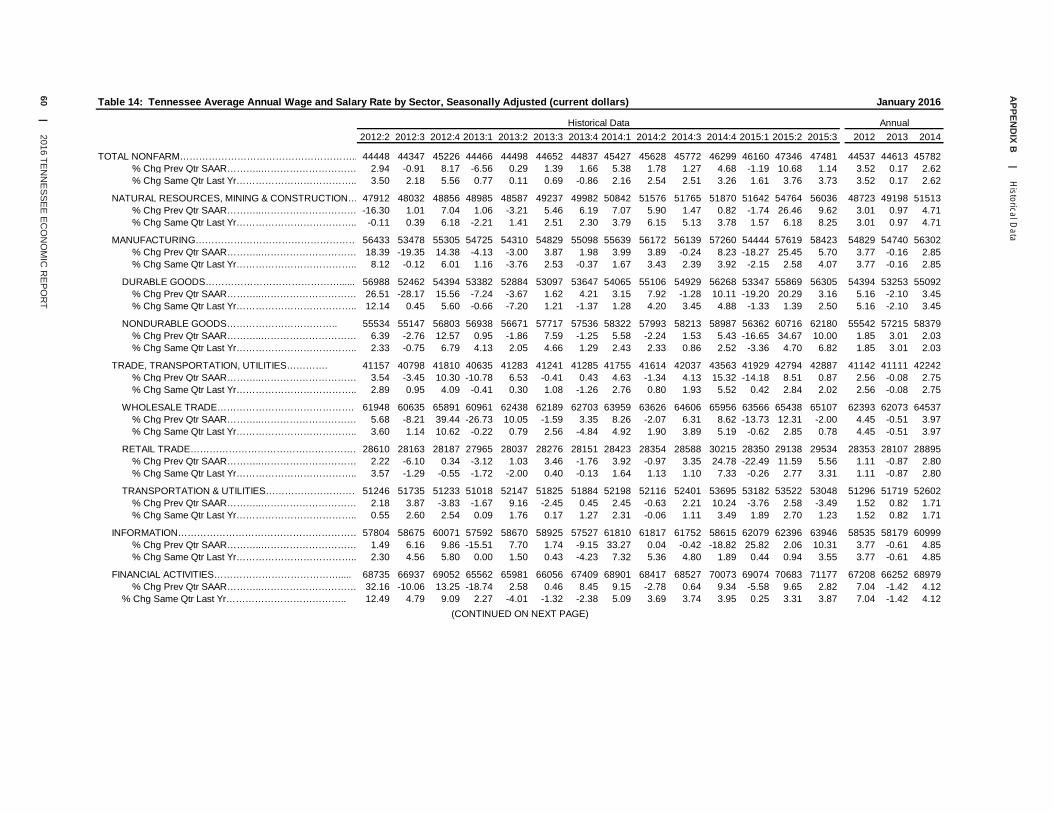
2016 TE
NN
ES
SE
E E
CO
NO
MIC
RE
PO
RT
| 6160 | 2016 T
EN
NE
SS
EE
EC
ON
OM
IC R
EP
OR
T
AP
PE
ND
IX B
| Historical D
ata
Table 14: Tennessee Average Annual Wage and Salary Rate by Sector, Seasonally Adjusted (current dollars)
2012:2 2012:3 2012:4 2013:1 2013:2 2013:3 2013:4 2014:1 2014:2 2014:3 2014:4 2015:1 2015:2 2015:3 2012 2013 2014
TOTAL NONFARM……………………………………………….. 44448 44347 45226 44466 44498 44652 44837 45427 45628 45772 46299 46160 47346 47481 44537 44613 45782% Chg Prev Qtr SAAR………..………………………… 2.94 -0.91 8.17 -6.56 0.29 1.39 1.66 5.38 1.78 1.27 4.68 -1.19 10.68 1.14 3.52 0.17 2.62% Chg Same Qtr Last Yr……………………………….. 3.50 2.18 5.56 0.77 0.11 0.69 -0.86 2.16 2.54 2.51 3.26 1.61 3.76 3.73 3.52 0.17 2.62
NATURAL RESOURCES, MINING & CONSTRUCTION… 47912 48032 48856 48985 48587 49237 49982 50842 51576 51765 51870 51642 54764 56036 48723 49198 51513% Chg Prev Qtr SAAR………..………………………… -16.30 1.01 7.04 1.06 -3.21 5.46 6.19 7.07 5.90 1.47 0.82 -1.74 26.46 9.62 3.01 0.97 4.71% Chg Same Qtr Last Yr……………………………….. -0.11 0.39 6.18 -2.21 1.41 2.51 2.30 3.79 6.15 5.13 3.78 1.57 6.18 8.25 3.01 0.97 4.71
MANUFACTURING…………………………………………… 56433 53478 55305 54725 54310 54829 55098 55639 56172 56139 57260 54444 57619 58423 54829 54740 56302% Chg Prev Qtr SAAR………..………………………… 18.39 -19.35 14.38 -4.13 -3.00 3.87 1.98 3.99 3.89 -0.24 8.23 -18.27 25.45 5.70 3.77 -0.16 2.85% Chg Same Qtr Last Yr……………………………….. 8.12 -0.12 6.01 1.16 -3.76 2.53 -0.37 1.67 3.43 2.39 3.92 -2.15 2.58 4.07 3.77 -0.16 2.85
DURABLE GOODS……………………………………...... 56988 52462 54394 53382 52884 53097 53647 54065 55106 54929 56268 53347 55869 56305 54394 53253 55092% Chg Prev Qtr SAAR………..………………………… 26.51 -28.17 15.56 -7.24 -3.67 1.62 4.21 3.15 7.92 -1.28 10.11 -19.20 20.29 3.16 5.16 -2.10 3.45% Chg Same Qtr Last Yr……………………………….. 12.14 0.45 5.60 -0.66 -7.20 1.21 -1.37 1.28 4.20 3.45 4.88 -1.33 1.39 2.50 5.16 -2.10 3.45
NONDURABLE GOODS…………………………….. 55534 55147 56803 56938 56671 57717 57536 58322 57993 58213 58987 56362 60716 62180 55542 57215 58379% Chg Prev Qtr SAAR………..………………………… 6.39 -2.76 12.57 0.95 -1.86 7.59 -1.25 5.58 -2.24 1.53 5.43 -16.65 34.67 10.00 1.85 3.01 2.03% Chg Same Qtr Last Yr……………………………….. 2.33 -0.75 6.79 4.13 2.05 4.66 1.29 2.43 2.33 0.86 2.52 -3.36 4.70 6.82 1.85 3.01 2.03
TRADE, TRANSPORTATION, UTILITIES…………. 41157 40798 41810 40635 41283 41241 41285 41755 41614 42037 43563 41929 42794 42887 41142 41111 42242% Chg Prev Qtr SAAR………..………………………… 3.54 -3.45 10.30 -10.78 6.53 -0.41 0.43 4.63 -1.34 4.13 15.32 -14.18 8.51 0.87 2.56 -0.08 2.75% Chg Same Qtr Last Yr……………………………….. 2.89 0.95 4.09 -0.41 0.30 1.08 -1.26 2.76 0.80 1.93 5.52 0.42 2.84 2.02 2.56 -0.08 2.75
WHOLESALE TRADE……………………………………. 61948 60635 65891 60961 62438 62189 62703 63959 63626 64606 65956 63566 65438 65107 62393 62073 64537% Chg Prev Qtr SAAR………..………………………… 5.68 -8.21 39.44 -26.73 10.05 -1.59 3.35 8.26 -2.07 6.31 8.62 -13.73 12.31 -2.00 4.45 -0.51 3.97% Chg Same Qtr Last Yr……………………………….. 3.60 1.14 10.62 -0.22 0.79 2.56 -4.84 4.92 1.90 3.89 5.19 -0.62 2.85 0.78 4.45 -0.51 3.97
RETAIL TRADE……………………………………………. 28610 28163 28187 27965 28037 28276 28151 28423 28354 28588 30215 28350 29138 29534 28353 28107 28895% Chg Prev Qtr SAAR………..………………………… 2.22 -6.10 0.34 -3.12 1.03 3.46 -1.76 3.92 -0.97 3.35 24.78 -22.49 11.59 5.56 1.11 -0.87 2.80% Chg Same Qtr Last Yr……………………………….. 3.57 -1.29 -0.55 -1.72 -2.00 0.40 -0.13 1.64 1.13 1.10 7.33 -0.26 2.77 3.31 1.11 -0.87 2.80
TRANSPORTATION & UTILITIES…………………………51246 51735 51233 51018 52147 51825 51884 52198 52116 52401 53695 53182 53522 53048 51296 51719 52602% Chg Prev Qtr SAAR………..………………………… 2.18 3.87 -3.83 -1.67 9.16 -2.45 0.45 2.45 -0.63 2.21 10.24 -3.76 2.58 -3.49 1.52 0.82 1.71% Chg Same Qtr Last Yr……………………………….. 0.55 2.60 2.54 0.09 1.76 0.17 1.27 2.31 -0.06 1.11 3.49 1.89 2.70 1.23 1.52 0.82 1.71
INFORMATION………………………………………………… 57804 58675 60071 57592 58670 58925 57527 61810 61817 61752 58615 62079 62396 63946 58535 58179 60999% Chg Prev Qtr SAAR………..………………………… 1.49 6.16 9.86 -15.51 7.70 1.74 -9.15 33.27 0.04 -0.42 -18.82 25.82 2.06 10.31 3.77 -0.61 4.85% Chg Same Qtr Last Yr……………………………….. 2.30 4.56 5.80 0.00 1.50 0.43 -4.23 7.32 5.36 4.80 1.89 0.44 0.94 3.55 3.77 -0.61 4.85
FINANCIAL ACTIVITIES…………………………………..... 68735 66937 69052 65562 65981 66056 67409 68901 68417 68527 70073 69074 70683 71177 67208 66252 68979% Chg Prev Qtr SAAR………..………………………… 32.16 -10.06 13.25 -18.74 2.58 0.46 8.45 9.15 -2.78 0.64 9.34 -5.58 9.65 2.82 7.04 -1.42 4.12
% Chg Same Qtr Last Yr……………………………….. 12.49 4.79 9.09 2.27 -4.01 -1.32 -2.38 5.09 3.69 3.74 3.95 0.25 3.31 3.87 7.04 -1.42 4.12
January 2016
Historical Data Annual
(CONTINUED ON NEXT PAGE)

2016 TE
NN
ES
SE
E E
CO
NO
MIC
RE
PO
RT
| 6160 | 2016 T
EN
NE
SS
EE
EC
ON
OM
IC R
EP
OR
T
Historical D
ata | AP
PE
ND
IX B
Table 14: Tennessee Average Annual Wage and Salary Rate by Sector, Seasonally Adjusted (current dollars)
2012:2 2012:3 2012:4 2013:1 2013:2 2013:3 2013:4 2014:1 2014:2 2014:3 2014:4 2015:1 2015:2 2015:3 2012 2013 2014
January 2016
Historical Data Annual
PROFESSIONAL & BUSINESS SERVICES…………………49754 51602 53797 52404 52221 52075 51595 51821 52132 51803 52070 55380 56794 55448 51570 52074 51957% Chg Prev Qtr SAAR………..………………………… -10.31 15.71 18.12 -9.96 -1.39 -1.11 -3.64 1.77 2.42 -2.50 2.08 27.95 10.61 -9.15 7.48 0.98 -0.22% Chg Same Qtr Last Yr……………………………….. 3.17 7.35 13.87 2.50 4.96 0.92 -4.09 -1.11 -0.17 -0.52 0.92 6.87 8.94 7.04 7.48 0.98 -0.22
EDUCATION & HEALTH SERVICES………………………. 44994 45487 46065 45563 45701 46093 45778 46629 46593 46872 46734 47588 47802 48546 45448 45784 46707% Chg Prev Qtr SAAR………..………………………… -2.19 4.46 5.18 -4.29 1.21 3.48 -2.71 7.65 -0.31 2.42 -1.17 7.51 1.81 6.37 1.78 0.74 2.02% Chg Same Qtr Last Yr……………………………….. -0.15 0.92 3.41 0.71 1.57 1.33 -0.62 2.34 1.95 1.69 2.09 2.06 2.59 3.57 1.78 0.74 2.02
LEISURE & HOSPITALITY…………………………………… 21409 21457 21308 20879 21126 21274 21383 21409 22009 22023 22538 22189 23635 23180 21450 21165 21995% Chg Prev Qtr SAAR………..………………………… -3.94 0.90 -2.75 -7.81 4.81 2.82 2.08 0.48 11.69 0.25 9.69 -6.05 28.74 -7.48 3.07 -1.32 3.92% Chg Same Qtr Last Yr……………………………….. 3.78 -0.05 3.61 -3.45 -1.32 -0.85 0.35 2.54 4.18 3.52 5.40 3.64 7.39 5.26 3.07 -1.32 3.92
OTHER SERVICES…………………………………………... 40590 39633 39802 39459 39538 40391 40751 42113 41878 42388 43243 43164 44433 44547 39779 40035 42406% Chg Prev Qtr SAAR………..………………………… 16.23 -9.10 1.72 -3.41 0.81 8.92 3.61 14.06 -2.22 4.97 8.31 -0.72 12.29 1.03 2.69 0.64 5.92% Chg Same Qtr Last Yr……………………………….. 6.21 2.29 2.63 0.94 -2.59 1.91 2.38 6.73 5.92 4.94 6.11 2.49 6.10 5.09 2.69 0.64 5.92
GOVERNMENT……………………………………………….. 41128 41896 41680 42145 41520 41411 42261 42612 43146 43359 42873 42947 43148 43702 41483 41834 42997% Chg Prev Qtr SAAR………..………………………… -0.94 7.68 -2.05 4.53 -5.80 -1.04 8.47 3.36 5.11 1.99 -4.41 0.69 1.89 5.23 1.63 0.85 2.78% Chg Same Qtr Last Yr……………………………….. 0.43 2.32 1.48 2.23 0.95 -1.16 1.39 1.11 3.92 4.70 1.45 0.79 0.00 0.79 1.63 0.85 2.78
FEDERAL, CIVILIAN………………………………………. 71875 70117 70185 70258 70672 68945 72826 75769 78449 78343 81065 80801 80179 83305 71056 70675 78407% Chg Prev Qtr SAAR………..………………………… -0.96 -9.43 0.39 0.41 2.38 -9.42 24.49 17.17 14.91 -0.54 14.64 -1.30 -3.04 16.53 0.15 -0.54 10.94% Chg Same Qtr Last Yr……………………………….. 0.70 0.33 -1.73 -2.49 -1.67 -1.67 3.76 7.85 11.00 13.63 11.31 6.64 2.21 6.33 0.15 -0.54 10.94
STATE & LOCAL…………………………………………... 37029 38064 37839 38394 37720 37757 38246 38297 38591 38924 38210 38203 38396 38738 37515 38029 38505% Chg Prev Qtr SAAR………..………………………… -1.06 11.66 -2.34 5.99 -6.84 0.39 5.28 0.53 3.11 3.50 -7.14 -0.07 2.03 3.61 1.96 1.37 1.25% Chg Same Qtr Last Yr……………………………….. 0.30 2.80 2.27 3.41 1.87 -0.81 1.07 -0.25 2.31 3.09 -0.09 -0.24 -0.50 -0.48 1.96 1.37 1.25
Center for Business and Economic Research, University of Tennessee Tennessee Econometric Model

2016 TE
NN
ES
SE
E E
CO
NO
MIC
RE
PO
RT
| 6362 | 2016 T
EN
NE
SS
EE
EC
ON
OM
IC R
EP
OR
T
AP
PE
ND
IX B
| Historical D
ata
Table 15: Tennessee Civilian Labor Force and Unemployment Rate, Not Seasonally Adjusted
2012:3 2012:4 2013:1 2013:2 2013:3 2013:4 2014:1 2014:2 2014:3 2014:4 2015:1 2015:2 2015:3 2015:4 2012 2013 2014
CIVILIAN LABOR FORCE (THOUS)………… 3119 3115 3089 3110 3086 3041 3014 3025 3017 2990 3024 3105 3066 3064 3111 3082 3011% Chg Same Qtr Last Yr………………… -0.63 -0.39 -0.05 -0.25 -1.06 -2.37 -2.45 -2.72 -2.22 -1.69 0.33 2.64 1.61 2.47 -0.62 -0.93 -2.27
EMPLOYED PERSONS (THOUS)………… 2871 2887 2833 2862 2844 2830 2807 2828 2805 2803 2829 2926 2883 2899 2868 2842 2811% Chg Same Qtr Last Yr………………… 0.54 0.29 -0.22 -0.44 -0.94 -1.99 -0.91 -1.16 -1.38 -0.96 0.78 3.46 2.78 3.45 0.64 -0.90 -1.10
UNEMPLOYED PERSONS (THOUS)……… 247 228 257 248 242 211 207 197 212 187 195 179 183 164 243 239 201% Chg Same Qtr Last Yr…………………-12.41 -8.19 1.89 1.98 -2.36 -7.24 -19.44 -20.70 -12.12 -11.50 -5.84 -9.03 -13.89 -12.10 -13.52 -1.31 -16.17
PARTICIPATION RATE (PERCENT)………… 60.8 60.5 59.9 60.1 59.4 58.4 57.7 57.8 57.4 56.7 57.2 58.6 57.7 57.5 60.7 59.5 57.4% Chg Same Qtr Last Yr………………… -1.81 -1.56 -1.23 -1.42 -2.21 -3.51 -3.59 -3.87 -3.38 -2.86 -0.86 1.43 0.41 1.26 -1.81 -2.09 -3.43
UNEMPLOYMENT RATE (PERCENT)……… 7.9 7.3 8.3 8.0 7.8 6.9 6.9 6.5 7.0 6.3 6.4 5.8 6.0 5.4 7.8 7.8 6.7
Center for Business and Economic Research, University of Tennessee
Historical Data
Tennessee Econometric Model
January 2016
Annual

2016 TE
NN
ES
SE
E E
CO
NO
MIC
RE
PO
RT
| 6362 | 2016 T
EN
NE
SS
EE
EC
ON
OM
IC R
EP
OR
T
Historical D
ata | AP
PE
ND
IX B
Table 16: Tennessee Civilian Labor Force and Unemployment Rate, Seasonally Adjusted
2012:3 2012:4 2013:1 2013:2 2013:3 2013:4 2014:1 2014:2 2014:3 2014:4 2015:1 2015:2 2015:3 2015:4 2012 2013 2014
CIVILIAN LABOR FORCE (THOUS)………… 3092 3091 3082 3067 3045 3020 3007 2997 2987 2983 3037 3096 3058 3062 3091 3054 2993% Chg Prev Qtr SAAR…………………… 0.49 -0.10 -1.18 -1.88 -2.89 -3.23 -1.72 -1.36 -1.32 -0.49 7.43 7.94 -4.74 0.42 -0.88 -1.20 -1.97% Chg Same Qtr Last Yr………………… -0.87 -0.65 -0.32 -0.67 -1.51 -2.30 -2.43 -2.30 -1.91 -1.22 1.00 3.30 2.39 2.63 -0.88 -1.20 -1.97
EMPLOYED PERSONS (THOUS)………… 2852 2852 2838 2826 2812 2805 2811 2802 2789 2786 2839 2915 2884 2891 2850 2820 2797% Chg Prev Qtr SAAR…………………… 0.83 0.06 -1.94 -1.67 -2.00 -0.96 0.78 -1.28 -1.80 -0.39 7.83 11.14 -4.22 0.97 0.28 -1.03 -0.84% Chg Same Qtr Last Yr………………… 0.25 -0.01 -0.38 -0.69 -1.39 -1.65 -0.97 -0.87 -0.82 -0.68 1.02 4.05 3.40 3.75 0.28 -1.03 -0.84
UNEMPLOYED PERSONS (THOUS)…… 240 239 244 241 233 215 196 195 198 197 198 181 174 171 241 233 197% Chg Prev Qtr SAAR…………………… -3.47 -2.02 8.34 -4.25 -12.84 -27.66 -30.21 -2.48 5.69 -1.91 1.99 -30.73 -12.79 -8.29 -12.79 -3.27 -15.69% Chg Same Qtr Last Yr…………………-12.50 -7.78 0.35 -0.48 -2.98 -10.07 -19.43 -19.06 -15.06 -8.35 0.77 -7.49 -11.83 -13.30 -12.79 -3.27 -15.69
PARTICIPATION RATE (PERCENT)……… 60.3 60.1 59.7 59.3 58.7 58.0 57.6 57.2 56.9 56.6 57.5 58.4 57.5 57.4 60.3 58.9 57.1% Chg Prev Qtr SAAR…………………… -0.69 -1.27 -2.34 -3.02 -4.02 -4.36 -2.89 -2.53 -2.49 -1.67 6.16 6.66 -5.87 -0.77 -2.07 -2.36 -3.13% Chg Same Qtr Last Yr………………… -2.05 -1.83 -1.49 -1.84 -2.67 -3.44 -3.57 -3.45 -3.07 -2.39 -0.20 2.08 1.18 1.41 -2.07 -2.36 -3.13
UNEMPLOYMENT RATE (PERCENT)……… 7.8 7.7 7.9 7.9 7.7 7.1 6.5 6.5 6.6 6.6 6.5 5.8 5.7 5.6 7.8 7.6 6.6
Center for Business and Economic Research, University of Tennessee Tennessee Econometric Model
January 2016
AnnualHistorical Data

2016 TE
NN
ES
SE
E E
CO
NO
MIC
RE
PO
RT
| 6564 | 2016 T
EN
NE
SS
EE
EC
ON
OM
IC R
EP
OR
T
AP
PE
ND
IX B
| Historical D
ata
Table 17: Tennessee Taxable Sales, Not Seasonally Adjusted (millions of 2009 dollars)
2012:2 2012:3 2012:4 2013:1 2013:2 2013:3 2013:4 2014:1 2014:2 2014:3 2014:4 2015:1 2015:2 2015:3 2012 2013 2014
TOTAL TAXABLE SALES………………………… 23376 22622 24312 21915 23858 23108 24973 22314 24190 24183 26431 23004 26057 25942 92342 93853 97118% Chg Same Qtr Last Yr…………………… 2.74 0.72 1.15 -0.53 2.06 2.15 2.72 1.82 1.39 4.65 5.84 3.09 7.72 7.27 2.70 1.64 3.48
AUTO DEALERS………………………………… 2222 2269 2037 2241 2309 2413 2180 2340 2426 2542 2375 2536 2750 2870 8745 9144 9683% Chg Same Qtr Last Yr…………………… 7.26 9.30 3.25 1.08 3.93 6.35 7.01 4.44 5.04 5.34 8.92 8.35 13.37 12.91 8.16 4.55 5.90
PURCHASES FROM MANUFACTURERS…. 974 929 1119 806 989 968 1126 818 1007 1036 1247 884 1100 1136 3826 3889 4109% Chg Same Qtr Last Yr…………………… -2.00 -7.74 7.77 0.39 1.57 4.18 0.57 1.53 1.79 6.96 10.83 8.03 9.19 9.67 -0.78 1.66 5.64
MISC DURABLE GOODS……………………… 4078 3741 3895 3491 4181 3933 4027 3508 4244 4120 4231 3532 4547 4346 15404 15632 16103% Chg Same Qtr Last Yr…………………… 2.53 -2.95 0.59 -5.40 2.52 5.14 3.39 0.47 1.51 4.75 5.07 0.69 7.15 5.49 2.87 1.48 3.01
EATING AND DRINKING PLACES…………… 2460 2422 2385 2352 2552 2480 2448 2426 2607 2616 2611 2552 2833 2808 9610 9833 10260% Chg Same Qtr Last Yr…………………… 5.51 3.52 3.73 0.41 3.74 2.40 2.64 3.14 2.16 5.46 6.66 5.19 8.68 7.36 5.27 2.32 4.35
FOOD STORES………………………………… 2253 2278 2459 2251 2326 2289 2504 2211 2329 2367 2584 2311 2420 2457 9131 9369 9490% Chg Same Qtr Last Yr…………………… 2.98 3.63 1.68 5.11 3.24 0.48 1.84 -1.79 0.15 3.39 3.20 4.52 3.91 3.83 3.14 2.61 1.29
LIQUOR STORES……………………………… 183 174 219 178 184 187 230 186 193 195 247 200 211 210 747 778 821% Chg Same Qtr Last Yr…………………… 9.56 4.99 4.23 3.52 0.57 7.28 4.94 4.62 5.32 4.02 7.47 7.36 9.22 8.12 6.78 4.10 5.48
HOTELS AND MOTELS………………………… 638 627 582 502 630 626 600 534 713 730 670 575 801 832 2343 2358 2647% Chg Same Qtr Last Yr…………………… 4.87 0.08 2.89 1.30 -1.28 -0.22 3.11 6.27 13.18 16.69 11.74 7.69 12.38 13.97 4.44 0.64 12.27
OTHER RETAIL AND SERVICE……………… 7071 6790 7857 6703 7175 6877 8063 6913 7332 7137 8542 7014 7789 7708 28411 28818 29923% Chg Same Qtr Last Yr…………………… 3.90 1.83 0.81 0.15 1.46 1.28 2.63 3.14 2.19 3.77 5.93 1.46 6.24 8.01 2.96 1.43 3.84
MISC NONDURABLE GOODS………………… 1960 1872 2221 1893 1994 1910 2284 1889 2045 1984 2379 1916 2134 2098 7934 8082 8297% Chg Same Qtr Last Yr…………………… 3.58 2.00 1.88 0.62 1.72 2.04 2.86 -0.22 2.53 3.84 4.17 1.42 4.37 5.75 3.46 1.86 2.66
TRANSPORTATION, COMMUNICATION…… 1536 1519 1539 1498 1519 1424 1510 1489 1295 1458 1544 1485 1472 1476 6190 5951 5786% Chg Same Qtr Last Yr…………………… -10.46 -10.07 -8.72 -6.15 -1.14 -6.24 -1.84 -0.57 -14.73 2.36 2.20 -0.27 13.65 1.21 -9.14 -3.85 -2.78
PER CAPITA ($)…………………………………… 3624 3498 3750 3371 3660 3536 3811 3396 3672 3661 3991 3465 3914 3887 14297 14378 14721% Chg Same Qtr Last Yr…………………… 1.64 -0.35 0.08 -1.59 0.99 1.07 1.63 0.75 0.33 3.55 4.73 2.01 6.60 6.16 1.61 0.56 2.39
Center for Business and Economic Research, University of Tennessee
January 2016
Historical Data Annual
Tennessee Econometric Model

2016 TE
NN
ES
SE
E E
CO
NO
MIC
RE
PO
RT
| 6564 | 2016 T
EN
NE
SS
EE
EC
ON
OM
IC R
EP
OR
T
Historical D
ata | AP
PE
ND
IX B
Table 18: Tennessee Taxable Sales, Seasonally Adjusted (millions of 2009 dollars)
2012:2 2012:3 2012:4 2013:1 2013:2 2013:3 2013:4 2014:1 2014:2 2014:3 2014:4 2015:1 2015:2 2015:3 2012 2013 2014
TOTAL TAXABLE SALES………………………… 22989 22878 23007 23361 23472 23389 23615 23780 23807 24465 24985 24523 25642 26228 92389 93837 97036% Chg Prev Qtr SAAR………..…………… -8.65 -1.93 2.28 6.30 1.91 -1.41 3.94 2.81 0.45 11.54 8.76 -7.19 19.55 9.46 2.77 1.57 3.41% Chg Same Qtr Last Yr…………………… 2.73 0.93 1.02 -0.66 2.10 2.23 2.65 1.79 1.43 4.60 5.80 3.12 7.71 7.21 2.77 1.57 3.41
AUTO DEALERS………………………………… 2155 2180 2194 2233 2252 2321 2337 2331 2375 2441 2541 2526 2697 2754 8743 9143 9689% Chg Prev Qtr SAAR………..…………… -10.37 4.61 2.64 7.43 3.45 12.64 2.79 -0.91 7.80 11.57 17.42 -2.40 29.95 8.67 8.02 4.57 5.98% Chg Same Qtr Last Yr…………………… 7.84 9.76 2.49 0.84 4.52 6.47 6.51 4.38 5.46 5.21 8.77 8.35 13.53 12.79 8.02 4.57 5.98
PURCHASES FROM MANUFACTURERS…. 952 919 995 957 969 964 988 977 990 1034 1088 1059 1081 1135 3813 3878 4089% Chg Prev Qtr SAAR………..…………… 1.85 -12.84 37.21 -14.50 5.22 -2.11 10.52 -4.39 5.12 18.96 22.91 -10.17 8.58 21.27 -0.94 1.70 5.42% Chg Same Qtr Last Yr…………………… -1.78 -7.20 6.40 1.02 1.84 4.84 -0.68 2.14 2.11 7.22 10.10 8.40 9.28 9.81 -0.94 1.70 5.42
MISC DURABLE GOODS……………………… 3813 3711 3797 3892 3908 3908 3918 3914 3968 4094 4112 3945 4252 4317 15433 15626 16089% Chg Prev Qtr SAAR………..…………… -26.03 -10.23 9.62 10.34 1.67 -0.03 1.06 -0.40 5.65 13.28 1.81 -15.31 34.98 6.21 3.15 1.26 2.96% Chg Same Qtr Last Yr…………………… 2.42 -2.64 0.29 -5.33 2.50 5.30 3.18 0.57 1.54 4.76 4.96 0.79 7.15 5.44 3.15 1.26 2.96
EATING AND DRINKING PLACES…………… 2385 2392 2412 2433 2470 2455 2474 2510 2523 2589 2638 2642 2741 2779 9611 9832 10259% Chg Prev Qtr SAAR………..…………… -5.98 1.22 3.43 3.51 6.11 -2.41 3.21 5.91 2.08 10.87 7.82 0.59 15.86 5.72 5.29 2.29 4.35% Chg Same Qtr Last Yr…………………… 5.33 3.74 3.66 0.47 3.55 2.61 2.56 3.15 2.15 5.46 6.62 5.26 8.64 7.36 5.29 2.29 4.35
FOOD STORES………………………………… 2272 2298 2290 2382 2347 2312 2332 2336 2352 2392 2406 2440 2445 2483 9131 9373 9487% Chg Prev Qtr SAAR………..…………… 0.24 4.56 -1.37 17.13 -5.73 -5.91 3.47 0.81 2.72 6.89 2.44 5.77 0.82 6.40 3.19 2.65 1.21% Chg Same Qtr Last Yr…………………… 2.96 4.00 1.57 4.90 3.30 0.61 1.82 -1.92 0.20 3.45 3.19 4.44 3.95 3.83 3.19 2.65 1.21
LIQUOR STORES……………………………… 189 185 188 191 190 199 197 200 200 207 212 215 219 223 747 778 819% Chg Prev Qtr SAAR………..…………… 8.56 -7.12 5.65 7.40 -2.56 19.65 -3.06 5.64 0.96 12.90 10.89 4.86 8.75 7.79 6.93 4.06 5.36% Chg Same Qtr Last Yr…………………… 9.63 4.91 4.29 3.42 0.66 7.24 4.96 4.53 5.46 3.94 7.49 7.30 9.31 8.05 6.93 4.06 5.36
HOTELS AND MOTELS………………………… 588 581 587 595 580 580 606 632 656 677 678 681 737 771 2345 2361 2642% Chg Prev Qtr SAAR………..…………… -0.92 -5.09 4.57 5.39 -9.80 0.55 18.65 18.09 16.47 13.18 0.52 1.88 37.30 19.59 4.74 0.66 11.91% Chg Same Qtr Last Yr…………………… 4.47 0.46 3.23 0.90 -1.44 -0.01 3.20 6.17 13.18 16.58 11.84 7.79 12.32 13.88 4.74 0.66 11.91
OTHER RETAIL AND SERVICE……………… 7122 7095 7063 7148 7217 7192 7262 7360 7373 7464 7694 7468 7832 8060 28444 28818 29891% Chg Prev Qtr SAAR………..…………… -2.32 -1.53 -1.77 4.88 3.92 -1.35 3.93 5.50 0.74 5.02 12.94 -11.25 20.96 12.16 3.02 1.32 3.72% Chg Same Qtr Last Yr…………………… 3.71 1.95 1.23 -0.23 1.33 1.37 2.81 2.97 2.17 3.78 5.96 1.48 6.23 7.99 3.02 1.32 3.72
MISC NONDURABLE GOODS………………… 1982 1977 1967 2026 2014 2015 2026 2023 2065 2090 2112 2051 2155 2209 7939 8081 8289% Chg Prev Qtr SAAR………..…………… -6.09 -0.97 -1.91 12.52 -2.41 0.20 2.21 -0.66 8.57 4.98 4.29 -10.99 21.73 10.46 3.51 1.79 2.57% Chg Same Qtr Last Yr…………………… 3.29 2.00 2.04 0.65 1.63 1.92 2.98 -0.18 2.52 3.72 4.24 1.42 4.36 5.70 3.51 1.79 2.57
TRANSPORTATION, COMMUNICATION…… 1532 1540 1513 1503 1524 1443 1476 1497 1304 1479 1502 1495 1483 1497 6182 5946 5782% Chg Prev Qtr SAAR………..…………… -15.37 2.07 -6.82 -2.55 5.82 -19.69 9.31 5.91 -42.47 65.49 6.53 -1.89 -3.32 4.06 -9.13 -3.81 -2.77% Chg Same Qtr Last Yr…………………… -9.72 -9.97 -9.70 -5.89 -0.49 -6.28 -2.46 -0.41 -14.48 2.46 1.80 -0.13 13.72 1.26 -9.13 -3.81 -2.77
PER CAPITA ($)…………………………………… 3565 3538 3548 3593 3601 3579 3604 3619 3614 3704 3773 3693 3852 3930 14306 14377 14710% Chg Prev Qtr SAAR………..…………… -9.62 -2.97 1.20 5.18 0.83 -2.45 2.85 1.74 -0.60 10.37 7.63 -8.16 18.31 8.33 1.68 0.49 2.32% Chg Same Qtr Last Yr…………………… 1.63 -0.14 -0.05 -1.71 1.02 1.15 1.56 0.72 0.36 3.51 4.69 2.05 6.59 6.09 1.68 0.49 2.32
Center for Business and Economic Research, University of Tennessee
January 2016
Historical Data Annual
Tennessee Econometric Model

2016 TE
NN
ES
SE
E E
CO
NO
MIC
RE
PO
RT
| 6766 | 2016 T
EN
NE
SS
EE
EC
ON
OM
IC R
EP
OR
T
AP
PE
ND
IX B
| Historical D
ata
Table 19: Tennessee Taxable Sales, Not Seasonally Adjusted (millions of current dollars)
2012:2 2012:3 2012:4 2013:1 2013:2 2013:3 2013:4 2014:1 2014:2 2014:3 2014:4 2015:1 2015:2 2015:3 2012 2013 2014
TOTAL TAXABLE SALES………………………… 24751 24032 25967 23485 25596 24894 26997 24220 26396 26466 28894 25027 28505 28466 98007 100972 #####% Chg Same Qtr Last Yr…………………… 4.56 2.30 2.93 0.98 3.41 3.59 3.97 3.13 3.12 6.32 7.03 3.33 7.99 7.56 4.62 3.03 4.96
AUTO DEALERS………………………………… 2353 2411 2176 2401 2477 2600 2357 2540 2647 2782 2596 2759 3008 3150 9279 9836 10565% Chg Same Qtr Last Yr…………………… 9.16 11.02 5.07 2.62 5.30 7.85 8.32 5.78 6.84 7.01 10.14 8.61 13.65 13.21 10.19 5.99 7.42
PURCHASES FROM MANUFACTURERS…. 1031 987 1195 864 1061 1043 1217 888 1099 1134 1364 962 1203 1246 4062 4185 4484% Chg Same Qtr Last Yr…………………… -0.27 -6.29 9.67 1.92 2.91 5.65 1.79 2.83 3.53 8.66 12.07 8.28 9.46 9.96 1.08 3.04 7.15
MISC DURABLE GOODS……………………… 4318 3974 4160 3741 4485 4237 4353 3807 4631 4509 4626 3843 4974 4769 16348 16817 17572% Chg Same Qtr Last Yr…………………… 4.34 -1.43 2.36 -3.97 3.87 6.62 4.65 1.76 3.25 6.42 6.25 0.93 7.42 5.77 4.77 2.87 4.49
EATING AND DRINKING PLACES…………… 2605 2573 2548 2521 2738 2672 2647 2633 2845 2863 2855 2776 3099 3082 10198 10577 11195% Chg Same Qtr Last Yr…………………… 7.38 5.14 5.56 1.93 5.11 3.84 3.90 4.46 3.90 7.14 7.86 5.44 8.95 7.65 7.24 3.72 5.84
FOOD STORES………………………………… 2385 2420 2626 2412 2495 2466 2707 2399 2541 2590 2825 2514 2647 2696 9692 10080 10356% Chg Same Qtr Last Yr…………………… 4.80 5.25 3.47 6.71 4.60 1.90 3.08 -0.53 1.86 5.04 4.35 4.77 4.17 4.11 5.08 4.01 2.74
LIQUOR STORES……………………………… 193 185 234 190 197 202 248 202 211 213 270 217 231 231 793 837 896% Chg Same Qtr Last Yr…………………… 11.50 6.64 6.07 5.09 1.90 8.80 6.22 5.96 7.12 5.67 8.68 7.61 9.49 8.41 8.77 5.51 6.97
HOTELS AND MOTELS………………………… 675 666 621 538 676 674 649 580 778 799 733 626 876 913 2486 2537 2889% Chg Same Qtr Last Yr…………………… 6.73 1.65 4.70 2.84 0.02 1.19 4.37 7.63 15.11 18.55 13.00 7.94 12.66 14.28 6.36 2.01 13.90
OTHER RETAIL AND SERVICE……………… 7488 7214 8392 7183 7697 7409 8717 7503 8000 7811 9338 7631 8521 8459 30158 31006 32652% Chg Same Qtr Last Yr…………………… 5.74 3.43 2.59 1.67 2.80 2.70 3.88 4.46 3.93 5.42 7.12 1.69 6.51 8.30 4.89 2.81 5.31
MISC NONDURABLE GOODS………………… 2076 1989 2372 2029 2139 2058 2469 2050 2231 2171 2601 2084 2334 2302 8422 8695 9053% Chg Same Qtr Last Yr…………………… 5.41 3.60 3.68 2.15 3.06 3.48 4.12 1.06 4.29 5.49 5.34 1.66 4.63 6.03 5.40 3.24 4.12
TRANSPORTATION, COMMUNICATION…… 1627 1614 1643 1605 1630 1534 1633 1617 1413 1596 1687 1616 1610 1619 6569 6402 6313% Chg Same Qtr Last Yr…………………… -8.87 -8.66 -7.11 -4.72 0.17 -4.92 -0.64 0.71 -13.28 3.99 3.35 -0.04 13.94 1.48 -7.41 -2.54 -1.39
PER CAPITA ($)…………………………………… 3838 3716 4005 3612 3927 3809 4120 3686 4007 4007 4363 3769 4282 4265 15174 15468 16063% Chg Same Qtr Last Yr…………………… 3.44 1.21 1.84 -0.09 2.32 2.49 2.87 2.04 2.04 5.20 5.91 2.25 6.87 6.44 3.51 1.93 3.85
Center for Business and Economic Research, University of Tennessee
January 2016
Historical Data Annual
Tennessee Econometric Model

2016 TE
NN
ES
SE
E E
CO
NO
MIC
RE
PO
RT
| 6766 | 2016 T
EN
NE
SS
EE
EC
ON
OM
IC R
EP
OR
T
Historical D
ata | AP
PE
ND
IX B
Table 20: Tennessee Taxable Sales, Seasonally Adjusted (millions of current dollars)
2012:2 2012:3 2012:4 2013:1 2013:2 2013:3 2013:4 2014:1 2014:2 2014:3 2014:4 2015:1 2015:2 2015:3 2012 2013 2014
TOTAL TAXABLE SALES………………………… 24342 24303 24572 25035 25181 25196 25530 25811 25977 26775 27314 26679 28050 28781 98041 100943 105877% Chg Prev Qtr SAAR………..…………… -7.53 -0.64 4.50 7.75 2.36 0.23 5.41 4.47 2.60 12.87 8.29 -8.97 22.19 10.84 4.70 2.96 4.89% Chg Same Qtr Last Yr…………………… 4.55 2.51 2.80 0.85 3.45 3.67 3.90 3.10 3.16 6.27 6.99 3.37 7.98 7.49 4.70 2.96 4.89
AUTO DEALERS………………………………… 2282 2315 2343 2394 2417 2500 2526 2530 2592 2672 2778 2748 2950 3022 9279 9836 10572% Chg Prev Qtr SAAR………..…………… -9.27 5.99 4.87 8.90 3.91 14.51 4.25 0.69 10.11 12.90 16.91 -4.27 32.82 10.03 10.05 6.01 7.49% Chg Same Qtr Last Yr…………………… 9.75 11.48 4.29 2.37 5.90 7.97 7.81 5.72 7.26 6.88 9.99 8.61 13.82 13.09 10.05 6.01 7.49
PURCHASES FROM MANUFACTURERS…. 1008 977 1063 1025 1040 1038 1069 1061 1080 1131 1190 1153 1183 1245 4047 4172 4461% Chg Prev Qtr SAAR………..…………… 3.10 -11.69 40.19 -13.34 5.68 -0.48 12.09 -2.85 7.37 20.38 22.37 -11.89 10.98 22.79 0.94 3.09 6.93% Chg Same Qtr Last Yr…………………… -0.04 -5.75 8.28 2.55 3.19 6.32 0.54 3.45 3.86 8.92 11.34 8.65 9.55 10.10 0.94 3.09 6.93
MISC DURABLE GOODS……………………… 4037 3943 4056 4171 4193 4210 4236 4249 4330 4481 4496 4292 4652 4737 16375 16810 17555% Chg Prev Qtr SAAR………..…………… -25.13 -9.04 12.00 11.84 2.12 1.64 2.49 1.20 7.91 14.63 1.36 -16.93 37.96 7.54 5.08 2.65 4.44% Chg Same Qtr Last Yr…………………… 4.23 -1.12 2.06 -3.89 3.86 6.78 4.44 1.86 3.28 6.43 6.14 1.02 7.42 5.72 5.08 2.65 4.44
EATING AND DRINKING PLACES…………… 2525 2541 2577 2608 2649 2644 2675 2724 2753 2833 2884 2874 2998 3050 10200 10576 11194% Chg Prev Qtr SAAR………..…………… -4.83 2.55 5.68 4.92 6.58 -0.79 4.67 7.62 4.27 12.19 7.36 -1.34 18.42 7.05 7.28 3.69 5.84% Chg Same Qtr Last Yr…………………… 7.20 5.36 5.48 1.99 4.92 4.06 3.81 4.47 3.90 7.14 7.82 5.51 8.92 7.65 7.28 3.69 5.84
FOOD STORES………………………………… 2406 2441 2446 2553 2518 2491 2521 2536 2567 2618 2631 2655 2675 2725 9690 10083 10351% Chg Prev Qtr SAAR………..…………… 1.47 5.94 0.77 18.73 -5.31 -4.34 4.94 2.43 4.93 8.17 2.00 3.75 3.05 7.74 5.14 4.05 2.66% Chg Same Qtr Last Yr…………………… 4.78 5.62 3.35 6.49 4.67 2.03 3.07 -0.67 1.92 5.10 4.35 4.69 4.21 4.11 5.14 4.05 2.66
LIQUOR STORES……………………………… 200 197 201 205 204 214 213 217 219 226 232 233 240 245 793 836 894% Chg Prev Qtr SAAR………..…………… 9.89 -5.90 7.94 8.86 -2.13 21.64 -1.69 7.34 3.12 14.24 10.41 2.86 11.15 9.14 8.94 5.49 6.86% Chg Same Qtr Last Yr…………………… 11.57 6.56 6.13 4.99 1.99 8.75 6.24 5.87 7.26 5.59 8.70 7.55 9.58 8.34 8.94 5.49 6.86
HOTELS AND MOTELS………………………… 623 617 627 637 622 625 655 685 716 741 741 741 806 846 2489 2540 2883% Chg Prev Qtr SAAR………..…………… 0.29 -3.84 6.84 6.83 -9.40 2.22 20.33 19.99 18.96 14.53 0.09 -0.07 40.33 21.10 6.70 2.04 13.51% Chg Same Qtr Last Yr…………………… 6.32 2.03 5.05 2.43 -0.14 1.40 4.46 7.53 15.11 18.43 13.10 8.05 12.60 14.18 6.70 2.04 13.51
OTHER RETAIL AND SERVICE……………… 7541 7537 7544 7660 7742 7748 7851 7988 8045 8169 8412 8125 8568 8845 30184 31000 32614% Chg Prev Qtr SAAR………..…………… -1.12 -0.23 0.36 6.30 4.38 0.30 5.40 7.19 2.90 6.27 12.45 -12.95 23.64 13.57 4.96 2.70 5.20% Chg Same Qtr Last Yr…………………… 5.55 3.55 3.02 1.28 2.67 2.80 4.07 4.29 3.91 5.43 7.15 1.72 6.49 8.28 4.96 2.70 5.20
MISC NONDURABLE GOODS………………… 2098 2100 2101 2171 2161 2171 2190 2195 2253 2287 2309 2232 2357 2424 8425 8693 9044% Chg Prev Qtr SAAR………..…………… -4.94 0.34 0.22 14.05 -1.98 1.87 3.66 0.94 10.90 6.23 3.84 -12.69 24.42 11.85 5.46 3.18 4.04% Chg Same Qtr Last Yr…………………… 5.12 3.60 3.84 2.18 2.97 3.36 4.24 1.10 4.27 5.37 5.41 1.66 4.63 5.98 5.46 3.18 4.04
TRANSPORTATION, COMMUNICATION…… 1622 1636 1616 1611 1636 1555 1595 1625 1423 1618 1642 1627 1622 1643 6560 6396 6308% Chg Prev Qtr SAAR………..…………… -14.33 3.41 -4.80 -1.22 6.28 -18.35 10.86 7.62 -41.24 67.46 6.06 -3.77 -1.18 5.37 -7.42 -2.49 -1.38% Chg Same Qtr Last Yr…………………… -8.12 -8.57 -8.11 -4.46 0.83 -4.96 -1.27 0.87 -13.02 4.09 2.95 0.11 14.00 1.53 -7.42 -2.49 -1.38
PER CAPITA ($)…………………………………… 3774 3758 3790 3851 3863 3855 3896 3928 3943 4054 4125 4018 4214 4312 15181 15465 16050% Chg Prev Qtr SAAR………..…………… -8.51 -1.69 3.40 6.61 1.28 -0.82 4.31 3.37 1.53 11.69 7.16 -9.92 20.93 9.69 3.59 1.87 3.78% Chg Same Qtr Last Yr…………………… 3.43 1.42 1.71 -0.21 2.35 2.58 2.80 2.01 2.08 5.15 5.87 2.29 6.86 6.38 3.59 1.87 3.78
Center for Business and Economic Research, University of Tennessee
January 2016
Historical Data Annual
Tennessee Econometric Model

2016 TE
NN
ES
SE
E E
CO
NO
MIC
RE
PO
RT
| 6968 | 2016 T
EN
NE
SS
EE
EC
ON
OM
IC R
EP
OR
T
AP
PE
ND
IX B
| Historical D
ata
Table 1: Selected U.S. and Tennessee Economic Indicators, Seasonally Adjusted
2003 2004 2005 2006 2007 2008 2009 2010 2011 2012 2013 2014
TN GDP (Mil2009$) SAAR……………………………………… 240376 250288 252717 258027 255313 257567 247316 251094 258257 266947 268707 274962Percentage change…………………………………………… 2.34 4.12 0.97 2.10 -1.05 0.88 -3.98 1.53 2.85 3.36 0.66 2.33
US GDP (Bil2009$) SAAR……………………………………… 13271.1 13773.5 14234.3 14613.8 14873.8 14830.4 14418.8 14783.8 15020.6 15354.6 15583.3 15961.7Percentage change…………………………………………… 2.81 3.79 3.35 2.67 1.78 -0.29 -2.78 2.53 1.60 2.22 1.49 2.43
TN GDP (Mil$) SAAR……………………………………………. 206562 220573 228724 239395 243368 250402 247316 253252 264022 279654 286908 298623Percentage change…………………………………………… 4.44 6.78 3.70 4.67 1.66 2.89 -1.23 2.40 4.25 5.92 2.59 4.08
US GDP (Bil$) SAAR……………………………………………. 11510.7 12274.9 13093.7 13855.9 14477.6 14718.6 14418.7 14964.4 15517.9 16155.3 16663.2 17348.1Percentage change…………………………………………… 4.86 6.64 6.67 5.82 4.49 1.66 -2.04 3.78 3.70 4.11 3.14 4.11
TN PERSONAL INCOME (MIL2009$) SAAR……................. 196674 203762 205807 212564 217676 220441 217358 222615 229291 238054 237442 242848Percentage change…………………………………………… 1.84 3.60 1.00 3.28 2.40 1.27 -1.40 2.42 3.00 3.82 -0.26 2.28
US PERSONAL INCOME (BIL2009$) SAAR………….......... 10838 11206 11504 12028 12358 12494 12095 12274 12726 13112 13078 13468Percentage change…………………………………………… 1.67 3.40 2.66 4.56 2.75 1.10 -3.19 1.48 3.69 3.03 -0.26 2.98
TN PERSONAL INCOME (MIL$) SAAR…………………….... 172239 182791 189889 201367 211376 220580 217354 226302 238810 252636 255422 264965Percentage change…………………………………………… 3.86 6.13 3.88 6.04 4.97 4.35 -1.46 4.12 5.53 5.79 1.10 3.74
US PERSONAL INCOME (BIL$) SAAR…………………….... 9491 10053 10614 11394 12000 12502 12095 12477 13255 13915 14068 14694Percentage change…………………………………………… 3.68 5.92 5.58 7.35 5.32 4.18 -3.26 3.16 6.23 4.98 1.10 4.45
TN NONFARM JOBS (THOUS)………………………………… 2662.6 2705.6 2743.0 2782.9 2797.8 2775.4 2619.3 2615.5 2661.9 2715.3 2758.7 2816.1Percentage change…………………………………………… -0.10 1.62 1.38 1.46 0.53 -0.80 -5.62 -0.15 1.78 2.00 1.60 2.08
US NONFARM JOBS (MIL)……………………………………… 130.3 131.7 134.0 136.4 137.9 137.2 131.2 130.3 131.8 134.1 136.4 139.0Percentage change…………………………………………… -0.24 1.09 1.72 1.80 1.12 -0.56 -4.34 -0.73 1.21 1.71 1.71 1.93
TN MFG JOBS (THOUS)………………………………………… 413.3 411.8 408.8 399.4 379.9 360.9 309.2 299.0 304.4 313.4 318.4 325.2Percentage change…………………………………………… -3.56 -0.35 -0.74 -2.30 -4.87 -4.99 -14.33 -3.32 1.84 2.94 1.61 2.13
US MFG JOBS (MIL)……………………………………………… 14.5 14.3 14.2 14.2 13.9 13.4 11.8 11.5 11.7 11.9 12.0 12.2Percentage change…………………………………………… -4.90 -1.34 -0.62 -0.49 -1.97 -3.42 -11.61 -2.69 1.71 1.71 0.78 1.41
TN UNEMPLOYMENT RATE (%)…………………………….... 5.6 5.4 5.5 5.2 4.7 6.8 10.6 9.6 8.9 7.8 7.6 6.6
US UNEMPLOYMENT RATE (%)……………………………… 6.0 5.5 5.1 4.6 4.6 5.8 9.3 9.6 8.9 8.1 7.4 6.2
CHAINED PRICE INDEX, GDP (2009=100.0)……………..... 86.7 89.1 92.0 94.8 97.3 99.2 100.0 101.2 103.3 105.2 106.9 108.7Percentage change…………………………………………… 1.99 2.75 3.22 3.07 2.67 1.93 0.79 1.23 2.06 1.84 1.63 1.64
US PERS CONSUMP DEFL (2009=100.0)……………......... 87.6 89.7 92.3 94.7 97.1 100.1 100.0 101.7 104.1 106.1 107.6 109.1Percentage change…………………………………………… 1.98 2.43 2.85 2.68 2.50 3.05 -0.06 1.65 2.46 1.89 1.37 1.43
CONSUMER PRICE INDEX, ALL-URBAN (82-84=1.000)…… 1.840 1.889 1.953 2.016 2.073 2.153 2.146 2.181 2.249 2.296 2.330 2.367Percentage change…………………………………………… 2.30 2.67 3.37 3.22 2.87 3.81 -0.32 1.64 3.14 2.08 1.46 1.61
BANK PRIME INTEREST RATE (%)…………………………… 4.1 4.3 6.2 8.0 8.1 5.1 3.3 3.3 3.3 3.3 3.3 3.3
FEDERAL FUNDS RATE (% per annum)……………………… 1.128 1.349 3.213 4.964 5.019 1.928 0.160 0.175 0.102 0.140 0.108 0.089
30-YEAR FIXED MORTGAGE RATE (%)……………………… 5.8 5.8 5.9 6.4 6.3 6.0 5.0 4.7 4.5 3.7 4.0 4.2
TN TAXABLE SALES (MIL2009$)……………………………… 89918 92218 95680 97860 98872 93182 86223 86956 89903 92389 93837 97036Percentage change…………………………………………… 2.32 2.56 3.75 2.28 1.03 -5.76 -7.47 0.85 3.39 2.77 1.57 3.41
TN TAXABLE SALES (MIL$)…………………………………… 78749 82725 88284 92705 95999 93236 86219 88395 93641 98041 100943 105877Percentage change…………………………………………… 4.35 5.05 6.72 5.01 3.55 -2.88 -7.53 2.52 5.93 4.70 2.96 4.89
TN AVG ANNUAL WAGE, NONFARM (2009$)……………... 38815 39485 39441 40242 40847 40545 40821 41444 41310 41968 41473 41961Percentage change…………………………………………… 1.34 1.73 -0.11 2.03 1.50 -0.74 0.68 1.53 -0.32 1.59 -1.18 1.18
TN AVG ANNUAL WAGE, NONFARM ($)………………....... 33993 35421 36388 38122 39664 40570 40822 42129 43022 44537 44613 45782Percentage change…………………………………………… 3.35 4.20 2.73 4.77 4.04 2.28 0.62 3.20 2.12 3.52 0.17 2.62
Center for Business and Economic Research, University of Tennessee
January 2016Historical Data
Tennessee Econometric Model

2016 TE
NN
ES
SE
E E
CO
NO
MIC
RE
PO
RT
| 6968 | 2016 T
EN
NE
SS
EE
EC
ON
OM
IC R
EP
OR
T
Historical D
ata | AP
PE
ND
IX B
Table 2: Selected Per Capita U.S. and Tennessee Economic Indicators
2003 2004 2005 2006 2007 2008 2009 2010 2011 2012 2013 2014
TN GDP (2009$) SAAR………………………… 41243 42514 42395 42634 41561 41406 39356 39661 40420 41335 41168 41685Percentage change………………………… 1.47 3.08 -0.28 0.56 -2.52 -0.37 -4.95 0.77 1.92 2.26 -0.40 1.25
US GDP (2009$) SAAR………………….…… 45587 46887 48014 48830 49214 48633 46878 47673 48071 48777 49139 49964Percentage change................................ 1.86 2.85 2.40 1.70 0.79 -1.18 -3.61 1.70 0.84 1.47 0.74 1.68
TN GDP ($) SAAR……………………………… 35441 37467 38370 39556 39616 40254 39356 40001 41323 43303 43957 45272Percentage change………………………… 3.56 5.72 2.41 3.09 0.15 1.61 -2.23 1.64 3.30 4.79 1.51 2.99
US GDP ($) SAAR……………………………… 39540 41786 44167 46297 47903 48266 46878 48255 49663 51321 52544 54304Percentage change................................ 3.89 5.68 5.70 4.82 3.47 0.76 -2.88 2.94 2.92 3.34 2.38 3.35
TN PERSONAL INCOME (2009$) SAAR…… 33744 34611 34525 35122 35434 35439 34589 35162 35887 36860 36378 36816Percentage change................................ 0.98 2.57 -0.25 1.73 0.89 0.01 -2.40 1.65 2.06 2.71 -1.31 1.20
US PERSONAL INCOME (2009$) SAAR…… 37228 38147 38803 40188 40890 40972 39324 39579 40728 41653 41238 42157Percentage change................................ 0.73 2.47 1.72 3.57 1.75 0.20 -4.02 0.65 2.90 2.27 -0.99 2.23
TN PERSONAL INCOME ($) SAAR………… 29551 31048 31854 33271 34407 35461 34588 35744 37376 39118 39133 40168Percentage change................................ 2.98 5.06 2.60 4.45 3.42 3.06 -2.46 3.34 4.57 4.66 0.04 2.65
US PERSONAL INCOME ($) SAAR………… 32603 34222 35803 38071 39706 40998 39322 40235 42419 44204 44362 45996Percentage change................................ 2.73 4.97 4.62 6.34 4.29 3.25 -4.09 2.32 5.43 4.21 0.36 3.69
TN TAXABLE SALES (2009$)………………… 15427 15664 16051 16169 16096 14981 13721 13735 14071 14306 14377 14710Percentage change................................ 1.45 1.54 2.47 0.74 -0.46 -6.92 -8.41 0.10 2.45 1.68 0.49 2.32
TN TAXABLE SALES ($)……………………… 13511 14051 14809 15317 15627 14990 13720 13962 14655 15181 15465 16050Percentage change................................ 3.46 4.00 5.40 3.43 2.02 -4.08 -8.47 1.76 4.97 3.59 1.87 3.78
Center for Business and Economic Research, University of Tennessee Tennessee Econometric Model
January 2016
Historical Data

2016 TE
NN
ES
SE
E E
CO
NO
MIC
RE
PO
RT
| 7170 | 2016 T
EN
NE
SS
EE
EC
ON
OM
IC R
EP
OR
T
AP
PE
ND
IX B
| Historical D
ata
Table 3: Tennessee Personal Income Components (millions of 2009 dollars)
2003 2004 2005 2006 2007 2008 2009 2010 2011 2012 2013 2014
TN PERSONAL INCOME…………...……… 196674 203762 205807 212564 217676 220441 217358 222615 229291 238054 237442 242848Percentage change…………………… 1.84 3.60 1.00 3.28 2.40 1.27 -1.40 2.42 3.00 3.82 -0.26 2.28
WAGES AND SALARIES……………… 104284 107774 109129 112922 115251 113521 107965 109400 110853 114827 115266 119019Percentage change…………………… 1.37 3.35 1.26 3.48 2.06 -1.50 -4.89 1.33 1.33 3.59 0.38 3.26
OTHER LABOR INCOME……………… 24968 26158 26715 25965 26618 26803 25817 25481 26011 27860 27710 27148Percentage change…………………… 6.51 4.77 2.13 -2.81 2.51 0.70 -3.68 -1.30 2.08 7.11 -0.54 -2.03
PROPRIETORS INCOME……………… 26618 27967 26282 27188 24205 24017 26095 26133 27896 29745 30953 32225Percentage change…………………… -1.56 5.07 -6.02 3.44 -10.97 -0.78 8.65 0.15 6.75 6.63 4.06 4.11
RENT, INTEREST, DIVIDENDS……… 26736 26714 27238 29476 31792 32598 30022 30559 32056 34082 33543 34428Percentage change…………………… 0.15 -0.08 1.96 8.22 7.86 2.53 -7.90 1.79 4.90 6.32 -1.58 2.64
TRANSFER PAYMENTS……………… 32876 34138 35531 36559 39183 42789 46062 49595 49388 48980 49797 50249Percentage change…………………… 4.13 3.84 4.08 2.89 7.18 9.20 7.65 7.67 -0.42 -0.83 1.67 0.91
LESS: PERS CONT FOR SOC INS… 16506 16998 17219 17684 18051 17978 17644 17799 16140 16314 18592 19059Percentage change…………………… 1.61 2.98 1.30 2.70 2.07 -0.40 -1.86 0.88 -9.32 1.07 13.96 2.52
RESIDENCE ADJUSTMENT…………… -2302 -1991 -1870 -1861 -1323 -1309 -958 -753 -772 -1126 -1235 -1163Percentage change…………………… 1.76 -13.48 -6.09 -0.46 -28.93 -1.03 -26.83 -21.42 2.58 45.87 9.70 -5.89
PER CAPITA PERSONAL INCOME ($)… 33744 34611 34525 35122 35434 35439 34589 35162 35887 36860 36378 36816Percentage change…………………… 0.98 2.57 -0.25 1.73 0.89 0.01 -2.40 1.65 2.06 2.71 -1.31 1.20
Center for Business and Economic Research, University of Tennessee
January 2016
Historical Data
Tennessee Econometric Model

2016 TE
NN
ES
SE
E E
CO
NO
MIC
RE
PO
RT
| 7170 | 2016 T
EN
NE
SS
EE
EC
ON
OM
IC R
EP
OR
T
Historical D
ata | AP
PE
ND
IX B
Table 4: Tennessee Personal Income Components (millions of current dollars)
2003 2004 2005 2006 2007 2008 2009 2010 2011 2012 2013 2014
TN PERSONAL INCOME…………...……… 172239 182791 189889 201367 211376 220580 217354 226302 238810 252636 255422 264965Percentage change…………………… 3.86 6.13 3.88 6.04 4.97 4.35 -1.46 4.12 5.53 5.79 1.10 3.74
WAGES AND SALARIES……………… 91328 96683 100686 106974 111913 113587 107961 111211 115453 121860 123995 129859Percentage change…………………… 3.38 5.86 4.14 6.24 4.62 1.50 -4.95 3.01 3.81 5.55 1.75 4.73
OTHER LABOR INCOME……………… 21866 23467 24646 24597 25849 26819 25814 25902 27092 29566 29807 29620Percentage change…………………… 8.62 7.32 5.02 -0.20 5.09 3.75 -3.75 0.34 4.59 9.13 0.81 -0.63
PROPRIETORS INCOME……………… 23310 25087 24254 25754 23500 24032 26099 26565 29057 31567 33297 35161Percentage change…………………… 0.39 7.62 -3.32 6.18 -8.75 2.27 8.60 1.78 9.38 8.64 5.48 5.60
RENT, INTEREST, DIVIDENDS……… 23414 23965 25134 27925 30876 32619 30017 31066 33388 36172 36084 37563Percentage change…………………… 2.14 2.35 4.88 11.10 10.57 5.64 -7.98 3.49 7.48 8.34 -0.25 4.10
TRANSFER PAYMENTS……………… 28792 30624 32780 34633 38051 42822 46064 50417 51434 51978 53568 54826Percentage change…………………… 6.19 6.36 7.04 5.65 9.87 12.54 7.57 9.45 2.02 1.06 3.06 2.35
LESS: PERS CONT FOR SOC INS… 14455 15248 15886 16752 17528 17989 17644 18093 16810 17313 20000 20795Percentage change…………………… 3.62 5.48 4.19 5.45 4.63 2.63 -1.92 2.55 -7.09 2.99 15.52 3.98
RESIDENCE ADJUSTMENT…………… -2016 -1786 -1725 -1763 -1285 -1310 -958 -765 -804 -1195 -1329 -1268Percentage change…………………… 3.78 -11.38 -3.43 2.22 -27.14 1.96 -26.89 -20.10 5.11 48.63 11.18 -4.55
PER CAPITA PERSONAL INCOME ($)… 29551 31048 31854 33271 34407 35461 34588 35744 37376 39118 39133 40168Percentage change…………………… 2.98 5.06 2.60 4.45 3.42 3.06 -2.46 3.34 4.57 4.66 0.04 2.65
Center for Business and Economic Research, University of Tennessee
January 2016
Historical Data
Tennessee Econometric Model

2016 TE
NN
ES
SE
E E
CO
NO
MIC
RE
PO
RT
| 7372 | 2016 T
EN
NE
SS
EE
EC
ON
OM
IC R
EP
OR
T
AP
PE
ND
IX B
| Historical D
ata
Table 5: Tennessee Nonfarm Employment by Sector, Seasonally Adjusted (thousands of jobs)
2003 2004 2005 2006 2007 2008 2009 2010 2011 2012 2013 2014
TOTAL NONFARM………………………………… 2662.6 2705.6 2743.0 2782.9 2797.8 2775.4 2619.3 2615.5 2661.9 2715.3 2758.7 2816.1Percentage change………..……………… -0.10 1.62 1.38 1.46 0.53 -0.80 -5.62 -0.15 1.78 2.00 1.60 2.08
NATURAL RESOURCES, MINING AND CONSTRUCTION……………………… 119.6 121.3 125.3 134.3 137.8 132.4 109.9 105.1 108.7 108.9 107.8 110.9
Percentage change………..……………… 0.08 1.41 3.28 7.23 2.56 -3.90 -16.97 -4.37 3.43 0.17 -0.99 2.87
MANUFACTURING……………………………… 413.3 411.8 408.8 399.4 379.9 360.9 309.2 299.0 304.4 313.4 318.4 325.2Percentage change………..……………… -3.56 -0.35 -0.74 -2.30 -4.87 -4.99 -14.33 -3.32 1.84 2.94 1.61 2.13
DURABLE GOODS…………………………… 250.9 254.0 254.6 251.8 237.1 220.8 181.8 176.3 183.7 193.9 198.9 205.5Percentage change………..……………… -3.15 1.25 0.22 -1.11 -5.83 -6.85 -17.66 -3.04 4.21 5.55 2.54 3.36
NONDURABLE GOODS…………………… 162.4 157.8 154.2 147.6 142.8 140.1 127.4 122.6 120.7 119.5 119.6 119.7Percentage change………..……………… -4.19 -2.82 -2.28 -4.25 -3.24 -1.91 -9.08 -3.72 -1.57 -1.04 0.11 0.09
TRADE, TRANSPORTATION, UTILITIES…… 578.7 587.8 598.0 607.4 610.7 600.3 559.3 555.0 563.5 575.1 582.1 592.1Percentage change………..……………… 0.30 1.58 1.73 1.56 0.54 -1.70 -6.82 -0.76 1.54 2.05 1.22 1.71
WHOLESALE TRADE……………………… 126.5 128.0 130.3 132.1 133.0 131.7 120.7 116.8 117.9 120.5 121.8 123.3Percentage change………..……………… 0.00 1.14 1.82 1.36 0.70 -1.00 -8.31 -3.26 0.96 2.21 1.09 1.22
RETAIL TRADE……………………………… 313.2 319.6 324.3 328.3 330.6 325.5 306.9 306.7 309.2 312.8 315.0 320.8Percentage change………..……………… 0.27 2.05 1.49 1.22 0.70 -1.55 -5.71 -0.06 0.81 1.18 0.68 1.86
TRANSPORTATION & UTILITIES………… 139.0 140.3 143.4 147.0 147.1 143.1 131.7 131.5 136.4 141.8 145.4 148.0Percentage change………..……………… 0.64 0.91 2.22 2.52 0.04 -2.70 -8.00 -0.12 3.75 3.89 2.54 1.81
INFORMATION………………………………… 51.2 49.5 49.4 49.6 50.3 50.5 46.9 45.0 43.8 43.2 44.1 43.9Percentage change………..……………… -4.08 -3.31 -0.20 0.37 1.41 0.51 -7.27 -3.98 -2.74 -1.35 2.08 -0.36
FINANCIAL ACTIVITIES……………………… 139.8 141.9 143.3 143.6 144.8 145.1 140.5 137.1 136.5 137.1 138.2 141.5Percentage change………..……………… 1.15 1.46 0.99 0.20 0.89 0.18 -3.15 -2.45 -0.44 0.45 0.78 2.41
PROFESSIONAL & BUSINESS SERVICES… 287.3 302.3 312.5 319.2 322.8 321.4 293.6 304.1 323.1 338.6 353.1 372.6Percentage change………..……………… -3.15 5.21 3.38 2.13 1.14 -0.43 -8.64 3.57 6.24 4.82 4.26 5.54
EDUCATION & HEALTH SERVICES………… 312.7 320.7 330.3 340.8 349.9 358.7 365.7 373.9 384.4 393.8 398.4 402.6Percentage change………..……………… 4.20 2.57 3.00 3.16 2.68 2.50 1.96 2.24 2.81 2.44 1.17 1.05
LEISURE & HOSPITALITY…………………… 246.7 253.6 262.1 270.1 276.2 273.7 263.5 262.0 267.7 276.8 285.8 296.1Percentage change………..……………… 2.81 2.82 3.34 3.07 2.23 -0.88 -3.73 -0.58 2.15 3.40 3.26 3.62
OTHER SERVICES……………………………… 102.3 101.7 100.7 101.7 104.0 104.5 102.0 101.2 102.0 104.3 105.6 105.8Percentage change………..……………… 0.62 -0.57 -0.99 0.99 2.33 0.42 -2.36 -0.82 0.85 2.21 1.27 0.21
GOVERNMENT………………………………… 411.1 415.0 412.7 417.0 421.4 427.8 428.6 433.1 427.8 424.1 425.2 425.2Percentage change………..……………… 0.20 0.96 -0.56 1.05 1.07 1.52 0.18 1.04 -1.22 -0.86 0.25 0.00
FEDERAL, CIVILIAN………………………… 51.2 50.1 49.2 48.9 48.8 49.5 50.1 52.4 50.4 50.2 49.6 47.9Percentage change………..……………… -1.21 -2.23 -1.65 -0.64 -0.27 1.35 1.21 4.66 -3.77 -0.45 -1.23 -3.33
STATE & LOCAL……………………………… 359.9 364.9 363.4 368.1 372.6 378.4 378.6 380.7 377.4 373.9 375.6 377.3Percentage change………..……………… 0.41 1.41 -0.42 1.27 1.24 1.55 0.04 0.57 -0.87 -0.91 0.45 0.44
STATISTICAL DISCREPANCY (% )……… 0.00 0.00 0.00 -0.01 0.00 0.00 0.01 0.00 -0.01 -0.01 0.00 0.01
Tennessee Econometric Model
January 2016
Historical Data
Center for Business and Economic Research, University of Tennessee

2016 TE
NN
ES
SE
E E
CO
NO
MIC
RE
PO
RT
| 7372 | 2016 T
EN
NE
SS
EE
EC
ON
OM
IC R
EP
OR
T
Historical D
ata | AP
PE
ND
IX B
Table 6: Tennessee Durable Goods Manufacturing Employment (thousands of jobs) January 2016
2003 2004 2005 2006 2007 2008 2009 2010 2011 2012 2013 2014
TOTAL DURABLE GOODS…………………… 250.9 254.0 254.6 251.8 237.1 220.8 181.8 176.3 183.7 193.9 198.9 205.5Percentage change………..…………… -3.15 1.25 0.22 -1.11 -5.83 -6.85 -17.66 -3.04 4.21 5.55 2.54 3.36
WOOD PRODUCTS……………………… 16.7 17.4 17.7 17.9 16.1 14.3 11.3 10.9 10.8 11.0 10.9 11.2Percentage change………..…………… -4.74 4.07 1.91 0.95 -10.14 -11.24 -20.84 -3.55 -1.07 2.25 -1.59 3.44
NONMETALLIC MINERALS……………… 15.6 15.7 15.9 16.1 15.5 14.2 11.6 11.3 11.8 12.5 12.1 11.9Percentage change………..…………… 2.94 0.64 1.73 1.05 -3.52 -8.38 -18.89 -2.05 4.20 5.80 -2.66 -1.94
PRIMARY METALS………….…………… 11.8 12.1 12.0 11.8 11.7 11.1 9.0 8.8 9.2 9.7 10.0 10.1Percentage change………..…………… -6.74 2.90 -0.97 -1.55 -0.85 -4.97 -18.84 -2.68 4.66 4.89 3.19 0.99
FABRICATED METALS………………….. 41.4 41.7 42.6 43.4 41.5 39.7 33.6 33.0 33.6 34.5 33.9 34.4Percentage change………..…………… -0.05 0.68 2.23 1.92 -4.46 -4.30 -15.37 -1.95 1.92 2.67 -1.67 1.35
MACHINERY………………………………… 33.2 34.3 33.9 33.2 32.0 31.2 26.0 24.8 25.1 25.5 25.4 25.7Percentage change………..…………… -7.52 3.21 -1.16 -1.97 -3.69 -2.50 -16.63 -4.79 1.48 1.67 -0.70 1.44
COMPUTERS & ELECTRONICS………… 11.7 11.3 10.4 9.3 8.1 7.4 6.2 5.6 5.6 5.6 5.2 5.0Percentage change………..…………… -9.59 -3.39 -7.48 -11.27 -12.55 -8.27 -16.07 -10.58 0.44 0.58 -7.24 -3.66
ELECTRICAL EQUIPMENT, APPLIANCES & COMPONENTS…………..…………… 23.6 23.1 23.5 23.2 22.1 20.6 17.8 16.9 17.7 17.9 18.6 19.4
Percentage change………..…………… -5.65 -2.22 1.65 -1.36 -4.66 -6.94 -13.52 -5.00 4.51 1.65 3.47 4.49
TRANSPORTATION EQUIPMENT……… 60.2 62.9 63.9 63.7 58.6 52.5 40.4 40.5 45.8 53.6 59.5 64.0Percentage change………..…………… 0.28 4.53 1.59 -0.27 -7.99 -10.46 -22.96 0.03 13.20 17.03 11.02 7.55
FURNITURE………………………………… 19.9 19.6 19.2 17.7 16.0 14.2 10.8 9.7 8.9 8.7 8.8 9.1Percentage change………..…………… -6.59 -1.34 -2.04 -7.71 -9.72 -11.08 -24.26 -10.21 -7.73 -2.92 1.06 3.50
MISCELLANEOUS DURABLES………… 16.8 15.9 15.3 15.3 15.4 15.5 15.0 14.9 15.2 14.9 14.5 14.7Percentage change………..…………… -1.76 -5.22 -3.83 0.16 0.18 0.98 -2.99 -0.68 1.83 -2.30 -2.25 1.26
Center for Business and Economic Research, University of Tennessee Tennessee Econometric Model
Historical Data

2016 TE
NN
ES
SE
E E
CO
NO
MIC
RE
PO
RT
| 7574 | 2016 T
EN
NE
SS
EE
EC
ON
OM
IC R
EP
OR
T
AP
PE
ND
IX B
| Historical D
ata
Table 7: Tennessee Nondurable Goods Manufacturing Employment (thousands of jobs) January 2016
2003 2004 2005 2006 2007 2008 2009 2010 2011 2012 2013 2014
TOTAL NONDURABLE GOODS………………… 162.4 157.8 154.2 147.6 142.8 140.1 127.4 122.6 120.7 119.5 119.6 119.7Percentage change………..………………… -4.19 -2.82 -2.28 -4.25 -3.24 -1.91 -9.08 -3.72 -1.57 -1.04 0.11 0.09
FOOD……………………………………………… 35.9 34.8 34.3 34.0 32.7 32.5 32.3 32.6 33.1 33.0 32.4 32.7Percentage change………..………………… -0.43 -3.04 -1.38 -0.97 -3.84 -0.62 -0.46 0.80 1.62 -0.24 -1.90 0.95
BEVERAGE & TOBACCO……………………… 6.1 5.8 5.4 5.2 5.1 5.1 5.1 5.0 5.0 5.2 5.3 5.4Percentage change………..………………… -3.77 -6.12 -5.79 -4.31 -2.56 0.14 0.16 -1.64 0.18 3.51 2.58 1.88
TEXTILE MILLS, TEXTILE MILL PRODUCTS & APPAREL…………………… 21.3 19.4 18.0 16.1 15.1 14.8 12.6 11.5 10.7 10.7 10.5 10.0
Percentage change………..………………… -12.94 -8.85 -7.37 -10.55 -6.37 -2.09 -14.93 -8.35 -7.20 -0.07 -1.96 -4.53
PAPER…………………………………………… 19.6 18.8 18.9 18.3 17.4 17.2 16.2 15.7 15.3 14.7 14.7 14.6Percentage change………..………………… -4.02 -3.92 0.72 -3.23 -5.06 -1.02 -6.13 -2.94 -2.53 -3.76 -0.17 -0.53
PRINTING & RELATED SUPPORT…………… 19.9 19.6 18.8 17.8 17.0 15.7 13.3 11.4 10.0 9.6 9.6 9.5Percentage change………..………………… -3.16 -1.20 -4.32 -5.39 -4.51 -7.53 -15.27 -13.96 -12.93 -3.45 0.08 -1.73
CHEMICALS……………………………………… 28.6 27.6 27.2 26.3 26.9 27.5 25.8 25.0 24.6 24.4 24.8 25.3Percentage change………..………………… 0.36 -3.29 -1.76 -3.14 2.34 2.20 -6.17 -3.26 -1.63 -0.68 1.68 2.12
PLASTICS & RUBBER………………………… 28.2 28.9 29.3 27.6 26.6 25.4 20.4 19.9 20.5 20.0 20.2 20.7Percentage change………..………………… -6.14 2.59 1.46 -5.76 -3.64 -4.39 -19.81 -2.49 2.90 -2.45 1.03 2.39
MISCELLANEOUS NONDURABLE GOODS… 2.8 2.8 2.3 2.3 2.1 2.0 1.8 1.6 1.7 1.9 2.1 1.5Percentage change………..………………… -10.49 0.06 -20.22 3.32 -8.57 -9.00 -9.44 -10.87 4.82 14.67 12.41 -27.57
Center for Business and Economic Research, University of Tennessee Tennessee Econometric Model
Historical Data

2016 TE
NN
ES
SE
E E
CO
NO
MIC
RE
PO
RT
| 7574 | 2016 T
EN
NE
SS
EE
EC
ON
OM
IC R
EP
OR
T
Historical D
ata | AP
PE
ND
IX B
Table 8: Tennessee Average Annual Wage and Salary Rate by Sector (2009 dollars)
2003 2004 2005 2006 2007 2008 2009 2010 2011 2012 2013 2014
TOTAL NONFARM………………………………… 38815 39485 39441 40242 40847 40545 40821 41444 41310 41968 41473 41961Percentage change………..……………… 1.34 1.73 -0.11 2.03 1.50 -0.74 0.68 1.53 -0.32 1.59 -1.18 1.18
NATURAL RESOURCES, MINING AND CONSTRUCTION……………………… 41700 41541 42264 44071 45329 45128 44526 45426 45418 45915 45734 47214
Percentage change………..……………… 0.85 -0.38 1.74 4.27 2.86 -0.44 -1.33 2.02 -0.02 1.09 -0.39 3.24
MANUFACTURING……………………………… 45856 46892 46605 47371 48006 48163 48923 51200 50738 51667 50887 51603Percentage change………..……………… 1.63 2.26 -0.61 1.64 1.34 0.33 1.58 4.66 -0.90 1.83 -1.51 1.41
DURABLE GOODS…………………………… 45284 46069 45774 46584 47071 47379 48242 50335 49667 51259 49504 50493Percentage change………..……………… 0.91 1.73 -0.64 1.77 1.04 0.66 1.82 4.34 -1.33 3.21 -3.42 2.00
NONDURABLE GOODS…………………… 46742 48219 47976 48721 49551 49402 49884 52453 52365 52336 53188 53507Percentage change………..……………… 2.74 3.16 -0.50 1.55 1.70 -0.30 0.97 5.15 -0.17 -0.05 1.63 0.60
TRADE, TRANSPORTATION, UTILITIES…… 36969 37525 37797 38337 38926 38008 37815 38270 38519 38768 38217 38716Percentage change………..……………… 0.91 1.50 0.72 1.43 1.54 -2.36 -0.51 1.20 0.65 0.65 -1.42 1.31
WHOLESALE TRADE……………………… 51712 53743 54161 56196 57141 56361 55941 56904 57355 58788 57703 59151Percentage change………..……………… 2.08 3.93 0.78 3.76 1.68 -1.37 -0.74 1.72 0.79 2.50 -1.85 2.51
RETAIL TRADE……………………………… 26656 26489 26583 26659 27206 26281 26401 26841 26925 26719 26129 26483Percentage change………..……………… 0.30 -0.63 0.36 0.29 2.05 -3.40 0.46 1.67 0.31 -0.77 -2.21 1.36
TRANSPORTATION & UTILITIES………… 46786 47872 48297 48367 48796 47789 47801 48376 48520 48338 48078 48212Percentage change………..……………… 0.52 2.32 0.89 0.15 0.89 -2.06 0.02 1.20 0.30 -0.38 -0.54 0.28
INFORMATION………………………………… 46609 48212 48521 52767 52342 51111 51533 52405 54163 55156 54085 55910Percentage change………..……………… 1.28 3.44 0.64 8.75 -0.81 -2.35 0.83 1.69 3.35 1.83 -1.94 3.38
FINANCIAL ACTIVITIES……………………… 54730 56157 54620 57508 58928 57322 57385 60363 60287 63326 61587 63223Percentage change………..……………… 5.52 2.61 -2.74 5.29 2.47 -2.73 0.11 5.19 -0.13 5.04 -2.75 2.66
PROFESSIONAL & BUSINESS SERVICES… 39828 40484 40405 41932 43665 44569 46282 46898 46076 48591 48410 47621Percentage change………..……………… 0.91 1.65 -0.20 3.78 4.13 2.07 3.84 1.33 -1.75 5.46 -0.37 -1.63
EDUCATION & HEALTH SERVICES………… 40127 41473 42147 42295 42744 42642 43665 43532 42873 42826 42561 42809Percentage change………..……………… 0.57 3.35 1.62 0.35 1.06 -0.24 2.40 -0.30 -1.51 -0.11 -0.62 0.58
LEISURE & HOSPITALITY…………………… 19556 19545 19397 19858 20195 19686 19666 20077 19982 20213 19675 20158Percentage change………..……………… 0.85 -0.05 -0.76 2.38 1.69 -2.52 -0.10 2.09 -0.47 1.16 -2.66 2.45
OTHER SERVICES……………………………… 35909 37014 36314 37234 36543 36437 37018 37008 37199 37485 37216 38866Percentage change………..……………… 2.17 3.08 -1.89 2.53 -1.85 -0.29 1.60 -0.03 0.52 0.77 -0.72 4.44
GOVERNMENT………………………………… 37683 38100 38110 38495 38989 38902 39122 39028 39191 39090 38890 39409Percentage change………..……………… 2.14 1.11 0.03 1.01 1.28 -0.22 0.57 -0.24 0.42 -0.26 -0.51 1.33
FEDERAL, CIVILIAN………………………… 60785 63097 63215 63610 64920 63166 64208 65783 68125 66962 65699 71860Percentage change………..……………… 4.50 3.80 0.19 0.62 2.06 -2.70 1.65 2.45 3.56 -1.71 -1.89 9.38
STATE & LOCAL……………………………… 34395 34671 34709 35156 35593 35731 35805 35362 35327 35351 35353 35292Percentage change………..……………… 1.71 0.80 0.11 1.29 1.24 0.39 0.21 -1.24 -0.10 0.07 0.01 -0.17
Tennessee Econometric Model
January 2016Historical Data
Center for Business and Economic Research, University of Tennessee
2016 TE
NN
ES
SE
E E
CO
NO
MIC
RE
PO
RT
| 7776 | 2016 T
EN
NE
SS
EE
EC
ON
OM
IC R
EP
OR
T
AP
PE
ND
IX B
| Historical D
ata
Table 9: Tennessee Average Annual Wage and Salary Rate by Sector (current dollars)
2003 2004 2005 2006 2007 2008 2009 2010 2011 2012 2013 2014
TOTAL NONFARM……………………………………………….. 33993 35421 36388 38122 39664 40570 40822 42129 43022 44537 44613 45782Percentage change………..……………………………… 3.35 4.20 2.73 4.77 4.04 2.28 0.62 3.20 2.12 3.52 0.17 2.62
NATURAL RESOURCES, MINING & CONSTRUCTION… 36519 37263 38995 41749 44020 45155 44523 46175 47298 48723 49198 51513Percentage change………..……………………………… 2.86 2.04 4.65 7.06 5.44 2.58 -1.40 3.71 2.43 3.01 0.97 4.71
MANUFACTURING…………………………………………… 40160 42067 42999 44875 46615 48192 48934 52048 52839 54829 54740 56302Percentage change………..……………………………… 3.65 4.75 2.22 4.36 3.88 3.38 1.54 6.36 1.52 3.77 -0.16 2.85
DURABLE GOODS……………………………………...... 39659 41328 42231 44128 45705 47412 48252 51167 51724 54394 53253 55092Percentage change………..……………………………… 2.92 4.21 2.19 4.49 3.57 3.74 1.77 6.04 1.09 5.16 -2.10 3.45
NONDURABLE GOODS…………………………….. 40936 43260 44266 46156 48119 49426 49896 53325 54531 55542 57215 58379Percentage change………..……………………………… 4.78 5.68 2.33 4.27 4.25 2.72 0.95 6.87 2.26 1.85 3.01 2.03
TRADE, TRANSPORTATION, UTILITIES…………. 32376 33663 34872 36317 37796 38030 37816 38903 40116 41142 41111 42242Percentage change………..……………………………… 2.91 3.97 3.59 4.14 4.07 0.62 -0.56 2.87 3.12 2.56 -0.08 2.75
WHOLESALE TRADE……………………………………. 45288 48212 49972 53236 55483 56395 55941 57846 59732 62393 62073 64537Percentage change………..……………………………… 4.11 6.46 3.65 6.53 4.22 1.64 -0.81 3.41 3.26 4.45 -0.51 3.97
RETAIL TRADE……………………………………………. 23344 23762 24525 25255 26417 26298 26402 27285 28043 28353 28107 28895Percentage change………..……………………………… 2.30 1.79 3.21 2.98 4.60 -0.45 0.40 3.34 2.78 1.11 -0.87 2.80
TRANSPORTATION & UTILITIES………………………… 40974 42943 44556 45819 47379 47815 47802 49176 50528 51296 51719 52602Percentage change………..……………………………… 2.51 4.81 3.75 2.84 3.40 0.92 -0.03 2.87 2.75 1.52 0.82 1.71
INFORMATION………………………………………………… 40816 43247 44752 49988 50817 51141 51535 53268 56408 58535 58179 60999Percentage change………..……………………………… 3.28 5.96 3.48 11.70 1.66 0.64 0.77 3.36 5.89 3.77 -0.61 4.85
FINANCIAL ACTIVITIES…………………………………..... 47931 50379 50399 54482 57219 57358 57388 61370 62787 67208 66252 68979Percentage change………..……………………………… 7.61 5.11 0.04 8.10 5.02 0.24 0.05 6.94 2.31 7.04 -1.42 4.12
PROFESSIONAL & BUSINESS SERVICES………………… 34880 36314 37273 39723 42403 44594 46283 47673 47982 51570 52074 51957Percentage change………..……………………………… 2.91 4.11 2.64 6.57 6.75 5.17 3.79 3.00 0.65 7.48 0.98 -0.22
EDUCATION & HEALTH SERVICES………………………. 35143 37206 38886 40065 41506 42670 43666 44252 44652 45448 45784 46707Percentage change………..……………………………… 2.57 5.87 4.52 3.03 3.60 2.80 2.33 1.34 0.90 1.78 0.74 2.02
LEISURE & HOSPITALITY…………………………………… 17126 17532 17896 18812 19610 19698 19666 20409 20811 21450 21165 21995Percentage change………..……………………………… 2.85 2.37 2.07 5.12 4.24 0.45 -0.17 3.78 1.97 3.07 -1.32 3.92
OTHER SERVICES…………………………………………... 31446 33199 33504 35272 35482 36458 37021 37619 38739 39779 40035 42406Percentage change………..……………………………… 4.18 5.57 0.92 5.27 0.60 2.75 1.54 1.61 2.98 2.69 0.64 5.92
GOVERNMENT……………………………………………….. 33000 34178 35159 36467 37858 38925 39120 39672 40817 41483 41834 42997Percentage change………..……………………………… 4.16 3.57 2.87 3.72 3.82 2.82 0.50 1.41 2.88 1.63 0.85 2.78
FEDERAL, CIVILIAN………………………………………. 53231 56597 58318 60258 63034 63202 64209 66876 70947 71056 70675 78407Percentage change………..……………………………… 6.58 6.32 3.04 3.33 4.61 0.27 1.59 4.15 6.09 0.15 -0.54 10.94
STATE & LOCAL…………………………………………... 30121 31103 32021 33304 34562 35753 35803 35946 36793 37515 38029 38505Percentage change………..……………………………… 3.72 3.26 2.95 4.01 3.78 3.45 0.14 0.40 2.36 1.96 1.37 1.25
Tennessee Econometric Model
January 2016
Historical Data
Center for Business and Economic Research, University of Tennessee

2016 TE
NN
ES
SE
E E
CO
NO
MIC
RE
PO
RT
| 7776 | 2016 T
EN
NE
SS
EE
EC
ON
OM
IC R
EP
OR
T
Historical D
ata | AP
PE
ND
IX B
Table 10: Tennessee Civilian Labor Force and Unemployment Rate
2003 2004 2005 2006 2007 2008 2009 2010 2011 2012 2013 2014
CIVILIAN LABOR FORCE (THOUS)………… 2912 2880 2901 3032 3062 3052 3050 3088 3118 3091 3054 2993Percentage change……………………… 0.18 -1.11 0.73 4.52 0.97 -0.32 -0.05 1.23 0.99 -0.88 -1.20 -1.97
EMPLOYED PERSONS (THOUS)………… 2748 2726 2740 2874 2916 2845 2727 2790 2842 2850 2820 2797Percentage change……………………… -0.29 -0.81 0.54 4.89 1.46 -2.46 -4.14 2.32 1.85 0.28 -1.03 -0.84
UNEMPLOYED PERSONS (THOUS)…… 164 154 161 158 145 207 323 298 276 241 233 197Percentage change……………………… 8.81 -6.01 4.17 -1.86 -7.93 42.71 56.11 -7.95 -7.13 -12.79 -3.27 -15.69
PARTICIPATION RATE (PERCENT)……… 63.8 62.4 62.0 63.7 63.3 62.2 61.4 61.6 61.6 60.3 58.9 57.1Percentage change……………………… -0.73 -2.18 -0.66 2.78 -0.70 -1.67 -1.22 0.32 -0.06 -2.07 -2.36 -3.13
UNEMPLOYMENT RATE (PERCENT)……… 5.6 5.4 5.5 5.2 4.7 6.8 10.6 9.6 8.9 7.8 7.6 6.6
Center for Business and Economic Research, University of Tennessee
January 2016
Historical Data
Tennessee Econometric Model

2016 TE
NN
ES
SE
E E
CO
NO
MIC
RE
PO
RT
| 7978 | 2016 T
EN
NE
SS
EE
EC
ON
OM
IC R
EP
OR
T
AP
PE
ND
IX B
| Historical D
ata
Table 11: Tennessee Taxable Sales (millions of 2009 dollars)
2003 2004 2005 2006 2007 2008 2009 2010 2011 2012 2013 2014
TOTAL TAXABLE SALES………………………… 89918 92218 95680 97860 98872 93182 86223 86956 89903 92389 93837 97036Percentage change………..………………… 2.32 2.56 3.75 2.28 1.03 -5.76 -7.47 0.85 3.39 2.77 1.57 3.41
AUTO DEALERS………………………………… 10769 10529 10224 9911 9788 7935 6724 7546 8094 8743 9143 9689Percentage change………..………………… 4.67 -2.23 -2.90 -3.06 -1.24 -18.93 -15.27 12.22 7.26 8.02 4.57 5.98
PURCHASES FROM MANUFACTURERS…. 4490 4626 5205 4940 4888 4495 3491 3595 3850 3813 3878 4089Percentage change………..………………… 5.59 3.02 12.52 -5.10 -1.06 -8.04 -22.33 2.96 7.09 -0.94 1.70 5.42
MISC DURABLE GOODS……………………… 14719 15810 17170 18165 17964 16339 13748 14258 14961 15433 15626 16089Percentage change………..………………… 3.00 7.41 8.60 5.80 -1.11 -9.05 -15.86 3.71 4.93 3.15 1.26 2.96
EATING AND DRINKING PLACES…………… 7896 8309 8627 8935 9144 8968 8841 8909 9128 9611 9832 10259Percentage change………..………………… 3.28 5.24 3.83 3.56 2.35 -1.92 -1.42 0.78 2.45 5.29 2.29 4.35
FOOD STORES………………………………… 8966 8849 8884 8887 8992 8592 8822 8740 8849 9131 9373 9487Percentage change………..………………… -3.55 -1.31 0.40 0.04 1.17 -4.44 2.68 -0.93 1.24 3.19 2.65 1.21
LIQUOR STORES……………………………… 495 510 536 578 612 636 657 673 699 747 778 819Percentage change………..………………… 4.10 3.20 5.09 7.76 5.86 3.89 3.37 2.48 3.75 6.93 4.06 5.36
HOTELS AND MOTELS………………………… 2079 2096 2215 2342 2425 2312 2038 2033 2239 2345 2361 2642Percentage change………..………………… 0.51 0.81 5.66 5.73 3.56 -4.66 -11.84 -0.25 10.13 4.74 0.66 11.91
OTHER RETAIL AND SERVICE……………… 26505 27074 27970 28642 29151 28220 26806 26871 27611 28444 28818 29891Percentage change………..………………… 3.32 2.15 3.31 2.40 1.78 -3.19 -5.01 0.24 2.75 3.02 1.32 3.72
MISC NONDURABLE GOODS………………… 7128 7269 7613 7698 7990 7780 7364 7521 7670 7939 8081 8289Percentage change………..………………… -1.69 1.98 4.72 1.12 3.79 -2.63 -5.34 2.13 1.98 3.51 1.79 2.57
TRANSPORTATION, COMMUNICATION…… 6870 7146 7237 7763 7919 7905 7731 6808 6803 6182 5946 5782Percentage change………..………………… 3.10 4.02 1.27 7.27 2.01 -0.17 -2.20 -11.94 -0.08 -9.13 -3.81 -2.77
PER CAPITA ($)…………………………………… 15427 15664 16051 16169 16096 14981 13721 13735 14071 14306 14377 14710Percentage change………..………………… 1.45 1.54 2.47 0.74 -0.46 -6.92 -8.41 0.10 2.45 1.68 0.49 2.32
Center for Business and Economic Research, University of Tennessee
January 2016
Historical Data
Tennessee Econometric Model

2016 TE
NN
ES
SE
E E
CO
NO
MIC
RE
PO
RT
| 7978 | 2016 T
EN
NE
SS
EE
EC
ON
OM
IC R
EP
OR
T
Historical D
ata | AP
PE
ND
IX B
Table 12: Tennessee Taxable Sales (millions of current dollars)
2003 2004 2005 2006 2007 2008 2009 2010 2011 2012 2013 2014
TOTAL TAXABLE SALES………………………… 78749 82725 88284 92705 95999 93236 86219 88395 93641 98041 100943 105877Percentage change………..………………… 4.35 5.05 6.72 5.01 3.55 -2.88 -7.53 2.52 5.93 4.70 2.96 4.89
AUTO DEALERS………………………………… 9431 9444 9429 9389 9503 7938 6725 7672 8431 9279 9836 10572Percentage change………..………………… 6.74 0.14 -0.16 -0.43 1.21 -16.47 -15.28 14.07 9.90 10.05 6.01 7.49
PURCHASES FROM MANUFACTURERS…. 3933 4150 4803 4679 4745 4497 3491 3654 4009 4047 4172 4461Percentage change………..………………… 7.69 5.52 15.73 -2.58 1.41 -5.22 -22.37 4.68 9.72 0.94 3.09 6.93
MISC DURABLE GOODS……………………… 12892 14183 15845 17208 17440 16347 13747 14494 15583 16375 16810 17555Percentage change………..………………… 5.06 10.02 11.72 8.60 1.35 -6.27 -15.90 5.43 7.52 5.08 2.65 4.44
EATING AND DRINKING PLACES…………… 6915 7454 7960 8464 8880 8973 8840 9057 9508 10200 10576 11194Percentage change………..………………… 5.34 7.80 6.79 6.34 4.91 1.06 -1.48 2.45 4.98 7.28 3.69 5.84
FOOD STORES………………………………… 7852 7937 8196 8419 8731 8601 8821 8885 9217 9690 10083 10351Percentage change………..………………… -1.64 1.09 3.26 2.72 3.70 -1.49 2.57 0.72 3.74 5.14 4.05 2.66
LIQUOR STORES……………………………… 433 458 495 548 594 636 657 685 728 793 836 894Percentage change………..………………… 6.17 5.71 8.10 10.63 8.51 7.05 3.32 4.17 6.31 8.94 5.49 6.86
HOTELS AND MOTELS………………………… 1821 1881 2044 2218 2355 2313 2038 2067 2333 2489 2540 2883Percentage change………..………………… 2.50 3.27 8.67 8.55 6.15 -1.78 -11.87 1.40 12.85 6.70 2.04 13.51
OTHER RETAIL AND SERVICE……………… 23213 24286 25806 27134 28304 28237 26806 27316 28758 30184 31000 32614Percentage change………..………………… 5.37 4.62 6.26 5.15 4.31 -0.24 -5.07 1.90 5.28 4.96 2.70 5.20
MISC NONDURABLE GOODS………………… 6243 6521 7024 7293 7758 7784 7364 7646 7989 8425 8693 9044Percentage change………..………………… 0.27 4.45 7.72 3.82 6.38 0.34 -5.39 3.82 4.49 5.46 3.18 4.04
TRANSPORTATION, COMMUNICATION…… 6016 6410 6682 7353 7689 7910 7729 6921 7085 6560 6396 6308Percentage change………..………………… 5.15 6.55 4.23 10.05 4.57 2.87 -2.29 -10.45 2.37 -7.42 -2.49 -1.38
PER CAPITA ($)…………………………………… 13511 14051 14809 15317 15627 14990 13720 13962 14655 15181 15465 16050Percentage change………..………………… 3.46 4.00 5.40 3.43 2.02 -4.08 -8.47 1.76 4.97 3.59 1.87 3.78
Center for Business and Economic Research, University of Tennessee
January 2016
Historical Data
Tennessee Econometric Model

2016 TE
NN
ES
SE
E E
CO
NO
MIC
RE
PO
RT
| 8180 | 2016 T
EN
NE
SS
EE
EC
ON
OM
IC R
EP
OR
T
AP
PE
ND
IX B
| Historical D
ata
Table 14: Tennessee Average Annual Wage and Salary Rate by Sector, Seasonally Adjusted (current dollars)
2015:2 2015:3 2015:4 2016:1 2016:2 2016:3 2016:4 2017:1 2017:2 2017:3 2017:4 2018:1 2014 2015 2016 2017
TOTAL NONFARM……………………………………………….. 47346 47481 47891 48241 48586 48925 49266 49616 49956 50303 50649 50984 45782 47219 48755 50131% Chg Prev Qtr SAAR………..…………………………… 10.68 1.14 3.50 2.96 2.89 2.82 2.82 2.87 2.77 2.81 2.78 2.67 2.62 3.14 3.25 2.82% Chg Same Qtr Last Yr……………………………….. 3.76 3.73 3.44 4.51 2.62 3.04 2.87 2.85 2.82 2.82 2.81 2.76 2.62 3.14 3.25 2.82
NATURAL RESOURCES, MINING & CONSTRUCTION…… 54764 56036 56338 56717 57094 57489 57866 58296 58734 59169 59609 60009 51513 54695 57291 58952% Chg Prev Qtr SAAR………..…………………………… 26.46 9.62 2.17 2.72 2.69 2.79 2.65 3.01 3.04 2.99 3.01 2.71 4.71 6.18 4.75 2.90% Chg Same Qtr Last Yr……………………………….. 6.18 8.25 8.61 9.83 4.26 2.59 2.71 2.78 2.87 2.92 3.01 2.94 4.71 6.18 4.75 2.90
MANUFACTURING…………………………………………… 57619 58423 59116 59605 60062 60584 61081 61537 61954 62435 62929 63334 56302 57400 60333 62214% Chg Prev Qtr SAAR………..…………………………… 25.45 5.70 4.83 3.35 3.10 3.52 3.32 3.02 2.74 3.15 3.20 2.60 2.85 1.95 5.11 3.12% Chg Same Qtr Last Yr……………………………….. 2.58 4.07 3.24 9.48 4.24 3.70 3.32 3.24 3.15 3.06 3.03 2.92 2.85 1.95 5.11 3.12
DURABLE GOODS……………………………………...... 55869 56305 56988 57331 57693 58176 58650 59072 59451 59941 60460 60849 55092 55627 57962 59731% Chg Prev Qtr SAAR………..…………………………… 20.29 3.16 4.94 2.43 2.55 3.39 3.30 2.91 2.59 3.34 3.51 2.60 3.45 0.97 4.20 3.05% Chg Same Qtr Last Yr……………………………….. 1.39 2.50 1.28 7.47 3.26 3.32 2.92 3.04 3.05 3.03 3.09 3.01 3.45 0.97 4.20 3.05
NONDURABLE GOODS…………………………….. 60716 62180 62910 63681 64330 64949 65517 66055 66566 67057 67531 67993 58379 60542 64619 66803% Chg Prev Qtr SAAR………..…………………………… 34.67 10.00 4.78 4.99 4.14 3.91 3.54 3.33 3.13 2.98 2.86 2.76 2.03 3.71 6.73 3.38% Chg Same Qtr Last Yr……………………………….. 4.70 6.82 6.65 12.98 5.95 4.45 4.14 3.73 3.48 3.24 3.07 2.93 2.03 3.71 6.73 3.38
TRADE, TRANSPORTATION, UTILITIES…………. 42794 42887 43218 43594 43970 44311 44670 45047 45414 45778 46130 46497 42242 42707 44136 45592% Chg Prev Qtr SAAR………..…………………………… 8.51 0.87 3.12 3.53 3.50 3.13 3.28 3.42 3.30 3.24 3.11 3.22 2.75 1.10 3.35 3.30% Chg Same Qtr Last Yr……………………………….. 2.84 2.02 -0.79 3.97 2.75 3.32 3.36 3.33 3.28 3.31 3.27 3.22 2.75 1.10 3.35 3.30
WHOLESALE TRADE……………………………………. 65438 65107 65624 66259 66802 67371 67904 68436 68952 69463 69949 70508 64537 64934 67084 69200% Chg Prev Qtr SAAR………..…………………………… 12.31 -2.00 3.21 3.93 3.32 3.45 3.20 3.17 3.05 3.00 2.83 3.23 3.97 0.61 3.31 3.15% Chg Same Qtr Last Yr……………………………….. 2.85 0.78 -0.50 4.24 2.09 3.48 3.47 3.28 3.22 3.10 3.01 3.03 3.97 0.61 3.31 3.15
RETAIL TRADE……………………………………………. 29138 29534 29748 29973 30226 30443 30692 30946 31202 31466 31700 31933 28895 29193 30333 31329% Chg Prev Qtr SAAR………..…………………………… 11.59 5.56 2.93 3.05 3.42 2.90 3.32 3.35 3.35 3.43 3.01 2.97 2.80 1.03 3.91 3.28% Chg Same Qtr Last Yr……………………………….. 2.77 3.31 -1.54 5.72 3.73 3.07 3.17 3.25 3.23 3.36 3.28 3.19 2.80 1.03 3.91 3.28
TRANSPORTATION & UTILITIES……………………………53522 53048 53448 53897 54358 54738 55162 55636 56083 56519 56977 57407 52602 53300 54539 56304% Chg Prev Qtr SAAR………..…………………………… 2.58 -3.49 3.05 3.40 3.47 2.82 3.14 3.48 3.25 3.15 3.28 3.05 1.71 1.33 2.32 3.24% Chg Same Qtr Last Yr……………………………….. 2.70 1.23 -0.46 1.34 1.56 3.18 3.21 3.23 3.17 3.25 3.29 3.18 1.71 1.33 2.32 3.24
INFORMATION…………………………………………………… 62396 63946 64536 65034 65505 65925 66370 66806 67331 67866 68396 68793 60999 63239 65708 67600% Chg Prev Qtr SAAR………..…………………………… 2.06 10.31 3.74 3.12 2.93 2.59 2.73 2.65 3.18 3.22 3.16 2.34 4.85 3.67 3.90 2.88% Chg Same Qtr Last Yr……………………………….. 0.94 3.55 10.10 4.76 4.98 3.09 2.84 2.72 2.79 2.94 3.05 2.97 4.85 3.67 3.90 2.88
FINANCIAL ACTIVITIES…………………………………..... 70683 71177 71949 72635 73243 73807 74348 74950 75522 76033 76539 77045 68979 70721 73508 75761% Chg Prev Qtr SAAR………..…………………………… 9.65 2.82 4.41 3.87 3.39 3.12 2.96 3.28 3.09 2.73 2.69 2.67 4.12 2.52 3.94 3.06% Chg Same Qtr Last Yr……………………………….. 3.31 3.87 2.68 5.16 3.62 3.70 3.33 3.19 3.11 3.01 2.95 2.79 4.12 2.52 3.94 3.06
January 2016
History Forecast Data Annual
(CONTINUED ON NEXT PAGE)
Table 13: Tennessee Gross Domestic Product by Sector (millions of 2009 dollars)
2003 2004 2005 2006 2007 2008 2009 2010 2011 2012 2013 2014GROSS DOMESTIC PRODUCT..........................................................................240,376 250,288 252,717 258,027 255,313 257,567 247,316 251,094 258,257 266,947 268,707 274,962 Percentage change………………………………………………………………………..2.34 4.12 0.97 2.10 -1.05 0.88 -3.98 1.53 2.85 3.36 0.66 2.33
NATURAL RESOURCES & MINING......................................................................................................2,409 2,449 2,553 2,697 2,034 2,333 2,676 2,575 2,451 2,313 2,838 3,033 Percentage change………………………………………………………………………..9.00 1.66 4.25 5.64 -24.58 14.70 14.70 -3.77 -4.82 -5.63 22.70 6.88
CONSTRUCTION................................................................................11,484 11,434 11,319 11,407 11,112 10,171 9,066 8,995 9,157 9,525 9,297 9,461 Percentage change………………………………………………………………………..-1.50 -0.44 -1.01 0.78 -2.59 -8.47 -10.86 -0.78 1.80 4.02 -2.39 1.77
MANUFACTURING.............................................................................39,647 44,681 43,954 45,674 43,772 42,827 38,639 39,488 41,425 44,136 44,914 46,110 Percentage change………………………………………………………………………..3.78 12.70 -1.63 3.91 -4.16 -2.16 -9.78 2.20 4.91 6.54 1.76 2.66
DURABLE GOODS........................................................................22,702 25,103 26,116 27,090 24,479 24,898 20,627 20,498 23,023 25,302 25,593 26,450 Percentage change………………………………………………………………………..10.88 10.58 4.04 3.73 -9.64 1.71 -17.15 -0.63 12.32 9.90 1.15 3.35
WOOD PRODUCTS………………………………………….............622 655 705 730 814 809 603 611 663 660 560 569 Percentage change………………………………………………………………………..-11.27 5.31 7.63 3.55 11.51 -0.61 -25.46 1.33 8.51 -0.45 -15.15 1.59
NONMETALLIC MINERAL PRODUCTS……………………………..1,547 1,675 1,497 1,335 1,332 1,112 875 959 1,068 1,089 1,030 1,033 Percentage change………………………………………………………………………..14.09 8.27 -10.63 -10.82 -0.22 -16.52 -21.31 9.60 11.37 1.97 -5.42 0.31
PRIMARY METALS………….…………………………….................990 1,134 1,121 1,075 853 848 767 875 993 1,159 1,219 1,228 Percentage change………………………………………………………………………..-19.90 14.55 -1.15 -4.10 -20.65 -0.59 -9.55 14.08 13.49 16.72 5.18 0.73
FABRICATED METAL PRODUCTS…………………..3,965 4,477 4,294 4,601 4,483 3,899 3,527 3,751 3,625 3,710 3,478 3,542 Percentage change………………………………………………………………………..7.37 12.91 -4.09 7.15 -2.56 -13.03 -9.54 6.35 -3.36 2.34 -6.25 1.84
MACHINERY…………………………………………………………3,467 3,299 3,797 3,534 3,064 3,614 2,761 2,598 2,802 2,553 3,010 3,060 Percentage change………………………………………………………………………..6.02 -4.85 15.10 -6.93 -13.30 17.95 -23.60 -5.90 7.85 -8.89 17.90 1.67
COMPUTER & ELECTRONIC PRODUCTS……………2252 2868 2561 2302 2752 3897 4072 1210 1176 1278 1,385 1,455 Percentage change………………………………………………………………………..95.15 27.35 -10.70 -10.11 19.55 41.61 4.49 -70.28 -2.81 8.67 8.37 5.07
ELECTRICAL EQUIPMENT, APPLIANCES& COMPONENTS………….………………… 2,590 2,583 2,828 3,090 2,487 3,088 2,909 2,536 2,696 3,484 3,070 3,139
Percentage change………………………………………………………………………..8.87 -0.27 9.49 9.26 -19.51 24.17 -5.80 -12.82 6.31 29.23 -11.88 2.24
MOTOR VEHICLES, BODIES & TRAILERS& PARTS………………………………… 4,127 5,018 5,856 7,077 5,312 4,398 1,969 4,792 6,821 8,297 8,994 9,524
Percentage change………………………………………………………………………..19.66 21.59 16.70 20.85 -24.94 -17.21 -55.23 143.37 42.34 21.64 8.40 5.89
OTHER TRANSPORTATION EQUIPMENT………………………………………………………………………………………………………………671 893 946 805 751 631 423 495 540 455 369 377 Percentage change………………………………………………………………………..-6.93 33.08 5.94 -14.90 -6.71 -15.98 -32.96 17.02 9.09 -15.74 -18.90 2.18
FURNITURE……………………………………………………………..1,028 990 905 849 826 651 471 423 404 426 456 463 Percentage change………………………………………………………………………..-7.80 -3.70 -8.59 -6.19 -2.71 -21.19 -27.65 -10.19 -4.49 5.45 7.04 1.63
MISCELLANEOUS DURABLE GOODS………………1,443 1,511 1,606 1,692 1,805 1,951 2,250 2,248 2,235 2,191 2,022 2,060 Percentage change………………………………………………………………………..3.07 4.71 6.29 5.35 6.68 8.09 15.33 -0.09 -0.58 -1.97 -7.71 1.86
NONDURABLE GOODS………………………………….16,945 19,578 17,838 18,584 19,293 17,929 18,012 18,990 18,402 18,834 19,321 19,660 Percentage change………………………………………………………………………..-4.43 15.54 -8.89 4.18 3.82 -7.07 0.46 5.43 -3.10 2.35 2.59 1.75
FOOD AND BEVERAGE & TOBACCO.........................5,388 6,014 5,938 6,585 7,369 6,779 6,912 7,120 6,761 6,769 6,501 6,652 Percentage change………………………………………………………………………..-3.42 11.62 -1.26 10.90 11.91 -8.01 1.96 3.01 -5.04 0.12 -3.96 2.32
Historical DataJanuary 2016

2016 TE
NN
ES
SE
E E
CO
NO
MIC
RE
PO
RT
| 8180 | 2016 T
EN
NE
SS
EE
EC
ON
OM
IC R
EP
OR
T
Historical D
ata | AP
PE
ND
IX B
2003 2004 2005 2006 2007 2008 2009 2010 2011 2012 2013 2014TEXTILE MILLS & TEXTILE PRODUCT MILLS……………………………..675 725 618 668 582 615 421 369 295 332 455 448
Percentage change………………………………………………………………………..-6.38 7.41 -14.76 8.09 -12.87 5.67 -31.54 -12.35 -20.05 12.54 37.05 -1.46
PAPER………………………………………………………………………..2,285 2,402 2,462 2,746 2,348 2,385 2,590 2,709 2,452 2,610 2,683 2,731 Percentage change………………………………………………………………………..1.78 5.12 2.50 11.54 -14.49 1.58 8.60 4.59 -9.49 6.44 2.80 1.79
PRINTING & RELATED SUPPORT………………………………………………………………………..1,211 1,233 1,256 1,304 1,276 1,237 1,093 1,064 1,041 995 1,121 1,140 Percentage change………………………………………………………………………..6.88 1.82 1.87 3.82 -2.15 -3.06 -11.64 -2.65 -2.16 -4.42 12.66 1.72
CHEMICALS………………………………………………………………………..3,535 5,506 4,218 4,604 4,781 4,337 4,557 5,198 5,622 5,740 5,852 5,998 Percentage change………………………………………………………………………..-17.64 55.76 -23.39 9.15 3.84 -9.29 5.07 14.07 8.16 2.10 1.95 2.49
PLASTICS & RUBBER………………………………………………………………………..2,451 2,509 2,280 1,932 2,121 1,919 1,757 1,894 1,749 1,782 1,957 1,948 Percentage change………………………………………………………………………..1.49 2.37 -9.13 -15.26 9.78 -9.52 -8.44 7.80 -7.66 1.89 9.82 -0.47
MISCELLANEOUS NONDURABLE GOODS………………1,020 841 768 505 586 415 470 395 275 397 432 430 Percentage change………………………………………………………………………..15.38 -17.55 -8.68 -34.24 16.04 -29.18 13.25 -15.96 -30.38 44.36 8.82 -0.37
TRADE, TRANSPORTATION, UTILITIES………….....................……..................……..................48,398 50,717 52,831 54,084 53,733 52,319 47,471 49,142 49,883 50,770 50,708 51,765 Percentage change………………………………………………………………………..6.09 4.79 4.17 2.37 -0.65 -2.63 -9.27 3.52 1.51 1.78 -0.12 3.20
WHOLESALE TRADE……………………………………......................16,648 17,765 18,420 19,025 19,537 19,414 16,467 16,740 16,876 17,612 17,935 18,426 Percentage change………………………………………………………………………..7.32 6.71 3.69 3.28 2.69 -0.63 -15.18 1.66 0.81 4.36 1.83 2.74
RETAIL TRADE…………………………………………….........................18,926 19,307 20,139 20,156 19,928 18,871 18,229 18,805 18,909 19,184 18,864 19,202 Percentage change………………………………………………………………………..7.40 2.01 4.31 0.08 -1.13 -5.30 -3.40 3.16 0.55 1.45 -1.67 1.79
TRANSPORTATION & UTILITIES…………………………………………….12,824 13,645 14,272 14,903 14,268 14,034 12,775 13,597 14,098 13,974 13,909 14,137 Percentage change………………………………………………………………………..2.72 6.40 4.60 4.42 -4.26 -1.64 -8.97 6.43 3.68 -0.88 -0.47 1.64
INFORMATION……………………………………………………....................................6,339 6,897 7,424 8,033 8,532 8,808 8,330 8,516 8,359 8,395 8,583 8,828 Percentage change………………………………………………………………………..4.53 8.80 7.64 8.20 6.21 3.23 -5.43 2.23 -1.84 0.43 2.24 2.86
FINANCIAL ACTIVITIES…………………………………............................36,980 35,988 35,367 36,027 37,767 38,658 39,929 41,490 42,980 43,242 43,188 44,311 Percentage change………………………………………………………………………..0.42 -2.68 -1.73 1.87 4.83 2.36 3.29 3.91 3.59 0.61 -0.12 2.60
PROFESSIONAL & BUSINESS SERVICES………………………….................24,214 25,269 25,285 25,374 25,656 27,151 25,606 26,821 27,840 30,019 30,649 31,896 Percentage change………………………………………………………………………..3.96 4.36 0.06 0.35 1.11 5.83 -5.69 4.74 3.80 7.83 2.10 4.07
EDUCATION & HEALTH SERVICES………………………...........................21,501 22,963 22,995 23,497 23,665 25,297 26,373 26,477 27,224 27,967 28,398 29,134 Percentage change………………………………………………………………………..3.50 6.80 0.14 2.18 0.71 6.90 4.25 0.39 2.82 2.73 1.54 2.59
LEISURE & HOSPITALITY…………………………………….....................11,047 11,341 11,330 11,608 11,606 11,020 10,285 10,541 10,936 11,292 11,260 11,602 Percentage change………………………………………………………………………..3.80 2.66 -0.10 2.45 -0.02 -5.05 -6.67 2.49 3.75 3.26 -0.28 3.04
OTHER SERVICES…………………………………………............................7,366 7,526 7,496 7,544 7,201 6,860 6,524 6,479 6,529 6,771 6,608 6,543 Percentage change………………………………………………………………………..-2.96 2.17 -0.40 0.64 -4.55 -4.74 -4.90 -0.69 0.77 3.71 -2.41 -0.99
GOVERNMENT………………………………………………..............................30,991 31,023 32,163 32,082 30,235 32,123 32,417 30,570 31,473 32,517 32,264 32,279 Percentage change………………………………………………………………………..-3.17 0.10 3.67 -0.25 -5.76 6.24 0.92 -5.70 2.95 3.32 -0.78 0.05
FEDERAL.............................................……………………………………..9,579 9,245 8,507 8,496 8,457 7,859 7,790 7,738 7,647 7,573 7,876 7,722 Percentage change………………………………………………………………………..-1.32 -3.49 -7.98 -0.13 -0.46 -7.07 -0.88 -0.67 -1.18 -0.97 4.00 -1.95
STATE & LOCAL…………………………………………........................21,412 21,778 23,656 23,586 21,778 24,264 24,627 22,832 23,826 24,944 24,388 24,556 Percentage change………………………………………………………………………..-3.98 1.71 8.62 -0.30 -7.67 11.42 1.50 -7.29 4.35 4.69 -2.23 0.69
Center for Business and Economic Research, University of Tennessee Tennessee Econometric Model
Table 13: Tennessee Gross Domestic Product by Sector (millions of 2009 dollars)
2003 2004 2005 2006 2007 2008 2009 2010 2011 2012 2013 2014GROSS DOMESTIC PRODUCT..........................................................................240,376 250,288 252,717 258,027 255,313 257,567 247,316 251,094 258,257 266,947 268,707 274,962 Percentage change………………………………………………………………………..2.34 4.12 0.97 2.10 -1.05 0.88 -3.98 1.53 2.85 3.36 0.66 2.33
NATURAL RESOURCES & MINING......................................................................................................2,409 2,449 2,553 2,697 2,034 2,333 2,676 2,575 2,451 2,313 2,838 3,033 Percentage change………………………………………………………………………..9.00 1.66 4.25 5.64 -24.58 14.70 14.70 -3.77 -4.82 -5.63 22.70 6.88
CONSTRUCTION................................................................................11,484 11,434 11,319 11,407 11,112 10,171 9,066 8,995 9,157 9,525 9,297 9,461 Percentage change………………………………………………………………………..-1.50 -0.44 -1.01 0.78 -2.59 -8.47 -10.86 -0.78 1.80 4.02 -2.39 1.77
MANUFACTURING.............................................................................39,647 44,681 43,954 45,674 43,772 42,827 38,639 39,488 41,425 44,136 44,914 46,110 Percentage change………………………………………………………………………..3.78 12.70 -1.63 3.91 -4.16 -2.16 -9.78 2.20 4.91 6.54 1.76 2.66
DURABLE GOODS........................................................................22,702 25,103 26,116 27,090 24,479 24,898 20,627 20,498 23,023 25,302 25,593 26,450 Percentage change………………………………………………………………………..10.88 10.58 4.04 3.73 -9.64 1.71 -17.15 -0.63 12.32 9.90 1.15 3.35
WOOD PRODUCTS………………………………………….............622 655 705 730 814 809 603 611 663 660 560 569 Percentage change………………………………………………………………………..-11.27 5.31 7.63 3.55 11.51 -0.61 -25.46 1.33 8.51 -0.45 -15.15 1.59
NONMETALLIC MINERAL PRODUCTS……………………………..1,547 1,675 1,497 1,335 1,332 1,112 875 959 1,068 1,089 1,030 1,033 Percentage change………………………………………………………………………..14.09 8.27 -10.63 -10.82 -0.22 -16.52 -21.31 9.60 11.37 1.97 -5.42 0.31
PRIMARY METALS………….…………………………….................990 1,134 1,121 1,075 853 848 767 875 993 1,159 1,219 1,228 Percentage change………………………………………………………………………..-19.90 14.55 -1.15 -4.10 -20.65 -0.59 -9.55 14.08 13.49 16.72 5.18 0.73
FABRICATED METAL PRODUCTS…………………..3,965 4,477 4,294 4,601 4,483 3,899 3,527 3,751 3,625 3,710 3,478 3,542 Percentage change………………………………………………………………………..7.37 12.91 -4.09 7.15 -2.56 -13.03 -9.54 6.35 -3.36 2.34 -6.25 1.84
MACHINERY…………………………………………………………3,467 3,299 3,797 3,534 3,064 3,614 2,761 2,598 2,802 2,553 3,010 3,060 Percentage change………………………………………………………………………..6.02 -4.85 15.10 -6.93 -13.30 17.95 -23.60 -5.90 7.85 -8.89 17.90 1.67
COMPUTER & ELECTRONIC PRODUCTS……………2252 2868 2561 2302 2752 3897 4072 1210 1176 1278 1,385 1,455 Percentage change………………………………………………………………………..95.15 27.35 -10.70 -10.11 19.55 41.61 4.49 -70.28 -2.81 8.67 8.37 5.07
ELECTRICAL EQUIPMENT, APPLIANCES& COMPONENTS………….………………… 2,590 2,583 2,828 3,090 2,487 3,088 2,909 2,536 2,696 3,484 3,070 3,139
Percentage change………………………………………………………………………..8.87 -0.27 9.49 9.26 -19.51 24.17 -5.80 -12.82 6.31 29.23 -11.88 2.24
MOTOR VEHICLES, BODIES & TRAILERS& PARTS………………………………… 4,127 5,018 5,856 7,077 5,312 4,398 1,969 4,792 6,821 8,297 8,994 9,524
Percentage change………………………………………………………………………..19.66 21.59 16.70 20.85 -24.94 -17.21 -55.23 143.37 42.34 21.64 8.40 5.89
OTHER TRANSPORTATION EQUIPMENT………………………………………………………………………………………………………………671 893 946 805 751 631 423 495 540 455 369 377 Percentage change………………………………………………………………………..-6.93 33.08 5.94 -14.90 -6.71 -15.98 -32.96 17.02 9.09 -15.74 -18.90 2.18
FURNITURE……………………………………………………………..1,028 990 905 849 826 651 471 423 404 426 456 463 Percentage change………………………………………………………………………..-7.80 -3.70 -8.59 -6.19 -2.71 -21.19 -27.65 -10.19 -4.49 5.45 7.04 1.63
MISCELLANEOUS DURABLE GOODS………………1,443 1,511 1,606 1,692 1,805 1,951 2,250 2,248 2,235 2,191 2,022 2,060 Percentage change………………………………………………………………………..3.07 4.71 6.29 5.35 6.68 8.09 15.33 -0.09 -0.58 -1.97 -7.71 1.86
NONDURABLE GOODS………………………………….16,945 19,578 17,838 18,584 19,293 17,929 18,012 18,990 18,402 18,834 19,321 19,660 Percentage change………………………………………………………………………..-4.43 15.54 -8.89 4.18 3.82 -7.07 0.46 5.43 -3.10 2.35 2.59 1.75
FOOD AND BEVERAGE & TOBACCO.........................5,388 6,014 5,938 6,585 7,369 6,779 6,912 7,120 6,761 6,769 6,501 6,652 Percentage change………………………………………………………………………..-3.42 11.62 -1.26 10.90 11.91 -8.01 1.96 3.01 -5.04 0.12 -3.96 2.32
Historical DataJanuary 2016

2016 TE
NN
ES
SE
E E
CO
NO
MIC
RE
PO
RT
| 8382 | 2016 T
EN
NE
SS
EE
EC
ON
OM
IC R
EP
OR
T
AP
PE
ND
IX B
| Historical D
ata
Table 14: Tennessee Gross Domestic Product by Sector (millions of current dollars)
2003 2004 2005 2006 2007 2008 2009 2010 2011 2012 2013 2014GROSS DOMESTIC PRODUCT..........................................................................206,562 220,573 228,724 239,395 243,368 250,402 247,316 253,252 264,022 279,654 286,908 298,623 Percentage change………………………………………………………………………..4.44 6.78 3.70 4.67 1.66 2.89 -1.23 2.40 4.25 5.92 2.59 4.08
NATURAL RESOURCES & MINING......................................................................................................1,796 2,098 2,150 2,369 2,097 2,590 2,676 2,894 3,297 3,135 3,811 3,855 Percentage change………………………………………………………………………..17.54 16.82 2.48 10.19 -11.48 23.51 3.32 8.15 13.93 -4.91 21.56 1.17
CONSTRUCTION................................................................................8,132 8,719 9,581 10,571 10,956 10,030 9,066 8,832 9,123 9,767 9,867 10,454 Percentage change………………………………………………………………………..3.11 7.22 9.89 10.33 3.64 -8.45 -9.61 -2.58 3.29 7.06 1.02 5.95
MANUFACTURING.............................................................................36,987 41,192 41,088 42,256 40,282 40,068 38,639 38,898 40,805 45,296 46,913 48,671 Percentage change………………………………………………………………………..5.11 11.37 -0.25 2.84 -4.67 -0.53 -3.57 0.67 4.90 11.01 3.57 3.75
DURABLE GOODS........................................................................22,764 25,106 25,800 26,011 23,410 23,536 20,627 19,878 21,865 24,753 25,418 26,555 Percentage change………………………………………………………………………..12.43 10.29 2.76 0.82 -10.00 0.54 -12.36 -3.63 10.00 13.21 2.69 4.48
WOOD PRODUCTS………………………………………….............735 893 942 907 887 834 603 631 626 664 654 674 Percentage change………………………………………………………………………..-6.37 21.50 5.49 -3.72 -2.21 -5.98 -27.70 4.64 -0.79 6.07 -1.51 3.11
NONMETALLIC MINERAL PRODUCTS……………………………..1,283 1,401 1,333 1,316 1,307 1,039 875 929 999 1,060 1,055 1,080 Percentage change………………………………………………………………………..11.66 9.20 -4.85 -1.28 -0.68 -20.50 -15.78 6.17 7.53 6.11 -0.47 2.39
PRIMARY METALS………….…………………………….................892 1,305 1,433 1,672 1,401 1,410 767 1,105 1,437 1,484 1,376 1,357 Percentage change………………………………………………………………………..-21.13 46.30 9.81 16.68 -16.21 0.64 -45.60 44.07 30.05 3.27 -7.28 -1.35
FABRICATED METAL PRODUCTS…………………………3,016 3,462 3,474 3,706 3,696 3,356 3,527 3,491 3,361 3,623 3,503 3,652 Percentage change………………………………………………………………………..5.71 14.79 0.35 6.68 -0.27 -9.20 5.10 -1.02 -3.72 7.80 -3.31 4.26
MACHINERY………………………………………….………………………3,107 2,857 3,359 3,116 2,746 3,234 2,761 2,483 2,651 2,530 3,121 3,225 Percentage change………………………………………………………………………..5.29 -8.05 17.57 -7.23 -11.87 17.77 -14.63 -10.07 6.77 -4.56 23.36 3.32
COMPUTER & ELECTRONIC PRODUCTS…………… 3,655 4,245 3,515 2,866 3,086 4,010 4,072 1,178 1,105 1,187 1,297 1,325 Percentage change………………………………………………………………………..75.13 16.14 -17.20 -18.46 7.68 29.94 1.55 -71.07 -6.20 7.42 9.27 2.14
ELECTRICAL EQUIPMENT, APPLIANCES & COMPONENTS........................................................ 2,169 2,118 2,358 2,636 2,211 2,829 2,909 2,470 2,593 3,558 3,203 3,343
Percentage change………………………………………………………………………..5.70 -2.35 11.33 11.79 -16.12 27.95 2.83 -15.09 4.98 37.22 -9.98 4.36
MOTOR VEHICLES, BODIES & TRAILERS & PARTS....................................................................................................................................4,983 5,734 6,188 6,673 4,877 3,775 1,969 4,463 5,945 7,541 8,264 8,850
Percentage change………………………………………………………………………..16.86 15.07 7.92 7.84 -26.91 -22.60 -47.84 126.66 33.21 26.85 9.59 7.09
OTHER TRANSPORTATION EQUIPMENT………………………………………………………………………………………………………………581 790 862 754 709 596 423 494 545 470 392 410 Percentage change………………………………………………………………………..-3.17 35.97 9.11 -12.53 -5.97 -15.94 -29.03 16.78 10.32 -13.76 -16.60 4.56
FURNITURE……………………………………………………………………895 818 773 729 734 578 471 405 386 423 453 468 Percentage change………………………………………………………………………..-8.30 -8.60 -5.50 -5.69 0.69 -21.25 -18.51 -14.01 -4.69 9.59 7.09 3.23
MISCELLANEOUS DURABLE GOODS……………… 1,448 1,483 1,563 1,636 1,756 1,875 2,250 2,229 2,217 2,213 2,100 2,172 Percentage change………………………………………………………………………..3.50 2.42 5.39 4.67 7.33 6.78 20.00 -0.93 -0.54 -0.18 -5.11 3.44
NONDURABLE GOODS…………………………...………………….14,223 16,086 15,288 16,245 16,872 16,532 18,012 19,020 18,940 20,543 21,495 22,116 Percentage change………………………………………………………………………..-4.82 13.10 -4.96 6.26 3.86 -2.02 8.95 5.60 -0.42 8.46 4.63 2.89
FOOD AND BEVERAGE & TOBACCO......................... 4,642 5,010 5,036 5,442 6,060 6,052 6,912 7,010 6,503 7,019 6,932 7,263 Percentage change………………………………………………………………………..-4.80 7.93 0.52 8.06 11.36 -0.13 14.21 1.42 -7.23 7.93 -1.24 4.78
Historical Data
January 2016
Table 14: Tennessee Average Annual Wage and Salary Rate by Sector, Seasonally Adjusted (current dollars)
2015:2 2015:3 2015:4 2016:1 2016:2 2016:3 2016:4 2017:1 2017:2 2017:3 2017:4 2018:1 2014 2015 2016 2017
TOTAL NONFARM……………………………………………….. 47346 47481 47891 48241 48586 48925 49266 49616 49956 50303 50649 50984 45782 47219 48755 50131% Chg Prev Qtr SAAR………..…………………………… 10.68 1.14 3.50 2.96 2.89 2.82 2.82 2.87 2.77 2.81 2.78 2.67 2.62 3.14 3.25 2.82% Chg Same Qtr Last Yr……………………………….. 3.76 3.73 3.44 4.51 2.62 3.04 2.87 2.85 2.82 2.82 2.81 2.76 2.62 3.14 3.25 2.82
NATURAL RESOURCES, MINING & CONSTRUCTION…… 54764 56036 56338 56717 57094 57489 57866 58296 58734 59169 59609 60009 51513 54695 57291 58952% Chg Prev Qtr SAAR………..…………………………… 26.46 9.62 2.17 2.72 2.69 2.79 2.65 3.01 3.04 2.99 3.01 2.71 4.71 6.18 4.75 2.90% Chg Same Qtr Last Yr……………………………….. 6.18 8.25 8.61 9.83 4.26 2.59 2.71 2.78 2.87 2.92 3.01 2.94 4.71 6.18 4.75 2.90
MANUFACTURING…………………………………………… 57619 58423 59116 59605 60062 60584 61081 61537 61954 62435 62929 63334 56302 57400 60333 62214% Chg Prev Qtr SAAR………..…………………………… 25.45 5.70 4.83 3.35 3.10 3.52 3.32 3.02 2.74 3.15 3.20 2.60 2.85 1.95 5.11 3.12% Chg Same Qtr Last Yr……………………………….. 2.58 4.07 3.24 9.48 4.24 3.70 3.32 3.24 3.15 3.06 3.03 2.92 2.85 1.95 5.11 3.12
DURABLE GOODS……………………………………...... 55869 56305 56988 57331 57693 58176 58650 59072 59451 59941 60460 60849 55092 55627 57962 59731% Chg Prev Qtr SAAR………..…………………………… 20.29 3.16 4.94 2.43 2.55 3.39 3.30 2.91 2.59 3.34 3.51 2.60 3.45 0.97 4.20 3.05% Chg Same Qtr Last Yr……………………………….. 1.39 2.50 1.28 7.47 3.26 3.32 2.92 3.04 3.05 3.03 3.09 3.01 3.45 0.97 4.20 3.05
NONDURABLE GOODS…………………………….. 60716 62180 62910 63681 64330 64949 65517 66055 66566 67057 67531 67993 58379 60542 64619 66803% Chg Prev Qtr SAAR………..…………………………… 34.67 10.00 4.78 4.99 4.14 3.91 3.54 3.33 3.13 2.98 2.86 2.76 2.03 3.71 6.73 3.38% Chg Same Qtr Last Yr……………………………….. 4.70 6.82 6.65 12.98 5.95 4.45 4.14 3.73 3.48 3.24 3.07 2.93 2.03 3.71 6.73 3.38
TRADE, TRANSPORTATION, UTILITIES…………. 42794 42887 43218 43594 43970 44311 44670 45047 45414 45778 46130 46497 42242 42707 44136 45592% Chg Prev Qtr SAAR………..…………………………… 8.51 0.87 3.12 3.53 3.50 3.13 3.28 3.42 3.30 3.24 3.11 3.22 2.75 1.10 3.35 3.30% Chg Same Qtr Last Yr……………………………….. 2.84 2.02 -0.79 3.97 2.75 3.32 3.36 3.33 3.28 3.31 3.27 3.22 2.75 1.10 3.35 3.30
WHOLESALE TRADE……………………………………. 65438 65107 65624 66259 66802 67371 67904 68436 68952 69463 69949 70508 64537 64934 67084 69200% Chg Prev Qtr SAAR………..…………………………… 12.31 -2.00 3.21 3.93 3.32 3.45 3.20 3.17 3.05 3.00 2.83 3.23 3.97 0.61 3.31 3.15% Chg Same Qtr Last Yr……………………………….. 2.85 0.78 -0.50 4.24 2.09 3.48 3.47 3.28 3.22 3.10 3.01 3.03 3.97 0.61 3.31 3.15
RETAIL TRADE……………………………………………. 29138 29534 29748 29973 30226 30443 30692 30946 31202 31466 31700 31933 28895 29193 30333 31329% Chg Prev Qtr SAAR………..…………………………… 11.59 5.56 2.93 3.05 3.42 2.90 3.32 3.35 3.35 3.43 3.01 2.97 2.80 1.03 3.91 3.28% Chg Same Qtr Last Yr……………………………….. 2.77 3.31 -1.54 5.72 3.73 3.07 3.17 3.25 3.23 3.36 3.28 3.19 2.80 1.03 3.91 3.28
TRANSPORTATION & UTILITIES……………………………53522 53048 53448 53897 54358 54738 55162 55636 56083 56519 56977 57407 52602 53300 54539 56304% Chg Prev Qtr SAAR………..…………………………… 2.58 -3.49 3.05 3.40 3.47 2.82 3.14 3.48 3.25 3.15 3.28 3.05 1.71 1.33 2.32 3.24% Chg Same Qtr Last Yr……………………………….. 2.70 1.23 -0.46 1.34 1.56 3.18 3.21 3.23 3.17 3.25 3.29 3.18 1.71 1.33 2.32 3.24
INFORMATION…………………………………………………… 62396 63946 64536 65034 65505 65925 66370 66806 67331 67866 68396 68793 60999 63239 65708 67600% Chg Prev Qtr SAAR………..…………………………… 2.06 10.31 3.74 3.12 2.93 2.59 2.73 2.65 3.18 3.22 3.16 2.34 4.85 3.67 3.90 2.88% Chg Same Qtr Last Yr……………………………….. 0.94 3.55 10.10 4.76 4.98 3.09 2.84 2.72 2.79 2.94 3.05 2.97 4.85 3.67 3.90 2.88
FINANCIAL ACTIVITIES…………………………………..... 70683 71177 71949 72635 73243 73807 74348 74950 75522 76033 76539 77045 68979 70721 73508 75761% Chg Prev Qtr SAAR………..…………………………… 9.65 2.82 4.41 3.87 3.39 3.12 2.96 3.28 3.09 2.73 2.69 2.67 4.12 2.52 3.94 3.06% Chg Same Qtr Last Yr……………………………….. 3.31 3.87 2.68 5.16 3.62 3.70 3.33 3.19 3.11 3.01 2.95 2.79 4.12 2.52 3.94 3.06
January 2016
History Forecast Data Annual
(CONTINUED ON NEXT PAGE)

2016 TE
NN
ES
SE
E E
CO
NO
MIC
RE
PO
RT
| 8382 | 2016 T
EN
NE
SS
EE
EC
ON
OM
IC R
EP
OR
T
Historical D
ata | AP
PE
ND
IX B
2003 2004 2005 2006 2007 2008 2009 2010 2011 2012 2013 2014 TEXTILE MILLS & TEXTILE PRODUCT MILLS..................................................................609 645 576 636 553 572 421 369 332 358 486 475 Percentage change………………………………………………………………………..-13.25 5.91 -10.70 10.42 -13.05 3.44 -26.40 -12.35 -10.03 7.83 35.75 -2.32
APPAREL & LEATHER PRODUCTS………………………………………………………………………..415 371 311 246 231 239 212 235 203 206 316 306 Percentage change………………………………………………………………………..-18.79 -10.60 -16.17 -20.90 -6.10 3.46 -11.30 10.85 -13.62 1.48 53.40 -3.06
PAPER………………………………………………………………………….....1,857 1,894 1,971 2,334 2,040 2,171 2,590 2,806 2,537 2,693 2,925 3,040 Percentage change………………………………………………………………………..-2.26 1.99 4.07 18.42 -12.60 6.42 19.30 8.34 -9.59 6.15 8.61 3.94
PRINTING & RELATED SUPPORT………………………………………………………………………..1,192 1,203 1,258 1,350 1,307 1,222 1,093 1,039 973 922 1,040 1,068 Percentage change………………………………………………………………………..6.33 0.92 4.57 7.31 -3.19 -6.50 -10.56 -4.94 -6.35 -5.24 12.80 2.67
CHEMICALS………………………………………………………………………..727 690 860 651 821 548 470 521 551 848 785 820 Percentage change………………………………………………………………………..38.48 -5.09 24.64 -24.30 26.11 -33.25 -14.23 10.85 5.76 53.90 -7.43 4.41
PLASTICS & RUBBER………………………………………………………………………..2,694 4,216 3,367 3,806 3,962 3,983 4,557 5,205 6,089 6,624 6,927 7,025 Percentage change………………………………………………………………………..-16.00 56.50 -20.14 13.04 4.10 0.53 14.41 14.22 16.98 8.79 4.57 1.41
MISCELLANEOUS NONDURABLE GOODS………………2,087 2,057 1,909 1,780 1,898 1,745 1,757 1,835 1,752 1,873 2,084 2,119 Percentage change………………………………………………………………………..-0.67 -1.44 -7.19 -6.76 6.63 -8.06 0.69 4.44 -4.52 6.91 11.27 1.69
TRADE, TRANSPORTATION, UTILITIES………….....................……..................……..................41,117 44,015 47,012 49,584 50,417 50,336 47,471 49,691 51,450 53,880 54,604 56,848 Percentage change………………………………………………………………………..6.09 7.05 6.81 5.47 1.68 -0.16 -5.69 4.68 3.54 4.72 1.34 4.11
WHOLESALE TRADE……………………………………......................13,433 14,777 15,722 16,806 17,620 18,063 16,467 17,137 17,679 19,024 19,551 20,575 Percentage change………………………………………………………………………..6.21 10.01 6.40 6.89 4.84 2.51 -8.84 4.07 3.16 7.61 2.77 5.24
RETAIL TRADE…………………………………………….........................16,634 17,306 18,478 19,034 19,342 18,647 18,229 18,950 19,436 20,249 20,108 20,732 Percentage change………………………………………………………………………..6.76 4.04 6.77 3.01 1.62 -3.59 -2.24 3.96 2.56 4.18 -0.70 3.10
TRANSPORTATION & UTILITIES…………………………………………….11,050 11,932 12,812 13,744 13,455 13,626 12,775 13,604 14,335 14,607 14,945 15,541 Percentage change………………………………………………………………………..4.95 7.98 7.38 7.27 -2.10 1.27 -6.25 6.49 5.37 1.90 2.31 3.99
INFORMATION……………………………………………………....................................6,812 7,357 7,722 8,220 8,614 8,801 8,330 8,464 8,273 8,317 8,568 8,817 Percentage change………………………………………………………………………..4.35 8.00 4.96 6.45 4.79 2.17 -5.35 1.61 -2.26 0.53 3.02 2.90
FINANCIAL ACTIVITIES…………………………………............................33,976 33,843 33,976 35,388 37,774 39,067 39,929 41,778 43,818 45,276 46,390 48,619 Percentage change………………………………………………………………………..3.04 -0.39 0.39 4.16 6.74 3.42 2.21 4.63 4.88 3.33 2.46 4.81
PROFESSIONAL & BUSINESS SERVICES………………………….................20,394 22,162 22,784 23,695 25,012 26,784 25,606 26,957 28,216 30,826 31,928 33,779 Percentage change………………………………………………………………………..5.33 8.67 2.81 4.00 5.56 7.08 -4.40 5.28 4.67 9.25 3.57 5.80
EDUCATION & HEALTH SERVICES………………………...........................17,900 19,716 20,348 21,316 22,356 24,393 26,373 27,077 28,225 29,538 30,334 31,611 Percentage change………………………………………………………………………..6.83 10.15 3.21 4.76 4.88 9.11 8.12 2.67 4.24 4.65 2.69 4.21
LEISURE & HOSPITALITY…………………………………….....................8,898 9,339 9,705 10,303 10,737 10,524 10,285 10,542 10,921 11,703 11,975 12,599 Percentage change………………………………………………………………………..5.34 4.96 3.92 6.16 4.21 -1.98 -2.27 2.50 3.60 7.16 2.32 5.21
OTHER SERVICES…………………………………………............................5,803 6,116 6,339 6,639 6,595 6,533 6,524 6,649 6,856 7,301 7,326 7,439 Percentage change………………………………………………………………………..-0.19 5.39 3.65 4.73 -0.66 -0.94 -0.14 1.92 3.11 6.49 0.34 1.54
GOVERNMENT………………………………………………..............................24,747 26,016 28,019 29,054 28,528 31,276 32,417 31,470 33,038 34,615 35,192 35,930 Percentage change………………………………………………………………………..0.86 5.13 7.70 3.69 -1.81 9.63 3.65 -2.92 4.98 4.77 1.67 2.10
FEDERAL.............................................……………………………………..7,857 7,956 7,638 7,862 8,117 7,714 7,790 8,028 8,124 8,051 8,564 8,537 Percentage change………………………………………………………………………..3.81 1.26 -3.99 2.93 3.24 -4.96 0.98 3.06 1.20 -0.90 6.38 -0.32
STATE & LOCAL…………………………………………........................16,890 18,060 20,381 21,192 20,411 23,562 24,627 23,442 24,914 26,564 26,628 27,394 Percentage change………………………………………………………………………..-0.46 6.93 12.85 3.98 -3.69 15.44 4.52 -4.81 6.28 6.62 0.24 2.882003 2004 2005 2006 2007 2008 2009 2010 2011 2012 2013 2014
Center for Business and Economic Research, University of Tennessee Tennessee Econometric Model
Table 14: Tennessee Gross Domestic Product by Sector (millions of current dollars)
2003 2004 2005 2006 2007 2008 2009 2010 2011 2012 2013 2014GROSS DOMESTIC PRODUCT..........................................................................206,562 220,573 228,724 239,395 243,368 250,402 247,316 253,252 264,022 279,654 286,908 298,623 Percentage change………………………………………………………………………..4.44 6.78 3.70 4.67 1.66 2.89 -1.23 2.40 4.25 5.92 2.59 4.08
NATURAL RESOURCES & MINING......................................................................................................1,796 2,098 2,150 2,369 2,097 2,590 2,676 2,894 3,297 3,135 3,811 3,855 Percentage change………………………………………………………………………..17.54 16.82 2.48 10.19 -11.48 23.51 3.32 8.15 13.93 -4.91 21.56 1.17
CONSTRUCTION................................................................................8,132 8,719 9,581 10,571 10,956 10,030 9,066 8,832 9,123 9,767 9,867 10,454 Percentage change………………………………………………………………………..3.11 7.22 9.89 10.33 3.64 -8.45 -9.61 -2.58 3.29 7.06 1.02 5.95
MANUFACTURING.............................................................................36,987 41,192 41,088 42,256 40,282 40,068 38,639 38,898 40,805 45,296 46,913 48,671 Percentage change………………………………………………………………………..5.11 11.37 -0.25 2.84 -4.67 -0.53 -3.57 0.67 4.90 11.01 3.57 3.75
DURABLE GOODS........................................................................22,764 25,106 25,800 26,011 23,410 23,536 20,627 19,878 21,865 24,753 25,418 26,555 Percentage change………………………………………………………………………..12.43 10.29 2.76 0.82 -10.00 0.54 -12.36 -3.63 10.00 13.21 2.69 4.48
WOOD PRODUCTS………………………………………….............735 893 942 907 887 834 603 631 626 664 654 674 Percentage change………………………………………………………………………..-6.37 21.50 5.49 -3.72 -2.21 -5.98 -27.70 4.64 -0.79 6.07 -1.51 3.11
NONMETALLIC MINERAL PRODUCTS……………………………..1,283 1,401 1,333 1,316 1,307 1,039 875 929 999 1,060 1,055 1,080 Percentage change………………………………………………………………………..11.66 9.20 -4.85 -1.28 -0.68 -20.50 -15.78 6.17 7.53 6.11 -0.47 2.39
PRIMARY METALS………….…………………………….................892 1,305 1,433 1,672 1,401 1,410 767 1,105 1,437 1,484 1,376 1,357 Percentage change………………………………………………………………………..-21.13 46.30 9.81 16.68 -16.21 0.64 -45.60 44.07 30.05 3.27 -7.28 -1.35
FABRICATED METAL PRODUCTS…………………………3,016 3,462 3,474 3,706 3,696 3,356 3,527 3,491 3,361 3,623 3,503 3,652 Percentage change………………………………………………………………………..5.71 14.79 0.35 6.68 -0.27 -9.20 5.10 -1.02 -3.72 7.80 -3.31 4.26
MACHINERY………………………………………….………………………3,107 2,857 3,359 3,116 2,746 3,234 2,761 2,483 2,651 2,530 3,121 3,225 Percentage change………………………………………………………………………..5.29 -8.05 17.57 -7.23 -11.87 17.77 -14.63 -10.07 6.77 -4.56 23.36 3.32
COMPUTER & ELECTRONIC PRODUCTS…………… 3,655 4,245 3,515 2,866 3,086 4,010 4,072 1,178 1,105 1,187 1,297 1,325 Percentage change………………………………………………………………………..75.13 16.14 -17.20 -18.46 7.68 29.94 1.55 -71.07 -6.20 7.42 9.27 2.14
ELECTRICAL EQUIPMENT, APPLIANCES & COMPONENTS........................................................ 2,169 2,118 2,358 2,636 2,211 2,829 2,909 2,470 2,593 3,558 3,203 3,343
Percentage change………………………………………………………………………..5.70 -2.35 11.33 11.79 -16.12 27.95 2.83 -15.09 4.98 37.22 -9.98 4.36
MOTOR VEHICLES, BODIES & TRAILERS & PARTS....................................................................................................................................4,983 5,734 6,188 6,673 4,877 3,775 1,969 4,463 5,945 7,541 8,264 8,850
Percentage change………………………………………………………………………..16.86 15.07 7.92 7.84 -26.91 -22.60 -47.84 126.66 33.21 26.85 9.59 7.09
OTHER TRANSPORTATION EQUIPMENT………………………………………………………………………………………………………………581 790 862 754 709 596 423 494 545 470 392 410 Percentage change………………………………………………………………………..-3.17 35.97 9.11 -12.53 -5.97 -15.94 -29.03 16.78 10.32 -13.76 -16.60 4.56
FURNITURE……………………………………………………………………895 818 773 729 734 578 471 405 386 423 453 468 Percentage change………………………………………………………………………..-8.30 -8.60 -5.50 -5.69 0.69 -21.25 -18.51 -14.01 -4.69 9.59 7.09 3.23
MISCELLANEOUS DURABLE GOODS……………… 1,448 1,483 1,563 1,636 1,756 1,875 2,250 2,229 2,217 2,213 2,100 2,172 Percentage change………………………………………………………………………..3.50 2.42 5.39 4.67 7.33 6.78 20.00 -0.93 -0.54 -0.18 -5.11 3.44
NONDURABLE GOODS…………………………...………………….14,223 16,086 15,288 16,245 16,872 16,532 18,012 19,020 18,940 20,543 21,495 22,116 Percentage change………………………………………………………………………..-4.82 13.10 -4.96 6.26 3.86 -2.02 8.95 5.60 -0.42 8.46 4.63 2.89
FOOD AND BEVERAGE & TOBACCO......................... 4,642 5,010 5,036 5,442 6,060 6,052 6,912 7,010 6,503 7,019 6,932 7,263 Percentage change………………………………………………………………………..-4.80 7.93 0.52 8.06 11.36 -0.13 14.21 1.42 -7.23 7.93 -1.24 4.78
Historical Data
January 2016

AN ECONOMIC REPORT TO THE GOVERNOR
OF THE STATE OF TENNESSEE