an edge-on translucent dust disk around the nearest agb
TRANSCRIPT

HAL Id: hal-00977699https://hal.archives-ouvertes.fr/hal-00977699
Submitted on 11 Apr 2014
HAL is a multi-disciplinary open accessarchive for the deposit and dissemination of sci-entific research documents, whether they are pub-lished or not. The documents may come fromteaching and research institutions in France orabroad, or from public or private research centers.
L’archive ouverte pluridisciplinaire HAL, estdestinée au dépôt et à la diffusion de documentsscientifiques de niveau recherche, publiés ou non,émanant des établissements d’enseignement et derecherche français ou étrangers, des laboratoirespublics ou privés.
An edge-on translucent dust disk around the nearestAGB star L2 Puppis - VLT/NACO spectro-imagingfrom 1.04 to 4.05 microns and VLTI interferometry
Pierre Kervella, Miguel Montargès, Stephen Ridgway, Guy Perrin, OlivierChesneau, Sylvestre Lacour, Andrea Chiavassa, Xavier Haubois, Alexandre
Gallenne
To cite this version:Pierre Kervella, Miguel Montargès, Stephen Ridgway, Guy Perrin, Olivier Chesneau, et al.. An edge-on translucent dust disk around the nearest AGB star L2 Puppis - VLT/NACO spectro-imaging from1.04 to 4.05 microns and VLTI interferometry. Astronomy and Astrophysics - A&A, EDP Sciences,2014, 564, pp.A88. �10.1051/0004-6361/201323273�. �hal-00977699�

Astronomy & Astrophysics manuscript no. aa23273-13-2 c©ESO 2014April 11, 2014
An edge-on translucent dust disk around the nearest AGB star,
L2 Puppis⋆
VLT/NACO spectro-imaging from 1.04 to 4.05µm and VLTI interferometry
P. Kervella1, M. Montargès1, S. T. Ridgway2, G. Perrin1, O. Chesneau3, S. Lacour1, A. Chiavassa3, X. Haubois1, andA. Gallenne4
1 LESIA, Observatoire de Paris, CNRS UMR 8109, UPMC, Université Paris Diderot, 5 place Jules Janssen, F-92195 Meudon, France2 National Optical Astronomy Observatories, 950 North Cherry Avenue, Tucson, AZ 85719, USA3 Laboratoire Lagrange, UMR 7293, Université de Nice-Sophia Antipolis, CNRS, Observatoire de la Côte d’Azur, Bd de
l’Observatoire, B.P. 4229, F-06304 Nice cedex 4, France4 Universidad de Concepción, Departamento de Astronomía, Casilla 160-C, Concepción, Chile
Received 18 December 2013; Accepted 4 March 2014
ABSTRACT
As the nearest known AGB star (d = 64 pc) and one of the brightest (mK ≈ −2), L2 Pup is a particularly interesting benchmark objectto monitor the final stages of stellar evolution. We report new serendipitous imaging observations of this star with the VLT/NACOadaptive optics system in twelve narrow-band filters covering the 1.0 − 4.0 µm wavelength range. These diffraction-limited imagesreveal an extended circumstellar dust lane in front of the star that exhibits a high opacity in the J band and becomes translucent inthe H and K bands. In the L band, extended thermal emission from the dust is detected. We reproduced these observations usingMonte Carlo radiative transfer modeling of a dust disk with the RADMC-3D code. We also present new interferometric observationswith the VLTI/VINCI and MIDI instruments. We measured in the K band an upper limit to the limb-darkened angular diameter ofθLD = 17.9 ± 1.6 mas, converting to a maximum linear radius of R = 123 ± 14 R⊙. Considering the geometry of the extended Kband emission in the NACO images, this upper limit is probably close to the actual angular diameter of the star. The position ofL2 Pup in the Hertzsprung-Russell diagram indicates that this star has a mass of about 2 M⊙ and is probably experiencing an earlystage of the asymptotic giant branch. We did not detect any stellar companion of L2 Pup in our adaptive optics and interferometricobservations, and we attribute its apparent astrometric wobble in the Hipparcos data to variable lighting effects on its circumstellarmaterial. However, we do not exclude the presence of a binary companion, because the large loop structure extending to more than10 AU to the northeast of the disk in our L -band images may be the result of interaction between the stellar wind of L2 Pup and ahidden secondary object. The geometric configuration that we propose, with a large dust disk seen almost edge-on, appears particularlyfavorable to test and develop our understanding of the formation of bipolar nebulae.
Key words. Stars: individual: HD 56096; Stars: imaging; Stars: AGB and post-AGB; Stars: circumstellar matter; Stars: mass-loss;Techniques: high angular resolution
1. Introduction
Evolved stars are important contributors to the enrichment ofheavy elements in the interstellar medium, and more generallyto the chemical evolution of the Universe. L2 Puppis (HD 56096,HIP 34922, HR 2748) is an asymptotic giant branch (AGB)semiregular variable. Its variability was discovered by Gouldas early as 1872 (Cannon 1907). Its M5III spectral type corre-sponds to an approximate effective temperature of Teff = 3500 K,which is what we considered here. Its proximity (π = 15.61 ±0.99 mas, van Leeuwen 2007) makes it the closest AGB star andone of the brightest stars in the infrared sky. Goldin & Makarov(2007) identified a periodic shift in the Hipparcos astrometricposition of L2 Pup with a 141-day period and a semimajor axisof 9.5 mas. They attributed this displacement to the orbital re-flex motion of the AGB star due to an unresolved companion.
Send offprint requests to: P. Kervella⋆ Based on observations made with ESO telescopes at Paranal Ob-
servatory, under ESO programs 090.D-0144(A), 074.D-0198(C) and anunreferenced VLTI/VINCI program.
The corresponding orbital period is almost identical to the pho-tometric variation period (140.6 days) as listed in the GeneralCatalogue of Variable Stars (Samus et al. 2009). Bedding et al.(2002) explained the long-term (over decades) variability of thebrightness of L2 Pup as the consequence of the obscuration ofthe star by circumstellar dust. These authors also pointed out thatthe period of L2 Pup has been remarkably stable over 75 years ofphotometric observations, making it a semiregular variable of theSRa type (i.e. with a well-defined period), closely related to Mi-ras. Lebzelter et al. (2005) obtained six radial velocity measure-ments spread around the maximum and minimum light phases,and estimated a radial velocity amplitude of 12 km.s−1. The bina-rity hypothesis was discussed (and dismissed) by Jorissen et al.(2009), based in particular on geometrical arguments on the lin-ear size of the giant star. McIntosh & Indermuehle (2013) re-cently discovered a 139-day periodic velocity centroid variationfrom SiO maser emission. They concluded that this variabilitypoints at the presence of differential illumination, or an asym-metric distribution of the circumstellar material around L2 Pup.Alternatively, Gray et al. (2009) predicted that the centroid of
Article number, page 1 of 16
A&A proofs: manuscript no. aa23273-13-2
SiO emission would shift in velocity according to the stage inthe stellar cycle, as a consequence of the shock behavior and be-cause the SiO maser region is located in a compact region, withina few stellar radii of the central object. Ohnaka (2014) recentlyobserved L2 Pup in the thermal infrared domain (N band) usingthe high spectral resolution mode of VISIR, and concluded thatits spectrum cannot be reproduced satisfactorily using MARCSatmosphere models. However, this author considered a tempera-ture of 2800 K for the central star, which may be underestimated(see Sect. 2.4).
We present in Sect. 2 our new NACO, VINCI and MIDI ob-servations of L2 Pup, and in Sect. 3 the RADMC-3D radiativetransfer model we propose to reproduce these observations. Thismodel consists of a central star surrounded by an edge-on cir-cumstellar disk. Section 4 is dedicated to a discussion of theevolutionary status, mass loss geometry, and possible binarityof L2 Pup.
2. Observations and data processing
2.1. VLT/NACO imaging
2.1.1. Instrumental setup
We observed L2 Pup on the night of 21 March 2013 using theNasmyth Adaptive Optics System (Rousset et al. 2003) of theVery Large Telescope (VLT), coupled to the CONICA infraredcamera (Lenzen et al. 1998), which is abbreviated as NACO.As its name indicates, NACO is installed at the Nasmyth focusof the Unit Telescope 4 (Yepun), located on the eastern side ofthe VLT platform. NAOS is equipped with a tip-tilt mirror anda deformable mirror controlled by 185 actuators, as well as twowavefront sensors: one for visible light, and one for the infrareddomain. For our observations, we used the visible light wave-front sensor, as L2 Pup is bright in the R band (mR = 2.45; Ducati2002).
We employed 12 narrow-band filters1 spread over the in-frared JHKL bands, with central wavelengths of 1.04, 1.08,1.09, 1.24, 1.26, 1.28, 1.64, 1.75, 2.12, 2.17, 3.74, and 4.05 µm.For the JHK band filters (1.04 to 2.17 µm), we selected theS13 camera that provides the smallest available pixel scale of13.26 ± 0.03 mas/pixel (Masciadri et al. 2003; Neuhäuser et al.2008), giving a field of view of 13.6′′. In the L band (3.74 and4.05 µm), we used the L27 camera, which has a pixel scaleof 27.05 mas/pixel (Schödel et al. 2010) and a field of viewof 27.7′′. Because of the brightness of L2 Pup, we also usedneutral-density filters, labeled “ND2_short" for the wavelengthsbetween 1.04 and 2.17 µm and “ND2_long" for the 3.74 and4.05 µm filters. These two filters have respective transmissions ofabout 1.3% and 2%. We selected the small 64 pixel (JHK) or 120pixel (L) windows of the CONICA detector to obtain the high-est frame frequency. The detector integration time (DIT) was setto the minimum possible: DIT = 7.2 ms in the JHK bands, andDIT = 8.4 ms for the two L band filters, to freeze the residualatmospheric distortions of the images.
2.1.2. Raw data reduction
Following Kervella et al. (2009), we processed the raw imagecubes using a serendipitous imaging technique. The individualraw images were pre-processed (bias subtraction, flat-fielding,
1 http://www.eso.org/sci/facilities/paranal/
instruments/naco/
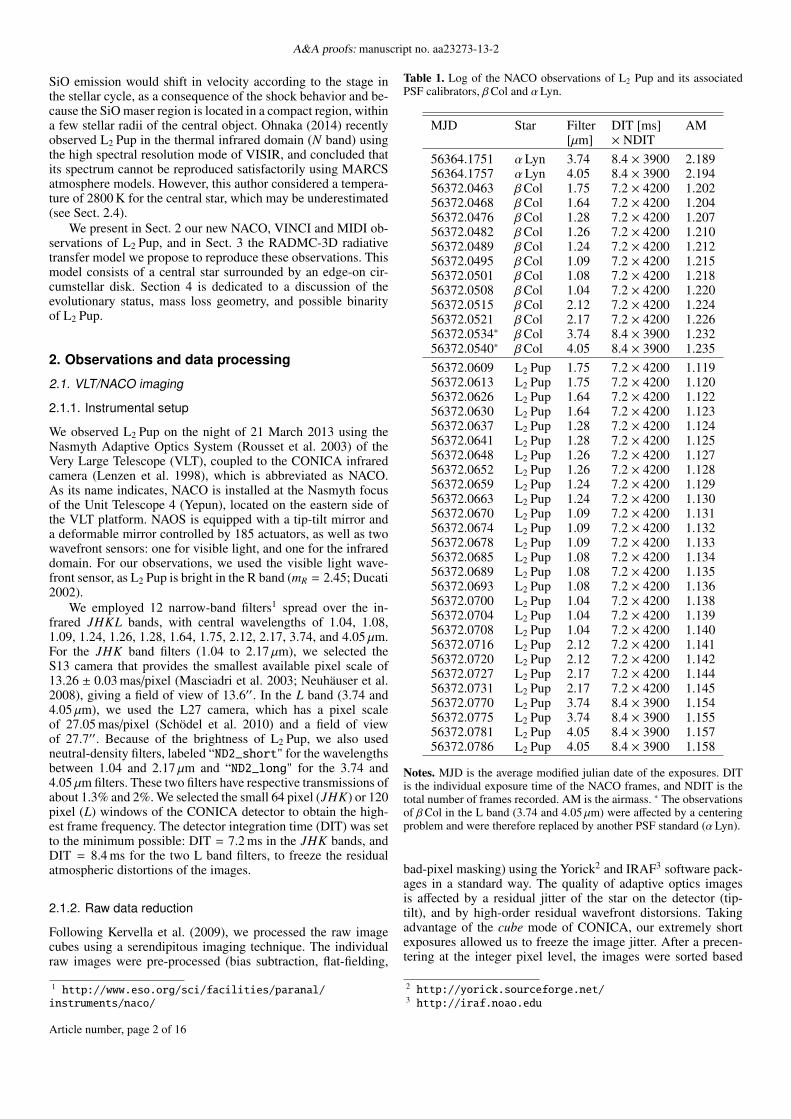
Table 1. Log of the NACO observations of L2 Pup and its associatedPSF calibrators, βCol and αLyn.
MJD Star Filter DIT [ms] AM[µm] × NDIT
56364.1751 αLyn 3.74 8.4 × 3900 2.18956364.1757 αLyn 4.05 8.4 × 3900 2.19456372.0463 βCol 1.75 7.2 × 4200 1.20256372.0468 βCol 1.64 7.2 × 4200 1.20456372.0476 βCol 1.28 7.2 × 4200 1.20756372.0482 βCol 1.26 7.2 × 4200 1.21056372.0489 βCol 1.24 7.2 × 4200 1.21256372.0495 βCol 1.09 7.2 × 4200 1.21556372.0501 βCol 1.08 7.2 × 4200 1.21856372.0508 βCol 1.04 7.2 × 4200 1.22056372.0515 βCol 2.12 7.2 × 4200 1.22456372.0521 βCol 2.17 7.2 × 4200 1.22656372.0534∗ βCol 3.74 8.4 × 3900 1.23256372.0540∗ βCol 4.05 8.4 × 3900 1.235
56372.0609 L2 Pup 1.75 7.2 × 4200 1.11956372.0613 L2 Pup 1.75 7.2 × 4200 1.12056372.0626 L2 Pup 1.64 7.2 × 4200 1.12256372.0630 L2 Pup 1.64 7.2 × 4200 1.12356372.0637 L2 Pup 1.28 7.2 × 4200 1.12456372.0641 L2 Pup 1.28 7.2 × 4200 1.12556372.0648 L2 Pup 1.26 7.2 × 4200 1.12756372.0652 L2 Pup 1.26 7.2 × 4200 1.12856372.0659 L2 Pup 1.24 7.2 × 4200 1.12956372.0663 L2 Pup 1.24 7.2 × 4200 1.13056372.0670 L2 Pup 1.09 7.2 × 4200 1.13156372.0674 L2 Pup 1.09 7.2 × 4200 1.13256372.0678 L2 Pup 1.09 7.2 × 4200 1.13356372.0685 L2 Pup 1.08 7.2 × 4200 1.13456372.0689 L2 Pup 1.08 7.2 × 4200 1.13556372.0693 L2 Pup 1.08 7.2 × 4200 1.13656372.0700 L2 Pup 1.04 7.2 × 4200 1.13856372.0704 L2 Pup 1.04 7.2 × 4200 1.13956372.0708 L2 Pup 1.04 7.2 × 4200 1.14056372.0716 L2 Pup 2.12 7.2 × 4200 1.14156372.0720 L2 Pup 2.12 7.2 × 4200 1.14256372.0727 L2 Pup 2.17 7.2 × 4200 1.14456372.0731 L2 Pup 2.17 7.2 × 4200 1.14556372.0770 L2 Pup 3.74 8.4 × 3900 1.15456372.0775 L2 Pup 3.74 8.4 × 3900 1.15556372.0781 L2 Pup 4.05 8.4 × 3900 1.15756372.0786 L2 Pup 4.05 8.4 × 3900 1.158
Notes. MJD is the average modified julian date of the exposures. DITis the individual exposure time of the NACO frames, and NDIT is thetotal number of frames recorded. AM is the airmass. ∗ The observationsof βCol in the L band (3.74 and 4.05 µm) were affected by a centeringproblem and were therefore replaced by another PSF standard (αLyn).
bad-pixel masking) using the Yorick2 and IRAF3 software pack-ages in a standard way. The quality of adaptive optics imagesis affected by a residual jitter of the star on the detector (tip-tilt), and by high-order residual wavefront distorsions. Takingadvantage of the cube mode of CONICA, our extremely shortexposures allowed us to freeze the image jitter. After a precen-tering at the integer pixel level, the images were sorted based
2 http://yorick.sourceforge.net/3 http://iraf.noao.edu
Article number, page 2 of 16

P. Kervella et al.: An edge-on translucent dust disk around the nearest AGB star, L2 Puppis
Fig. 1. Transmissions of the 12 CONICA narrow-band filters used forthe observations of L2 Pup (black profiles) and of the atmosphere (thingray curve, Lord 1992).
on their maximum intensity, used as a proxy of the Strehl ratio.The 50% best images of each cube were then resampled up by afactor 4 (in the JHK bands) or 2 (in the L band) using a cubicspline interpolation, and the star image was precisely centeredusing Gaussian fitting. The selected and centered image cubeswere eventually averaged to obtain the master images of eachstar used in the following analysis. A more stringent selection(e.g. considering only 10% of the frames) does not result in asignificantly better image quality, as most of the residual imagedegradation is caused by the tip-tilt errors and not by higher or-der pertubations.
2.1.3. Photometric calibration
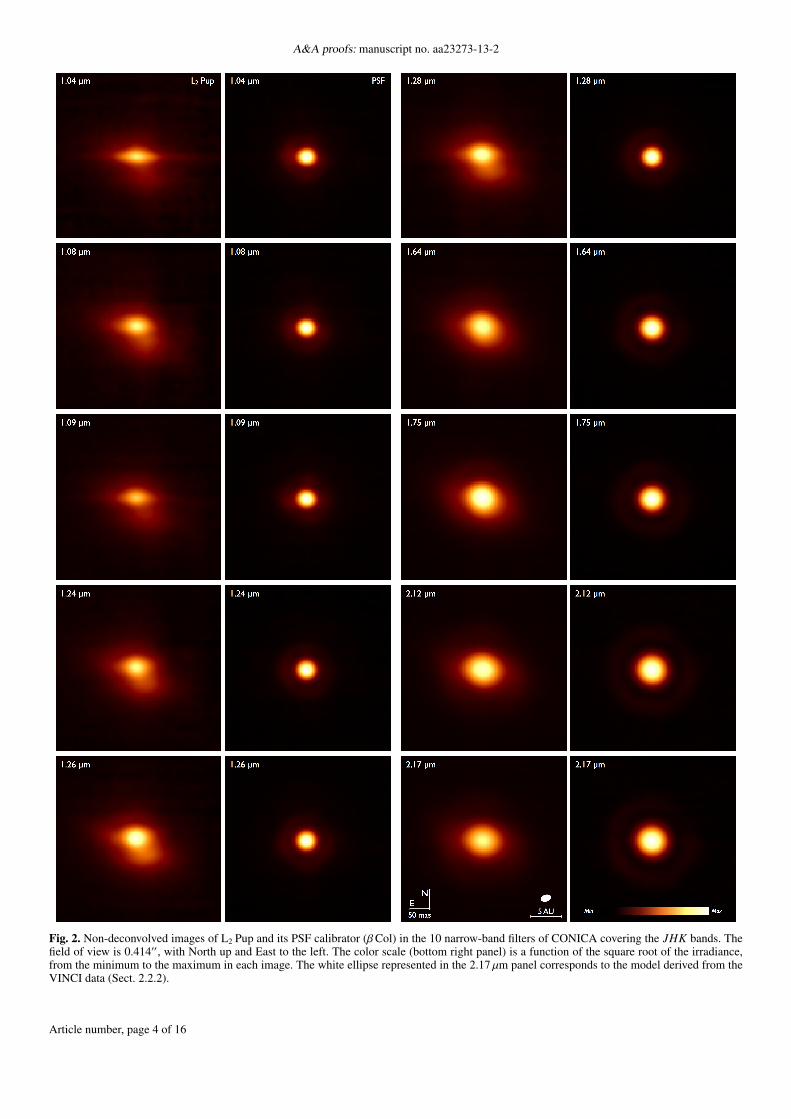
We photometrically normalized the images using our PSF refer-ence. We used the calibrators βCol (JHK bands) and αLyn (Lband), whose images are shown in Fig. 2 and 3. We retrieved thespectral energy distribution (SED) from the Castelli-Kurucz cat-alogue (Castelli & Kurucz 2004; Kurucz 2005) provided by theSTScI4. The physical parameters used to characterize the cali-brators are listed in Table 2. We tested the reliability of the SEDby comparing it with the existing broadband photometry mea-surements for both stars. Then we integrated the SED in eachobserved narrow-band using the NACO filter profiles presentedin Fig. 1. To calibrate photometrically the images of L2 Pup, wethen multiplied their pixel values by the integrated SED of thePSF calibrator in each filter band and normalized then by the in-tegrated flux measured on a disk of 33 mas in radius, thus avoid-ing a contamination by the adaptive optics residual halo. Theresulting photometry of L2 Pup in the 12 narrow band filters ofNACO is listed in Table 3.
Table 2. Physical parameters used to characterize the photometric/PSFcalibrators
Parameter βCol αLyn
θLD (mas) 3.99 ± 0.05 7.30 ± 0.08Teff (K) 4500 3750log(g) 2.0 0.0log(Fe/H) +0.5 −0.5
Notes. θLD is the limb-darkened angular diameter.
2.1.4. Image deconvolution
As discussed by Kervella et al. (2009), the improvement in Strehlratio from the serendipitous imaging approach compared with
4 http://www.stsci.edu/hst/observatory/cdbs/castelli_
kurucz_atlas.html
Table 3. Photometry of L2 Pup in the NACO narrow-band filters for theobserving epoch 2013.22.
Filter λ0 ∆λ Flux density[µm] [µm] [10−10 W/m2/µm]
NB1.04 1.040 0.015 7.15 ± 0.93NB1.08 1.083 0.015 7.75 ± 0.10NB1.09 1.094 0.015 6.46 ± 0.84NB1.24 1.237 0.015 7.52 ± 0.98NB1.26 1.257 0.014 8.74 ± 0.11NB1.28 1.282 0.014 8.19 ± 0.11NB1.64 1.644 0.018 7.42 ± 0.97NB1.75 1.748 0.026 7.69 ± 0.10NB2.12 2.122 0.022 7.20 ± 0.94NB2.17 2.166 0.023 6.42 ± 0.84NB3.74 3.74 0.02 4.73 ± 0.62NB4.05 4.05 0.02 5.13 ± 0.67
classical long exposures is particularly significant in the J -bandfilters. This technique allows us to retrieve details at the diffrac-tion limit of the telescope, and makes the deconvolution of theimages much more efficient.
We deconvolved the images of L2 Pup using the PSF images(Sect. 2.1.2) as the dirty beams and the Lucy-Richardson (L-R)algorithm implemented in the IRAF software package. The re-sulting average deconvolved images in the 12 narrow-band filtersare presented in Fig. 4, and a color composite image is presentedin Fig. 5. We stopped the L-R deconvolution after 80 iterations(uniformly for all wavelengths), as the images do not show asignificant evolution for additional processing steps.
Fig. 3. Non-deconvolved images of L2 Pup and its associated PSF(αLyn) in the two narrow-band filters of CONICA in the L band. Ori-entation, field of view and color scale are the same as in Fig. 2.
Article number, page 3 of 16
A&A proofs: manuscript no. aa23273-13-2
Fig. 2. Non-deconvolved images of L2 Pup and its PSF calibrator (βCol) in the 10 narrow-band filters of CONICA covering the JHK bands. Thefield of view is 0.414′′, with North up and East to the left. The color scale (bottom right panel) is a function of the square root of the irradiance,from the minimum to the maximum in each image. The white ellipse represented in the 2.17 µm panel corresponds to the model derived from theVINCI data (Sect. 2.2.2).
Article number, page 4 of 16

P. Kervella et al.: An edge-on translucent dust disk around the nearest AGB star, L2 Puppis
Fig. 4. Deconvolved images of L2 Pup using a uniform, 80-step Lucy deconvolution. Orientation, field of view and color scale are the same as inFig. 2. The white ellipse represented in the 2.17 µm panel corresponds to the star model derived from the VINCI data (Sect. 2.2.2).
5 AU
100 mas
Fig. 5. Color composite view of L2 Pup assembled from the 12 NACOnarrow-band images in the JHKL bands.
2.2. VLTI/VINCI interferometry
L2 Pup was observed on several occasions during the early com-missioning of the VLTI in late 2001, using the VLT INterferom-
eter Commissioning Instrument (VINCI, Kervella et al. 2004a)and the two VLTI 0.35 m test siderostats installed on the E0-G0 baseline (16 m ground length). We used a regular K -bandfilter (λ = 2.0 − 2.4 µm) and processed the data using the stan-dard VINCI data reduction software version 3.0. As VINCI isa single-mode instrument (i.e. it spatially filters the light beamsusing single-mode fibers), its field of view (FOV) is defined bya combination of the seeing spot and the acceptance functionof the input fibers. The latter is matched to the Airy pattern ofthe telescope, whose typical size is ≈ 1.4′′. For extended objectslarger than the Airy pattern of the telescopes, variable seeingconditions can result in a variable bias on the measured visi-bility (Guyon 2002). However, as shown in Sect. 2.1, most ofL2 Pup’s flux is coming from an area on the sky that is well con-tained in the 1.4′′ Airy pattern of the 0.35 m VLTI siderostats.The VINCI measurements are therefore not affected by this bias.L2 Pup’s instrumental visibilities were calibrated using Sirius(θUD K = 5.936± 0.016 mas; Kervella et al. 2003) and ǫ Lep (HD32887, θUD K = 5.91 ± 0.064 mas; Bordé et al. 2002).
2.2.1. Resolved flux debiasing
From the morphology of L2 Pup in our NACO images, it is clearthat a significant fraction of the flux collected by the VINCI in-
Article number, page 5 of 16

A&A proofs: manuscript no. aa23273-13-2
Table 4. Table of the VINCI observations of L2 Pup in the infrared Kband (effective wavelength λeff = 2.19 µm).
MJD B [m] PA [deg] V2
52195.318 15.18 39.89 0.1439 ± 0.006452197.277 14.67 27.74 0.1799 ± 0.009352197.319 15.28 41.92 0.1421 ± 0.008052200.292 15.00 35.87 0.1250 ± 0.002452200.338 15.63 49.93 0.0875 ± 0.001952200.376 15.96 60.52 0.0678 ± 0.001352201.281 14.88 33.11 0.1327 ± 0.002752201.316 15.39 44.40 0.0938 ± 0.001552201.356 15.84 55.81 0.0708 ± 0.001252202.280 14.90 33.46 0.1278 ± 0.006752202.326 15.56 48.17 0.0804 ± 0.004252202.377 15.99 62.23 0.0664 ± 0.004852203.278 14.91 33.75 0.1149 ± 0.005752203.343 15.78 53.81 0.0687 ± 0.003452203.375 15.99 62.33 0.0593 ± 0.003052210.343 15.93 58.98 0.0449 ± 0.002352218.360 15.98 69.02 0.0368 ± 0.000952218.363 15.96 69.76 0.0369 ± 0.001152218.367 15.95 70.62 0.0374 ± 0.0011
Notes. MJD is the average modified julian date of the exposures, B isthe projected baseline length in meters, PA is the position angle relativeto north (E=90◦) and V2 is the squared visibility of the fringes.
strument in the K band within its ≈ 1.4′′ field of view comesfrom spatially extended emission. Any flux contribution fromstructures larger than the resolving power of the interferome-ter will contribute essentially uncorrelated flux to the measure-ments. In other words, VINCI’s V2 values are displaced towardslower values by the contribution from the extended disk. To re-trieve the properties of the central object, we therefore have tocorrect for this effect.
Because we do not have interferometric measurements onshort baselines (0-15 m), we used the NACO images at 2.12 and2.17 µm (Fig. 4, within the VINCI wavelength range) to mea-sure the relative flux contribution that is unresolved by the UnitTelescope. The NACO images were obtained in 2013, while theVINCI observations were recorded in late 2001. According toFig. 2 in Bedding et al. (2002), L2 Pup was at this time in its cur-rent low photometric flux state. We interpolated the L-R decon-volved 2.12 and 2.17 µm images of L2 Pup over the central objectto remove its flux contribution. We used the deconvolved imagesbecause the L-R deconvolution algorithm presents the advantageof preserving the photometric flux. The result of this operation isshown in Fig. 6. We then estimated the unresolved flux fractionω = 1 − fresolved/ ftotal from the flux fresolved in the image of thedisk alone and the total flux in the original image ftotal. We ob-tained ω = 59.2% for the 2.17 µm image and ω = 62.9% for the2.12 µm band. We therefore considered a value of ω = 60 ± 5%to debias the VINCI visibilities using
V2debiased =
V2measured
ω2. (1)
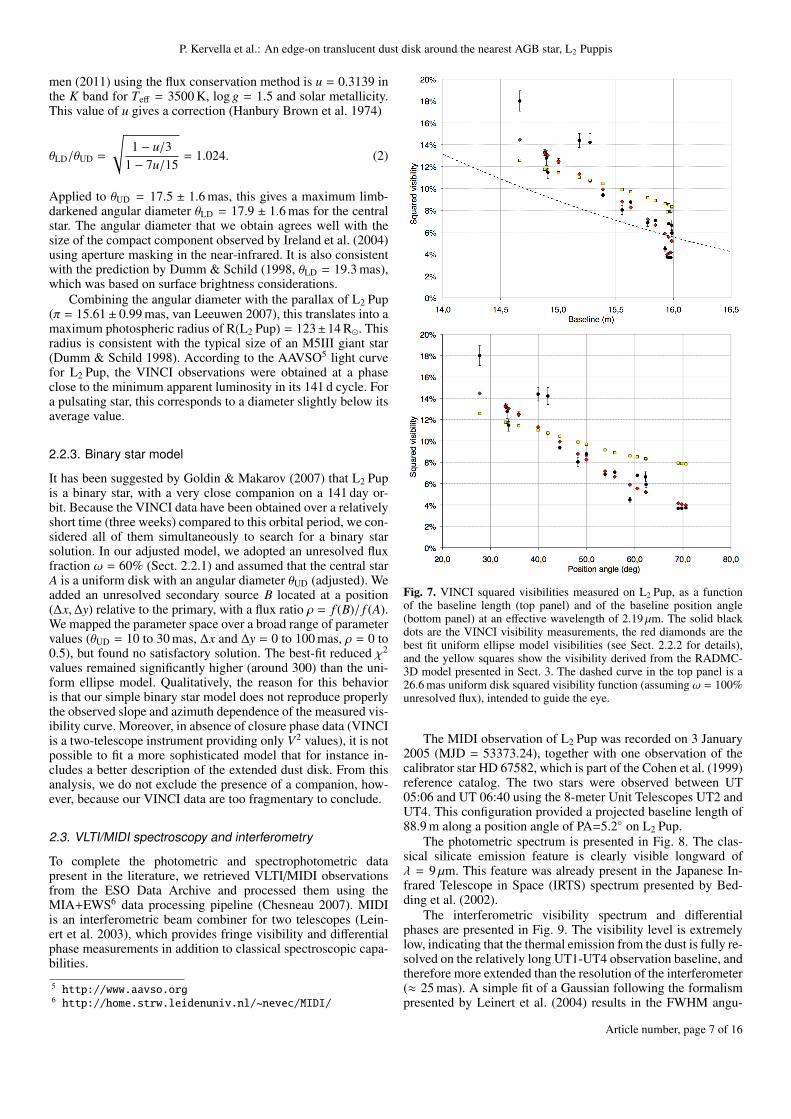
The VINCI squared visibility measurements are presented inFig. 7. As shown in the top panel, the distribution of the V2(B)measurement points does not follow the general trend expectedfor a circularly symmetric object. Using a simple uniform diskmodel with 100% unresolved flux fraction, we obtained a best-fituniform disk (UD) angular diameter θUD = 26.6 ± 1.5 mas with
Fig. 6. Deconvolved image of L2 Pup at 2.17 µm (left) and contributionfrom the disk alone (right). The field of view is 1.33′′.
a poor reduced χ2red ≈ 150. Considering ω = 60%, we obtained
θUD = 22.4 ± 2.5 mas with an even higher reduced χ2red ≈ 210.
This behavior is due to the fact that adding a resolved flux contri-bution to the model makes the slope of the visibility curve V(B)shallower, while the observations show that it is actually steeper.We therefore test hereafter two simple geometrical models tobetter reproduce the VINCI data: 1) a uniform ellipse model and2) a binary star model.
2.2.2. Uniform ellipse model
In addition to the fixed resolved flux contribution ω = 60 ± 5%,the adjusted model has three parameters: the uniform ellipsemajor-axis angular size θa, the minor-axis angular size θb , andthe position angle of the major axis αa (North=0◦, East=90◦).The formalism used to fit the data is presented in detail inKervella & Domiciano de Souza (2006).
The best-fit parameters are θa = 26.9 ± 1.6 mas, θb = 17.5 ±1.6 mas, and αa = 106± 4◦. The minimum reduced χ2
red of the fitis 18, indicating that the dispersion of the measurements is largerthan our simple ellipse model predicts. We therefore chose a con-servative approach to estimate the error bars by solving the equa-tion χ2
red(a, b, α) = 2 χ2red min. The impact of the 5% error bar on
ω dominates the derived parameter uncertainties. The uniformellipse model is certainly not physically realistic, but reasonableconsidering the limited available VINCI measurements.
As shown in the NACO images in the K band (Fig. 4) andin Fig. 6, the contribution of the circumstellar material of L2 Pupis important in the K band. The distribution of the emitting ma-terial appears elongated approximately along an east-west axis,consistent with the position angle αa of the major axis of the ad-justed ellipse. We took into account the resolved flux measuredwith NACO, including the part of the circumstellar material thatis well inside the interferometric FOV of VINCI. But this contri-bution is extended spatially along an east-west axis, and it willdecrease the measured visibilities (compared with a star withoutenvelope) when the projected baseline azimuth is close to thisdirection. The measured east-west elongation is therefore prob-ably caused by the circumstellar material and not by a physicalelongation of the star itself.
We interpret the minor axis θb = 17.5 ± 1.6 mas as an up-per limit on the uniform disk angular diameter of the centralstar in the K band. Considering that we do not detect a signifi-cant extension of L2 Pup’s envelope in the K band NACO imagesalong the orthogonal direction (i.e. approximately North-South,see Fig. 4), this upper limit is most probably close to the actualangular size of the star within the stated uncertainty domain. Thelinear limb-darkening coefficient computed by Claret & Bloe-
Article number, page 6 of 16
P. Kervella et al.: An edge-on translucent dust disk around the nearest AGB star, L2 Puppis
men (2011) using the flux conservation method is u = 0.3139 inthe K band for Teff = 3500 K, log g = 1.5 and solar metallicity.This value of u gives a correction (Hanbury Brown et al. 1974)
θLD/θUD =
√
1 − u/31 − 7u/15
= 1.024. (2)
Applied to θUD = 17.5 ± 1.6 mas, this gives a maximum limb-darkened angular diameter θLD = 17.9 ± 1.6 mas for the centralstar. The angular diameter that we obtain agrees well with thesize of the compact component observed by Ireland et al. (2004)using aperture masking in the near-infrared. It is also consistentwith the prediction by Dumm & Schild (1998, θLD = 19.3 mas),which was based on surface brightness considerations.
Combining the angular diameter with the parallax of L2 Pup(π = 15.61± 0.99 mas, van Leeuwen 2007), this translates into amaximum photospheric radius of R(L2 Pup) = 123±14 R⊙. Thisradius is consistent with the typical size of an M5III giant star(Dumm & Schild 1998). According to the AAVSO5 light curvefor L2 Pup, the VINCI observations were obtained at a phaseclose to the minimum apparent luminosity in its 141 d cycle. Fora pulsating star, this corresponds to a diameter slightly below itsaverage value.
2.2.3. Binary star model
It has been suggested by Goldin & Makarov (2007) that L2 Pupis a binary star, with a very close companion on a 141 day or-bit. Because the VINCI data have been obtained over a relativelyshort time (three weeks) compared to this orbital period, we con-sidered all of them simultaneously to search for a binary starsolution. In our adjusted model, we adopted an unresolved fluxfraction ω = 60% (Sect. 2.2.1) and assumed that the central starA is a uniform disk with an angular diameter θUD (adjusted). Weadded an unresolved secondary source B located at a position(∆x,∆y) relative to the primary, with a flux ratio ρ = f (B)/ f (A).We mapped the parameter space over a broad range of parametervalues (θUD = 10 to 30 mas, ∆x and ∆y = 0 to 100 mas, ρ = 0 to0.5), but found no satisfactory solution. The best-fit reduced χ2
values remained significantly higher (around 300) than the uni-form ellipse model. Qualitatively, the reason for this behavioris that our simple binary star model does not reproduce properlythe observed slope and azimuth dependence of the measured vis-ibility curve. Moreover, in absence of closure phase data (VINCIis a two-telescope instrument providing only V2 values), it is notpossible to fit a more sophisticated model that for instance in-cludes a better description of the extended dust disk. From thisanalysis, we do not exclude the presence of a companion, how-ever, because our VINCI data are too fragmentary to conclude.
2.3. VLTI/MIDI spectroscopy and interferometry
To complete the photometric and spectrophotometric datapresent in the literature, we retrieved VLTI/MIDI observationsfrom the ESO Data Archive and processed them using theMIA+EWS6 data processing pipeline (Chesneau 2007). MIDIis an interferometric beam combiner for two telescopes (Lein-ert et al. 2003), which provides fringe visibility and differentialphase measurements in addition to classical spectroscopic capa-bilities.
5 http://www.aavso.org6 http://home.strw.leidenuniv.nl/~nevec/MIDI/
Fig. 7. VINCI squared visibilities measured on L2 Pup, as a functionof the baseline length (top panel) and of the baseline position angle(bottom panel) at an effective wavelength of 2.19 µm. The solid blackdots are the VINCI visibility measurements, the red diamonds are thebest fit uniform ellipse model visibilities (see Sect. 2.2.2 for details),and the yellow squares show the visibility derived from the RADMC-3D model presented in Sect. 3. The dashed curve in the top panel is a26.6 mas uniform disk squared visibility function (assuming ω = 100%unresolved flux), intended to guide the eye.
The MIDI observation of L2 Pup was recorded on 3 January2005 (MJD = 53373.24), together with one observation of thecalibrator star HD 67582, which is part of the Cohen et al. (1999)reference catalog. The two stars were observed between UT05:06 and UT 06:40 using the 8-meter Unit Telescopes UT2 andUT4. This configuration provided a projected baseline length of88.9 m along a position angle of PA=5.2◦ on L2 Pup.
The photometric spectrum is presented in Fig. 8. The clas-sical silicate emission feature is clearly visible longward ofλ = 9 µm. This feature was already present in the Japanese In-frared Telescope in Space (IRTS) spectrum presented by Bed-ding et al. (2002).
The interferometric visibility spectrum and differentialphases are presented in Fig. 9. The visibility level is extremelylow, indicating that the thermal emission from the dust is fully re-solved on the relatively long UT1-UT4 observation baseline, andtherefore more extended than the resolution of the interferometer(≈ 25 mas). A simple fit of a Gaussian following the formalismpresented by Leinert et al. (2004) results in the FWHM angu-
Article number, page 7 of 16
A&A proofs: manuscript no. aa23273-13-2
Fig. 8. MIDI photometric spectrum of L2 Pup.
lar size as a function of wavelength presented in Fig. 10. The≈ 18 mas angular size derived from the VINCI measurements(Sect. 2.2) corresponds reasonably well to the FWHM derivedat λ = 8 µm (≈ 22 mas). At this wavelength, the flux contri-bution of the photosphere is still higher than that of the dust.Around 10 µm and longward, the measured FWHM increasessignificantly up to 40 mas because the thermal emission becomesdominant.
From the spectral energy distribution discussed in Sect. 2.4,the relative flux contribution of the central star is ≈ 10% at10 µm, and based on the VINCI angular diameter, its expectedphotospheric visibility is ≈ 40%. These two figures imply thatthe photosphere probably contributes a ≈ 4% visibility to theMIDI measurements. Because we observe a much lower visibil-ity value (below 1%), the morphology of the dust envelope inthis wavelength range is probably more complex than a simpleGaussian. This conclusion is strengthened by the presence of adust band in front of the star and of a large loop in the L bandimages (Sect. 3.1).
Interferometric measurements with MIDI at shorter base-lines and covering a broader range of position angles are nec-essary to better constrain the true extension and morphology ofthe dust envelope at 10 µm. The position angle of the presentedMIDI measurement is almost aligned with the minor axis of thedisk-like structure observed with NACO. As a consequence, thederived FWHM extension should be considered a lower limit forthe actual extension of the thermal infrared emission.
The differential phase signal shows a significant variationwith wavelength that is commonly associated with a drift of thephotocenter of the object as the wavelength changes. This phasebehavior is commony interpreted as caused by a disk (see e.g.Deroo et al. 2007; Ohnaka et al. 2008), and few alternative ex-planations are possible. The photospheric stellar flux decreasesas wavelength increases, while the silicate emission feature at10 µm and longward increases the relative contribution from thedust considerably. This change in flux ratio between the star andthe disk as a function of wavelength directly affects the interfer-ometric phase, as observed on the MIDI phase signal (Fig. 9).
However, considering the complexity of the geometry of theobserved dust distribution and the scarcity of the MIDI samplingof the spatial frequency (u, v) plane, a different interpretation ofthe visibility and phase signals appears to be very difficult. Wetherefore did not consider the MIDI interferometric observables
Fig. 9. MIDI fringe visibility spectrum (top panel) and relative phases(bottom panel) of L2 Pup.
Fig. 10. Equivalent Gaussian FWHM of L2 Pup derived from the MIDIvisibilities.
(visibility and phase) any longer in the present study. We usedthe photometric spectrum to constrain the photometry of our ra-diative transfer model, however.
2.4. Spectral energy distribution of L2 Pup
We searched the literature for photometry of L2 Pup and the re-trieved measurements are listed in Table 5. Because it is a vari-able star, there is some scattering in the measured fluxes, partic-ularly in the visible. The WISE bands 1, 2, and 3 (Cutri et al.2012) are discrepant compared to the other literature measure-ments, possibly because of detector saturation on this extremelybright source, and were excluded from this analysis. The Planckdata points were retrieved from the recently released Planck Col-laboration (2013) catalog, considering the PSF fitting method.Compared with the other listed measurements, the angular res-olution of the Planck instruments is low, with a beam size of≈ 5′ at the considered frequencies (217-857 GHz). The millime-ter wavelength emission from L2 Pup and its envelope (millime-ter excess) are clearly detected, however.
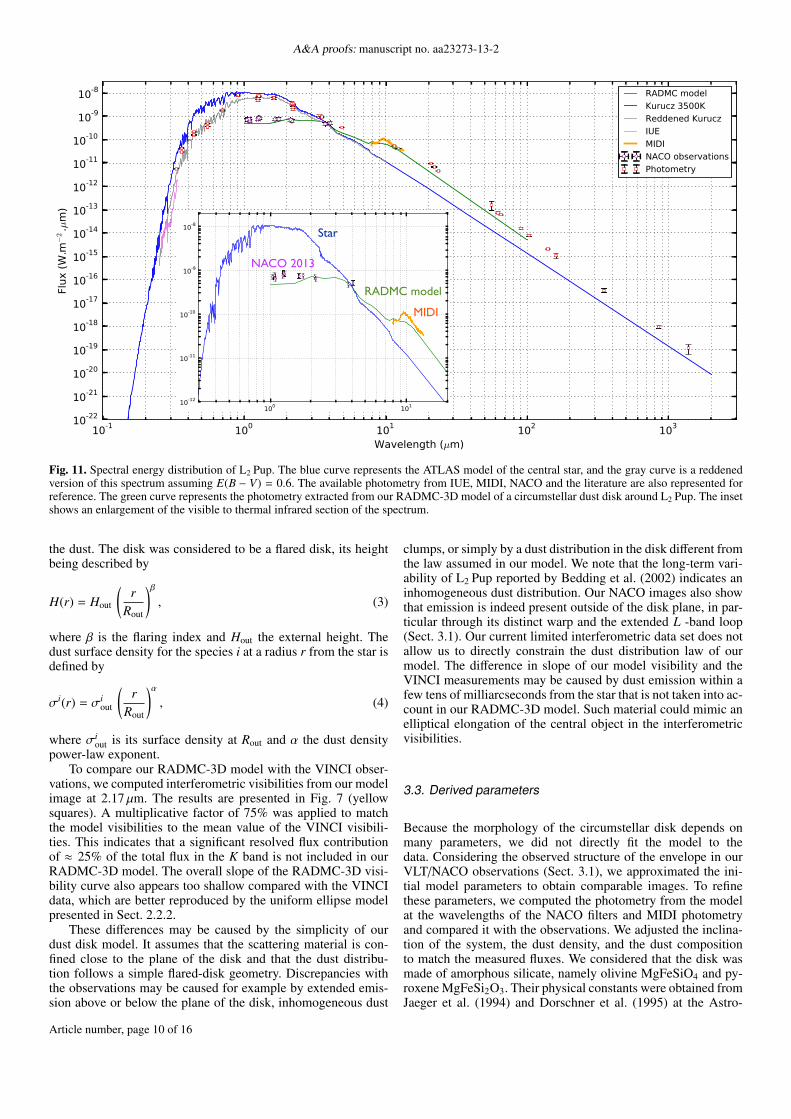
Figure 11 presents the available photometric measurementsfrom the literature as red squares, the archival IUE spectrum withreference LWP222507 as a green curve, and the MIDI spectrum(Sect. 2.3) as an orange curve.
7 Retrieved from the IUE database at MAST http://archive.stsci.edu/iue/search.php
Article number, page 8 of 16

P. Kervella et al.: An edge-on translucent dust disk around the nearest AGB star, L2 Puppis
Many different values of the effective temperature of L2 Pupare found in the literature, from 2800 K or below up to 3500 Kor more. Adding to the difficulty of the measurement, this tem-perature is also variable over the 14- day cycle of the star (Rubanet al. 2009). Bedding et al. (2002) discussed the choice of effec-tive temperature for this star. The main difficulty in estimatingthis parameter is that the photometric flux of L2 Pup itself is af-fected by two bias sources, depending on the wavelength range.At visible and very near-infrared wavelengths (shortward of theH band), there is strong circumstellar absorption (as shown inFig. 4) and scattering that results in a negative bias. Longwardof the K band, there is a significant contribution from the ther-mal emission of the dust, which creates a positive bias on themeasured flux. The near-infrared H and K bands provide thebest window to avoid these two bias sources, as the scatteringis much less efficient in these bands than in the visible, while thethermal emission from the dust is still minor compared with thephotospheric flux. We here took advantage of the JHKL pho-tometry published by Bedding et al. (2002) to derive the meanmagnitudes of L2 Pup: mJ = −0.71 ± 0.07, mH = −1.66 ± 0.07,mK = −2.13 ± 0.05, mL = −2.78 ± 0.04. We now combinethese H and K mean magnitudes with the angular diameterθLD = 17.9 ± 1.6 mas we derived in Sect. 2.2.2 to apply the sur-face brightness-temperature relations derived by Kervella et al.(2004b). We obtain effective temperatures in H and K of 3250and 3500 K, with an uncertainty of 500 K. We therefore selectedfor L2 Pup a model atmosphere SED with an effective tempera-ture of 3500 K. We note that this is close to the choice of Juraet al. (2002) (3400 K).
In Fig. 11, the thin gray curve represents an ATLAS modelfor Teff = 3500 K, log g = 1.5, [M/H] = 0.0, which was re-trieved from the Castelli & Kurucz (2004) grid8 and normalizedto a limb-darkened angular diameter of θLD = 17.9 mas. The thingray curve is a reddened version of this ATLAS model spectralenergy distribution for a selective absorption E(B − V) = 0.6,using the prescription by Fitzpatrick (1999) for a standard RV =
AV/E(B−V) = 3.1 interstellar dust model. This value of E(B−V)was adjusted to reproduce the observed SED of L2 Pup before itsrecent dimming (i.e., considering the photometric measurementsfrom the literature).
The integrated flux from the Kurucz model gives a bolomet-ric luminosity L = 2000 ± 700 L⊙, assuming the Hipparcos par-allax (π = 15.61 ± 0.99 mas, van Leeuwen 2007) and a solarbolometric luminosity of L⊙ = 3.846 × 1026 W (Torres 2010).
3. Modeling of the nebula
3.1. Overall morphology of the nebula and chosen model
The NACO images presented in Fig. 4 show that the morphologyof the nebula around L2 Pup is dominated by a dark band in the Jband and elongated or loop-like structures at longer wavelengths.As the scattering of the stellar light by the dust is more efficientat shorter wavelengths, the dust band masks the star very effi-ciently in the J band, and we observe essentially the light scat-tered above and below the dust disk. This results in an apparent“double source” with one component to the north and one to thesouth of the star itself, which essentially remains hidden behindthe dust. As wavelength increases, the scattering becomes lessefficient, and the dust becomes more translucent. In the K band,the star is visible as a single source, together with an east-west
8 http://www.stsci.edu/hst/observatory/cdbs/castelli_
kurucz_atlas.html
Fig. 12. Deconvolved NACO images of L2 Pup at 3.74 and 4.05 µm. Theposition and angular size of the star is represented with a white disk.
segment approximately 2-3 AU in radius. In the L band (around4 µm), the thermal emission of the close-in warm dust becomesimportant. We observe an elongated central source and a largeloop extending up to more than 10 AU in radius from the star inthe northeast quadrant (Fig. 12). The innermost section of this re-markable feature is also detected at shorter wavelengths (H andK bands). The symmetry of the nebula is essentially along theNS and EW directions, although a noticeable level of warping isvisible in the NE-SW direction. This asymmetry may be relatedto the formation of the loop.
The general structure of L2 Pup’s envelope appears consis-tent with a dust disk seen almost edge-on. Under this hypothe-sis, we computed a model of the disk that is presented in the nextparagraphs. However, this is certainly not the only possible inter-pretation of the NACO images. The dust band might for instancebe transiting temporarily in front of the star without pertainingto a complete circumstellar disk. We also assumed in our modelthat the dust distribution in the disk follows an axial symmetry.The long-term photometric variability of L2 Pup presented byBedding et al. (2002) could be interpreted as the consequence ofvariable obscuration of the star by circumstellar dust. In this sce-nario, the relatively large amplitude of the photometric variationin the visible (∆mV ≈ +2.5 mag since 1995) would imply a veryinhomogeneous dust distribution across the disk surface, whichis currently not reflected in our model.
The dust disk model we chose should therefore be under-stood as a simplified, first-order attempt to reproduce the ob-served morphology of the envelope of L2 Pup and its presentphotometry.
3.2. RADMC-3D radiative transfer model
We used the RADMC-3D code9 (Dullemond 2012) to model thedusty nebula around L2 Pup. RADMC-3D is designed for as-trophysical radiative transfers calculations. It is working in twosteps: first it computes the dust temperature by running a thermalMonte Carlo simulation (Bjorkman & Wood 2001), then it pro-duces an image of the dust continuum. The model was first cre-ated using the protoplanetary disk GUI provided in the RADMC-3D package and developed by Juhász et al. (2010), which weadapted to suit our needs. We used a regular grid without refine-ment, whose parameters are listed in Table 6.
Consistent with the VLTI/VINCI observations (seeSect. 2.2), we considered a radius of 123 R⊙ for the cen-tral star. The spectrum of the photosphere was taken from anATLAS model with Teff = 3500 K, log g = 0.0 and [M/H] =0.0 (Fig. 11). We considered an isotropic scattering model for
9 Available at http://www.ita.uni-heidelberg.de/
~dullemond/software/radmc-3d/
Article number, page 9 of 16
A&A proofs: manuscript no. aa23273-13-2
NACO 2013
RADMC model
MIDI
Star
Fig. 11. Spectral energy distribution of L2 Pup. The blue curve represents the ATLAS model of the central star, and the gray curve is a reddenedversion of this spectrum assuming E(B − V) = 0.6. The available photometry from IUE, MIDI, NACO and the literature are also represented forreference. The green curve represents the photometry extracted from our RADMC-3D model of a circumstellar dust disk around L2 Pup. The insetshows an enlargement of the visible to thermal infrared section of the spectrum.
the dust. The disk was considered to be a flared disk, its heightbeing described by
H(r) = Hout
(
r
Rout
)β
, (3)
where β is the flaring index and Hout the external height. Thedust surface density for the species i at a radius r from the star isdefined by
σi(r) = σiout
(
r
Rout
)α
, (4)
where σiout is its surface density at Rout and α the dust density
power-law exponent.To compare our RADMC-3D model with the VINCI obser-
vations, we computed interferometric visibilities from our modelimage at 2.17 µm. The results are presented in Fig. 7 (yellowsquares). A multiplicative factor of 75% was applied to matchthe model visibilities to the mean value of the VINCI visibili-ties. This indicates that a significant resolved flux contributionof ≈ 25% of the total flux in the K band is not included in ourRADMC-3D model. The overall slope of the RADMC-3D visi-bility curve also appears too shallow compared with the VINCIdata, which are better reproduced by the uniform ellipse modelpresented in Sect. 2.2.2.
These differences may be caused by the simplicity of ourdust disk model. It assumes that the scattering material is con-fined close to the plane of the disk and that the dust distribu-tion follows a simple flared-disk geometry. Discrepancies withthe observations may be caused for example by extended emis-sion above or below the plane of the disk, inhomogeneous dust
clumps, or simply by a dust distribution in the disk different fromthe law assumed in our model. We note that the long-term vari-ability of L2 Pup reported by Bedding et al. (2002) indicates aninhomogeneous dust distribution. Our NACO images also showthat emission is indeed present outside of the disk plane, in par-ticular through its distinct warp and the extended L -band loop(Sect. 3.1). Our current limited interferometric data set does notallow us to directly constrain the dust distribution law of ourmodel. The difference in slope of our model visibility and theVINCI measurements may be caused by dust emission within afew tens of milliarcseconds from the star that is not taken into ac-count in our RADMC-3D model. Such material could mimic anelliptical elongation of the central object in the interferometricvisibilities.
3.3. Derived parameters
Because the morphology of the circumstellar disk depends onmany parameters, we did not directly fit the model to thedata. Considering the observed structure of the envelope in ourVLT/NACO observations (Sect. 3.1), we approximated the ini-tial model parameters to obtain comparable images. To refinethese parameters, we computed the photometry from the modelat the wavelengths of the NACO filters and MIDI photometryand compared it with the observations. We adjusted the inclina-tion of the system, the dust density, and the dust compositionto match the measured fluxes. We considered that the disk wasmade of amorphous silicate, namely olivine MgFeSiO4 and py-roxene MgFeSi2O3. Their physical constants were obtained fromJaeger et al. (1994) and Dorschner et al. (1995) at the Astro-
Article number, page 10 of 16
P. Kervella et al.: An edge-on translucent dust disk around the nearest AGB star, L2 Puppis
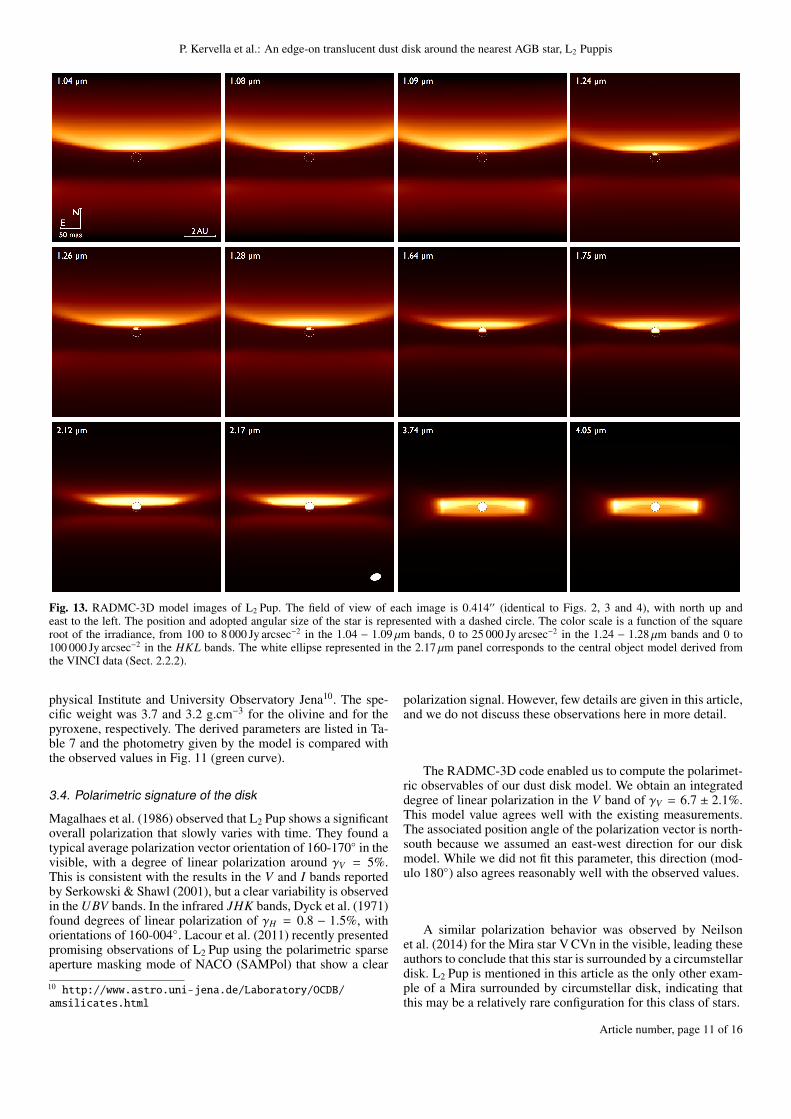
Fig. 13. RADMC-3D model images of L2 Pup. The field of view of each image is 0.414′′ (identical to Figs. 2, 3 and 4), with north up andeast to the left. The position and adopted angular size of the star is represented with a dashed circle. The color scale is a function of the squareroot of the irradiance, from 100 to 8 000 Jy arcsec−2 in the 1.04 − 1.09 µm bands, 0 to 25 000 Jy arcsec−2 in the 1.24 − 1.28 µm bands and 0 to100 000 Jy arcsec−2 in the HKL bands. The white ellipse represented in the 2.17 µm panel corresponds to the central object model derived fromthe VINCI data (Sect. 2.2.2).
physical Institute and University Observatory Jena10. The spe-cific weight was 3.7 and 3.2 g.cm−3 for the olivine and for thepyroxene, respectively. The derived parameters are listed in Ta-ble 7 and the photometry given by the model is compared withthe observed values in Fig. 11 (green curve).
3.4. Polarimetric signature of the disk
Magalhaes et al. (1986) observed that L2 Pup shows a significantoverall polarization that slowly varies with time. They found atypical average polarization vector orientation of 160-170◦ in thevisible, with a degree of linear polarization around γV = 5%.This is consistent with the results in the V and I bands reportedby Serkowski & Shawl (2001), but a clear variability is observedin the UBV bands. In the infrared JHK bands, Dyck et al. (1971)found degrees of linear polarization of γH = 0.8 − 1.5%, withorientations of 160-004◦. Lacour et al. (2011) recently presentedpromising observations of L2 Pup using the polarimetric sparseaperture masking mode of NACO (SAMPol) that show a clear
10 http://www.astro.uni-jena.de/Laboratory/OCDB/
amsilicates.html
polarization signal. However, few details are given in this article,and we do not discuss these observations here in more detail.
The RADMC-3D code enabled us to compute the polarimet-ric observables of our dust disk model. We obtain an integrateddegree of linear polarization in the V band of γV = 6.7 ± 2.1%.This model value agrees well with the existing measurements.The associated position angle of the polarization vector is north-south because we assumed an east-west direction for our diskmodel. While we did not fit this parameter, this direction (mod-ulo 180◦) also agrees reasonably well with the observed values.
A similar polarization behavior was observed by Neilsonet al. (2014) for the Mira star V CVn in the visible, leading theseauthors to conclude that this star is surrounded by a circumstellardisk. L2 Pup is mentioned in this article as the only other exam-ple of a Mira surrounded by circumstellar disk, indicating thatthis may be a relatively rare configuration for this class of stars.
Article number, page 11 of 16
A&A proofs: manuscript no. aa23273-13-2
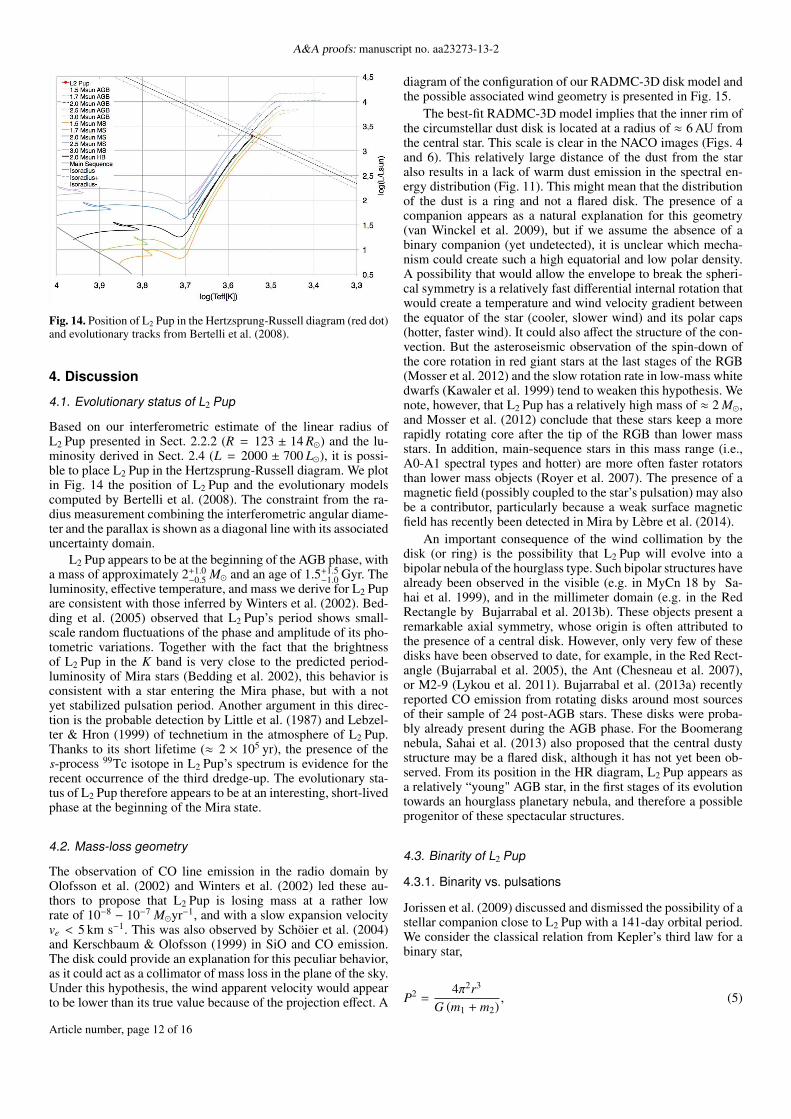
Fig. 14. Position of L2 Pup in the Hertzsprung-Russell diagram (red dot)and evolutionary tracks from Bertelli et al. (2008).
4. Discussion
4.1. Evolutionary status of L2 Pup
Based on our interferometric estimate of the linear radius ofL2 Pup presented in Sect. 2.2.2 (R = 123 ± 14 R⊙) and the lu-minosity derived in Sect. 2.4 (L = 2000 ± 700 L⊙), it is possi-ble to place L2 Pup in the Hertzsprung-Russell diagram. We plotin Fig. 14 the position of L2 Pup and the evolutionary modelscomputed by Bertelli et al. (2008). The constraint from the ra-dius measurement combining the interferometric angular diame-ter and the parallax is shown as a diagonal line with its associateduncertainty domain.
L2 Pup appears to be at the beginning of the AGB phase, witha mass of approximately 2+1.0
−0.5 M⊙ and an age of 1.5+1.5−1.0 Gyr. The
luminosity, effective temperature, and mass we derive for L2 Pupare consistent with those inferred by Winters et al. (2002). Bed-ding et al. (2005) observed that L2 Pup’s period shows small-scale random fluctuations of the phase and amplitude of its pho-tometric variations. Together with the fact that the brightnessof L2 Pup in the K band is very close to the predicted period-luminosity of Mira stars (Bedding et al. 2002), this behavior isconsistent with a star entering the Mira phase, but with a notyet stabilized pulsation period. Another argument in this direc-tion is the probable detection by Little et al. (1987) and Lebzel-ter & Hron (1999) of technetium in the atmosphere of L2 Pup.Thanks to its short lifetime (≈ 2 × 10⁵ yr), the presence of thes-process 99Tc isotope in L2 Pup’s spectrum is evidence for therecent occurrence of the third dredge-up. The evolutionary sta-tus of L2 Pup therefore appears to be at an interesting, short-livedphase at the beginning of the Mira state.
4.2. Mass-loss geometry
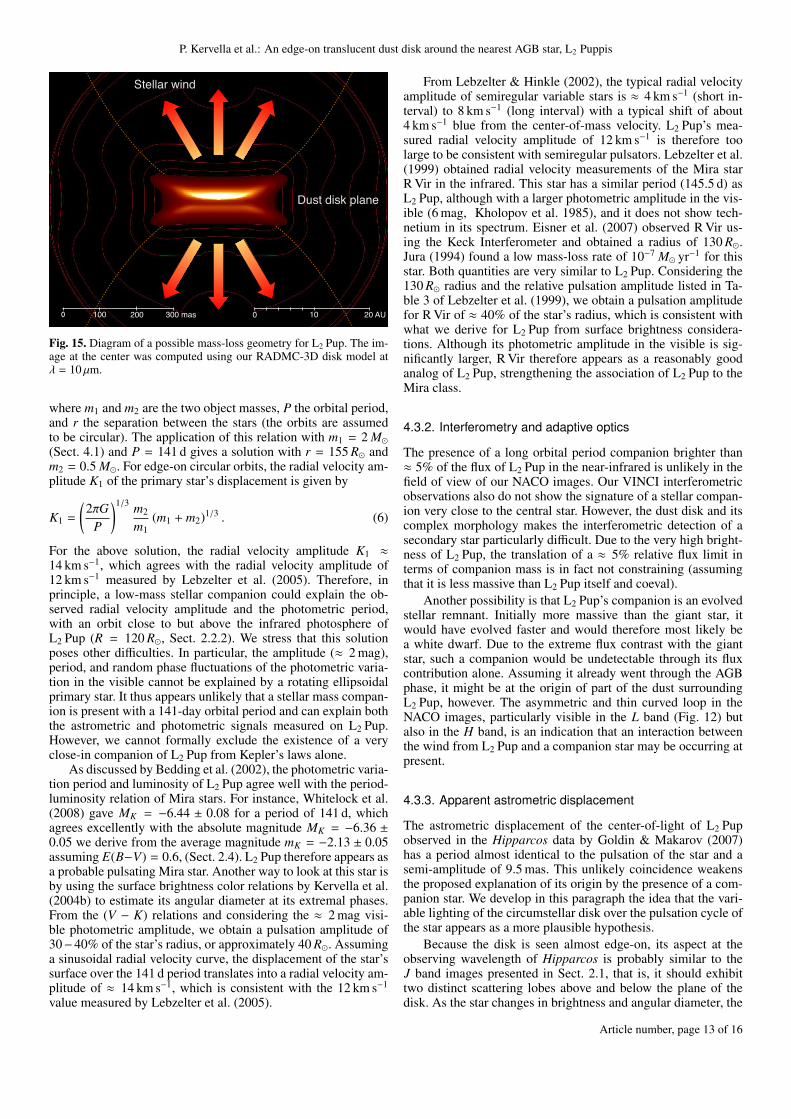
The observation of CO line emission in the radio domain byOlofsson et al. (2002) and Winters et al. (2002) led these au-thors to propose that L2 Pup is losing mass at a rather lowrate of 10−8 − 10−7 M⊙yr−1, and with a slow expansion velocityve < 5 km s−1. This was also observed by Schöier et al. (2004)and Kerschbaum & Olofsson (1999) in SiO and CO emission.The disk could provide an explanation for this peculiar behavior,as it could act as a collimator of mass loss in the plane of the sky.Under this hypothesis, the wind apparent velocity would appearto be lower than its true value because of the projection effect. A
diagram of the configuration of our RADMC-3D disk model andthe possible associated wind geometry is presented in Fig. 15.
The best-fit RADMC-3D model implies that the inner rim ofthe circumstellar dust disk is located at a radius of ≈ 6 AU fromthe central star. This scale is clear in the NACO images (Figs. 4and 6). This relatively large distance of the dust from the staralso results in a lack of warm dust emission in the spectral en-ergy distribution (Fig. 11). This might mean that the distributionof the dust is a ring and not a flared disk. The presence of acompanion appears as a natural explanation for this geometry(van Winckel et al. 2009), but if we assume the absence of abinary companion (yet undetected), it is unclear which mecha-nism could create such a high equatorial and low polar density.A possibility that would allow the envelope to break the spheri-cal symmetry is a relatively fast differential internal rotation thatwould create a temperature and wind velocity gradient betweenthe equator of the star (cooler, slower wind) and its polar caps(hotter, faster wind). It could also affect the structure of the con-vection. But the asteroseismic observation of the spin-down ofthe core rotation in red giant stars at the last stages of the RGB(Mosser et al. 2012) and the slow rotation rate in low-mass whitedwarfs (Kawaler et al. 1999) tend to weaken this hypothesis. Wenote, however, that L2 Pup has a relatively high mass of ≈ 2 M⊙,and Mosser et al. (2012) conclude that these stars keep a morerapidly rotating core after the tip of the RGB than lower massstars. In addition, main-sequence stars in this mass range (i.e.,A0-A1 spectral types and hotter) are more often faster rotatorsthan lower mass objects (Royer et al. 2007). The presence of amagnetic field (possibly coupled to the star’s pulsation) may alsobe a contributor, particularly because a weak surface magneticfield has recently been detected in Mira by Lèbre et al. (2014).
An important consequence of the wind collimation by thedisk (or ring) is the possibility that L2 Pup will evolve into abipolar nebula of the hourglass type. Such bipolar structures havealready been observed in the visible (e.g. in MyCn 18 by Sa-hai et al. 1999), and in the millimeter domain (e.g. in the RedRectangle by Bujarrabal et al. 2013b). These objects present aremarkable axial symmetry, whose origin is often attributed tothe presence of a central disk. However, only very few of thesedisks have been observed to date, for example, in the Red Rect-angle (Bujarrabal et al. 2005), the Ant (Chesneau et al. 2007),or M2-9 (Lykou et al. 2011). Bujarrabal et al. (2013a) recentlyreported CO emission from rotating disks around most sourcesof their sample of 24 post-AGB stars. These disks were proba-bly already present during the AGB phase. For the Boomerangnebula, Sahai et al. (2013) also proposed that the central dustystructure may be a flared disk, although it has not yet been ob-served. From its position in the HR diagram, L2 Pup appears asa relatively “young" AGB star, in the first stages of its evolutiontowards an hourglass planetary nebula, and therefore a possibleprogenitor of these spectacular structures.
4.3. Binarity of L2 Pup
4.3.1. Binarity vs. pulsations
Jorissen et al. (2009) discussed and dismissed the possibility of astellar companion close to L2 Pup with a 141-day orbital period.We consider the classical relation from Kepler’s third law for abinary star,
P2 =4π2r3
G (m1 + m2), (5)
Article number, page 12 of 16
P. Kervella et al.: An edge-on translucent dust disk around the nearest AGB star, L2 Puppis
Stellar wind
Dust disk plane
10 20 AU0300 mas0 200100
Fig. 15. Diagram of a possible mass-loss geometry for L2 Pup. The im-age at the center was computed using our RADMC-3D disk model atλ = 10 µm.
where m1 and m2 are the two object masses, P the orbital period,and r the separation between the stars (the orbits are assumedto be circular). The application of this relation with m1 = 2 M⊙(Sect. 4.1) and P = 141 d gives a solution with r = 155 R⊙ andm2 = 0.5 M⊙. For edge-on circular orbits, the radial velocity am-plitude K1 of the primary star’s displacement is given by
K1 =
(
2πGP
)1/3m2
m1(m1 + m2)1/3 . (6)
For the above solution, the radial velocity amplitude K1 ≈
14 km s−1, which agrees with the radial velocity amplitude of12 km s−1 measured by Lebzelter et al. (2005). Therefore, inprinciple, a low-mass stellar companion could explain the ob-served radial velocity amplitude and the photometric period,with an orbit close to but above the infrared photosphere ofL2 Pup (R = 120 R⊙, Sect. 2.2.2). We stress that this solutionposes other difficulties. In particular, the amplitude (≈ 2 mag),period, and random phase fluctuations of the photometric varia-tion in the visible cannot be explained by a rotating ellipsoidalprimary star. It thus appears unlikely that a stellar mass compan-ion is present with a 141-day orbital period and can explain boththe astrometric and photometric signals measured on L2 Pup.However, we cannot formally exclude the existence of a veryclose-in companion of L2 Pup from Kepler’s laws alone.
As discussed by Bedding et al. (2002), the photometric varia-tion period and luminosity of L2 Pup agree well with the period-luminosity relation of Mira stars. For instance, Whitelock et al.(2008) gave MK = −6.44 ± 0.08 for a period of 141 d, whichagrees excellently with the absolute magnitude MK = −6.36 ±0.05 we derive from the average magnitude mK = −2.13 ± 0.05assuming E(B−V) = 0.6, (Sect. 2.4). L2 Pup therefore appears asa probable pulsating Mira star. Another way to look at this star isby using the surface brightness color relations by Kervella et al.(2004b) to estimate its angular diameter at its extremal phases.From the (V − K) relations and considering the ≈ 2 mag visi-ble photometric amplitude, we obtain a pulsation amplitude of30−40% of the star’s radius, or approximately 40 R⊙. Assuminga sinusoidal radial velocity curve, the displacement of the star’ssurface over the 141 d period translates into a radial velocity am-plitude of ≈ 14 km s−1, which is consistent with the 12 km s−1
value measured by Lebzelter et al. (2005).
From Lebzelter & Hinkle (2002), the typical radial velocityamplitude of semiregular variable stars is ≈ 4 km s−1 (short in-terval) to 8 km s−1 (long interval) with a typical shift of about4 km s−1 blue from the center-of-mass velocity. L2 Pup’s mea-sured radial velocity amplitude of 12 km s−1 is therefore toolarge to be consistent with semiregular pulsators. Lebzelter et al.(1999) obtained radial velocity measurements of the Mira starR Vir in the infrared. This star has a similar period (145.5 d) asL2 Pup, although with a larger photometric amplitude in the vis-ible (6 mag, Kholopov et al. 1985), and it does not show tech-netium in its spectrum. Eisner et al. (2007) observed R Vir us-ing the Keck Interferometer and obtained a radius of 130 R⊙.Jura (1994) found a low mass-loss rate of 10−7 M⊙ yr−1 for thisstar. Both quantities are very similar to L2 Pup. Considering the130 R⊙ radius and the relative pulsation amplitude listed in Ta-ble 3 of Lebzelter et al. (1999), we obtain a pulsation amplitudefor R Vir of ≈ 40% of the star’s radius, which is consistent withwhat we derive for L2 Pup from surface brightness considera-tions. Although its photometric amplitude in the visible is sig-nificantly larger, R Vir therefore appears as a reasonably goodanalog of L2 Pup, strengthening the association of L2 Pup to theMira class.
4.3.2. Interferometry and adaptive optics
The presence of a long orbital period companion brighter than≈ 5% of the flux of L2 Pup in the near-infrared is unlikely in thefield of view of our NACO images. Our VINCI interferometricobservations also do not show the signature of a stellar compan-ion very close to the central star. However, the dust disk and itscomplex morphology makes the interferometric detection of asecondary star particularly difficult. Due to the very high bright-ness of L2 Pup, the translation of a ≈ 5% relative flux limit interms of companion mass is in fact not constraining (assumingthat it is less massive than L2 Pup itself and coeval).
Another possibility is that L2 Pup’s companion is an evolvedstellar remnant. Initially more massive than the giant star, itwould have evolved faster and would therefore most likely bea white dwarf. Due to the extreme flux contrast with the giantstar, such a companion would be undetectable through its fluxcontribution alone. Assuming it already went through the AGBphase, it might be at the origin of part of the dust surroundingL2 Pup, however. The asymmetric and thin curved loop in theNACO images, particularly visible in the L band (Fig. 12) butalso in the H band, is an indication that an interaction betweenthe wind from L2 Pup and a companion star may be occurring atpresent.
4.3.3. Apparent astrometric displacement
The astrometric displacement of the center-of-light of L2 Pupobserved in the Hipparcos data by Goldin & Makarov (2007)has a period almost identical to the pulsation of the star and asemi-amplitude of 9.5 mas. This unlikely coincidence weakensthe proposed explanation of its origin by the presence of a com-panion star. We develop in this paragraph the idea that the vari-able lighting of the circumstellar disk over the pulsation cycle ofthe star appears as a more plausible hypothesis.
Because the disk is seen almost edge-on, its aspect at theobserving wavelength of Hipparcos is probably similar to theJ band images presented in Sect. 2.1, that is, it should exhibittwo distinct scattering lobes above and below the plane of thedisk. As the star changes in brightness and angular diameter, the
Article number, page 13 of 16
A&A proofs: manuscript no. aa23273-13-2
flux ratio between the two lobes will also change and displacethe photocenter. More distant dusty features (such as the loop),depending on their linear (de-projected) distance from the starand shadowing effects in the star’s envelope, will also show achanging relative brightnesses. A combination of these differentlighting effects in the close environment of L2 Pup could wellshift the center-of-light position by the relatively large observedsemi-amplitude of 9.5 mas.
As an alternative explanation, during the expansion phase ofthe pulsation, the northern hemisphere of the stellar disk may“emerge” above the dust disk, as the star’s radius inflates byapproximately 40 R⊙ (Sect. 4.3.1). Because the southern hemi-sphere of the star will remain darkened by the dust, this willinduce a shift of the center-of-light toward the north. Depend-ing on its amplitude, such a displacement could mimick the or-bital reflex motion caused by a companion. This scenario alone,however, is insufficient to explain the 9.5 mas amplitude of theHipparcos displacement observed by Goldin & Makarov (2007)because it is larger than the stellar radius. It could play a role incombination with lighting effects in the inhomogenous nebula,however.
It is interesting to note that a time-variable lighting effect wasalso invoked by McIntosh & Indermuehle (2013) to explain theirobservation of variable SiO maser emission. This interpretationis consistent with our model of an edge-on disk around L2 Pupand the presence of dusty material in front of the star.
4.3.4. X-ray emission
The presence of a close companion orbiting in L2 Pup’s windwill result in accretion of the AGB stellar wind, for example,through the wind Roche-lobe overflow process (Abate et al.2013). The low mass-loss rate and slow wind of L2 Pup (Olof-sson et al. 2002) would likely result in a low accretion rate ona main-sequence or compact companion, and consequently littleX-ray production. This X-ray flux would be additionally reducedby the strong absorption by the dust disk. An X-ray emissionof L2 Pup was recently reported by Ramstedt et al. (2012) fromarchival XMM data, but it was attributed by these authors to aleak of optical (red) photons and not to true emission from thestar. So the X-ray emission does not provide a clear diagnosticon the existence of a companion of L2 Pup.
5. Conclusion
The NACO observations we presented in Sect. 2.1 show thatL2 Pup is veiled by a large dust band. Its morphology appearsconsistent with a circumstellar dust disk seen almost edge-on.Its aspect changes significantly from 1.0 to 4.0 µm. At shorterwavelengths (J band), the scattering by dust grains is very ef-ficient, resulting in a high opacity and the presence of a darkband obscuring the stellar light. In the L band, the dust scatteringis much less efficient, and the thermal emission from the inneredge of the disk becomes dominant. In the intermediate near-infrared bands (HK), the disk is translucent and the central starbecomes progressively more visible as the wavelength increases.Our simulations using the RADMC-3D radiative transfer codestrengthened this interpretation because the model we developedreproduced both the aspect of the NACO images as a function ofwavelength and the observed spectral energy distribution. If weconsider that the dust density is inhomogenous in the disk, thevariable dust obscuration scenario proposed by Bedding et al.(2002) to explain the long-term variability of L2 Pup is consis-tent with the proposed edge-on configuration. In this framework,
the long minimum flux phase observed since ≈ 1995 would re-sult from the transit of a dense part of the dust disk in front ofthe star, creating the morphology observed in the NACO images.
A simple evolutionary analysis shows that L2 Pup is probablyin an early phase of the AGB, with a mass of approximately2 M⊙, and an age of about 1.5 Gyr. Its physical properties arevery similar to those of the short-period Mira star R Vir, and itsluminosity is consistent with the period-luminosity relation ofthis class of stars. We propose that L2 Pup should be classified asa short-period Mira star instead of a semiregular variable.
We did not detect any stellar companion to L2 Pup in ourNACO images or in our VINCI interferometric observations.We propose that the astrometric wobble observed by Goldin &Makarov (2007) is caused by time-variable lighting effects onL2 Pup’s circumstellar nebula and not by an orbiting companion.The measured radial velocity amplitude is also consistent withthe pulsation of the central star, without the need to invoke asecondary object. We stress, however, that we do not exclude thepossibility that a companion is present, particularly if its orbitalperiod is significantly longer than the pulsation period of L2 Pup.In addition, the loop structure we detected in our L -band imagespoints at a possible interaction of a hidden companion with thedusty wind from the central star. As discussed by van Winckelet al. (2009), the mere existence of a dusty disk around L2 Pup isalso in itself an indication that a companion may be present, asdisks in post-AGB stars appear inherently connected to binarity.
L2 Pup presents interesting challenges for the modeling ofthe envelope of an evolved, moderately massive star. The geo-metric configuration that we propose, with a large disk seen al-most edge-on, is particularly promising to test and develop ourunderstanding of the formation of bipolar planetary nebulae inthe post-AGB phase. Such a disk could also be a favorable en-vironment to form large dust grains, and possibly planetesimals.The presence of circumstellar material around white dwarfs (Far-ihi et al. 2005) could be the final result of this secondary planetformation episode in AGB dust disks such as L2 Pup’s.
Acknowledgements. This research received the support of PHASE, the high an-gular resolution partnership between ONERA, Observatoire de Paris, CNRS andUniversity Denis Diderot Paris 7. We acknowledge financial support from the“Programme National de Physique Stellaire" (PNPS) of CNRS/INSU, France.STR acknowledges partial support by NASA grant NNH09AK731. AG ac-knowledges support from FONDECYT grant 3130361. We acknowledge withthanks the variable star observations from the AAVSO International Databasecontributed by observers worldwide and used in this research. This researchmade use of Astropy11, a community-developed core Python package for As-tronomy (Astropy Collaboration et al. 2013). We used the SIMBAD and VIZIERdatabases at the CDS, Strasbourg (France), and NASA’s Astrophysics Data Sys-tem Bibliographic Services. We used the IRAF package, distributed by theNOAO, which are operated by the Association of Universities for Research inAstronomy, Inc., under cooperative agreement with the National Science Foun-dation. Some of the data presented in this paper were obtained from the Multi-mission Archive at the Space Telescope Science Institute (MAST). STScI is op-erated by the Association of Universities for Research in Astronomy, Inc., underNASA contract NAS5-26555. Support for MAST for non-HST data is providedby the NASA Office of Space Science via grant NAG5-7584 and by other grantsand contracts.
References
Abate, C., Pols, O. R., Izzard, R. G., Mohamed, S. S., & de Mink, S. E. 2013,A&A, 552, A26
Astropy Collaboration, Robitaille, T. P., Tollerud, E. J., et al. 2013, A&A, 558,A33
Bedding, T. R., Kiss, L. L., Kjeldsen, H., et al. 2005, MNRAS, 361, 1375Bedding, T. R., Zijlstra, A. A., Jones, A., et al. 2002, MNRAS, 337, 79
11 Available at http://www.astropy.org/
Article number, page 14 of 16
P. Kervella et al.: An edge-on translucent dust disk around the nearest AGB star, L2 Puppis
Beichman, C. A., Neugebauer, G., Habing, H. J., Clegg, P. E., & Chester, T. J.,eds. 1988, Infrared astronomical satellite (IRAS) catalogs and atlases. Volume1: Explanatory supplement, Vol. 1
Bertelli, G., Girardi, L., Marigo, P., & Nasi, E. 2008, A&A, 484, 815Bjorkman, J. E. & Wood, K. 2001, ApJ, 554, 615Bordé, P., Coudé du Foresto, V., Chagnon, G., & Perrin, G. 2002, A&A, 393,
183Bujarrabal, V., Alcolea, J., Van Winckel, H., Santander-García, M., & Castro-
Carrizo, A. 2013a, A&A, 557, A104Bujarrabal, V., Castro-Carrizo, A., Alcolea, J., & Neri, R. 2005, A&A, 441, 1031Bujarrabal, V., Castro-Carrizo, A., Alcolea, J., et al. 2013b, A&A, 557, L11Cannon, A. J. 1907, Annals of Harvard College Observatory, 55, 1Castelli, F. & Kurucz, R. L. 2004, ArXiv Astrophysics e-prints, arXiv:astro-
ph/0405087Chesneau, O. 2007, New A Rev., 51, 666Chesneau, O., Lykou, F., Balick, B., et al. 2007, A&A, 473, L29Claret, A. & Bloemen, S. 2011, A&A, 529, A75Cohen, M., Walker, R. G., Carter, B., et al. 1999, AJ, 117, 1864Cutri, R. M., Skrutskie, M. F., van Dyk, S., et al. 2003, 2MASS All Sky Catalog
of point sources.Cutri, R. M., Wright, E. L., Conrow, T., et al. 2012, VizieR Online Data Catalog,
2311Deroo, P., Acke, B., Verhoelst, T., et al. 2007, A&A, 474, L45Dorschner, J., Begemann, B., Henning, T., Jaeger, C., & Mutschke, H. 1995,
A&A, 300, 503Ducati, J. R. 2002, VizieR Online Data Catalog, 2237Dullemond, C. P. 2012, RADMC-3D: A multi-purpose radiative transfer tool,
astrophysics Source Code LibraryDumm, T. & Schild, H. 1998, New A, 3, 137Dyck, H. M., Forbes, F. F., & Shawl, S. J. 1971, AJ, 76, 901Eisner, J. A., Graham, J. R., Akeson, R. L., et al. 2007, ApJ, 654, L77Farihi, J., Becklin, E. E., & Zuckerman, B. 2005, ApJS, 161, 394Fitzpatrick, E. L. 1999, PASP, 111, 63Goldin, A. & Makarov, V. V. 2007, ApJS, 173, 137Gray, M. D., Wittkowski, M., Scholz, M., et al. 2009, MNRAS, 394, 51Guyon, O. 2002, A&A, 387, 366Hanbury Brown, R., Davis, J., Lake, R. J. W., & Thompson, R. J. 1974, MNRAS,
167, 475Ireland, M. J., Tuthill, P. G., Bedding, T. R., Robertson, J. G., & Jacob, A. P.
2004, MNRAS, 350, 365Ishihara, D., Onaka, T., Kataza, H., et al. 2010, A&A, 514, A1Jaeger, C., Mutschke, H., Begemann, B., Dorschner, J., & Henning, T. 1994,
A&A, 292, 641Jorissen, A., Frankowski, A., Famaey, B., & van Eck, S. 2009, A&A, 498, 489Juhász, A., Bouwman, J., Henning, T., et al. 2010, ApJ, 721, 431Jura, M. 1994, ApJ, 422, 102Jura, M., Chen, C., & Plavchan, P. 2002, ApJ, 569, 964Kawaler, S. D., Sekii, T., & Gough, D. 1999, ApJ, 516, 349Kerschbaum, F. & Olofsson, H. 1999, A&AS, 138, 299Kervella, P. & Domiciano de Souza, A. 2006, A&A, 453, 1059Kervella, P., Ségransan, D., & Coudé du Foresto, V. 2004a, A&A, 425, 1161Kervella, P., Thévenin, F., Di Folco, E., & Ségransan, D. 2004b, A&A, 426, 297Kervella, P., Thévenin, F., Morel, P., Bordé, P., & Di Folco, E. 2003, A&A, 408,
681Kervella, P., Verhoelst, T., Ridgway, S. T., et al. 2009, A&A, 504, 115Kholopov, P. N., Samus, N. N., Kazarovets, E. V., & Perova, N. B. 1985, Infor-
mation Bulletin on Variable Stars, 2681, 1Kurucz, R. L. 2005, Memorie della Societa Astronomica Italiana Supplementi,
8, 14Lacour, S., Tuthill, P., Ireland, M., Amico, P., & Girard, J. 2011, The Messenger,
146, 18Lèbre, A., Aurière, M., Fabas, N., et al. 2014, A&A, 561, A85Lebzelter, T. & Hinkle, K. H. 2002, A&A, 393, 563Lebzelter, T., Hinkle, K. H., & Hron, J. 1999, A&A, 341, 224Lebzelter, T., Hinkle, K. H., Wood, P. R., Joyce, R. R., & Fekel, F. C. 2005,
A&A, 431, 623Lebzelter, T. & Hron, J. 1999, A&A, 351, 533Leinert, C., Graser, U., Przygodda, F., et al. 2003, Ap&SS, 286, 73Leinert, C., van Boekel, R., Waters, L. B. F. M., et al. 2004, A&A, 423, 537Lenzen, R., Hofmann, R., Bizenberger, P., & Tusche, A. 1998, in Society
of Photo-Optical Instrumentation Engineers (SPIE) Conference Series, ed.A. M. Fowler, Vol. 3354, 606–614
Little, S. J., Little-Marenin, I. R., & Bauer, W. H. 1987, AJ, 94, 981Lord, S. D. 1992, NASA Technical Memorandum, 103957Lykou, F., Chesneau, O., Zijlstra, A. A., et al. 2011, A&A, 527, A105Magalhaes, A. M., Codina-Landaberry, S. J., Gneiding, C., & Coyne, G. V. 1986,
A&A, 154, 1Masciadri, E., Brandner, W., Bouy, H., et al. 2003, A&A, 411, 157McIntosh, G. C. & Indermuehle, B. 2013, ApJ, 774, 21
Mermilliod, J.-C. & Mermilliod, M. 1994, Catalogue of Mean UBV Data onStars
Morel, M. & Magnenat, P. 1978, A&AS, 34, 477Mosser, B., Goupil, M. J., Belkacem, K., et al. 2012, A&A, 548, A10Neilson, H. R., Ignace, R., & Henson, G. D. 2014, in IAU Symposium, Vol. 301,
IAU Symposium, ed. J. A. Guzik, W. J. Chaplin, G. Handler, & A. Pigulski,463–464
Neuhäuser, R., Mugrauer, M., Seifahrt, A., Schmidt, T. O. B., & Vogt, N. 2008,A&A, 484, 281
Ohnaka, K. 2014, A&A, 561, A47Ohnaka, K., Izumiura, H., Leinert, C., et al. 2008, A&A, 490, 173Olofsson, H., González Delgado, D., Kerschbaum, F., & Schöier, F. L. 2002,
A&A, 391, 1053Planck Collaboration. 2013, VizieR Online Data Catalog, 8091Ramstedt, S., Montez, R., Kastner, J., & Vlemmings, W. H. T. 2012, A&A, 543,
A147Rousset, G., Lacombe, F., Puget, P., et al. 2003, in Society of Photo-Optical
Instrumentation Engineers (SPIE) Conference Series, ed. P. L. Wizinowich &D. Bonaccini, Vol. 4839, 140–149
Royer, F., Zorec, J., & Gómez, A. E. 2007, A&A, 463, 671Ruban, E. V., Arkharov, A. A., Hagen-Thorn, E. I., & Novikov, V. V. 2009,
Astrophysics, 52, 88Sahai, R., Dayal, A., Watson, A. M., et al. 1999, AJ, 118, 468Sahai, R., Vlemmings, W. H. T., Huggins, P. J., Nyman, L.-Å., & Gonidakis, I.
2013, ApJ, 777, 92Samus, N. N., Durlevich, O. V., & et al. 2009, VizieR Online Data Catalog, 1,
2025Schödel, R., Najarro, F., Muzic, K., & Eckart, A. 2010, A&A, 511, A18Schöier, F. L., Olofsson, H., Wong, T., Lindqvist, M., & Kerschbaum, F. 2004,
A&A, 422, 651Serkowski, K. & Shawl, S. J. 2001, AJ, 122, 2017Smith, B. J., Price, S. D., & Baker, R. I. 2004, ApJS, 154, 673Torres, G. 2010, AJ, 140, 1158van Leeuwen, F. 2007, A&A, 474, 653van Winckel, H., Lloyd Evans, T., Briquet, M., et al. 2009, A&A, 505, 1221Wesselius, P. R., van Duinen, R. J., de Jonge, A. R. W., et al. 1982, A&AS, 49,
427Whitelock, P. A., Feast, M. W., & van Leeuwen, F. 2008, MNRAS, 386, 313Winters, J. M., Le Bertre, T., Nyman, L.-Å., Omont, A., & Jeong, K. S. 2002,
A&A, 388, 609
Article number, page 15 of 16
A&A proofs: manuscript no. aa23273-13-2
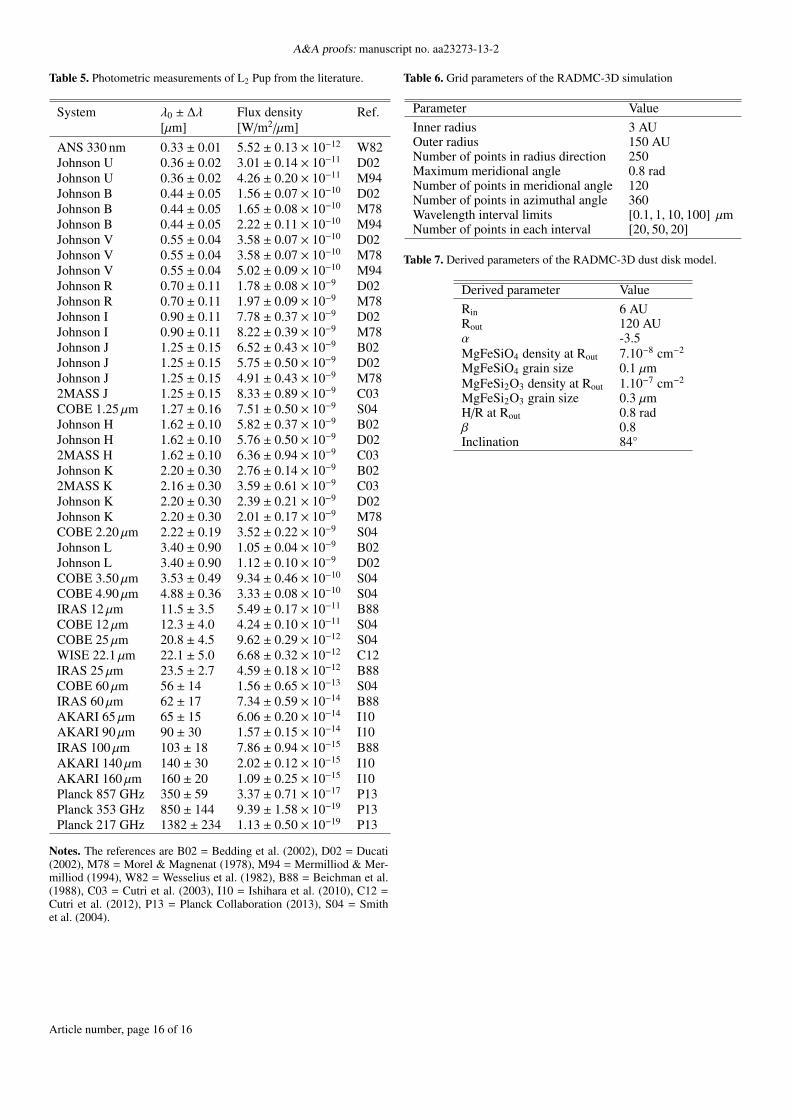
Table 5. Photometric measurements of L2 Pup from the literature.
System λ0 ± ∆λ Flux density Ref.[µm] [W/m2/µm]
ANS 330 nm 0.33 ± 0.01 5.52 ± 0.13 × 10⁻¹² W82Johnson U 0.36 ± 0.02 3.01 ± 0.14 × 10⁻¹¹ D02Johnson U 0.36 ± 0.02 4.26 ± 0.20 × 10⁻¹¹ M94Johnson B 0.44 ± 0.05 1.56 ± 0.07 × 10⁻¹⁰ D02Johnson B 0.44 ± 0.05 1.65 ± 0.08 × 10⁻¹⁰ M78Johnson B 0.44 ± 0.05 2.22 ± 0.11 × 10⁻¹⁰ M94Johnson V 0.55 ± 0.04 3.58 ± 0.07 × 10⁻¹⁰ D02Johnson V 0.55 ± 0.04 3.58 ± 0.07 × 10⁻¹⁰ M78Johnson V 0.55 ± 0.04 5.02 ± 0.09 × 10⁻¹⁰ M94Johnson R 0.70 ± 0.11 1.78 ± 0.08 × 10⁻⁹ D02Johnson R 0.70 ± 0.11 1.97 ± 0.09 × 10⁻⁹ M78Johnson I 0.90 ± 0.11 7.78 ± 0.37 × 10⁻⁹ D02Johnson I 0.90 ± 0.11 8.22 ± 0.39 × 10⁻⁹ M78Johnson J 1.25 ± 0.15 6.52 ± 0.43 × 10⁻⁹ B02Johnson J 1.25 ± 0.15 5.75 ± 0.50 × 10⁻⁹ D02Johnson J 1.25 ± 0.15 4.91 ± 0.43 × 10⁻⁹ M782MASS J 1.25 ± 0.15 8.33 ± 0.89 × 10⁻⁹ C03COBE 1.25 µm 1.27 ± 0.16 7.51 ± 0.50 × 10⁻⁹ S04Johnson H 1.62 ± 0.10 5.82 ± 0.37 × 10⁻⁹ B02Johnson H 1.62 ± 0.10 5.76 ± 0.50 × 10⁻⁹ D022MASS H 1.62 ± 0.10 6.36 ± 0.94 × 10⁻⁹ C03Johnson K 2.20 ± 0.30 2.76 ± 0.14 × 10⁻⁹ B022MASS K 2.16 ± 0.30 3.59 ± 0.61 × 10⁻⁹ C03Johnson K 2.20 ± 0.30 2.39 ± 0.21 × 10⁻⁹ D02Johnson K 2.20 ± 0.30 2.01 ± 0.17 × 10⁻⁹ M78COBE 2.20 µm 2.22 ± 0.19 3.52 ± 0.22 × 10⁻⁹ S04Johnson L 3.40 ± 0.90 1.05 ± 0.04 × 10⁻⁹ B02Johnson L 3.40 ± 0.90 1.12 ± 0.10 × 10⁻⁹ D02COBE 3.50 µm 3.53 ± 0.49 9.34 ± 0.46 × 10⁻¹⁰ S04COBE 4.90 µm 4.88 ± 0.36 3.33 ± 0.08 × 10⁻¹⁰ S04IRAS 12 µm 11.5 ± 3.5 5.49 ± 0.17 × 10⁻¹¹ B88COBE 12 µm 12.3 ± 4.0 4.24 ± 0.10 × 10⁻¹¹ S04COBE 25 µm 20.8 ± 4.5 9.62 ± 0.29 × 10⁻¹² S04WISE 22.1 µm 22.1 ± 5.0 6.68 ± 0.32 × 10⁻¹² C12IRAS 25 µm 23.5 ± 2.7 4.59 ± 0.18 × 10⁻¹² B88COBE 60 µm 56 ± 14 1.56 ± 0.65 × 10⁻¹³ S04IRAS 60 µm 62 ± 17 7.34 ± 0.59 × 10⁻¹⁴ B88AKARI 65 µm 65 ± 15 6.06 ± 0.20 × 10⁻¹⁴ I10AKARI 90 µm 90 ± 30 1.57 ± 0.15 × 10⁻¹⁴ I10IRAS 100 µm 103 ± 18 7.86 ± 0.94 × 10⁻¹⁵ B88AKARI 140 µm 140 ± 30 2.02 ± 0.12 × 10⁻¹⁵ I10AKARI 160 µm 160 ± 20 1.09 ± 0.25 × 10⁻¹⁵ I10Planck 857 GHz 350 ± 59 3.37 ± 0.71 × 10⁻¹⁷ P13Planck 353 GHz 850 ± 144 9.39 ± 1.58 × 10⁻¹⁹ P13Planck 217 GHz 1382 ± 234 1.13 ± 0.50 × 10⁻¹⁹ P13
Notes. The references are B02 = Bedding et al. (2002), D02 = Ducati(2002), M78 = Morel & Magnenat (1978), M94 = Mermilliod & Mer-milliod (1994), W82 = Wesselius et al. (1982), B88 = Beichman et al.(1988), C03 = Cutri et al. (2003), I10 = Ishihara et al. (2010), C12 =Cutri et al. (2012), P13 = Planck Collaboration (2013), S04 = Smithet al. (2004).
Table 6. Grid parameters of the RADMC-3D simulation
Parameter Value
Inner radius 3 AUOuter radius 150 AUNumber of points in radius direction 250Maximum meridional angle 0.8 radNumber of points in meridional angle 120Number of points in azimuthal angle 360Wavelength interval limits [0.1, 1, 10, 100] µmNumber of points in each interval [20, 50, 20]
Table 7. Derived parameters of the RADMC-3D dust disk model.
Derived parameter Value
Rin 6 AURout 120 AUα -3.5MgFeSiO4 density at Rout 7.10−8 cm−2
MgFeSiO4 grain size 0.1 µmMgFeSi2O3 density at Rout 1.10−7 cm−2
MgFeSi2O3 grain size 0.3 µmH/R at Rout 0.8 radβ 0.8Inclination 84◦
Article number, page 16 of 16