an effective size window for impact ionization in pbs ... · pdf filean effective size window...
TRANSCRIPT

1
An effective size window for impact ionization in PbS nanoparticles
and experimental evidence of dispersive screening of coulomb
interaction in hot excitons
Padmashri V. Patil and Shouvik Datta
Department of Physics, Indian Institute of Science Education and Research-Pune,
1st Floor, Central Tower, Sai Trinity Building, Pashan, Pune – 411021, Maharashtra, India.
Email : [email protected], [email protected]
ABSTRACT
Photo-induced carrier multiplications are predicted to overcome the limiting efficiency of single junction solar cells by
generating more than one electron-hole pair (exciton) per absorbed photon. Here, we have studied collisional
broadening of excitonic absorption spectra of PbS nano-crystallites at energies much above its fundamental band gap.
Observed spectral features necessitate the role of extended band structure of semiconductors to understand the physics
of carrier multiplication in nanoparticles. Our analysis also shows that quasi ballistic transport of hot excitons can
actually suppress exciton-exciton scattering events required for photo-induced carrier multiplication in very small
quantum dots. Measured variations of excitonic broadening clearly indicate that impact ionization of excitons may be
efficient only inside an intermediate „size window‟. This can explain the current debates on reported efficiencies of
carrier multiplication in semiconductor nanoparticles as compared to bulk materials. Moreover, we will discuss the
importance of „effective Bohr exciton radius‟ as a direct consequence of significant departure from the usual dielectric
screening limits of coulomb interactions of „hot‟ excitons in the region of strong dispersion at energies much above the
fundamental band gap.
Keywords: Exciton, Carrier Multiplication, Multiple Exciton Generation, Nanoparticles, Quantum Dots, Absorption
Spectroscopy, Dielectric Response, Auger Processes, Ballistic transport.

2
I. INTRODUCTION
In solids, attractive coulomb interaction generates electron-hole pairs to form hydrogen atom like
bound states called excitons. In semiconductors, such exciton like quasi particles can form during optical
absorptions. Here we will study the optical absorption spectra of excitons generated much above the
fundamental bang gap in Lead Sulfide (PbS) nanoparticles. It is known that PbS is a narrow band gap (E0Bulk
~ 0.41eV at 300K) group IV-VI semiconductor having a seemingly large (~18nm) Bohr exciton radius1.
Optical absorption spectra of lowest excitonic transitions in PbS nanoparticles were extensively studied in
the past1-4
. It was also predicted earlier that carrier multiplication (CM) or multiple exciton generation5,6
can
be very efficient in these quantum confined structures of semiconductors. Consequently, one expects that
solar cells using these nanoparticles may be able to exploit CM to generate more than one electron-hole pairs
from single photon absorption events to enhance the efficiency beyond the maximum attainable
thermodynamic efficiency7 of a single junction solar cell. Efficient CM was subsequently reported by several
groups8-11
in many different semiconductor nanoparticles. However, some recent experimental results and
theoretical analyses generated further controversies12-15
about the precise nature of efficiency of such CM
processes in semiconductor nanoparticles as compared to their bulk counterparts.
Here we report, the broadening of an excitonic feature of PbS nano-crystallites in room temperature
optical absorption spectra at excitation energies (> 5.3 eV) much higher than its bulk band gap. This is in
contrast to most spectral studies where the focus were primarily on the lowest excitonic transitions in which
one can comfortably neglect the presence of strong dispersions in the dielectric response. In this report, we
will analyze – (i) the role of collisional broadening of „hot‟ excitons via „zero phonon coupling‟ to the
extended band structure of PbS and (ii) also the reduction of collisional broadening in the strong confinement
regimes where the nano-crystallites can be quasi ballistic for inverse Auger type of events. It will be

3
demonstrated that this collisional broadening decreases for both smaller and larger nano-crystallites.
Therefore, we will argue in favor of the existence of an effective intermediate size window for efficient CM
via photo-induced impact ionization in semiconductor nanoparticles. Moreover, we will also talk about - (iii)
the role of asymmetric effective masses of electron and holes at high energy critical points of PbS band
structure and (iv) the concept of ‘effective Bohr exciton radius’ (a*Ex) at photon energies much higher than
the fundamental band gap. There we will argue that within such energy regions of strong dielectric
dispersion, the usual high frequency limit of dielectric screening of coulomb interactions may no longer be
valid for such „hot‟ excitons. Furthermore, we deliberately allowed larger PbS nano-particles to age to get
more physical insights about the spectral broadening. We will discuss - (v) how the aging of excitonic
spectra due to spatial delocalization of excitons can affect such collisional broadening, and (vi) the „quasi-
reversible‟ evolution of room temperature optical absorption spectra of „hot‟ excitons of weakly confined
(particle radius > 3 times Bohr exciton radius ) PbS nano-crystallites to that of bulk like absorption spectra at
temperatures higher than room temperature. We will argue that all these above observations actually support
our analysis about the effect of exciton scattering on the collisional broadening of optical absorption spectra.
We hope that this work will be useful to optimize the size of semiconductor nanoparticles in nano-
photovoltaic cells designed to exploit the benefits of carrier multiplications to enhance the power conversion
efficiency.
II. EXPERIMENTAL METHODS
A. Synthesis of PbS Nanoparticles. Chemicals used for the synthesis of PbS nano-crystallites were
Lead Acetate Pb(CH3COO)2 and Sodium Sulfide (Na2S). Thio-glycerol (3-Mercapto-propane-1,2 diol) or TG
was used as capping agents. All chemicals were purchased from Sigma Aldrich and used without further

4
purifications. Synthesis was done in a two neck, round bottom flask with 18M de-ionized water as solvent.
10mL of 0.02 M Lead Acetate was heated to 80o C. Then 10mL of 0.02 M Sodium Sulfide and TG was
added drop wise. The quantity of TG was varied during the reaction (from none for the uncapped sample to
120 L in steps of 20 L) to get a wide range of nano-crystallite sizes. The temperature is maintained at 80o C
for half an hour for each reaction. After the reaction, particles were further washed several times with de-
ionized water using a 4000 rpm centrifuge for 10 minutes and finally re-dispersed in de-ionized water for
further characterizations. 20 L of this final aqueous dispersion of PbS nanoparticles is then mixed with 3mL
of de-ionized water inside a quartz cuvette for optical absorption studies. Similar characterization studies
were also performed on PbS nanoparticles dispersed in non-aqueous medium.
B. Characterizations of PbS Nanoparticles. Perkin Elmer lambda 950 was used for UV-VIS-NIR
optical absorption spectroscopy with scan steps of 0.2nm. Crystallite sizes were determined by X-ray powder
diffraction (XRD) spectra of drop casted thin films of these nanoparticles using a Bruker D8 Advanced X-
ray diffractometer with = 0.154 nm and increment of 0.01 per step. We use these crystallite sizes in our
analysis. Moreover, hydrodynamic sizes were also determined by Dynamic Light Scattering (DLS) studies
using Malvern Zeta-Sizer Nano-ZS90. DLS experiments were carried out at 25 C using 633nm, 3mW He-Ne
laser using 90 optics having 10 m apertures and autocorrelation time window of 20s. Transmission
Electron Microscopy (TEM) was done with FEI‟s Technai T-20 electron microscope using tungsten filament
at 200kV.
III. RESULTS AND DISCUSSION
A. Nano-Crystallite size vs hydrodynamic size. Figure 1a shows the XRD spectra for PbS
nanoparticles synthesized with varying Thio-glycerol (TG) concentrations. The 2 peak positions at 26.0 ,

5
30.1 , 43.1 , and 51.1 can be indexed respectively to planes (111), (200), (220), and (311) of cubic rocksalt
structure of PbS. Each of these peaks are used to calculate the final mean size of PbS nano-crystallites using
the Debye-Scherrer formula , where D is the average size(diameter) of the crystallite, K is the
shape factor ≈ 0.9, wavelength = 0.154 nm for Cu-K X-Ray, is the FWHM of the Bragg peaks and 2
is the Bragg angle. Estimated mean crystallite sizes (diameters) are also mentioned in figure 1a. Clearly the
width of the Bragg peaks increases as the crystallite size are reduced. Further analysis of the powder
diffraction spectra using William-Hall analysis showed very little strain (<0.05%) in these crystallites, which
substantiate the validity of our calculation based on Debye-Scherrer formula. A comparison of
hydrodynamic size of these particles as determined by DLS is also plotted along with the nano-crystallite
sizes in figure 1b. There we see that the hydrodynamic sizes and crystallite sizes are somewhat comparable
only below a certain crystallite diameter of 16nm. Below this 16nm of mean crystallite size, DLS data
possibly underestimate the hydrodynamic size. Above that critical size of 16nm, inherent agglomeration of
these nanoparticles is responsible for much larger hydrodynamic sizes. We will come back to this issue while
analyzing the ballistic limits of collisional broadening of excitonic line width and the aging of larger
nanoparticles.
B. Size Dependence of Excitonic Line Width. Figure 2a shows room
temperature optical absorption spectrum of freshly prepared uncapped PbS nano-crystallites dispersed in de-
ionized water. The term „freshly prepared‟ means the time (t = 0) starts 30mins after the end of reaction. We
have observed a strong excitonic feature (~5.9eV) above E3 16,17
critical point18
of bulk PbS (5.3eV).
Absorption edges are also observed near ~3.5 eV and ~2.1 eV which are close to E2 (3.14eV) and E1 (1.94
eV) critical points of bulk PbS respectively. Similar spectral features of excitonic transitions are also
6
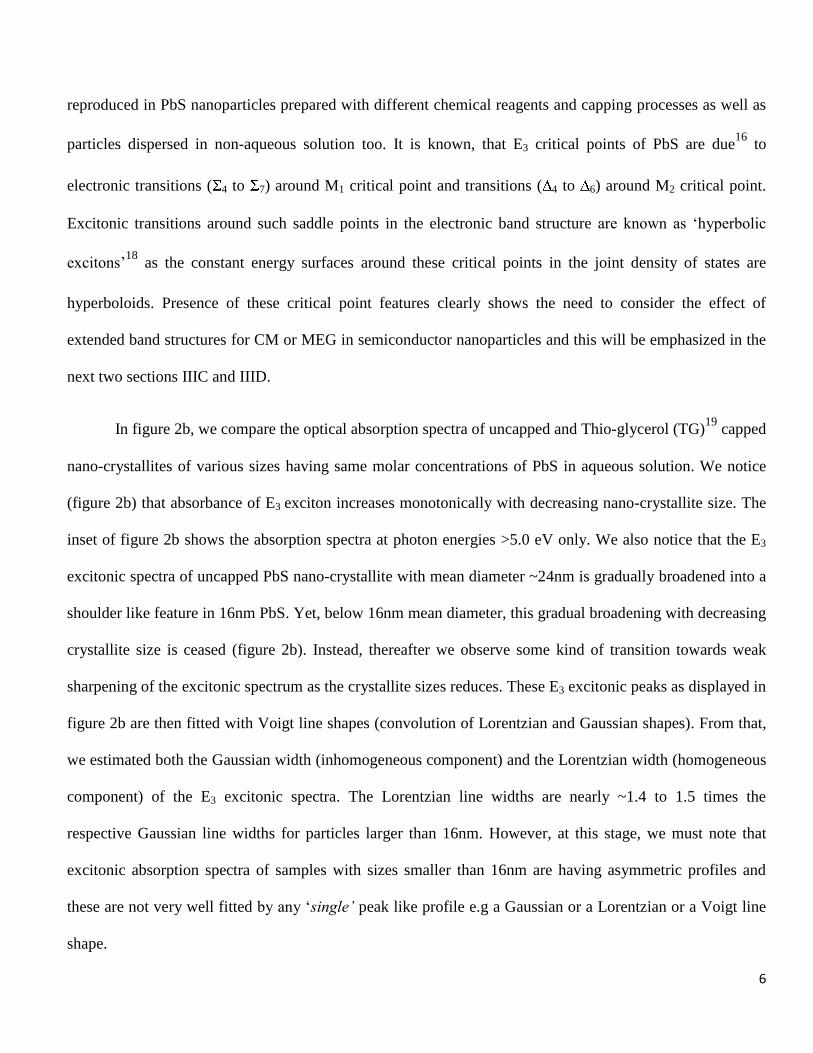
reproduced in PbS nanoparticles prepared with different chemical reagents and capping processes as well as
particles dispersed in non-aqueous solution too. It is known, that E3 critical points of PbS are due16
to
electronic transitions ( 4 to 7) around M1 critical point and transitions ( 4 to 6) around M2 critical point.
Excitonic transitions around such saddle points in the electronic band structure are known as „hyperbolic
excitons‟18
as the constant energy surfaces around these critical points in the joint density of states are
hyperboloids. Presence of these critical point features clearly shows the need to consider the effect of
extended band structures for CM or MEG in semiconductor nanoparticles and this will be emphasized in the
next two sections IIIC and IIID.
In figure 2b, we compare the optical absorption spectra of uncapped and Thio-glycerol (TG)19
capped
nano-crystallites of various sizes having same molar concentrations of PbS in aqueous solution. We notice
(figure 2b) that absorbance of E3 exciton increases monotonically with decreasing nano-crystallite size. The
inset of figure 2b shows the absorption spectra at photon energies >5.0 eV only. We also notice that the E3
excitonic spectra of uncapped PbS nano-crystallite with mean diameter ~24nm is gradually broadened into a
shoulder like feature in 16nm PbS. Yet, below 16nm mean diameter, this gradual broadening with decreasing
crystallite size is ceased (figure 2b). Instead, thereafter we observe some kind of transition towards weak
sharpening of the excitonic spectrum as the crystallite sizes reduces. These E3 excitonic peaks as displayed in
figure 2b are then fitted with Voigt line shapes (convolution of Lorentzian and Gaussian shapes). From that,
we estimated both the Gaussian width (inhomogeneous component) and the Lorentzian width (homogeneous
component) of the E3 excitonic spectra. The Lorentzian line widths are nearly ~1.4 to 1.5 times the
respective Gaussian line widths for particles larger than 16nm. However, at this stage, we must note that
excitonic absorption spectra of samples with sizes smaller than 16nm are having asymmetric profiles and
these are not very well fitted by any „single’ peak like profile e.g a Gaussian or a Lorentzian or a Voigt line
shape.

7
In general, the magnitude of any excitonic transition (both Lorentzian and Gaussian shapes) is
inversely proportional to its broadening parameter. However, contrary to the usual expectations, the
inhomogeneous width of E3 exciton is not monotonically decreasing with size (see figure 3a). So it is very
clear that we do not witness any straightforward inverse type relationship between the peak absorbance and
the line width of spectral broadening for E3 exciton. Additionally, we also see monotonic blue shift (figure
3b) of the E3 excitonic energy and monotonic increase of peak absorbance with decreasing size. These results
indicate that oscillator strength for excitonic absorption is still size dependent in PbS nano-crystallites even
in the intermediate (16nm) to weak (24 nm) confinement regimes20
. Therefore, we conclude that the origin
of this large line width (~few hundreds of meV) may not be from any simple homogenous or inhomogeneous
type of broadening mechanisms. This is reinforced by the facts that spectral shapes are asymmetric and
unlike any single peak like feature for samples smaller than 16nm.
Moreover, the magnitude of the maximum broadening width Emax = [ E(RMin) - E(RMax)] is
calculated using , where Emax is the difference between the energy position
corresponding to the minimum (R=Rmin) and maximum (R=Rmax) nano-crystallite radius, me* and mh* are
effective mass of electron and holes, h is the Planck constant and R=D/2 is the radius of the crystallite as
estimated by XRD. These Emax values (figure 3a) are far less than the estimated inhomogeneous
(Gaussian) width and homogeneous (Lorentzian) width of the E3 excitonic peaks for all nano-crystallite
diameters. We also notice that the size dependence of both estimated homogeneous and inhomogeneous
widths are qualitatively different from that of the calculated Emax. Therefore, we can rule out any significant
contribution from variation of size distributions of these nano-crystallites into the energy broadening of E3
exciton. We will discuss the physical origin of this significant inhomogeneous component at the end of
section III.D.

8
Surprisingly, these excitonic transitions (figure 2b) are located much above the E3 critical point of
bulk PbS (> 0.6eV larger than 5.3eV). This difference is also much larger than the optical phonon energy of
PbS ~ 20-27meV, which may be preventing it from thermalizing to the band edge. Our estimates
also shows that this excess energy of E3 exciton cannot be explained by size
confinement induced enhancement of energy alone (see figure 3b), except
for the strongly confined PbS nano-crystallites of mean diameter ≤ 3nm. This unusually
large departure of the peak excitonic energy position above the bulk E3 critical point of PbS may be
attributed to (at least for smaller crystallites) – a) the failure of effective mass theory21-22
at small sizes, b)
non-parabolicity of the band structure at high energies and at small sizes. However, the measured size
dependence of excitonic energy is rather „much‟ slower than even the usual type of behavior 23
(figure
3b). So, it seems that, E3 exciton can qualify as a „hot exciton‟ with excess center-of-mass kinetic energy
above the E3 band edge. We will further elucidate this point in connection with the temperature dependence
of PbS nano-crystallites (figure 7) where we will observe how this „hot‟ E3 exciton loses its extra energy
above certain temperature.
C. Dispersive Screening of Coulomb Interaction and Effective Bohr Exciton Radius. Generally,
one uses the so called “zero frequency” dielectric constant or optical dielectric constant 18
of PbS as = e +
lattice = e(0) ~ 17 to estimate the exciton binding energy and Bohr radius etc, where the subscript „e‟
stands for the electronic contribution and the subscript „lattice‟ stands for lattice contribution to dielectric
response. In contrast, here in the presence of strong dispersion around E3 critical point, we have used the
empirical value ( ) = 7 around 5.9 eV of photon energy as determined by the spectroscopic ellipsometry
measurements17
on bulk PbS. In principle, one can use experimentally determined values of ( ) for the

9
same set of nanoparticles which is currently beyond the scope (for wavelength ≤ 210 nm). To continue, we
find that – (i) there is presence of significant dispersion16, 17
above the fundamental band gap of PbS and (ii)
this E3 exciton posses excess center-of-mass kinetic energy as discussed above. As a consequence, the
calculated exciton binding energy (EEx~1/ϵ, using ( ) = 7) of this E3 exciton can be substantially higher (as
reported in the past16
) than the usual limiting value of = 17 (See Table I). We also see in Table I that the
excitonic binding energy (for all sizes) in case of dispersive ( ) = 7 is larger than the reported1,6 optical
phonon energy of PbS. This fact along with size confinement can explain the
existence of this E3 excitonic transition in PbS nano-crystallites even at room temperature. Interestingly, the
mean nano-crystallite radius of 8nm at the transition point of excitonic line width broadening (figure 3a) is
comparable to the effective Bohr exciton radius (a*
Ex) = 7.6 nm [assuming17
( ) = 7 ( 17) at E > 5.9eV and
approximately using , where me* and mh* are effective mass of electron and
holes, me is the free electron mass and is the reduced mass of exciton at E3 critical point of PbS]. We also
want to state that approximating the dielectric function with an energy independent limiting value such as
e(0) ~ is only valid 18
for , where Eg is the band gap and T is the frequency of transverse
optical phonon. However, in case of this above band gap E3 transition, . Therefore, we
understand that this revised value for the excitonic Bohr radius (a*Ex) is a direct consequence of departure
from the usual high frequency limit of dielectric constant of coulomb interactions at high photon energies
due the presence of significant dispersion16,17
much above the fundamental band gap for this „hot‟ E3 exciton.
Later we will demonstrate further connection of this new length scale termed as „effective Bohr exciton
radius’ with the ballistic limit of impact ionization which can really affect the collisional broadening E3
exciton. We will also explore the physics of this unusual variation of the broadening of E3 exciton in more
detail with respect to aging and temperature dependence of optical absorption spectra.

10
D. How Ballistic Limit of Impact Ionization Affects the Collisional Broadening? In order to
explore this connection, we first note that the electronic band structure near E3 critical point in PbS is not
symmetric16,24
at all (e.g. me*
mh* around E3). This is unlike the usual situation near its fundamental band
gap. So, we rather expect the broadening of E3 exciton25
to be dominated by Fröhlich type strong polar
exciton-phonon interactions. Usually this kind of strong coupling of excitons to optical phonons is neglected
in PbS because of its quasi symmetrical nature of electron and hole bands near its fundamental band gap
(E0). However, it is a different situation for the E3 transition in PbS. Despite the obvious presence of such
strong coupling with the optical phonons, the E3 excitonic feature still survives at room temperature and
hardly shows any temperature dependent shift in peak position (figure 7) even for weakly confined particles.
Therefore, it seems likely that quantum confinement induced non-phonon energy relaxation mechanisms26
like inverse Auger type of events (e.g impact ionization) can be dominating over phonon induced processes
for this highly energetic E3 exciton. We also know that extended band structures of a solid often play crucial
roles27-29
for inverse Auger processes. We note that this „hot‟ E3 exciton can easily avail a large number of
final density of states needed for efficient impact ionization via quantum confinement induced zero phonon
coupling to other parts of the PbS band structure. Currently, probing the CM or the impact ionization events
of this „hot‟ E3 exciton ( for wavelengths ≤ 210nm) with time domain transient absorption spectroscopy is
beyond the scope of this study. Instead, we concentrate more on the inverse Auger type of collisional
broadening30,31
of E3 excitonic peak as the mean diameter of PbS crystallite is changed from 24nm to 16nm
(figure 3a). We attribute this progressive enhancement of spectral broadening as collisional broadening due
to increased „zero phonon transitions‟ leading to efficient impact ionization and possibly CM of the E3
exciton with reducing size. Further evidences about the unusual nature of this size confinement induced
collisional broadening will be presented in connection with aging and temperature dependence.

11
As mentioned earlier in Section IIIB, fitting of Voigt lineshapes to the E3 excitonic spectra in figure
2b, also reveals significant presence of both homogeneous (Lorentzian) and inhomogeneous (Gaussian)
components. We have already shown in figure 3a, that size distribution of these PbS nano-crystallites cannot
account for such large inhomogeneous broadening. Usually, collisional broadening results in homogeneously
broadened line shapes for gas molecules. However, the presence of this significant inhomogeneous
broadening can be explained in terms of – a) size confinement induced momentum uncertainty which
connects E3 excitons to different symmetry points in the PbS band structure and b) a distribution in excitonic
K space for such hot excitons. These can cause anisotropic exciton-exciton collisions leading to
inhomogeneously broadened absorption peaks of E3 exciton. The asymmetric nature of E3 excitonic line
shape for smaller particles may also be coming from the fact that below 16nm of crystallite size, the ballistic
nature of exciton scattering can be influencing the spectral line shape. Therefore, we conclude that these
results also support the model of size confinement induced exciton scattering as the cause for spectral
broadening of E3 exciton.
Unlike the expected monotonic32-34
size variation of the rates of Auger type processes, spectral
broadening of E3 exciton is seemingly arrested (figure 2b and 3a) for sizes smaller than the „effective Bohr
exciton radius‟. Moreover, we even noticed weak sharpening of excitonic spectra in the intermediate to
strong confinement regime ( ≤ 16nm ). This observation can be explained if the impact ionization of E3
exciton and subsequent collisional broadening have a minimum size cut off. It is well known, that impact
ionization35-37
can be suppressed in very small structures due to the presence of quasi ballistic transport. This
usually happens when the nanoparticle size becomes smaller than the inverse Auger type mean free path
( )38
of exciton scattering events within the material. Our estimates based on the reported calculation38
indeed show that this for PbS nano-crystallites with

12
mean diameter of 16nm. Here we use M as the effective translation mass of exciton = me*+mh
* ≈ 0.21me, as
the reduced mass , a*Ex = 7.6nm is the effective Bohr exciton radius around E3, kB
is Boltzmann constant, T is temperature in degree Kelvin and EEx is the excitonic binding energy.
Interestingly, the estimated mean free path ( ) for exciton scattering for 16nm PbS nano-crystallite is very
much comparable - (i) to the size (diameter) at the transition point of exciton broadening (figure 2b and 3a)
and (ii) to the ‘effective Bohr exciton diameter of E3 Exciton and (iii) also to the size where the
hydrodynamic size and the crystallite size become comparable [figure 1b]! However, we must note that the
above formula was calculated based on symmetric S state wavefunctions only and may needs revision.
Moreover, we plot the estimated size dependent exciton mean free paths of PbS in figure 4 for both
( ) = 7 at 5.9eV and = 17. It is also very clear from the plot that use of the standard high frequency limit
of dielectric constant as = 17 will produce a mean free path for exciton scattering at a value > 30nm which
is much greater than the diameter of any of the PbS nano-crystallites used in this work. That way you hardly
expect any PbS nanoparticles having sizes < 30nm to undergo exciton-exciton collision processes and
subsequently produce any significant CM mediated by photo-induced impact ionization events. On the
contrary, we can invoke dispersive (dynamic) screening of coulomb interaction39-41
and an experimentally
measured value of ( ) = 7 can be used. Then it allows for the possibility of impact ionization of E3 exciton
and subsequent collisional broadening within a size window of operation in the weak to intermediate
confinement regimes. Although, our experimental results and subsequent explanations clearly resonate with
the theoretical statement42
that strong confinement may not be exclusively needed for efficient CM, but our
approach based on mean free path for inverse Auger type of exciton scattering, departure from standard static
limits of dielectric screening and the role of extended band structure is much different from those reported
earlier. Moreover, the above analysis clearly shows that we seriously need to revisit43, 44
the commonplace
13
excitonic terminologies to understand the physics of carrier multiplication of such „hot‟ excitons – a) having
very high center-of-mass velocity and b) created inside a region of strong dielectric dispersion. The dielectric
function of a material near such energetic quasi particle excitations can deviate considerably from its usual
constant (static) high frequency or optical frequency limit ( ) in such circumstances. Further support for the
above analysis will be discussed in connection with aging and temperature dependence of the excitonic
spectra.
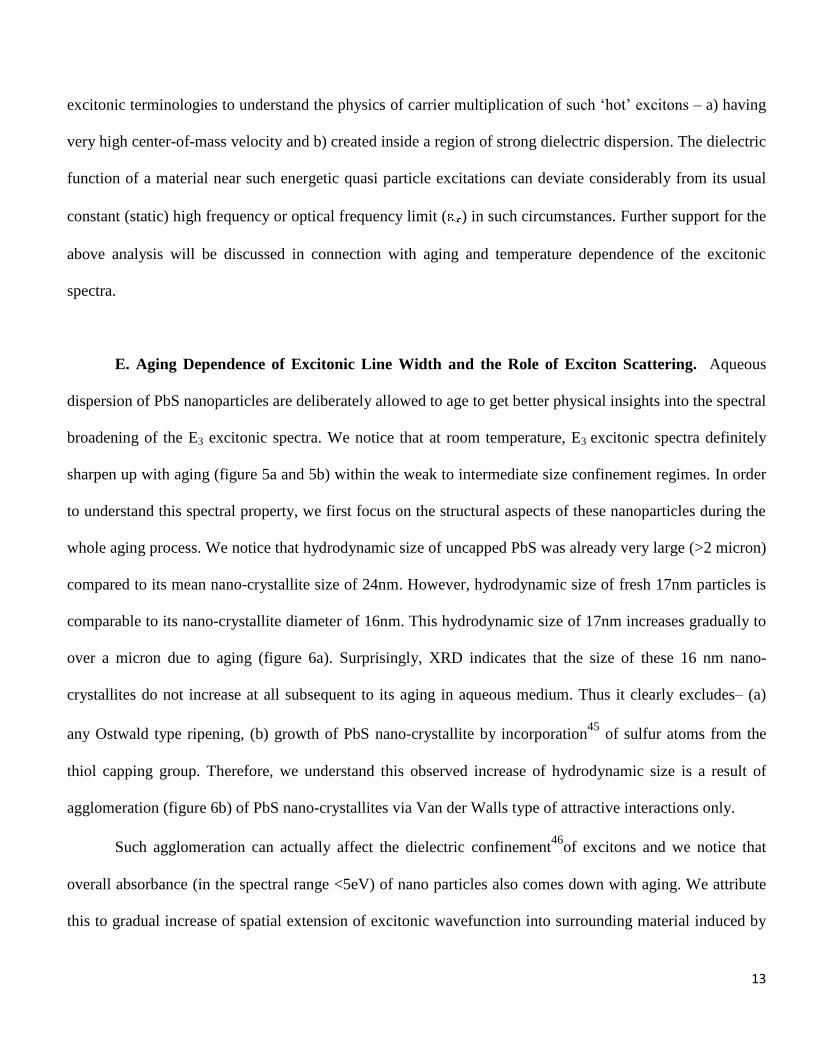
E. Aging Dependence of Excitonic Line Width and the Role of Exciton Scattering. Aqueous
dispersion of PbS nanoparticles are deliberately allowed to age to get better physical insights into the spectral
broadening of the E3 excitonic spectra. We notice that at room temperature, E3 excitonic spectra definitely
sharpen up with aging (figure 5a and 5b) within the weak to intermediate size confinement regimes. In order
to understand this spectral property, we first focus on the structural aspects of these nanoparticles during the
whole aging process. We notice that hydrodynamic size of uncapped PbS was already very large (>2 micron)
compared to its mean nano-crystallite size of 24nm. However, hydrodynamic size of fresh 17nm particles is
comparable to its nano-crystallite diameter of 16nm. This hydrodynamic size of 17nm increases gradually to
over a micron due to aging (figure 6a). Surprisingly, XRD indicates that the size of these 16 nm nano-
crystallites do not increase at all subsequent to its aging in aqueous medium. Thus it clearly excludes– (a)
any Ostwald type ripening, (b) growth of PbS nano-crystallite by incorporation45
of sulfur atoms from the
thiol capping group. Therefore, we understand this observed increase of hydrodynamic size is a result of
agglomeration (figure 6b) of PbS nano-crystallites via Van der Walls type of attractive interactions only.
Such agglomeration can actually affect the dielectric confinement46
of excitons and we notice that
overall absorbance (in the spectral range <5eV) of nano particles also comes down with aging. We attribute
this to gradual increase of spatial extension of excitonic wavefunction into surrounding material induced by

14
increased agglomeration. Subsequently, it decreases size dependent oscillator strength21-22, 47
, which further
decreases absorbance in the low energy spectral regions. On the other hand, we notice in figure 5a that the E3
excitonic peak is rather being enhanced with time and is becoming sharper with aging! We understand that
enhancement of spatial delocalization of excitons with aging can decrease the confinement induced
momentum uncertainty. So, lesser numbers of density of states are available for exciton scattering (say
impact ionizations) via confinement induced zero phonon coupling of hot E3 exciton within the extended
bandstructure of PbS. Therefore, the probability of exciton scattering and possibility of impact ionization of
E3 exciton can also come down due to such spatial delocalization 48
. This subsequently decreases the amount
of collisional broadening of E3 exciton with aging. Overall, the observation of such aging behavior
substantiates our claim on the effect of exciton scattering and possibly impact ionizations towards
broadening of optical absorption spectra of E3 exciton. Similar phenomenon, although less pronounced, is
observed in the capped PbS nano-crystallite of mean diameter of 16nm (figure 5b), where we also see aging
induced sharpening of the E3 excitonic peak. The peak position of the corresponding E3 exciton in the 16nm
sample also show slight red shift (figure 5b) during the preliminary phases of aging. However, we do not
notice such red shifts in the peak position in larger uncapped samples due to its quasi-bulk nature.
On the contrary, absorbance of 3nm PbS is not changing much with aging (figure 5c) at all. Unlike,
16nm PbS nano-crystallites, hydrodynamic diameter (3nm) of these smaller PbS nano-crystallites are not
changing with aging either. This can only happen if these smaller nanoparticles are intrinsically charged as
compared to the bigger ones (≥16nm mean diameter, see figure 1b). Similarly charged nanoparticles tend to
repel each other and that can prevent agglomeration of this 3nm PbS. Subsequently, there can be no change
of dielectric confinement in the absence of agglomeration of PbS nano-crystallites and thereby the optical
absorption spectra of 3nm PbS remain unaffected due to the absence of spatial delocalization of exciton
wavefunction. Reader should note that any additional defect formation during aging or incorporation of
15
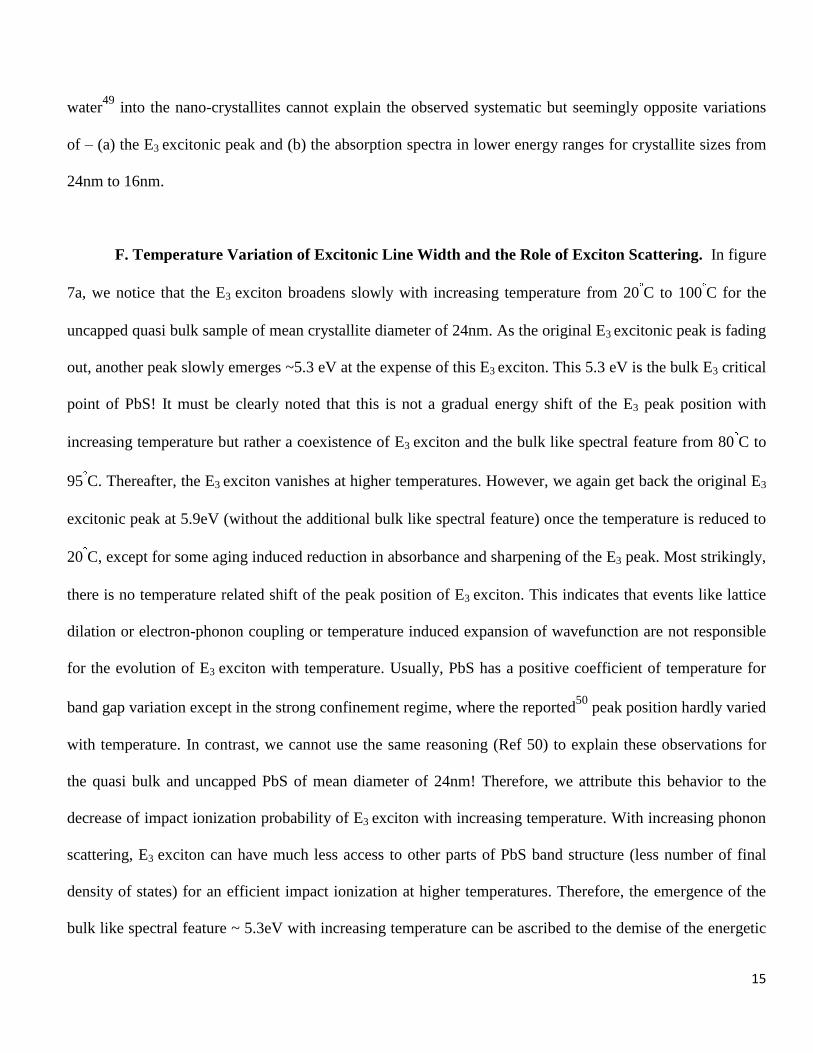
water49
into the nano-crystallites cannot explain the observed systematic but seemingly opposite variations
of – (a) the E3 excitonic peak and (b) the absorption spectra in lower energy ranges for crystallite sizes from
24nm to 16nm.
F. Temperature Variation of Excitonic Line Width and the Role of Exciton Scattering. In figure
7a, we notice that the E3 exciton broadens slowly with increasing temperature from 20 C to 100 C for the
uncapped quasi bulk sample of mean crystallite diameter of 24nm. As the original E3 excitonic peak is fading
out, another peak slowly emerges ~5.3 eV at the expense of this E3 exciton. This 5.3 eV is the bulk E3 critical
point of PbS! It must be clearly noted that this is not a gradual energy shift of the E3 peak position with
increasing temperature but rather a coexistence of E3 exciton and the bulk like spectral feature from 80 C to
95 C. Thereafter, the E3 exciton vanishes at higher temperatures. However, we again get back the original E3
excitonic peak at 5.9eV (without the additional bulk like spectral feature) once the temperature is reduced to
20 C, except for some aging induced reduction in absorbance and sharpening of the E3 peak. Most strikingly,
there is no temperature related shift of the peak position of E3 exciton. This indicates that events like lattice
dilation or electron-phonon coupling or temperature induced expansion of wavefunction are not responsible
for the evolution of E3 exciton with temperature. Usually, PbS has a positive coefficient of temperature for
band gap variation except in the strong confinement regime, where the reported50
peak position hardly varied
with temperature. In contrast, we cannot use the same reasoning (Ref 50) to explain these observations for
the quasi bulk and uncapped PbS of mean diameter of 24nm! Therefore, we attribute this behavior to the
decrease of impact ionization probability of E3 exciton with increasing temperature. With increasing phonon
scattering, E3 exciton can have much less access to other parts of PbS band structure (less number of final
density of states) for an efficient impact ionization at higher temperatures. Therefore, the emergence of the
bulk like spectral feature ~ 5.3eV with increasing temperature can be ascribed to the demise of the energetic

16
„hot‟ E3 excitons to its quasi bulk E3 band edge via Auger type cooling mechanisms51,52
by transferring its
excess energy mostly to heavier holes (note that me*
mh*at E3
16). Qualitatively similar changes were found
in the temperature dependence of 16nm PbS nano-crystallite where the corresponding E3 excitonic peak
broadens with increasing temperature (figure 7b). Moreover, the peak position of E3 exciton remains
temperature independent in both cases. The observed agglomeration of these uncapped nano-crystallites as
evidenced by DLS (figure 6a) and TEM (figure 6b) studies also point towards their non-charged nature
which may have prevented the reported suppression of Auger Cooling as observed51,53
in charged
nanoparticles. Nano-crystallite diameter of these particles as determined by XRD also remain same which
shows that significant irreversible changes like oxide formation or defect formation are not taking place in
this range of temperature. However, the emergence of bulk like E3 band edge is not so prominently visible in
16 nm samples because of much stronger size confinement and consequently lesser density of available
ground states as compared to uncapped PbS nano-crystallite with mean diameter of 24nm. At this stage, we
also wish to emphasize that line width broadening of E3 exciton with decreasing size and that with increasing
temperature are qualitatively different. We see the emergence of bulk E3 like spectral feature in the
temperature dependence studies of large PbS nano-crystallites only.
It has recently been argued that exciton-exciton scattering54
and impact ionization55,56
is the main
cause of carrier multiplication in semiconductor nanoparticles. This is in line with our above analysis about
the involvement of impact ionization towards collisional broadening of E3 excitonic spectra. We further note
that the temperature (T) coefficient (TCII) of impact ionization not only depends on the threshold energy for
impact ionization (Ei), but also on the mean free path or relaxation path length ( ) of exciton scattering
events as37
. It can be positive or negative depending on the relative balance of these
two terms. Temperature dependence of optical absorption spectra of 3nm PbS nanoparticles follows the

17
literature57
for annealing temperature >40 C, where it undergoes Ostwald ripening and we see that
hydrodynamic size of the particles increases to >275nm. However, there are hardly any irreversible changes
in the optical absorption spectra of E3 exciton till 30 C (figure 7c). This apparent temperature independence
of exciton line width broadening for strongly confined PbS can be ascribed to a set of reasons like – (a)
vanishing of TCII37
due to mutual cancellation of the above two terms, (b) reduction of impact ionization due
to the charged nature of these strongly confined particles, (c) reduction of collisional broadening in the
„quasi‟ ballistic regime, (d) strong surface effects (inelastic scattering at the hetero-interface) at very small
sizes etc. Further work is going on to understand these issues. The connection between the effects of
photocharging58
and/or photoinduced surface trapping59,
60
in smaller nanoparticles with our observation (see
figures 1b and 6a) of size dependence of hydrodynamic size and subsequent aging of this hydrodynamic size
in both capped and uncapped nanoparticles are currently being investigated in more detail.
IV. CONCLUSIONS
In summary, we have studied the broadening of very high energy excitonic feature in the
optical absorption spectra of PbS nano-crystallites. Presence of impact ionization and the effect of extended
band structure of PbS were sought to explain the observed collisional broadening of E3 excitonic absorption
spectra and its observed variation with the size of these nano-crystallites, aging and temperature. We have
also argued why quantum confinement induced collisional broadening can have significant inhomogeneous
component due to the anisotropic nature of exciton-exciton scattering events.
We find that inverse Auger type of mean free path for exciton scattering can be equally important
like the effective Bohr excitonic radius as one of the critical length scales for efficient CM in semiconductor
nanoparticles. Moreover, this concept of effective excitonic Bohr radius is a direct consequence of the

18
dispersive screening of coulomb interactions at high photon energies where the dielectric function of the
semiconductor can have a strong dependence on photon energy. We hope that our experimental analysis in
terms of dispersive (dynamical) screening of „hot‟ excitons in PbS nanoparticles will lead to better
conceptual understanding of the condensed matter physics of exciton generation and similar processes
involving dielectric contribution to coulomb interactions in semiconductors materials and devices. The
analysis of our experimental observations to some extent complements the recent theoretical prediction61
that
the effective coulomb interaction governing the carrier multiplication can be energy dependent.
To explain our experimental observations, we finally predict an intermediate size window for
semiconductor nanoparticles, where impact ionization can dominate over other kinds of exciton relaxation
pathways. Therefore, we suggest size optimization of these nanoparticles to achieve nano-photovoltaic cells
exploiting such carrier multiplications events to improve the power conversion efficiency. Finally, time
resolved studies of CM and quantum yield measurements on various semiconductor nanoparticles of
different sizes are necessary to complement these observations and additional details will be published in
future.

19
FIGURE 1
Figure 1: (a) This shows the XRD spectra of PbS nano-crystallites of different mean crystallite diameters.
Bragg peaks clearly broaden with the reduction in crystallite sizes. (b) Here we compare the mean crystallite
diameter as determined by XRD and the mean hydrodynamic diameter as determined by DLS against the
amount of TG (capping agent) added during the synthesis. The nano-crystallite diameter below which
crystallite sizes are somewhat comparable to hydrodynamic size is marked clearly.
20 30 40 50 60 70 80
(a)
16nm
8 nm
7 nm
6 nm
3 nm(311)(220)(200)
Inte
ns
ity
(a.u
.)
2 (degree)
24nm
18nm
(111)
0 30 60 90 1201
10
100
1000
Dia
me
ter
(nm
)
Amount of TG Added ( L)
DLS
XRD
(b)
16 nm

20
FIGURE 2
Figure 2: Room temperature optical absorption spectra of freshly prepared PbS nano-crystallites. (a) The
plot shows the position of various spectral features ascribed to three different critical point transitions in
uncapped PbS nano-crystallites of mean diameter of 24nm. This necessitates the role of extended band
structure of semiconductor nanoparticles to analyze CM or MEG. (b) This plot demonstrates the variation of
optical absorption spectra with PbS nanoparticles having different mean crystallite diameters as determined
by XRD. The arrow represents the direction of size variation of E3 excitonic peak. Molar concentrations of
PbS were kept same for all particle sizes during the measurements except for 3nm. There the molar
concentration was kept at 50% of the rest to avoid the saturation of optical absorption. The inset shows the
close up of the E3 excitonic peak (> 5.0 eV). It is clearly visible that the E3 excitonic spectra sharpen up for
nano-crystallites with mean diameter either smaller or bigger than 16nm. We also notice that the E3
excitonic spectral shapes for sizes smaller than 16nm are not at all symmetric unlike bigger particles.
Therefore any „single’ Gaussian or Lorentzian or even a Voigt type line shape is not a good fit to these
peaks.
2 3 4 5 6
0.15
0.30
0.45
0.60
(a)
E1
(2.1eV)
E2
(3.5eV)
Ab
so
rba
nc
e
Energy (eV)
E3Exciton
(5.9eV)
24nm
2 3 4 5 60.0
0.5
1.0
1.5
2.0
5.0 5.5 6.0 6.5
Ab
so
rba
nc
e
Energy (eV)
3nm
6nm
7nm
8nm
16nm
18nm
24nm
(b)

21
FIGURE 3
Figure 3: (a) De-convoluted Gaussian component of the E3 excitonic line width increases for crystallite sizes
from 24nm to 16nm. Anisotropic exciton-exciton scatterings are responsible for this large inhomogeneous
line width. However, this line width decreases below 16nm, showing that further broadening is ceased for
smaller particles. Maximum possible energy broadening ( Emax) due to the size distribution of these nano-
crystallites is much smaller than both the estimated homogeneous and inhomogeneous widths of the E3
exciton for all sizes. (b) This shows monotonic blue shifts of E3 excitonic spectra ( = E + 5.3eV) with
decreasing mean crystallite diameter of PbS nanoparticles. No single power law behavior can describe the
variation for all sizes. The size dependence of the energy position of peak absorbance is
also very much slower than 1/R2
behavior.
0 5 10 15 20 25
0.0
0.1
0.2
0.3
0.4 (a)
=7
=17
Gaussian
Bro
ad
en
ing
wid
th(e
V)
Diameter (nm)
5 10 15 20 25
6.0
6.1
6.2
6.3
Diameter(nm)En
erg
y @
Pe
ak
Ab
so
rba
nc
e (
eV
)
(b)
y=a x
= -0.053
= -0.076

22
FIGURE 4
Figure 4 : This plot demonstrates the comparison of exciton mean free path values calculated using ε = 17 and
ε = 7. In case of ε =17, the calculated mean free path for exciton-exciton scattering event is >30nm. In that
case, any impact ionization is not possible in any PbS nanoparticles under our investigation due to the ballistic
nature of the exciton scattering. The solid lines are just a guide to the eye only.
0 5 10 15 20 25
15
20
25
30
3540
Me
an
fre
e p
ath
(n
m)
Diameter (nm)
~ 17
~ 7

23
FIGURE 5
Figure 5: Aqueous dispersion of PbS nanoparticles were not sonicated and deliberately allowed to age to get
better physical insights of the spectral origin of E3 exciton. (a) Aging behavior of room temperature
absorption spectra of uncapped PbS nano-crystallites with mean diameter of 24nm. The variation of
absorbance of E3 exciton is characteristically opposite to the portion of the spectra at photon energies lower
than 5eV. The abrupt changes between 3eV to 4eV are due to instrumental artifacts for lamp changes etc at
small absorbance. This artifact is absent in similar samples having large absorbance due to higher
concentration (figure 7a) of the PbS nano-crystallites. (b) Aging of TG capped PbS nano-crystallites of mean
diameter 16nm. Evidently we see qualitatively similar kind of sharpening of E3 excitonic peak with aging. (c)
The absorption spectra for strongly confined PbS nano-particle with mean diameter 3 nm hardly changes
with aging as compared to that of figure 5a and 5b.
2 3 4 5 6
0.02
0.04
0.06
0.08 (a)
Ab
so
rba
nc
e
Energy (eV)
Fresh
50 mins
100 mins
200 mins
400 mins
12 hrs
24nm
2 3 4 5 60.0
0.5
1.0
1.5
2.0
16nm
(b)
Ab
so
rba
nc
e
Energy (eV)
Fresh
100 mins
150 mins
250 mins
450 mins
12 hrs
2 3 4 5 60
1
2
3
4(c)
Ab
so
rba
nc
e
Energy (eV)
Fresh
1 hr
2 hrs
4 hrs
5 hrs
24 hrs
3 nm

24
FIGURE 6
Figure 6: (a) This shows DLS results of 16nm PbS nano-crystallites during different stages of aging. These
nano-crystallites agglomerate and the hydrodynamic size increase to around a micron. (b) This shows
Transmission Electron Microscopy (TEM) image which reveals the presence of granular agglomerate of ≤
20nm PbS nano-crystallites. Samples are not sonicated deliberately to preserve the agglomerate structure.
This clearly says that aging did not increase the crystallite size for bigger nano-crystallites.
10 100 1000Particle size (nm)
fresh
Siz
e D
istr
ibu
tio
n %
(a) 16nm
1hr
2hrs
3hrs
5hrs
24 hrs

25
FIGURE 7
Figure 7: (a) Temperature variation of uncapped PbS nano-crystallite with mean diameter of 24nm. The E3
bulk edge (~5.3 eV) appears at the expense of E3 exciton and „coexist‟ for temperatures >80 C. E3 excitonic
feature nearly vanishes by 100 C but reversibly recovers around 20 C during cooling. (b) Almost similar but
less pronounced spectral changes with temperature are also observed for 16nm PbS during cooling. (c) 3 nm
PbS shows relative less temperature dependence upto 30 C. The arrows indicate the direction of temperature
variation in all three graphs.
2 3 4 5 60.0
0.2
0.4
0.6
0.8
1.0
1.2 (a)
E3 Bulk edge
E3 Exciton
Ab
so
rba
nc
e
Energy (eV)
20 oC
60 oC
80 oC
90 oC
95 oC
100 oC
20 oC
cooling
24nm
2 3 4 5 60.0
0.3
0.6
0.9
1.2
1.5
1.8
Ab
so
rba
nc
e
Energy (eV)
20oC
60oC
80oC
100oC
20oC cooling
(b)
16 nm
2 3 4 5 60.0
0.5
1.0
1.5
2.0
2.5
3.0
Ab
so
rba
nc
e
Energy (eV)
20o C
25o C
30o C
20o C Cooling
(c)
3nm

26
TABLE I.
Samples ; Nano-Crystallite
Diameter (nm)
Exciton Binding Energy
EEx (eV)
assuming ε = 17
Exciton Binding Energy
EEx (eV)
assuming ε = 7
NO TG PbS ; 24 nm 0.013 0.030
20 TG PbS ; 18 nm 0.017 0.040
40 TG PbS ; 16 nm 0.020 0.045
60 TG PbS ; 8 nm 0.038 0.090
80 TG PbS ; 7 nm 0.044 0.103
100 TG PbS ; 6 nm 0.051 0.120
120 TG PbS ; 3 nm 0.102 0.240

27
Acknowledgements: Authors want to thank Dept. of Science and Technology, India for DST Nano
Unit grant SR/NM/NS-42/2009 and IISER-Pune for their support. We thank National Chemical Laboratory,
India for allowing us to get the TEM image. Authors also wish to thank Dr. Sandip Ghosh, Prof. K. L.
Narasimhan, Dr. G. V. Pavan Kumar, Dr. Harsh Chaturvedi, Dr. Pankaj Mondal, Dr. Shivaprasad Patil for
valuable discussions and Prof. K. N. Ganesh for encouragements and support.

28
References:
1 J. L. Machol, F. W. Wise, R.C. Patel and D.B. Tanner, Phys. Rev. B 48 (4), 2819 (1993).
2 T. D. Krauss and F. W. Wise, Phys. Rev. B 55 (15), 9860 (1997).
3 I. Kang and F. W. Wise, J. Opt. Soc. Am. B 14 (7), 1632 (1997).
4 F. W. Wise, Acc. Chem. Res. 33 (11), 773 (2000).
5 S. Kolodinski and J. Werner, Solar Energy. Mat. And Solar cells 33 (3), 275 (1994).
6 A. J. Nozik, Physica E 14, 115 (2002).
7 W. Schockley and H. J. Queisser, J. Appl. Phys. 32 (3), 510 (1961).
8 R. J. Ellingson, M. C. Beard, J. C. Johnson, P. Yu, O. I. Micic, A. J. Nozik, A. Shabaev and A. L. Efros, Nano Lett.
5 (5), 865 (2005).
9 R. D. Schaller and V. I. Klimov, Phys. Rev. Lett. 92 (18), 186601 (2004); R. D. Schaller, M. Sykora, J. M. Pietryga
and V. I. Klimov, Nano Lett. 6 (3), 424 (2006).
10 M. Califano, A. Zunger and A. Franceschetti, Appl. Phys. Lett. 84 (13), 2409 (2004).
11 M. Califano, A. Zunger and A. Franceschetti, Nano Lett. 4 (3), 525 (2004).
12 J. J. H. Pijpers, R. Ulbricht, K. J. Tielrooij, A. Osherov, Y. Golan, C. Deleure, G. Alla and, M. Bonn, Nature Phys. 5,
811 (2009).
13 C. Deleure, G. Allan, J. J. H. Pijpers and M. Bonn, Phys. Rev. B 81, 125306 (2010).
14 G. Nair, S. M. Geyer, L.-Y. Chang and M. G. Bawendi, Phys. Rev. B 78, 125325 (2008).
15 G. Nair and M. G. Bawendi, Phys. Rev. B 76, 081304R (2007).
16 S. E. Kohn, P. Y. Yu, Y. Petroff, Y. R. Shen, Y. Tsang and M. L. Cohen, Phys. Rev. B 8 (4), 1477 (1973).
17 H. Kanazawa and S. Adachi, J. Appl. Phys. 83 (11), 5997 (1998).
18 Yu, P. & Cardona, M. Fundamentals of Semiconductors Ch. 6 (2nd edition, Springer, 1999).
19 B. R. Hyun, A.C. Bartnik, J. K. Lee, H. Imoto, L. Sun, J. J. Choi, Y. Chujo, T. Hanrath, C. K. Ober and F. W. Wise,
Nano Lett. 10, 318 (2010).
20 A. I. Ekimov, F. Hache, M. C. Schanne-Klein, D. Richard, C. Flytzanis, I. A. Kudeyavtsev, T. V. Yazeva, A. V.
Rodina and Al. L. Efros, J. Opt. Soc. Am. B 10 (1), 100 (1993).
21 M. S. Hybertsen, Phys. Rev. Lett. 72 (10), 1514 (1994).
22 Shouvik Datta and K. L. Narsimhan, Phys. Rev. B 60 (11), 8246 (1999).
23 Y. Wang, A. Suna, W. Mahler and R. Kasowski, J. Chem. Phys. 87 (12), 7315 (1987).
24 A. Franceschetti, Phys. Rev. B 78, 075418 (2008).
25 S. Schmitt-Rink, D. A. B. Miller and D. S. Chemla, Phys Rev. B 35 (15), 8113 (1987).
26 V. I. Klimov J. Phys. Chem. B 104, 6112 (2000).
27 M. Stobbe, R. Redmer and W. Schattke, Phys. Rev. B 49 (7), 4494 (1994).

29
28
L. Tirino, M. Weber, K. F. Brennan, E. Bellotti and M. Goano, J.Appl. Phys. 94 (1), 423 (2003).
29 J. Y. Tang and K. Hess, J. Appl. Phys. 54 (9), 5139 (1983).
30 J. Gavoret, P. Nozieres, B. Roulet and M. Combescot, J. Phys. France 30, 987 (1969).
31 Y. Kobayashi, L. Pan and N. Tamai, J. Phys. Chem. C 113 (27), 11783 (2009).
32 V.I. Klimov, A. A. Mikhailovsky, D. W. McBranch, C. A. Leatherdale and M. G. Bawendi Science 287, 1011
(2000).
33 V. I. Klimov, A. A. Mikhailovsky, S. Xu, A. Malko, J. A. Hollingsworth, C. A. Leatherdale, H.-J. Eisler and M. G.
Bawendi, Science 290, 314 (2000).
34 A. Pandey and P. Guyot-Sionnest, J. Chem. Phys. 127, 111104 (2007).
35 C. R. Bolognesi, M. W. Dvorak and D. H. Chow, IEEE Transaction on electron devices 46 (5), 826 (1999).
36 N. Sano and M. Tomizawa and A. Yoshii, IEEE Transaction on electron devices 42 (12), 2211 (1995).
37 N. S. Waldron, A. J. Pitera, M. L. Lee, E. A. Fitzgerald and J. A. del Alamo, IEEE Transactions on Electron Devices
52 (7), 1627 (2005).
38 G. A. Thomas, A. Frova, J. C. Hensel, R. E. Miller and P. A. Lee, Phys. Rev. B 13 (4), 1692 (1976).
39 Delerue, C.; Lannoo, M.; Nanostrctures – Theory and Modelling, 2008, Chapter 4 (Springer).
40 P. Lugli and D. K. Ferry, Phys. Rev. Lett. 56 (12), 1295 (1986).
41 M. S. Hybersten and S. G. Louie, Phys. Rev. B 34 (8), 5390 (1986).
42 J.-W. Luo, A. Franceschetti and A. Zunger, Nano lett. 8 (10), 3174 (2008).
43 J. R Meyer, and F. J. Bartoli, Phys. Rev B 28 (2), 915 (1983).
44 D. W. Wang, and S. Das Sharma, Phys. Rev B. 64, 195313 (2001).
45 A. L. Rogach, Mat. Sci. and Eng B 69-70, 435 (2000).
46 M. G. Lisachenko, E. A. Konstantinova, P. K. Kashkarov and V. Y. Timoshenko, Phys. Stat. Sol. (a) 182, 297
(2000).
47 C. Delerue, G. Allan and M. Lannoo, Phys. Rev. B 48 (15), 11024 (1993).
48 M. C. Beard, A. G. Midgett, M. Law, O. E. Semonin, R. J. Ellingson and A. J. Nozik, Nano Lett. 9 (2), 836 (2009).
49 S. W. Buckner, R. L. Konold and P. A. Jelliss, Chem. Phys. Lett. 394, 400 (2004).
50 A. Olkhovets, R.-C. Hsu, A. Lipovskii, and F. W. Wise, Phys. Rev. Lett. 81 (16), 3539 (1998).
51 M. Califano, Phys. Chem. 112, 8570 (2008).
52 E. Hendry, M. Koeberg, F. Wang, H. Zhang, C. de M. Donega, D. Vanmaekelbergh and M. Bonn, Phys. Rev. Lett.
96, 057408 (2006).
53 M. Califano, Appl. Phys. Lett. 91, 172114 (2007).
54 A. Piryatinski and K. A. Velizhanin, J. Chem. Phys. 133, 084508 (2010).
55 A. Franceschetti, J. M. An and A. Zunger, Nano Lett. 6 (10), 2191 (2006).

30
56
G. Nootz, L. A. Padilha, L. Levina, V. Sukhovatkin, S. Webster, L. Brzozowski, E. H. Sargent, D. J. Hagan and E.
W. Van Stryland, Phy. Rev. B 83, 155302 (2011).
57 L.Turyanska, U. Elfurawi, M. Li, M. W. Fay, N. R. Thomas, S. Mann, P. C. M. Christianen and A. Patane,
Nanotechnology 20, 315604 (2009).
58 J. A. McGuire, M. Sykora, I. Robel, L. A. Padhilha, J. Joo, J. M. Pietryga and V. I. Klimov, ACS Nano, 4 (10), 6087
(2010).
59 M. Califano, ACS Nano, in press, April 14, 2011. DOI: 10.1021/nn200723g.
60 P. Tyagi and P. Kambhampati, J. Che. Phys. 134, 094706 (2011).
61 Z. Lin, A. Franceschetti and M. T. Lusk, ACS Nano, 5 (4), 2503 (2011).