an efficient approach to control the morphology and the adhesion properties of anodized tio2...
TRANSCRIPT
Aa
WS
a
ARRAA
KTCSAP
1
mtwt[moactwfcsvtet
0d
Electrochimica Acta 56 (2011) 2618–2626
Contents lists available at ScienceDirect
Electrochimica Acta
journa l homepage: www.e lsev ier .com/ locate /e lec tac ta
n efficient approach to control the morphology and the adhesion properties ofnodized TiO2 nanotube arrays for improved photoconversion efficiency
en Zhu ∗, Xi Liu, Huiqiong Liu, Dali Tong, Junyou Yang ∗, Jiangying Pengtate Key Laboratory of Material Processing and Die & Mould Technology, Huazhong University of Science and Technology, Wuhan 430074, People’s Republic of China
r t i c l e i n f o
rticle history:eceived 11 July 2010eceived in revised form 5 November 2010ccepted 5 November 2010vailable online 22 December 2010
eywords:iO2 nanotubes
a b s t r a c t
We investigate an efficient approach to control the surface morphology and the geometrical parameterof TiO2 nanotubes, while improving its adhesion to underlying titanium substrate, which is the key tosuccessful fabrication of electro-optical devices. By controlling the water content and using the previ-ously used electrolyte, nanotube arrays with surface morphology, geometrical parameters and adhesionproperties relevant to required applications can be achieved. On the basis of these results, a mechanismof chemical dissolution rate is discussed in detail, in particular, with respect to the variation of nanotubelength, presence of surface aggregation on the top surface, and the adhesion of nanotubes to underly-
hemical dissolution rateurface morphologydhesion propertieshotoconversion efficiency
ing titanium substrate. It is found that the enhanced chemical dissolution rate can help to dissolve offthe surface aggregation parts and reduce the internal stress at the barrier layer–metal interface. As aresult this adhesion characteristic between the nanotubes and the underlying metal layer can be signifi-cantly improved. The contrastive photoelectrochemical experiments suggested that the photoconversionefficiency greatly depends on the geometric roughness factor of nanotubes and its adhesion to underly-ing metal layer. It shows that the 3.0% water content in previously used electrolytes has a combinativeadvantage to meet the optimal condition of photoconversion efficiency.
. Introduction
Vertically oriented TiO2 nanotube arrays are becoming more andore attractive for their potential versatile application in optoelec-
ronic and biomedical fields [1], such as generation of hydrogen byater photoelectrolysis [2–11], photocatalyst [12–14], heterojunc-
ion solar cells [15–27], room-temperature hydrogen gas sensing28,29], biomedical application [30–35], and so on. The perfor-
ance of such devices is determined by the geometrical parametersf the nanotube arrays including shape, wall thickness, pore size,nd length [36]. The large surface to volume ratio and excellentharge-transfer properties of TiO2 nanotubes remarkably enhanceheir performance [37]. As initially reported by Gong and co-orkers in 2001 [38], the first generation titania nanotube arrays
abricated by anodization using an aqueous HF based electrolyteould be grown to a length of about 500 nm. Grimes et al. [39] firsthowed that well-ordered nanotube arrays with large surface to
olume ratio can be obtained using fluoride-ion-containing neu-ral nonaqueous electrolytes such as ethylene glycol. The use ofthylene glycol solvent may increase the nanotube growth rateo over 10 �m/h [40]. Paulose et al. [41] demonstrated the pos-∗ Corresponding authors. Tel.: +86 27 87558310; fax: +86 27 87558310.E-mail address: [email protected] (W. Zhu).
013-4686/$ – see front matter © 2010 Elsevier Ltd. All rights reserved.oi:10.1016/j.electacta.2010.11.012
© 2010 Elsevier Ltd. All rights reserved.
sibility of increasing the nanotube length up to 1 mm after thecomplete anodization of a 1 mm thick Ti foil film sample forbiofiltration application [42]. They reported that achieving longnanotube arrays not only requires long anodization duration butalso requires increasing concentrations of NH4F and H2O in theoptimum electrolyte composition range. Recently, a new book,written by leading researchers in the field, provided an overviewto TiO2 nanotube arrays, as well as a description of the materialproperties and distillation of the current research [1]. For example,Grimes has developed the two-step fabrication process [43] androom temperature one-step polyol fabrication process [44] usedto directly synthesize crystalline TiO2-nanotube arrays, which canbe used in combination with flexible polymeric substrates as wellas other temperature-sensitive substrates intended for semicon-ductor devices. Misra has combined the efficient TiO2 nanotubeconfiguration with metal mesh to form flexible dye-sensitizedsolar cells [45,46]. Kamat has converted TiO2 nanotube arrays intoTiO2–SrTiO3 heterostructure by controlled substitution of Sr forimproving their photoelectrochemical performance [47]. His grouprecently demonstrated lithium ions intercalation into TiO2 nan-
otube arrays can also boost the photoelectrochemical performance[48]. Moreover, Macak et al. [49] and John et al. [50] synthesizedthe double-layered and the double-walled TiO2 nanotube arrays forwater photoelectrolysis, respectively. However, for those electro-optical devices, the surface morphology of TiO2 nanotubes and its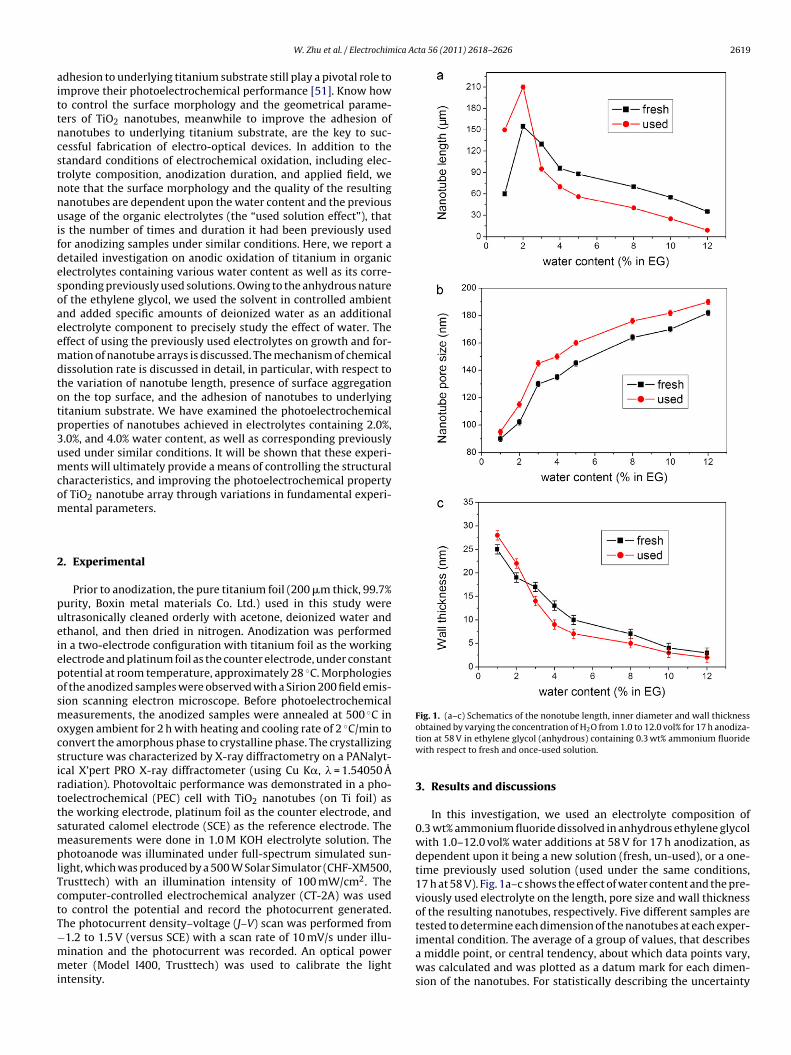
ica Acta 56 (2011) 2618–2626 2619
aittncstnnuifdesoaeemdtotp3umcom
2
pueieposmocsirttsmplTctT−mmi
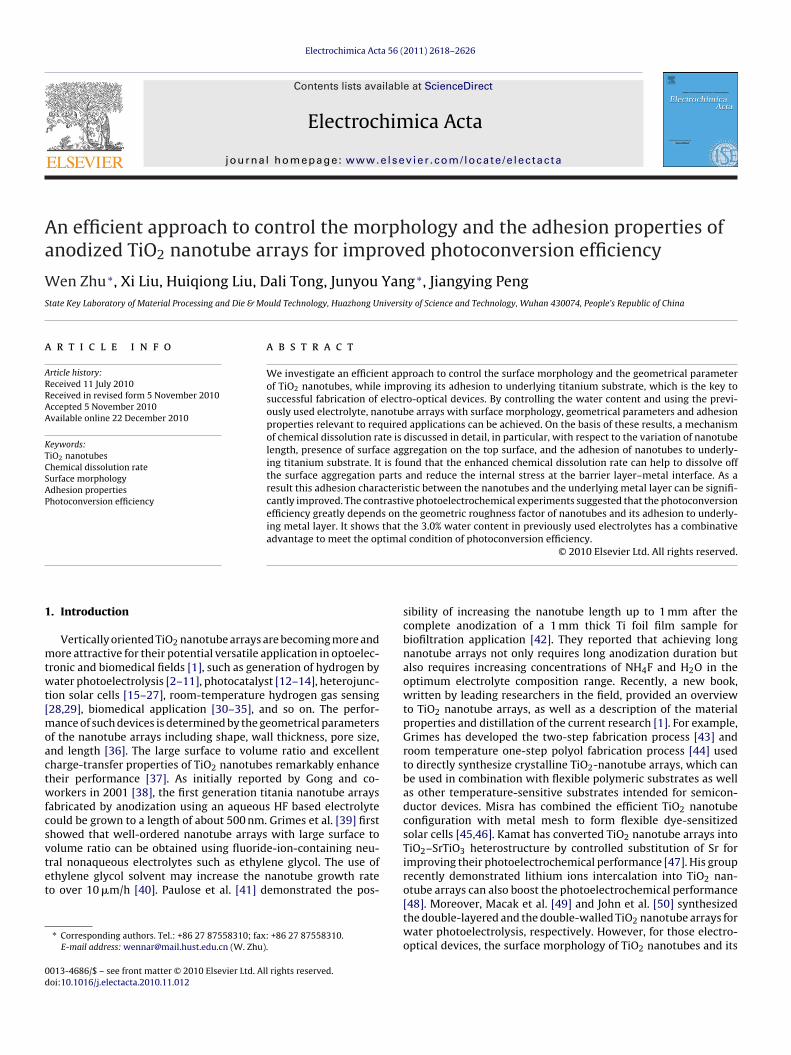
Fig. 1. (a–c) Schematics of the nonotube length, inner diameter and wall thickness
W. Zhu et al. / Electrochim
dhesion to underlying titanium substrate still play a pivotal role tomprove their photoelectrochemical performance [51]. Know howo control the surface morphology and the geometrical parame-ers of TiO2 nanotubes, meanwhile to improve the adhesion ofanotubes to underlying titanium substrate, are the key to suc-essful fabrication of electro-optical devices. In addition to thetandard conditions of electrochemical oxidation, including elec-rolyte composition, anodization duration, and applied field, weote that the surface morphology and the quality of the resultinganotubes are dependent upon the water content and the previoussage of the organic electrolytes (the “used solution effect”), that
s the number of times and duration it had been previously usedor anodizing samples under similar conditions. Here, we report aetailed investigation on anodic oxidation of titanium in organiclectrolytes containing various water content as well as its corre-ponding previously used solutions. Owing to the anhydrous naturef the ethylene glycol, we used the solvent in controlled ambientnd added specific amounts of deionized water as an additionallectrolyte component to precisely study the effect of water. Theffect of using the previously used electrolytes on growth and for-ation of nanotube arrays is discussed. The mechanism of chemical
issolution rate is discussed in detail, in particular, with respect tohe variation of nanotube length, presence of surface aggregationn the top surface, and the adhesion of nanotubes to underlyingitanium substrate. We have examined the photoelectrochemicalroperties of nanotubes achieved in electrolytes containing 2.0%,.0%, and 4.0% water content, as well as corresponding previouslysed under similar conditions. It will be shown that these experi-ents will ultimately provide a means of controlling the structural
haracteristics, and improving the photoelectrochemical propertyf TiO2 nanotube array through variations in fundamental experi-ental parameters.
. Experimental
Prior to anodization, the pure titanium foil (200 �m thick, 99.7%urity, Boxin metal materials Co. Ltd.) used in this study wereltrasonically cleaned orderly with acetone, deionized water andthanol, and then dried in nitrogen. Anodization was performedn a two-electrode configuration with titanium foil as the workinglectrode and platinum foil as the counter electrode, under constantotential at room temperature, approximately 28 ◦C. Morphologiesf the anodized samples were observed with a Sirion 200 field emis-ion scanning electron microscope. Before photoelectrochemicaleasurements, the anodized samples were annealed at 500 ◦C in
xygen ambient for 2 h with heating and cooling rate of 2 ◦C/min toonvert the amorphous phase to crystalline phase. The crystallizingtructure was characterized by X-ray diffractometry on a PANalyt-cal X’pert PRO X-ray diffractometer (using Cu K�, � = 1.54050 Aadiation). Photovoltaic performance was demonstrated in a pho-oelectrochemical (PEC) cell with TiO2 nanotubes (on Ti foil) ashe working electrode, platinum foil as the counter electrode, andaturated calomel electrode (SCE) as the reference electrode. Theeasurements were done in 1.0 M KOH electrolyte solution. The
hotoanode was illuminated under full-spectrum simulated sun-ight, which was produced by a 500 W Solar Simulator (CHF-XM500,rusttech) with an illumination intensity of 100 mW/cm2. Theomputer-controlled electrochemical analyzer (CT-2A) was usedo control the potential and record the photocurrent generated.
he photocurrent density–voltage (J–V) scan was performed from1.2 to 1.5 V (versus SCE) with a scan rate of 10 mV/s under illu-ination and the photocurrent was recorded. An optical powereter (Model I400, Trusttech) was used to calibrate the lightntensity.
obtained by varying the concentration of H2O from 1.0 to 12.0 vol% for 17 h anodiza-tion at 58 V in ethylene glycol (anhydrous) containing 0.3 wt% ammonium fluoridewith respect to fresh and once-used solution.
3. Results and discussions
In this investigation, we used an electrolyte composition of0.3 wt% ammonium fluoride dissolved in anhydrous ethylene glycolwith 1.0–12.0 vol% water additions at 58 V for 17 h anodization, asdependent upon it being a new solution (fresh, un-used), or a one-time previously used solution (used under the same conditions,17 h at 58 V). Fig. 1a–c shows the effect of water content and the pre-viously used electrolyte on the length, pore size and wall thicknessof the resulting nanotubes, respectively. Five different samples aretested to determine each dimension of the nanotubes at each exper-
imental condition. The average of a group of values, that describesa middle point, or central tendency, about which data points vary,was calculated and was plotted as a datum mark for each dimen-sion of the nanotubes. For statistically describing the uncertainty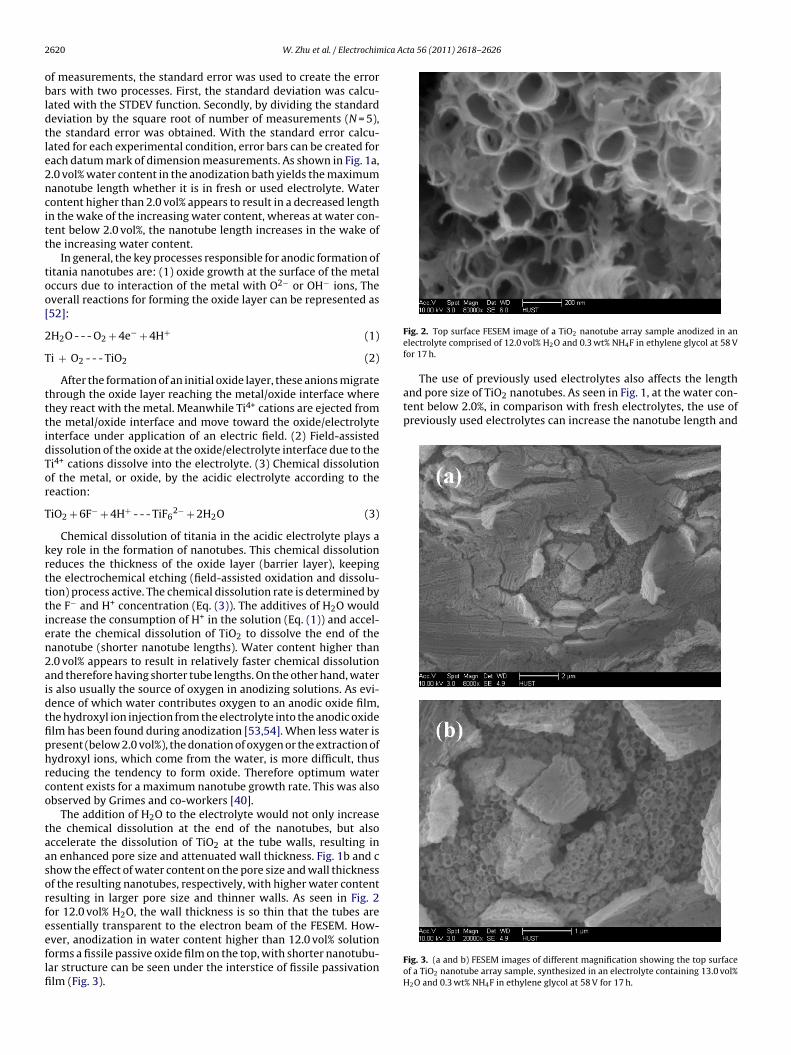
2 ica Acta 56 (2011) 2618–2626
obldtle2ncitt
too[
2
T
tttidTor
T
krtttien2aidtfiphrco
taasorfeeflfi
The use of previously used electrolytes also affects the lengthand pore size of TiO2 nanotubes. As seen in Fig. 1, at the water con-tent below 2.0%, in comparison with fresh electrolytes, the use ofpreviously used electrolytes can increase the nanotube length and
620 W. Zhu et al. / Electrochim
f measurements, the standard error was used to create the errorars with two processes. First, the standard deviation was calcu-
ated with the STDEV function. Secondly, by dividing the standardeviation by the square root of number of measurements (N = 5),he standard error was obtained. With the standard error calcu-ated for each experimental condition, error bars can be created forach datum mark of dimension measurements. As shown in Fig. 1a,.0 vol% water content in the anodization bath yields the maximumanotube length whether it is in fresh or used electrolyte. Waterontent higher than 2.0 vol% appears to result in a decreased lengthn the wake of the increasing water content, whereas at water con-ent below 2.0 vol%, the nanotube length increases in the wake ofhe increasing water content.
In general, the key processes responsible for anodic formation ofitania nanotubes are: (1) oxide growth at the surface of the metalccurs due to interaction of the metal with O2− or OH− ions, Theverall reactions for forming the oxide layer can be represented as52]:
H2O - - - O2 + 4e− + 4H+ (1)
i + O2 - - - TiO2 (2)
After the formation of an initial oxide layer, these anions migratehrough the oxide layer reaching the metal/oxide interface wherehey react with the metal. Meanwhile Ti4+ cations are ejected fromhe metal/oxide interface and move toward the oxide/electrolytenterface under application of an electric field. (2) Field-assistedissolution of the oxide at the oxide/electrolyte interface due to thei4+ cations dissolve into the electrolyte. (3) Chemical dissolutionf the metal, or oxide, by the acidic electrolyte according to theeaction:
iO2 + 6F− + 4H+ - - - TiF62− + 2H2O (3)
Chemical dissolution of titania in the acidic electrolyte plays aey role in the formation of nanotubes. This chemical dissolutioneduces the thickness of the oxide layer (barrier layer), keepinghe electrochemical etching (field-assisted oxidation and dissolu-ion) process active. The chemical dissolution rate is determined byhe F− and H+ concentration (Eq. (3)). The additives of H2O wouldncrease the consumption of H+ in the solution (Eq. (1)) and accel-rate the chemical dissolution of TiO2 to dissolve the end of theanotube (shorter nanotube lengths). Water content higher than.0 vol% appears to result in relatively faster chemical dissolutionnd therefore having shorter tube lengths. On the other hand, waters also usually the source of oxygen in anodizing solutions. As evi-ence of which water contributes oxygen to an anodic oxide film,he hydroxyl ion injection from the electrolyte into the anodic oxidelm has been found during anodization [53,54]. When less water isresent (below 2.0 vol%), the donation of oxygen or the extraction ofydroxyl ions, which come from the water, is more difficult, thuseducing the tendency to form oxide. Therefore optimum waterontent exists for a maximum nanotube growth rate. This was alsobserved by Grimes and co-workers [40].
The addition of H2O to the electrolyte would not only increasehe chemical dissolution at the end of the nanotubes, but alsoccelerate the dissolution of TiO2 at the tube walls, resulting inn enhanced pore size and attenuated wall thickness. Fig. 1b and chow the effect of water content on the pore size and wall thicknessf the resulting nanotubes, respectively, with higher water contentesulting in larger pore size and thinner walls. As seen in Fig. 2or 12.0 vol% H2O, the wall thickness is so thin that the tubes are
ssentially transparent to the electron beam of the FESEM. How-ver, anodization in water content higher than 12.0 vol% solutionorms a fissile passive oxide film on the top, with shorter nanotubu-ar structure can be seen under the interstice of fissile passivationlm (Fig. 3).Fig. 2. Top surface FESEM image of a TiO2 nanotube array sample anodized in anelectrolyte comprised of 12.0 vol% H2O and 0.3 wt% NH4F in ethylene glycol at 58 Vfor 17 h.
Fig. 3. (a and b) FESEM images of different magnification showing the top surfaceof a TiO2 nanotube array sample, synthesized in an electrolyte containing 13.0 vol%H2O and 0.3 wt% NH4F in ethylene glycol at 58 V for 17 h.
ica Acta 56 (2011) 2618–2626 2621
stfdcHpeidofwamppeidrntptafitactuneaslelcaiadsr
os2tgtmfoadiaoctt
e
W. Zhu et al. / Electrochim
lightly widen the wall thickness. With the repeated use of elec-rolytes, an amount of water can be absorbed by the electrolyterom the ambient due to the hygroscopic nature of ethylene glycoluring longer anodization, which also should increase the chemi-al dissolution rate, resulting in the decrease of nanotube length.owever, the conductivity of the electrolytes, in this case, mustlay a role in controlling the growth of nanotube arrays. The usedlectrolytes usually have a higher conductivity because of chem-cal and field assisted dissolution of titanium into the electrolyteuring the first time anodization. For instance, the conductivityf previously used electrolyte of 1.0 vol% H2O in ethylene glycolor 58 V 17 h anodization, is approximately 545 �S/cm comparedith 383 �S/cm in fresh electrolyte. As we known, the total applied
nodization voltage is the sum of the potential difference at theetal–oxide interface, the potential drop across the oxide, the
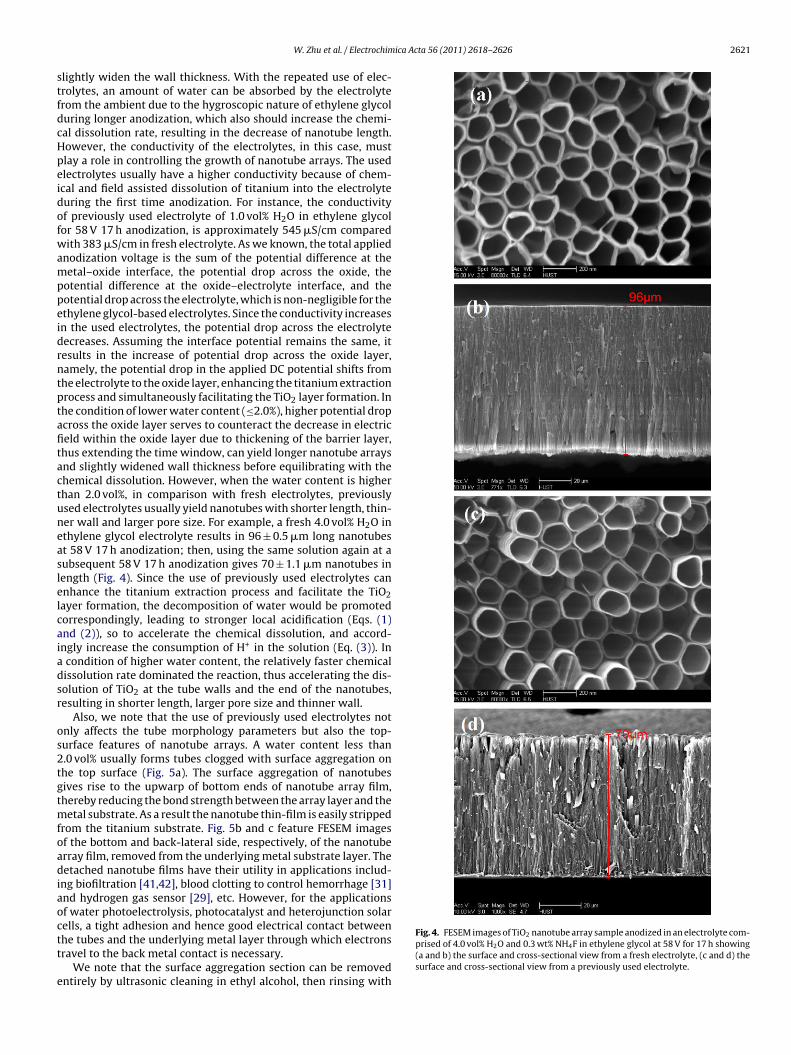
otential difference at the oxide–electrolyte interface, and theotential drop across the electrolyte, which is non-negligible for thethylene glycol-based electrolytes. Since the conductivity increasesn the used electrolytes, the potential drop across the electrolyteecreases. Assuming the interface potential remains the same, itesults in the increase of potential drop across the oxide layer,amely, the potential drop in the applied DC potential shifts fromhe electrolyte to the oxide layer, enhancing the titanium extractionrocess and simultaneously facilitating the TiO2 layer formation. Inhe condition of lower water content (≤2.0%), higher potential dropcross the oxide layer serves to counteract the decrease in electriceld within the oxide layer due to thickening of the barrier layer,hus extending the time window, can yield longer nanotube arraysnd slightly widened wall thickness before equilibrating with thehemical dissolution. However, when the water content is higherhan 2.0 vol%, in comparison with fresh electrolytes, previouslysed electrolytes usually yield nanotubes with shorter length, thin-er wall and larger pore size. For example, a fresh 4.0 vol% H2O inthylene glycol electrolyte results in 96 ± 0.5 �m long nanotubest 58 V 17 h anodization; then, using the same solution again at aubsequent 58 V 17 h anodization gives 70 ± 1.1 �m nanotubes inength (Fig. 4). Since the use of previously used electrolytes cannhance the titanium extraction process and facilitate the TiO2ayer formation, the decomposition of water would be promotedorrespondingly, leading to stronger local acidification (Eqs. (1)nd (2)), so to accelerate the chemical dissolution, and accord-ngly increase the consumption of H+ in the solution (Eq. (3)). Incondition of higher water content, the relatively faster chemicalissolution rate dominated the reaction, thus accelerating the dis-olution of TiO2 at the tube walls and the end of the nanotubes,esulting in shorter length, larger pore size and thinner wall.
Also, we note that the use of previously used electrolytes notnly affects the tube morphology parameters but also the top-urface features of nanotube arrays. A water content less than.0 vol% usually forms tubes clogged with surface aggregation onhe top surface (Fig. 5a). The surface aggregation of nanotubesives rise to the upwarp of bottom ends of nanotube array film,hereby reducing the bond strength between the array layer and the
etal substrate. As a result the nanotube thin-film is easily strippedrom the titanium substrate. Fig. 5b and c feature FESEM imagesf the bottom and back-lateral side, respectively, of the nanotuberray film, removed from the underlying metal substrate layer. Theetached nanotube films have their utility in applications includ-
ng biofiltration [41,42], blood clotting to control hemorrhage [31]nd hydrogen gas sensor [29], etc. However, for the applicationsf water photoelectrolysis, photocatalyst and heterojunction solar
ells, a tight adhesion and hence good electrical contact betweenhe tubes and the underlying metal layer through which electronsravel to the back metal contact is necessary.We note that the surface aggregation section can be removedntirely by ultrasonic cleaning in ethyl alcohol, then rinsing with
Fig. 4. FESEM images of TiO2 nanotube array sample anodized in an electrolyte com-prised of 4.0 vol% H2O and 0.3 wt% NH4F in ethylene glycol at 58 V for 17 h showing(a and b) the surface and cross-sectional view from a fresh electrolyte, (c and d) thesurface and cross-sectional view from a previously used electrolyte.

2622 W. Zhu et al. / Electrochimica Acta 56 (2011) 2618–2626
Fig. 5. FESEM images of a TiO2 nanotube array sample grown from a fresh electrolytecontaining 2.0 vol% H O + 0.3 wt% NH F in ethylene glycol for 17 h at 58 V. (a) Topsln
dntatn
Fig. 6. FESEM images of a TiO2 nanotube array sample made by ultrasonic agitationin ethyl alcohol from a fresh electrolyte (2.0% H O, 58 V, 17 h). (a) The top surface
2 4
urface image; (b) tube bottom view image, removed from the underlying metalayer; (c) back side or back-lateral side of nanotube array film showing its tubularature.
ouble distilled water. Fig. 6a shows the top surface view of titaniaanotube formed in a fresh electrolyte just after ultrasonic agita-
ion of approximately 25 s duration in ethyl alcohol. The surfaceggregation section has been broken off by ultrasonic agitation;he resulting a few of residual fragments remain on the surface ofanotube-array. These surface residual fragments can be removed2
view of titania nanotube just after ultrasonic agitation; (b) the undefiled top surfaceimage of titania nanotube, rinsed with twice-distilled water to remove the surfaceresidual fragment.
by rinsing with double distilled water. Fig. 6b shows the undefiledtop surface image of titania nanotube after rinsing with twice-distilled water. The results show that the clean, regular and highlyordered nanotube arrays surface can be obtained with an optimalultrasonic duration 20–30 s.
Nanotubes obtained from used electrolytes do not suffer fromaggregation, having open, unclogged pores. Fig. 7 shows FESEMimages of a sample fabricated from a previously used electrolyte at58 V for 17 h, in the ethylene glycol electrolyte containing 2.0 vol%H2O; noting the disappearance of the surface aggregation sectionin comparison with Fig. 5a using the fresh electrolytes.
The most important advantage offered by the use of used elec-trolytes was greatly improved adhesion between the nanotubesand the underlying metal substrate. While the exact mechanism bywhich previously used electrolytes improve the adhesion charac-teristic is not well understood, however, we may rationally deducethe possible effective factor. It is believed that the enhanced chem-ical dissolution rate in the used electrolytes is the main reason.First, an enhanced chemical dissolution rate will help to dissolve offthe surface aggregation parts, reduce the upturned tension of bot-
tom ends of nanotube array film, thereby improving the adhesionbetween the nanotubes and the metal layer. Second, the enhancedchemical dissolution rate in the used electrolytes can help to reducethe internal stress at the barrier layer–metal interface. The inter-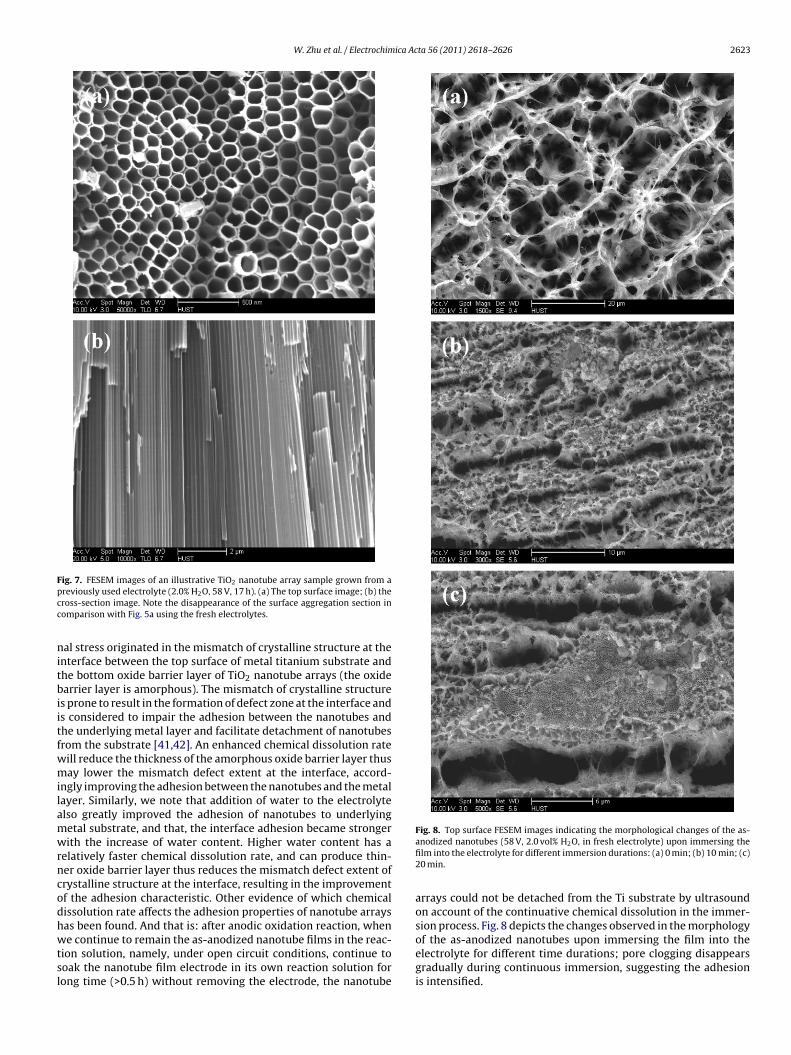
W. Zhu et al. / Electrochimica Acta 56 (2011) 2618–2626 2623
Fpcc
nitbiitfwmilamwrncodhwtsl
ig. 7. FESEM images of an illustrative TiO2 nanotube array sample grown from areviously used electrolyte (2.0% H2O, 58 V, 17 h). (a) The top surface image; (b) theross-section image. Note the disappearance of the surface aggregation section inomparison with Fig. 5a using the fresh electrolytes.
al stress originated in the mismatch of crystalline structure at thenterface between the top surface of metal titanium substrate andhe bottom oxide barrier layer of TiO2 nanotube arrays (the oxidearrier layer is amorphous). The mismatch of crystalline structure
s prone to result in the formation of defect zone at the interface ands considered to impair the adhesion between the nanotubes andhe underlying metal layer and facilitate detachment of nanotubesrom the substrate [41,42]. An enhanced chemical dissolution rateill reduce the thickness of the amorphous oxide barrier layer thusay lower the mismatch defect extent at the interface, accord-
ngly improving the adhesion between the nanotubes and the metalayer. Similarly, we note that addition of water to the electrolytelso greatly improved the adhesion of nanotubes to underlyingetal substrate, and that, the interface adhesion became strongerith the increase of water content. Higher water content has a
elatively faster chemical dissolution rate, and can produce thin-er oxide barrier layer thus reduces the mismatch defect extent ofrystalline structure at the interface, resulting in the improvementf the adhesion characteristic. Other evidence of which chemicalissolution rate affects the adhesion properties of nanotube arrays
as been found. And that is: after anodic oxidation reaction, whene continue to remain the as-anodized nanotube films in the reac-ion solution, namely, under open circuit conditions, continue tooak the nanotube film electrode in its own reaction solution forong time (>0.5 h) without removing the electrode, the nanotube
Fig. 8. Top surface FESEM images indicating the morphological changes of the as-anodized nanotubes (58 V, 2.0 vol% H2O, in fresh electrolyte) upon immersing thefilm into the electrolyte for different immersion durations: (a) 0 min; (b) 10 min; (c)20 min.
arrays could not be detached from the Ti substrate by ultrasoundon account of the continuative chemical dissolution in the immer-sion process. Fig. 8 depicts the changes observed in the morphology
of the as-anodized nanotubes upon immersing the film into theelectrolyte for different time durations; pore clogging disappearsgradually during continuous immersion, suggesting the adhesionis intensified.
2624 W. Zhu et al. / Electrochimica Acta 56 (2011) 2618–2626
Fwvm
bcciHctcisvstatctr
satiwdHcfogpvd(cwtFteogras
Fig. 10. Top surface FESEM images indicating the morphological changes of the
ig. 9. Schematic drawing of a variety of pH value of reaction solution with differentater content and corresponding previously used under similar conditions. The pH
alue was measured when the reaction solution was magnetic-stirred for 5 min toix well after each anodic oxidation reaction.
According to Eq. (3), the chemical dissolution rate is determinedy the F− and H+ concentration. In our experimental system, F− con-entration can be approximately considered as constant, so the H+
oncentration changes would be the main factor to affect the chem-cal dissolution rate. The chemical dissolution needs to consume the
+, therefore, the pH value of reaction solution to a certain extent,ould be detected to reflect the chemical dissolution rate. Fig. 9 fea-ures a variety of pH value of reaction solution with different waterontent and corresponding previously used electrolyte under sim-lar conditions. After each anodic oxidation reaction, the reactionolution was magnetic-stirred for 5 min to mix well, and the pHalue was measured. As seen in Fig. 9, the pH value of reactionolution increases gently in the wake of the increasing water con-ent, while the pH value of reaction solution with used electrolytelso slightly larger than that with fresh electrolyte. This is consis-ent with our previous analysis, namely, both an increase of waterontent and the use of previously used electrolyte could increasehe chemical dissolution rate, accelerated the consumption of H+,esulting in a slight raise of pH value in the reaction solution.
However, it can be found from Fig. 9, the pH value did not changeignificantly after each reaction even though the changes followcertain rule. The reason for this should be related with the fact
hat the chemical dissolution is a local dynamic process. Accord-ng to Eqs. (1) and (2), H+ is produced at some specific locations,
here the oxidation and hydrolysis of elemental titanium occurue to self-induced local acidification [1,40,55]. It suggests that the+ concentration changes, which have an important effect on thehemical dissolution rate, occur at some specific locations, namely,ollowing a local acidification mechanism. The chemical dissolutionf TiO2, as is clear in Eq. (3), is largely depended on the local pHradient, which is established by the local acidification at both theore bottom and the sidewall of nanotubes. However, the local pHalue is difficult to measure quantitatively, because it is a developedynamic process where H+ is constantly produced (according to Eq.1)), and has kept consumption (according to Eq. (3)). Although weannot quantitatively measure the local chemical dissolution rate,e could still change some experimental conditions to investigate
he possible influence characteristics of the chemical dissolution.or that, a contrastive experiment of the continuous stirring of elec-rolytes with the stock-still condition was designed to illustrate theffect of related chemical dissolution process on the morphologies
f nanotubes. An intense stirring process may change the local pHradient, and therefore could alter the local chemical dissolutionate in some corresponding sites. When the nanotubes grew undercontinuous stirring condition, H+ ions became less available atome locations, and the chemical dissolution rate of the TiO2 was
as-anodized nanotubes with different diffusion condition (58 V, 3.0 vol% H2O, inpreviously used electrolyte): (a) nanotubes grown with continuous stirring; (b)nanotubes obtained from stock-still electrolyte.
accordingly lowered, resulting in the variety in the morphologicalparameters of TiO2 nanotubes. As shown in Fig. 10, tubes grownwith continuous stirring have relatively thicker walls, are muchasymmetrical, and have pore sizes of about 90–120 nm and tubelength of 110 ± 1.5 �m compared with 143.2 ± 1.8 nm pore size and94.8 ± 1.2 �m tube length for nanotubes obtained from stock-stillelectrolytes. We also have found that the fabricated nanotubes withcontinuous stirring have a weaker adhesion to the underlying metalsubstrate layer relative to that from stock-still electrolytes.
Photoelectrochemical Properties. The weak adhesion of theless water (≤1.0%) fabricated nanotubes to the underlying metallayer and low tube-to-tube adhesion always result in catastroph-ical curling into a fragmented membrane pieces after dryingthoroughly in air, making them difficult to measure the photo-electrochemical properties. In addition, the water content morethan 5.0% yields shorter nanotube length, and therefore havinga lower photoelectrochemical property. Herein we examine thephotoelectrochemical properties of nanotubes achieved in elec-trolytes containing 2.0%, 3.0%, and 4.0% water content, as well ascorresponding previously used under similar conditions. For pho-toelectrochemical measurements, these as-anodized amorphous
simples are crystallized via annealing treatment at 500 ◦C in oxy-gen ambient for 2 h. Fig. 11a shows XRD of an annealed nanotubesample fabricated in 2.0% water content electrolyte exhibiting onlythe anatase peaks. An identical XRD spectrum is obtained for any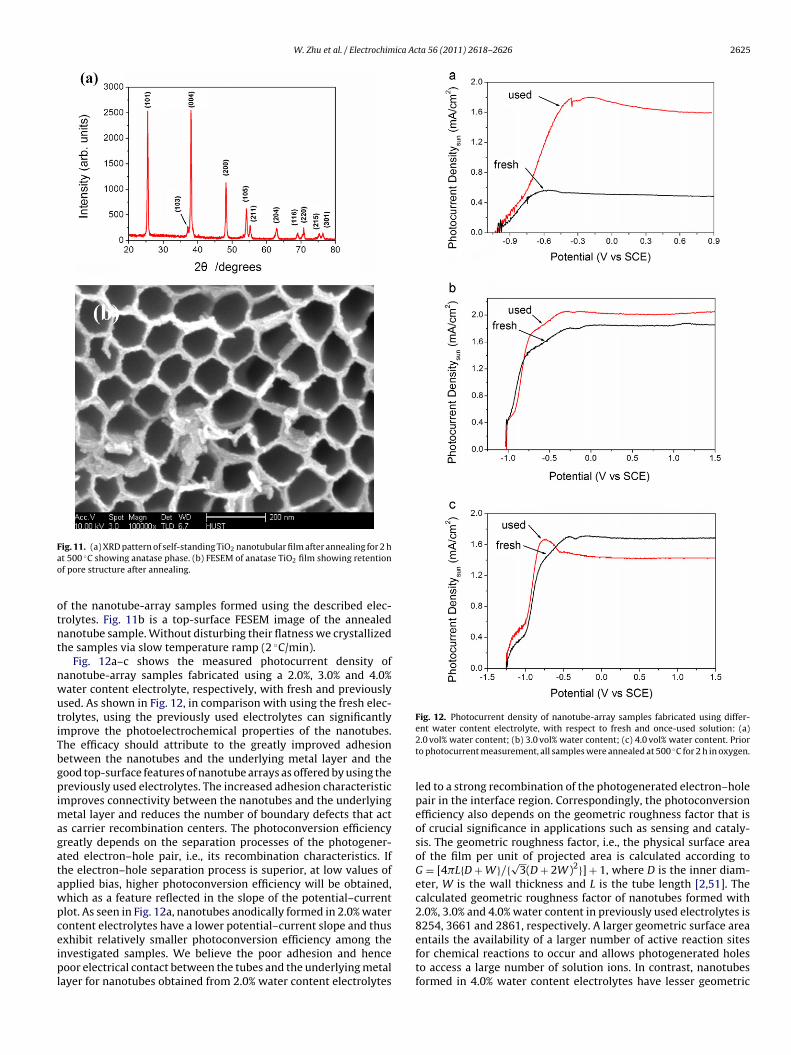
W. Zhu et al. / Electrochimica Acta 56 (2011) 2618–2626 2625
Fao
otnt
nwutiTbgpimagatawpceipl
ig. 11. (a) XRD pattern of self-standing TiO2 nanotubular film after annealing for 2 ht 500 ◦C showing anatase phase. (b) FESEM of anatase TiO2 film showing retentionf pore structure after annealing.
f the nanotube-array samples formed using the described elec-rolytes. Fig. 11b is a top-surface FESEM image of the annealedanotube sample. Without disturbing their flatness we crystallizedhe samples via slow temperature ramp (2 ◦C/min).
Fig. 12a–c shows the measured photocurrent density ofanotube-array samples fabricated using a 2.0%, 3.0% and 4.0%ater content electrolyte, respectively, with fresh and previouslysed. As shown in Fig. 12, in comparison with using the fresh elec-rolytes, using the previously used electrolytes can significantlymprove the photoelectrochemical properties of the nanotubes.he efficacy should attribute to the greatly improved adhesionetween the nanotubes and the underlying metal layer and theood top-surface features of nanotube arrays as offered by using thereviously used electrolytes. The increased adhesion characteristic
mproves connectivity between the nanotubes and the underlyingetal layer and reduces the number of boundary defects that act
s carrier recombination centers. The photoconversion efficiencyreatly depends on the separation processes of the photogener-ted electron–hole pair, i.e., its recombination characteristics. Ifhe electron–hole separation process is superior, at low values ofpplied bias, higher photoconversion efficiency will be obtained,hich as a feature reflected in the slope of the potential–currentlot. As seen in Fig. 12a, nanotubes anodically formed in 2.0% waterontent electrolytes have a lower potential–current slope and thus
xhibit relatively smaller photoconversion efficiency among thenvestigated samples. We believe the poor adhesion and henceoor electrical contact between the tubes and the underlying metalayer for nanotubes obtained from 2.0% water content electrolytes
Fig. 12. Photocurrent density of nanotube-array samples fabricated using differ-ent water content electrolyte, with respect to fresh and once-used solution: (a)2.0 vol% water content; (b) 3.0 vol% water content; (c) 4.0 vol% water content. Priorto photocurrent measurement, all samples were annealed at 500 ◦C for 2 h in oxygen.
led to a strong recombination of the photogenerated electron–holepair in the interface region. Correspondingly, the photoconversionefficiency also depends on the geometric roughness factor that isof crucial significance in applications such as sensing and cataly-sis. The geometric roughness factor, i.e., the physical surface areaof the film per unit of projected area is calculated according toG = [4�L{D + W}/{
√3(D + 2W)2}] + 1, where D is the inner diam-
eter, W is the wall thickness and L is the tube length [2,51]. Thecalculated geometric roughness factor of nanotubes formed with2.0%, 3.0% and 4.0% water content in previously used electrolytes is8254, 3661 and 2861, respectively. A larger geometric surface area
entails the availability of a larger number of active reaction sitesfor chemical reactions to occur and allows photogenerated holesto access a large number of solution ions. In contrast, nanotubesformed in 4.0% water content electrolytes have lesser geometric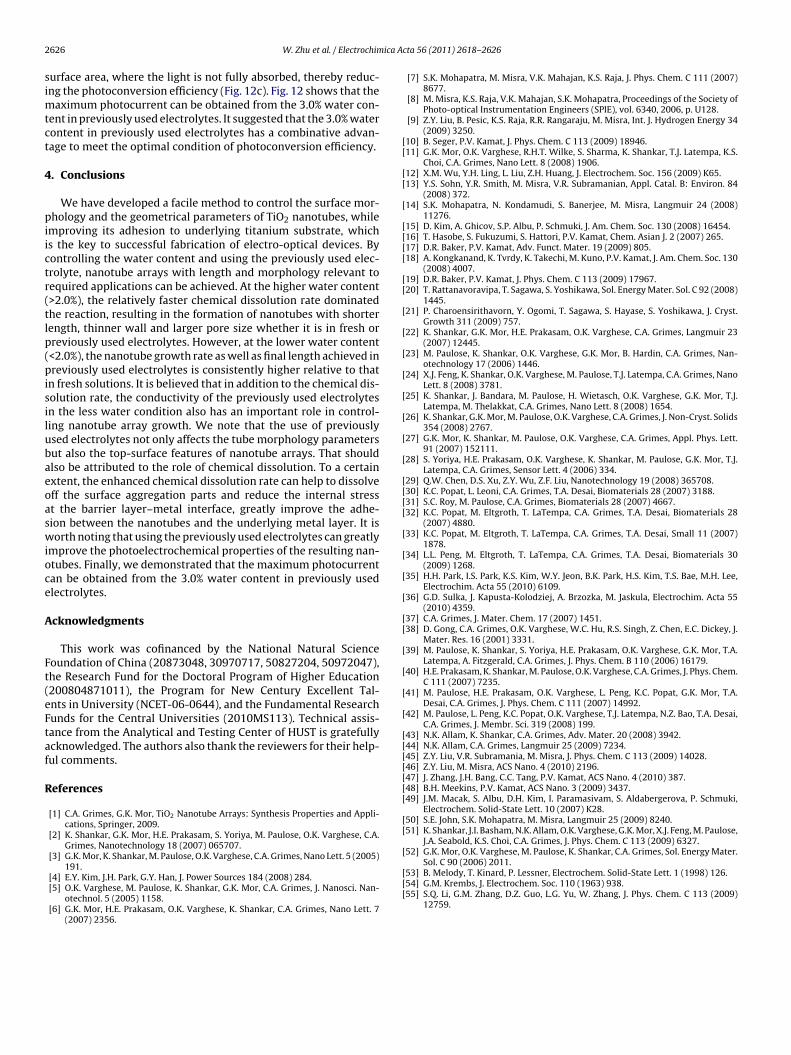
2 ica Ac
simtct
4
piictr(tlp(pisilubaeoaswioce
A
Ft(eFtaf
R
[[
[[
[
[[[[
[[
[
[
[
[
[
[
[
[
[[[[
[
[
[
[
[[
[
[
[
[
[[[[[[[
[[
[52] G.K. Mor, O.K. Varghese, M. Paulose, K. Shankar, C.A. Grimes, Sol. Energy Mater.
626 W. Zhu et al. / Electrochim
urface area, where the light is not fully absorbed, thereby reduc-ng the photoconversion efficiency (Fig. 12c). Fig. 12 shows that the
aximum photocurrent can be obtained from the 3.0% water con-ent in previously used electrolytes. It suggested that the 3.0% waterontent in previously used electrolytes has a combinative advan-age to meet the optimal condition of photoconversion efficiency.
. Conclusions
We have developed a facile method to control the surface mor-hology and the geometrical parameters of TiO2 nanotubes, while
mproving its adhesion to underlying titanium substrate, whichs the key to successful fabrication of electro-optical devices. Byontrolling the water content and using the previously used elec-rolyte, nanotube arrays with length and morphology relevant toequired applications can be achieved. At the higher water content>2.0%), the relatively faster chemical dissolution rate dominatedhe reaction, resulting in the formation of nanotubes with shorterength, thinner wall and larger pore size whether it is in fresh orreviously used electrolytes. However, at the lower water content<2.0%), the nanotube growth rate as well as final length achieved inreviously used electrolytes is consistently higher relative to that
n fresh solutions. It is believed that in addition to the chemical dis-olution rate, the conductivity of the previously used electrolytesn the less water condition also has an important role in control-ing nanotube array growth. We note that the use of previouslysed electrolytes not only affects the tube morphology parametersut also the top-surface features of nanotube arrays. That shouldlso be attributed to the role of chemical dissolution. To a certainxtent, the enhanced chemical dissolution rate can help to dissolveff the surface aggregation parts and reduce the internal stresst the barrier layer–metal interface, greatly improve the adhe-ion between the nanotubes and the underlying metal layer. It isorth noting that using the previously used electrolytes can greatly
mprove the photoelectrochemical properties of the resulting nan-tubes. Finally, we demonstrated that the maximum photocurrentan be obtained from the 3.0% water content in previously usedlectrolytes.
cknowledgments
This work was cofinanced by the National Natural Scienceoundation of China (20873048, 30970717, 50827204, 50972047),he Research Fund for the Doctoral Program of Higher Education200804871011), the Program for New Century Excellent Tal-nts in University (NCET-06-0644), and the Fundamental Researchunds for the Central Universities (2010MS113). Technical assis-ance from the Analytical and Testing Center of HUST is gratefullycknowledged. The authors also thank the reviewers for their help-ul comments.
eferences
[1] C.A. Grimes, G.K. Mor, TiO2 Nanotube Arrays: Synthesis Properties and Appli-cations, Springer, 2009.
[2] K. Shankar, G.K. Mor, H.E. Prakasam, S. Yoriya, M. Paulose, O.K. Varghese, C.A.Grimes, Nanotechnology 18 (2007) 065707.
[3] G.K. Mor, K. Shankar, M. Paulose, O.K. Varghese, C.A. Grimes, Nano Lett. 5 (2005)
191.[4] E.Y. Kim, J.H. Park, G.Y. Han, J. Power Sources 184 (2008) 284.[5] O.K. Varghese, M. Paulose, K. Shankar, G.K. Mor, C.A. Grimes, J. Nanosci. Nan-
otechnol. 5 (2005) 1158.[6] G.K. Mor, H.E. Prakasam, O.K. Varghese, K. Shankar, C.A. Grimes, Nano Lett. 7
(2007) 2356.
[[[
ta 56 (2011) 2618–2626
[7] S.K. Mohapatra, M. Misra, V.K. Mahajan, K.S. Raja, J. Phys. Chem. C 111 (2007)8677.
[8] M. Misra, K.S. Raja, V.K. Mahajan, S.K. Mohapatra, Proceedings of the Society ofPhoto-optical Instrumentation Engineers (SPIE), vol. 6340, 2006, p. U128.
[9] Z.Y. Liu, B. Pesic, K.S. Raja, R.R. Rangaraju, M. Misra, Int. J. Hydrogen Energy 34(2009) 3250.
10] B. Seger, P.V. Kamat, J. Phys. Chem. C 113 (2009) 18946.11] G.K. Mor, O.K. Varghese, R.H.T. Wilke, S. Sharma, K. Shankar, T.J. Latempa, K.S.
Choi, C.A. Grimes, Nano Lett. 8 (2008) 1906.12] X.M. Wu, Y.H. Ling, L. Liu, Z.H. Huang, J. Electrochem. Soc. 156 (2009) K65.13] Y.S. Sohn, Y.R. Smith, M. Misra, V.R. Subramanian, Appl. Catal. B: Environ. 84
(2008) 372.14] S.K. Mohapatra, N. Kondamudi, S. Banerjee, M. Misra, Langmuir 24 (2008)
11276.15] D. Kim, A. Ghicov, S.P. Albu, P. Schmuki, J. Am. Chem. Soc. 130 (2008) 16454.16] T. Hasobe, S. Fukuzumi, S. Hattori, P.V. Kamat, Chem. Asian J. 2 (2007) 265.17] D.R. Baker, P.V. Kamat, Adv. Funct. Mater. 19 (2009) 805.18] A. Kongkanand, K. Tvrdy, K. Takechi, M. Kuno, P.V. Kamat, J. Am. Chem. Soc. 130
(2008) 4007.19] D.R. Baker, P.V. Kamat, J. Phys. Chem. C 113 (2009) 17967.20] T. Rattanavoravipa, T. Sagawa, S. Yoshikawa, Sol. Energy Mater. Sol. C 92 (2008)
1445.21] P. Charoensirithavorn, Y. Ogomi, T. Sagawa, S. Hayase, S. Yoshikawa, J. Cryst.
Growth 311 (2009) 757.22] K. Shankar, G.K. Mor, H.E. Prakasam, O.K. Varghese, C.A. Grimes, Langmuir 23
(2007) 12445.23] M. Paulose, K. Shankar, O.K. Varghese, G.K. Mor, B. Hardin, C.A. Grimes, Nan-
otechnology 17 (2006) 1446.24] X.J. Feng, K. Shankar, O.K. Varghese, M. Paulose, T.J. Latempa, C.A. Grimes, Nano
Lett. 8 (2008) 3781.25] K. Shankar, J. Bandara, M. Paulose, H. Wietasch, O.K. Varghese, G.K. Mor, T.J.
Latempa, M. Thelakkat, C.A. Grimes, Nano Lett. 8 (2008) 1654.26] K. Shankar, G.K. Mor, M. Paulose, O.K. Varghese, C.A. Grimes, J. Non-Cryst. Solids
354 (2008) 2767.27] G.K. Mor, K. Shankar, M. Paulose, O.K. Varghese, C.A. Grimes, Appl. Phys. Lett.
91 (2007) 152111.28] S. Yoriya, H.E. Prakasam, O.K. Varghese, K. Shankar, M. Paulose, G.K. Mor, T.J.
Latempa, C.A. Grimes, Sensor Lett. 4 (2006) 334.29] Q.W. Chen, D.S. Xu, Z.Y. Wu, Z.F. Liu, Nanotechnology 19 (2008) 365708.30] K.C. Popat, L. Leoni, C.A. Grimes, T.A. Desai, Biomaterials 28 (2007) 3188.31] S.C. Roy, M. Paulose, C.A. Grimes, Biomaterials 28 (2007) 4667.32] K.C. Popat, M. Eltgroth, T. LaTempa, C.A. Grimes, T.A. Desai, Biomaterials 28
(2007) 4880.33] K.C. Popat, M. Eltgroth, T. LaTempa, C.A. Grimes, T.A. Desai, Small 11 (2007)
1878.34] L.L. Peng, M. Eltgroth, T. LaTempa, C.A. Grimes, T.A. Desai, Biomaterials 30
(2009) 1268.35] H.H. Park, I.S. Park, K.S. Kim, W.Y. Jeon, B.K. Park, H.S. Kim, T.S. Bae, M.H. Lee,
Electrochim. Acta 55 (2010) 6109.36] G.D. Sulka, J. Kapusta-Kolodziej, A. Brzozka, M. Jaskula, Electrochim. Acta 55
(2010) 4359.37] C.A. Grimes, J. Mater. Chem. 17 (2007) 1451.38] D. Gong, C.A. Grimes, O.K. Varghese, W.C. Hu, R.S. Singh, Z. Chen, E.C. Dickey, J.
Mater. Res. 16 (2001) 3331.39] M. Paulose, K. Shankar, S. Yoriya, H.E. Prakasam, O.K. Varghese, G.K. Mor, T.A.
Latempa, A. Fitzgerald, C.A. Grimes, J. Phys. Chem. B 110 (2006) 16179.40] H.E. Prakasam, K. Shankar, M. Paulose, O.K. Varghese, C.A. Grimes, J. Phys. Chem.
C 111 (2007) 7235.41] M. Paulose, H.E. Prakasam, O.K. Varghese, L. Peng, K.C. Popat, G.K. Mor, T.A.
Desai, C.A. Grimes, J. Phys. Chem. C 111 (2007) 14992.42] M. Paulose, L. Peng, K.C. Popat, O.K. Varghese, T.J. Latempa, N.Z. Bao, T.A. Desai,
C.A. Grimes, J. Membr. Sci. 319 (2008) 199.43] N.K. Allam, K. Shankar, C.A. Grimes, Adv. Mater. 20 (2008) 3942.44] N.K. Allam, C.A. Grimes, Langmuir 25 (2009) 7234.45] Z.Y. Liu, V.R. Subramania, M. Misra, J. Phys. Chem. C 113 (2009) 14028.46] Z.Y. Liu, M. Misra, ACS Nano. 4 (2010) 2196.47] J. Zhang, J.H. Bang, C.C. Tang, P.V. Kamat, ACS Nano. 4 (2010) 387.48] B.H. Meekins, P.V. Kamat, ACS Nano. 3 (2009) 3437.49] J.M. Macak, S. Albu, D.H. Kim, I. Paramasivam, S. Aldabergerova, P. Schmuki,
Electrochem. Solid-State Lett. 10 (2007) K28.50] S.E. John, S.K. Mohapatra, M. Misra, Langmuir 25 (2009) 8240.51] K. Shankar, J.I. Basham, N.K. Allam, O.K. Varghese, G.K. Mor, X.J. Feng, M. Paulose,
J.A. Seabold, K.S. Choi, C.A. Grimes, J. Phys. Chem. C 113 (2009) 6327.
Sol. C 90 (2006) 2011.53] B. Melody, T. Kinard, P. Lessner, Electrochem. Solid-State Lett. 1 (1998) 126.54] G.M. Krembs, J. Electrochem. Soc. 110 (1963) 938.55] S.Q. Li, G.M. Zhang, D.Z. Guo, L.G. Yu, W. Zhang, J. Phys. Chem. C 113 (2009)
12759.