an efficient frontier for international portfolios
TRANSCRIPT

\N?S U-'
POLICY RESEARCH WORKING PAPER 1266
An Efficient Frontier Including commodities andassets from emerging equity
for International Portfolios markets in investment
with Commodity Assets portfolios produces significant
risk/return benefits.
Sudhakar SatyanarayanPanos Varangis
The World Bank
International Economics Department
International Trade Division
March 1994
Pub
lic D
iscl
osur
e A
utho
rized
Pub
lic D
iscl
osur
e A
utho
rized
Pub
lic D
iscl
osur
e A
utho
rized
Pub
lic D
iscl
osur
e A
utho
rized

|POLICY RESEARCH WORKING PAPER 1266
Summary findings
In recent years, the role of investment funds has reduction through portfolio diversification.increased in most commodity markets. Investment funds, Satyanarayan and Varangis analyze the benefits ofwhich traditionally deal with financial markets, have including commodity futures and assets from emergingbeen shifting between financial markets and comnmodity markets in an investment portfolio.futures markets, as well as among commodity futures They also try to calculate the optimal composition ofmarkets. assets. The calculated optimal weights show that a
The popularity of investing in emerging capital considerable proportion of an investment portfolio couldmarkets is as high as it has been since World War 1. By be invested in commodity futures and emerging market1913, nearly half of a typical equity portfolio was assets. The weights calculated are higher than thoseinvested in emerging markets. Today, one in every four funds usually used, signifying the potential for furtherdollars invested in foreign equity markets goes to expansion of these assets in a portfolio.emerging markets. Finally, including commodity futures and assets from
Both commodity futures and emerging capital markets emerging markets in investment portfolios produces aare growing in popularity because they allow risk significant risk/return benefit.
This paper - a product of the International Trade Division, Policy Research D)epartment - is part of a larger effort in thdepartment to explore the role of commodities as assets. Copies of the paper are available free from the World Bank, 1818 H StreetNW, Washington, DC 20433. Please contact Dawn Gustafson, rcom 57-033, extension 33732 (30 pages). March 1994.
The Policy Research Working Paper Series disseminates the findings of wvork in progress to encourage the exchange of ideas aboutdevelopment issues. An objective of the series is to get the findings out quickly, eten if the presentations are less than fully polished. Trepapers carry the names o; the authors and should be used and cited accordingly. The findings, interpretations, and conclusions are theauthors' own and should not be attributed to the W orld Bank, its Executive Board of Directors, or any of its memnber countries.
Produced by the Policy Research Dissemination Center

AN EFFICIENT FRONTIER FOR INTERNATIONAL PORTFOLIOSWITH COMMODITY ASSETS
By
Sudhakar Satyanarayan
and
Panos Varangis

1
INTRODUCTION
An increasing amount of attention has recently been devoted to the notion of commodities
as traded assets. This notion is, however, not new. Dusak (1973, p. 1388) in extending the
Capital Asset Pricing Model (CAPM) to investigate commodity market risk premiums noted that
"...futures markets are no different in principle from the markets for any other risky portfolio
assets... they (futures market assets) are all candidates for inclusion in the investor's portfolio".
Recent years have witnessed the increasing role of investment funds in most commodity markets.
Investment funds, traditionally dealing with financial markets, have now been diversifying into
commodity futures markets.
Claessens and Varangis (1994) in a discussion of commodity risk management in
developing countries argue that the increased tradability of commodities necessitates a re-
interpretation of the rate of return for commodities. A zommodity that trades as a financial asset,
if left untraded, forgoes the opportunity cost of money (interest rate)'. Commodity rates of
return should reflect this opportunity cost; thus the appropriate rate of return on a commodity
should equal the spot return (percentage change in the spot or cash commodity price) plus the
opportunity cost of money. Claessens and Varangis point out that commodity assets, in addition
to offering high rates of return, also offer significant risk management benefits since commodity
assets are generally negatively correlated with other assets.
'This is particularly true for the more storable commodities such as metals. Thetradability of commodities implies that commodity prices are more interest rate sensitive.Palaskas and Varangis (1989), for instance, found that a 1% increase in the real interest rate leadto a 2.2% decrease in the price of metals but only a 1.2% decrease in the price of less storableagricultural commodities.

2
In addition to commodities, the popularity of investing in emerging capital markets has
been increasing in recent years. Today one in every four dollars invested in foreign equity
markets goes to emerging stock markets. According to Risk Magazine (1993), in 1992 alone,
$14 billion flowed into foreign emerging market equities, taking total foreign holdings to about
$86 billion. Key vehicles are the proliferating country funds, regional funds and global
emerging market funds. According to the same article, the high risks involved in foreign equity
markets have led to the growing popularity of global emerging market funds, which seek to
reduce risk through diversification (note that the correlation between emerging markets is mostly
quite low).
The objective of this paper is to conr.ruct an international portfolio that includes
commodity assets as well as assets from developed and emerging markets to evaluate the risk-
return characteristics of such a portfolio. The returns from commodity assets is measured by the
recently developed Goldman Sachs Commodity Index (GSCI) which incorporates the notion that
commodity asset returns must include an opportunity cost of money component. The composition
of the optimal international portfolio is examined and an efficient frontier for the international
assets is derived.
The outline of the paper is as follows. Section 1 describes the salient features of the
Goldman Sachs Commodity Index and the return-risk characteristics of commodity assets.
Section 2 analyses the return-risk structure of the international portfolio while Section 3 derives
the optimal composition of the international portfolio and the efficient frontier of assets. Section
4 remarks on the policy implications of the study.

3
I. COMMODITY MARKET INVESTMENTS AND THE GSCI
The growing interest in commodities as traded assets prompted Goldman Sachs to develop
the Goldman Sachs Commodity Index (GSCI) in 1991. The GSCI incorporates the notion that
the returns on commodity assets must include an opport nity cost component. The return on this
index replicates the return from a fully collateralized portfolio of commodity futures2. The GSCI
is constructed in a manner similar to a capitalization-weighted stock market index except that
the commodity futures are weighted according to the dollar value of the conunodities world
production. In 1992, for instance, the GSCI dollar weights were as follows: 48% energy futures,
23% livestock futures, 21% agricultural futures and 8% metals futures. Since 1982, the weights
have generally shifted away from agricultural and livestock futures and towards energy futures.
The tc tal returns from the GSCI are made up of three components - the return from T-bills
(the opportunity cost component), the spot return (changes in the commodities prices) and the
"roll yield". Table 1 shows the breakdown of total returns by each of these three components
over the 1970-1992 period. The roll yield essentially represents the loss or gain from trading
futures contracts. In general, the most active futures contract (usually the first nearby contract)
is held until a month before its expiration when it is "rolled over" by selling it and purchasing
the second nearby contract. The profit or loss from this represents the roll yield. If a commodity
is in backwardation, the roll yield is positive because the futures price increases towards the spot
price as the maturity date approaches. Over the 1970-1992 period, since commodity futures
2The return on the GSCI is calculated on the assumption that the investor posted collateralconsisting of US T-bills equal to the value of the futures prices.

4
prices were generally in backwardation, the roll yield was positive. Table 1 indicates that the
total annual return on the GSCI over this period was 13.81%. Of this, 7.49% was attributable
to the T-bill yield, 3.74% to the roll yield and 2.58% to the spot return. Over the same period,
the return on the S&P 500 index was 10.84%. Clearly, investment in the GSCI over the 1970-
1992 period would have been attractive.
The attractiveness of commodity investments is further reinforced by noting that over the
1970-1992 period, Goldman Sachs estimated the quarterly correlation between the GSCI and the
S&P 500 to have been -.32. (Over the sub-period 1970-1981 and 1982-1992, the correlation was
-.43 and -.20, respectively). Thus, investment in the GSCI as part of a larger portfolio would
not only have raised total returns it would also have decreased total risk. The risk diversification
benefits of commodity assets, therefore, merit some consideration. Our paper examines the
larger role of commodity assets in international portfolios composed also of assets from both
developed and emerging markets.

5
TABLE 1: Goldman Sachs Commodity Index Return Components, 1970-92
Year Spot Return(%) Roll Yield(%) T-Bill Yield(%) TotW Return(%) S&P 500 Renun (%)
1970 4.80 2.73 6.53 14.06 3.931971 6.47 8.22 4.44 19.14 13.381972 27.35 3.88 4.13 35.35 17.381973 39.64 9.07 7.22 55.94 -15.861974 18.82 6.41 8.07 33.30 -30.751975 -36.41 11.55 5.96 -18.90 31.631976 -14.88 - 2.92 5.11 -12.68 21.381977 0.78 3.73 5.35 9.86 - 7.461978 19.21 0.92 7.34 27.46 6.351979 20.84 - 2.09 10.37 29.13 16.921980 12.21 -13.60 11.90 10.51 28.081981 -28.70 -11.98 14.53 -26.15 - 5.031982 - 0.09 0.01 11.02 10.94 19.401983 7.03 - 0.79 8.82 15.06 20.311984 -10.02 1.18 9.88 1.04 6.081985 0.26 1.62 7.66 9.54 27.881986 -20.78 16.70 6.10 2.02 16.951987 3.13 12.25 5.95 21.33 5.101988 11.52 6.30 6.81 24.63 15.541989 11.68 12.44 8.29 32.41 27.381990 5.96 11.84 7.73 25.52 - 3.221991 -21.78 9.92 5.53 - 6.33 26.661992 2.28 - 1.48 3.53 4.33 7.39ContinuouslyCompoundedAnnual Returns 2.58 3.74 7.49 13.81 10.84
NOTES: All returns are calculated as changes in logarithms.
Data Sources: GSCI-Goldman Sachs S&P 500-Ibbotson Associates.
6
II. THE RETURN-RISK STRUCTURE OF THE INTERNATIONAL PORTFOLIO
The recent development of capital markets in a number of countries has increased the
opportunity for diversifying portfolios internationally. The interest in country funds in recent
years, especially in "emerging markets" (i.e., the newly liberalized markets of developing
countries in Asia, Europe, Latin America and Africa) testifies to this growing awareness on the
part of portfolio managers. The focus on emerging markets is motivated by the fact that many
of these markets have increasingly moved towards market-based systems, liberalized stock and
currency markets, and loosened restrictions on foreign investor participation. Developing
countries as a group, moreover, are growing faster than the developed countries and are
expected to do so in the future. The World Bank, for example, projects that over the next
decade, developing countries will grow at 4.7% a year as compared to 2.7% for the seven major
developed economies. In 1992, of the world's 15 best performing stock markets, 12 were
errerging markets, including all of the top six markets. Investment in these markets can,
however, be extremely risky. Divecha, Drach, and Stefek (1992) cite the instance of the
Taiwanese stock market which went from 5,000 points at the beginning of 1990 to 12,600 in the
first quarter and collapsed to 2500 points in the third quarter. The Taiwanese market is,
however, only the fourth or fifth most risky emerging market.

7
Besides certain obvious risks (political instability, low liquidity, unreliable information,
insider trading, exchange rate risk3, etc.) emerging stock markets tend to be risky for other
reasons related to their economic and market structure. Unlike developed markets which have
diverse sectors that are differently affected by market shocks, emerging markets because of less
diversified industrial bases are more susceptible to macroeconomic shocks. Also, because of low
liquidity, the stock markets in these countries tend to be concentrated in a few large stocks.
These factors tend to accentuate market shocks.
The volatility of emerging markets should, however, be balanced against the fact that these
markets exhibit very low or negative correlations with the less risky developed markets. Thus,
portfolios composed of stocks from developed and emerging markets offer significant risk
diversification potential.
We constructed an international portfolio of 14 assets. Besides commodity market
investments, as represented by the GSCI, we chose stocks from developed and emerging
markets. Among the developed markets we chose the United States, United Kingdom, Japan,
Germany, Switzerland, France, and Hong-Kong. From the emerging markets we chose Taiwan,
Korea, Mexico, Thailand, Brazil, and India4. Table 2 reports monthly average returns (in
3Exchange rate risk may, however, not be a significant issue in international investment.Solnik and Noetzlin (1982) found exchange rate risk for stocks of developed markets to be asmall part of aggregate investment risk and Errunza and Losq (1987) found a similar result foremerging markets. The insignificance of the currency factor is due to the fact that currencyvolatility and stock market volatility are generally weakly or negatively correlated.
4The data for the developed markets is from the MSCI (Morgan-Stanley Capital MarketsInternational) index and the data for the emerging markets is from the IFC (InternationalFinancial Corporation) Emerging Markets Database. We chose the emerging markets on thebasis of both risk diversification potential and market liquidity. We used market capitalizationas an indicator of the latter.

8
TABLE 2: Return and Risk Statistics for Selected Stock Markets - Dec. 1984/June 1992
Average Return (%) Standard Deviation Coefficient of(%)J Variation
DEVELOPEDMARKETS
United States 1.42 4.85 3.42United Kingdom 1.43 5.75 4.02Japan .66 6.60 10.0Germany 1.29 7.22 6.0Switzerland 1.10 5.76 5.24France 1.63 6.62 4.06Hong Kong 2.68 7.92 2.96
EMERGINGMARKETS
Taiwan (China) 3.33 15.61 4.69Korea 1.91 8.73 4.57Mexico 4.65 13.90 2.99Thailand 2.61 8.58 3.29Brazil 2.97 22.28 7.50India 2.24 10.19 4.55
Europe 1.67 5.64 3.38
EAFE (Europe, 1.12 6.78 6.05Asia & Far East)
World 1.15 5.03 4.37
GSCI (Goldman 1.42 4.80 3.38Sachs CommnodityIndex)
Sources: Developed Markets--MSCI (Morgan-Stanley Capital Markets International).Emerging Markets--EMDB (Emerging Markets Database) of the IFC.

9
US dollars)5 , standard deviations and coefficients of variation for these markets over the Dec.84-
Jan.92 period. The data show that the emerging markets have performned bettcr but these
markets are also more risky in absolute terms. Notice, howevei, that if we consider risk per unit
of returnl (i.e., the coefficient of variation), the emerging markets do not compare unfavorably
with the developed markets. Japan and Germany, in particular, have been risky on this adjusted
basis. Over the same period, the monthly return and standard deviation of the GSCI was 1.42%
and 4.80%; the associated coefficient of variation of 3.38 compares favorably with most other
markets.
The attractiveness of commodity market investments is, however, better conveyed by Table
3 which shows the market correlation structure. The GSCI stands out as it is negatively
correlated with all developed markets and with three of the emerging markets. However, even
the positive correlation between the GSCI and the other emerging markets can hardly be
considered significant. These results indicate substantial potential for risk diversification by
including conimodity assets in international portfolios. Table 3 also implies that, in general,
emerging markets are less correlated with each other than developed markets are and as a group,
emerging markets generally exhibit low correlation with developed markets. The economic
reasoning behind this is that emerging markets tend to have little or no economic links with each
other and restrictions on outside participation in these markets essentially insulate these markets
from international trends. Consider, for example, the Indian market which is negatively
correlaEed with all but one of the developed markets and exhibits either negative or low positive
5The data, therefore, captures the risk of security returns in foreign markets as well as theexchange risk associated with converting foreign currencies into dollars.

TABLE 3: Correlations of MonUtly Average Returns between the GSCI.and Developed and Emerging Stock Markets (Dec. 84 - Jun. 92)
USA UK JAP GER SWZ FRA HKG TAI KOR MEX THI BRZ IND GSCI WLD
USA 1.00
UK .77 1.00
JAP .38 .40 1.00
GER .48 .50 .31 1.00
SWZ .60 .59 .40 .69 1.00
FRA .59 .54 .46 .66 .63 1.00
HKG .53 .60 .26 .40 .55 .39 1.00
TAI .14 .21 .33 .25 .17 .22 .16 1.00
KOR .26 .31 .36 .06 .31 .17 .11 .04 1.00 o
!.1EX .40 .38 .28 .32 .42 .31 .30 .35 .16 1.00
IfrHI .34 .38 .33 .30 .44 .28 .45 .40 -.01 .37 1.00
BRZ .12 .07 .15 .16 .20 .08 .14 .07 .03 -.008 .05 1.00
IND -.08 -.10 -.27 -.005 -.03 .04 -.04 -. 11 -.05 .02 .08 .03 1.00
GSCI -.19 -.07 -. 16 -. 10 -.17 -.14 -. 18 -.21 .04 -. 02 -. 22 .03 .11 1.00
WLD .71 .68 .73 .50 .57 .60 .49 .27 .41 .26 .36 .10 --11 -.12 1.00
Notes: The following abbreviations are used--Japan (JAP). Germany (GER), Swiuerland (SWZ), France (FRA), Hong Kong (HKG). Taiwan (TAI). Korea (KOR). Mexico (MEX).Thailand (THI), Brazil (BRZ), India (IND). Goldman-Sachs Commodity Index (GSCI), World Portfolio (WLD).
91 observations were used for the Developed Markets and 90 observations for the Emerging Markets and the GSCI.
Data sources: See Tables I and 2.

11
correlation with other emerging markets. It is interesting to recall in this context that the Indian
stock market was doing well in October 1987 when stock markets world-wide crashed. It is,
however, this fact that emerging markets are not well integrated with the global economy that
makes these markets interesting from the viewpoint of international portfolio diversification.

12
III. AN EFFICIENT FRONTIER SET FQR INTERNATIONAL ASSETS
This section explores the optimal composition of the international portfolio and derives an
efficient frontier for international assets. In the Markowitz mean-standard deviation portfolio
model, a portfolio is efficient, "...if no portfolio with the same or higher expected return has
lower standard deviation". (Fama and Miller, 1972, p.220).
The expected return on the portfolio, E(Rp), is simply the weighted average of the
individual asset returns in the portfolio. Thus,
E(Rp) = IN w; E(R;)
where:
w; = weight of asset i in the portfolio
E(R;) = expected return of asset i
The standard deviation of the portfolio (ap) is a weighted average of the standard deviation of
the individual asset returns and the covariances between the asset returns. Thus,
= [NiI Wi o2 + ENiI EN= W Wj Wja]ll 2 E[Ni1= Nj=1 Wi Wj aij] 2
j•i
The mean-standard deviation frontier set can be derived by minimizing the standard deviation
of the portfolio at different given levels of return subject to certain constraints. The optimal

13
investment proportions are the solution to the following quadratic programming problem6:
MINIMIZE
subject to
E(Rp) = E(Re)
Nj= wi = 1 and w; 2 0 for i = 1 ...... N
where:
E(R,) = given level of return
The constraints imply that the sum of the weights of the individual assets must equal 1 and the
non-negativity restriction on w; precludes short-selling'.
The solution to this non-linear programming problem for the 14-asset international portfolio
is reported in Table 4 and graphed in Figure 18. Notice in Table 4 that two of the developed
markets, the United Kingdom and Germany, are never held in the optimal portfolio and the
weight of the French market in the optimal portfolio is less than 1 %. The reason for the
exclusion of the UK market is that it is highly correlated with the US market - a market which
has almost the same mean return as the UK market but a lower standard deviation. The German
market is probably excluded because of its high correlation with other European markets and
because its return is lower and risk considerably higher than the US market.
6This problem was solved using a quadratic programming algorithm available in the GAMS(General Algebraic Modeling System) package developed by the World Bank.
7The portfolio model includes 14 assets. Thus, the standard deviation of the portfolio (ap)contains 14 standard deviation elements and (1/2).(14-1).(14) or 91 different covarianceelements.
8Table 4 and Figure 1 show the results of minimizing standard deviation at given rates ofreturn to derive the mean-standard deviation frontier set. Notice that the efficient set, however,corresponds only to rates of return equal to and greater than 1.4727.

TABLE 4: Composition of the Oplimal Intemational Poitfolio
Rate of USA UK I A GER SWZ FRA HKG TAI KOR MEX 111 BR IND GSCi Sum of PotfolioRetumn Weights Standard(Rc) Deviation
0.75 .858 .056 .086 1 5.76
1.0 .474 .187 .339 1 3.76
1.25 .175 .228 .131 .055 .410 1 2.84
1.4727* .254* .123* .056* .017* .024* .006* .021* .084* .415* 1* 2.71*
1 .50 .253 .115 .048 .023 .026 .010 .025 .084 .415 l 2.72
1.75 .225 .034 .002 .079 .045 .051 .060 .002 .087 .415 1 2.82
2.00 .126 0o6 .128 .053 .073 .030 .073 .010 .097 .403 l 3.11
2.25 .009 .181 .057 .088 .074 .078 .017 .111 .385 1 3.56
2.50 .205 .061 .076 .138 .060 .027 .131 .301 l 4.16 S
2.75 .227 .066 .061 .204 .040 .037 .152 .213 1 4.92
3.00 .250 .071 .047 .269 .020 .048 .173 .124 l 578
NOTE: Stnmed values represent retum. weights and standard deviation of the ninimwm-risk portfolio.Date Sources: See Tables I and 2.

FIGURE 1MEAN-STD.DEVIATION FRONTIER
3.
2.5-.
:32- / CD
a)
a-I 1-5- M 04xC.4
w
1-
0.09
0.5- , , , , ,2.5 3 3.5 4 4.5 5 5.5 6
Standard Deviation
NOTE: The numbers on the Mean-Standard Deviation Frontier refer to the percentage of theportfolio inv . in r M for the min'

16
Emerging markets, as a whole, are better represented than developed markets in the
international portfolio because emerging markets are not as correlated with each other as are the
developed markets. Among the emerging markets, the Indian market is the most heavily
represented. This is hardly surprising given its negative correlation with most other markets.
We previously noted that over the sample period the rates of return in emerging markets
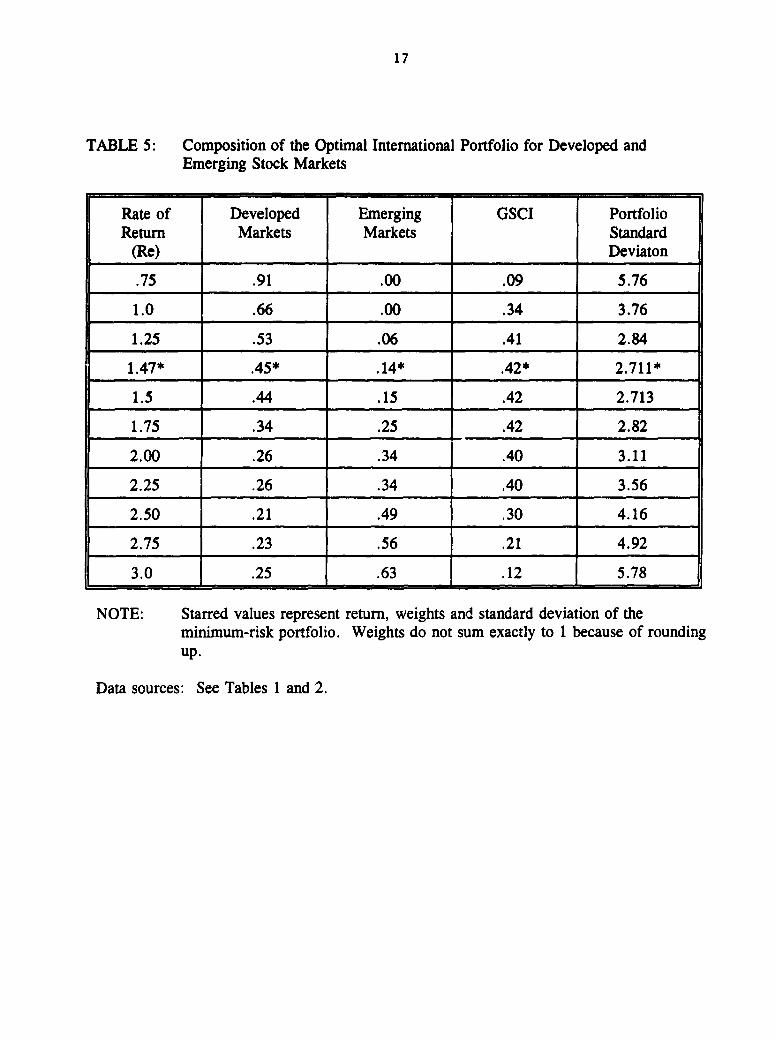
exceeded those of the developed markets. The outcome of this is shown in Table 5 which
presents the results of Table 4 in a summary form for the developed and emerging markets. The
optimal international portfolio is clearly biased towards investment in the emerging markets at
higher required rates of return. Speidell and Sappenfield (1992, p.67) in an analysis of global
diversification write that: "Conservative assumptions suggest optimal emerging market
weightings of 10% to 15 % .....". Our results suggest that this percentage is appropriate for a risk-
minimizer (the minimum-risk portfolio implies a 14% investment in emerging markets) but for
less risk averse investors, the optimal emerging market weighting is more likely to be between
25% and 50%.
Tables 4 and 5 reinforce our earlier notions regarding the return-risk benefits of
commodity market investments but it is still surprising to see how heavily the GSCI is
represented in the international portfolio. The minimum-risk international portfolio, for instance,
implies a 42% investment in the GSCI. This proportion decreases at higher required rates of
return but it would seem that at most reasonable levels of risk, the optimal proportion of
commodity market investments in the international portfolio would still be at least 30%.
We also computed the optimal international portfolio without commodity assets. The
composition of this portfolio is reported in Table 6 and graphed in Figure 2 which compares the
17
TABLE 5: Composition of the Optimnal International Portfolio for Developed andEmerging Stock Markets
Rate of Developed Emerging GSCI PortfolioReturn Markets Markets Standard
(Re) Deviaton
.75 .91 .00 .09 5.76
1.0 .66 .00 .34 3.76
1.25 .53 .06 .41 2.84 l
1.47* .45* .14* .42* 2.711*
1.5 .44 .15 .42 2.713
1.75 .34 .25 .42 2.82
2.00 .26 .34 .40 3.11
2.25 .26 .34 .40 3.56
2.50 .21 .49 .30 4.16
2.75 .23 .56 .21 4.92
3.0 .25 .63 .12 5.78
NOTE: Starred values represent return, weights and standard deviation of theminimum-risk portfolio. Weights do not sum exactly to 1 because of roundingup.
Data sources: See Tables 1 and 2.

TABLE 6: Composition of the Optimal International Portfolio Without Commodity Assets
Rate of USA UK JAP GER swz FRA WKG TAI KOR MEX THI BRZ IND Sum of PortfolioRetumrn Weights Standard(Re) . Deviation
1.00 .100 .527 .286 .087 1 4.57
1.25 .334 .337 .161 M.68 I 3.89
1.47* .407* .217* .028* .061* .012* .014* .063* .001* .196* 1* 3.77*
1.50 .405 .208 .030 .049 .020 .016 .069 .006 .197 1 3.78
1.75 .381 .129 .029 .071 .033 .108 -041 008 .199 1 3.86
2.00 .342 .053 .007 .114 .048 .137 .016 064 016 .202 1 4.06
2.25 .264 .017 .151 .055 .160 .048 .078 .023 .203 1 4.36
2.50 .136 .008 .205 .059 .171 .093 .083 .030 .214 1 4.75
2.75 .008 .259 .063 .182 .138 .088 .038 .224 1 5.24
1 3.00 .270 .069 .120 .229 .049 .048 .215 1 5.88
NOTE: Weights may not sum exactly to I because of rounding up.*Starred values represent return, weights and standard deviation of the minimum-risk portfolio.
Data sources: See Tables I and 2.

FIGURE 2: MEAN-STANDARD DEVIATIONFRONTIFRS WITH AND WITHOUT GSCI
3-. Il
2.5-
.8
* 2- /4-'
aI)
0.42
CL 1.5- M 4M a4--
0.09
0.5 - , 1 , , 2.5 3 3.5 4 4.5 5 5.5 6
Standard Deviation
|-- With GSCI - Without GSCI
NOTE: The numbers on the Mean-Standard Deviation Frontier refer to the percentage of the portfolioinvested in commodity assets. M stands for the minimum-risk portfolio.
20
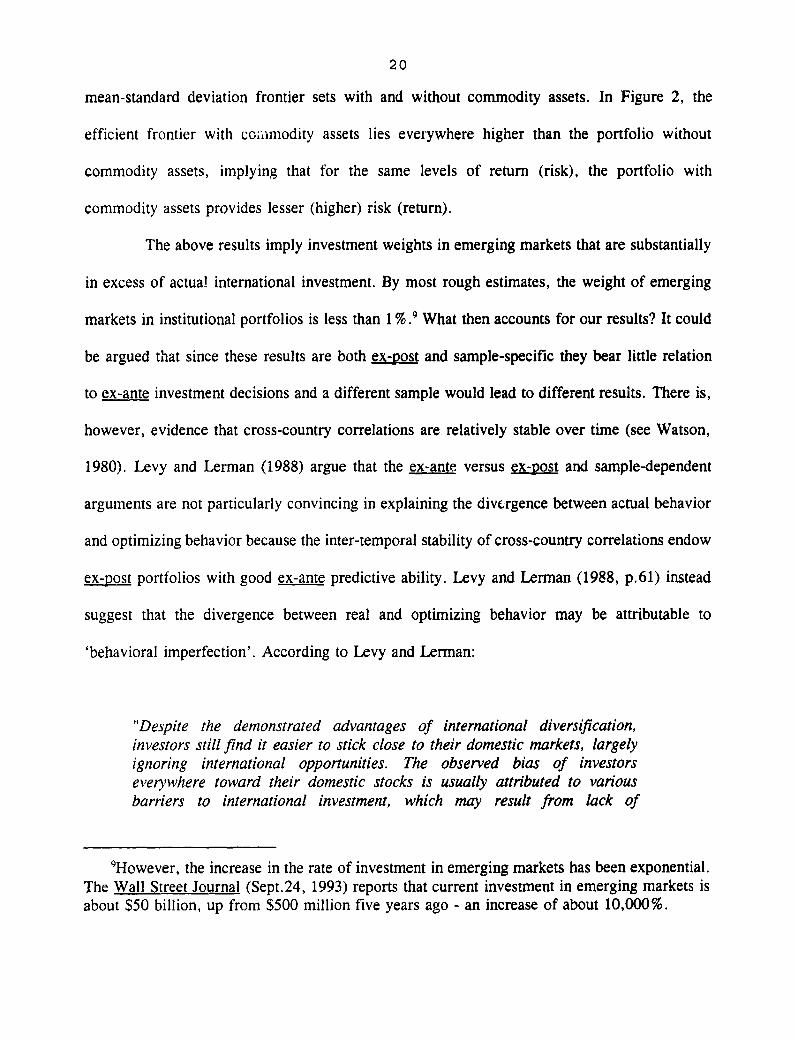
mean-standard deviation frontier sets with and without commodity assets. In Figure 2, the
efficient frontier with co;.modity assets lies everywhere higher than the portfolio without
commodity assets, implying that for the same levels of return (risk), the portfolio with
commodity assets provides lesser (higher) risk (return).
The above results imply investment weights in emerging markets that are substantially
in excess of actua! international investment. By most rough estimates, the weight of emerging
markets in institutional portfolios is less than 1 %.9 What then accounts for our results? It could
be argued that since these results are both ex-post and sample-specific they bear little relation
to ex-ante investment decisions and a different sample would lead to different resuits. There is,
however, evidence that cross-country correlations are relatively stable over time (see Watson,
1980). Levy and Lerman (1988) argue that the ex-ante versus ex-post and sample-dependent
arguments are not particularly convincing in explaining the divergence between actual behavior
and optimizing behavior because the inter-temporal stability of cross-country correlations endow
ex-post portfolios with good ex-ante predictive ability. Levy and Lerman (1988, p.61) instead
suggest that the divergence between real and optimizing behavior may be attributable to
'behavioral imperfection'. According to Levy and Lerman:
"Despite the demonstrated advantages of international diversification,investors still find it easier to stick close to their domestic markets, largelyignoring international opportunities. The observed bias of investorseverywhere toward their domestic stocks is usually attributed to variousbarriers to international investment, which may result from lack of
'However, the increase in the rate of investment in emerging markets has been exponential.The Wall Street Journal (Sept.24, 1993) reports that current investment in emerging markets isabout $50 billion, up from $500 million five years ago - an increase of about 10,000%.
21
information, discriminatory taxation, restrictions onfundsflow, or simply fearof expropriation. Our results, of course, ignore these imperfections andindicate wlhat would happen if investors felt no inhibition against diversifyinginternationally".
This argunLent seems perfectly suited to explaining our results.
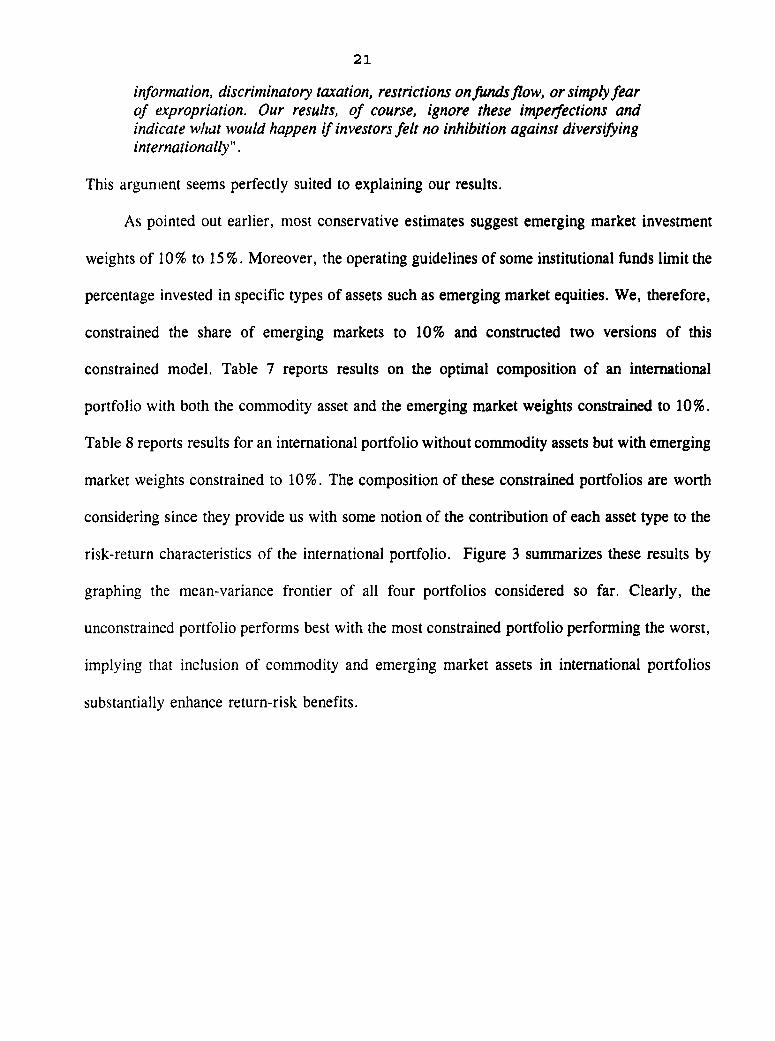
As pointed out earlier, most conservative estimates suggest emerging market investment
weights of 10% to 15 %. Moreover, the operating guidelines of some institutional funds limit the
percentage invested in specific types of assets such as emerging market equities. We, therefore,
constrained the share of emerging markets to 10% and constructed two versions of this
constrained model. Table 7 reports results on the optimal composition of an international
portfolio with both the commodity asset and the emerging market weights constrained to 10%.
Table 8 reports results for an international portfolio without commodity assets but with emerging
market weights constrained to 10%. The composition of these constrained portfolios are worth
considering since they provide us with some notion of the contribution of each asset type to the
risk-return characteristics of the international portfolio. Figure 3 summarizes these results by
graphing the mean-variance frontier of all four portfolios considered so far. Clearly, the
unconstrained portfolio performs best with the most constrained portfolio performing the worst,
implying that inclusion of commodity and emerging market assets in international portfolios
substantially enhance return-risk benefits.

TABLE 7: Composition of the Constrained International Portfolio [Emerging Markets 10%, GSCI = 10%]
Rate of USA UK JAP GER SWZ FRA HKG TAI KOR MEX TiI BRZ VWD GSCI Sum of PortfolioRetum Weights S*andard(Re) Deviation
1.00 .061 .500 .279 .060 .100 1 4.23
1.25 .378 .266 .156 .100 .100 1 3.52
1.31* .439* .218* .014* .119* .010* .100* .100 1 3.50*
1.50 .452 .171 .030 .035 .113 .100 .100 I 3.58
1.75 .423 .080 .074 .223 .011 .089 .100 1 3.89
2.00 .359 .120 .320 .015 .022 .063 .100 1 4.39
2.25 .216 .144 .440 .003 .066 .031 .100 1 5.05
2.50 .062 .165 .573 .100 .100 I 5.84
L2.75 .. I 799 .100 .100 1 6.84
NOTE: Weights may not sum exactly to I because of rounding up.*Starred values represent return, weights and standard deviation of the minimum-risk portfolio.
Data sources: See Tables I and 2.

TABLE 8: Composition of the Constrained International Portfolio Without Commodity Assets [Emerging Markets = 10%1
Rate of USA UK JAP GER SWZ FRA HKG TAI KOR MEX THI BRZ IND Sum of PortfolioReturn Weights Standard(Re) Deviation
1.00 .100 .527 .286 .087 1 4.57
1.25 .467 .264 .013 .155 .100 1 3.99
1.28* .493* .011* .238* .021* .135* .003* .100* 1* 3.98*
1.50 .515 .184 .039 .038 .001 .123 .100 1 4.08
1.75 A76 .098 .085 .241 .001 .099 1 4.39
2.00 .429 .001 .136 .334 .009 .016 .074 1 4.87
2.25 .287 .159 .454 .059 .041 I 5.49
2.50 .143 .1-19 .578 .096 .004 1 6.24
2.75 .121 .779 .100 1 7.12
NOTE: Weights may not sum exactly to I because of rounding up.*Starred values rapresent return, weights and standard deviation of the minimum-risk portfolio.
Data sources: See Tables I and 2.

FIGURE 3: COMPARISON OF UNCONSTRAINEDAND CONSTRAINED FRONTIERS
3
2.5-
E2-4-
4)
0.5
2.5 3 3.5 4 4.5 5 5.5 6 6.5 7 7.5Standard Deviation
|- Unconstrained + GSCI = 0% -±- EM=10%; GSCI=10o% F GSCI=0%; EM=10%

25
We also calculated the risk-minimizing weight of the GSCI in a portfolio composed of
the GSCI and individual stock market assets.10 rhe results for this two-asset, minimnum-risk
(standard deviation) portfolio provides some sense of the risk-minimization benefit held out by
the GSCI for individual markets. These results are reported in Table 9. The investment weights
in the GSCI range from a low of 51% for the US market to a high of 96% for the Brazilian
market. The heaviest weightings of the GSCI are in the emerging market portfolios since these
markets are much more volatile and there are consequently greater risk-minimization benefits
by investing in commodity assets. Notice, for instance, that the minimum-risk portfolio for
Brazil implies a 96% investment in the GSCI which reduces the Brazilian market standard
deviation of 22.28 to a considerably smaller standard deviation of 4.72. (Notice, however, that
the expected return is lowered from 2.97 to 1.48.) Among the developed markets, investment
in commodity markets raises returns for Japan, Germany and Switzerland while simultaneously
reducing risk in all three markets. For the aggregated market indices, the risk-minimizing
comrnmodity market weights are: 66% (EAFE), 58% (Europe) and 52% (World Portfolio). A
52% investment in the GSCI increases returns on the world portfolio from 1.15 to 1.29 while
reducing risk from 5.06 to 3.26. Notice that the GSCI weight of 52% in the minimum-risk world
portfolio roughly confirms the 42% weight (see Table 5) we arrived at for our minimum-risk
international portfolio. The difference is due to the fact that the international portfolio includes
'"The risk-minimizing weights are solved from a two asset (X,Y) portfolio model where therisk-minimizing weight of the individual market asset is w%x and that of the GSCI is w'y. Therisk-minimizing weights are then given by:
w% = [a'- cov(X,Y)] / [u2" + a- 2 cov(X,Y)J; w = (1 - wV)

26
TABLE 9: Weights, Return, & Standard Deviation of the Minimum-Risk Portfolio forInternational Stock Markets
Market Weight of Weight of Expected Portfoliothe Market GSCI Return Standard
Deviation
United States .49 .51 1.42 3.1
United Kingdom .41 .59 1.42 3.5
Japan .36 .64 1.14 3.6
Germany .32 .68 1.38 3.8
Switzerland .42 .58 1.29 3.4
France .36 .64 1.50 3.6
Hong Kong .30 .70 1.80 3.8
Taiwan (China) .13 .87 1.67 4.2
Korea .22 .78 1.53 4.3
Mexico .11 .89 1.78 4.5
Thailand .28 .72 1.75 3.8
Brazil .04 .96 1.48 4.7
India .15 .85 1.54 4.5
EAFE (Europe, Asia .34 .66 1.32 3.8and Far East) l
Europe .42 .58 1.52 3.6
World .48 .52 1.29 3.3
Data sources: See Tables 1 and 2.

27
only a sample of world markets. This result, if anything, implies an even greater role for
commodity assets in risk-minimization. These results unambiguously testify to the considerable
risk-return benefits from investing in commodity market assets.
We also considered the effect of including international bonds in the portfolio. (These
results are not reported here.)" The diversification benefits of bonds in international portfolios
have been reported by Levy and Lerman (1988) and Grauer and Hakansson (1987). Both papers
report gains from international diversification of stocks and bonds for highly risk-averse
investors. Since bonds typically carry less risk (and therefore less return) than stocks and are,
moreover, negatively correlated with stocks, they may substitute for commodity investments for
very risk averse investors. The percentage of investment in the GSCI, in fact, decreases for very
risk averse investors but the optimal investment weight in commodities continues to be strong
for less risk-averse investors with higher required rates of return.
"We included government bonds from the United States, Gernany and Japan and calculatedthe optimal composition of the international bond-stock portfolio with commodity assets. Thisbond-stock portfolio outperformed other portfolios at low mean rates of return.
28
IV. CONCLUSION
This paper analyses returns and risks from investing in an international portfolio composed
of assets from developed and emerging stock markets and the new opportunities for investment
in commodity market assets as represented by the GSCI. The optimal composition of the
international portfolio and the mean-standard deviation frontier for different investment sets were
calculated. These results are potentially useful because the irnter-temporal stability of cross-
market corre!ations endow ex-post portfolios with good ex-ante predictive ability.
The results of this paper point out to the important role commodities and emerging
market stocks could play in an investor's portfolio. The results from the optimal composition
of an international portfolio also indicate that the shares of commodities in an investor's portfolio
could well increase above of what is typically today is invested in commodities. Our results
indicate that commodities could account for between 20-40% of an international investment
portfolio. For commodity markets the implication of these results is the increased participation
of investors, mainly investment funds, into commodity markets could increase the liquidity and
the possibilities for arbitrage in these markets. The increased liquidity is likely to bring more
opportunities for large commodity producers to enter and exit commodity futures markets
without affecting prices.12 However, the role of the investment funds in commodities has
caused some skepticism among certain analysts. It is felt that because investment funds trade
commodities mainly based on technical analysis rather than fundamentals and also because of
their size, they could result in short-lived deviations between futures and spot prices, causing
12Large developing country producers that need significant liquidity in commodityfutures/options markets are Venezuela and Mexico for oil; C6te d'Ivoire and Ghana for cocoa;and Brazil and Colombia for coffee, amongst others.
29
problems for commodity hedgers--typically commodity producers and users. Also, because
investment funds enter and exit the market with high frequency and given their size, they could
lead to increases in the short-term price volatility. For example, a commodity price decline that
could trigger sales by one investment fund could be reinforced by this fund's sales and trigger
sales by other funds. These skepticisms, however, have yet to be formally empirically tested.
With regard to emerging equity markets, our main results imply that optimal emerging
market weights are higher than those previously stated in the literature and that there are
considerable return-risk benefits from investing in commodity markets. The miniimum-risk
portfolio we constructed implies about a 14% investment in emerging markets but for less risk
averse investors, the optimal emerging market weighting is more likely to be between 25% and
50%, depending upon the degree of risk aversion. The difference between our results and
previous results is due to the inclusion of commodity assets which have considerable risk-
minimization benefits, so that the higher-return emerging markets are now more heavily
represented in the international portfolio. This has the effect of increasing returns at given levels
of risk or effectively shifting upwards the efficient frontier.
In the future, as emerging markets become more liberalized and develop greater
economic and trade links with the global economy, the correlation among emerging markets and
between emerging and developed markets is bound to increase. This means that the risk
diversification benefits currently provided by emerging markets may not continue to be so large.
Divecha, Drach, and Stefek (1992, p.50), for instance, advise that "...there is a 'diversification
free lunch' currently available - one should indulge while the opportunity exists". If emerging
markets do lose their risk diversification potential, commodity assets could well become even
more important.
30
REFERFNCES
Claessens, S. and P. Varangis, 1994, "Commodity Risk Management in Developing Countries",in Derivative Instruments and Hedging Strategies for Emerging Capital Markets,M.Papaioannou and G. Tsetsekos, eds. Dow Jones Irwin, Illirnis, (forthcoming).
Divecha, A., J. Drach and D. Stefek, 1992, "Emerging Markets: A Quantitative Perspective",Journal of Portfolio Management, Fall, pp.41-50.
Dusak, K. 1973, "Futures Trading and Investor Returns: An Investigation of Commodity MarketRisk Premiums", Journal of Political Economy, Nov./Dec., pp.1387-1406.
Errunza, V. and E. Losq, 1987, "How Risky are Emerging Markets?", Journal of PortfolioManagement, Fall, pp.62-7.
Eun, C. and B. Resnick, 1984, "Estimating the Correlation Structure of International SharePrices", Journal of Finance, Dec., pp. 1311-24.
Fama,E. and M. Miller, 1972, The Theory of Finance, The Dryden Press, Hinsdale, Illinois.
Froot, K. and J. Light, 1992, "An Investment Linked to. Conmmodity Futures", Case Study,Harvard Business School.
Grauer, R. and N. Hakansson, 1987, "Gains from International Diversification: 1968-85 Returnson Portfolios of Stocks and Bonds", Journal of Finance, July, pp.721-41.
Levy, H. and Z. Lerman, 1988, "The Benefits of International Diversification in Bonds",Financial Analysts Journal, Sept. -Oct., pp. 56-64.
Palaskas, T. and P. Varangis, 1989, "Primary Commodity Prices and MacroeconomicVariables: A Long-Run Relationship", PR Working Paper No.314, The World Bank.
Priovolos, T., 1988, "Efficient Frontier of Commodity Returns: Is the King Naked?", mimeo,International Trade Division, The World Bank.
Risk, 1993, "Seize the Day", Vol. 6, No. 10, October, pp. 50-56.
Solnik, B. and B. Noetzlin, 1982, "Optimal International Asset Allocation", Journal of PortfolioManagement, Fall, pp. 11-21.
Speidell, L. and R.Sappenfield, 1992, "Global Diversification in a Shrinking World", Journalof Portfolio Management, Fall, pp.57-67.
Wall Street Journal, 1993, "The Emerging Boom", Friday, Sept. 24, pp. R1-R28.
Watson, J., 1980, "The Stationarity of Inter-Country Correlation Coefficients: A Note, " Journalof Business, Finance and Accounting, Summer, pp. 297-303.

Policy Research Working Paper Series
ContactTitle Author Date for paper
WPS1249 Competitiveness and Environmental Piritta Sorsa February 1994 P. KokilaStandards: Some Exploratory Results 33716
WPS1250 Explaining Miracles: Growth William Easterly February 1994 R. MartinRegressions Meet the Gang of Four 39026
WPS1251 Excise Taxes John F. Due February 1994 C. Jones37699
WPS1252 On the Dangers of Decentralization Remy Prud'homme February 1994 TWUTD31005
WPS1253 Can Competition Policy Control 301 ? J. Michael Finger February 1994 M. PatenaK. C. Fung 37947
WPS1254 What Are OECD Trade Preferences Alexander J, Yeats February 1994 J. JacobsonWorth to Sub-Saharan Africa? 33710
WPS1255 Intrahousehold Resource Allocation: Lawrence Haddad February 1994 P. CookAn Overview John Hoddinott 33902
WPS1256 World Fossil Fuel Subsidies and Bjorn Larsen February 1994 C. JonesGlobal Carbon Emissions in a Model 37699wih Interfuel Substitution
WPS1257 Old-Age Security in Transitional Louise Fox February 1994 E. VincentEconomies 82350
WPS1258 Decentralizing Infrastructure: Richard Bird February 1994 WDRFor Good or for III? 31393
WPS1259 The Reform of Fiscal Systems in Robin Boadway February 1994 C. JonesDeveloping and Emerging Market Sandra Roberts 37754Economies: A Federalism Perspective Anwar Shah
WPS1260 When Is a Life Too Costly to Save? George L. Van Houtven February 1994 A. MaranonEvidence from U.S. Environmental Maureen L. Cropper 39074Regulations
WPS1261 A Political-Economy Analysis of Arvind Panagariya March 1994 N. ArtisFree Trade Areas and Customs Ronald Findlay 37947Unions
WPS1262 Flexibility in Sri Lanka's Labor Market Martin Rama March 1994 P. Cook33902
WPS1263 The Effects of Barriers on Equity Stijn Claessens March 1994 F. HatabInvestment in Developing Countries Moon-Whoan Rhee 35835

Policy Research Working Paper Series
ContactTitle Author Date for paper
WPS1264 A Rock and a Hard Place: The Two J. Michael Finger March 1994 M. PatenaFaces of U.S. Trade Policy Toward 37947Korea
WPS1265 Parallel Exchange Rates in Miguel A. Kiguel March 1994 R. LuzDeveloping Countries: Lessons f'om Stephen A. O'Connell 34303Eight Case Studies
WPS1266 An Efficient Frontier for International Sudhakar Satyanarayan March 1994 D. GustafsonPortfolios with Commodity Assets Panos Varangis 33732
WPS1267 The Tax Base in Transition: The Case Zeljko Bogetic March 1994 F. Smithof Bulgaria Arye L. Hillman 36072