an empirical anaysis of cambodia’s import
TRANSCRIPT
1
AN EMPIRICAL ANAYSIS OF CAMBODIA’S IMPORT
DEMAND FUNCTION
Chantha Hor1, Kakda Keo2, Chutima Suttiprapa3
1Department of Business Administration, ACLEDA Institute of Business, Phnom Penh,
Cambodia
2Department of Actuarial, Sovannaphum Life Assurance Plc, Phnom Penh, Cambodia
3Department of Business Administration, Vongchavalitkul University, Nakhorn Ratchasima,
Thailand
Abstract
This empirical study examines an import demand function for
Cambodia by employing time series data during 1993-2015. This
study uses Autoregressive Distributed Lag (ARDL) model to
investigate the impact of relative prices, foreign direct investment,
final consumption expenditure, export volume, exchange rate and
foreign exchange reserve on import demand in Cambodia for both
long run and short run. The study finds that relative prices and
exchange rate are negative effect on import demand in Cambodia for
both long and short run, while export volume is positively effect on
import demand. While, foreign direct investment, final consumption
expenditure, and foreign exchange reserve are insignificant impact
on import demand in Cambodia. The finding suggests that the
Cambodian government should monitor domestic price.
Keywords: ARDL Model, Cambodia, Import Demand, Time Series.
Introduction
Cambodia’s economy has been growing constantly more than 20
years after the fall of the Khmer Rouge regime. The Cambodia’s
economy is growing at the average of 7 percent over two decades
(1993-2015) (The World Bank, 2016). According to the World Bank
reported that Cambodia became the lower-middle-income country in
2015 with real gross national income per capita of approximately
$US 1, 070 and 15.5 million population. The strong economic
growth of Cambodia is mainly driven by three major sectors such as
garment and textile, construction, and services sector including
international trade.
Received 31 August 2017
Revised 03 October 2017
Accepted 15 October 2017
Torain Publishing Limited
Corresponding author:
Hor C., Keo K. and Suttiprapa C.
/ Journal of Management, Economics, and Industrial Organization, Vol.2 No.1, 2018, pp.1-12.
2
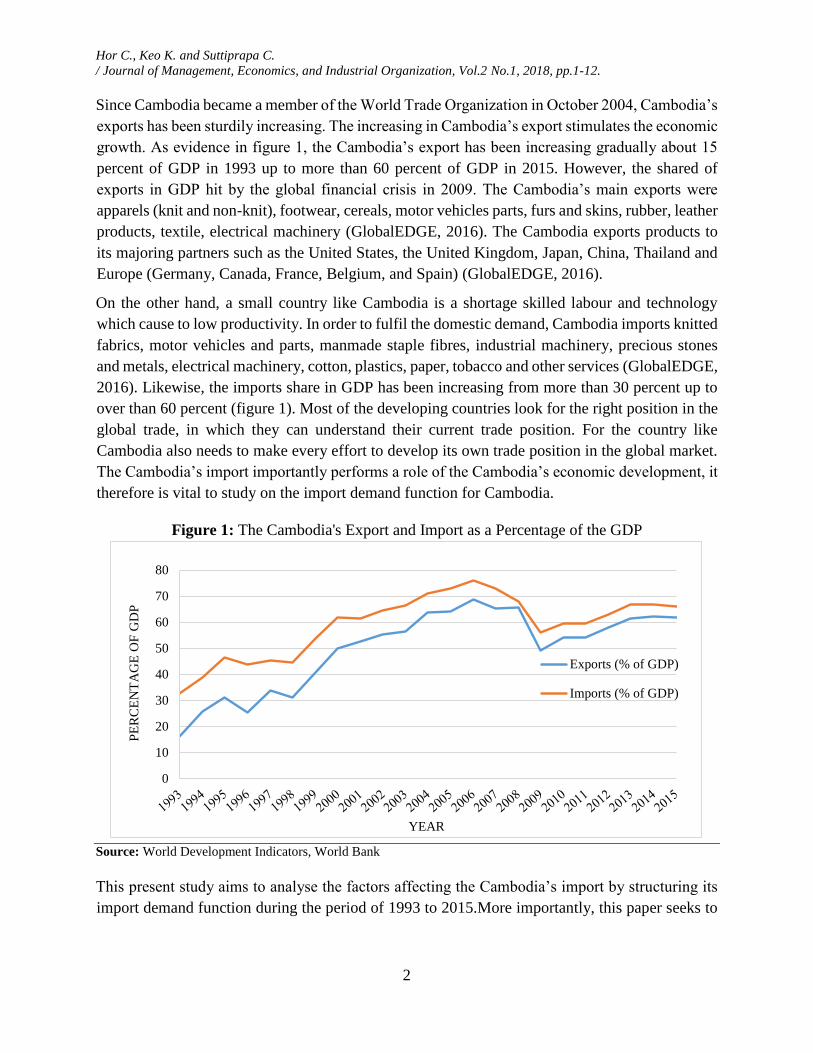
Since Cambodia became a member of the World Trade Organization in October 2004, Cambodia’s
exports has been sturdily increasing. The increasing in Cambodia’s export stimulates the economic
growth. As evidence in figure 1, the Cambodia’s export has been increasing gradually about 15
percent of GDP in 1993 up to more than 60 percent of GDP in 2015. However, the shared of
exports in GDP hit by the global financial crisis in 2009. The Cambodia’s main exports were
apparels (knit and non-knit), footwear, cereals, motor vehicles parts, furs and skins, rubber, leather
products, textile, electrical machinery (GlobalEDGE, 2016). The Cambodia exports products to
its majoring partners such as the United States, the United Kingdom, Japan, China, Thailand and
Europe (Germany, Canada, France, Belgium, and Spain) (GlobalEDGE, 2016).
On the other hand, a small country like Cambodia is a shortage skilled labour and technology
which cause to low productivity. In order to fulfil the domestic demand, Cambodia imports knitted
fabrics, motor vehicles and parts, manmade staple fibres, industrial machinery, precious stones
and metals, electrical machinery, cotton, plastics, paper, tobacco and other services (GlobalEDGE,
2016). Likewise, the imports share in GDP has been increasing from more than 30 percent up to
over than 60 percent (figure 1). Most of the developing countries look for the right position in the
global trade, in which they can understand their current trade position. For the country like
Cambodia also needs to make every effort to develop its own trade position in the global market.
The Cambodia’s import importantly performs a role of the Cambodia’s economic development, it
therefore is vital to study on the import demand function for Cambodia.
Figure 1: The Cambodia's Export and Import as a Percentage of the GDP
Source: World Development Indicators, World Bank
This present study aims to analyse the factors affecting the Cambodia’s import by structuring its
import demand function during the period of 1993 to 2015.More importantly, this paper seeks to
0
10
20
30
40
50
60
70
80
PE
RC
EN
TA
GE
OF
GD
P
YEAR
Exports (% of GDP)
Imports (% of GDP)
Hor C., Keo K. and Suttiprapa C.
/ Journal of Management, Economics, and Industrial Organization, Vol.2 No.1, 2018, pp.1-12.
3
observe in-debt long- and short-run effects on the determinant variables on the Cambodia’s import
demand function.
1. Literature Review
The studies on import demand function for both developed and developing countries have been
done by numerous authors. There are immense economic and non-economic factors used to
explain the import demand function. In this paper, we review the latest studies in an attempt to
select the appropriate variables employed in the study of import demand function for Cambodia.
Aziz (2013) studied on the aggregate import demand function for developing countries, the case
of Bangladesh. He employed several co-integration estimation techniques and the error correction
mechanism. The finding illustrates that real income, relative price of imports, foreign exchange
reserves, and export demand are statistically significant in both the short run and long run.
Alias, Tang, and Othman (2001) estimated the long-run relationship between aggregate imports
and expenditure component of 5-ASEAN (Malaysia, Indonesia, The Philippines, Thailand, and
Singapore). He employed the Johansen multivariate co-integration analysis. The study used the
yearly data from 1968 to 1998 for four ASEAN countries, except for Singapore (1974-1998). The
study introduced some significant variable, such as imports, final consumption expenditure,
investment expenditure, exports, relative price, and the capacity of country to produce and supply
of the goods. The finding shows that import demand is co-integrated with its determinants in the
ASEAN countries.
Muhammad and Zafar (2016) used Autoregressive Distributed Lag model to estimate the long run
and short run of import demand function of Pakistan during 1973-2013. He introduced important
variables, such as final consumption expenditure, investment expenditure, government
consumption expenditure, exports, foreign direct investment, exchange rate, and import. The result
shows that the import has both long- and short-run relationship with the relevant independent
variables.
The import demand function of Guyana during the period of 1960 to 2002 was estimated by using
single equations and Vector Autoregression (VAR), it aims to illustrate the long-run and short-run
relationship between import demand and independent variables such as gross domestic income,
exports as capacity to import, real exchange rate, foreign exchange reserves, official development
assistance and share-of aid in gross capital formation (Butts and Mitchell, 2012). The result
supports that foreign exchange supply channel variables are important determinants on import
demand function of Guyana.
Narayan and Narayan (2005) analysed the Fiji’s import demand behaviour by using disaggregated
import demand function during the period of 1970 to 2000. He introduced relevant variables using
Fiji’s import demand function such as relative prices, total consumption, and investment
expenditure and export expenditure. He estimates the import demand function of Fiji by using the
Hor C., Keo K. and Suttiprapa C.
/ Journal of Management, Economics, and Industrial Organization, Vol.2 No.1, 2018, pp.1-12.
4
Autoregressive Distributed Lag (ARDL) model. The findings illustrate that there is a long-run
relationship between import demand and independent variables.
From the above literature reviews illustrate the various import demand functions due to
individuals’ characteristics of each country, including various econometric approaches to estimate
the import demand function. In this study we adopt and choose the relevant variables accordance
to the characteristics of economic view and trade of Cambodia as well as using the ARDL
technique to estimate the long- and short-run relationship between the Cambodia’s import demand
and exogenous variables.
2. Methodology
Model Specification
The traditional import demand function was implemented from the imperfect substitution theory.
It illustrates that the importing country’s income, own price of imported good and price of the
imperfect substitute goods (Mervar, 1994). The methodical form of aggregate import demand
function is illustrated below:
MDt = f(Yt, Ptd, Pt
m) (1)
Where, import demand is MDt; Yt refers to domestic income which has positive impact on import
demand ; Ptd represents price of domestic goods and services or cross prices, has a positive
relationship with import demand, whilePtm (prices of imports or own prices) has a negative
relationship with import demand.
Abbott and Seddighi (1996) identified three main determinants that define a demand for imports
of a country such as the level of final expenditure, the relative price of imports, and the capacity
to produce and supply the goods of a country. The import demand function in Abbott and Seddighi
(1996) is illustrated as following:
IMPD = f(FCE, INVT, EXP, (PM/PD)) (2)
Where, IMPD is the volume of imports which is determined by exogenous variables, final
consumption expenditure (FCE), investment expenditure of goods (INVT), expenditure on exports
(EXP), and relative price of imports(PM/PD).
In this current study, we construct the Cambodia’s import demand function by adding some other
major factors into equation (2). Hence, the import demand function for Cambodia can be written
in the logarithm form as follow:
Ln IMPDt = f(Ln RPt, Ln FDIt, Ln FCEt, Ln EXPt, Ln ERt, Ln FERt) (3)
Or, we set up the long-run aggregate import demand function of Cambodia in log-linear regression
form as following:
ln IMPDt = δ0 + δ1 ln RPt + δ2 ln FDIt + δ3 ln FCEt + δ4 ln EXPt + δ5 ln ERt
+δ6 ln FERt + εt (4)
Hor C., Keo K. and Suttiprapa C.
/ Journal of Management, Economics, and Industrial Organization, Vol.2 No.1, 2018, pp.1-12.
5
Where,
lnIMPDt = logarithm of import volume during time t, where t is the period of 1993–
2015,
lnFDIt = logarithm of foreign direct investment during time t,
lnFCEt = logarithm of final consumption expenditure during time t,
lnEXPt = logarithm of exports of goods and services during time t,
lnRPt = logarithm of relative price which is the ratio of import price index and domestic price
index (CPI) during time t,
lnERt = logarithm of exchange rate during time t,
lnFERt = logarithm of foreign exchange reserve during time t,
δ0 = the intercept,
δ1, … , δ6) = long-run coefficient,
εt = the error term.
3. Data Description
The data of dependent (IMPD) and independent variables (FCE, FDI, EXP, ER, RP and FER) over
the period of 1993 to 2015 in this study are obtained from the World Development Index report in
2015. Relative price is measured by the import price index divided by domestic price proxy by
consumer price index.
4. Econometric Analysis
The aim of this study is to observe the long run and short run effects of determinant factors on the
Cambodia’s import demand function. There are numerous empirical studies on the relationship
between import demand and its major determinants, as reported in the papers of (Muhammad and
Zafar, 2016), (Aziz, 2013), (Ziramba and Bbuku, 2013), (Yue, 2010), and (Abbott and Seddighi,
1996).
This study applies the ARDL bounds testing approach to co-integration proposed by Pesaran et al.
(2001) due to its fruitful outperformance over other time series models. This approach works well
with a small sample size without concerning whether all variables are stationary at level I(0) or
I(1), or mixed integration (Pesaran, 1996 & 1997).
Several steps are needed to perform in this analysis. Firstly, we use the Augmented Dickey-Fuller
test to ensure none of the variables are not integrated order at I(2) level. Secondly, when there is
an evidence of inexistence of unit root for all variables at level I(2), then the ARDL bounds testing
Hor C., Keo K. and Suttiprapa C.
/ Journal of Management, Economics, and Industrial Organization, Vol.2 No.1, 2018, pp.1-12.
6
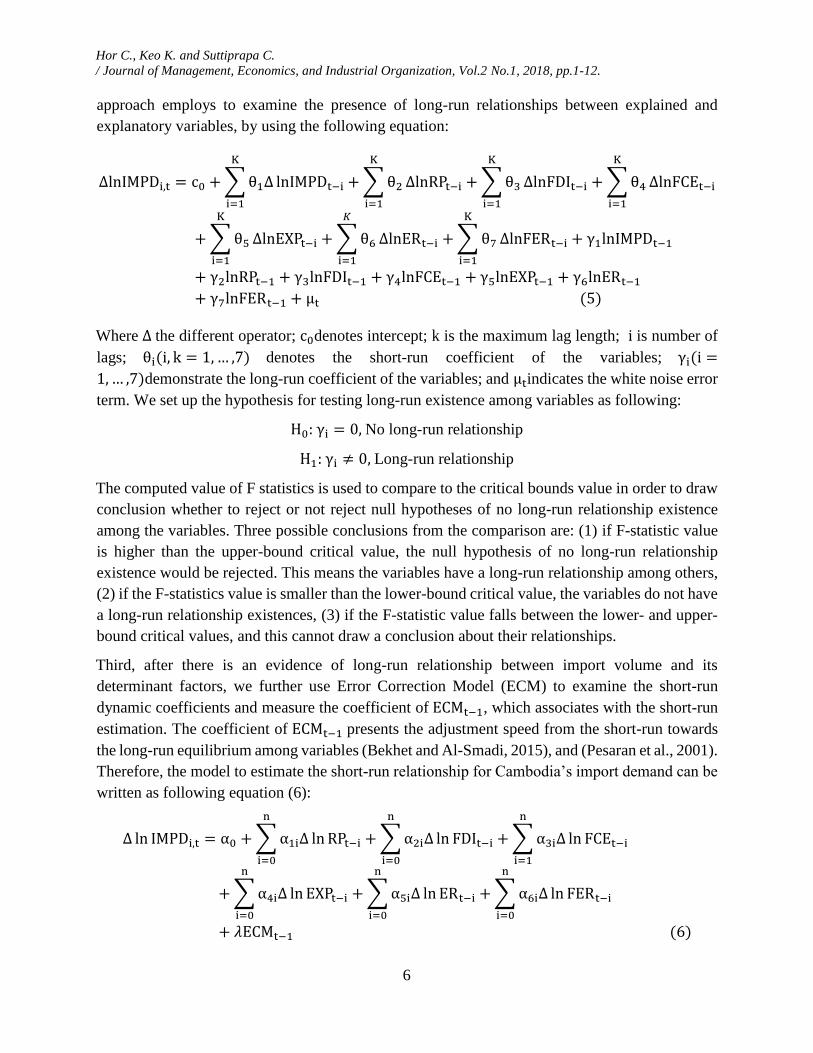
approach employs to examine the presence of long-run relationships between explained and
explanatory variables, by using the following equation:
∆lnIMPDi,t = c0 + ∑ θ1∆
K
i=1
lnIMPDt−i + ∑ θ2
K
i=1
∆lnRPt−i + ∑ θ3
K
i=1
∆lnFDIt−i + ∑ θ4
K
i=1
∆lnFCEt−i
+ ∑ θ5
K
i=1
∆lnEXPt−i + ∑ θ6
𝐾
i=1
∆lnERt−i + ∑ θ7
K
i=1
∆lnFERt−i + γ1lnIMPDt−1
+ γ2lnRPt−1 + γ3lnFDIt−1 + γ4lnFCEt−1 + γ5lnEXPt−1 + γ6lnERt−1
+ γ7lnFERt−1 + μt (5)
Where ∆ the different operator; c0denotes intercept; k is the maximum lag length; i is number of
lags; θi(i, k = 1, … ,7) denotes the short-run coefficient of the variables; γi(i =
1, … ,7)demonstrate the long-run coefficient of the variables; and μtindicates the white noise error
term. We set up the hypothesis for testing long-run existence among variables as following:
H0: γi = 0, No long-run relationship
H1: γi ≠ 0, Long-run relationship
The computed value of F statistics is used to compare to the critical bounds value in order to draw
conclusion whether to reject or not reject null hypotheses of no long-run relationship existence
among the variables. Three possible conclusions from the comparison are: (1) if F-statistic value
is higher than the upper-bound critical value, the null hypothesis of no long-run relationship
existence would be rejected. This means the variables have a long-run relationship among others,
(2) if the F-statistics value is smaller than the lower-bound critical value, the variables do not have
a long-run relationship existences, (3) if the F-statistic value falls between the lower- and upper-
bound critical values, and this cannot draw a conclusion about their relationships.
Third, after there is an evidence of long-run relationship between import volume and its
determinant factors, we further use Error Correction Model (ECM) to examine the short-run
dynamic coefficients and measure the coefficient of ECMt−1, which associates with the short-run
estimation. The coefficient of ECMt−1 presents the adjustment speed from the short-run towards
the long-run equilibrium among variables (Bekhet and Al-Smadi, 2015), and (Pesaran et al., 2001).
Therefore, the model to estimate the short-run relationship for Cambodia’s import demand can be
written as following equation (6):
∆ ln IMPDi,t = α0 + ∑ α1i∆ ln RPt−i
n
i=0
+ ∑ α2i∆ ln FDIt−i
n
i=0
+ ∑ α3i∆ ln FCEt−i
n
i=1
+ ∑ α4i∆ ln EXPt−i
n
i=0
+ ∑ α5i∆ ln ERt−i + ∑ α6i∆ ln FERt−i
n
i=0
n
i=0
+ 𝜆ECMt−1 (6)
Hor C., Keo K. and Suttiprapa C.
/ Journal of Management, Economics, and Industrial Organization, Vol.2 No.1, 2018, pp.1-12.
7
Where, α0 shows the intercept; αji(j, i = 1, … ,6) denotes the short-run coefficients; 𝜆 presents
coefficient of the lagged error correction term (ECMt−1). The coefficient of ECMt−1 must be
statistically negative significance (Pesaran et al., 2001).
Finally, several diagnostic tests are used to ensure that all the models are reliable and well-perform.
The serial correlation (Godfrey, 1978), normal distribution (Jarque and Bera, 1980),
heteroscedasticity (White, 1980), and the cumulative sum of recursive residuals (CUSUM) to
assess the stability of the model (Brown et al., 1975) will be utilized in this analysis.
5. Results and Discussion
5.1 Unit Root Test Results
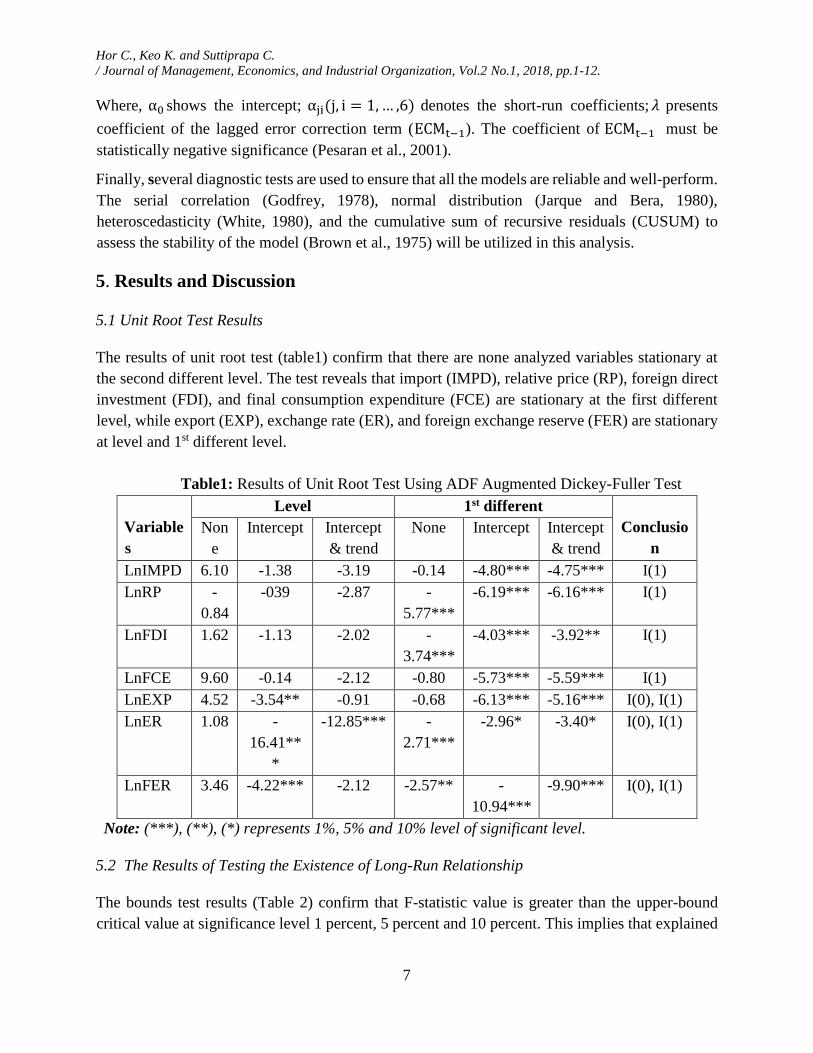
The results of unit root test (table1) confirm that there are none analyzed variables stationary at
the second different level. The test reveals that import (IMPD), relative price (RP), foreign direct
investment (FDI), and final consumption expenditure (FCE) are stationary at the first different
level, while export (EXP), exchange rate (ER), and foreign exchange reserve (FER) are stationary
at level and 1st different level.
Table1: Results of Unit Root Test Using ADF Augmented Dickey-Fuller Test
Variable
s
Level 1st different
Conclusio
n
Non
e
Intercept Intercept
& trend
None Intercept Intercept
& trend
LnIMPD 6.10 -1.38 -3.19 -0.14 -4.80*** -4.75*** I(1)
LnRP -
0.84
-039 -2.87 -
5.77***
-6.19*** -6.16*** I(1)
LnFDI 1.62 -1.13 -2.02 -
3.74***
-4.03*** -3.92** I(1)
LnFCE 9.60 -0.14 -2.12 -0.80 -5.73*** -5.59*** I(1)
LnEXP 4.52 -3.54** -0.91 -0.68 -6.13*** -5.16*** I(0), I(1)
LnER 1.08 -
16.41**
*
-12.85*** -
2.71***
-2.96* -3.40* I(0), I(1)
LnFER 3.46 -4.22*** -2.12 -2.57** -
10.94***
-9.90*** I(0), I(1)
Note: (***), (**), (*) represents 1%, 5% and 10% level of significant level.
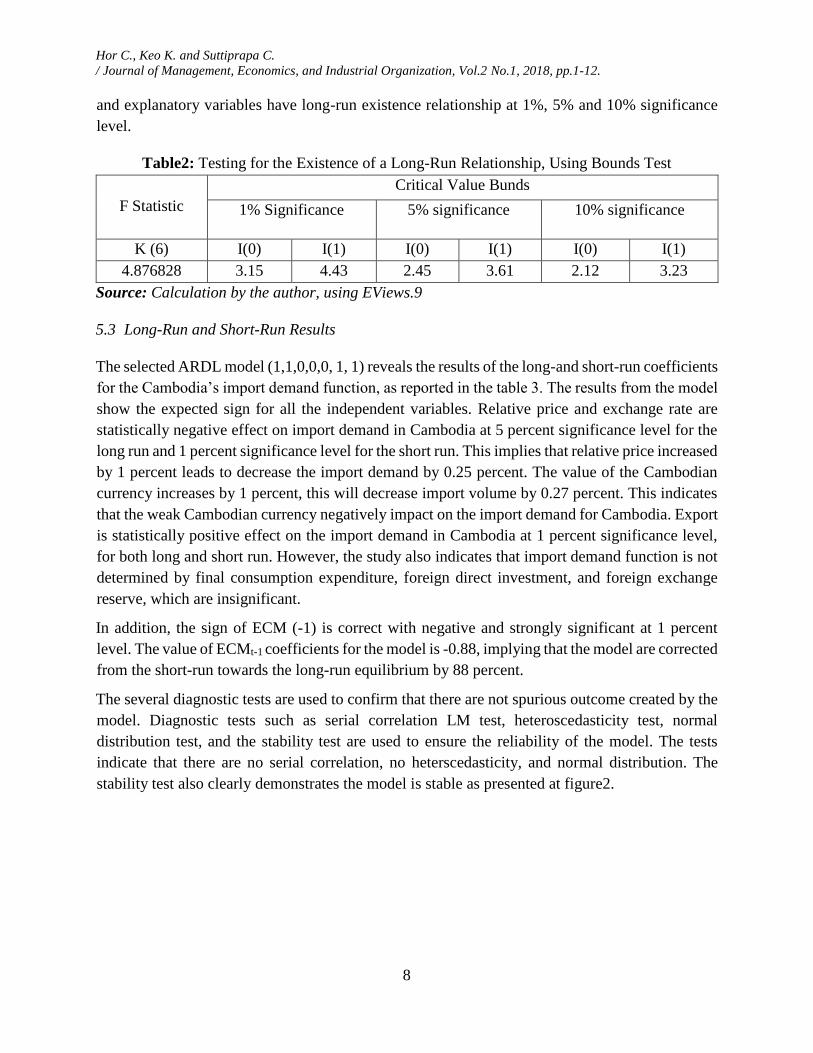
5.2 The Results of Testing the Existence of Long-Run Relationship
The bounds test results (Table 2) confirm that F-statistic value is greater than the upper-bound
critical value at significance level 1 percent, 5 percent and 10 percent. This implies that explained
Hor C., Keo K. and Suttiprapa C.
/ Journal of Management, Economics, and Industrial Organization, Vol.2 No.1, 2018, pp.1-12.
8
and explanatory variables have long-run existence relationship at 1%, 5% and 10% significance
level.
Table2: Testing for the Existence of a Long-Run Relationship, Using Bounds Test
F Statistic
Critical Value Bunds
1% Significance 5% significance 10% significance
K (6) I(0) I(1) I(0) I(1) I(0) I(1)
4.876828 3.15 4.43 2.45 3.61 2.12 3.23
Source: Calculation by the author, using EViews.9
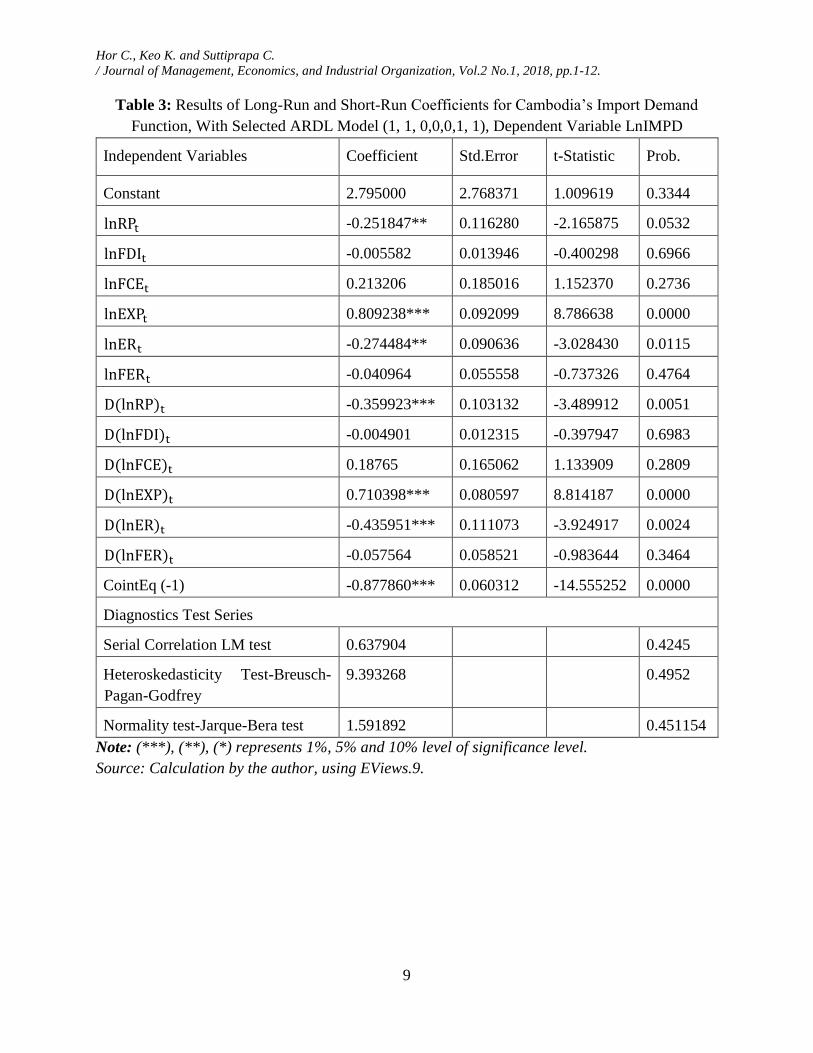
5.3 Long-Run and Short-Run Results
The selected ARDL model (1,1,0,0,0, 1, 1) reveals the results of the long-and short-run coefficients
for the Cambodia’s import demand function, as reported in the table 3. The results from the model
show the expected sign for all the independent variables. Relative price and exchange rate are
statistically negative effect on import demand in Cambodia at 5 percent significance level for the
long run and 1 percent significance level for the short run. This implies that relative price increased
by 1 percent leads to decrease the import demand by 0.25 percent. The value of the Cambodian
currency increases by 1 percent, this will decrease import volume by 0.27 percent. This indicates
that the weak Cambodian currency negatively impact on the import demand for Cambodia. Export
is statistically positive effect on the import demand in Cambodia at 1 percent significance level,
for both long and short run. However, the study also indicates that import demand function is not
determined by final consumption expenditure, foreign direct investment, and foreign exchange
reserve, which are insignificant.
In addition, the sign of ECM (-1) is correct with negative and strongly significant at 1 percent
level. The value of ECMt-1 coefficients for the model is -0.88, implying that the model are corrected
from the short-run towards the long-run equilibrium by 88 percent.
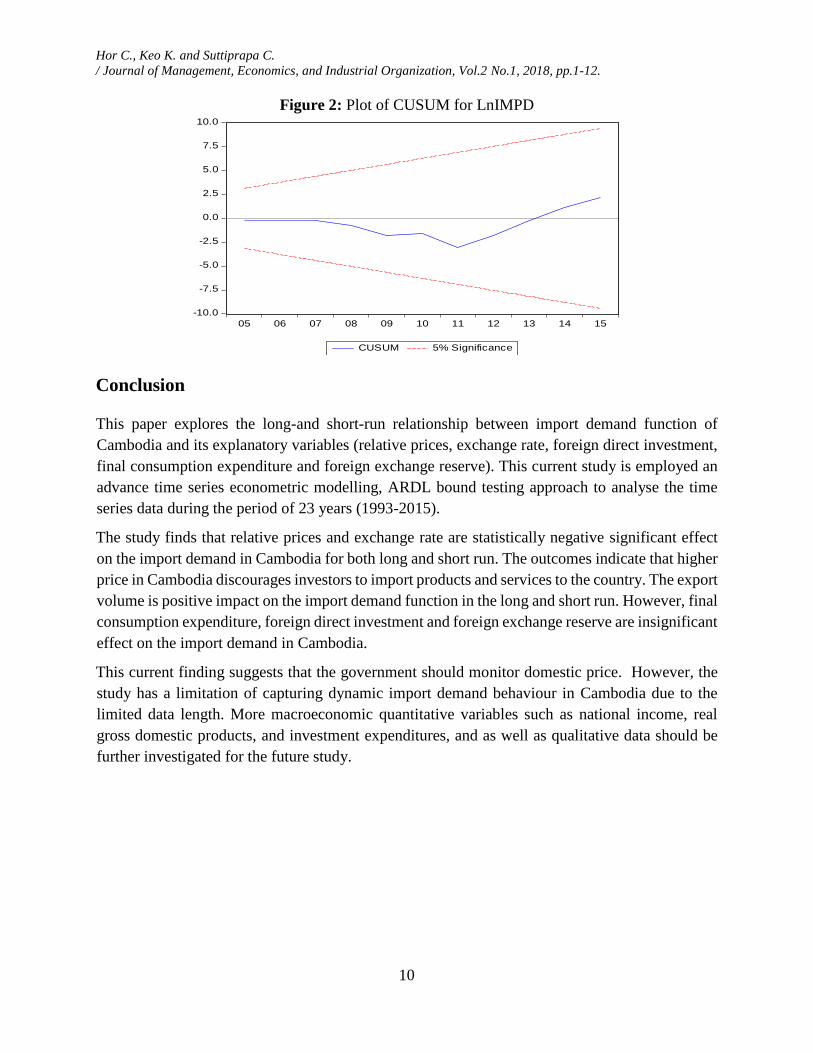
The several diagnostic tests are used to confirm that there are not spurious outcome created by the
model. Diagnostic tests such as serial correlation LM test, heteroscedasticity test, normal
distribution test, and the stability test are used to ensure the reliability of the model. The tests
indicate that there are no serial correlation, no heterscedasticity, and normal distribution. The
stability test also clearly demonstrates the model is stable as presented at figure2.
Hor C., Keo K. and Suttiprapa C.
/ Journal of Management, Economics, and Industrial Organization, Vol.2 No.1, 2018, pp.1-12.
9
Table 3: Results of Long-Run and Short-Run Coefficients for Cambodia’s Import Demand
Function, With Selected ARDL Model (1, 1, 0,0,0,1, 1), Dependent Variable LnIMPD
Independent Variables Coefficient Std.Error t-Statistic Prob.
Constant 2.795000 2.768371 1.009619 0.3344
lnRPt -0.251847** 0.116280 -2.165875 0.0532
lnFDIt -0.005582 0.013946 -0.400298 0.6966
lnFCEt 0.213206 0.185016 1.152370 0.2736
lnEXPt 0.809238*** 0.092099 8.786638 0.0000
lnERt -0.274484** 0.090636 -3.028430 0.0115
lnFERt -0.040964 0.055558 -0.737326 0.4764
D(lnRP)t -0.359923*** 0.103132 -3.489912 0.0051
D(lnFDI)t -0.004901 0.012315 -0.397947 0.6983
D(lnFCE)t 0.18765 0.165062 1.133909 0.2809
D(lnEXP)t 0.710398*** 0.080597 8.814187 0.0000
D(lnER)t -0.435951*** 0.111073 -3.924917 0.0024
D(lnFER)t -0.057564 0.058521 -0.983644 0.3464
CointEq (-1) -0.877860*** 0.060312 -14.555252 0.0000
Diagnostics Test Series
Serial Correlation LM test 0.637904 0.4245
Heteroskedasticity Test-Breusch-
Pagan-Godfrey
9.393268 0.4952
Normality test-Jarque-Bera test 1.591892 0.451154
Note: (***), (**), (*) represents 1%, 5% and 10% level of significance level.
Source: Calculation by the author, using EViews.9.
Hor C., Keo K. and Suttiprapa C.
/ Journal of Management, Economics, and Industrial Organization, Vol.2 No.1, 2018, pp.1-12.
10
Figure 2: Plot of CUSUM for LnIMPD
-10.0
-7.5
-5.0
-2.5
0.0
2.5
5.0
7.5
10.0
05 06 07 08 09 10 11 12 13 14 15
CUSUM 5% Significance
Conclusion
This paper explores the long-and short-run relationship between import demand function of
Cambodia and its explanatory variables (relative prices, exchange rate, foreign direct investment,
final consumption expenditure and foreign exchange reserve). This current study is employed an
advance time series econometric modelling, ARDL bound testing approach to analyse the time
series data during the period of 23 years (1993-2015).
The study finds that relative prices and exchange rate are statistically negative significant effect
on the import demand in Cambodia for both long and short run. The outcomes indicate that higher
price in Cambodia discourages investors to import products and services to the country. The export
volume is positive impact on the import demand function in the long and short run. However, final
consumption expenditure, foreign direct investment and foreign exchange reserve are insignificant
effect on the import demand in Cambodia.
This current finding suggests that the government should monitor domestic price. However, the
study has a limitation of capturing dynamic import demand behaviour in Cambodia due to the
limited data length. More macroeconomic quantitative variables such as national income, real
gross domestic products, and investment expenditures, and as well as qualitative data should be
further investigated for the future study.
Hor C., Keo K. and Suttiprapa C.
/ Journal of Management, Economics, and Industrial Organization, Vol.2 No.1, 2018, pp.1-12.
11
References
Abbott, A. J. and Seddighi, H. R. (1996), "Aggregate Imports and Expenditure Components in
the UK: An Empirical Analysis", Applied Economics, Vol.28 No. 9, pp. 1119-1125.
Alias, M. H., Tang, T. C., and Othman, J. (2001), "Aggregate Import Demand and Expenditure
Components in Five ASEAN Countries: An Empirical Study". Jurnal Ekonomi Malaysia,
Vol.35 No.2001, pp. 37-60.
Aziz, M. N. (2013), "Modelling Import Demand Function for a Developing Country: An
Empirical Approach". Asian-African Journal of Economics and Econometrics, Vol.13
No.1, pp.1-15.
Bekhet, H., and Al-Smadi, R. (2015), "Determinants of Jordanian Foreign Direct Investment
Inflows: Bounds Testing Approach". Economic Modelling, Vol. 46, pp. 27-35.
Butts, H. C., and Mitchell, I. S. (2012), "An Empirical Analysis of Small Country Import
Demand Function : A Case of Guyana". Problems and Perspectives in
Management,Vol.10 No.1, pp. 105-121.
GlobalEDGE. (2016), "Cambodia: Trade Statistics", avaliable at:
http://globaledge.msu.edu/countries/cambodia/tradestats (accessed December 2016).
Godfrey, G. (1995), "Testing for Higher Order Serial Correlation in Regression Equations When
the Regression Contain Lagged Dependent Varibles". Econometrica, pp. 1303-1310.
Jarque, C., and Bera, A. (1980), "Efficient Tests for Normality, Homskedasticity and Serial
Independence of Regression Residuals" . Economic Letters, pp. 233-259
Mervar, A. (1994), "Estimates of the traditional export and import demand functions in the case
of Croatia." Croatian economic survey, No.1, pp. 79-93.
Muhammad, S. D, and Zafar, S. (2016), "Determinants of Imports Demand Functions of
Pakistan: An ARDL Bound Testing Approach." International Journal of Business,
Economics and Management, Vol.3 No.9, pp.113-121.
Narayan, S., and Narayan, P. K. (2005), "An Empirical Analysis of Fiji's Import Demand
Function." Journal of Economic Studies, Vol. 32 No.2, pp. 158-168, doi:
10.1108/01443580510600931
Pesaran, M., and Pesaran, B. (1997), "Working with Microfit 4.0: Interactive Econometric
Analysis", Oxford, Oxford University Press.
Pesaran, M., Shin, Y., and Smith, R. (1996), "Testing for the Existence of a Long-run
Relationship". Cambridge: University of Cambridge.
Pesaran, M., Shin, Y., and Smith, R. (1999), "Bounds Testing Approaches to the Analysis of Long
Run Relationship". Cambridge .
Pesaran, M. H., Shin, Y., and Smith, R. J. (2001), "Bounds Testing Approaches to the Analysis
of Level Relationships". Journal of Applied Econometrics, Vol.16 No.3, pp. 289-326.
TheWorldBank. (2016), "Country Overview: Cambodia". available at:
http://www.worldbank.org/en/country/cambodia/overview (accessed December 2016).
White, H. (1980), "A Heteroskedasticity-Consistent Covariance Matrix Estimator and a Ddirect
Test of Heteroskedasticity". Econometrica, pp. 773-780.
Hor C., Keo K. and Suttiprapa C.
/ Journal of Management, Economics, and Industrial Organization, Vol.2 No.1, 2018, pp.1-12.
12
Yue, Y. (2010), "An Econometric Estimation of Import Demand Function for Cote d'ivoire".
International Journal of Business and Management, Vol.5 No.2.
Ziramba, E., and Bbuku, M. (2013), "An Empirical Analysis of Aggregate Import Demand and
Expenditure Components in Namibia". International Journal of Economics and
Research, Vol. 1 No.4, pp. 39-50.