an empirical evaluation of the impact of test-driven...
TRANSCRIPT

An Empirical Evaluation of the Impact ofTest-Driven Development on Software Quality
By
Copyright 2006David Scott Janzen
M.S., Computer Science, University of Kansas, 1993
Submitted to the Department of Electrical Engineering andComputer Science and the Faculty of the Graduate School of
the University of Kansas in partial fulfillment of therequirements for the degree of Doctor of Philosophy.
Dr. Hossein Saiedian, Chairman
Committee Members
Dr. Arvin Agah
Dr. Perry Alexander
Dr. John Gauch
Dr. Carey Johnson
Date defended:

The Dissertation Committee for David Scott Janzen certifies that this is theapproved version of the following dissertation:
An Empirical Evaluation of the Impact ofTest-Driven Development on Software Quality
Committee:
Dr. Hossein Saiedian, Chairman
Dr. Arvin Agah
Dr. Perry Alexander
Dr. John Gauch
Dr. Carey Johnson
Date approved:
ii

Abstract
Test-driven development (TDD) has gained recent attention with the popularity ofthe Extreme Programming agile software development methodology. Advocates ofTDD rely primarily on anecdotal evidence with relatively little empirical evidence ofthe benefits of the practice. This research is the first comprehensive evaluation ofhow TDD affects software architecture and internal design quality.
Formal controlled experiments were conducted in undergraduate and graduateacademic courses, in a professional training course, and with in-house professionaldevelopment projects in a Fortune 500 company. The experiments involved over230 student and professional programmers working on almost five hundred soft-ware projects ranging in size from one hundred to over 30,000 lines of code. Theresearch also included a case study of fifteen software projects developed over fiveyears in a Fortune 500 corporation.
This research demonstrates that software developers applying a test-first (TDD)approach are likely to improve some software quality aspects at minimal cost overa comparable test-last approach. In particular this research has shown statisticallysignificant differences in the areas of code complexity, size, and testing. These inter-nal quality differences can substantially improve external software quality (defects),software maintainability, software understandability, and software reusability. Fur-ther this research has shown that mature programmers who have used both thetest-first and test-last development approaches prefer the test-first approach.
In addition, this research contributes a pedagogical approach called test-drivenlearning (TDL) that integrates TDD instruction at all levels. TDL was partially appliedat all academic levels from early programming instruction through professional con-tinuing education. Results indicate some differences between beginning and maturedevelopers including reluctance by early programmers to adopt the TDD approach.
By providing the first substantial empirical evidence on TDD and internal soft-ware quality, this research establishes a benchmark and framework for future em-pirical studies. By focusing on both software design and software testing, this re-search is already raising awareness of TDD as both a design and testing approachthrough publications and international awards.
iii
Acknowledgements
Although this dissertation has but one author, many people have contributed invaried but significant ways. I have been blessed with their wisdom, encouragement,and love.
I would like to thank my committee. First and foremost I thank my advisor, Dr.Hossein Saiedian who from the day we met has been an enthusiastic believer in meand this work. Dr. Saiedian has provided sound guidance every step of the way, andhe has been a joy with whom to work. Many thanks to Dr. Arvin Agah, Dr. PerryAlexander, Dr. John Gauch, and Dr. Carey Johnson. Your time, contributions, andadvice have been a gift and have greatly improved this research.
In addition to my committee members, I am in debt to Dr. Man Kong and DaveMelton for allowing me to conduct experiments in their courses and company. Theirtrust in me was greatly appreciated. Similarly I want to thank James O’Hara for hisassistance with the CS2 experiment and interest in the work.
A special thanks to my colleagues Brian Bowser, Kathryn Mitchell, and Jeff Zort-man who made the industry experiments and case study possible. Their time, con-tributions, and interest in the research enriched the work and extended its impor-tance and credibility. An extra thanks to Jeff for promptly reviewing and improvingChapter 5.
Finally and most importantly I want to thank my family whose love and joy blessme every day. Karen whom I treasure, thank you for how you cared for me andthe boys throughout this journey. Many thanks for all the data entry, patience,and encouragement. This dissertation is as much your accomplishment as mine.Thank you Alex and Simon for your unbridled enthusiasm, eager celebrations ofmilestones, and regular requests for study breaks. Yes, we can go to the beachnow! I also want to thank my parents. You’ve believed in me from the very begin-ning. Thank you for encouraging my youthful curiosity by fielding my barrage ofquestions. As a Dad, I finally appreciate what you went through.
iv
Contents
Title i
Acceptance ii
Abstract iii
Acknowledgements iv
1 Introduction 11.1 Objective . . . . . . . . . . . . . . . . . . . . . . . . . . . . . . . . . . . . . . . 11.2 State of Software Construction . . . . . . . . . . . . . . . . . . . . . . . . . 11.3 State of Software Research . . . . . . . . . . . . . . . . . . . . . . . . . . . . 2
1.3.1 Empirical Software Engineering . . . . . . . . . . . . . . . . . . . . . 31.4 Summary of Research . . . . . . . . . . . . . . . . . . . . . . . . . . . . . . . 31.5 Introduction to Test-Driven Development . . . . . . . . . . . . . . . . . . 41.6 Significance of Research Contributions . . . . . . . . . . . . . . . . . . . . 51.7 Summary of Remaining Chapters . . . . . . . . . . . . . . . . . . . . . . . . 6
2 Test-Driven Development in Context 82.1 Definitions of TDD . . . . . . . . . . . . . . . . . . . . . . . . . . . . . . . . . 8
2.1.1 Significance of “Test” in TDD . . . . . . . . . . . . . . . . . . . . . . 82.1.2 Significance of “Driven” in TDD . . . . . . . . . . . . . . . . . . . . 92.1.3 Significance of “Development” in TDD . . . . . . . . . . . . . . . . 102.1.4 A New Definition of TDD . . . . . . . . . . . . . . . . . . . . . . . . . 10
2.2 Survey of Software Development Methodologies . . . . . . . . . . . . . . 112.3 Historical Context of TDD . . . . . . . . . . . . . . . . . . . . . . . . . . . . 13
2.3.1 Early Test-Early Examples . . . . . . . . . . . . . . . . . . . . . . . . 132.3.2 Incremental, Iterative, and Evolutionary Development . . . . . . 14
2.4 Emergence of Automated Testing Tools . . . . . . . . . . . . . . . . . . . 142.5 Early Testing in Curriculum . . . . . . . . . . . . . . . . . . . . . . . . . . . 162.6 Recent Context of TDD . . . . . . . . . . . . . . . . . . . . . . . . . . . . . . 17
2.6.1 Emergence of Agile Methods . . . . . . . . . . . . . . . . . . . . . . 172.6.2 Measuring Adoption of Agile Methods . . . . . . . . . . . . . . . . 17
v

3 Related Work 193.1 XP and TDD Observations . . . . . . . . . . . . . . . . . . . . . . . . . . . . 193.2 Evaluative Research on TDD in Industry . . . . . . . . . . . . . . . . . . . 223.3 Evaluative Research on TDD in Academia . . . . . . . . . . . . . . . . . . 233.4 Research Classification . . . . . . . . . . . . . . . . . . . . . . . . . . . . . . 23
3.4.1 Definition of “Topic” Attribute . . . . . . . . . . . . . . . . . . . . . 243.4.2 Definition of “Approach” Attribute . . . . . . . . . . . . . . . . . . 243.4.3 Definition of “Method” Attribute . . . . . . . . . . . . . . . . . . . . 253.4.4 Definition of “Reference Discipline” Attribute . . . . . . . . . . . . 253.4.5 Definition of “Level of Analysis” Attribute . . . . . . . . . . . . . . 25
3.5 Factors in Software Practice Adoption . . . . . . . . . . . . . . . . . . . . . 26
4 Research Methodology 274.1 TDD Example . . . . . . . . . . . . . . . . . . . . . . . . . . . . . . . . . . . . 27
4.1.1 Java Example . . . . . . . . . . . . . . . . . . . . . . . . . . . . . . . . 274.1.2 C++ Example . . . . . . . . . . . . . . . . . . . . . . . . . . . . . . . . 37
4.2 Experiment Design . . . . . . . . . . . . . . . . . . . . . . . . . . . . . . . . . 374.2.1 Hypothesis . . . . . . . . . . . . . . . . . . . . . . . . . . . . . . . . . 444.2.2 Formalized Hypotheses . . . . . . . . . . . . . . . . . . . . . . . . . 444.2.3 TDD in a Traditional Development Process . . . . . . . . . . . . . 454.2.4 Experiment Overview . . . . . . . . . . . . . . . . . . . . . . . . . . . 464.2.5 Academic Experiments . . . . . . . . . . . . . . . . . . . . . . . . . . 524.2.6 Industry Experiments . . . . . . . . . . . . . . . . . . . . . . . . . . . 564.2.7 Software Metrics and Analysis . . . . . . . . . . . . . . . . . . . . . 594.2.8 Assessment and Validity . . . . . . . . . . . . . . . . . . . . . . . . . 64
5 Experiments in Industry 655.1 Metrics Collection and Analysis . . . . . . . . . . . . . . . . . . . . . . . . . 65
5.1.1 Method-Level Metrics . . . . . . . . . . . . . . . . . . . . . . . . . . . 665.1.2 Class-Level Metrics . . . . . . . . . . . . . . . . . . . . . . . . . . . . 665.1.3 Interface-Level Metrics . . . . . . . . . . . . . . . . . . . . . . . . . . 675.1.4 Project-Level Metrics . . . . . . . . . . . . . . . . . . . . . . . . . . . 675.1.5 Test Metrics . . . . . . . . . . . . . . . . . . . . . . . . . . . . . . . . . 675.1.6 Subjective and Evaluative Metrics . . . . . . . . . . . . . . . . . . . 70
5.2 Formal Industry Experiment #1:No-Tests - Test-First . . . . . . . . . . . . . . . . . . . . . . . . . . . . . . . . 715.2.1 Experiment Design and Context . . . . . . . . . . . . . . . . . . . . 715.2.2 Internal Quality Results . . . . . . . . . . . . . . . . . . . . . . . . . 725.2.3 Test Results . . . . . . . . . . . . . . . . . . . . . . . . . . . . . . . . . 77
5.3 Formal Industry Experiment #2:Test-Last - Test-First . . . . . . . . . . . . . . . . . . . . . . . . . . . . . . . . 795.3.1 Experiment Design and Context . . . . . . . . . . . . . . . . . . . . 79
vi

5.3.2 Internal Quality Results . . . . . . . . . . . . . . . . . . . . . . . . . 805.3.3 Test Results . . . . . . . . . . . . . . . . . . . . . . . . . . . . . . . . . 87
5.4 Formal Industry Experiment #3:Test-First - Test-Last . . . . . . . . . . . . . . . . . . . . . . . . . . . . . . . . 875.4.1 Experiment Design and Context . . . . . . . . . . . . . . . . . . . . 875.4.2 Internal Quality Results . . . . . . . . . . . . . . . . . . . . . . . . . 885.4.3 Test Results . . . . . . . . . . . . . . . . . . . . . . . . . . . . . . . . . 915.4.4 Subjective and Evaluative Results . . . . . . . . . . . . . . . . . . . 915.4.5 Possible Explanations of Results . . . . . . . . . . . . . . . . . . . . 97
5.5 Industry Experiment in Training Course . . . . . . . . . . . . . . . . . . . 975.5.1 Experiment Design and Context . . . . . . . . . . . . . . . . . . . . 975.5.2 Internal Quality Results . . . . . . . . . . . . . . . . . . . . . . . . . 985.5.3 Test Results . . . . . . . . . . . . . . . . . . . . . . . . . . . . . . . . . 985.5.4 Subjective and Evaluative Results . . . . . . . . . . . . . . . . . . . 99
5.6 Industry Case Study . . . . . . . . . . . . . . . . . . . . . . . . . . . . . . . . 1035.6.1 Context and Overview . . . . . . . . . . . . . . . . . . . . . . . . . . 1035.6.2 Internal Quality Results . . . . . . . . . . . . . . . . . . . . . . . . . 1045.6.3 Test Results . . . . . . . . . . . . . . . . . . . . . . . . . . . . . . . . . 110
6 Experiments in Academia 1146.1 Metrics Collection and Analysis . . . . . . . . . . . . . . . . . . . . . . . . . 1146.2 Undergraduate Software Engineering Experiment . . . . . . . . . . . . . . 117
6.2.1 Experiment Design and Context . . . . . . . . . . . . . . . . . . . . 1176.2.2 Internal Quality Results . . . . . . . . . . . . . . . . . . . . . . . . . 1186.2.3 Productivity . . . . . . . . . . . . . . . . . . . . . . . . . . . . . . . . . 1216.2.4 Test Results . . . . . . . . . . . . . . . . . . . . . . . . . . . . . . . . . 1256.2.5 Programmer Perceptions . . . . . . . . . . . . . . . . . . . . . . . . . 1266.2.6 Longitudinal Results . . . . . . . . . . . . . . . . . . . . . . . . . . . 128
6.3 Graduate Software Engineering Experiment . . . . . . . . . . . . . . . . . 1286.3.1 Experiment Design and Context . . . . . . . . . . . . . . . . . . . . 1286.3.2 Internal Quality Results . . . . . . . . . . . . . . . . . . . . . . . . . 1296.3.3 Productivity Results . . . . . . . . . . . . . . . . . . . . . . . . . . . . 1326.3.4 Test Results . . . . . . . . . . . . . . . . . . . . . . . . . . . . . . . . . 1356.3.5 Programmer Perceptions . . . . . . . . . . . . . . . . . . . . . . . . . 1366.3.6 Longitudinal Results . . . . . . . . . . . . . . . . . . . . . . . . . . . 137
6.4 Combined Software Engineering Experiment . . . . . . . . . . . . . . . . . 1376.4.1 Internal Quality Results . . . . . . . . . . . . . . . . . . . . . . . . . 1386.4.2 Test Results . . . . . . . . . . . . . . . . . . . . . . . . . . . . . . . . . 141
6.5 Programming 1 Experiment . . . . . . . . . . . . . . . . . . . . . . . . . . . 1416.5.1 Experiment Design and Context . . . . . . . . . . . . . . . . . . . . 1416.5.2 Internal Quality Results . . . . . . . . . . . . . . . . . . . . . . . . . 1436.5.3 Test Results . . . . . . . . . . . . . . . . . . . . . . . . . . . . . . . . . 148
vii

6.5.4 Productivity Results . . . . . . . . . . . . . . . . . . . . . . . . . . . . 1486.5.5 Subjective and Evaluative Results . . . . . . . . . . . . . . . . . . . 1506.5.6 Programmer Perceptions . . . . . . . . . . . . . . . . . . . . . . . . . 1506.5.7 Longitudinal Results . . . . . . . . . . . . . . . . . . . . . . . . . . . 151
6.6 Programming 2 Experiments . . . . . . . . . . . . . . . . . . . . . . . . . . 1516.6.1 Experiment Design and Context . . . . . . . . . . . . . . . . . . . . 1526.6.2 Internal Quality Results . . . . . . . . . . . . . . . . . . . . . . . . . 1536.6.3 Test Results . . . . . . . . . . . . . . . . . . . . . . . . . . . . . . . . . 1636.6.4 Productivity Results . . . . . . . . . . . . . . . . . . . . . . . . . . . . 1646.6.5 Subjective and Evaluative Results . . . . . . . . . . . . . . . . . . . 1656.6.6 Programmer Perceptions . . . . . . . . . . . . . . . . . . . . . . . . . 1666.6.7 Longitudinal Results . . . . . . . . . . . . . . . . . . . . . . . . . . . 166
7 Evaluation, Observation, and Discussion 1687.1 Empirical Evidence of TDD Efficacy . . . . . . . . . . . . . . . . . . . . . . 168
7.1.1 Quantitative Evidence: Testing . . . . . . . . . . . . . . . . . . . . . 1697.1.2 Quantitative Evidence: Complexity . . . . . . . . . . . . . . . . . . 1727.1.3 Quantitative Evidence: Coupling . . . . . . . . . . . . . . . . . . . . 1757.1.4 Quantitative Evidence: Cohesion . . . . . . . . . . . . . . . . . . . . 1787.1.5 Quantitative Evidence: Size . . . . . . . . . . . . . . . . . . . . . . . 1827.1.6 Quantitative Evidence: Productivity and Evaluation . . . . . . . . 1847.1.7 Qualitative Evidence: Programmer Attitudes . . . . . . . . . . . . 1857.1.8 Empirical Evidence Summary and Conclusions . . . . . . . . . . . 191
7.2 Evaluation and External Validity . . . . . . . . . . . . . . . . . . . . . . . . 1937.2.1 Peer-Reviewed Publications . . . . . . . . . . . . . . . . . . . . . . . 1947.2.2 Awards and Grants . . . . . . . . . . . . . . . . . . . . . . . . . . . . 1957.2.3 Presentations . . . . . . . . . . . . . . . . . . . . . . . . . . . . . . . . 195
7.3 Additional Contributions . . . . . . . . . . . . . . . . . . . . . . . . . . . . . 1957.3.1 Framework for Empirical TDD Studies . . . . . . . . . . . . . . . . 1957.3.2 Pedagogical Contributions . . . . . . . . . . . . . . . . . . . . . . . . 196
7.4 Summary and Future Work . . . . . . . . . . . . . . . . . . . . . . . . . . . 197
Bibliography 198
A Test-Driven Learning 205A.1 Introduction to TDL . . . . . . . . . . . . . . . . . . . . . . . . . . . . . . . . 205A.2 TDL Objectives . . . . . . . . . . . . . . . . . . . . . . . . . . . . . . . . . . . 207A.3 Related Work . . . . . . . . . . . . . . . . . . . . . . . . . . . . . . . . . . . . 208A.4 TDL in Introductory Courses . . . . . . . . . . . . . . . . . . . . . . . . . . 209A.5 TDL in later courses . . . . . . . . . . . . . . . . . . . . . . . . . . . . . . . . 212A.6 Assessment and Perceptions . . . . . . . . . . . . . . . . . . . . . . . . . . 213A.7 Conclusions of early TDL study . . . . . . . . . . . . . . . . . . . . . . . . . 215
viii

B TDL and TDD Training Materials 216B.1 Sample Academic Materials . . . . . . . . . . . . . . . . . . . . . . . . . . . 216
B.1.1 CS1 Lecture Slides . . . . . . . . . . . . . . . . . . . . . . . . . . . . . 216B.1.2 Sample CS1 Lab . . . . . . . . . . . . . . . . . . . . . . . . . . . . . . 219B.1.3 Sample CS2 Lab . . . . . . . . . . . . . . . . . . . . . . . . . . . . . . 228B.1.4 Sample CS1 Project . . . . . . . . . . . . . . . . . . . . . . . . . . . . 234B.1.5 Sample CS2 Project . . . . . . . . . . . . . . . . . . . . . . . . . . . . 237B.1.6 Sample SE Project . . . . . . . . . . . . . . . . . . . . . . . . . . . . . 242B.1.7 Sample SE Time Sheet . . . . . . . . . . . . . . . . . . . . . . . . . . 246
B.2 Sample Professional Training Materials . . . . . . . . . . . . . . . . . . . . 247B.2.1 Sample TDD Training Slides . . . . . . . . . . . . . . . . . . . . . . . 247B.2.2 Bowling Assignment . . . . . . . . . . . . . . . . . . . . . . . . . . . 256
C Custom-built Analysis Tools 259C.1 Ant Script . . . . . . . . . . . . . . . . . . . . . . . . . . . . . . . . . . . . . . 259C.2 CCCCRunner . . . . . . . . . . . . . . . . . . . . . . . . . . . . . . . . . . . . 261C.3 AssertCounter . . . . . . . . . . . . . . . . . . . . . . . . . . . . . . . . . . . 261C.4 CCCCDriver . . . . . . . . . . . . . . . . . . . . . . . . . . . . . . . . . . . . . 262C.5 CCCC Analyzer . . . . . . . . . . . . . . . . . . . . . . . . . . . . . . . . . . . 266
D Metrics 271D.1 Robert C. Martin Suite . . . . . . . . . . . . . . . . . . . . . . . . . . . . . . . 271D.2 Eclipse Metrics . . . . . . . . . . . . . . . . . . . . . . . . . . . . . . . . . . . 272
D.2.1 Class Metrics . . . . . . . . . . . . . . . . . . . . . . . . . . . . . . . . 272D.3 JStyle . . . . . . . . . . . . . . . . . . . . . . . . . . . . . . . . . . . . . . . . . 272
D.3.1 Project-wide Metrics . . . . . . . . . . . . . . . . . . . . . . . . . . . 272D.3.2 Module-wide Metrics . . . . . . . . . . . . . . . . . . . . . . . . . . . 275
D.4 Class-wide Metrics . . . . . . . . . . . . . . . . . . . . . . . . . . . . . . . . . 275D.4.1 Method-wide Metrics . . . . . . . . . . . . . . . . . . . . . . . . . . . 280
D.5 Krakatau Professional . . . . . . . . . . . . . . . . . . . . . . . . . . . . . . . 282D.5.1 Project Metrics . . . . . . . . . . . . . . . . . . . . . . . . . . . . . . . 282D.5.2 File Metrics . . . . . . . . . . . . . . . . . . . . . . . . . . . . . . . . . 285D.5.3 Class Metrics . . . . . . . . . . . . . . . . . . . . . . . . . . . . . . . . 288D.5.4 Method Metrics . . . . . . . . . . . . . . . . . . . . . . . . . . . . . . . 291
E Metrics Tools 296
F Surveys 304F.1 Academic Pre-Experiment Survey . . . . . . . . . . . . . . . . . . . . . . . . 304F.2 Academic Post-Experiment Survey . . . . . . . . . . . . . . . . . . . . . . . 309F.3 Industry Pre-Experiment Survey . . . . . . . . . . . . . . . . . . . . . . . . 314F.4 Industry Post-Experiment Survey . . . . . . . . . . . . . . . . . . . . . . . . 318F.5 Industry Design Quality Review Scorecard . . . . . . . . . . . . . . . . . . 323
ix

F.6 Academic Longitudinal Survey . . . . . . . . . . . . . . . . . . . . . . . . . 325F.7 Industry Longitudinal Survey . . . . . . . . . . . . . . . . . . . . . . . . . . 331
x
List of Figures
3.1 Basic Flow of XP . . . . . . . . . . . . . . . . . . . . . . . . . . . . . . . . . . 203.2 XP Practices . . . . . . . . . . . . . . . . . . . . . . . . . . . . . . . . . . . . . 203.3 XP Scale-Defined Practices . . . . . . . . . . . . . . . . . . . . . . . . . . . . 213.4 XP Time Scale-Defined Practices . . . . . . . . . . . . . . . . . . . . . . . . 213.5 XP Noise Reduction Practices . . . . . . . . . . . . . . . . . . . . . . . . . . 21
4.1 Television Channel Guide Use Cases . . . . . . . . . . . . . . . . . . . . . . 284.2 Television Channel Guide Java GUI . . . . . . . . . . . . . . . . . . . . . . . 284.3 Television Channel Guide C++ Screen Shot . . . . . . . . . . . . . . . . . . 284.4 Testing Show in Java . . . . . . . . . . . . . . . . . . . . . . . . . . . . . . . 294.5 JUnit GUI - All Tests Pass . . . . . . . . . . . . . . . . . . . . . . . . . . . . . 304.6 Java Show Class . . . . . . . . . . . . . . . . . . . . . . . . . . . . . . . . . . 314.7 Testing Java Exceptions . . . . . . . . . . . . . . . . . . . . . . . . . . . . . 314.8 JUnit Exception Failure . . . . . . . . . . . . . . . . . . . . . . . . . . . . . . 324.9 Channel Guide JUnit Test . . . . . . . . . . . . . . . . . . . . . . . . . . . . 324.10 Channel Guide UML Class Diagram Prior to Refactoring . . . . . . . . . . 334.11 Read Shows from File Test . . . . . . . . . . . . . . . . . . . . . . . . . . . . 334.12 Show Listing Data Structure Test . . . . . . . . . . . . . . . . . . . . . . . . 344.13 Channel Guide with Dependency Injection Test . . . . . . . . . . . . . . . 344.14 Channel Guide UML Class Diagram with Dependency Injection . . . . . 354.15 Testing Events in Java GUI . . . . . . . . . . . . . . . . . . . . . . . . . . . . 364.16 Testing Events in Java GUI cont. . . . . . . . . . . . . . . . . . . . . . . . . 374.17 Java GUI . . . . . . . . . . . . . . . . . . . . . . . . . . . . . . . . . . . . . . . 384.18 Java GUI cont. . . . . . . . . . . . . . . . . . . . . . . . . . . . . . . . . . . . . 394.19 Java GUI Event Handling . . . . . . . . . . . . . . . . . . . . . . . . . . . . . 404.20 C++ Channel Guide . . . . . . . . . . . . . . . . . . . . . . . . . . . . . . . . 414.21 C++ Channel Guide cont. . . . . . . . . . . . . . . . . . . . . . . . . . . . . . 424.22 C++ Channel Guide Tests . . . . . . . . . . . . . . . . . . . . . . . . . . . . . 434.23 Test-Last Flow . . . . . . . . . . . . . . . . . . . . . . . . . . . . . . . . . . . 464.24 Test-First Flow . . . . . . . . . . . . . . . . . . . . . . . . . . . . . . . . . . . 464.25 Overview of TDD Experiments . . . . . . . . . . . . . . . . . . . . . . . . . 474.26 Research Study Context Grid . . . . . . . . . . . . . . . . . . . . . . . . . . 514.27 CS1 Experiment . . . . . . . . . . . . . . . . . . . . . . . . . . . . . . . . . . 52
xi
4.28 CS2 Experiment . . . . . . . . . . . . . . . . . . . . . . . . . . . . . . . . . . 534.29 Software Engineering and Industry Training Experiments . . . . . . . . 554.30 Screenshot from HTML Pretty Print application. . . . . . . . . . . . . . . 554.31 Industry Experiment 1 . . . . . . . . . . . . . . . . . . . . . . . . . . . . . . 584.32 Industry Experiment 2 . . . . . . . . . . . . . . . . . . . . . . . . . . . . . . 584.33 Industry Experiment 3 . . . . . . . . . . . . . . . . . . . . . . . . . . . . . . 59
5.1 Industry Experiment 1 Method Metrics Radar Chart . . . . . . . . . . . . 775.2 Industry Experiment 2 Method Metrics Radar Chart . . . . . . . . . . . . 825.3 Industry Experiment 3 Method Metrics Radar Chart . . . . . . . . . . . . 905.4 Longitudinal Industry Programmer Opinions . . . . . . . . . . . . . . . . 1025.5 Industry Case Study Method Metrics Radar Chart . . . . . . . . . . . . . . 106
6.1 Undergraduate SE Experiment Method Metrics Radar Chart . . . . . . . 1216.2 Undergraduate SE Time Distribution by Team . . . . . . . . . . . . . . . . 1246.3 Undergraduate SE Programmer Opinions . . . . . . . . . . . . . . . . . . . 1276.4 Graduate SE Experiment Method Metrics Radar Chart . . . . . . . . . . . 1316.5 Graduate SE Time Distribution by Team. . . . . . . . . . . . . . . . . . . . 1356.6 Graduate SE Programmer Opinions . . . . . . . . . . . . . . . . . . . . . . 1376.7 Combined SE Experiments Method Metrics Radar Chart . . . . . . . . . . 1396.8 CS1 Experiment Method Metrics Radar Chart, Project 4 . . . . . . . . . . 1456.9 CS1 Experiment Method Metrics Radar Chart, Project 5 . . . . . . . . . . 1466.10 CS1 Programmer Opinions . . . . . . . . . . . . . . . . . . . . . . . . . . . . 1516.11 CS2 Experiment Method Metrics Radar Chart, Project 1 . . . . . . . . . . 1556.12 CS2 Experiment Method Metrics Radar Chart, Project 2 . . . . . . . . . . 1566.13 CS2 Experiment Method Metrics Radar Chart, Project 3 . . . . . . . . . . 1576.14 Spring CS2 Experiment Method Metrics Radar Chart, Project 1 . . . . . 1586.15 Spring CS2 Experiment Method Metrics Radar Chart, Project 2 . . . . . 1596.16 Spring CS2 Experiment Method Metrics Radar Chart, Project 3 . . . . . 1606.17 CS2 Fall 2005 Programmer Opinions . . . . . . . . . . . . . . . . . . . . . 1666.18 CS2 Spring 2006 Programmer Opinions . . . . . . . . . . . . . . . . . . . . 167
7.1 % Differences in Testing (Mature Developers) . . . . . . . . . . . . . . . . 1707.2 % Differences in Testing (Beginning Developers) . . . . . . . . . . . . . . 1717.3 % Differences in Complexity (Mature Developers) . . . . . . . . . . . . . . 1727.4 % Differences in Complexity (Beginning Developers) . . . . . . . . . . . . 1737.5 % Differences in Coupling (All OO Experiments) . . . . . . . . . . . . . . . 1767.6 % Differences in Abstractness (All OO Experiments) . . . . . . . . . . . . 1777.7 % Differences with Additional Coupling Metrics (All OO Experiments) . 1797.8 % Differences in LCOM Metric (All OO Experiments) . . . . . . . . . . . . 1807.9 % Differences in Cohesion Metrics (Academic Experiments) . . . . . . . 1817.10 % Differences in Code Size Metrics (All OO Experiments) . . . . . . . . . 1827.11 % Differences in Academic Size Metrics . . . . . . . . . . . . . . . . . . . . 183
xii

7.12 % Differences in Programmer Productivity (Academic Experiments) . . 1847.13 % Differences in Program Evaluations (Academic Experiments) . . . . . 1867.14 Beginning Programmer Opinions of Test-First/Test-Lest Methods . . . 1877.15 Mature Programmer Opinions of Test-First/Test-Lest Methods . . . . . 1887.16 Opinions of Beginning Programmer with TF Experience . . . . . . . . . . 1897.17 Opinions of Beginning Programmer with Only TL Experience . . . . . . 1897.18 Opinions of Mature Programmer with TF Experience . . . . . . . . . . . . 1907.19 Opinions of Mature Programmer with Only TL Experience . . . . . . . . 190
xiii

List of Tables
1.1 Standish Group Comparison of IT Project Success Rates . . . . . . . . . 2
3.1 Summary of TDD Research in Industry . . . . . . . . . . . . . . . . . . . . 233.2 Summary of TDD Research in Academia . . . . . . . . . . . . . . . . . . . 243.3 Classification of TDD Research . . . . . . . . . . . . . . . . . . . . . . . . . 25
4.1 Formalized Hypotheses . . . . . . . . . . . . . . . . . . . . . . . . . . . . . . 454.2 Fenton’s Taxonomy of Software Metrics . . . . . . . . . . . . . . . . . . . 604.3 Sample Metrics by Attribute 1 . . . . . . . . . . . . . . . . . . . . . . . . . . 614.4 Sample Metrics by Attribute 2 . . . . . . . . . . . . . . . . . . . . . . . . . . 62
5.1 Method-level Metrics . . . . . . . . . . . . . . . . . . . . . . . . . . . . . . . 665.2 Class-level Metrics . . . . . . . . . . . . . . . . . . . . . . . . . . . . . . . . . 685.3 Interface-level Metrics . . . . . . . . . . . . . . . . . . . . . . . . . . . . . . . 695.4 Project-level Metrics . . . . . . . . . . . . . . . . . . . . . . . . . . . . . . . . 695.5 Analysis of Method Metrics for Industry Experiment 1, Part 1 . . . . . . 725.6 Analysis of Method Metrics for Industry Experiment 1, Part 2 . . . . . . 735.7 Analysis of Class Metrics for Industry Experiment 1, Part 1 . . . . . . . 745.8 Analysis of Class Metrics for Industry Experiment 1, Part 2 . . . . . . . 755.9 Sorted Class Metrics for Industry Experiment 1 . . . . . . . . . . . . . . . 765.10 Analysis of Project Metrics for Industry Experiment 1 . . . . . . . . . . . 785.11 Test Metrics for Industry Experiment 1 . . . . . . . . . . . . . . . . . . . . 785.12 Analysis of Method Metrics for Industry Experiment 2, Part 1 . . . . . . 805.13 Analysis of Method Metrics for Industry Experiment 2, Part 2 . . . . . . 815.14 Analysis of Class Metrics for Industry Experiment 2, Part 1 . . . . . . . 835.15 Analysis of Class Metrics for Industry Experiment 2, Part 2 . . . . . . . 845.16 Sorted Class Metrics for Industry Experiment 2 . . . . . . . . . . . . . . . 855.17 Analysis of Interface Metrics for Experiment 2 . . . . . . . . . . . . . . . 865.18 Analysis of Project Metrics for Industry Experiment 2 . . . . . . . . . . . 865.19 Test Metrics for Industry Experiment 2 . . . . . . . . . . . . . . . . . . . . 875.20 Analysis of Method Metrics for Industry Experiment 3, Part 1 . . . . . . 895.21 Analysis of Method Metrics for Industry Experiment 3, Part 2 . . . . . . 895.22 Analysis of Class Metrics for Industry Experiment 3, Part 1 . . . . . . . 925.23 Analysis of Class Metrics for Industry Experiment 3, Part 2 . . . . . . . 93
xiv

5.24 Sorted Class Metrics for Industry Experiment 3 . . . . . . . . . . . . . . . 945.25 Analysis of Interface Metrics for Experiment 3 . . . . . . . . . . . . . . . 955.26 Analysis of Project Metrics for Industry Experiment 3 . . . . . . . . . . . 955.27 Test Metrics for Industry Experiment 3 . . . . . . . . . . . . . . . . . . . . 965.28 Design Review Results for Industry Experiment 3 . . . . . . . . . . . . . 965.29 Test Metrics for Industry Training Experiment . . . . . . . . . . . . . . . 995.30 Programmer Attitude Changes in Industry Training Experiment . . . . 1015.31 Project Summary . . . . . . . . . . . . . . . . . . . . . . . . . . . . . . . . . . 1035.32 Analysis of Method Metrics on Industry Data, Part 1 . . . . . . . . . . . . 1055.33 Analysis of Method Metrics on Industry Data, Part 2 . . . . . . . . . . . . 1055.34 Analysis of Class Metrics for Industry Case Study, Part 1 . . . . . . . . . 1075.35 Analysis of Class Metrics for Industry Case Study, Part 2 . . . . . . . . . 1085.36 Sorted Class Metrics for Industry Case Study . . . . . . . . . . . . . . . . 1095.37 Industry Case Study Class/Interface Ratio . . . . . . . . . . . . . . . . . . 1105.38 Analysis of Interface Metrics for Industry Case Study . . . . . . . . . . . 1105.39 Analysis of Project Metrics for Industry Case Study . . . . . . . . . . . . 1115.40 Analysis of Test Coverage Metrics for Industry Projects with Auto-
mated Tests . . . . . . . . . . . . . . . . . . . . . . . . . . . . . . . . . . . . . 1125.41 Test Coverage Metrics for Industry Projects with Automated Tests . . . 1125.42 Test/Source Ratio Metrics for Industry Projects with Automated Tests 1135.43 Test Saturation Metrics for Industry Projects with Automated Tests . . 113
6.1 C++ Method-level Metrics . . . . . . . . . . . . . . . . . . . . . . . . . . . . 1156.2 C++ Class-level Metrics . . . . . . . . . . . . . . . . . . . . . . . . . . . . . . 1166.3 Analysis of Method Metrics for Undergraduate SE Experiment, Part 1 . 1186.4 Analysis of Method Metrics for Undergraduate SE Experiment, Part 2 . 1196.5 Sorted Class Metrics for Undergraduate SE Experiment . . . . . . . . . . 1206.6 Analysis of Project Metrics for Undergraduate SE Experiment . . . . . . 1226.7 Metrics on Tested and Untested code of Test-First Project . . . . . . . . 1226.8 Features Implemented . . . . . . . . . . . . . . . . . . . . . . . . . . . . . . 1236.9 Undergraduate SE Effort in Minutes . . . . . . . . . . . . . . . . . . . . . . 1236.10 Undergraduate SE Code Size Metrics . . . . . . . . . . . . . . . . . . . . . . 1256.11 Test Metrics for Undergraduate SE Experiment . . . . . . . . . . . . . . . 1266.12 Test Metrics for Undergraduate SE Experiment (Text UI only) . . . . . . 1266.13 Programmer Perceptions of Test-First and Test-Last (0 to 4 scale) . . . 1266.14 Undergraduate SE Programmer Opinion Changes . . . . . . . . . . . . . . 1276.15 Analysis of Method Metrics for Graduate SE Experiment, Part 1 . . . . . 1306.16 Analysis of Method Metrics for Graduate SE Experiment, Part 2 . . . . . 1316.17 Sorted Class Metrics for Graduate SE Experiment . . . . . . . . . . . . . . 1336.18 Analysis of Project Metrics for Graduate SE Experiment . . . . . . . . . . 1346.19 Graduate SE Effort in Minutes . . . . . . . . . . . . . . . . . . . . . . . . . . 1346.20 Graduate SE Code Size Metrics . . . . . . . . . . . . . . . . . . . . . . . . . 134
xv

6.21 Test Metrics for Graduate SE Experiment . . . . . . . . . . . . . . . . . . . 1366.22 Graduate SE Programmer Opinion Changes . . . . . . . . . . . . . . . . . 1366.23 Analysis of Method Metrics for Combined SE Experiments, Part 1 . . . 1386.24 Analysis of Method Metrics for Combined SE Experiments, Part 2 . . . 1386.25 Sorted Class Metrics for Combined SE Experiments . . . . . . . . . . . . 1406.26 Analysis of Project Metrics for Combined SE Experiments . . . . . . . . 1426.27 Test Metrics for Combined SE Experiments . . . . . . . . . . . . . . . . . 1426.28 Analysis of Method Metrics for CS1 Experiment, Project 4 . . . . . . . . 1446.29 Analysis of Method Metrics for CS1 Experiment, Project 5 . . . . . . . . 1456.30 Sorted Class Metrics for CS1 Project 5 . . . . . . . . . . . . . . . . . . . . . 1476.31 Sorted Project Metrics for CS1 Project 4 . . . . . . . . . . . . . . . . . . . 1476.32 Sorted Project Metrics for CS1 Project 5 . . . . . . . . . . . . . . . . . . . 1476.33 CS1 Test Metrics . . . . . . . . . . . . . . . . . . . . . . . . . . . . . . . . . . 1496.34 CS1 Project Evaluations . . . . . . . . . . . . . . . . . . . . . . . . . . . . . . 1506.35 CS1 Programmer Opinions on Project 5 . . . . . . . . . . . . . . . . . . . . 1506.36 Approach Selection in CS2 Projects . . . . . . . . . . . . . . . . . . . . . . 1536.37 Analysis of Method Metrics for CS2 Experiment, Project 1 . . . . . . . . 1546.38 Analysis of Method Metrics for CS2 Experiment, Project 2 . . . . . . . . 1556.39 Analysis of Method Metrics for CS2 Experiment, Project 3 . . . . . . . . 1566.40 Analysis of Method Metrics for Spring CS2 Experiment, Project 1 . . . . 1576.41 Analysis of Method Metrics for Spring CS2 Experiment, Project 2 . . . . 1586.42 Analysis of Method Metrics for Spring CS2 Experiment, Project 3 . . . . 1596.43 Sorted Class Metrics for Fall 2005 CS2 Project 1 . . . . . . . . . . . . . . 1616.44 Sorted Class Metrics for Fall 2005 CS2 Project 2 . . . . . . . . . . . . . . 1626.45 Sorted Project Metrics for Fall 2005 CS2 Project 1 . . . . . . . . . . . . . 1636.46 Sorted Project Metrics for Fall 2005 CS2 Project 2 . . . . . . . . . . . . . 1636.47 Sorted Project Metrics for Fall 2005 CS2 Project 3 . . . . . . . . . . . . . 1646.48 CS2 Test Metrics . . . . . . . . . . . . . . . . . . . . . . . . . . . . . . . . . . 1646.49 CS2 Project Evaluations . . . . . . . . . . . . . . . . . . . . . . . . . . . . . . 165
7.1 Complexity Metrics w/Statistically Significant Differences (Mature De-velopers) . . . . . . . . . . . . . . . . . . . . . . . . . . . . . . . . . . . . . . . 174
7.2 Complexity Metrics w/Statistically Significant Differences (BeginningDevelopers) . . . . . . . . . . . . . . . . . . . . . . . . . . . . . . . . . . . . . 175
7.3 Statistical Significance in Evaluation Differences . . . . . . . . . . . . . . 1857.4 Quality Comparison Summary . . . . . . . . . . . . . . . . . . . . . . . . . 192
A.1 TDL vs. Non-TDL Mean Scores . . . . . . . . . . . . . . . . . . . . . . . . . 214A.2 TDD Survey Responses by Course . . . . . . . . . . . . . . . . . . . . . . . 215A.3 TDD Survey Responses by Experience . . . . . . . . . . . . . . . . . . . . . 215
B.1 Sample Time Sheet . . . . . . . . . . . . . . . . . . . . . . . . . . . . . . . . . 246
xvi

E.1 Metrics Description 1 . . . . . . . . . . . . . . . . . . . . . . . . . . . . . . . 297E.2 Metrics Description 2 . . . . . . . . . . . . . . . . . . . . . . . . . . . . . . . 298E.3 Metrics Descriptions 3 . . . . . . . . . . . . . . . . . . . . . . . . . . . . . . 299E.4 Metrics Tool Language Support . . . . . . . . . . . . . . . . . . . . . . . . . 300E.5 Metrics Tool Comparison 1 . . . . . . . . . . . . . . . . . . . . . . . . . . . 301E.6 Metrics Tool Comparison 2 . . . . . . . . . . . . . . . . . . . . . . . . . . . 302E.7 Metrics Tool Comparison 3 . . . . . . . . . . . . . . . . . . . . . . . . . . . 303
xvii

Chapter 1
Introduction
Test-driven development (TDD) [16] is a novel software development practice thathas gained recent attention with the popularity of the Extreme Programming soft-ware development methodology. Although TDD may have been applied narrowlyand in various forms for several decades, there is evidence that TDD may be at anopportunistic point in its evolution for widespread adoption. The essence of TDDas a design methodology is virtually unstudied, yet scattered early adoption hasproceeded based solely on anecdotal evidence.
1.1 Objective
The objective of this research is to study the impact of TDD on the design of soft-ware. This research is the first to empirically evaluate the effects of TDD on internalsoftware quality through a series of controlled experiments conducted in academicand industrial contexts.
Early and intermediate results from this work have been widely reported in theliterature, and the research has garnered several awards. Most notably, this researchwas recognized among the three best graduate research projects of 2005 at the ACMAwards Banquet in San Francisco where the A.M. Turing Award was also given.
This chapter summarizes the problem being solved by this research, the solu-tion approach, and the significance of the research contributions. It provides a briefintroduction to the test-driven development strategy, summarizes the research con-ducted, and describes the contents of the remaining chapters.
1.2 State of Software Construction
Software construction is a challenging endeavor. It involves a complex mix of cre-ativity, discipline, communication, and organization. The Standish Group has beenstudying the state of software projects since 1985 and their research demonstrates
1
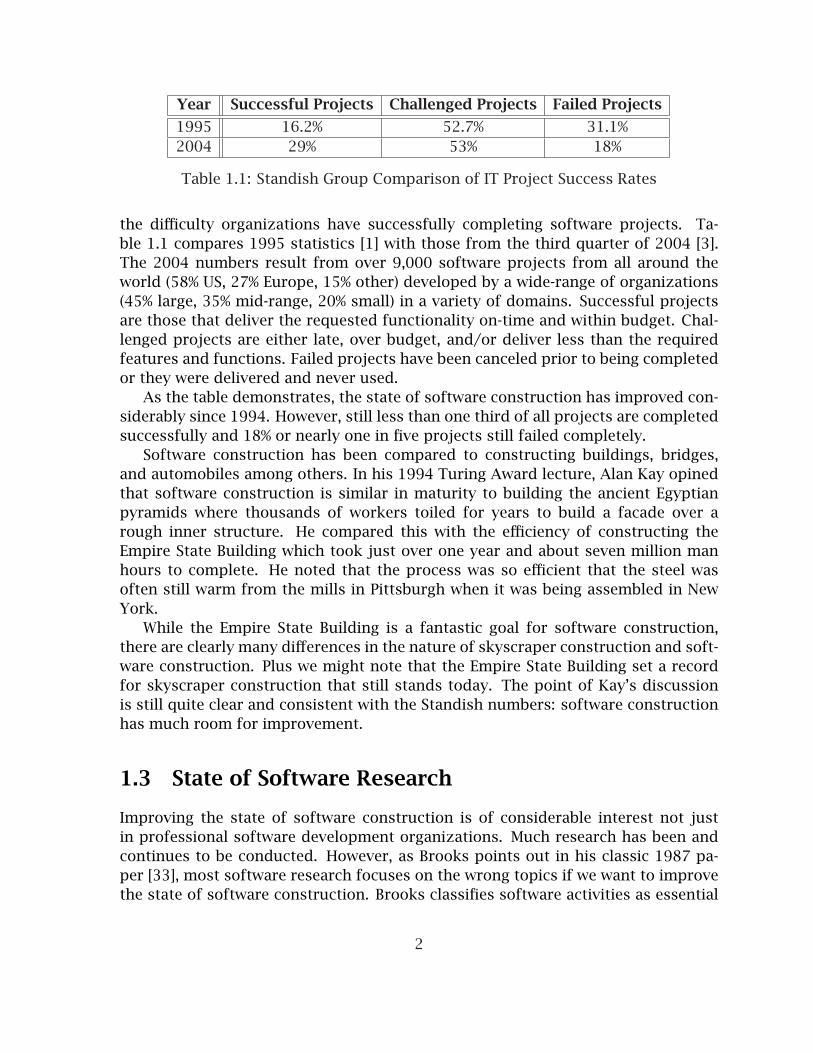
Year Successful Projects Challenged Projects Failed Projects
1995 16.2% 52.7% 31.1%2004 29% 53% 18%
Table 1.1: Standish Group Comparison of IT Project Success Rates
the difficulty organizations have successfully completing software projects. Ta-ble 1.1 compares 1995 statistics [1] with those from the third quarter of 2004 [3].The 2004 numbers result from over 9,000 software projects from all around theworld (58% US, 27% Europe, 15% other) developed by a wide-range of organizations(45% large, 35% mid-range, 20% small) in a variety of domains. Successful projectsare those that deliver the requested functionality on-time and within budget. Chal-lenged projects are either late, over budget, and/or deliver less than the requiredfeatures and functions. Failed projects have been canceled prior to being completedor they were delivered and never used.
As the table demonstrates, the state of software construction has improved con-siderably since 1994. However, still less than one third of all projects are completedsuccessfully and 18% or nearly one in five projects still failed completely.
Software construction has been compared to constructing buildings, bridges,and automobiles among others. In his 1994 Turing Award lecture, Alan Kay opinedthat software construction is similar in maturity to building the ancient Egyptianpyramids where thousands of workers toiled for years to build a facade over arough inner structure. He compared this with the efficiency of constructing theEmpire State Building which took just over one year and about seven million manhours to complete. He noted that the process was so efficient that the steel wasoften still warm from the mills in Pittsburgh when it was being assembled in NewYork.
While the Empire State Building is a fantastic goal for software construction,there are clearly many differences in the nature of skyscraper construction and soft-ware construction. Plus we might note that the Empire State Building set a recordfor skyscraper construction that still stands today. The point of Kay’s discussionis still quite clear and consistent with the Standish numbers: software constructionhas much room for improvement.
1.3 State of Software Research
Improving the state of software construction is of considerable interest not justin professional software development organizations. Much research has been andcontinues to be conducted. However, as Brooks points out in his classic 1987 pa-per [33], most software research focuses on the wrong topics if we want to improvethe state of software construction. Brooks classifies software activities as essential
2

and accidental tasks. Essential tasks focus on conceptual structures and mecha-nisms for forming abstractions with complex software, while accidental tasks focusmore on technologies that facilitate mapping abstractions into actual programs.
In the years since Brooks’ paper, there is still much attention on accidental tasks.Web services, modern integrated development environments, and new languagessuch as Java and C# are just a few examples. Professional training courses arestill predominantly focused on new technologies, and undergraduate curriculumscontinue to emphasize many technical skills while paying relatively little attentionto more conceptual and organizational skills such as software design and softwaredevelopment methods.
Attention has been drawn, however, to many essential tasks such as visual mod-eling, software organization, and development methods. The context for the re-search proposed in this paper in fact lies in the very iterative and evolutionarytypes of development models that Brooks was advocating.
Unfortunately few new ideas are thoroughly examined. As Gibbs wrote in 1994,“after 25 years of disappointment with apparent innovations that turned out tobe irreproducible or unscalable, many researchers concede that computer scienceneeds an experimental branch to separate the general results from the acciden-tal.” [85]
1.3.1 Empirical Software Engineering
Empirical software engineering has emerged as a valuable research discipline thatexamines ideas in software engineering. While empirical studies will rarely produceabsolute repeatable results, such studies can provide evidence of causal relation-ships, implying results that will most likely occur in given contexts.
Empirical software engineering projects have received significant governmentand corporate funding. Research centers have been founded such as the “NSF Centerfor Empirically-Based Software Engineering,” the “Software Engineering Institute” atCarnegie Mellon University, and the “Centre for Advanced Software Engineering Re-search.” Many journals such as IEEE Transactions on Software Engineering specif-ically request empirical studies and Springer publishes a dedicated journal titledEmpirical Software Engineering: An International Journal.
1.4 Summary of Research
This research applies empirical software engineering techniques to examine a newlypopularized approach that holds promise to significantly improve the state of soft-ware construction. Test-driven development is a relatively new, unstudied develop-ment strategy that has caught the attention of a number of prominent computer
3
scientists. Steve McConnell in his 2004 OOPSLA keynote address included test-driven development as the only yet-to-be-proven development practice among histop ten advances of the last decade.
The next section will briefly introduce test-driven development and the practicewill be explored further in chapter 2. The majority of this dissertation then willdescribe how empirical software engineering practices were applied to examine test-driven development’s efficacy or ability to produce desirable results. In particularthis research assesses how well test-driven development improves software designquality while also reducing defect density, and whether these improvements comewith a cost of increased effort or time.
This research is the first comprehensive evaluation of how TDD affects overallsoftware architecture quality beyond just defect density. The research includedeight formal controlled experiments and an extensive case study. The research wasconducted in a Fortune 500 company in Kansas and in academic courses at theUniversity of Kansas. The studies involved over two hundred developers writingover fifty thousand lines of code.
Statistically significant results indicate that TDD can improve internal designquality while potentially improving external quality by increasing test coverage. Inaddition, survey data reveals that developer opinions about the TDD process im-prove with TDD experience whereas opinions of test-last programming decrease.As usual TDD is not a silver bullet. The approach also appears to increase soft-ware coupling, although there is some indication that the coupling may have somebeneficial qualities.
1.5 Introduction to Test-Driven Development
Test-driven development is a software development strategy that requires that au-tomated tests be written prior to writing functional code in small, rapid iterations.Although TDD has been applied in various forms for several decades [56] [36], ithas gained increased attention in recent years thanks to being identified as one ofthe twelve core practices in Extreme Programming (XP) [15].
Extreme Programming is a lightweight, evolutionary software development pro-cess that involves developing object-oriented software in very short iterations withrelatively little up front design. XP is a member of a family of what are termed ag-ile methods [14]. Although not originally given this name, test-driven developmentwas described as an integral practice in XP, necessary for analysis, design, and test-ing, but also enabling design through refactoring, collective ownership, continuousintegration, and programmer courage [15].
In the few years since XP’s introduction, test-driven development has receivedincreased individual attention. Besides pair programming [88] and perhaps refac-toring [32], it is likely that no other XP practice has received as much individual at-
4

tention as TDD. Tools have been developed for a range of languages specifically tosupport TDD. Books have been written explaining how to apply TDD. Research hasbegun to examine the effects of TDD on defect reduction and quality improvementsin both academic and professional practitioner environments. Educators have be-gun to examine how TDD can be integrated into computer science and software en-gineering pedagogy. Some of these efforts have been in the context of XP projects,but others are independent.
1.6 Significance of Research Contributions
Advocates claim that TDD is more about design than it is about testing. The factthat it involves both design and testing indicates that if it works, there are manybenefits to be gained.
Software development organizations are hard-pressed to select the most effec-tive set of practices that produce the best quality software in the least amount oftime. Empirical evidence of a practice’s efficacy are rarely available and adoptingnew practices is time-consuming and risky. Such adoptions often involve a signif-icant conceptual shift and effort in the organization including but not limited todeveloper training, acquiring and implementing new tools, and collecting and re-porting new metrics.
In 2000, Laurie Williams completed her PhD at the University of Utah. Her dis-sertation presented the results of empirical studies she conducted on pair program-ming, another XP practice. This new approach has since gained significant popular-ity, largely based on the empirical evidence. Williams has gone on to publish widelyon pair programming and related topics, and she has been very successful in at-tracting both government and corporate funding for her work.
This research contributes empirical results perhaps even more beneficial thanWilliams’ results on pair programming. While pair programming has been shown toimprove defect detection and code understanding, this research demonstrates thatTDD does the same with the advantage of also improving software designs. Theresults from this study will assist professional developers in understanding andchoosing whether to adopt test-driven development. For the first time, it reveals theeffects on software design quality from applying TDD. It explores many importantquality aspects beyond defect density such as understandability, reusability, andmaintainability.
In addition, this research makes important pedagogical contributions. The re-search contributes a new approach to teaching that incorporates teaching with testscalled “test-driven learning” (TDL) [50]. The research demonstrates that undergrad-uate computer science students can learn to apply TDD, and it examines at whatpoint in the curriculum TDD is best introduced.
The early publications, significant conference interest, and prestigious ACM awards
5

indicate that this research should have a significant impact on the state of softwareconstruction because it demonstrates that TDD can significantly improve softwarequality at minimal cost. The significant results of this research should compel soft-ware development organizations to adopt TDD in appropriate situations. In addi-tion the research contributes essential tools for teaching TDD whereby facilitatingthe crucial inclusion in academia. New textbooks and instructional materials canbe written applying the test-driven learning approach. As students learn to take amore disciplined approach to software development associated with TDD, they willcarry these skills into professional software organizations and improve the overallstate of software construction.
1.7 Summary of Remaining Chapters
Chapter 2 will more thoroughly present the context in which TDD has developed andevolved. Test-driven development will be defined more precisely. Iterative, incre-mental, and evolutionary development processes will be discussed, along with his-torical references to various emerging forms of TDD. References to TDD in academiawill be noted, and particular attention will be given to the recent context in whichTDD has gained popularity.
Chapter 3 will survey the current state of research on TDD, independent of itscontext. It will not attempt to survey XP research that may provide indirect knowl-edge of TDD. However some observations on XP practices will be noted, revealingpotential reasons why pair programming and TDD can be easily extracted from XPto be studied and applied in a wide variety of process methodologies. It will attemptto provide the necessary definitions and background to fully understand TDD. Thenit will attempt to establish the current state of evaluative research on TDD. Finallyit will establish the motivation for this research, based on identified shortcomingsin previous work.
Chapter 4 presents the methods by which this research was carried out. Thechapter begins with an extensive example of how TDD is used in software devel-opment and particularly how it can influence design decisions. Experiment design,anticipated risks, and actual experiences are then reported. The chapter identifiestools and metrics that were utilized, and discusses how the results were analyzedand assessed.
Chapters 5 and 6 report and discuss the results of the research conducted inindustrial and academic settings respectively. Finally, chapter 7 summarizes thework and discusses its potential to improve the state of software construction andpedagogy. Future work will be identified.
Appendix A describes a new pedagogical approach called test-driven learning(TDL). Although TDL played an important, but relatively small role in the empiricalstudies, it is recognized as a significant by-product of this research, garnering sig-
6

nificant attention among computer science educators. Appendix B includes severalartifacts developed for teaching TDD using the TDL approach.
Appendix C presents some of the custom-built software tools used in collect-ing and analyzing the software resulting from the empirical studies. Appendix Dgives definitions for the metrics used in analyzing the software in this research. Ap-pendix E compares a number of metrics tools evaluated in the course of conductingthis research. Finally appendix F presents the actual survey instruments developedand administered in the empirical studies.
7

Chapter 2
Test-Driven Development in Context
This chapter presents the context wherein test-driven development is emerging. Itsurveys a variety of definitions for test-driven development, and provides a new onefor the purposes of this research. It discusses historical and recent events that havecontributed to the current understanding of test-driven development.
2.1 Definitions of TDD
Although its name would imply that TDD is a testing method, a close examinationof the name reveals a more complex picture.
2.1.1 Significance of “Test” in TDD
As the first word implies, test-driven development is concerned with testing. Morespecifically it is about writing automated unit tests. Unit testing is the process of ap-plying tests to individual units of a program. There is some debate regarding whatexactly is a unit in software. Even within the realm of object-oriented programming,both the class and the method have been suggested as the appropriate unit. Gener-ally, however, we will consider a unit to be “the smallest possible testable softwarecomponent” [20] which currently [17] appears to be the method or procedure.
Test drivers and function stubs are frequently implemented to support the ex-ecution of unit tests. Test execution can be either a manual or automated processand may be performed by developers or dedicated testers. Automated unit testinginvolves writing unit tests as code and placing this code in a test harness [20] or aframework such as JUnit [59]. Automated unit testing frameworks can reduce theeffort of testing, even for large numbers of tests to a simple button click. In con-trast, when test execution is a manual process, developers and/or testers may berequired to expend significant effort proportional to the number of tests executed.
8

Traditionally, unit testing has been applied some time after the unit has beencoded. This time interval may be quite small (a few minutes) or quite large (a fewmonths). The unit tests may be written by the same programmer or by a designatedtester. With TDD, however, unit tests are prescribed to be written prior to writingthe code under test. As a result, the unit tests in TDD normally don’t exist for verylong before they are executed.
2.1.2 Significance of “Driven” in TDD
Some definitions of TDD seem to imply that TDD is primarily a testing strategy. Forinstance, according to [59] when summarizing Beck [17],
Test-Driven Development (TDD) is a programming practice that instructsdevelopers to write new code only if an automated test has failed, and toeliminate duplication. The goal of TDD is ‘clean code that works.’ [51]
However, according to XP and TDD pioneer Ward Cunningham, “Test-first codingis not a testing technique.” [16] In fact TDD goes by various names including Test-First Programming, Test-Driven Design, and Test-First Design. The driven in test-driven development focuses on how TDD informs and leads analysis, design andprogramming decisions. TDD assumes that the software design is either incomplete,or at least very pliable and open to evolutionary changes. In the context of XP, TDDeven subsumes many analysis decisions. In XP, the customer is supposedly “on-site”, and test writing is one of the first steps in deciding what the program shoulddo, which is essentially an analysis step.
Another definition which captures this notion comes from The Agile Alliance [7],
Test-driven development (TDD) is the craft of producing automated testsfor production code, and using that process to drive design and program-ming. For every tiny bit of functionality in the production code, you firstdevelop a test that specifies and validates what the code will do. Youthen produce exactly as much code as will enable that test to pass. Thenyou refactor (simplify and clarify) both the production code and the testcode.
As is seen in this definition, promoting testing to an analysis and design stepinvolves the important practice of refactoring [32]. Refactoring is a technique forchanging the structure of an existing body of code without changing its externalbehavior. A test may pass, but the code may be inflexible or overly complex. Byrefactoring the code, the test should still pass and the code will be improved.
Understanding that TDD is more about analysis and design than it is about test-ing may be one of the most challenging conceptual shifts for new adopters of thepractice. As will be discussed later, testing has traditionally assumed the existence
9

of a program. The idea that a test can be written before the code, and even more,that the test can aid in deciding what code to write and what its interface shouldlook like is a radical concept for most software developers.
2.1.3 Significance of “Development” in TDD
TDD is intended to aid the construction of software. TDD is not in itself a soft-ware development methodology or process model. TDD is a practice, or a way ofdeveloping software to be used in conjunction with other practices in a particularorder and frequency in the context of some process model. As we will see in thenext section, TDD has emerged within a particular set of process models. It seemspossible that TDD could be applied as a micro-process within the context of manydifferent process models.
We have seen that TDD is concerned with analysis and design. We don’t want toignore the fact that TDD also produces a set of automated unit tests which providea number of side-effects in the development process. TDD assumes that these au-tomated tests will not be thrown away once a design decision is made. Instead thetests become a vital component of the development process. Among the benefits,the set of automated tests provide quick feedback to any changes to the system. Ifa change causes a test to fail, the developer should know within minutes of makingthe change while it is still fresh in his or her mind. Among the drawbacks, the de-veloper now has both the production code and the automated tests which must bemaintained.
2.1.4 A New Definition of TDD
TDD definitions proposed to date assume an unspecified design and a commit-ment to writing automated tests for all non-trivial production code. Despite TDD’spromise of delivering “clean code that works”, many developers seem to be reluc-tant to try TDD. This reluctance is perhaps at least partially a result of the choiceof overall development process in an organization. Obviously an organization thatis applying XP is willing to attempt TDD. However, an organization that is using amore traditional approach is likely unable to see how TDD can fit. This and otherfactors affecting this choice will be more fully addressed in chapter three.
To expand the utility and applicability of TDD, I propose the following modifica-tion of the Agile Alliance definition:
Test-driven development (TDD) is a software development strategy thatrequires that automated tests be written prior to writing functional codein small, rapid iterations. For every tiny bit of functionality desired, youfirst develop a test that specifies and validates what the code will do. Youthen produce exactly as much code as will enable that test to pass. Then
10

you refactor (simplify and clarify) both the code under test and the testcode. Test-driven development can be used to explore, design, develop,and/or test software.
This definition broadens TDD’s sphere of influence by suggesting that TDD canbe used to:
• explore a specified or unspecified design
• explore a new or unfamiliar component
• design software
• develop software given a design
• develop tests for software given only its interface
This definition removes the restrictions of working on an unspecified designand working only on production code. It introduces the possibility that TDD couldbe used as a prototyping mechanism for working out a potential design, withoutrequiring the tests to stick around.
2.2 Survey of Software Development Methodologies
The remainder of this chapter discusses the context that has contributed to theemergence of test-driven development. This section provides a broad survey of soft-ware development methodologies to help establish a background for understandingtest-driven development.
A software development process or methodology is a framework which definesa particular order, control, and evaluation of the basic tasks involved in creatingsoftware. Software process methodologies range in complexity and control fromlargely informal to highly structured. Methodologies may be classified as being pre-scriptive [70] or agile [14], and labeled with names such as waterfall [74], spiral [18],incremental [70], and evolutionary [38].
When an organization states that it is using a particular methodology, they areoften applying on a project-scale certain combinations of smaller, finer-grainedmethodologies. For example, an organization may be applying an incremental modelof development, building small, cumulative slices of the project’s features. In eachincrement however, they may be applying a waterfall or linear method of deter-mining requirements, designing a solution, coding, testing, and then integrating.Depending on the size of the increments and the time frame of the waterfall, theprocess may be labeled very differently with possibly very different results regard-ing quality and developer satisfaction.
11

If we break a software project into N increments where each increment is rep-resented as Ii, then the entire project could be represented by the equation
∑Ni=1 Ii.
If N is reasonably large, then we might label this project as an incremental project.However if N ≤ 2, then we would likely label this as a waterfall project.
If the increments require the modification of a significant amount of overlappingsoftware, then we might say that our methodology is more iterative in nature. Statedmore carefully, for project P consisting of code C and iterations I = ∑N
i=1 Ii, ifCi is the code affected by iteration Ii, then if project P is iterative, Ci ∩ Ci+1 6=∅ for most i such that 1 < i < N. Similarly, with the incremental and waterfallapproaches, we might expect a formal artifact (such as a specification document)for documenting the requirements for that increment. If however, the artifact israther informal (some whiteboard drawings or an incomplete set of UML diagrams),and was generated relatively quickly, then it is likely that we were working in thecontext of an agile process. Or, the approach and perspective of the architectureand/or design might cause us to label the process as aspect-oriented, component-based, or feature-driven.
Drilling down even further, we might find that individual software developers orsmaller teams are applying even finer-grained models such as the Personal SoftwareProcess [44] or the Collaborative Software Process [86]. The time, formality, andintersection of the steps in software construction can determine the way in whichthe process methodology is categorized.
Alternatively, the order in which construction tasks occur influences a project’slabel, and likely its quality. The traditional ordering is requirements elicitation,analysis, design, code, test, integration, deployment, maintenance. This orderingis very natural and logical, however we may consider some possible re-orderings.Most re-orderings do not make sense. For instance, we would never maintain a sys-tem that hasn’t been coded. Similarly, we would never code something for whichwe have no requirements. Note that requirements do not necessarily imply formalrequirements, but may be as simple as an idea in a programmer’s head. The Proto-typing approach [19] has been applied when requirements are fuzzy or incomplete.With this approach, we may do very little analysis and design before coding. Thedisadvantage is that the prototype is often discarded even though it was a usefultool in determining requirements and evaluating design options.
When we closely examine the phases such as design, code, and test, we see thatthere are many finer-grained activities. For instance, there are many types of testing:unit testing, integration testing, and regression testing among others. The timing,frequency, and granularity of these tests may vary widely. It may be possible toconduct some testing early, concurrent with other coding activities. Test-drivendevelopment, however, attempts to re-order these steps to some advantage. Byplacing very fine-grained unit tests just prior to just enough code to satisfy thattest, TDD has the potential of affecting many aspects of a software developmentmethodology.
12
2.3 Historical Context of TDD
Test-driven development has emerged in conjunction with the rise of agile processmodels. Both have roots in the iterative, incremental and evolutionary process mod-els, going back at least as early as the 1950’s. In addition, tools have evolved andemerged to play a significant role in support of TDD. Curriculum seems to be lag-ging in its adoption of TDD, but XP in general has seen some favorable attention inthe academic community.
2.3.1 Early Test-Early Examples
Research on testing has generally assumed the existence of a program to be tested [40],implying a test-last approach. Moving tests, however, from the end of coding to thebeginning is nothing new. It is common for software and test teams to develop testsearly in the software development process, often along with the program logic. Eval-uation and Prevention Life Cycle Models [36] integrated testing early into the soft-ware development process nearly two decades back. Introduced in the 1980s, theCleanroom [28] approach to software engineering included formal verification ofdesign elements early in the development process. There are even claims that someform of TDD was applied as early as the 1950’s in NASA’s Project Mercury [56].
However, prior to the introduction of XP in 1998, very little if anything has beenwritten about the concept of letting small incremental automated unit tests drivethe software development and particularly the design process. Despite the lack ofpublished documentation, it is very possible that many developers have used a testfirst approach informally. Kent Beck even claims he
learned test-first programming as a kid while reading a book on program-ming. It said that you program by taking the input tape ... and typing inthe output tape you expect. Then you program until you get the outputtape you expect. [16]
One might argue then that TDD merely gives a name and definition to a practicethat has been sporadically and informally applied for some time. It seems, however,that TDD is a bit more than this. As Beck states, XP takes known best practices and“turns the knobs all the way up to ten.” In other words, do them in the extreme.Many developers may have been thinking and coding in a test-first manner, butTDD does this in an extreme way, by always writing tests before code, making thetests as small as possible, and never letting the code degrade (test, code, refactor).As we will see next, TDD is a practice that must fit within a process model. Thedevelopment of incremental, iterative, and evolutionary process models has beenvital to the emergence of TDD.
13

2.3.2 Incremental, Iterative, and Evolutionary Development
Larman and Basili [56] survey a long history of iterative and incremental devel-opment models. Iterative development involves repeating a set of developmenttasks, generally on an expanding set of requirements. Evolutionary approaches asfirst presented by Gilb [38] involve iterative development which is adaptive andlightweight. Being adaptive generally refers to using feedback from previous itera-tions to improve and change the software in the current iteration. Being lightweightoften refers to the lack of a complete specification at the beginning of development,allowing feedback from previous iterations and from customers to guide future it-erations. Lightweight can refer to other aspects such as the level of formality anddegree of documentation in a process. The spiral model [18] is an evolutionary ap-proach that incorporates prototyping and the cyclic nature of iterative developmentalong with “risk-driven-iterations” and “anchor point milestones”
According to Pressman [70],
The incremental model delivers a series of releases, called increments,that provide progressively more functionality for the customer as eachincrement is delivered.
It was within the context of such iterative, incremental, and evolutionary modelsthat TDD developed. In fact, it appears that such iterative, incremental, and/orevolutionary approaches are prerequisite process models which are necessary forTDD to work. As we have stated, TDD is most closely associated with XP which isan iterative, evolutionary model. In fact, Beck claims that in order to implementXP, you must apply all of the incumbent practices. Leaving some out weakens themodel and may cause the model to fail [15]. In order for TDD to influence softwaredesign, TDD requires that design decisions be delayed and flexible. With each newtest, something new may be revealed about the code which requires a refactoringand possible change to the design as determined at that point. Automated testsgive the programmer courage to change any code and know quickly if anything hasbroken, enabling collective ownership.
As originally proposed, TDD requires some form of an evolutionary processmodel. The converse, however, is clearly not true as many iterative, incremental,and/or evolutionary models have been proposed without the mention of TDD.
2.4 Emergence of Automated Testing Tools
Software tools have become important factors in the development of modern soft-ware systems. Tools ranging from compilers, debuggers, and integrated develop-ment environments (IDEs) through modeling and computer-aided software engi-neering (CASE) tools have improved and hence significantly increased developerproductivity. Similarly testing tools have matured over the years.
14
Testing tools vary in purpose and scope, and will not be reviewed here. However,it is important to note the role that tools have played in the emergence of TDD. TDDassumes the existence of an automated unit testing framework. Such a frameworksimplifies both the creation and execution of software unit tests. Test harnessesare basically automated testing frameworks and have existed for some time. A testharness is a combination of test drivers, stubs, and possibly interfaces to othersubsystems [20]. Often such harnesses are custom-built, although commercial toolsdo exist to assist with test harness preparation [69].
JUnit [34] is an automated unit testing framework for Java developed by ErichGamma and Kent Beck. JUnit is an essential tool for implementing TDD with Java.In fact, it might be argued that TDD and possibly even XP might not have receivedsuch wide popularity if it weren’t for JUnit. JUnit-like frameworks have been im-plemented for a number of different languages, and the family of frameworks isreferred to as xUnit [89].
Generally, xUnit allows the programmer to write sets of automated unit testswhich initialize, execute, and make assertions about the code under test. Individualtests are independent of each other so that test order does not matter, and totalnumbers of successes and failures are reported. xUnit tests are written in the samelanguage as the code under test and thus serve as first-class clients of the code.As a result, tests can serve as documentation for the code. On the other hand,because xUnit is implemented in the target language, the tool’s simplicity and flexi-bility are determined somewhat by that language. For instance JUnit is very simpleand portable, partly because it takes advantage of Java’s portability through thebytecode/virtual machine architecture, it uses Java’s ability to load classes dynam-ically, and it exploits Java’s reflection mechanism to automatically discover tests.In addition, it provides a nice, portable graphical user interface that has even beenintegrated into popular integrated development environments like Eclipse.
A wide range of additional tools have emerged to support automated testing,particularly in Java. Several tools attempt to simplify the creation of mock ob-jects [9] which are essentially stubs which stand-in for needed collaborating objectsso that one can only test a particular object. Other tools such as Cactus [10] andDerby [11] can be used in conjunction with JUnit to automate tests which involveJ2EE components or databases respectively.
The proliferation of software tools supporting TDD seems to be an indicator thatTDD has widespread support and may be on its way to becoming an establishedapproach. A significant factor in the use of TDD particularly in the Java communityseems to be the simplicity and elegance of the JUnit tool. Programmers can developunit-tests easily, and large suites of tests can be executed with a single click of abutton, yielding quick results on the state of the system.
15

2.5 Early Testing in Curriculum
One indicator of the widespread acceptance of a software practice might be theundergraduate curriculum in computer science and software engineering. In somecases, academia has led practice in the field. In others, academia has followed.Software Engineering, iterative development and TDD seem to all fall in with thelatter model.
Although much software engineering research has originated in academia, andfound its way into common practice, the undergraduate curriculum in computerscience and software engineering has tended to reflect and lag behind commonpractice in industry. Programming Language choice has commonly followed theneeds of businesses. Process models have developed in practice and then later beenreflected in curriculums.
The 1991 ACM Curriculum Guidelines [6] recommended that a small amount oflecture and lab time be given to iterative development processes (SE2) and verifica-tion and validation (SE5) (portions of eight hours each). The 2001 ACM CurriculumGuidelines [2] recommended that a perhaps even smaller amount of time be givento development processes (SE4) and software validation (SE6) (two and three hoursrespectively).
Undergraduate texts give little attention to comparative process models. Textshave limited coverage of software design and often have minimal coverage of test-ing techniques. The topics of software design and testing are often relegated to asoftware engineering course which may not even be required of all students.
There is much debate regarding the place of Extreme Programming in undergrad-uate education. Some [41] argue strongly in favor of using XP to introduce softwareengineering to undergraduates. Others [76] argue that XP and agile methods areonly beneficial on a very limited basis. Still others [65] report mixed experiences.
Despite the mix of opinions on using XP in the undergraduate curriculum, TDDis receiving some limited exposure at this level. Some educators have called forincreased design and testing coverage for some time. Some see TDD as an oppor-tunity to incorporate testing throughout the curriculum, and not relegate it to anindividual course [22].
TDD tools have found their way into early programming education. BlueJ [54], apopular environment for learning Java has incorporated JUnit and added helps forbuilding test cases at an early stage in a programmer’s learning cycle [67]. JUnithas been advocated for early learning of Java because it abstracts the bootstrappingmechanism of main(), allowing the student to concentrate on the use of objectsearly.
TDD, however, is still far from being widely accepted in academia. Faculty whodon’t specialize in software engineering are still unlikely to have much familiaritywith TDD. Instructional materials on TDD targeted at undergraduate courses arebasically non-existent. As we will discuss in section five, several steps need to take
16

place before TDD finds its place in the undergraduate curriculum.
2.6 Recent Context of TDD
Test-driven development has emerged in the context of agile methods. This sectionnotes the significance of agile methods and considers attempts to measure howmany development groups are applying agile methods.
2.6.1 Emergence of Agile Methods
The early years of the twenty-first century have seen significant attention given towhat are deemed agile methods. Agile methods clearly have roots in the incremen-tal, iterative, and evolutionary methods discussed earlier. Abrahamsson et al. [5]provide an evolutionary map of nine agile methods, and describe such methods asfocusing primarily on simplicity and speed, emphasizing people over processes [4].
Extreme Programming (XP) [15] is probably the most well-known agile method,and in fact XP is often used in combination with other agile methods such as Scrum.XP proposes the use of TDD as an integral component of developing high-qualitysoftware. There is an interesting conflict between the highly disciplined practice ofTDD and the simple, lightweight nature of agile processes. In fact, one of the pri-mary concerns of potential adopters of TDD seems to be the overhead or cost/timeof writing and maintaining the unit tests. Although he concedes that automatedunit tests are not necessary for absolutely everything (some things are still hard toautomatically test), Beck insists that TDD is necessary for XP to work. It seems thatTDD may provide the “glue” that holds the process together.
2.6.2 Measuring Adoption of Agile Methods
It is hard to measure the use of a particular software development methodology.Many organizations may be using the methodology, but not talking about it. Othersmight claim to be using a methodology, when in reality they may be mis-applyingthe methodology, or worse yet, advertising its use falsely. Surveys might be con-ducted to gauge a methods use, but often only those who are enthusiastic about themethodology (either in favor or opposed) will respond.
A 2002 survey [73] reported that out of 32 survey respondents across ten in-dustry segments, fourteen firms were using an agile process. Of these, five of thefirms were categorized in the E-business industry. Most of the projects using agileprocesses were small (ten or fewer participants) and lasting one year or less. An-other 2003 survey [79] reported 131 respondents claiming they were using an agilemethod. Of these, 59% claimed to be using XP, implying that they were using TDD.
17

Both surveys revealed positive results from applying agile methods with increasesin productivity and quality, and reduced or minimal changes in costs.
A substantial body of literature regarding XP has accumulated since its incep-tion. Most of this literature admittedly involves promotion of XP or explanationsof how to implement XP. Many experience reports present only anecdotal evidenceof benefits and drawbacks of XP. However, their existence indicates that XP is be-ing adopted in many organizations. It is not clear yet if these same organizationswill continue to use XP over time, or if they have or will move on to other (or old)methods.
We are unaware of any measure of how widespread is the use of TDD. The pop-ularity of XP, however, seems to imply a growing adoption of TDD. It is possiblethat organizations are adopting XP without adopting all of the practices, or they areapplying some practices inconsistently. Rasmusson reports on a project at Thought-Works, an early adopter of XP, in which he estimates that one-third of the code wasdeveloped using TDD [71]. In the same report, though, he states,
If I could only recommend one coding practice to software developers,those who use XP or otherwise, it would be to write unit tests.
In this ThoughtWorks project, 16,000 lines of automated unit tests were writtenfor 21,000 lines of production code. It appears that many tests were written in botha test-first and test-last manner.
Despite the possibility of adopting XP without TDD, TDD seems to be a corepractice in XP and anecdotal evidence seems to indicate that TDD is commonlyincluded when only a subset of XP is adopted.
Another possible indicator of the use of TDD is the use of the xUnit testingframeworks. JUnit was the first such framework and it has enjoyed widespreadpopularity. As Martin Fowler stated regarding JUnit,
Never in the field of software development was so much owed by so manyto so few lines of code [34].
No adoption statistics are directly available for JUnit. However, JUnit is includedin the core distribution of Eclipse, a popular integrated development environmentwhich is primarily used for Java development. A February, 2004 press release [24]states that the Eclipse platform has recorded more than 18 million download re-quests since its inception. Although duplicate requests likely occur from the samedeveloper requesting new releases, the figure is still substantial. Certainly not allEclipse developers are using JUnit, nor are all JUnit adopters using TDD, but it seemslikely that the combination of XP, JUnit, and Eclipse popularity implies some degreeof TDD adoption.
18

Chapter 3
Related Work
Since the introduction of XP, many practitioner articles and several books [12,17,59]have been written describing how to apply TDD. Relatively little evaluative research,however has been published on the benefits and effects of TDD.
This chapter will summarize and classify the research discovered to date thatspecifically evaluates TDD. There are a number of publications on XP and agilemethods, many anecdotal and some empirical. The first section will present someobservations that validate the notion that TDD can be studied and applied indepen-dent of XP. However, this discussion will generally exclude research on XP or agilemethods as a whole. Such research on agile methods might prove informative whenexamining TDD, but it fails to prove any individual merits or shortcomings of TDD.
Research on TDD can be categorized broadly by context. In particular, TDDresearch will be classified as “Industry” if the study or research was primarily con-ducted with professional software practitioners. Alternatively, the research will beclassified as “Academia” if the software practitioners are primarily students and thework is in the context of a course or some academic setting. Studies in which stu-dents work on a project for a company but as the requirements and in the contextof some course will be classified with “Academia”.
3.1 XP and TDD Observations
As mentioned earlier, TDD has gained significant exposure in recent years due to thepopularity of XP. In fact, many would claim that the two are intrinsically linked. XPinventors and advocates claim that XP is not XP without TDD. This research howeverexamines TDD independent of XP. This section presents some observations made byGlenn Vanderburg in the first ever Essay talk at OOPSLA’05 [81]. These observationsexplain why TDD can be extracted from XP and validate the attempts of this researchto do exactly this.
Figure 3.1 illustrates the basic flow of XP. Development is divided into short iter-ations usually lasting about three or four weeks. Each iteration includes a full pass
19
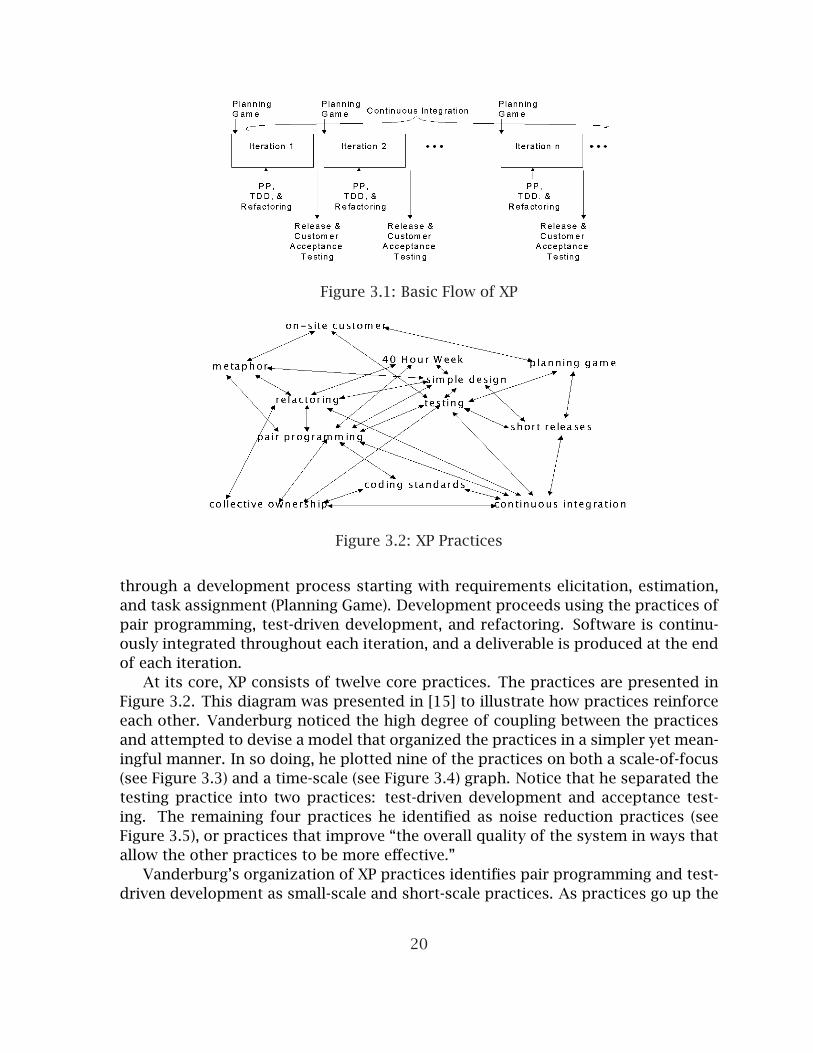
Figure 3.1: Basic Flow of XP
Figure 3.2: XP Practices
through a development process starting with requirements elicitation, estimation,and task assignment (Planning Game). Development proceeds using the practices ofpair programming, test-driven development, and refactoring. Software is continu-ously integrated throughout each iteration, and a deliverable is produced at the endof each iteration.
At its core, XP consists of twelve core practices. The practices are presented inFigure 3.2. This diagram was presented in [15] to illustrate how practices reinforceeach other. Vanderburg noticed the high degree of coupling between the practicesand attempted to devise a model that organized the practices in a simpler yet mean-ingful manner. In so doing, he plotted nine of the practices on both a scale-of-focus(see Figure 3.3) and a time-scale (see Figure 3.4) graph. Notice that he separated thetesting practice into two practices: test-driven development and acceptance test-ing. The remaining four practices he identified as noise reduction practices (seeFigure 3.5), or practices that improve “the overall quality of the system in ways thatallow the other practices to be more effective.”
Vanderburg’s organization of XP practices identifies pair programming and test-driven development as small-scale and short-scale practices. As practices go up the
20
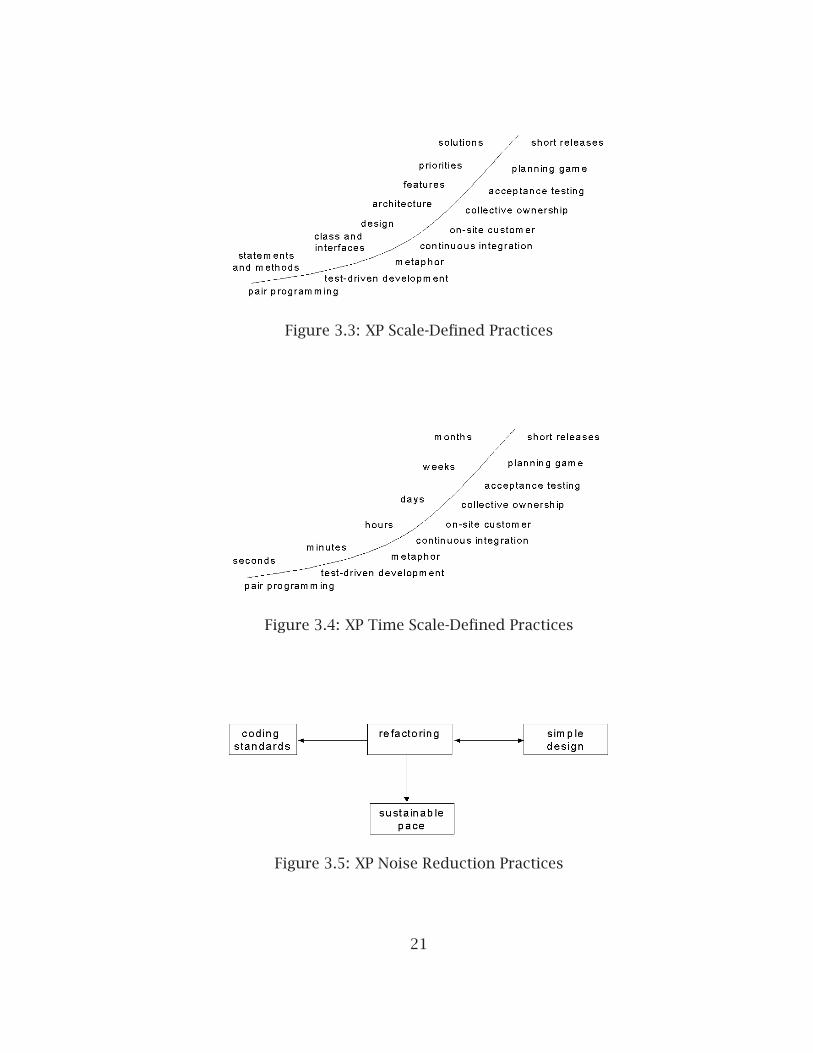
Figure 3.3: XP Scale-Defined Practices
Figure 3.4: XP Time Scale-Defined Practices
Figure 3.5: XP Noise Reduction Practices
21

scale, they become more dependent on lower practices. For instance, continuousintegration and collective ownership are enabled by the comprehensive automatedtests produced by test-driven development and the constant code review resultingfrom pair programming. In the collective ownership example, developers are morewilling to share ownership of code when they know that other developers must keepall tests passing and that no changes will ever occur by an individual developer.
Based on these observations, it should be no surprise that pair programmingand now with this research, test-driven development have been the first two prac-tices to be studied independent of XP. As practices focusing on the smallest scales,pair-programming and test-driven development are least dependent on other prac-tices and have the greatest potential of applying in a wider range of developmentprocesses.
Chapter 4 will further discuss how this research examines TDD in the context ofa more traditional development process. Developers in the empirical studies of thisresearch demonstrate that TDD is an effective practice independent of XP.
3.2 Evaluative Research on TDD in Industry
A very limited number of evaluative research studies have been conducted on TDDwith professional practitioners. North Carolina State University (NCSU) seems tobe the only source of such studies to date. Researchers at NCSU have performedat least three empirical studies on TDD in industry settings involving fairly smallgroups in at least four different companies [37, 60, 87]. These studies primarilyexamined defect density as a measure of software quality, although some surveydata indicated that programmers thought TDD promoted simpler designs. In theGeorge study, programmer experience with TDD varied from novice to expert, whilethe other studies involved programmers new to TDD.
These studies revealed that programmers using TDD produced code which passedbetween 18% and 50% more external test cases than code produced by the corre-sponding control groups. The studies also reported less time spent debugging codedeveloped with TDD. Further they reported that applying TDD had from minimalimpact to a 16% decrease in programmer productivity. In other words, applyingTDD sometimes took longer than not using TDD. In the case of that took 16% moretime, it was noted that the control group also wrote far fewer tests than the TDDgroup.
These studies are summarized in Table 3.1. Each experiment is labeled as eithera case study (CS) or a controlled experiment (CE).
22

No. of No. of Quality ProductivityStudy Type Companies Programmers Effects Effects
George [37] CE 3 24 TDD passed18% moretests
TDD took16% longer
Maximilien [60] CS 1 9 50% reduc-tion in defectdensity
minimal im-pact
Williams [87] CS 1 9 40% reduc-tion in defectdensity
no change
Table 3.1: Summary of TDD Research in Industry
3.3 Evaluative Research on TDD in Academia
A number of studies are reported from academic settings. Most of these examine XPas a whole, but a few specifically focus on TDD. Although many of the publicationson TDD in academic settings are primarily anecdotal [13, 62], five were discoveredwhich report empirical results. When referring to software quality, all but one [53] ofthe empirical studies focused on the ability of TDD to detect defects early. Two [26,53] of the five studies reported significant improvements in software quality andprogrammer productivity. One [27] reported a correlation between number of testswritten and productivity. In this study, students using test-first wrote more testsand were significantly more productive. The remaining two [63, 66] reported nosignificant improvements in either defect density or productivity. All five studieswere relatively small and involved only a single semester or less. In all studies,programmers had little or no previous experience with TDD.
Although not included here, the anecdotal studies are also beneficial to exam-ine. For instance, the Barriocanal study reports that only 10% of the 100 studentsinvolved actually wrote unit tests, indicating that motivation is a serious concern.
The empirical studies are summarized in Table 3.2. All studies involved con-trolled experiments (CE).
3.4 Research Classification
Vessey et al. [39, 83] present a classification system for the computing disciplines.This system provides classification of research by topic, approach, method, refer-ence discipline, and level of analysis. The previously mentioned studies are summa-rized in Table 3.3. This table applies the Vessey classification system, and the tablecontents are described in the following sections. This table summarizes all experi-
23

No. of Quality ProductivityStudy Type Programmers Effects Effects
Edwards [26] CE 59 54% fewerdefects
n/a
Kaufmann [53] CE 8 improvedinformationflow
50% im-provement
Muller [63] CE 19 no change,but betterreuse
no change
Pancur [66] CE 38 no change no changeErdogmus [27] CE 35 no change improved
productiv-ity
Table 3.2: Summary of TDD Research in Academia
mental studies found, plus two anecdotal studies. A number of additional anecdo-tal studies were discovered. Although some of these do have useful information asmentioned in the previous section, they reveal little concerning classification andthus are not included here.
3.4.1 Definition of “Topic” Attribute
This research concentrates solely on the topic of TDD which fits in category 3.0Systems/Software Concepts and subcategory 3.4 Methods/techniques.
3.4.2 Definition of “Approach” Attribute
Research approaches may be descriptive, evaluative, or formulative. A number ofpublications were referenced in previous sections which originally presented andexplained TDD. These would be considered formulative and descriptive research.This research focuses primarily on evaluative research of the TDD software method.Such research attempts to evaluate or assess the efficacy of TDD.
Evaluative approaches may be divided into the following four sub-categories:deductive (ED), interpretive (EI), critical (EC), or other (EO). From Table 3.3 one cansee all of these studies are classified as evaluative-deductive.
24
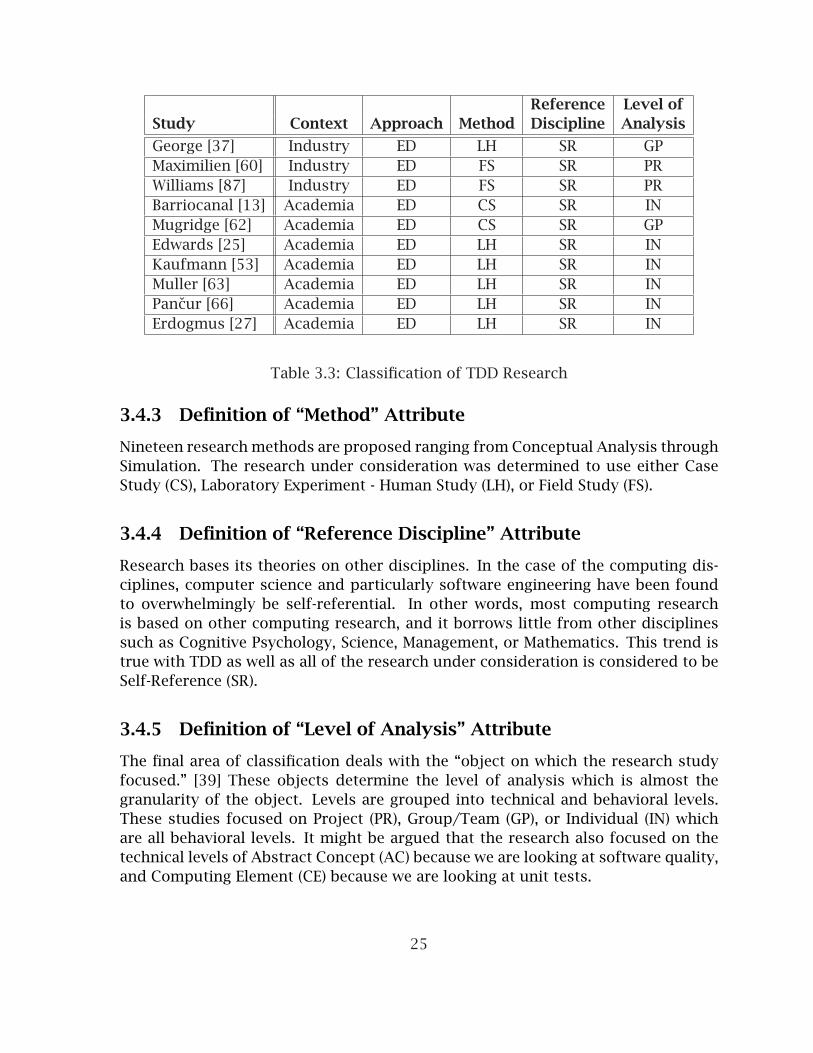
Reference Level ofStudy Context Approach Method Discipline Analysis
George [37] Industry ED LH SR GPMaximilien [60] Industry ED FS SR PRWilliams [87] Industry ED FS SR PRBarriocanal [13] Academia ED CS SR INMugridge [62] Academia ED CS SR GPEdwards [25] Academia ED LH SR INKaufmann [53] Academia ED LH SR INMuller [63] Academia ED LH SR INPancur [66] Academia ED LH SR INErdogmus [27] Academia ED LH SR IN
Table 3.3: Classification of TDD Research
3.4.3 Definition of “Method” Attribute
Nineteen research methods are proposed ranging from Conceptual Analysis throughSimulation. The research under consideration was determined to use either CaseStudy (CS), Laboratory Experiment - Human Study (LH), or Field Study (FS).
3.4.4 Definition of “Reference Discipline” Attribute
Research bases its theories on other disciplines. In the case of the computing dis-ciplines, computer science and particularly software engineering have been foundto overwhelmingly be self-referential. In other words, most computing researchis based on other computing research, and it borrows little from other disciplinessuch as Cognitive Psychology, Science, Management, or Mathematics. This trend istrue with TDD as well as all of the research under consideration is considered to beSelf-Reference (SR).
3.4.5 Definition of “Level of Analysis” Attribute
The final area of classification deals with the “object on which the research studyfocused.” [39] These objects determine the level of analysis which is almost thegranularity of the object. Levels are grouped into technical and behavioral levels.These studies focused on Project (PR), Group/Team (GP), or Individual (IN) whichare all behavioral levels. It might be argued that the research also focused on thetechnical levels of Abstract Concept (AC) because we are looking at software quality,and Computing Element (CE) because we are looking at unit tests.
25
3.5 Factors in Software Practice Adoption
A variety of factors play into the widespread adoption of a software practice. Moti-vation for change, economics, availability of tools, training and instructional mate-rials, a sound theoretical basis, empirical and anecdotal evidence of success, time,and even endorsements of the practice by highly regarded individuals or groups canall influence the decision on whether or not to adopt a new practice.
The current state of TDD is mixed regarding this list of factors. With regardto some factors, TDD seems to be poised for growth in adoption. The state ofsoftware development practice provides a clear motivation for change. Softwaredevelopment is a complex mix of people, process, technology, and tools which con-tinues to struggle to find consistency and predictability. Projects continue to runover schedule and budget, and practitioners seem eager to find improved methods.
As was noted in earlier sections, tools such as JUnit, MockObjects, and Cactus aremature and widely available. Although much of the tool development has targetedthe Java Programming Language, Java is an increasingly popular language both incommercial applications and academia. Further, tool support for TDD is good andimproving for most modern languages.
Economic models have considered XP and TDD [64] and note the potential forpositive improvements, but recognize that additional research is needed. As wasseen in the previous section, empirical and anecdotal evidence is still quite sparse,and limited to fairly small, disparate studies. This research will extend the exam-ination of TDD extensively first by looking at software quality more broadly, andsecond by looking at a much larger, more diverse population over a longer periodof time.
The interplay of acceptance between academics and industry practitioners is avery interesting one. Some reports indicate that it takes five to fifteen years forresearch developments to make it into commercial practice. The reverse pathwayseems to be similar. Some research has shown how TDD can improve programmingpedagogy, yet there are few instructional resources available. JUnit incorporationinto BlueJ and the corresponding programming textbook indicates that improve-ments may be on the way in this area.
There are a number of challenges to adopting TDD. Perhaps first and foremostis that TDD requires a good deal of discipline on the part of the programmer. Henceprogrammers may require compelling reasons before they are willing to give it atry. Secondly, TDD is still widely misunderstood. Perhaps its name is to blame, butmany still erroneously think that TDD is only about testing, not design. Third, TDDdoesn’t appear to fit in every situation. Section three described iterative, incremen-tal, and evolutionary process models which work best with TDD. Developers andmanagers must then determine when to apply TDD and when to do something else.
It is not clear how widespread TDD will be adopted. Additional research and theavailability of training and instructional materials may play an important role.
26

Chapter 4
Research Methodology
This chapter presents the test-driven development approach and details how thisresearch will examine it. In the first section, TDD will be introduced with a smallsample application, giving examples in Java and C++. Particular attention will begiven to how TDD informs design decisions.
In the last section, the design of the formal experiment will be detailed.
4.1 TDD Example
This section will present an example of how developing an application with TDDmight proceed. The application to be developed is a television channel guide asdescribed by the use cases in Figure 4.1. We will only start the application assumingthat there is only one channel and the user can only move left and right. In otherwords, we will not attempt the use case “Shift Channel Selection Up/Down”.
In the Java implementation, the application should provide a graphical user in-terface that displays a window of maybe three hours worth of shows. It allows theuser to select a show and scroll the window of shows to the left and right with thearrow keys.
The C++ implementation will provide a character-based user interface and allowthe user to move left and right by entering 4 and 5 respectively. Screen shots ofpossible Java and C++ implementations are given in Figure 4.2 and Figure 4.3.
4.1.1 Java Example
First we will do a Java example. As discussed in chapter 2, JUnit is the de factostandard testing framework for Java so our example will use JUnit and TDD todevelop this application.
27

Figure 4.1: Television Channel Guide Use Cases
Figure 4.2: Television Channel Guide Java GUI
8:00 9:00 10:00 10:30+==============++==============++======++======+|Sesame Street ||Cyber Chase ||Zoom ||Arthur|+==============++==============++======++======+Enter 4 to move left one show, 5 to move right one show, and -1 to quit.
Figure 4.3: Television Channel Guide C++ Screen Shot
28
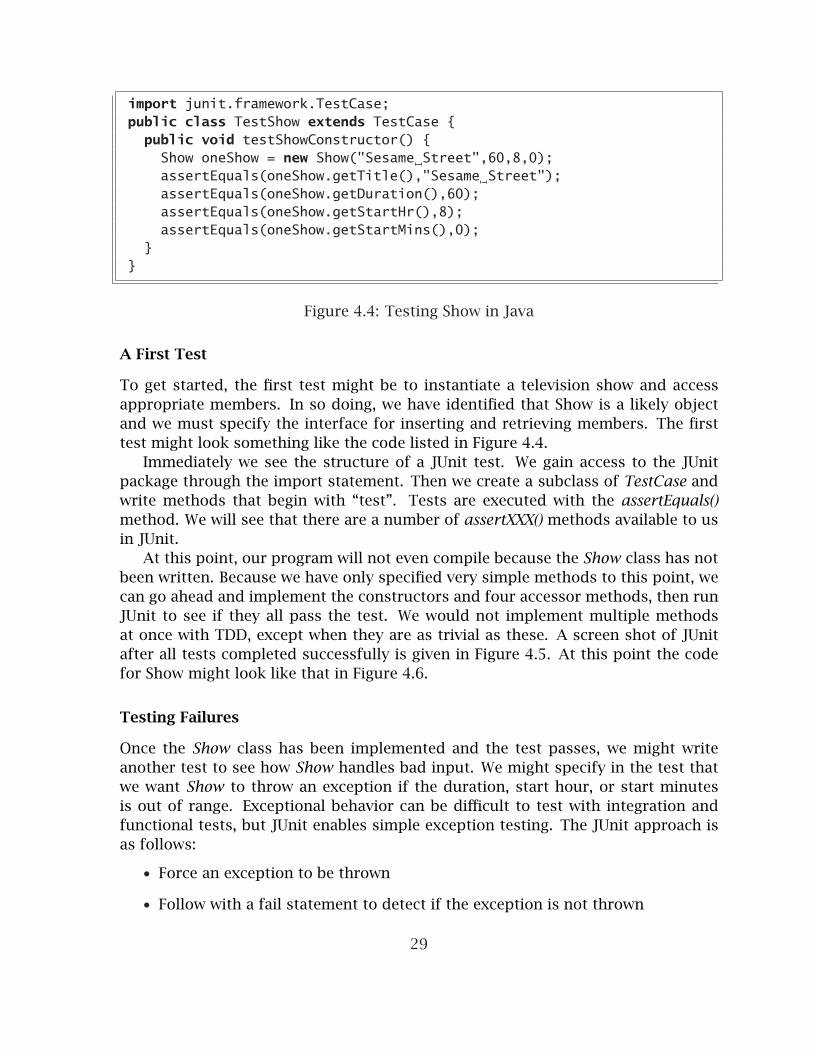
import junit.framework.TestCase;public class TestShow extends TestCase {public void testShowConstructor() {Show oneShow = new Show("Sesame Street",60,8,0);assertEquals(oneShow.getTitle(),"Sesame Street");assertEquals(oneShow.getDuration(),60);assertEquals(oneShow.getStartHr(),8);assertEquals(oneShow.getStartMins(),0);
}}
Figure 4.4: Testing Show in Java
A First Test
To get started, the first test might be to instantiate a television show and accessappropriate members. In so doing, we have identified that Show is a likely objectand we must specify the interface for inserting and retrieving members. The firsttest might look something like the code listed in Figure 4.4.
Immediately we see the structure of a JUnit test. We gain access to the JUnitpackage through the import statement. Then we create a subclass of TestCase andwrite methods that begin with “test”. Tests are executed with the assertEquals()method. We will see that there are a number of assertXXX() methods available to usin JUnit.
At this point, our program will not even compile because the Show class has notbeen written. Because we have only specified very simple methods to this point, wecan go ahead and implement the constructors and four accessor methods, then runJUnit to see if they all pass the test. We would not implement multiple methodsat once with TDD, except when they are as trivial as these. A screen shot of JUnitafter all tests completed successfully is given in Figure 4.5. At this point the codefor Show might look like that in Figure 4.6.
Testing Failures
Once the Show class has been implemented and the test passes, we might writeanother test to see how Show handles bad input. We might specify in the test thatwe want Show to throw an exception if the duration, start hour, or start minutesis out of range. Exceptional behavior can be difficult to test with integration andfunctional tests, but JUnit enables simple exception testing. The JUnit approach isas follows:
• Force an exception to be thrown
• Follow with a fail statement to detect if the exception is not thrown
29

Figure 4.5: JUnit GUI - All Tests Pass
• Catch the exception and assert that it was caught
The test in Figure 4.7 specifies that the constructor should throw the exception.Notice the use of the fail method following the line that is expected to throw theexception. This technique ensures that the exception was thrown and execution didnot reach the fail method. In the exception handler, the assertTrue method may beunnecessary, but it provides documentation that execution should reach this point.
Because we have not yet implemented this functionality, this test will fail asshown in Figure 4.8. We would now proceed to implement the desired exceptionthrowing and check to see if we need to refactor to improve either the code or thetests. We would continue to repeatedly write a test, write the code to make the testpass, and refactor until we are satisfied that the Show class has the interface andbehavior that we desire.
Refactoring to an Improved Design
Next we consider whether the Show class was the correct place to start. It was thefirst thing that came to mind, but maybe we were thinking at too low a level. Afterreviewing the use cases, we might decide to tackle the “Load Channel Listing” usecase. We might start with the test shown in Figure 4.9.
In this test we have defined the file format, identified the ChannelGuide class,and specified a constructor that accepts the name of the file containing the televi-sion show listings. We might step back and consider how the test drove us to makethe filename a parameter to this class. Had we been designing with a UML class di-agram, we likely would have included a filename member in this class, but we may
30

public class Show {public Show() {}public Show(String title, int hr, int min, int duration){this.title = title;this.duration = duration;this.startHr = hr;this.startMins = min;
}public String getTitle() {return title;
}public int getDuration() {return duration;
}public int getStartHr() {return startHr;
}public int getStartMins() {return startMins;
}private String title;private int duration;private int startHr;private int startMins;
}
Figure 4.6: Java Show Class
public void testBadMins() {try {Show oneShow = new Show("Cyber Chase",30,7,70);fail("Non-default constructor should throw an Exception if the\n"
+ " minutes parameter is greater than 59 or less than 0");}catch (Exception expected) {assertTrue(true);
}}
Figure 4.7: Testing Java Exceptions
31

Figure 4.8: JUnit Exception Failure
public void testChannelGuideFromFile() {try {PrintWriter dout = new PrintWriter(
new FileWriter("tvlistings.txt"));dout.println("Sesame Street:8:0:60");dout.println("Cyber Chase:9:0:30");dout.println("Zoom:9:30:30");dout.println("Caillou:10:0:30");dout.println("Mr. Rogers:10:30:30");dout.println("Zooboomafoo:11:0:30");dout.println("Arthur:11:30:30");dout.close();
} catch(IOException e) { System.out.println(e);}
ChannelGuide cg = new ChannelGuide("tvlistings.txt");assertEquals(cg.numShows(),7);
}
Figure 4.9: Channel Guide JUnit Test
32

ChannelGuide
-listing: ArrayList
+ChannelGuide(filename:String)
+readListings()
+numShows(): int
+getShow(hour:int,min:int)
ArrayList
Figure 4.10: Channel Guide UML Class Diagram Prior to Refactoring
public void testReadListings() {// write shows to tv l i s t i ngs . txt as in testChannelGuideFromFile ( )List testList = new ArrayList();ListingReader lr = new ListingReader("tvlistings.txt",testList);assertEquals(testList.size(),7);
}
Figure 4.11: Read Shows from File Test
not have considered passing the name as a constructor parameter. Because we arethinking of how to use and test the class from the beginning, the class is naturallymore testable.
Refactoring to the Dependency Injection Design Pattern
In keeping with the TDD cycle of write a test, write code, then refactor, the developershould again examine the test just completed in Figure 4.9 to see if any refactoringneeds to occur. Figure 4.10 illustrates the current design with a UML class diagram.
An astute developer will notice that this test is actually testing two things. Firstit is testing the reading and processing of the input data file. Second it is testing thestoring of the shows in some data structure. It would be better if the two functionswere separated and tested independently. If the test fails, one would like to know ifthe failure is caused by a problem with the input file processing or if the failure iscaused by a problem with the data structure. In fact by separating the two it shouldbe easier to accommodate new functionality such as retrieving show data from anetwork service rather than from a file.
The test in Figure 4.11 isolates and tests the functionality of reading show list-ings from a file. The shows are stored in a simple ArrayList data structure. Notethat the ChannelGuide class is not involved in this test at all. Instead a new List-ingReader class is introduced whose sole purpose is to read shows into a List. Inmaking this piece of functionality more testable, the two classes ChannelGuide andListingReader have become more cohesive.
The test in Figure 4.12 isolates and tests the ChannelGuide interface for stor-
33

public void testChannelGuideAlone() {List testList = new ArrayList();testList.add(new Show("Sesame Street",8,0,60));//add other showsChannelGuide cg = new ChannelGuide();cg.setListing(testList);assertEquals(cg.numShows(),7);
}
Figure 4.12: Show Listing Data Structure Test
public void testChannelGuideWithDI() {List testList = new ArrayList();// tes tL i s t could be any data structure that implements L i s tListingReader lr = new ListingReader("tvlistings.txt",testList);ChannelGuide cg = new ChannelGuide();cg.setListing(testList);assertEquals(cg.numShows(),7);
}
Figure 4.13: Channel Guide with Dependency Injection Test
ing and retrieving the show listing data structure. The setListing() method allowsthe test to “inject” the data structure into the ChannelGuide class. The Channel-Guide class expects a listing that implements the List interface from the Java API.By taking this approach, the test can inject a simple ArrayList while the productionChannelGuide class can be configured or “wired” with a more advanced data struc-ture. This approach is an example of the Dependency Injection design pattern [31].Figure 4.13 demonstrates the use of both the show listing and the listing storagefunctionality in the Channel Guide class. Figure 4.14 illustrates the new design ofthe Channel Guide with the Dependency Injection pattern. Although this designintroduces a new coupling between the ChannelGuide class and the List interface,such a coupling is highly configurable and not hard-coded.
The Dependency Injection pattern has proven to be a very powerful and popu-lar pattern. The pattern was originally given the name Inversion of Control. Severallightweight Java frameworks such as the Spring framework [52] have emerged basedprimarily on this pattern. Frameworks such as Spring provide “plumbing” code thatsimplifies the wiring of objects and their dependencies through external configura-tion files such as XML.
34

ChannelGuide
-listing: List
+setListing(List)
<<interface>>
List
ListingReader
+ListingReader(filename:String,aList:List)
Figure 4.14: Channel Guide UML Class Diagram with Dependency Injection
Testing a Graphical User Interface
As development progresses one might notice the emphasis placed on the underlyingmodel of the application. Because the graphical user interface is difficult to testautomatically, TDD encourages placing as much functionality as possible in themodel, minimizing what will exist in the GUI. We will conclude this example bylooking at some of the event handling code in the GUI.
The GUI needs to react to two types of events: pressing the right arrow keyshould shift the television listing one show to the right, and pressing the left arrowkey should shift the listing one show to the left. Prior to even writing the GUI code,we can write tests for the event handlers. The code in Figure 4.15 and Figure 4.16utilizes the setUp() method to create a test file prior to each test. The first test calledtestMoveRight() creates the GUI with the specified file, then checks to see if the firstshow is the first one about to be displayed by the GUI (“Sesame Street”). Next thetest forces the action of pressing the right arrow key to be performed by extractingthe MoveRightAction object from the GUI and performing the action. Finally thetest checks to see if the new first show is what used to be the second show (“CyberChase”).
The code under test is given in Figure 4.17 and Figure 4.18 along with the eventhandling code in Figure 4.19. Notice that no GUI components are tested directly.The ChannelGuideGUI object is a JFrame, but it is instantiated and tested withoutactually showing it. We do observe some improvements that could be made. Forinstance, the MoveRightAction and the MoveLeftAction classes are so similar thatthey could probably be combined, perhaps in a common parent that implementsthe Template Method [35] design pattern. The tests give us courage to refactor tosuch a pattern. We can make small, incremental changes such as changing a classname, adding a method parameter, or eliminating a class, using the tests to quicklydetermine if we have broken anything.
35

public class TestChannelGuideGUI extends TestCase {public void setUp() {try {PrintWriter dout = new PrintWriter(
new FileWriter("tvlistings.txt"));dout.println("Sesame Street:8:0:60");dout.println("Cyber Chase:9:0:30");dout.println("Zoom:9:30:30");dout.println("Caillou:10:0:30");dout.println("Mr. Rogers:10:30:30");dout.println("Zooboomafoo:11:0:30");dout.println("Arthur:11:30:30");dout.close();
} catch(IOException e) { System.out.println(e);}}public void testMoveRight() {ChannelGuideGUI cgui = new ChannelGuideGUI("tvlistings.txt");ListIterator it = cgui.cg.currentStartIterator();assertEquals(((Show)it.next()).getTitle(),"Sesame Street");
// create move right actioncgui.showPanel.getActionMap().get("panel.right").
actionPerformed(new ActionEvent(this, 0, ""));it = cgui.cg.currentStartIterator();
// ver i fy new star tassertEquals(((Show)it.next()).getTitle(),"Cyber Chase");
// ver i fy button textassertEquals(cgui.showButtons[0].getText(),"9:00 Cyber Chase");
}public void testMoveLeft() {ChannelGuideGUI cgui = new ChannelGuideGUI("tvlistings.txt");ListIterator it = cgui.cg.currentStartIterator();assertEquals(((Show)it.next()).getTitle(),"Sesame Street");
// create move l e f t actioncgui.showPanel.getActionMap().get("panel.left").
actionPerformed(new ActionEvent(this, 0, ""));it = cgui.cg.currentStartIterator();
// ver i fy s tar t didn ’ t changeassertEquals(((Show)it.next()).getTitle(),"Sesame Street");
// ver i fy button textassertEquals(cgui.showButtons[0].getText(),"8:00 Sesame Street");
} ...}
Figure 4.15: Testing Events in Java GUI
36

public void testMoveLeft2() {ChannelGuideGUI cgui = new ChannelGuideGUI("tvlistings.txt");ListIterator it = cgui.cg.currentStartIterator();assertEquals(((Show)it.next()).getTitle(),"Sesame Street");cgui.showPanel.getActionMap().get("panel.right").
actionPerformed(new ActionEvent(this, 0, ""));it = cgui.cg.currentStartIterator();assertEquals(((Show)it.next()).getTitle(),"Cyber Chase");cgui.showPanel.getActionMap().get("panel.right").
actionPerformed(new ActionEvent(this, 0, ""));it = cgui.cg.currentStartIterator();assertEquals(((Show)it.next()).getTitle(),"Zoom");cgui.showPanel.getActionMap().get("panel.left").
actionPerformed(new ActionEvent(this, 0, ""));it = cgui.cg.currentStartIterator();assertEquals(((Show)it.next()).getTitle(),"Cyber Chase");
}
Figure 4.16: Testing Events in Java GUI cont.
4.1.2 C++ Example
A C++ example will be presented next. Unlike with Java, there is no de factostandard unit testing framework for C++. There may be a number of reasons forthis [80], not least of which is the lack of reflection capabilities like that in Java.
Of the C++ unit testing frameworks, the CxxTest [84] framework seems to havethe simplest interface. In order for it work, CxxTest must be included with thestandard libraries. Unfortunately it also requires an installation of perl and an extrastep in compilation.
To minimize the intrusion to the learning programmer, the research experimentsin CS1 and CS2 used simple assert statements from the standard library cassert.An example is given demonstrating a CS1/CS2 appropriate implementation of thesame ChannelGuide application (with a text-based user interface) where studentsonly know about classes, arrays, and assert. The class declarations are shown inFigure 4.20 and the driver, main(), is shown in Figure 4.21. Unit tests are relegatedto a global function named run_tests(). Three tests are shown in Figure 4.22. Thisapproach is described further in Appendix A.
4.2 Experiment Design
This section will outline the details of the formal experiments. It will discuss thehypothesis, independent and dependent variables, the software development pro-
37
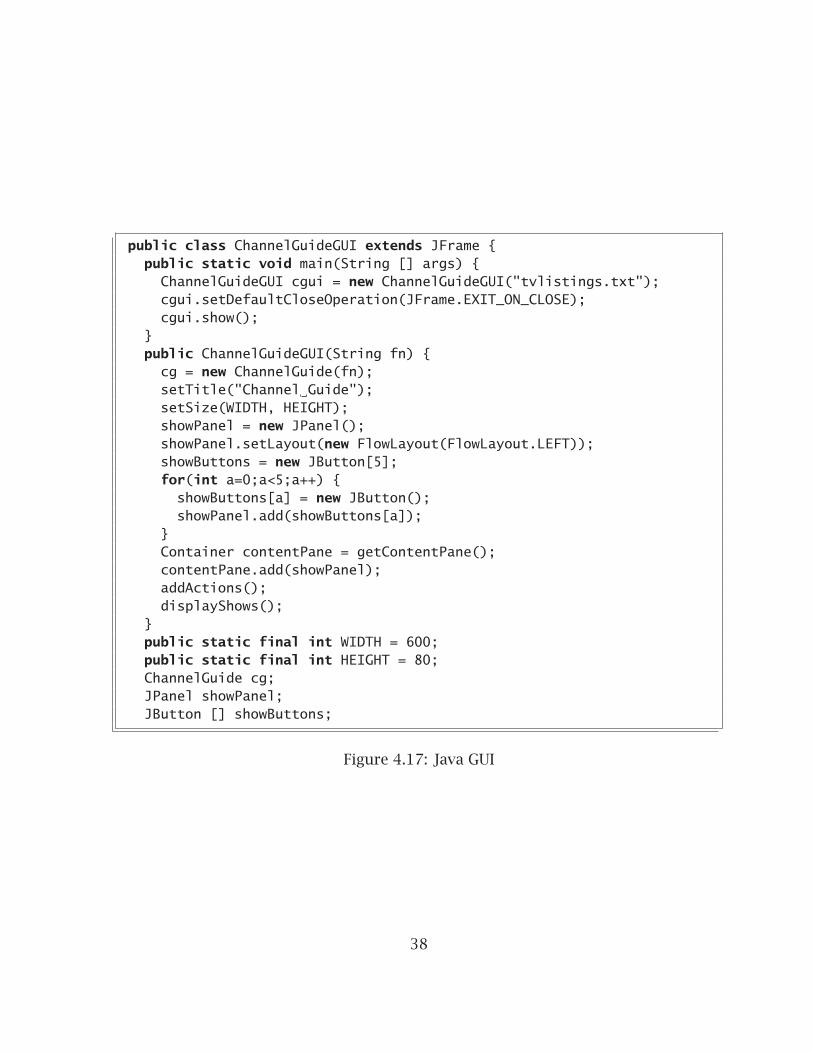
public class ChannelGuideGUI extends JFrame {public static void main(String [] args) {ChannelGuideGUI cgui = new ChannelGuideGUI("tvlistings.txt");cgui.setDefaultCloseOperation(JFrame.EXIT_ON_CLOSE);cgui.show();
}public ChannelGuideGUI(String fn) {cg = new ChannelGuide(fn);setTitle("Channel Guide");setSize(WIDTH, HEIGHT);showPanel = new JPanel();showPanel.setLayout(new FlowLayout(FlowLayout.LEFT));showButtons = new JButton[5];for(int a=0;a<5;a++) {showButtons[a] = new JButton();showPanel.add(showButtons[a]);
}Container contentPane = getContentPane();contentPane.add(showPanel);addActions();displayShows();
}public static final int WIDTH = 600;public static final int HEIGHT = 80;ChannelGuide cg;JPanel showPanel;JButton [] showButtons;
Figure 4.17: Java GUI
38
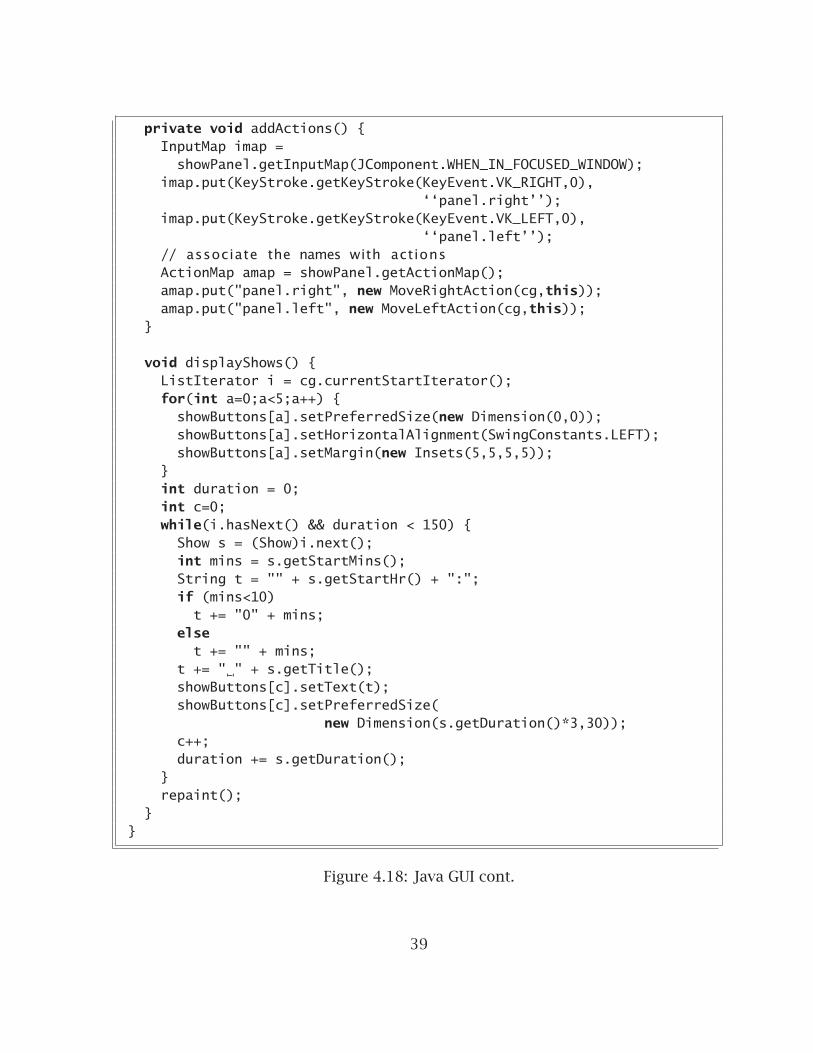
private void addActions() {InputMap imap =showPanel.getInputMap(JComponent.WHEN_IN_FOCUSED_WINDOW);
imap.put(KeyStroke.getKeyStroke(KeyEvent.VK_RIGHT,0),‘‘panel.right’’);
imap.put(KeyStroke.getKeyStroke(KeyEvent.VK_LEFT,0),‘‘panel.left’’);
// associate the names with actionsActionMap amap = showPanel.getActionMap();amap.put("panel.right", new MoveRightAction(cg,this));amap.put("panel.left", new MoveLeftAction(cg,this));
}
void displayShows() {ListIterator i = cg.currentStartIterator();for(int a=0;a<5;a++) {showButtons[a].setPreferredSize(new Dimension(0,0));showButtons[a].setHorizontalAlignment(SwingConstants.LEFT);showButtons[a].setMargin(new Insets(5,5,5,5));
}int duration = 0;int c=0;while(i.hasNext() && duration < 150) {Show s = (Show)i.next();int mins = s.getStartMins();String t = "" + s.getStartHr() + ":";if (mins<10)t += "0" + mins;
elset += "" + mins;
t += " " + s.getTitle();showButtons[c].setText(t);showButtons[c].setPreferredSize(
new Dimension(s.getDuration()*3,30));c++;duration += s.getDuration();
}repaint();
}}
Figure 4.18: Java GUI cont.
39

class MoveRightAction extends AbstractAction {MoveRightAction(ChannelGuide cg, ChannelGuideGUI c) {this.cg = cg;comp = c;
}public void actionPerformed(ActionEvent a){cg.advanceOne();comp.displayShows();
}private ChannelGuide cg;private ChannelGuideGUI comp;
}
class MoveLeftAction extends AbstractAction {MoveLeftAction(ChannelGuide cg, ChannelGuideGUI c) {this.cg = cg;comp = c;
}public void actionPerformed(ActionEvent a){cg.backupOne();comp.displayShows();
}private ChannelGuide cg;private ChannelGuideGUI comp;
}
Figure 4.19: Java GUI Event Handling
40

class Show{public:Show() : startHrs(0),startMins(0),duration(0)
{ strcpy(title,""); }Show(char[],int,int,int);Show(istream&);void getTitle(char[]);int getStartHours();int getStartMins();int getDuration();void displayTimeHeaders(ostream& out);void displayTopBottomLine(ostream& out);void displayMiddleLine(ostream& out);
private:char title[21];int startHrs;int startMins;int duration;
};
class Listing{public:Listing() {}Listing(istream&);int getNumShows();void setCurrent(int,int);Show getCurrent();Show getNext();Show getPrev();bool hasNext();bool hasPrev();
private:int getShowIndex(int,int);Show shows[20];int numShows;int current; // index of current show
};
Figure 4.20: C++ Channel Guide
41

class ChannelGuide{public:ChannelGuide();void display();void move(int);
private:Listing listing;
};
int main(){run_tests();ChannelGuide cg;int input=0;do{cg.display();cout << "Enter 4 to move left one show, "
<< "5 to move right one show, "<< "and -1 to quit" << endl;
cin >> input;cg.move(input);
} while(input>=0);return 0;
}
Figure 4.21: C++ Channel Guide cont.
42

void run_tests(){{ // test 1Show showOne("Seinfeld",9,0,60);char t[20];showOne.getTitle(t);assert(strcmp(t,"Seinfeld") == 0);assert(showOne.getStartHours() == 9);assert(showOne.getStartMins() == 0);assert(showOne.getDuration() == 60);}{ // tests with input f i l eofstream out;out.open("test2.out");assert(!out.fail());ifstream in;in.open("test2.out");assert(!in.fail());out << "Arthur 9 0 60" << endl
<< "Barney 10 0 30" << endl<< "Zoom 10 30 30" << endl;
Listing channelOne(in);{ // test 2assert(channelOne.getNumShows() == 3);char t[20];channelOne.setCurrent(10,0);Show curShow = channelOne.getCurrent();curShow.getTitle(t);assert(strcmp(t,"Barney") == 0);assert(curShow.getStartHours() == 10);}{ // test 3 tests getting a show already in progresschannelOne.setCurrent(9,30);Show curShow = channelOne.getCurrent();char t[20];curShow.getTitle(t);assert(strcmp(t,"Arthur") == 0);assert(curShow.getStartHours() == 9);assert(curShow.getStartMins() == 0);}}}
Figure 4.22: C++ Channel Guide Tests
43
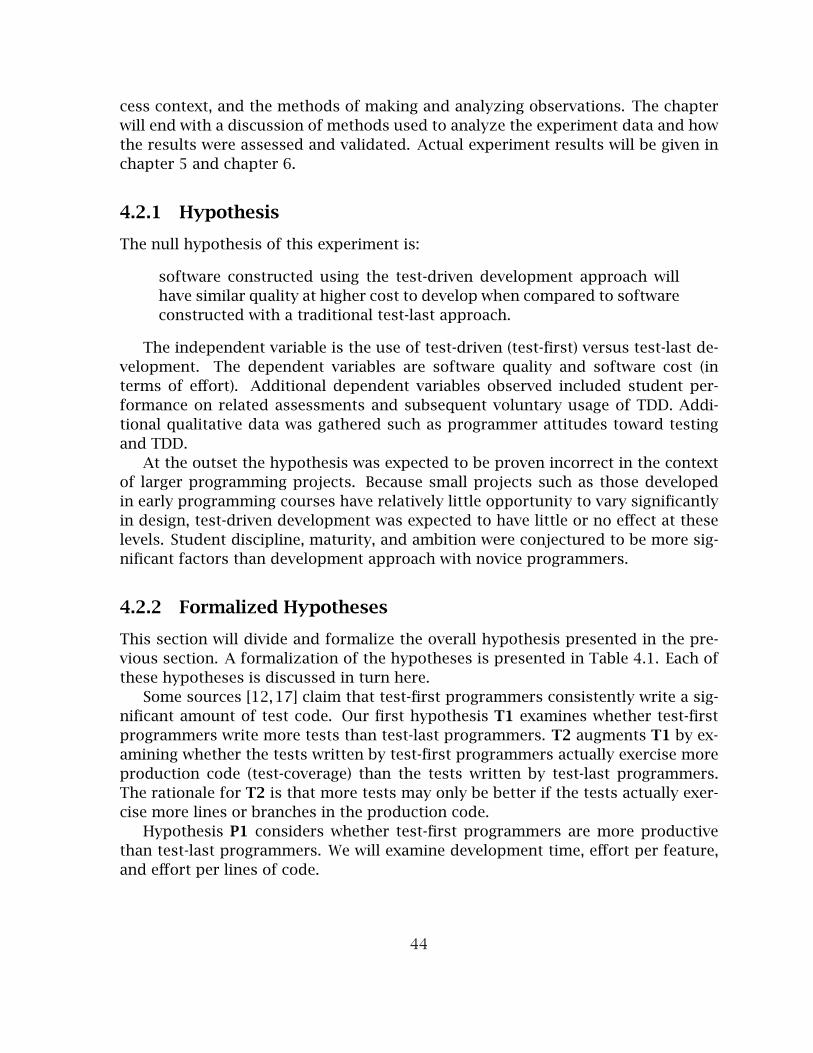
cess context, and the methods of making and analyzing observations. The chapterwill end with a discussion of methods used to analyze the experiment data and howthe results were assessed and validated. Actual experiment results will be given inchapter 5 and chapter 6.
4.2.1 Hypothesis
The null hypothesis of this experiment is:
software constructed using the test-driven development approach willhave similar quality at higher cost to develop when compared to softwareconstructed with a traditional test-last approach.
The independent variable is the use of test-driven (test-first) versus test-last de-velopment. The dependent variables are software quality and software cost (interms of effort). Additional dependent variables observed included student per-formance on related assessments and subsequent voluntary usage of TDD. Addi-tional qualitative data was gathered such as programmer attitudes toward testingand TDD.
At the outset the hypothesis was expected to be proven incorrect in the contextof larger programming projects. Because small projects such as those developedin early programming courses have relatively little opportunity to vary significantlyin design, test-driven development was expected to have little or no effect at theselevels. Student discipline, maturity, and ambition were conjectured to be more sig-nificant factors than development approach with novice programmers.
4.2.2 Formalized Hypotheses
This section will divide and formalize the overall hypothesis presented in the pre-vious section. A formalization of the hypotheses is presented in Table 4.1. Each ofthese hypotheses is discussed in turn here.
Some sources [12,17] claim that test-first programmers consistently write a sig-nificant amount of test code. Our first hypothesis T1 examines whether test-firstprogrammers write more tests than test-last programmers. T2 augments T1 by ex-amining whether the tests written by test-first programmers actually exercise moreproduction code (test-coverage) than the tests written by test-last programmers.The rationale for T2 is that more tests may only be better if the tests actually exer-cise more lines or branches in the production code.
Hypothesis P1 considers whether test-first programmers are more productivethan test-last programmers. We will examine development time, effort per feature,and effort per lines of code.
44
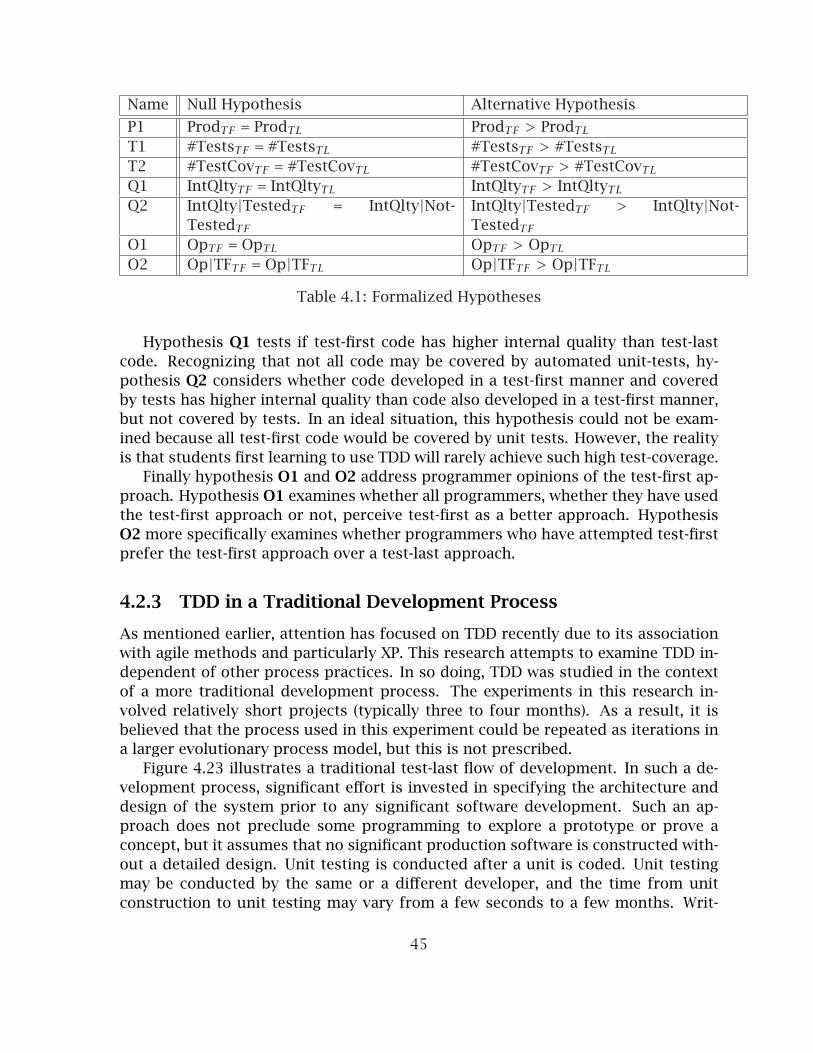
Name Null Hypothesis Alternative Hypothesis
P1 ProdTF = ProdTL ProdTF > ProdTLT1 #TestsTF = #TestsTL #TestsTF > #TestsTLT2 #TestCovTF = #TestCovTL #TestCovTF > #TestCovTLQ1 IntQltyTF = IntQltyTL IntQltyTF > IntQltyTLQ2 IntQlty|TestedTF = IntQlty|Not-
TestedTF
IntQlty|TestedTF > IntQlty|Not-TestedTF
O1 OpTF = OpTL OpTF > OpTLO2 Op|TFTF = Op|TFTL Op|TFTF > Op|TFTL
Table 4.1: Formalized Hypotheses
Hypothesis Q1 tests if test-first code has higher internal quality than test-lastcode. Recognizing that not all code may be covered by automated unit-tests, hy-pothesis Q2 considers whether code developed in a test-first manner and coveredby tests has higher internal quality than code also developed in a test-first manner,but not covered by tests. In an ideal situation, this hypothesis could not be exam-ined because all test-first code would be covered by unit tests. However, the realityis that students first learning to use TDD will rarely achieve such high test-coverage.
Finally hypothesis O1 and O2 address programmer opinions of the test-first ap-proach. Hypothesis O1 examines whether all programmers, whether they have usedthe test-first approach or not, perceive test-first as a better approach. HypothesisO2 more specifically examines whether programmers who have attempted test-firstprefer the test-first approach over a test-last approach.
4.2.3 TDD in a Traditional Development Process
As mentioned earlier, attention has focused on TDD recently due to its associationwith agile methods and particularly XP. This research attempts to examine TDD in-dependent of other process practices. In so doing, TDD was studied in the contextof a more traditional development process. The experiments in this research in-volved relatively short projects (typically three to four months). As a result, it isbelieved that the process used in this experiment could be repeated as iterations ina larger evolutionary process model, but this is not prescribed.
Figure 4.23 illustrates a traditional test-last flow of development. In such a de-velopment process, significant effort is invested in specifying the architecture anddesign of the system prior to any significant software development. Such an ap-proach does not preclude some programming to explore a prototype or prove aconcept, but it assumes that no significant production software is constructed with-out a detailed design. Unit testing is conducted after a unit is coded. Unit testingmay be conducted by the same or a different developer, and the time from unitconstruction to unit testing may vary from a few seconds to a few months. Writ-
45

Figure 4.23: Test-Last Flow
Figure 4.24: Test-First Flow
ing units and tests in short, rapid iterations will be referred to as iterative test-lastprogramming, whereas allowing long gaps and additional development before unitsare tested will be referred to as linear test-last programming.
Figure 4.24 illustrates the test-first flow of development. This approach assumesthat some high-level architecture is identified, but that design does not proceed toa detailed level. Instead the test-first process of writing unit-tests and constructingthe units in short, rapid iterations is used to allow the design to emerge and evolve.Notice that there are no assumptions about other process practices.
4.2.4 Experiment Overview
A total of seven formal experiments and one case study were conducted. An overviewof the controlled experiments is given in Figure 4.25.
Five experiments were conducted in academic settings at the University of Kansas.Separate experiments were conducted in courses ranging from beginning program-ming (CS1) through graduate software engineering. The first experiment was con-ducted in an undergraduate software engineering course in Summer 2005. In Fall2005, experiments were conducted in Programming 1 (CS1), Programming 2 (CS2),and the graduate software engineering course. The CS2 experiment was then re-peated in Spring 2006. With the exception of this second CS2 experiment, no stu-dent participated in multiple experiments.
Two experiments were conducted in a Fortune 500 company with experiencedsoftware developers. The larger industrial experiment compared three sets of twoprojects each, completed with distinct sequences of treatments. This experimentis labeled as “Industry (in-domain)” because the projects were completed by de-velopers in their regular work environment. The projects were prioritized and as-signed through the normal business process and the projects were delivered tousers for production use. The second, smaller industrial experiment labeled “In-dustry (in-training)” was conducted in a professional training course developed by
46

Figure 4.25: Overview of TDD Experiments
47
the researcher.
TDD Educational Materials
Educational materials were developed and delivered in conjunction with each ex-periment. The two early programming courses (CS1 and CS2) utilized a condensedform of the test-driven learning approach described in Appendix A. This approachembedded test-driven development training in the context of teaching other coursetopics. Training materials were also developed and delivered in the two more ad-vanced courses and in the two industry experiments. The software engineeringcourses involved relatively short (about two hours) training sessions dedicated tothe topic of automated unit testing and test-driven development. The industry train-ing consisted of a full-day course on automated unit testing and test-driven develop-ment in the context of a larger six-day training course. All materials were developedand delivered by the author and some artifacts are provided in Appendix B.
Team and Treatment Selection
Each experiment involved two phases or projects. The original objective was to de-termine the amount of software reuse from one phase/project to another. Due tocourse and industry constraints, this design was not consistent across all experi-ments although it was consistent within each experiment. In the CS1 experiment,students were randomly assigned to use a test-first or test-last approach on oneproject. Students were then asked to use the opposite approach on the secondproject. This design allows one to examine the influence of starting with a particu-lar approach.
In the CS2 experiment, students were allowed to choose which approach theywanted to use. They were then asked to use the same approach on both projects.This design allows one to examine student perceptions of the approaches (willing-ness to try them) and to look for differences in quality between the two projectsas they gain added experience and maturity. In both the CS1 and CS2 experiments,students worked individually and used C++ as the programming language.
In the two software engineering courses, students worked in teams of three orfour programmers each. Students self-selected their teammates, but Java experiencewas established as a blocking variable to ensure that each team had a minimum andbalanced skill set. Both experiments involved the same semester-long project. Theproject was divided into two phases.
Developers worked in pairs in the in-training industry experiment. The experi-ment consisted of two phases, but developers were only able to complete the firstphase in the time allotted. This design allows one to examine programmers’ abilityto quickly apply test-driven development and compares early quality differences inthe test-first and test-last approach.
48
In the in-domain industry experiment, experienced developers worked in smallteams of up to three people. Three sets of two projects were examined. The first setinvolved a test-last project followed by a test-first project. The second set involveda test-first project followed by a test-last project. The third set involved a test-lastproject with no automated tests followed by a second phase of the same projectcompleted with a test-first approach. This experiment design allows one to exam-ine quality differences in the approaches on a much larger scale and on practicalproblems without the confounding factor of inexperienced software developers.
Developer Experience and Perception Surveys
Programmer attitudes towards testing and test-driven development were evaluatedthrough pre- and post- experiment surveys conducted with both the control and thestudy groups. In the pre-experiment survey, students were asked to report on howthey perceive the value of testing, how they currently test their programs, and howopen they are to learning to use test-driven development. The pre-experiment sur-vey also asked about programming and academic experience and performance, andrequested demographic information so that results can be analyzed for significantdifferences in women and minority population groups [30]. The pre-experiment sur-veys were administered after students were given some training on automated unittesting and both the test-first and test-last approaches to software development.
In the post-experiment survey, students were asked to report again on how theyperceive the value of testing, whether they feel like they understand test-drivendevelopment, whether they used test-driven development in their assignments, andwhether they intend to use the test-driven development approach in the future bothin course work, or in any professional programming they may do.
The post-experiment survey was administered to all programmers at the end ofthe semester. The pre- and post-experiment surveys contained many identical ques-tions to determine if student attitudes toward testing and test-driven developmentchanged based on their experiences in the experiment.
Software, Effort, and Grade Artifacts
Developers were required to submit all of the code that they completed on eachproject. In most cases this code was collected through the normal grading processor extracted from a software configuration management system so no extract ef-fort was required on the part of the subjects. For the semester long projects, codewas collected at multiple points in order to see the development progression. Thecode was then evaluated to determine the code quality and test coverage. In addi-tion, during the coding process, a random sample of students were observed andinterviewed regarding their use of test-driven development.
Students were required to track and submit the amount of time they spent on
49
programming projects. CS1 and CS2 students tracked this data manually or throughsource code comment entries and reported this data with the final project submis-sions. SE students were provided a spreadsheet template which they submitted byteam each week of the semester. Project time data was not collected or was un-reliable in the industry experiments so it was not available for analysis in thosecontexts.
Student exam and course grades were also collected in order to determine if anycorrelation exists between test-driven development use and academic performance.
Industry Case Study
In addition a case study was completed in the same industry development group asthe aforementioned experiments. The case study examined fifteen software projectscompleted in one development group over the course of five years. The six projectsfrom the in-domain industry experiment were included in the fifteen projects ex-amined. The projects were generally completed in three to twelve months with lessthan 10,000 lines of code by development teams with three or fewer primary devel-opers. This development group was selected because the projects were developedwith a variety of approaches. Some projects were completed with no automatedunit tests. Some projects were completed with automated tests in a test-last man-ner, and some projects were completed with automated tests in a test-first manner.All projects were completed in Java.
Experiment Context
Figure 4.26 illustrates the context of all the software projects examined (in academiaand industry). All projects enjoyed relatively stable requirements. In addition, eachproject included some degree of new technology. In the academic experiments,developers were generally programming in a language with which they had littlefamiliarity. In the industrial experiments, while developers had experience with thelanguage used, the projects included new frameworks with which developers hadno significant previous experience.
The projects, however, included developers with a range of programming expe-rience. While student programmers had generally similar course backgrounds, theyreported a mix of programming experience. Similarly the industry project teamsincluded a mix of junior through more senior developers. As will be discussed, thecontrol and experiment groups were balanced to ensure consistency.
The study contexts avoid confounding factors by keeping requirements volatilityand technology experience consistent within each experiment. Other confoundingfactors were avoided by ensuring consistent language use, consistent domain andproject assignment, and consistent time frames in each experiment. It would be
50
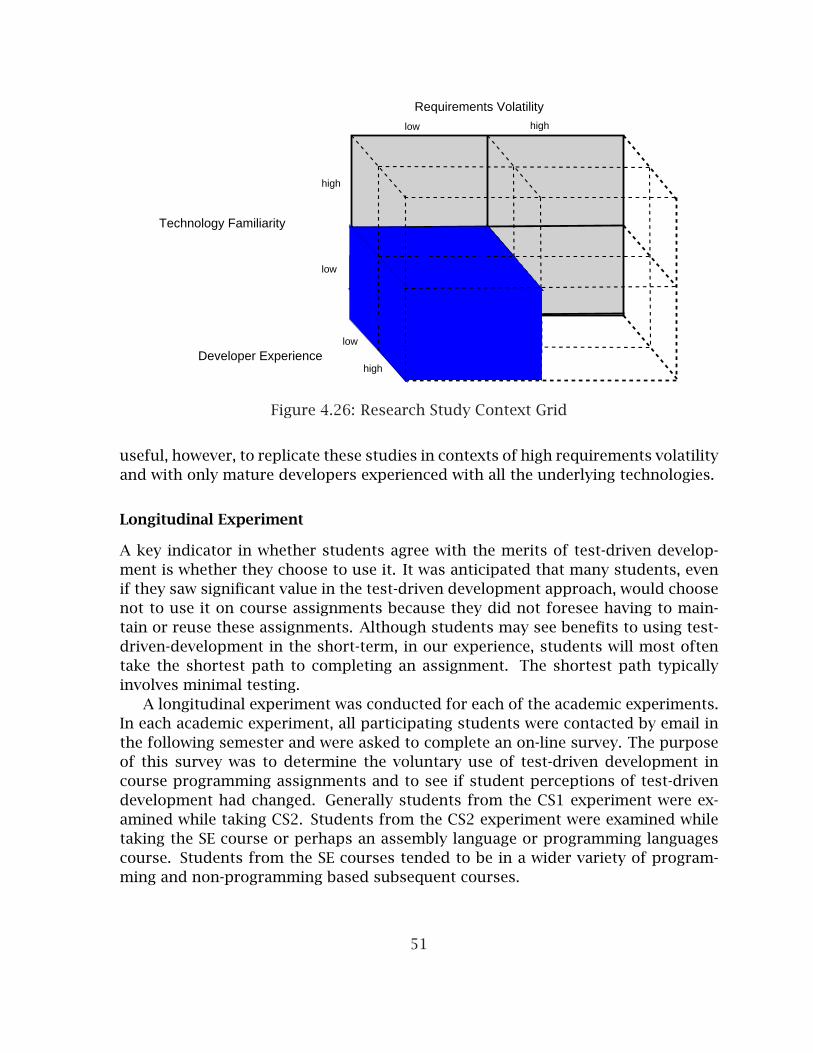
Requirements Volatility
Technology Familiarity
low high
high
low
high
low
Developer Experience
Figure 4.26: Research Study Context Grid
useful, however, to replicate these studies in contexts of high requirements volatilityand with only mature developers experienced with all the underlying technologies.
Longitudinal Experiment
A key indicator in whether students agree with the merits of test-driven develop-ment is whether they choose to use it. It was anticipated that many students, evenif they saw significant value in the test-driven development approach, would choosenot to use it on course assignments because they did not foresee having to main-tain or reuse these assignments. Although students may see benefits to using test-driven-development in the short-term, in our experience, students will most oftentake the shortest path to completing an assignment. The shortest path typicallyinvolves minimal testing.
A longitudinal experiment was conducted for each of the academic experiments.In each academic experiment, all participating students were contacted by email inthe following semester and were asked to complete an on-line survey. The purposeof this survey was to determine the voluntary use of test-driven development incourse programming assignments and to see if student perceptions of test-drivendevelopment had changed. Generally students from the CS1 experiment were ex-amined while taking CS2. Students from the CS2 experiment were examined whiletaking the SE course or perhaps an assembly language or programming languagescourse. Students from the SE courses tended to be in a wider variety of program-ming and non-programming based subsequent courses.
51
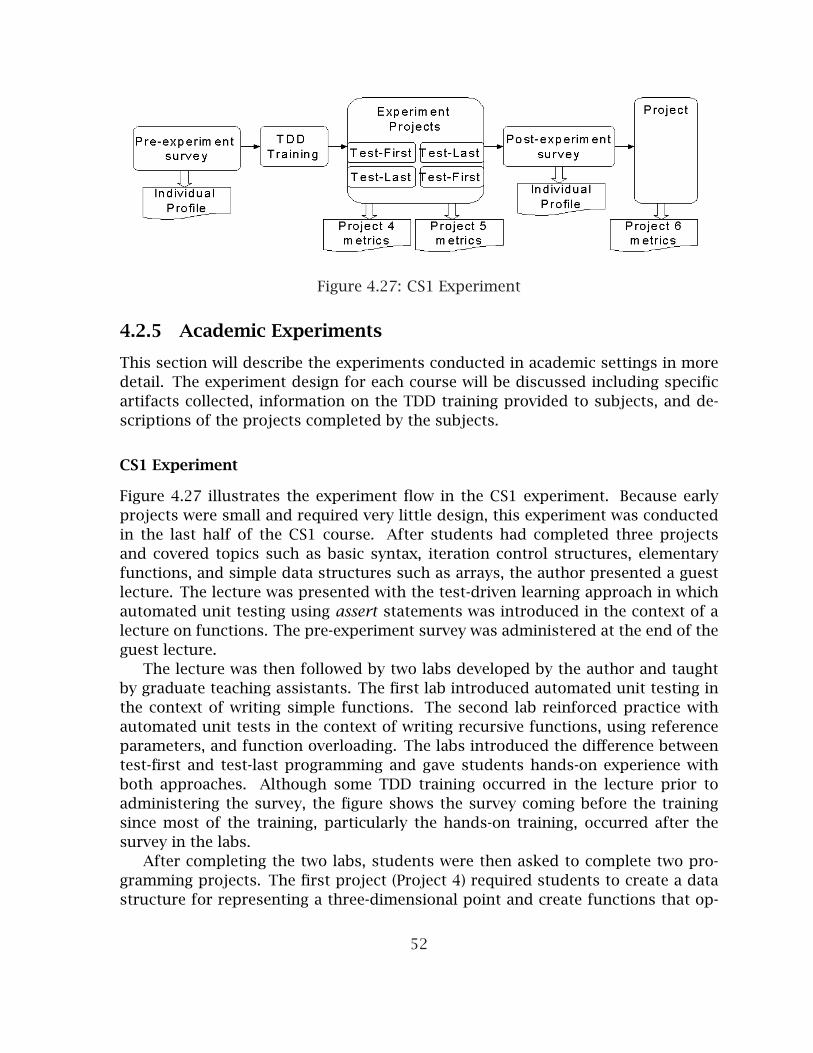
Figure 4.27: CS1 Experiment
4.2.5 Academic Experiments
This section will describe the experiments conducted in academic settings in moredetail. The experiment design for each course will be discussed including specificartifacts collected, information on the TDD training provided to subjects, and de-scriptions of the projects completed by the subjects.
CS1 Experiment
Figure 4.27 illustrates the experiment flow in the CS1 experiment. Because earlyprojects were small and required very little design, this experiment was conductedin the last half of the CS1 course. After students had completed three projectsand covered topics such as basic syntax, iteration control structures, elementaryfunctions, and simple data structures such as arrays, the author presented a guestlecture. The lecture was presented with the test-driven learning approach in whichautomated unit testing using assert statements was introduced in the context of alecture on functions. The pre-experiment survey was administered at the end of theguest lecture.
The lecture was then followed by two labs developed by the author and taughtby graduate teaching assistants. The first lab introduced automated unit testing inthe context of writing simple functions. The second lab reinforced practice withautomated unit tests in the context of writing recursive functions, using referenceparameters, and function overloading. The labs introduced the difference betweentest-first and test-last programming and gave students hands-on experience withboth approaches. Although some TDD training occurred in the lecture prior toadministering the survey, the figure shows the survey coming before the trainingsince most of the training, particularly the hands-on training, occurred after thesurvey in the labs.
After completing the two labs, students were then asked to complete two pro-gramming projects. The first project (Project 4) required students to create a datastructure for representing a three-dimensional point and create functions that op-
52

Figure 4.28: CS2 Experiment
erate on such points. Functions included adding, subtracting, multiplying, and di-viding points, as well as functions to determine of two points were equal and tocalculate the Euclidean distance and dot product of two points. Students had notbeen introduced to classes so they generally used an array-based data structure andglobal functions in their solutions.
Students with student IDs ending in an even number were asked to complete thefirst project with a test-first approach and students with student IDs ending in anodd number were asked to complete the first project with a test-last approach.
The second project (Project 5) required students to create class-based data struc-tures for representing points and polygons. A textual user interface was to allowusers to specify a number of points in a polygon and the program was to calcu-late the perimeter and area of that polygon. Test-first/test-last assignments wereswitched on the second project so students with student IDs ending in an odd num-ber were asked to complete the second project with a test-first approach and stu-dents with student IDs ending in an even number were asked to complete the secondproject with a test-last approach.
At the beginning of the second project, students were provided with a solu-tion to the first project that included a full set of automated unit tests. The post-experiment survey was then administered in labs following the completion of thesecond project.
CS2 Experiments
Figure 4.28 illustrates the experiment flow in the two CS2 experiments. Studentswere given a very brief (five minutes) introduction to test-first and test-last pro-gramming on the first day of the course, then given the pre-experiment survey.Students were introduced to automated unit testing using assert statements earlyin the semester in the third week lab. The lab presented examples and requiredhands-on exercises with automated tests using classes and simple and recursivefunctions. The lab presented both test-first and test-last approaches.
53

Students were then required to complete two programming projects. Studentswere asked to develop the projects with either a test-first or test-last approach. Thefollowing statement in the project description prescribes this requirement:
You should develop this program in a test-first or a test-last manner asdescribed in Lab 3. You may choose which approach you use, but use theapproach throughout the development of the project. If you don’t carewhich approach you use, choose test-first if your KUID starts with aneven number and use test-last if your KUID starts with an odd number.
Each programming project was to be completed in two or three weeks. Thefirst project in Fall 2005 required students to build an application that stored andmanipulated a list of drivers with traffic citations. The application had a textualuser interface that allowed the user to insert, delete, find, and print driver and cita-tion information. The public interface for the main list data structure class (calledDriverTable) was prescribed in the project description. This class was specified tocontain a statically allocated array for storing the driver and citation information.Although much of the interface for the one data structure class was specified, stu-dents were expected to design at least two other classes. The project description isprovided in Appendix B.
The second project extended and modified the first project. The DriverTableclass was to be modified internally to use a pointer-based linked list instead of anarray-based list. The application was to allow multiple DriverTables and the classinterface was modified slightly. Exceptions and some recursive functions were alsoadded to the requirements. At the beginning of the second project, students wereprovided with a solution to the first project that included a full set of automatedunit tests.
Students were asked to use a test-first or test-last approach in the remainingthree projects of the semester. Software from these projects was also analyzed, butthey were not originally a part of the experiment. At least two of these remainingprojects had very procedural solutions (a grammar checker and an experimentalprofiler of sorting algorithms). Their design was more prescribed than the first twoprojects that were a part of the formal experiment.
The second CS2 experiment in Spring 2006 was designed to be similar to thefirst CS2 experiment that was conducted in Fall 2005. The Spring 2006 versionrequired a set of two projects that were very similar to those in Fall 2005 but in adifferent domain (airline flights instead of traffic citations). In both experiments thepost-experiment survey was administered after the completion of the third project.
SE Experiments
Figure 4.29 illustrates the experiment flow in the two experiments conducted in theundergraduate and graduate software engineering courses. The first experiment
54

Figure 4.29: Software Engineering and Industry Training Experiments
Figure 4.30: Screenshot from HTML Pretty Print application.
was conducted in the context of an undergraduate software engineering course con-sisting of junior and senior computer science and computer engineering students.This course was taught during summer 2005. Results from this experiment werepublished and presented at the Conference on Software Engineering Education andTraining [49] in Hawaii in April 2006.
Students were asked to design and build an HTML pretty print system. Thissystem was to take an HTML file as input and transform the file into a more hu-man readable format by performing operations such as deleting redundant tagsand adding appropriate indentation. A sample application with a graphical userinterface is shown in Figure 4.30.
Students were taught and asked to follow a simplified form of the Unified Processincluding inception, elaboration, construction, and transition stages. The projectschedule was divided into two iterations with the first focusing on a text-based userinterface and a partial set of features. The second iteration added a graphical userinterface and additional features.
55
Students were asked to complete the pre-experiment survey and then were taughthow to write automated unit tests with the JUnit framework. All students were in-structed in how to write software in a test-first and test-last manner. The total timespent on JUnit and test-first/test-last programming training was less than one and ahalf hours. Students were then divided into three groups: two groups were to com-plete the project with a test-first approach and the third group was to complete theproject with a test-last approach. Students were allowed to self-select their teams,but Java programming experience was established as a blocking variable to ensurethat each team had at least one member with reasonable previous Java experience.Test-first/test-last team assignments were made after analyzing the pre-experimentquestionnaire to ensure the teams were reasonably balanced.
All teams completed a software requirements specification and a high-level ar-chitectural design. The test-last teams were asked to complete a detailed designprior to completing any significant coding. The test-first teams on the other handwere asked to use the test-first approach to allow the detailed design to emergeas the software was developed. The test-first teams were asked to document theirdetailed design after the code was developed.
Student programmers used the Java Programming Language, the JUnit unit test-ing framework, and the Eclipse integrated development environment. Studentssubmitted electronic time sheets (see Appendix B for a sample) and software ona weekly basis. They presented their projects in the final class period and thencompleted the post-experiment survey after seeing each others presentations.
The second SE experiment took place in a graduate software engineering coursethat is the first course in the Masters of Software Engineering program at the Univer-sity of Kansas. The course is a survey of software engineering and regularly includesa semester-long team-based project. This course met during the Fall 2005 semesterand used the exact same semester-long project as the undergraduate course de-scribed earlier. The pre-experiment survey, TDD training, development process,weekly time sheet and code submissions, and post-experiment survey also matchedthe same design and schedule as the undergraduate experiment.
4.2.6 Industry Experiments
This section will describe the experiments conducted with professional program-mers in more detail. The experiment design will be discussed including specificartifacts collected, information on the TDD training provided to subjects, and de-scriptions of the projects completed by the subjects. The industry experimentswere all completed in the same Fortune 500 company. The first smaller experimenttook place in the context of a training course. The second, significantly larger ex-periment actually consists of three experiments conducted on production projectsin the developers’ normal domain.
56

In-training Experiment
The in-training experiment took place in the context of a six day training course. Theexperiment followed the same design as the software engineering courses describedabove and illustrated in Figure 4.29. The primary difference was that the project wassignificantly smaller. Instead of a semester-long project, this project was intendedto be completed in a two-hour block of an eight hour full-day training session.
The course consisted of six full-days of on-site training developed and deliv-ered by the author in Fall 2005. The course included one day of instruction ontest-driven development with JUnit and the remaining five days of instruction weresplit between the Spring and Hibernate frameworks. The Spring [52] frameworkwas described in section 4.1.1 as a lightweight dependency injection framework.Spring also includes a model-view-controller based web application framework aswell as a framework for communicating with relational databases. Hibernate [68]is a persistence service providing object/relational mapping functionality. Springand Hibernate are commonly used together and provide integration support. Thecourse consisted of lecture directed by nearly five hundred presentation slides andhands-on lab exercises. The day on test-driven development was largely a refresherfor most developers from a similar course provided two years earlier.
The experiment consisted of an extended exercise near the end of the TDD day.Half of the developers were asked to complete the exercise with a test-first approachand half were asked to complete the exercise with a test-last approach. Subjectswere randomly selected for each group. A couple of individuals with limited Javaexperience requested to work in pairs with more experienced Java developers. Thiswas allowed and both test-first and test-last groups contained one or two such pairsof programmers. All developers were asked to use JUnit in the Eclipse IDE forwriting automated unit tests.
The exercise was to build a bowling game scorer. This project was proposed byRobert C. Martin [58] and was used in an industry experiment by Laurie Williams [37]to examine the effects of TDD on external quality. The project involved readingbowling throws from a file, calculating scores, and presenting scores through a text-based user interface. Some sample input/output code was provided to subjects toshorten the development effort. Despite these helps, not all programmers were ableto complete the project in the time allotted.
In-domain Experiment
Three experiments were conducted with professional developers in their regularwork environment with production projects. The three experiments were designedto examine different sequences of treatments. Each experiment compared two soft-ware projects completed in serial. The projects were primarily web applicationswritten in Java.
57

Figure 4.31: Industry Experiment 1
Figure 4.32: Industry Experiment 2
Figure 4.31 illustrates the experiment flow in the first industry experiment. Soft-ware from two phases of the same project were collected and compared in thisexperiment. The first phase was completed in 2001, before any of the develop-ers received any training on TDD or automated unit testing. As a result no auto-mated tests were written and the project was developed in a traditional mode with alarge up-front design and manual testing after software was completed. The secondphase was implemented in 2005 and 2006 using a test-first approach. In betweenthe two projects, developers completed a pre-experiment survey and participated inthe TDD training described earlier.
Figure 4.32 illustrates the experiment flow in the second industry experiment.The first project was developed with a traditional test-last approach. Developerslearned to use JUnit and wrote automated unit tests without formal training. Thisproject is then compared with the same second project from the first industry ex-periment. Although these projects were distinct (not continuation phases as inthe first experiment), there was significant developer overlap on the two projectsand they had many similarities. As described above developers completed a pre-experiment survey and participated in a TDD training class prior to completing thesecond project with a test-first approach.
Figure 4.33 illustrates the experiment flow in the third industry experiment. Pro-grammers were presented with TDD training in Summer 2004. They then com-pleted a project with a test-first approach. These two steps occurred before formalapproval for the research study was received. Programmers then participated inthe TDD/Spring/Hibernate training course described above. At the beginning ofthis training they completed the pre-experiment survey. Two-thirds of the devel-
58
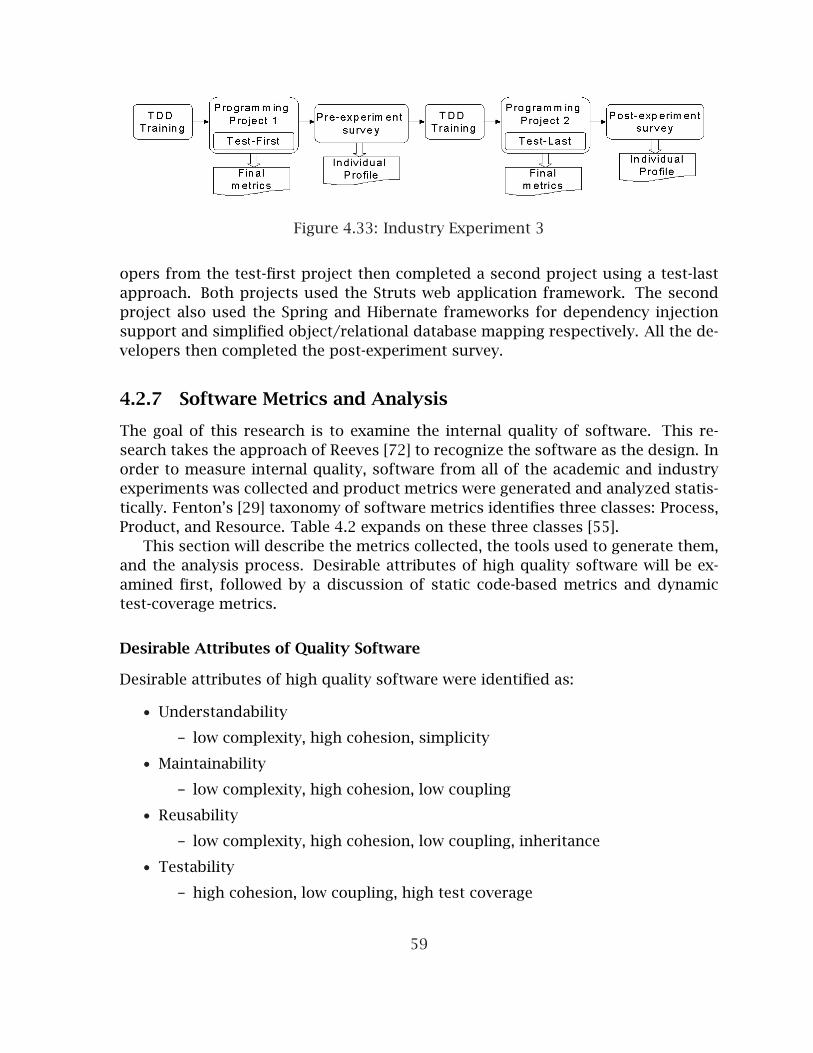
Figure 4.33: Industry Experiment 3
opers from the test-first project then completed a second project using a test-lastapproach. Both projects used the Struts web application framework. The secondproject also used the Spring and Hibernate frameworks for dependency injectionsupport and simplified object/relational database mapping respectively. All the de-velopers then completed the post-experiment survey.
4.2.7 Software Metrics and Analysis
The goal of this research is to examine the internal quality of software. This re-search takes the approach of Reeves [72] to recognize the software as the design. Inorder to measure internal quality, software from all of the academic and industryexperiments was collected and product metrics were generated and analyzed statis-tically. Fenton’s [29] taxonomy of software metrics identifies three classes: Process,Product, and Resource. Table 4.2 expands on these three classes [55].
This section will describe the metrics collected, the tools used to generate them,and the analysis process. Desirable attributes of high quality software will be ex-amined first, followed by a discussion of static code-based metrics and dynamictest-coverage metrics.
Desirable Attributes of Quality Software
Desirable attributes of high quality software were identified as:
• Understandability
– low complexity, high cohesion, simplicity
• Maintainability
– low complexity, high cohesion, low coupling
• Reusability
– low complexity, high cohesion, low coupling, inheritance
• Testability
– high cohesion, low coupling, high test coverage
59

Process
• Maturity Metrics• Management Metrics• Life Cycle Metrics
Product
• Size Metrics• Architecture Metrics• Structure Metrics• Quality Metrics• Complexity Metrics
Resource
• Personnel Metrics• Software Metrics• Hardware Metrics
Table 4.2: Fenton’s Taxonomy of Software Metrics
One will note that complexity, coupling, and cohesion are cross-cutting mea-sures affecting many desirable attributes. Although it is difficult to relegate thesemeasures to a single attribute, a broad look at many metrics can indicate high orlow internal quality. Table 4.3 and Table 4.4 identify many of the objective metricsconsidered for these categories.
Static Code Analysis
An extensive search produced twelve static code analysis metrics tools that werethen acquired and evaluated for the purposes of this research. The search focusedon tools that generate metrics from C++ and Java code. These static analysis toolscome from a variety of sources. Some are free and open-source. Others are commer-cial products. In the case of the latter, fully functional trial versions were acquired.
The tools produce a total of 116 unique traditional and object-oriented metrics.Appendix E identifies all 116 metrics and gives a very brief description of eachmetric. The appendix also identifies what languages are supported by each tool andwhich tools generate each metric. In some cases, multiple tools generate the samemetric, sometimes with different names which is noted in the table. Appendix Dprovides brief definitions and some examples for many of the metrics collected.
An automated metrics collection framework and some custom metrics collec-tion scripts were developed by the author. The framework was an Ant-based script
60

Attribute Metrics
Complexity
• McCabe’s Cyclomatic Complexity• Halstead Complexity• LOC/method• Weighted Methods per Class (WMC)• Number of Parameters• Depth of Inheritance Tree• #Children (bigger can be bad)• Specialization Index• #Overridden Methods• Nested Block Depth• Cyclic Dependencies• Limited Size Principle• Response for Class
Coupling
• Coupling between Objects• Fan-in, Fan-out (Afferent/Efferent Coupling)• Information Flow• Instability• #Interfaces• Cyclic Dependencies• Direct Cyclic Dependencies• Dependency Inversion Principle• Encapsulation Principle
Cohesion
• Lack of Cohesion of Methods• Weighted Methods per Class• LOC/Method
Table 4.3: Sample Metrics by Attribute 1
61
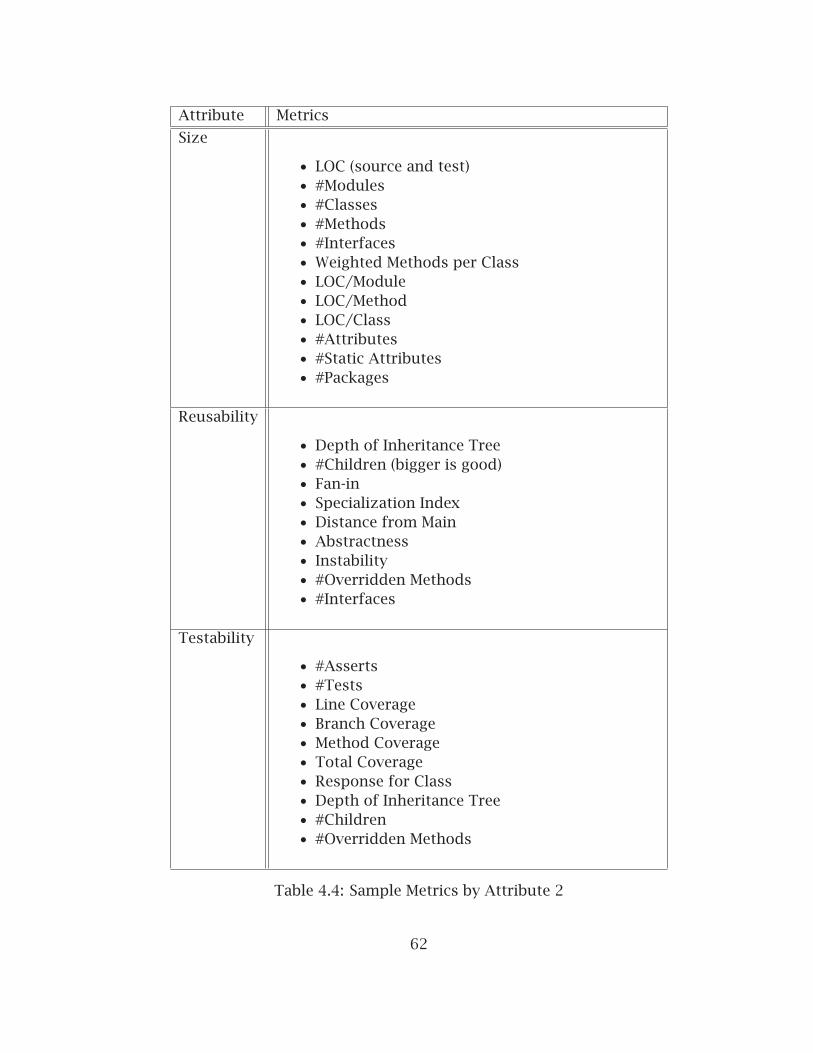
Attribute Metrics
Size
• LOC (source and test)• #Modules• #Classes• #Methods• #Interfaces• Weighted Methods per Class• LOC/Module• LOC/Method• LOC/Class• #Attributes• #Static Attributes• #Packages
Reusability
• Depth of Inheritance Tree• #Children (bigger is good)• Fan-in• Specialization Index• Distance from Main• Abstractness• Instability• #Overridden Methods• #Interfaces
Testability
• #Asserts• #Tests• Line Coverage• Branch Coverage• Method Coverage• Total Coverage• Response for Class• Depth of Inheritance Tree• #Children• #Overridden Methods
Table 4.4: Sample Metrics by Attribute 2
62

coupled with several Java programs that would invoke metrics tools, parse xml out-put files, and consolidate desired metrics in comma separated spreadsheet files byexperiment. Additionally some Java programs were written to count assert test-ing statements in the CS1 and CS2 C++ programs. Unfortunately not all metricscollection was able to be automated. Some metrics tools such as JStyle and Refac-torIT required invocation through a graphical user interface. Collecting metricswith these tools was manually intensive involving many steps for each of the Javaprojects evaluated. Also, not all xml parsing was automated. Although this againinvolved many manual steps of extracting xml data through an editor or parsingit in a spreadsheet with many custom spreadsheet formulas, it was deemed to befaster than writing the code for all metrics desired.
Project metrics were produced from CCCC [57] (C++ and Java), custom scriptsto count asserts (C++), Eclipse Metrics [75] (Java), JStyle [78] (Java), and KrakatauProfessional Metrics (C++) [77]. Class, file, and method metrics were primarily pro-duced using JStyle (Java), Eclipse Metrics (Java), and Krakatau Professional Metrics(C++).
Dynamic Test Coverage Analysis
All software produced was expected to have associated automated unit tests. Codefrom the CS1 and CS2 experiments contained assert() statements embedded in thesource code, but separated in a global run_tests() function. Code from all otherexperiments utilized the JUnit framework so the test code was separate from thesource/production code.
Code coverage tools were employed to determine line, branch, and overall testcoverage. Cobertura [23] and Clover [21] were used to generate test coverage met-rics for all Java projects. Generally all tests should pass. In the rare instances wherea project contained tests that did not pass, the failing test was omitted in order togenerate test coverage metrics. Although defect density turned out to be a difficultmeasure to capture, a detailed analysis did examine this measure in the undergrad-uate software engineering projects.
Code coverage tools also exist for C++ [82], but test coverage metrics were notproduced for the CS1 and CS2 projects. A couple of factors weighed in on thedecision not to collect CS1/CS2 test coverage metrics. First, a not-insignificant per-centage of these projects failed to compile and execute correctly. Second, even whenautomated tests were written, they were generally commented out before final sub-mission for grading purposes. As a result it was unreasonable to manually examineevery CS1/CS2 project to determine what tests were working. Instead a script waswritten to count the number of asserts written in each CS1/CS2 project. Althoughthis is a very suspicious metric, it gives an indication of testing effort and whencombined with the graded score on each project, provides a reasonable measure oftesting.
63

4.2.8 Assessment and Validity
Data collected from the experiments were analyzed statistically. The next two chap-ters will report results of this analysis. Statistical tests such as the Analysis of Vari-ance (ANOVA) and the two-sample t-test were employed to determine if differencesbetween the control and experimental groups are statistically significant.
For privacy reasons, student performance results are only reported in aggregate.In fact, training and approval for the experiments was obtained from the Universityof Kansas Human Subjects Committee - Lawrence Campus (HSCL) prior to conduct-ing the studies.
The experiment design and corresponding results between experiments shouldestablish internal validity of the experiments. As mentioned earlier, care was takento ensure that the control and experimental groups are homogeneous and random.Both groups were presented with the same instructional material to ensure that nobias was introduced.
External validity of the experiments is established through peer reviewed publi-cations, consistent results across seven studies in diverse environments, and throughexternal recognition of the research merits. This research resulted in a peer re-viewed publication in IEEE Computer, and conference publications and presenta-tions at the Technical Symposium of the Special Interest Group on Computer ScienceEducation (SIGCSE’06) in Houston, Texas, and the 19th Conference on Software En-gineering Education and Training (CSEE&T’06) in North Shore, Oahu. External recog-nition includes third place in the ACM Student Research Competition Grand Finals,third place in the OOPSLA ACM Student Research Competition, a SIGCSE SpecialProjects Award, and acceptance to the OOPSLA’05 Doctoral Symposium. The finalresults are being prepared for submission to IEEE Transactions on Software Engi-neering and additional publications are expected.
64

Chapter 5
Experiments in Industry
This chapter summarizes research conducted with professional programmers inFortune 500 companies. Four semi-controlled experiments were conducted. Thefirst three experiments compare three sets of two projects. The first set involved atest-last project with no automated tests followed by a second phase of the sameproject completed with a test-first approach. The second set involved a test-firstproject followed by a test-last project. The third set involved a test-last projectfollowed by a test-first project.
The fourth experiment was conducted in a training course and is significantlysmaller than the other studies. A case study was also conducted with fifteen projectscompleted by a software development group in a single company over a span of fiveyears. Results from the case study are reported in the last section.
The chapter begins with a description of the metrics collected and the corre-sponding analysis performed.
5.1 Metrics Collection and Analysis
For each experiment and the case study, a large number of metrics will be reportedand analyzed. This section describes the metrics collected and their source. Italso describes the statistical analysis conducted. This research focuses on metricsthat pertain to internal design and code quality. These metrics will be categorizedas method-level, class-level, interface-level, and project-level. Test metrics are alsoevaluated due to the key role of automated unit testing in the experiments. Noproductivity or defect data was available for the industry projects. An externaldesign review was conducted on the third controlled experiment. Subjective andevaluative measures from this experiment were collected and are discussed.
For each set of metrics, a one-way analysis of variance (ANOVA) with unbalanceddata and a two-sample two-tailed unequal variance t-test were performed to deter-mine differences between two populations of metrics values. Statistical significanceis determined with p<.05. The mean and standard deviation for the test-first and
65

Metric Expanded Name
NOS Number of StatementsNOE Number of Exceptions thrownV(G) Cyclomatic ComplexityPL Program LengthAHL Actual Halstead LengthVOC ProgramŠs VocabularyVOL Program VolumeLVL Program LevelPD Program DifficultyEFF Development EffortBUG Bugs PredictedMLOC Method Lines of CodeNBD Nested Block DepthPAR Number of Parameters
Table 5.1: Method-level Metrics
test-last groups are reported, and the %difference is calculated as the test-first meanminus the test-last mean divided by the test-last mean ((TF-TL)/TL). When the test-last mean is 0 and the test-first mean is non-zero, a 100% difference is recorded.When both means are zero, a 0% difference is recorded.
5.1.1 Method-Level Metrics
The method-level metrics calculated are expanded in Table 5.1 and defined in Ap-pendix D. The first eleven metrics were produced by JStyle [78] and the remainingthree were produced by Eclipse Metrics [75].
5.1.2 Class-Level Metrics
The class-level metrics calculated are expanded in Table 5.2 and defined in Ap-pendix D. The first twenty-six metrics were produced by JStyle [78]. Eclipse Met-rics [75] was used to generate MLOC, NOF, NORM, NBD, PAR, SIX, and VG. The met-rics TL, CL, BL, SL, and CD were collected by JStyle at the file level but are consideredhere as class metrics as Java files are typically one class per file. Total and averagevalues by class were aggregated by class from the method level metrics NOS, NOE,V(G), PL, AHL, VOC, VOL, LVL, PD, EFF, and BUG.
Although the metrics tools calculate class and Java interface metrics together,the two were separated prior to conducting this analysis. Several of the metrics onlypertain to classes or interfaces, but not both. In addition, leaving the two combinedcould skew some metrics. For instance, when counting the number of instance
66

methods (NIM) or weighted method complexity per class (WMC), interfaces wouldalways have zero values. Including interfaces might unfairly penalize or rewarda project that had an unusually high number of interfaces. The next section willreport the interface only metrics and analysis.
5.1.3 Interface-Level Metrics
As mentioned in the previous section, Java Interfaces were isolated from classes.This section reports metrics only for interfaces. The pertinent interface-level met-rics are expanded in Table 5.3 and defined in Appendix D.
5.1.4 Project-Level Metrics
Project-level metrics include some new metrics that were collected only at the projectlevel as well as some method, class, and interface level metrics that were aggregatedat the project level. A total of one hundred and forty-six project-level metrics werecalculated for each project. Table 5.4 lists the subset of these metrics that will bereported. For many of the metrics maximum, average, and standard deviation val-ues were calculated for visible (public), internal (private), and total (public + private)entities. In most cases only the average total metric values will be reported. The firstsix were generated or calculated by CCCC [57]. The next sixteen were generated byEclipse Metrics [75]. The final three were generated by JStyle [78].
Because the project-level metrics result in a single value per project, a statisti-cal analysis is not meaningful when comparing the project-level metrics from twoprojects. Hence only the case study metrics will be analyzed statistically at thislevel. Project-level metrics from individual experiments will still be reported anddiscussed.
In the project-level metrics, a module is generally the same as a class. Somemetrics tools [57] identified basic data types such as int and double as modules sothese were excluded. Some projects, namely the CS1 and CS2 C++ projects in thenext chapter, included a mix of global functions and class member functions. Insuch projects all global functions were grouped into a single “anonymous” module.
5.1.5 Test Metrics
The degree and quality of testing will be compared between the test-first and test-last projects. Because the tests are automated in the same programming languagesas the source code, coverage and volume metrics can be collected and analyzed.
Test coverage metrics will include both line coverage and branch (or condition)coverage. Test volume will be measured with several metrics. The number of linesof test code (TestLOC) will be compared to the number of lines of source code(SLOC). The two will be divided to give a ratio of test to source lines of code (T/S
67

Metric Expanded Name
DIT Depth of Inheritance TreeNII Number of Interfaces ImplementedNIV Number of Instance VariablesNSV Number of Static VariablesNOV Number of VariablesNIM Number of Instance MethodsNSM Number of Static MethodsNPM Number of Primitive MethodsNNP Number of NonPrimitive MethodsNOM Number of MethodsWMC Weighted Methods ComplexityRFC Response For ClassLCOM_CK Lack of Cohesion of Methods (Chidamber-Kemerer)LCOM_LH Lack of Cohesion of Methods (Li-Henry)LCOM_HS Lack of Cohesion of Methods (Henderson-Sellers)NIC Number of Inner ClassesNIS Number of Inner Static ClassesNLC Number of Local ClassesNAC Number of Anonymous ClassesNOC Number of ChildrenFI Fan-inFO Fan-outPFI Intra-Package Fan-inPFO Intra-Package Fan-outIFI Inter-package Fan-inIFO Inter-package Fan-outMLOC Average Method Lines of CodeNOF Number of FieldsNORM Number of Overridden MethodsNBD Average Nested Block DepthPAR Average Number of ParametersSIX Specialization IndexVG Cyclomatic Complexity (class)V(G) Cyclomatic Complexity (avg of methods in class)TL Total LinesCL Comment LinesBL Blank LinesSL Source LinesCD Comment Density
Table 5.2: Class-level Metrics
68
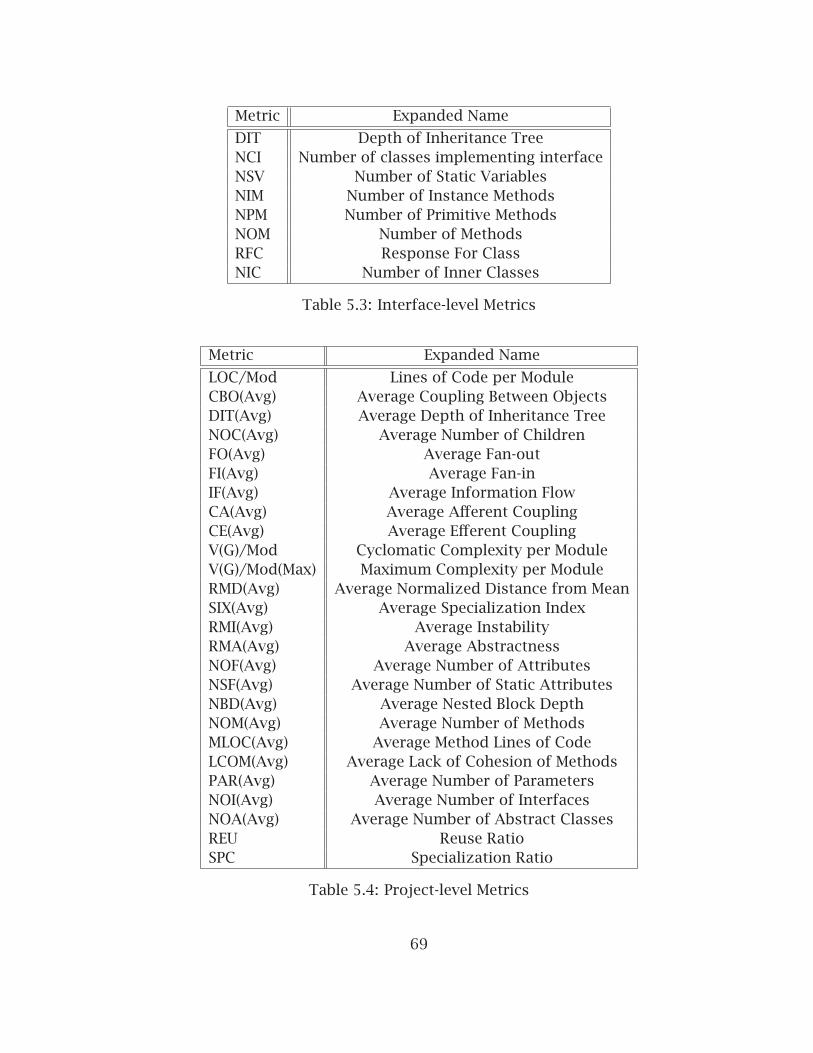
Metric Expanded Name
DIT Depth of Inheritance TreeNCI Number of classes implementing interfaceNSV Number of Static VariablesNIM Number of Instance MethodsNPM Number of Primitive MethodsNOM Number of MethodsRFC Response For ClassNIC Number of Inner Classes
Table 5.3: Interface-level Metrics
Metric Expanded Name
LOC/Mod Lines of Code per ModuleCBO(Avg) Average Coupling Between ObjectsDIT(Avg) Average Depth of Inheritance TreeNOC(Avg) Average Number of ChildrenFO(Avg) Average Fan-outFI(Avg) Average Fan-inIF(Avg) Average Information FlowCA(Avg) Average Afferent CouplingCE(Avg) Average Efferent CouplingV(G)/Mod Cyclomatic Complexity per ModuleV(G)/Mod(Max) Maximum Complexity per ModuleRMD(Avg) Average Normalized Distance from MeanSIX(Avg) Average Specialization IndexRMI(Avg) Average InstabilityRMA(Avg) Average AbstractnessNOF(Avg) Average Number of AttributesNSF(Avg) Average Number of Static AttributesNBD(Avg) Average Nested Block DepthNOM(Avg) Average Number of MethodsMLOC(Avg) Average Method Lines of CodeLCOM(Avg) Average Lack of Cohesion of MethodsPAR(Avg) Average Number of ParametersNOI(Avg) Average Number of InterfacesNOA(Avg) Average Number of Abstract ClassesREU Reuse RatioSPC Specialization Ratio
Table 5.4: Project-level Metrics
69

Ratio). This value can indicate the effort extended in writing the automated tests. Inaddition, the number of assert statements will be measured in aggregate (#Asserts),per lines of source code (#Asserts/LOC), per class (#Asserts/Class), and per method(#Asserts/Method). An assert statement is an individual claim that some conditionis true. A single test might consist of multiple asserts, but must contain at least oneassert. By measuring the volume of asserts and comparing it to test coverage, onecan see the efficiency of the tests. Tests that use many lines of code and asserts yetachieve low test coverage would be inefficient tests. Whereas tests that use fewerlines of code and asserts yet achieve high test coverage would be highly efficienttests.
5.1.6 Subjective and Evaluative Metrics
A formal design review was conducted on one of the controlled experiments. Thereview was completed independently by three reviewers in the same company wherethe experiments were conducted. None of the reviewers worked on any of theprojects under examination. However, all three had expertise and experience withthe languages, technologies, and domain of the projects.
The reviewers were asked to review the two projects of experiment three. Thefirst project was completed with a test-last approach and the second project wascompleted with a test-first approach. The projects are described further in sec-tion 5.4. Each reviewer was given a brief overview of the two projects that includedinstructions on how to obtain the source code for the projects. The reviewers wereasked to not spend more than two hours completing the review of each project.They were given a short survey (see Appendix F) to complete at the end of the re-view. The survey asked the reviewers to rate the projects using a Likert scale infive areas: Understandability, Maintainability, Reusability, Testability, and OverallDesign Quality. The results will be presented and discussed in section 5.4.
Additional subjective and evaluative metrics will be reported and discussed re-garding the experiment in the training class and the overall case study. These met-rics come from three surveys conducted. A pre- and post-experiment survey wereadministered in the training course. The intent of the surveys was twofold. Firstthe surveys were used to ensure that the experiment and control groups were bal-anced with programmers of similar academic and professional experience. Secondthe surveys were used to measure programmer opinions regarding the test-firstand test-last approaches. In addition, a longitudinal survey was administered overthe web after development completed on all of the experiment projects. The in-tent of the longitudinal survey was to measure if programmer opinions persisted orchanged over time.
70

5.2 Formal Industry Experiment #1:No-Tests - Test-First
This section reports results from the first of three controlled experiments. Theexperiment design and context are reviewed, followed by the results of an analysisof the experiment.
5.2.1 Experiment Design and Context
This section describes the experiment design and context of an experiment con-ducted in a large, Fortune 500 corporation. Two phases of the same project weredeveloped by the same group of programmers. The first phase was completed in2001, before any of the developers received formal training on TDD or automatedunit testing. As a result no automated tests were written and the project was de-veloped in a traditional mode with a large up-front design and manual testing afterthe software was implemented. This project will be labeled as test-last (TL). Thesecond phase was implemented in 2005 and 2006 using a test-first approach withautomated unit tests. This project will be labeled as test-first (TF). In between thetwo projects, developers completed a pre-experiment survey and participated in theTDD training described earlier.
The majority of the development effort in this project was completed by a singleprogrammer. This programmer reported having 6 to 10 years of experience andearned an undergraduate degree in a computing discipline. They reported havingextensive and recent previous Java and web experience.
The first phase was named “Part Number Advanced Search” and was completedin 2001 and contained 1,562 lines of source code. The project was a web applicationthat provided an interface to a database for searching for engineering part informa-tion. This project utilized Java Servlets and JavaServer Pages and used a Java beansapproach for centralizing database access.
The second phase was named “Part Number Advanced Search, Part II” and fullyreplaced the first with no reuse from phase 1. Phase 2 was completed in 2006 con-taining 842 lines of source code. This phase refactored the first phase to use theSpring framework for wiring dependent objects together and the Spring web ap-plication model-view-controller framework for managing the application flow. Thesecond phase implemented the data access object (DAO) design pattern for cen-tralizing database access. The second phase added several features such as datasearching and sorting, and it satisfied a number of maintenance requests.
A couple of threats to external validity of this experiment are identified. Thesmall team size causes one to question whether the same results found here shouldbe expected in general. In addition the extended time frame between the two projectphases allows for possible developer maturation that could have affected the re-
71
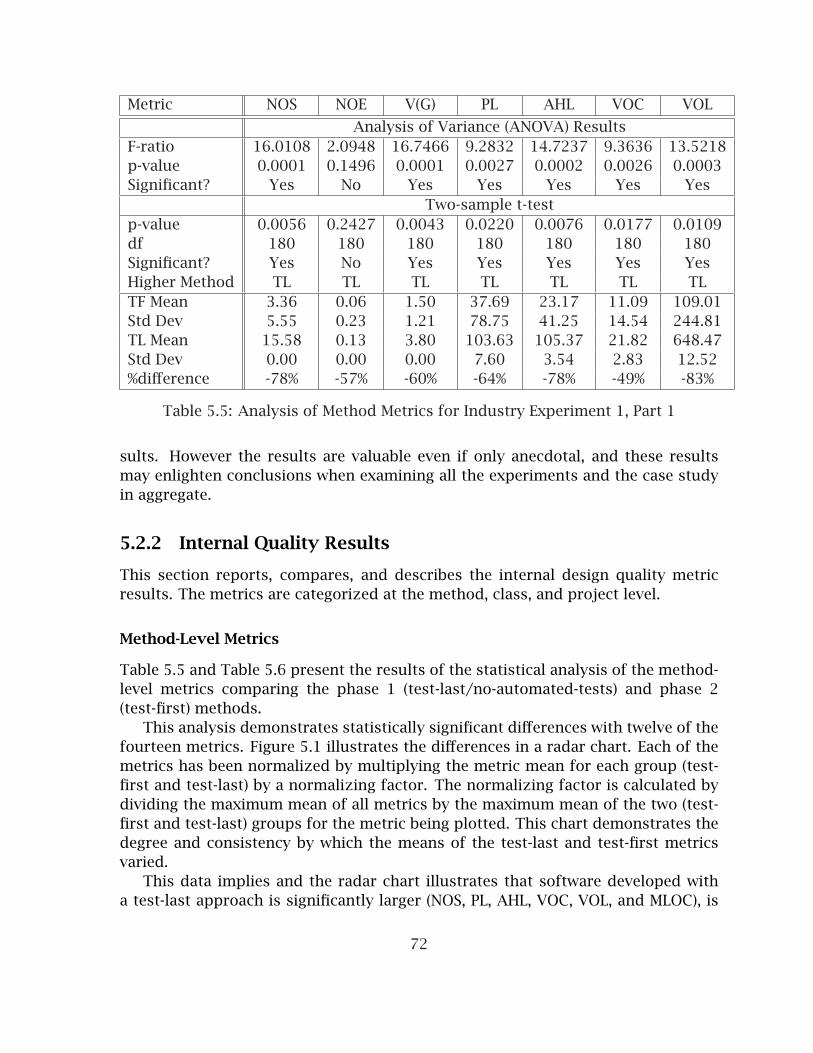
Metric NOS NOE V(G) PL AHL VOC VOL
Analysis of Variance (ANOVA) ResultsF-ratio 16.0108 2.0948 16.7466 9.2832 14.7237 9.3636 13.5218p-value 0.0001 0.1496 0.0001 0.0027 0.0002 0.0026 0.0003Significant? Yes No Yes Yes Yes Yes Yes
Two-sample t-testp-value 0.0056 0.2427 0.0043 0.0220 0.0076 0.0177 0.0109df 180 180 180 180 180 180 180Significant? Yes No Yes Yes Yes Yes YesHigher Method TL TL TL TL TL TL TLTF Mean 3.36 0.06 1.50 37.69 23.17 11.09 109.01Std Dev 5.55 0.23 1.21 78.75 41.25 14.54 244.81TL Mean 15.58 0.13 3.80 103.63 105.37 21.82 648.47Std Dev 0.00 0.00 0.00 7.60 3.54 2.83 12.52%difference -78% -57% -60% -64% -78% -49% -83%
Table 5.5: Analysis of Method Metrics for Industry Experiment 1, Part 1
sults. However the results are valuable even if only anecdotal, and these resultsmay enlighten conclusions when examining all the experiments and the case studyin aggregate.
5.2.2 Internal Quality Results
This section reports, compares, and describes the internal design quality metricresults. The metrics are categorized at the method, class, and project level.
Method-Level Metrics
Table 5.5 and Table 5.6 present the results of the statistical analysis of the method-level metrics comparing the phase 1 (test-last/no-automated-tests) and phase 2(test-first) methods.
This analysis demonstrates statistically significant differences with twelve of thefourteen metrics. Figure 5.1 illustrates the differences in a radar chart. Each of themetrics has been normalized by multiplying the metric mean for each group (test-first and test-last) by a normalizing factor. The normalizing factor is calculated bydividing the maximum mean of all metrics by the maximum mean of the two (test-first and test-last) groups for the metric being plotted. This chart demonstrates thedegree and consistency by which the means of the test-last and test-first metricsvaried.
This data implies and the radar chart illustrates that software developed witha test-last approach is significantly larger (NOS, PL, AHL, VOC, VOL, and MLOC), is
72

Metric LVL PD EFF BUG MLOC NBD PAR
Analysis of Variance (ANOVA) ResultsF-ratio 0.0010 7.0236 10.3928 13.5237 16.6473 8.6491 8.1909p-value 0.9746 0.0088 0.0015 0.0003 0.0001 0.0037 0.0047Significant? No Yes Yes Yes Yes Yes Yes
Two-sample t-testp-value 0.9754 0.0493 0.0270 0.0108 0.0045 0.0155 0.0026df 180 180 180 180 179 179 179Significant? No Yes Yes Yes Yes Yes YesHigher Method TF TL TL TL TL TL TFTF Mean 0.47 4.14 1.07 0.04 4.21 1.32 0.87Std Dev 0.37 3.88 3.18 0.08 7.77 0.74 0.86TL Mean 0.46 7.26 19.36 0.22 20.60 1.77 0.50Std Dev 0.44 1.18 0.04 0.00 0.00 0.00 0.00%difference 0% -43% -94% -83% -80% -25% 73%
Table 5.6: Analysis of Method Metrics for Industry Experiment 1, Part 2
significantly more complex (V(G), PD, NBD), and is less maintainable (PD, EFF, BUG)than software developed with a test-first approach. In contrast, this also impliesthat software developed with a test-first approach has higher coupling (PAR) thansoftware developed with a test-last approach.
Class-Level Metrics
Table 5.7 and Table 5.8 present the results of the statistical analysis of the class-level metrics comparing the phase 1 (test-last/no-automated-tests) and phase 2(test-first) classes. To save space, only the two-sample t-test p-values are reported.Although the ANOVA results strengthen the confidence, the t-test should be suffi-cient here to indicate significant differences between the two samples. The test-lastproject contained five classes and the test-first project contained nine classes.
Like the method-level metrics, a number of large differences exist between thetwo projects. However, unlike the method-level metrics, the differences on only acouple of metrics (NII and NSV) are statistically significant. Still the data indicatesnotable differences. Table 5.9 presents the same data from Table 5.7 and Table 5.8,but in sorted order by %difference with the middle metrics eliminated for space.This view illustrates more clearly that the phase 1 (test-last/no-automated-tests)classes were longer and more complex while the phase 2 (test-first) classes tendedto be more abstract (NII) with higher cohesion (LCOM), higher reuse (SIX, FI), andhigher coupling (PAR). An exception to these generalizations would be the highernested block depth (NBD) in the test-first classes indicating some complexity.
73

Higher TF TF TL TLMetric p-value Sig? Method Mean SDev Mean SDev %diff
DIT 0.1493 No TL 0.89 0.33 2.20 1.64 -60%NII 0.0039 Yes TF 0.67 0.50 0.00 0.00 100%NIV 0.6523 No TL 4.89 8.24 8.20 14.29 -40%NSV 0.0467 Yes TL 0.00 0.00 16.60 13.05 -100%NOV 0.1488 No TL 4.89 8.24 24.80 24.83 -80%NIM 0.8669 No TF 13.44 16.08 11.80 17.53 14%NSM 0.1778 No TL 0.00 0.00 1.20 1.64 -100%NPM 0.8951 No TF 10.11 16.89 8.80 17.48 15%NNP 0.6736 No TF 3.11 3.06 2.60 1.34 20%NOM 0.9636 No TF 13.44 16.08 13.00 17.33 3%WMC 0.5057 No TL 20.22 19.31 46.80 80.58 -57%RFC 0.5613 No TL 23.44 22.93 35.40 39.75 -34%LCOM_CK 0.7372 No TF 184.67 341.05 126.80 275.74 46%LCOM_LH 0.1135 No TF 7.78 7.58 3.00 2.55 159%LCOM_HS 0.7243 No TF 0.42 0.44 0.33 0.46 28%NIC N/A N/A N/A 0.00 0.00 0.00 0.00 0%NIS N/A N/A N/A 0.00 0.00 0.00 0.00 0%NLC 0.3466 No TF 0.22 0.67 0.00 0.00 100%NAC 0.3466 No TF 0.22 0.67 0.00 0.00 100%NOC N/A N/A N/A 0.00 0.00 0.00 0.00 0%FI 0.2198 No TF 1.11 0.93 0.60 0.55 85%FO 0.4913 No TL 7.56 5.22 10.40 7.77 -27%PFI 0.8864 No TL 0.56 0.53 0.60 0.55 -7%PFO 0.9420 No TL 0.56 1.33 0.60 0.89 -7%IFI 0.1786 No TF 0.56 1.13 0.00 0.00 100%IFO 0.4483 No TL 7.00 4.06 9.80 7.05 -29%
Table 5.7: Analysis of Class Metrics for Industry Experiment 1, Part 1
74

Higher TF TF TL TLMetric p-value Sig? Method Mean SDev Mean SDev %diff
MLOC 0.3877 No TL 69.29 69.12 255.40 427.61 -73%NOF 0.7560 No TL 6.29 8.96 8.60 14.03 -27%WMC 0.4801 No TL 28.14 18.99 60.80 93.02 -54%NORM 0.7676 No TL 0.57 1.51 0.80 1.10 -29%NBD 0.4489 No TF 1.58 0.52 1.37 0.40 15%PAR 0.0782 No TF 1.30 0.68 0.65 0.46 98%SIX 0.5119 No TF 0.65 1.73 0.19 0.35 247%VG 0.4493 No TL 2.09 0.76 3.11 2.68 -33%NOS 0.3410 No TL 45.22 44.46 198.60 316.78 -77%NOE 0.5914 No TL 0.78 1.30 1.60 3.05 -51%V(G) 0.4436 No TL 20.22 19.31 50.40 78.68 -60%PL 0.4139 No TL 506.77 676.32 1346.51 2025.77 -62%AHL 0.3507 No TL 311.56 348.85 1332.40 2154.84 -77%VOC 0.4603 No TL 149.11 149.71 301.20 407.41 -50%VOL 0.3329 No TL 1465.64 1967.40 8031.76 13305.30 -82%LVL 0.8761 No TL 6.27 10.08 7.06 8.12 -11%PD 0.5438 No TL 55.64 49.65 100.02 146.69 -44%EFF 0.2904 No TL 14.43 21.13 233.40 402.14 -94%BUG 0.3329 No TL 0.49 0.66 2.68 4.44 -82%NOSAvg 0.3030 No TL 4.31 2.87 10.19 11.05 -58%NOEAvg 0.9882 No TL 0.23 0.35 0.24 0.52 -2%V(G)Avg 0.3792 No TL 1.65 0.67 2.46 1.79 -33%PLAvg 0.5716 No TL 51.33 42.82 73.21 74.84 -30%AHLAvg 0.3692 No TL 32.68 23.15 67.92 76.93 -52%VOCAvg 0.7032 No TL 14.69 8.59 17.04 11.51 -14%VOLAvg 0.3346 No TL 152.28 128.88 413.27 528.20 -63%LVLAvg 0.2278 No TL 0.33 0.19 0.43 0.11 -23%PDAvg 0.9973 No TL 5.02 2.09 5.03 3.30 0%EFFAvg 0.2431 No TL 1.42 1.47 11.98 17.26 -88%BUGAvg 0.3346 No TL 0.05 0.04 0.14 0.18 -63%MLOCAvg 0.8377 No TL 6.36 5.29 7.49 11.08 -15%NBDAvg 0.1827 No TF 1.72 0.69 1.31 0.39 31%PARAvg 0.0635 No TF 1.24 0.57 0.61 0.51 102%TL 0.3415 No TL 196.29 116.96 517.60 662.62 -62%CL 0.1416 No TL 54.43 33.40 145.60 111.08 -63%BL 0.4732 No TL 21.57 16.71 39.80 50.30 -46%SL 0.4029 No TL 120.29 87.43 335.00 510.81 -64%CD 0.2407 No TL 0.30 0.16 0.44 0.20 -31%
Table 5.8: Analysis of Class Metrics for Industry Experiment 1, Part 2
75
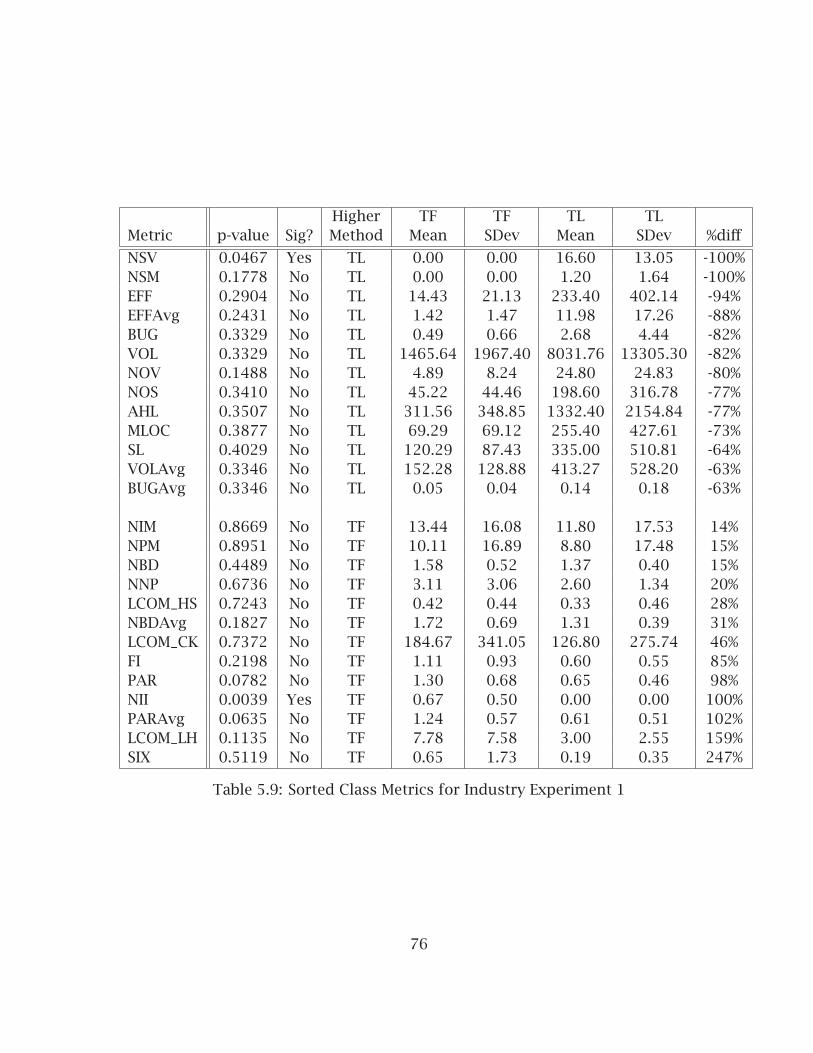
Higher TF TF TL TLMetric p-value Sig? Method Mean SDev Mean SDev %diff
NSV 0.0467 Yes TL 0.00 0.00 16.60 13.05 -100%NSM 0.1778 No TL 0.00 0.00 1.20 1.64 -100%EFF 0.2904 No TL 14.43 21.13 233.40 402.14 -94%EFFAvg 0.2431 No TL 1.42 1.47 11.98 17.26 -88%BUG 0.3329 No TL 0.49 0.66 2.68 4.44 -82%VOL 0.3329 No TL 1465.64 1967.40 8031.76 13305.30 -82%NOV 0.1488 No TL 4.89 8.24 24.80 24.83 -80%NOS 0.3410 No TL 45.22 44.46 198.60 316.78 -77%AHL 0.3507 No TL 311.56 348.85 1332.40 2154.84 -77%MLOC 0.3877 No TL 69.29 69.12 255.40 427.61 -73%SL 0.4029 No TL 120.29 87.43 335.00 510.81 -64%VOLAvg 0.3346 No TL 152.28 128.88 413.27 528.20 -63%BUGAvg 0.3346 No TL 0.05 0.04 0.14 0.18 -63%
NIM 0.8669 No TF 13.44 16.08 11.80 17.53 14%NPM 0.8951 No TF 10.11 16.89 8.80 17.48 15%NBD 0.4489 No TF 1.58 0.52 1.37 0.40 15%NNP 0.6736 No TF 3.11 3.06 2.60 1.34 20%LCOM_HS 0.7243 No TF 0.42 0.44 0.33 0.46 28%NBDAvg 0.1827 No TF 1.72 0.69 1.31 0.39 31%LCOM_CK 0.7372 No TF 184.67 341.05 126.80 275.74 46%FI 0.2198 No TF 1.11 0.93 0.60 0.55 85%PAR 0.0782 No TF 1.30 0.68 0.65 0.46 98%NII 0.0039 Yes TF 0.67 0.50 0.00 0.00 100%PARAvg 0.0635 No TF 1.24 0.57 0.61 0.51 102%LCOM_LH 0.1135 No TF 7.78 7.58 3.00 2.55 159%SIX 0.5119 No TF 0.65 1.73 0.19 0.35 247%
Table 5.9: Sorted Class Metrics for Industry Experiment 1
76
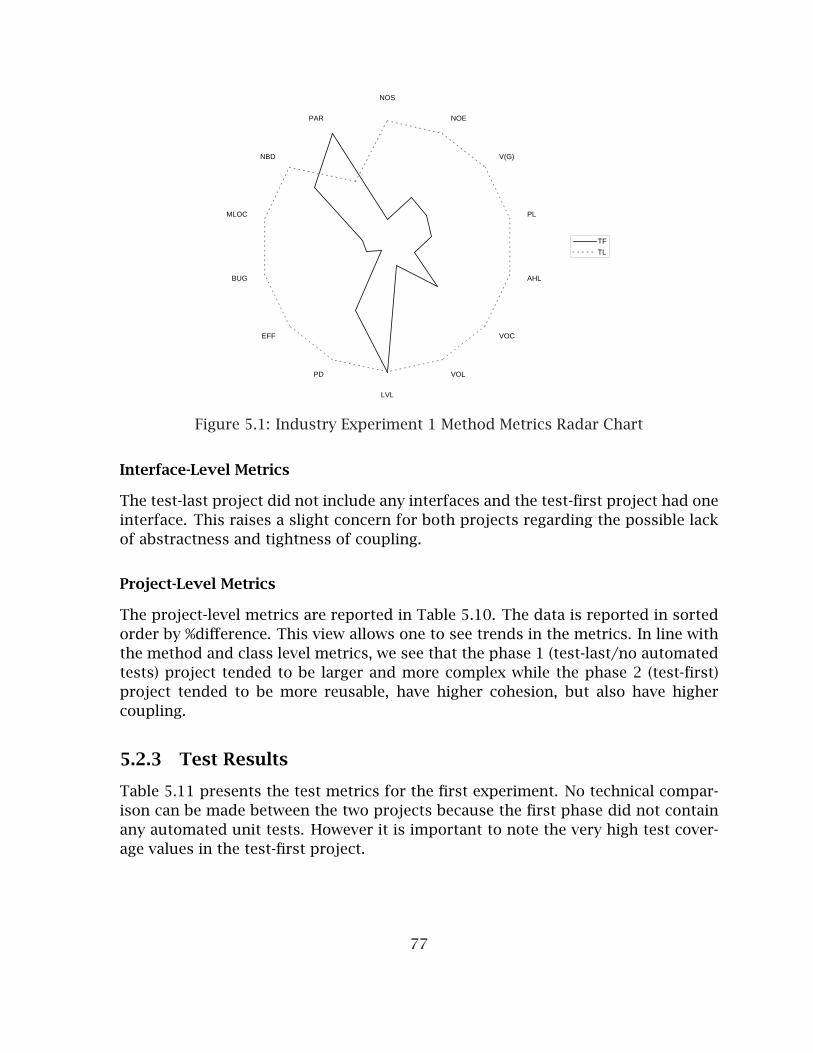
NOS
NOE
V(G)
PL
AHL
VOC
VOL
LVL
PD
EFF
BUG
MLOC
NBD
PAR
TF
TL
Figure 5.1: Industry Experiment 1 Method Metrics Radar Chart
Interface-Level Metrics
The test-last project did not include any interfaces and the test-first project had oneinterface. This raises a slight concern for both projects regarding the possible lackof abstractness and tightness of coupling.
Project-Level Metrics
The project-level metrics are reported in Table 5.10. The data is reported in sortedorder by %difference. This view allows one to see trends in the metrics. In line withthe method and class level metrics, we see that the phase 1 (test-last/no automatedtests) project tended to be larger and more complex while the phase 2 (test-first)project tended to be more reusable, have higher cohesion, but also have highercoupling.
5.2.3 Test Results
Table 5.11 presents the test metrics for the first experiment. No technical compar-ison can be made between the two projects because the first phase did not containany automated unit tests. However it is important to note the very high test cover-age values in the test-first project.
77

Metric TF Value TL Value Higher Method %diff
NSFavg 0.00 20.00 TL -100%MLOCavg 4.08 20.22 TL -80%VGmax 9.00 44.00 TL -80%LOC/module 25.52 78.10 TL -67%VGavg 1.66 4.62 TL -64%RMIavg 0.47 1.00 TL -53%NOFavg 6.29 10.25 TL -39%NBDavg 1.32 1.75 TL -25%DITavg 0.14 0.17 TL -14%NOAavg 0.00 0.00 N/A 0%REU 0.00 0.00 N/A 0%SPC 0.00 0.00 N/A 0%FIavg 1.54 1.33 TF 15%CBOavg 2.71 2.33 TF 16%FOavg 1.18 1.00 TF 18%NOMavg 17.00 13.50 TF 26%CEavg 4.00 3.00 TF 33%LCOMavg 0.39 0.27 TF 44%NOCavg 0.18 0.11 TF 61%PARavg 0.87 0.48 TF 79%RMAavg 0.17 0.00 TF 100%RMDavg 0.36 0.00 TF 100%NOIavg 0.50 0.00 TF 100%CAavg 6.00 0.00 TF 100%SIXavg 0.65 0.24 TF 178%IFavg 4.86 0.22 TF 2086%
Table 5.10: Analysis of Project Metrics for Industry Experiment 1
Metric TF TL
T/S Ratio 1.33 N/A#Asserts/LOC 0.24 N/A#Asserts/Class 9.46 N/A#Asserts/Method 2.60 N/ALine Coverage 98% N/ACond Coverage 100% N/A
Table 5.11: Test Metrics for Industry Experiment 1
78

5.3 Formal Industry Experiment #2:Test-Last - Test-First
This section reports results from the second of three controlled experiments. Theexperiment design and context are reviewed, followed by the results of an analysisof the experiment.
5.3.1 Experiment Design and Context
This section describes the experiment design and context of an experiment con-ducted in a large, Fortune 500 corporation. Two different projects were developedby overlapping teams of developers. The first project was completed in 2003. Thedevelopers employed a test-last approach including automated unit-tests writtenin JUnit. The project was developed in a traditional mode with a large up-frontdesign and automated and manual testing after the software was implemented.This project will be labeled as test-last (TL). The second project is the same sec-ond project compared in the previous experiment. This project was implemented in2005 and 2006 using a test-first approach with automated unit tests. This projectwill be labeled as test-first (TF). In between the two projects, developers completeda pre-experiment survey and participated in the TDD training described earlier.
The majority of the development effort in the first test-last project was com-pleted by two programmers. Both programmers reported having 6 to 10 years ofexperience and earned an undergraduate or graduate degree in a computing disci-pline. They reported having extensive and recent previous Java and web experience.The second test-first project staff was described in the previous section and was ledby one of the lead developers on the first test-last project.
The first project was named “Workflow” and was completed in 2003. It contained811 lines of source code. The project was a utility project that used XML for storinga workflow (paths and steps). Jakarta Common Digester was used for processingthe XML.
The second project was named “Part Number Advanced Search, Part II” and wascompleted in 2006 containing 842 lines of source code. This phase refactored anearlier phase to use the Spring framework for wiring dependent objects togetherand the Spring web application model-view-controller framework for managing theapplication flow. This second phase implemented the data access object (DAO) de-sign pattern for centralizing database access. This second phase added several fea-tures such as data searching and sorting, and it satisfied a number of maintenancerequests.
79

Metric NOS NOE V(G) PL AHL VOC VOL
Analysis of Variance (ANOVA) ResultsF-ratio 0.0001 8.0412 0.0720 3.4710 0.9483 4.5632 0.8070p-value 0.9933 0.0049 0.7886 0.0636 0.3311 0.0336 0.3699Significant? No Yes No No No Yes No
Two-sample t-testp-value 0.9932 0.0076 0.7843 0.0690 0.3295 0.0364 0.3689df 252 252 252 252 252 252Significant? No Yes No No No Yes NoHigher Method TL TF TF TF TF TF TFTF Mean 3.36 0.06 1.50 37.69 23.17 11.09 109.01Std Dev 5.55 0.23 1.21 78.75 41.25 14.54 244.81TL Mean 3.37 0.00 1.45 22.39 17.90 7.73 80.64Std Dev 8.37 0.00 2.04 49.83 44.57 10.31 256.45%difference 0% 0% 4% 68% 29% 44% 35%
Table 5.12: Analysis of Method Metrics for Industry Experiment 2, Part 1
5.3.2 Internal Quality Results
This section reports, compares, and describes the internal design quality metricresults. The metrics are categorized at the method, class, and project level.
For each set of metrics, a one-way analysis of variance (ANOVA) with unbalanceddata and a two-sample two-tailed unequal variance t-test were performed to deter-mine differences between two populations of metrics values. Statistical significanceis determined with p<.05. The mean and standard deviation for the test-first andtest-last groups are reported, and the %difference is calculated as the test-first meanminus the test-last mean divided by the test-last mean ((TF-TL)/TL).
Method-Level Metrics
Table 5.12 and Table 5.13 present the results of the statistical analysis of themethod-level metrics comparing the test-last and test-first methods. The method-level metrics calculated are expanded in Table 5.1 and defined in Appendix D. Thefirst eleven metrics were produced by JStyle [78] and the remaining three were pro-duced by Eclipse Metrics [75].
This analysis demonstrates statistically significant differences with four of thefourteen metrics. Figure 5.2 illustrates the differences in a radar chart. Each of themetrics has been normalized by multiplying the metric mean for each group (test-first and test-last) by a normalizing factor. The normalizing factor is calculated bydividing the maximum mean of all metrics by the maximum mean of the two (test-first and test-last) groups for the metric being plotted. This chart demonstrates the
80

Metric LVL PD EFF BUG MLOC NBD PAR
Analysis of Variance (ANOVA) ResultsF-ratio 1.2625 7.4288 0.0220 0.8053 0.4407 0.5084 24.8605p-value 0.2623 0.0069 0.8822 0.3704 0.5074 0.4765 0.0000Significant? No Yes No No No No Yes
Two-sample t-testp-value 0.2623 0.0070 0.8797 0.3694 0.5071 0.4757 0.0000df 252 252 252 252 241 241 241Significant? No Yes No No No No YesHigher Method TF TF TF TF TF TF TFTF Mean 0.47 4.14 1.07 0.04 4.21 1.32 0.87Std Dev 0.37 3.88 3.18 0.08 7.77 0.74 0.86TL Mean 0.41 2.83 0.99 0.03 3.52 1.24 0.42Std Dev 0.37 3.76 5.47 0.09 8.42 0.96 0.50%difference 13% 46% 9% 35% 20% 6% 107%
Table 5.13: Analysis of Method Metrics for Industry Experiment 2, Part 2
degree and consistency by which the means of the test-last and test-first metricsvaried.
This data implies and the radar chart illustrates relatively few significant dif-ferences between methods developed with a test-last approach and methods devel-oped with a test-first approach. Notice that unlike the previous experiment, test-lastmethods tend to have (insignificantly) lower mean metric values than the test-firstmethods. The data indicates that software developed with a test-first approach issignificantly larger in only two of the size and complexity measures (VOC and PD),has significantly more exceptions (NOE), and again has higher coupling (PAR) thansoftware developed with a test-last approach.
Class-Level Metrics
Table 5.14 and Table 5.15 present the results of the statistical analysis of the class-level metrics comparing the test-last and test-first classes. To save space, only thetwo-sample t-test p-values are reported. Although the ANOVA results strengthenthe confidence, the t-test should be sufficient here to indicate significant differencesbetween the two samples. The test-last project contained eleven classes and thetest-first project contained nine classes.
Table 5.16 presents the same data from Table 5.14 and Table 5.15, but in sortedorder by %difference with the middle metrics eliminated for space. This view illus-trates some slight trends but also some contradictions. It appears that the Workflow(test-last) project has a bit more reuse (DIT, NOC) but also perhaps more coupling.The phase 2 (test-first) project may be a bit longer and more complex (MLOC, VOC,
81

NOS
NOE
V(G)
PL
AHL
VOC
VOL
LVL
PD
EFF
BUG
MLOC
NBD
PAR
TF
TL
Figure 5.2: Industry Experiment 2 Method Metrics Radar Chart
VOL), but also may be more abstract and have higher internal reuse (NII, SIX, NORM).Again the test-first project has a higher number of parameters, but the fan-in andfan-out metrics cause one to question which project has the higher coupling. Finally,the three calculations of LCOM present inconsistencies regarding cohesion.
Interface-Level Metrics
As mentioned in the first section, Java Interfaces were isolated from classes. Thissection reports metrics only for interfaces. The pertinent interface-level metrics areexpanded in Table 5.3 and defined in Appendix D.
The test-first project did not include any interfaces. The test-last project didinclude two interfaces. This raises a slight concern for both projects regardingthe possible lack of abstractness and tightness of coupling. Table 5.17 presentsthe results of the statistical analysis of the interface-level metrics for the test-lastproject.
Project-Level Metrics
The project-level metrics are reported in Table 5.18. The data is reported in sortedorder by %difference. This view allows one to see trends in the metrics. Similar tothe method and class level metrics, few clear trends seem to exist in the differencesbetween the two projects of experiment two. The Workflow (test-last) project seemsto have higher coupling (CBO, IF) and perhaps better reuse (REU, SPC, NOI, DIT)although neither of these trends are completely clear (PAR, SIX).
82

Higher TF TF TL TLMetric p-value Sig? Method Mean SDev Mean SDev %diff
DIT 0.1647 No TL 0.89 0.33 1.27 0.79 -30%NII 0.0891 No TF 0.67 0.50 0.27 0.47 144%NIV 0.5704 No TF 4.89 8.24 3.18 3.19 54%NSV 0.1337 No TL 0.00 0.00 0.82 1.66 -100%NOV 0.7645 No TF 4.89 8.24 4.00 2.93 22%NIM 0.7005 No TF 13.44 16.08 11.00 10.46 22%NSM 0.3409 No TL 0.00 0.00 0.09 0.30 -100%NPM 0.2723 No TF 10.11 16.89 3.36 4.01 201%NNP 0.3332 No TF 3.11 3.06 1.73 3.13 80%NOM 0.7109 No TF 13.44 16.08 11.09 10.44 21%WMC 0.7381 No TF 20.22 19.31 17.36 17.93 16%RFC 0.8519 No TF 23.44 22.93 21.64 18.84 8%LCOM_CK 0.3111 No TF 184.67 341.05 59.18 89.64 212%LCOM_LH 0.3860 No TF 7.78 7.58 5.18 4.67 50%LCOM_HS 0.7753 No TL 0.42 0.44 0.48 0.46 -12%NIC N/A N/A N/A 0.00 0.00 0.00 0.00 0%NIS N/A N/A N/A 0.00 0.00 0.00 0.00 0%NLC 0.3466 No TF 0.22 0.67 0.00 0.00 100%NAC 0.3466 No TF 0.22 0.67 0.00 0.00 100%NOC 0.0816 No TL 0.00 0.00 0.55 0.93 -100%FI 0.0182 Yes TL 1.11 0.93 2.45 1.37 -55%FO 0.6199 No TL 7.56 5.22 8.73 5.08 -13%PFI 0.0009 Yes TL 0.56 0.53 2.45 1.37 -77%PFO 0.0189 Yes TL 0.56 1.33 2.91 2.59 -81%IFI 0.1786 No TF 0.56 1.13 0.00 0.00 100%IFO 0.4967 No TF 7.00 4.06 5.82 3.40 20%
Table 5.14: Analysis of Class Metrics for Industry Experiment 2, Part 1
83

Higher TF TF TL TLMetric p-value Sig? Method Mean SDev Mean SDev %diff
MLOC 0.3230 No TF 69.29 69.12 39.00 41.08 78%NOF 0.4072 No TF 6.29 8.96 3.18 3.19 98%WMC 0.3678 No TF 28.14 18.99 19.45 19.72 45%NORM 0.5277 No TF 0.57 1.51 0.18 0.40 214%NBD 0.1151 No TF 1.58 0.52 1.20 0.24 31%PAR 0.0178 Yes TF 1.30 0.68 0.47 0.21 175%SIX 0.4624 No TF 0.65 1.73 0.14 0.32 379%VG 0.2289 No TF 2.09 0.76 1.67 0.52 25%NOS 0.8090 No TF 45.22 44.46 40.45 41.61 12%NOE 0.1108 No TF 0.78 1.30 0.00 0.00 100%V(G) 0.7381 No TF 20.22 19.31 17.36 17.93 16%PL 0.3467 No TF 506.77 676.32 268.66 287.70 89%AHL 0.4828 No TF 311.56 348.85 213.91 229.10 46%VOC 0.3376 No TF 149.11 149.71 91.82 95.08 62%VOL 0.5096 No TF 1465.64 1967.40 967.71 1081.37 51%LVL 0.7273 No TF 6.27 10.08 4.97 4.51 26%PD 0.2907 No TF 55.64 49.65 33.95 35.85 64%EFF 0.7798 No TF 14.43 21.13 11.86 18.68 22%BUG 0.5100 No TF 0.49 0.66 0.32 0.36 51%NOSAvg 0.4082 No TF 4.31 2.87 3.36 1.85 28%NOEAvg 0.0806 No TF 0.23 0.35 0.00 0.00 100%V(G)Avg 0.5113 No TF 1.65 0.67 1.47 0.45 12%PLAvg 0.0863 No TF 51.33 42.82 22.88 13.32 124%AHLAvg 0.0959 No TF 32.68 23.15 17.54 9.81 86%VOCAvg 0.0524 No TF 14.69 8.59 8.03 3.23 83%VOLAvg 0.1359 No TF 152.28 128.88 77.70 56.10 96%LVLAvg 0.1210 No TL 0.33 0.19 0.45 0.12 -26%PDAvg 0.0157 Yes TF 5.02 2.09 2.86 0.96 76%EFFAvg 0.2837 No TF 1.42 1.47 0.80 0.83 77%BUGAvg 0.1360 No TF 0.05 0.04 0.03 0.02 96%MLOCAvg 0.7134 No TF 6.36 5.29 5.40 6.16 18%NBDAvg 0.7279 No TF 1.72 0.69 1.59 1.03 9%PARAvg 0.0060 Yes TF 1.24 0.57 0.54 0.25 129%TL 0.7841 No TF 196.29 116.96 179.09 142.42 10%CL 0.1836 No TL 54.43 33.40 88.64 69.85 -39%BL 0.4728 No TL 21.57 16.71 27.55 16.70 -22%SL 0.2249 No TF 120.29 87.43 70.91 63.41 70%CD 0.0141 Yes TL 0.30 0.16 0.50 0.04 -40%
Table 5.15: Analysis of Class Metrics for Industry Experiment 2, Part 2
84

Higher TF TF TL TLMetric p-value Sig? Method Mean SDev Mean SDev %diff
NSV 0.1337 No TL 0.00 0.00 0.82 1.66 -100%NSM 0.3409 No TL 0.00 0.00 0.09 0.30 -100%NOC 0.0816 No TL 0.00 0.00 0.55 0.93 -100%PFO 0.0189 Yes TL 0.56 1.33 2.91 2.59 -81%PFI 0.0009 Yes TL 0.56 0.53 2.45 1.37 -77%FI 0.0182 Yes TL 1.11 0.93 2.45 1.37 -55%CD 0.0141 Yes TL 0.30 0.16 0.50 0.04 -40%CL 0.1836 No TL 54.43 33.40 88.64 69.85 -39%DIT 0.1647 No TL 0.89 0.33 1.27 0.79 -30%LVLAvg 0.1210 No TL 0.33 0.19 0.45 0.12 -26%BL 0.4728 No TL 21.57 16.71 27.55 16.70 -22%FO 0.6199 No TL 7.56 5.22 8.73 5.08 -13%LCOM_HS 0.7753 No TL 0.42 0.44 0.48 0.46 -12%
LCOM_LH 0.3860 No TF 7.78 7.58 5.18 4.67 50%BUG 0.5100 No TF 0.49 0.66 0.32 0.36 51%VOL 0.5096 No TF 1465.64 1967.40 967.71 1081.37 51%NIV 0.5704 No TF 4.89 8.24 3.18 3.19 54%VOC 0.3376 No TF 149.11 149.71 91.82 95.08 62%PD 0.2907 No TF 55.64 49.65 33.95 35.85 64%SL 0.2249 No TF 120.29 87.43 70.91 63.41 70%PDAvg 0.0157 Yes TF 5.02 2.09 2.86 0.96 76%EFFAvg 0.2837 No TF 1.42 1.47 0.80 0.83 77%MLOC 0.3230 No TF 69.29 69.12 39.00 41.08 78%NNP 0.3332 No TF 3.11 3.06 1.73 3.13 80%VOCAvg 0.0524 No TF 14.69 8.59 8.03 3.23 83%AHLAvg 0.0959 No TF 32.68 23.15 17.54 9.81 86%PL 0.3467 No TF 506.77 676.32 268.66 287.70 89%BUGAvg 0.1360 No TF 0.05 0.04 0.03 0.02 96%VOLAvg 0.1359 No TF 152.28 128.88 77.70 56.10 96%NOF 0.4072 No TF 6.29 8.96 3.18 3.19 98%PLAvg 0.0863 No TF 51.33 42.82 22.88 13.32 124%PARAvg 0.0060 Yes TF 1.24 0.57 0.54 0.25 129%NII 0.0891 No TF 0.67 0.50 0.27 0.47 144%PAR 0.0178 Yes TF 1.30 0.68 0.47 0.21 175%NPM 0.2723 No TF 10.11 16.89 3.36 4.01 201%LCOM_CK 0.3111 No TF 184.67 341.05 59.18 89.64 212%NORM 0.5277 No TF 0.57 1.51 0.18 0.40 214%SIX 0.4624 No TF 0.65 1.73 0.14 0.32 379%
Table 5.16: Sorted Class Metrics for Industry Experiment 2
85

TL TLMetric Mean SDev
DIT 0.50 0.71NCI 4.00 2.83NSV 0.00 0.00NIM 5.00 5.66NPM 5.00 5.66NOM 5.00 5.66RFC 5.00 5.66NIC 0.00 0.00
Table 5.17: Analysis of Interface Metrics for Experiment 2
Metric TF Value TL Value Higher Method %diff
NSFavg 0.00 0.82 TL -100%NOAavg 0.00 2.00 TL -100%REU 0.00 0.27 TL -100%SPC 0.00 2.33 TL -100%IFavg 4.86 48.14 TL -90%NOIavg 0.50 2.00 TL -75%DITavg 0.14 0.43 TL -67%VGmax 9.00 21.00 TL -57%CEavg 4.00 9.00 TL -56%NOCavg 0.18 0.33 TL -46%RMAavg 0.17 0.31 TL -46%CAavg 6.00 11.00 TL -45%FOavg 1.18 1.95 TL -40%CBOavg 2.71 4.43 TL -39%FIavg 1.54 2.48 TL -38%LOC/Mod 25.52 36.86 TL -31%LCOMavg 0.39 0.47 TL -18%VGavg 1.66 1.75 TL -6%RMIavg 0.47 0.45 TF 5%NBDavg 1.32 1.24 TF 7%MLOCavg 4.08 3.52 TF 16%RMDavg 0.36 0.24 TF 49%NOMavg 17.00 11.00 TF 55%NOFavg 6.29 3.18 TF 98%PARavg 0.87 0.42 TF 107%SIXavg 0.65 0.14 TF 380%
Table 5.18: Analysis of Project Metrics for Industry Experiment 2
86

Metric TL TF Higher Method %diff
T/S Ratio 1.33 0.87 TF 52%#Asserts/LOC 0.24 0.16 TF 45%#Asserts/Class 9.46 5.04 TF 88%#Asserts/Method 2.60 1.45 TF 79%Line Coverage 98% 31% TF 216%Cond Coverage 100% 24% TF 317%
Table 5.19: Test Metrics for Industry Experiment 2
5.3.3 Test Results
Table 5.19 presents the testing metrics for the second experiment. The test-firstproject has significantly more testing including 216% and 317% higher test coverage(line and condition coverage respectively). This data perhaps highlights the empha-sis that the test-first approach places on writing automated tests.
5.4 Formal Industry Experiment #3:Test-First - Test-Last
This section reports results from the second of three controlled experiments. Theexperiment design and context are reviewed, followed by the results of an analysisof the experiment.
5.4.1 Experiment Design and Context
This section describes the experiment design and context of a third experiment con-ducted in a large, Fortune 500 corporation. In contrast to the previous two experi-ments, in this experiment the first project was developed with a test-first approachand the second project was developed with a test-last approach. Both projects in-volved aggressive automated unit testing. The two different projects were devel-oped by overlapping teams of developers. The first project was completed in 2005.The developers employed a test-first approach including automated unit-tests writ-ten in JUnit. This project will be labeled as test-first (TF). The second project wasimplemented in 2005 and 2006 using a test-last approach with automated unit tests.This project will be labeled as test-last (TL). The project was developed in a tradi-tional mode with an up-front design and automated testing after the software wasimplemented. Automated tests were written shortly after code in an iterative test-last fashion. In between the two projects, developers completed a pre-experimentsurvey and participated in the TDD training described earlier.
87

The majority of the development effort in the first test-first project was com-pleted by three programmers. Two of the three programmers reported having 6 to10 years of experience and earned an undergraduate or graduate degree in a com-puting discipline. They reported having extensive and recent previous Java and webexperience. The second test-last project staff consisted primarily of two of the leaddevelopers from the first test-first project.
The first project was named “Inventory Scanners” and was completed in 2005and contained 1559 lines of source code. The project was a web application that wasrun via a web browser in a hand-held bar-code scanner running Windows for PocketPC. This project was created to improve inventory tracking and reduce data entryerrors. The scanners allow attendants to check-in, check-out, stow, and move partsby selecting the desired function from the web interface menu and then scanningthe data from the part barcode or other source. This project utilized Java Servletsand JavaServer Pages, the Struts model-view-controller architecture, and the Springframework for wiring dependent objects together. This project implemented thedata access object (DAO) design pattern for centralizing database access.
The second project was named “Conformity Request Tracking” and was com-pleted in 2006 containing 2071 lines of source code. This project also was a webapplication that was created to improve tracking of conformity requests needed forexternal certification on new development projects. This project also used Strutsand Spring like the first project. In addition it used Hibernate and the data accessobject (DAO) design pattern for centralizing database access.
5.4.2 Internal Quality Results
This section reports, compares, and describes the internal design quality metricresults. The metrics are categorized at the method, class, and project level.
For each set of metrics, a one-way analysis of variance (ANOVA) with unbalanceddata and a two-sample two-tailed unequal variance t-test were performed to deter-mine differences between two populations of metrics values. Statistical significanceis determined with p<.05. The mean and standard deviation for the test-first andtest-last groups are reported, and the %difference is calculated as the test-first meanminus the test-last mean divided by the test-last mean ((TF-TL)/TL).
Method-Level Metrics
Table 5.20 and Table 5.21 present the results of the statistical analysis of themethod-level metrics comparing the test-last and test-first methods. The method-level metrics calculated are expanded in Table 5.1 and defined in Appendix D. Thefirst eleven metrics were produced by JStyle [78] and the remaining three were pro-duced by Eclipse Metrics [75].
88

Metric NOS NOE V(G) PL AHL VOC VOL
Analysis of Variance (ANOVA) ResultsF-ratio 51.003 322.360 16.766 49.008 30.528 59.437 26.754p-value 0.000 0.000 0.000 0.000 0.000 0.000 0.000Significant? Yes Yes Yes Yes Yes Yes Yes
Two-sample t-testp-value 0.0000 0.0000 0.0041 0.0000 0.0000 0.0000 0.0001df 562 562 562 562 562 562 562Significant? Yes Yes Yes Yes Yes Yes YesHigher Method TF TF TF TF TF TF TFTF Mean 5.21 0.61 1.28 51.26 31.52 14.06 155.91Std Dev 7.90 0.55 1.04 78.75 51.70 15.26 306.54TL Mean 1.71 0.04 1.03 15.30 11.70 6.28 47.80Std Dev 3.69 0.20 0.41 41.68 31.32 8.33 179.11%difference 205% 1550% 24% 235% 169% 124% 226%
Table 5.20: Analysis of Method Metrics for Industry Experiment 3, Part 1
Metric LVL PD EFF BUG MLOC NBD PAR
Analysis of Variance (ANOVA) ResultsF-ratio 87.734 16.454 10.022 26.773 38.423 40.466 40.527p-value 0.000 0.000 0.002 0.000 0.000 0.000 0.000Significant? Yes Yes Yes Yes Yes Yes Yes
Two-sample t-testp-value 0.0000 0.0007 0.0071 0.0001 0.0000 0.0000 0.0000df 562 562 562 562 561 561 561Significant? Yes Yes Yes Yes Yes Yes YesHigher Method TL TF TF TF TF TF TFTF Mean 0.23 3.78 1.40 0.05 5.34 1.33 1.32Std Dev 0.25 3.68 4.01 0.10 7.41 0.50 1.32TL Mean 0.54 2.66 0.44 0.02 2.21 1.08 0.69Std Dev 0.38 2.55 2.82 0.06 4.29 0.39 0.95%difference -57% 42% 214% 226% 141% 24% 93%
Table 5.21: Analysis of Method Metrics for Industry Experiment 3, Part 2
89

NOS
NOE
V(G)
PL
AHL
VOC
VOL
LVL
PD
EFF
BUG
MLOC
NBD
PAR
TF
TL
Figure 5.3: Industry Experiment 3 Method Metrics Radar Chart
This analysis demonstrates statistically significant differences with all fourteenof the method-level metrics. Figure 5.3 illustrates the differences in a radar chart.Each of the metrics has been normalized by multiplying the metric mean for eachgroup (test-first and test-last) by a normalizing factor. The normalizing factor iscalculated by dividing the maximum mean of all metrics by the maximum meanof the two (test-first and test-last) groups for the metric being plotted. This chartdemonstrates the degree and consistency by which the means of the test-last andtest-first metrics varied.
This data implies and the radar chart illustrates very interesting and significantdifferences between methods developed with a test-last approach and methods de-veloped with a test-first approach. Unlike the other experiments, in this experimentthe test-last methods tend to have significantly lower mean metric values than thetest-first methods. This data indicates that software developed with a test-last ap-proach is significantly better in all categories (size, complexity, effort).
Class-Level Metrics
Table 5.22 and Table 5.23 present the results of the statistical analysis of the class-level metrics comparing the test-last and test-first classes. To save space, only thetwo-sample t-test p-values are reported. Although the ANOVA results strengthenthe confidence, the t-test should be sufficient here to indicate significant differencesbetween the two samples. The test-last project contained thirty-three classes andthe test-first project contained thirty-six classes.
Table 5.24 presents the same data from Table 5.22 and Table 5.23, but in sorted
90

order by %difference with the middle metrics eliminated for space. This view illus-trates a number of perhaps surprising trends. Unlike the previous experiment, thetwo projects of this experiment demonstrate a large number (thirty-seven) of class-level metrics with significant differences. Again the test-first project has a highernumber of parameters (PAR) and exceptions (NOE). The methods in the test-firstproject tended to be larger and more complex (MLOCAvg, VOL, VOC, VG, NBD), butthe test-last classes were more complex (WMC, V(G)) and larger in some ways (NIV).The test-first classes may have had a higher amount of reuse (NORM, IFI). The test-last project used more interfaces (NII) and appeared to be more cohesive (LCOM).
Interface-Level Metrics
As mentioned in the first section, Java Interfaces were isolated from classes. Thissection reports metrics only for interfaces. The pertinent interface-level metrics areexpanded in Table 5.3 and defined in Appendix D.
Table 5.25 presents the results of the statistical analysis of the interface-levelmetrics for the test-last project. The test-first project included five interfaces andthe test-last project included three interfaces. The interface metrics were similarbetween the two projects and none of the differences were statistically significant.
Project-Level Metrics
The project-level metrics are reported in Table 5.26. The data is reported in sortedorder by %difference. This view allows one to see trends in the metrics. The dif-ferences are relatively inconsistent and inconclusive. Although the test-first projectseems to be more complex, the coupling (CBO, IF, PAR) and size (LOC/Mod, MLO-CAvg) measures are mixed.
5.4.3 Test Results
Table 5.27 presents the testing metrics for the third experiment. Despite the mostimpressive testing numbers of all the test-last projects analyzed, the test-first projectstill has the highest saturation of tests including a significantly higher conditionalcoverage at 94%. Conditional coverage is widely viewed as the more important ofthe two coverage metrics reported.
5.4.4 Subjective and Evaluative Results
An external design review was conducted on the two projects in this experiment.Three professional developers within the same company but who had not workedon either of the projects were asked to conduct a design review of both projectsand complete a quality review scorecard with their impressions. The scorecard is
91
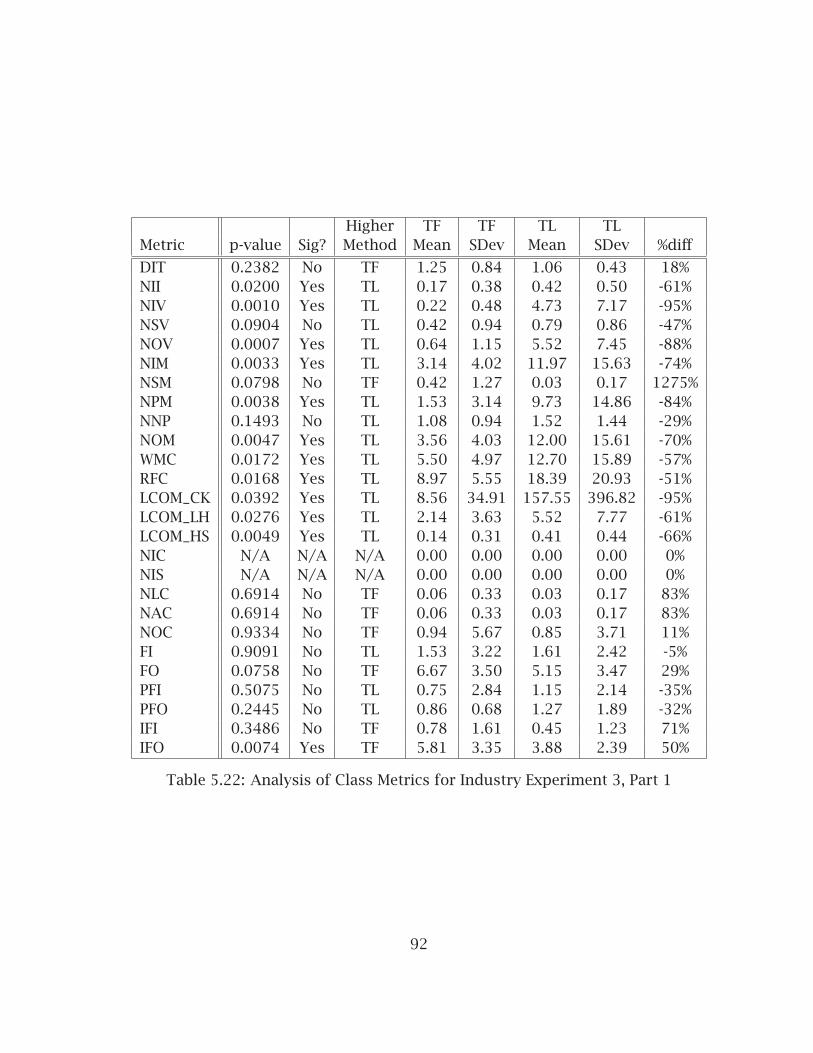
Higher TF TF TL TLMetric p-value Sig? Method Mean SDev Mean SDev %diff
DIT 0.2382 No TF 1.25 0.84 1.06 0.43 18%NII 0.0200 Yes TL 0.17 0.38 0.42 0.50 -61%NIV 0.0010 Yes TL 0.22 0.48 4.73 7.17 -95%NSV 0.0904 No TL 0.42 0.94 0.79 0.86 -47%NOV 0.0007 Yes TL 0.64 1.15 5.52 7.45 -88%NIM 0.0033 Yes TL 3.14 4.02 11.97 15.63 -74%NSM 0.0798 No TF 0.42 1.27 0.03 0.17 1275%NPM 0.0038 Yes TL 1.53 3.14 9.73 14.86 -84%NNP 0.1493 No TL 1.08 0.94 1.52 1.44 -29%NOM 0.0047 Yes TL 3.56 4.03 12.00 15.61 -70%WMC 0.0172 Yes TL 5.50 4.97 12.70 15.89 -57%RFC 0.0168 Yes TL 8.97 5.55 18.39 20.93 -51%LCOM_CK 0.0392 Yes TL 8.56 34.91 157.55 396.82 -95%LCOM_LH 0.0276 Yes TL 2.14 3.63 5.52 7.77 -61%LCOM_HS 0.0049 Yes TL 0.14 0.31 0.41 0.44 -66%NIC N/A N/A N/A 0.00 0.00 0.00 0.00 0%NIS N/A N/A N/A 0.00 0.00 0.00 0.00 0%NLC 0.6914 No TF 0.06 0.33 0.03 0.17 83%NAC 0.6914 No TF 0.06 0.33 0.03 0.17 83%NOC 0.9334 No TF 0.94 5.67 0.85 3.71 11%FI 0.9091 No TL 1.53 3.22 1.61 2.42 -5%FO 0.0758 No TF 6.67 3.50 5.15 3.47 29%PFI 0.5075 No TL 0.75 2.84 1.15 2.14 -35%PFO 0.2445 No TL 0.86 0.68 1.27 1.89 -32%IFI 0.3486 No TF 0.78 1.61 0.45 1.23 71%IFO 0.0074 Yes TF 5.81 3.35 3.88 2.39 50%
Table 5.22: Analysis of Class Metrics for Industry Experiment 3, Part 1
92
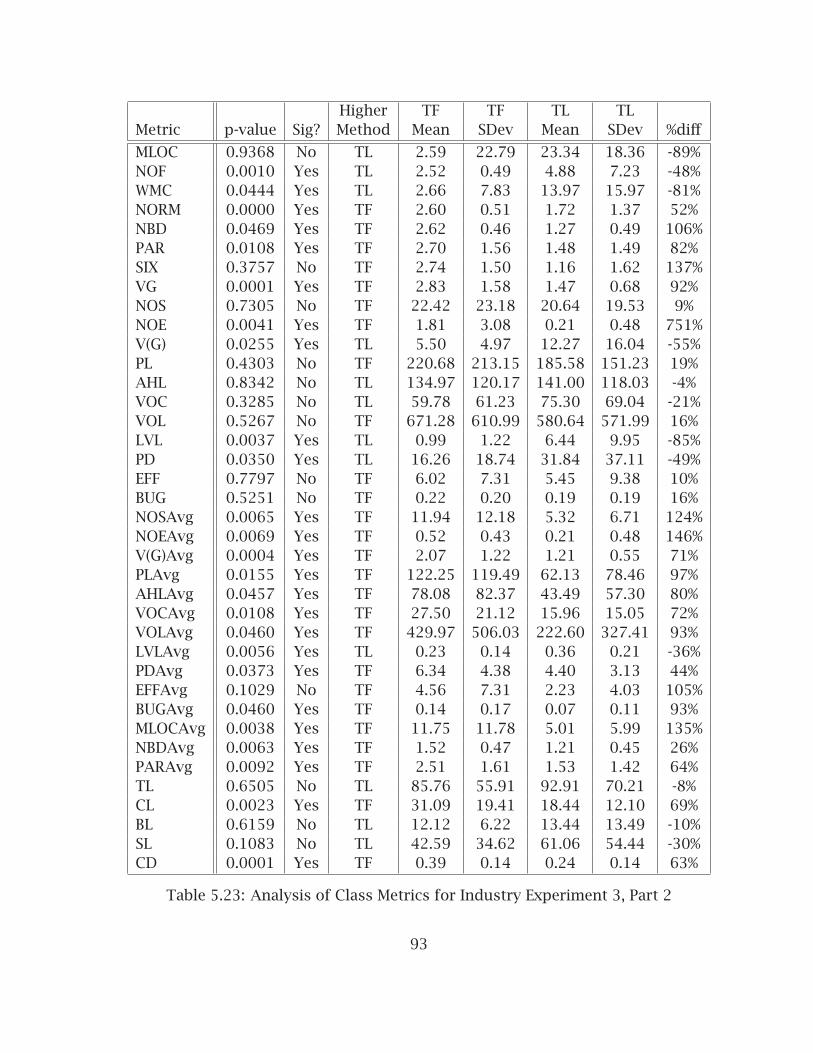
Higher TF TF TL TLMetric p-value Sig? Method Mean SDev Mean SDev %diff
MLOC 0.9368 No TL 2.59 22.79 23.34 18.36 -89%NOF 0.0010 Yes TL 2.52 0.49 4.88 7.23 -48%WMC 0.0444 Yes TL 2.66 7.83 13.97 15.97 -81%NORM 0.0000 Yes TF 2.60 0.51 1.72 1.37 52%NBD 0.0469 Yes TF 2.62 0.46 1.27 0.49 106%PAR 0.0108 Yes TF 2.70 1.56 1.48 1.49 82%SIX 0.3757 No TF 2.74 1.50 1.16 1.62 137%VG 0.0001 Yes TF 2.83 1.58 1.47 0.68 92%NOS 0.7305 No TF 22.42 23.18 20.64 19.53 9%NOE 0.0041 Yes TF 1.81 3.08 0.21 0.48 751%V(G) 0.0255 Yes TL 5.50 4.97 12.27 16.04 -55%PL 0.4303 No TF 220.68 213.15 185.58 151.23 19%AHL 0.8342 No TL 134.97 120.17 141.00 118.03 -4%VOC 0.3285 No TL 59.78 61.23 75.30 69.04 -21%VOL 0.5267 No TF 671.28 610.99 580.64 571.99 16%LVL 0.0037 Yes TL 0.99 1.22 6.44 9.95 -85%PD 0.0350 Yes TL 16.26 18.74 31.84 37.11 -49%EFF 0.7797 No TF 6.02 7.31 5.45 9.38 10%BUG 0.5251 No TF 0.22 0.20 0.19 0.19 16%NOSAvg 0.0065 Yes TF 11.94 12.18 5.32 6.71 124%NOEAvg 0.0069 Yes TF 0.52 0.43 0.21 0.48 146%V(G)Avg 0.0004 Yes TF 2.07 1.22 1.21 0.55 71%PLAvg 0.0155 Yes TF 122.25 119.49 62.13 78.46 97%AHLAvg 0.0457 Yes TF 78.08 82.37 43.49 57.30 80%VOCAvg 0.0108 Yes TF 27.50 21.12 15.96 15.05 72%VOLAvg 0.0460 Yes TF 429.97 506.03 222.60 327.41 93%LVLAvg 0.0056 Yes TL 0.23 0.14 0.36 0.21 -36%PDAvg 0.0373 Yes TF 6.34 4.38 4.40 3.13 44%EFFAvg 0.1029 No TF 4.56 7.31 2.23 4.03 105%BUGAvg 0.0460 Yes TF 0.14 0.17 0.07 0.11 93%MLOCAvg 0.0038 Yes TF 11.75 11.78 5.01 5.99 135%NBDAvg 0.0063 Yes TF 1.52 0.47 1.21 0.45 26%PARAvg 0.0092 Yes TF 2.51 1.61 1.53 1.42 64%TL 0.6505 No TL 85.76 55.91 92.91 70.21 -8%CL 0.0023 Yes TF 31.09 19.41 18.44 12.10 69%BL 0.6159 No TL 12.12 6.22 13.44 13.49 -10%SL 0.1083 No TL 42.59 34.62 61.06 54.44 -30%CD 0.0001 Yes TF 0.39 0.14 0.24 0.14 63%
Table 5.23: Analysis of Class Metrics for Industry Experiment 3, Part 2
93
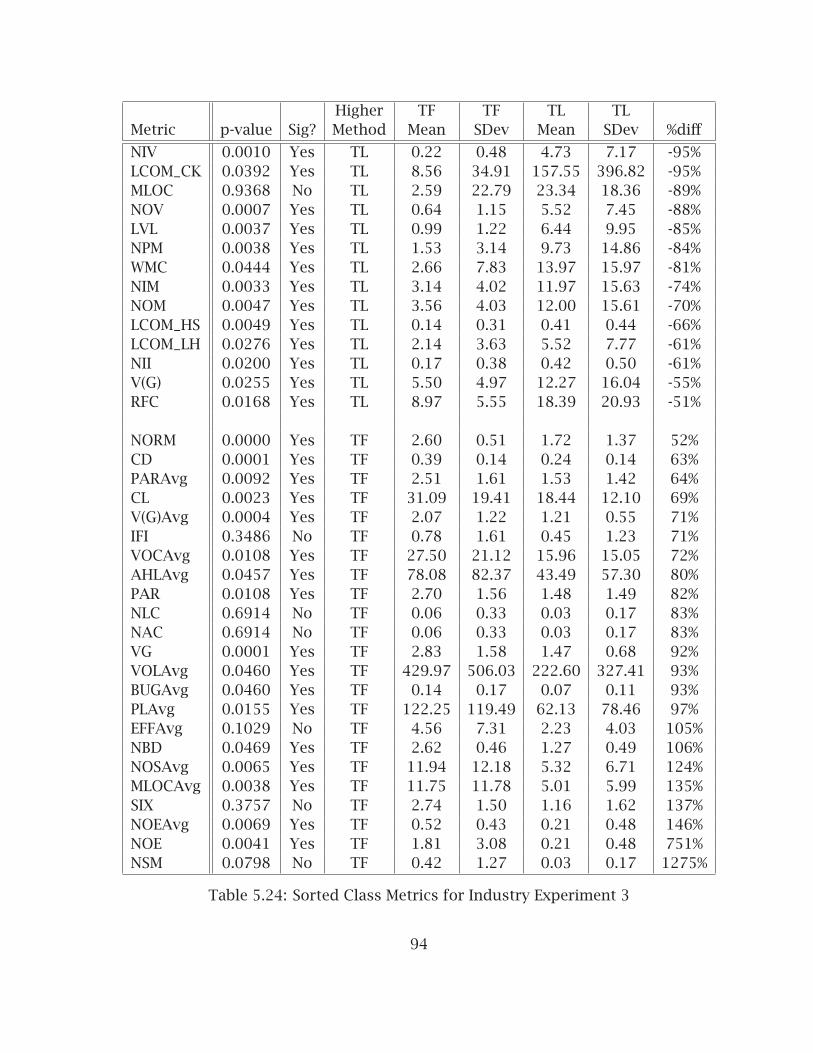
Higher TF TF TL TLMetric p-value Sig? Method Mean SDev Mean SDev %diff
NIV 0.0010 Yes TL 0.22 0.48 4.73 7.17 -95%LCOM_CK 0.0392 Yes TL 8.56 34.91 157.55 396.82 -95%MLOC 0.9368 No TL 2.59 22.79 23.34 18.36 -89%NOV 0.0007 Yes TL 0.64 1.15 5.52 7.45 -88%LVL 0.0037 Yes TL 0.99 1.22 6.44 9.95 -85%NPM 0.0038 Yes TL 1.53 3.14 9.73 14.86 -84%WMC 0.0444 Yes TL 2.66 7.83 13.97 15.97 -81%NIM 0.0033 Yes TL 3.14 4.02 11.97 15.63 -74%NOM 0.0047 Yes TL 3.56 4.03 12.00 15.61 -70%LCOM_HS 0.0049 Yes TL 0.14 0.31 0.41 0.44 -66%LCOM_LH 0.0276 Yes TL 2.14 3.63 5.52 7.77 -61%NII 0.0200 Yes TL 0.17 0.38 0.42 0.50 -61%V(G) 0.0255 Yes TL 5.50 4.97 12.27 16.04 -55%RFC 0.0168 Yes TL 8.97 5.55 18.39 20.93 -51%
NORM 0.0000 Yes TF 2.60 0.51 1.72 1.37 52%CD 0.0001 Yes TF 0.39 0.14 0.24 0.14 63%PARAvg 0.0092 Yes TF 2.51 1.61 1.53 1.42 64%CL 0.0023 Yes TF 31.09 19.41 18.44 12.10 69%V(G)Avg 0.0004 Yes TF 2.07 1.22 1.21 0.55 71%IFI 0.3486 No TF 0.78 1.61 0.45 1.23 71%VOCAvg 0.0108 Yes TF 27.50 21.12 15.96 15.05 72%AHLAvg 0.0457 Yes TF 78.08 82.37 43.49 57.30 80%PAR 0.0108 Yes TF 2.70 1.56 1.48 1.49 82%NLC 0.6914 No TF 0.06 0.33 0.03 0.17 83%NAC 0.6914 No TF 0.06 0.33 0.03 0.17 83%VG 0.0001 Yes TF 2.83 1.58 1.47 0.68 92%VOLAvg 0.0460 Yes TF 429.97 506.03 222.60 327.41 93%BUGAvg 0.0460 Yes TF 0.14 0.17 0.07 0.11 93%PLAvg 0.0155 Yes TF 122.25 119.49 62.13 78.46 97%EFFAvg 0.1029 No TF 4.56 7.31 2.23 4.03 105%NBD 0.0469 Yes TF 2.62 0.46 1.27 0.49 106%NOSAvg 0.0065 Yes TF 11.94 12.18 5.32 6.71 124%MLOCAvg 0.0038 Yes TF 11.75 11.78 5.01 5.99 135%SIX 0.3757 No TF 2.74 1.50 1.16 1.62 137%NOEAvg 0.0069 Yes TF 0.52 0.43 0.21 0.48 146%NOE 0.0041 Yes TF 1.81 3.08 0.21 0.48 751%NSM 0.0798 No TF 0.42 1.27 0.03 0.17 1275%
Table 5.24: Sorted Class Metrics for Industry Experiment 3
94

Higher TF TF TL TLMetric p-value Sig? Method Mean SDev Mean SDev %diff
DIT N/A N/A N/A 0.00 0.00 0.00 0.00 0%NCI 0.4226 No TL 2.00 0.00 2.67 1.15 -25%NSV N/A N/A N/A 0.00 0.00 0.00 0.00 0%NIM 0.6911 No TF 5.40 6.02 4.00 3.46 35%NPM 0.6911 No TF 5.40 6.02 4.00 3.46 35%NOM 0.6911 No TF 5.40 6.02 4.00 3.46 35%RFC 0.6911 No TF 5.40 6.02 4.00 3.46 35%NIC N/A N/A N/A 0.00 0.00 0.00 0.00 0%
Table 5.25: Analysis of Interface Metrics for Experiment 3
Metric TF Value TL Value Higher Method %diff
NOFavg 0.24 4.88 TL -95%LCOMavg 0.02 0.40 TL -94%NOMavg 3.27 12.31 TL -73%REU 0.03 0.06 TL -54%NOAavg 1.00 2.00 TL -50%NSFavg 0.44 0.81 TL -46%LOC/Mod 21.65 33.95 TL -36%NOCavg 0.43 0.53 TL -17%RMDavg 0.23 0.28 TL -17%FIavg 2.70 3.05 TL -12%CBOavg 5.03 5.56 TL -10%FOavg 2.33 2.51 TL -7%DITavg 0.68 0.72 TL -5%RMIavg 0.64 0.65 TL -2%VGmax 6.00 6.00 TL 0%CAavg 5.00 4.75 TF 5%SIXavg 1.46 1.16 TF 26%NBDavg 1.39 1.06 TF 31%NOIavg 1.25 0.75 TF 67%RMAavg 0.21 0.12 TF 79%VGavg 2.04 1.13 TF 80%CEavg 8.75 4.75 TF 84%SPC 34.00 15.00 TF 127%PARavg 1.43 0.60 TF 137%MLOCavg 6.10 1.89 TF 222%IFavg 341.93 44.81 TF 663%
Table 5.26: Analysis of Project Metrics for Industry Experiment 3
95

Metric TF TL Higher Method %diff
T/S Ratio 1.08 0.61 TF 78%#Asserts/LOC 0.10 0.09 TF 12%#Asserts/Class 4.38 3.00 TF 46%#Asserts/Method 1.12 1.06 TF 6%Line Coverage 72% 84% TL -14%Cond Coverage 94% 74% TF 27%
Table 5.27: Test Metrics for Industry Experiment 3
TF TF TL TL HigherMetric Mean SDev Mean SDev %diff Method
Understandability 3.67 1.15 3.33 0.58 10% TFMaintainability 3.00 1.00 3.67 0.58 -18% TLReusability 3.33 0.58 3.00 0.00 11% TFTestability 3.33 1.15 3.33 0.58 0% N/ADesign Quality 3.67 0.58 3.67 0.58 0% N/A
Table 5.28: Design Review Results for Industry Experiment 3
presented in Appendix F. The reviewers were asked to spend less than two hoursreviewing each of the projects. Reviewers were given a brief overview of the projectwhich included a very short description of the project architecture.
The three reviewers were selected based on development experience qualifica-tions. Two reviewers reported having six to ten years development experience andhaving completed a graduate degree in a computing-related major. The third re-viewer reported a bachelor’s degree in a non-computing-related major, but reportedhaving over twenty years development experience. All reviewers had experiencedeveloping Java web applications similar to those being reviewed.
The reviewers were requested to rate each project on a scale of 1 to 5 (1 beingthe worst and 5 being the best rating) in terms of understandability, maintainability,reusability, testability, and overall design quality. Table 5.28 presents the results ofthe reviewer ratings. The reviewer ratings were very similar for the two projectswith the test-first project being slightly better for understandability and reusability,but slightly worse for maintainability.
The reviewers were also given the opportunity to make general comments aboutthe two projects. Several comments regarded the lack of programmer documenta-tion in both projects. One reviewer stated that ”Tests are complex and do not coverall of the classes” in regards to the test-last project.
The design reviews provide additional validity to the objective metric analysis.Although many metrics had statistically significant differences, the class, interface,and project-level metrics provided many inconsistent and inconclusive results. Plus
96

the similar testing metrics lead one to think that the internal quality of these twoprojects is fairly similar.
5.4.5 Possible Explanations of Results
This section has noted improved metrics on the test-last project compared to thetest-last projects in the other experiments, particularly in the area of testing. Anumber of possible explanations could account for the similar results between thetwo projects. Because the test-last developers recently finished a test-first project,they may have adjusted their development style to focus more heavily on automatedunit testing.
Another possibility could be the Hawthorne effect. In the first two experiments,testing improved in the test-first projects which were the projects where developersknew they were participating in this study. In this third experiment, developers inthe test-last project knew they were participating in this study. Perhaps this knowl-edge caused an awareness of testing strategy that resulted in improved numbers.Even if this was the case, as discussed earlier the test-last testing metrics still werenot as good as those from the earlier test-first project.
5.5 Industry Experiment in Training Course
This section describes a short experiment conducted in a professional trainingcourse. The context of the course and experiment is reviewed, followed by a fewcomments regarding the results. The results of pre and post training surveys willbe presented and discussed.
5.5.1 Experiment Design and Context
The description of the experiment from Section 4.2.6 will be repeated and expandedhere. Sixteen developers participated in a six-day on-site professional training coursedeveloped and presented by the author in Fall 2005. The developers were from sev-eral development groups in the same company as the other experiments.
The course included one day of instruction on test-driven development with JU-nit and the remaining five days of instruction were split between the Spring andHibernate frameworks. The Spring [52] framework was described in section 4.1.1 asa lightweight dependency injection framework. Spring also includes a model-view-controller based web application framework as well as a framework for communi-cating with relational databases. Hibernate [68] is a persistence service providingobject/relational mapping functionality. Spring and Hibernate are commonly usedtogether and provide integration support. The course consisted of lecture directedby nearly five hundred presentation slides and hands-on lab exercises. The day on
97

test-driven development was largely a refresher for most developers from a similarcourse provided two years earlier.
At the beginning of the course, students completed the pre-experiment survey.The experiment then consisted of an extended exercise near the end of the TDD day.Half of the developers were asked to complete the exercise with a test-first approachand half were asked to complete the exercise with a test-last approach. Subjectswere randomly selected for each group. A couple of individuals with limited Javaexperience requested to work in pairs with more experienced Java developers. Thiswas allowed and both test-first and test-last groups contained one or two such pairsof programmers. All developers were asked to use JUnit in the Eclipse IDE forwriting automated unit tests.
The exercise was to build a bowling game scorer as described in Appendix B.2.2.This project was proposed by Robert C. Martin [58] and was used in an industryexperiment by Laurie Williams [37] to examine the effects of TDD on external qual-ity. The project involved reading bowling throws from a file, calculating scores, andpresenting scores through a text-based user interface. Some sample input/outputcode was provided to subjects to shorten the development effort. Despite thesehelps, not all programmers were able to complete the project in the time allotted.
Students completed a post-experiment survey on the second day of the trainingcourse after completing the Bowling experiment.
5.5.2 Internal Quality Results
Source and test code from six projects were submitted from students in the course.Three were completed with a test-first approach and three were completed with atest-last approach. The six projects submitted were completed primarily by devel-opers with previous JUnit experience. The other developers who did not completeand did not submit their projects reported running out of time because they spentmost of their time gaining familiarity with JUnit and the test-first/test-last approach.
No statistically significant differences existed between the software developedwith a test-first and a test-last approach. Perhaps this is due to the small size ofthe project completed. All projects were completed with two or three classes andan average of eighty lines of code (Std Dev of 19.2). Or perhaps this stems from thefact that one of the three test-last projects submitted were from developers withprevious test-first experience (see experiment #3 discussion).
5.5.3 Test Results
Table 5.29 reports the test coverage metrics from the training experiment. Althoughthere are no significant differences, it is interesting to note that the test-first met-rics are more consistent than the test-last metrics. Plus the highest coverage metrics
98

Prev TF Experience Approach Line Coverage Cond Coverage
No TF 50% 19%No TF 58% 55%No TF 49% 30%No TL 68% 63%Yes TL 73% 80%No TL 6% 0%
Two-sample t-testp-value 0.8916 0.6658Significant? No NoTF Mean 0.52 0.35Std Dev 0.05 0.18TL Mean 0.49 0.48Std Dev 0.37 0.42Higher Method TF TL%difference 7% -27%
Table 5.29: Test Metrics for Industry Training Experiment
were achieved by the one project where the developers had previous test-first expe-rience. This is consistent with the results from experiment #3.
5.5.4 Subjective and Evaluative Results
Pre and post experiment surveys were conducted before and after the bowling as-signment in the training course. The surveys are presented in Appendix F. No sta-tistically significant differences existed between the test-first and test-last groups interms of academic background, work experience, or specific programming experi-ence.
In the post-experiment survey, the industry programmers overwhelmingly pre-ferred the test-first approach. Ninety to one hundred percent of the programmerschose the test-first approach in all of the queries including:
• which approach they would choose in the future (Choice)
• which approach was the best for the project(s) they completed (BestApproach)
• which approach would cause them to more thoroughly test a program (Thor-oughTesting)
• which approach produces a correct solution in less time (Correct)
• which approach produces code that is simpler, more reusable, and more main-tainable (Simpler)
99

• which approach produces code with fewer defects (FewerDefects)
Programmer responses on six questions were analyzed for changes from the preto the post experiment survey. Table 5.30 presents the results of this analysis. Thefirst section gives results from the programmers who used a test-first approach inthe experiment. The second section gives the results from the programmers whoused a test-last approach in the experiment. The third section gives the resultsfrom all programmers including five programmers who took the surveys but didnot participate in the programming portion of the experiment. The questions ratedprogrammer attitudes toward the following factors:
• importance of unit testing (Testing Attitude)
• timing of writing unit tests (Test Timing)
• importance of software design prior to coding (Design Attitude)
• efficacy of test-first programming (TF Attitude)
• efficacy of test-last programming (TL Attitude)
• choice of test-first or test-last programming (Choice)
A paired, two-tailed t-test was applied to both the test-first and test-last groupsto determine if the differences from the pre to post experiment survey were signifi-cant. The only difference that was significant was on the first question regarding theimportance of unit testing. Both the test-first and test-last groups improved theirattitudes toward the importance of unit testing after participating in the bowlingexperiment.
Similarly, a paired, two-tailed t-test was applied to all participants in the class(regardless of whether they used a test-first or test-last approach on the bowlingproject). This revealed a statistically significant improvement in both the impor-tance of unit testing and a shift in test timing. The average response on the testtiming question changed from “after I think a small portion of the program is com-plete (such as a single function)” to “before I have written a new important portionof the program (such as a class), but after I have tested other code that is finished).”
Also, programmer opinion of the test-first approach improved on the whole by10% (not statistically significant). However, programmer opinion of the test-lastapproach decreased 38%, a statistically significant amount. The average test-firstopinion was “I think it might be a good approach on projects where programmersunderstand the domain well” and the average test-last opinion in the post experi-ment was between “I think it might be a good approach on small projects” and “Ithink it might be a good approach on projects where programmers have a lot ofprogramming experience.”
100

Testing Test Design TF TLMetric Attitude Timing Attitude Attitude Attitude Choice
test-first programmerspaired t-test p-value 0.0250 0.0643 0.1747 1.0000 0.3632 0.3632Significant Yes No No No No NoHigher Method Post Post Post Post Pre PrePre Mean 2.83 3.00 2.83 3.67 1.83 0.33Pre Std Dev 0.98 2.28 0.41 0.52 1.17 0.52Post Mean 3.50 5.50 3.17 3.67 1.67 0.17Post Std Dev 0.55 1.22 0.41 0.82 1.21 0.41%difference -19% -45% -11% 0% 10% 100%
test-last programmerspaired t-test p-value 0.0422 0.2080 1.0000 0.0791 0.1801 0.3632Significant Yes No No No No NoHigher Method Post Post Post Post Pre PrePre Mean 2.83 3.40 3.00 3.08 2.42 0.33Pre Std Dev 0.75 1.67 0.63 1.02 1.02 0.52Post Mean 3.67 4.50 3.00 4.00 1.83 0.17Post Std Dev 0.52 1.22 0.89 0.00 1.17 0.41%difference -23% -24% 0% -23% 32% 100%
all programmerspaired t-test p-value 0.0019 0.0295 0.3370 0.2301 0.0475 0.1661Significant Yes Yes No No Yes NoHigher Method Post Post Post Post Pre PrePre Mean 3.06 3.13 2.88 3.38 2.34 0.33Pre Std Dev 0.85 2.03 0.50 0.90 1.25 0.49Post Mean 3.62 5.00 3.08 3.77 1.69 0.17Post Std Dev 0.51 1.22 0.64 0.60 1.11 0.39%difference -15% -37% -7% -10% 38% 100%
Table 5.30: Programmer Attitude Changes in Industry Training Experiment
101

Industry Programmer Opinions (Longitudinal)
0% 10% 20% 30% 40% 50% 60% 70% 80% 90% 100%
FewerDefects
Simpler
Correctness
ThoroughTesting
BestApproach
Choice
Ch
arac
teri
stic
% Choosing
Test-First Test-Last
Figure 5.4: Longitudinal Industry Programmer Opinions
Finally in the pre-experiment survey, 67% of the programmers indicated theywould choose the test-first approach over test-last. In the post-experiment survey,this number increased to 83%. These numbers reveal a possible pre-disposition tothe test-first approach within the development group. Still the improvement wassubstantial and equivalent between the test-first and test-last groups.
A longitudinal survey was administered with all of the participants from thetraining course and the industry experiments. The survey was administered overthe web approximately seven months after the training course and eight of thetwelve developers responded. This time period ensured that all of the industryexperiment projects were complete and that programmers had the opportunity tovoluntarily choose to use the test-first or test-last approach on subsequent projects.Figure 5.4 presents the results from the longitudinal survey. Although results de-clined slightly on a few questions from the post-experiment survey, programmersstill unanimously would choose the test-first approach.
Other survey responses indicated that 62% of the programmers had used thetest-first approach on subsequent projects when they had the choice. Interestingly,75% indicated that they had also used the test-last approach on some projects. Onecomment from the surveys is presented here and may shed light on this result.
I have found that both test first and test last have their place in program-ming. For some issues, it is necessary to write the code first because theidea needs further development. In database applications, or file basedapplications, I have found that the test can become extremely compli-
102

Project Approach JUnit Team SLOC Date
Component Tracking TL Yes ABC 32065 ’01,’03,’04Common TL Yes many 7807 on-goingProject Engineer TL No AB 2787 ’02Part # Adv. Search TL No C 1562 ’01Workflow TL Yes BC 811 ’03Common Parameter TL Yes C 678 ’03Authentication TL No BC 476 ’01PDD TL Yes D 427 on-goingExp. Common Classes TL No E 399 ’02Exp. Data Connection TL No E 133 ’02Exp. Access TL No E 114 ’02Conformity Request Tracking TL Yes AB 2071 ’06Exp. Inv. Scanners TF Yes ABC 1559 ’05Part # Adv. Search II TF Yes C 842 ’06Common Pagination TF Yes C 349 ’06
Table 5.31: Project Summary
cated and difficult to change when refactoring. In these cases a test lastusing stubs seems to work better than test first. Even in these situations,the test first method is used for pieces of the code where the databaseor file can be separated from the code.
5.6 Industry Case Study
This section reports results from a case study conducted on fifteen software projectsdeveloped by a single development group in a Fortune 500 company. The contextof the projects is reviewed, followed by the results of an analysis of the projects.
5.6.1 Context and Overview
Table 5.31 summarizes the projects included in the case study. Each project islabeled with the approach used (test-first TF or test-last TL) and whether automatedtests were written. All projects are written in Java with automated tests written withJUnit. Lead developers are labeled with A, B, C, D, and E to enable fair comparisons.Years are given for project or major milestone completion.
The data presented in this case study represents recent test-first and test-lastsoftware projects written with automated unit tests as well as some test-last projectsthat were only manually tested. The projects were produced over a span of approx-imately five years. The study includes the five projects reported in earlier sections,
103

but does not include the projects from the small training experiment of the previ-ous section. All projects were identified and prioritized through normal businessprocesses and were developed for production use.
The projects were primarily web applications written in Java using the JavaServlet and JavaServer Pages technology. Some projects also utilized additionalframeworks and libraries including Struts, Spring, Hibernate, and Tiles.
The development group was organized into small teams of usually three or fewerdevelopers per project. Developers worked directly with internal users and cus-tomers to elicit requirements. Some projects included an external client base, butmost supported internal corporate functions. Projects were typically completed inthree to six months.
The lead developers A, B, C, and D all participated in a JUnit training coursein Summer 2003 and in the Fall 2005 training course described earlier. A surveywas conducted in the Fall 2005 training course. At this time, all of the developersworking on these projects had completed at least a bachelors degree, and all butdeveloper D had completed a degree in a computing related discipline. DevelopersA, B, and C reported having six to ten years of experience in a computing-related joband developer D reported eleven to twenty years of experience. They all reportedrecent (within previous three months) Java and web programming experience.
5.6.2 Internal Quality Results
This section reports, compares, and describes the internal design quality metricresults. The metrics are categorized at the method, class, and project level.
Method-Level Metrics
Table 5.32 and 5.33 summarizes results of method-level metrics performed onapproximately 5,173 methods representing over 30,000 lines of code in fifteen pri-marily web-based Java software projects.
This analysis demonstrates statistically significant differences with ten of thefourteen method-level metrics. Figure 5.5 illustrates the differences in a radar chart.Each of the metrics has been normalized by multiplying the metric mean for eachgroup (test-first and test-last) by a normalizing factor. The normalizing factor iscalculated by dividing the maximum mean of all metrics by the maximum meanof the two (test-first and test-last) groups for the metric being plotted. This chartdemonstrates that degree and consistency by which the means of the test-last andtest-first metrics varied.
This data implies and the radar chart illustrates that software developed in atest-first manner is likely to be smaller (NOS and MLOC), have more exceptions(NOE), and have a lower computational complexity (V(G)). Test-first code is alsolikely to be simpler as measured with Halstead’s length and level metrics (AHL and
104
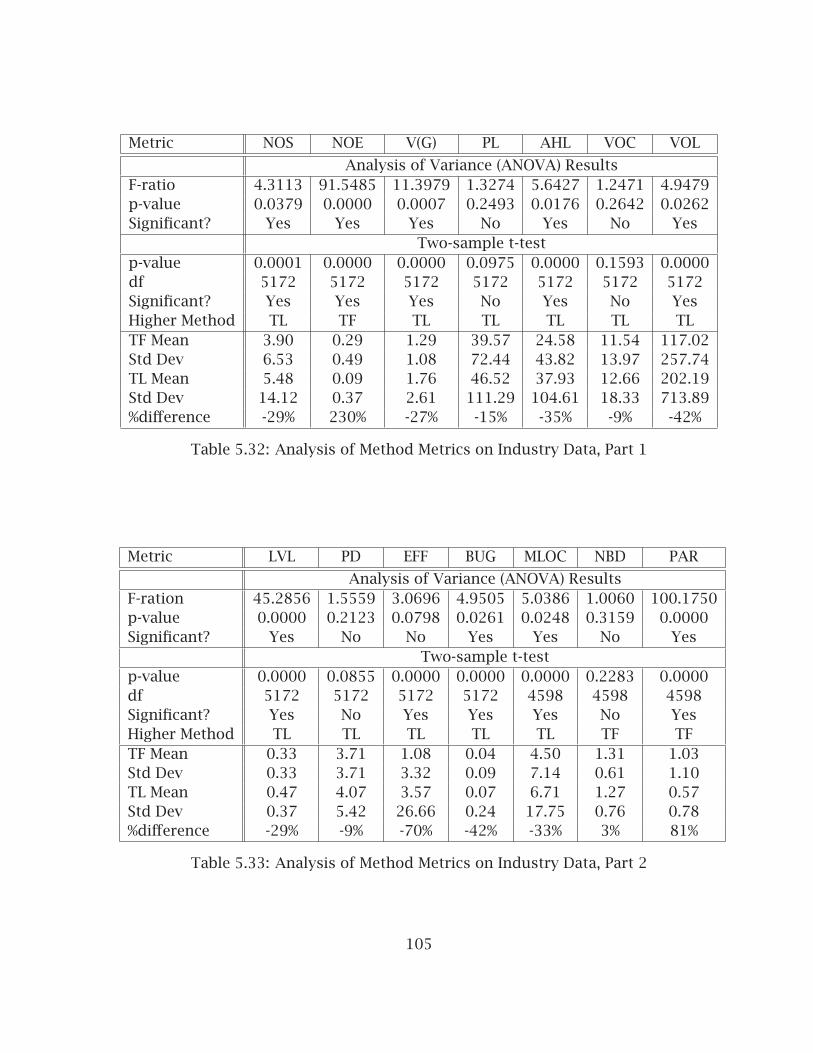
Metric NOS NOE V(G) PL AHL VOC VOL
Analysis of Variance (ANOVA) ResultsF-ratio 4.3113 91.5485 11.3979 1.3274 5.6427 1.2471 4.9479p-value 0.0379 0.0000 0.0007 0.2493 0.0176 0.2642 0.0262Significant? Yes Yes Yes No Yes No Yes
Two-sample t-testp-value 0.0001 0.0000 0.0000 0.0975 0.0000 0.1593 0.0000df 5172 5172 5172 5172 5172 5172 5172Significant? Yes Yes Yes No Yes No YesHigher Method TL TF TL TL TL TL TLTF Mean 3.90 0.29 1.29 39.57 24.58 11.54 117.02Std Dev 6.53 0.49 1.08 72.44 43.82 13.97 257.74TL Mean 5.48 0.09 1.76 46.52 37.93 12.66 202.19Std Dev 14.12 0.37 2.61 111.29 104.61 18.33 713.89%difference -29% 230% -27% -15% -35% -9% -42%
Table 5.32: Analysis of Method Metrics on Industry Data, Part 1
Metric LVL PD EFF BUG MLOC NBD PAR
Analysis of Variance (ANOVA) ResultsF-ration 45.2856 1.5559 3.0696 4.9505 5.0386 1.0060 100.1750p-value 0.0000 0.2123 0.0798 0.0261 0.0248 0.3159 0.0000Significant? Yes No No Yes Yes No Yes
Two-sample t-testp-value 0.0000 0.0855 0.0000 0.0000 0.0000 0.2283 0.0000df 5172 5172 5172 5172 4598 4598 4598Significant? Yes No Yes Yes Yes No YesHigher Method TL TL TL TL TL TF TFTF Mean 0.33 3.71 1.08 0.04 4.50 1.31 1.03Std Dev 0.33 3.71 3.32 0.09 7.14 0.61 1.10TL Mean 0.47 4.07 3.57 0.07 6.71 1.27 0.57Std Dev 0.37 5.42 26.66 0.24 17.75 0.76 0.78%difference -29% -9% -70% -42% -33% 3% 81%
Table 5.33: Analysis of Method Metrics on Industry Data, Part 2
105

NOS
NOE
V(G)
PL
AHL
VOC
VOL
LVL
PD
EFF
BUG
MLOC
NBD
PAR
TF
TL
Figure 5.5: Industry Case Study Method Metrics Radar Chart
LVL), have fewer expected defects (BUG), and possibly take less effort (EFF) (noteANOVA results are not quite statistically significant). Finally, test-first methods arelikely to have more parameters (PAR).
Class-Level Metrics
Table 5.34 and Table 5.35 present the results of the statistical analysis of the class-level metrics comparing the test-last and test-first classes. To save space, only thetwo-sample t-test p-values are reported. Although the ANOVA results strengthenthe confidence, the t-test should be sufficient here to indicate significant differencesbetween the two samples. Thirty-nine metrics demonstrated statistically significantdifferences.
Table 5.36 presents the same data from Table 5.34 and Table 5.35, but in sortedorder by %difference with the middle metrics eliminated for space. This view il-lustrates a number of trends. For instance, test-last projects tended to have largerand more complex methods and classes. Test-last projects may demonstrate morereuse (Fan-in). Test-first projects have methods with more parameters and throwmore exceptions.
There were a total of 51 classes in the three test-first projects and 515 classesin the twelve test-last project. Table 5.37 reports the ratio of interfaces to classes.Test-first projects made significantly more use of interfaces, indicating a higherlevel of abstraction and looser coupling.
106

Higher TF TF TL TLMetric p-value Sig? Method Mean SDev Mean SDev %diff
DIT 0.8375 No TL 1.18 0.74 1.20 1.09 -2%NII 0.1136 No TF 0.33 0.48 0.22 0.46 51%NIV 0.0314 Yes TL 1.33 3.85 2.61 5.01 -49%NSV 0.0000 Yes TL 0.29 0.81 3.21 9.86 -91%NOV 0.0000 Yes TL 1.63 3.87 5.83 11.89 -72%NIM 0.0388 Yes TL 5.69 8.74 8.53 12.94 -33%NSM 0.0265 Yes TL 0.29 1.08 0.71 2.38 -59%NPM 0.1472 No TL 3.75 8.30 5.63 12.46 -33%NNP 0.0758 No TL 1.51 1.86 2.01 2.30 -25%NOM 0.0182 Yes TL 5.98 8.65 9.23 13.43 -35%WMC 0.0001 Yes TL 8.88 10.99 16.52 24.07 -46%RFC 0.0000 Yes TL 12.75 12.66 25.34 30.14 -50%LCOM_CK 0.2712 No TL 42.12 155.82 80.38 612.34 -48%LCOM_LH 0.3304 No TL 3.29 4.92 4.00 4.31 -18%LCOM_HS 0.0005 Yes TL 0.23 0.37 0.43 0.43 -47%NIC 0.0252 Yes TL 0.00 0.00 0.02 0.20 -100%NIS 0.0026 Yes TL 0.00 0.00 0.02 0.13 -100%NLC 0.1335 No TF 0.10 0.41 0.01 0.10 910%NAC 0.1335 No TF 0.10 0.41 0.01 0.10 910%NOC 0.9766 No TL 0.71 4.76 0.73 3.95 -3%FI 0.0064 Yes TL 1.33 2.75 2.75 7.65 -51%FO 0.0031 Yes TL 7.10 3.85 9.01 7.23 -21%PFI 0.0454 Yes TL 0.69 2.40 1.44 3.69 -52%PFO 0.0019 Yes TL 0.96 0.96 1.51 2.49 -36%IFI 0.0364 Yes TL 0.65 1.44 1.30 5.39 -50%IFO 0.0160 Yes TL 6.14 3.42 7.50 6.28 -18%
Table 5.34: Analysis of Class Metrics for Industry Case Study, Part 1
107

Higher TF TF TL TLMetric p-value Sig? Method Mean SDev Mean SDev %diff
MLOC 0.0000 Yes TL 30.13 35.81 60.42 97.96 -50%NOF 0.0587 No TL 1.50 3.97 2.68 5.08 -44%NORM 0.9282 No TL 0.48 0.71 0.49 0.98 -2%NBD 0.0962 No TF 1.50 0.45 1.38 0.52 8%PAR 0.0000 Yes TF 2.07 1.50 0.62 0.64 236%SIX 0.0000 Yes TF 1.20 1.51 0.22 0.62 455%VG 0.6682 No TF 2.51 1.45 2.41 2.09 4%NOS 0.0000 Yes TL 22.06 27.55 49.26 78.90 -55%NOE 0.0416 Yes TF 1.65 3.17 0.79 1.95 108%V(G) 0.0000 Yes TL 7.31 10.52 15.87 23.81 -54%PL 0.0002 Yes TL 224.00 330.57 418.48 658.01 -46%AHL 0.0000 Yes TL 139.15 181.45 341.21 561.25 -59%VOC 0.0002 Yes TL 65.35 85.01 113.89 158.35 -43%VOL 0.0000 Yes TL 662.50 955.24 1818.96 3453.72 -64%LVL 0.0004 Yes TL 1.89 4.44 4.24 7.24 -55%PD 0.0006 Yes TL 20.99 29.78 36.66 52.25 -43%EFF 0.0000 Yes TL 6.09 10.39 32.13 102.62 -81%BUG 0.0000 Yes TL 0.22 0.32 0.61 1.15 -64%NOSAvg 0.5683 No TF 7.87 10.56 7.06 9.37 11%NOEAvg 0.0005 Yes TF 0.43 0.46 0.20 0.47 112%V(G)Avg 0.0857 No TL 1.57 1.23 1.86 1.40 -16%PLAvg 0.1891 No TF 81.12 105.13 62.82 80.21 29%AHLAvg 0.8385 No TF 52.06 70.77 50.12 68.89 4%VOCAvg 0.1640 No TF 19.23 19.47 15.65 13.59 23%VOLAvg 0.9466 No TF 279.28 428.02 275.39 464.06 1%LVLAvg 0.0000 Yes TL 0.23 0.18 0.38 0.20 -40%PDAvg 0.6687 No TF 4.80 4.19 4.57 3.57 5%EFFAvg 0.0668 No TL 2.92 5.91 4.65 13.02 -37%BUGAvg 0.9467 No TF 0.09 0.14 0.09 0.15 1%MLOCAvg 0.3009 No TF 9.16 10.30 7.67 9.07 19%NBDAvg 0.0334 Yes TF 1.50 0.49 1.35 0.50 11%PARAvg 0.0000 Yes TF 1.93 1.54 0.69 0.58 181%TL 0.0000 Yes TL 96.39 76.23 168.86 207.84 -43%CL 0.0000 Yes TL 35.32 28.62 56.27 68.65 -37%BL 0.0143 Yes TL 12.86 9.17 16.60 20.14 -23%SL 0.0000 Yes TL 48.23 50.41 96.82 134.60 -50%CD 0.1730 No TF 0.41 0.17 0.38 0.15 9%
Table 5.35: Analysis of Class Metrics for Industry Case Study, Part 2
108

Higher TF TF TL TLMetric p-value Sig? Method Mean SDev Mean SDev %diff
NIC 0.0252 Yes TL 0.00 0.00 0.02 0.20 -100%NIS 0.0026 Yes TL 0.00 0.00 0.02 0.13 -100%NSV 0.0000 Yes TL 0.29 0.81 3.21 9.86 -91%EFF 0.0000 Yes TL 6.09 10.39 32.13 102.62 -81%NOV 0.0000 Yes TL 1.63 3.87 5.83 11.89 -72%BUG 0.0000 Yes TL 0.22 0.32 0.61 1.15 -64%VOL 0.0000 Yes TL 662.50 955.24 1818.96 3453.72 -64%AHL 0.0000 Yes TL 139.15 181.45 341.21 561.25 -59%NSM 0.0265 Yes TL 0.29 1.08 0.71 2.38 -59%LVL 0.0004 Yes TL 1.89 4.44 4.24 7.24 -55%NOS 0.0000 Yes TL 22.06 27.55 49.26 78.90 -55%MLOC 0.0000 Yes TL 23.89 31.49 53.24 102.65 -55%V(G) 0.0000 Yes TL 7.31 10.52 15.87 23.81 -54%PFI 0.0454 Yes TL 0.69 2.40 1.44 3.69 -52%FI 0.0064 Yes TL 1.33 2.75 2.75 7.65 -51%IFI 0.0364 Yes TL 0.65 1.44 1.30 5.39 -50%SL 0.0000 Yes TL 48.23 50.41 96.82 134.60 -50%RFC 0.0000 Yes TL 12.75 12.66 25.34 30.14 -50%NIV 0.0314 Yes TL 1.33 3.85 2.61 5.01 -49%LCOM_CK 0.2712 No TL 42.12 155.82 80.38 612.34 -48%LCOM_HS 0.0005 Yes TL 0.23 0.37 0.43 0.43 -47%PL 0.0002 Yes TL 224.00 330.57 418.48 658.01 -46%WMC 0.0001 Yes TL 8.88 10.99 16.52 24.07 -46%NOF 0.0587 No TL 1.50 3.97 2.68 5.08 -44%TL 0.0000 Yes TL 96.39 76.23 168.86 207.84 -43%PD 0.0006 Yes TL 20.99 29.78 36.66 52.25 -43%VOC 0.0002 Yes TL 65.35 85.01 113.89 158.35 -43%
NII 0.1136 No TF 0.33 0.48 0.22 0.46 51%NOE 0.0416 Yes TF 1.65 3.17 0.79 1.95 108%NOEAvg 0.0005 Yes TF 0.43 0.46 0.20 0.47 112%PARAvg 0.0000 Yes TF 1.93 1.54 0.69 0.58 181%PAR 0.0000 Yes TF 2.07 1.50 0.62 0.64 236%SIX 0.0000 Yes TF 1.20 1.51 0.22 0.62 455%NLC 0.1335 No TF 0.10 0.41 0.01 0.10 910%NAC 0.1335 No TF 0.10 0.41 0.01 0.10 910%
Table 5.36: Sorted Class Metrics for Industry Case Study
109
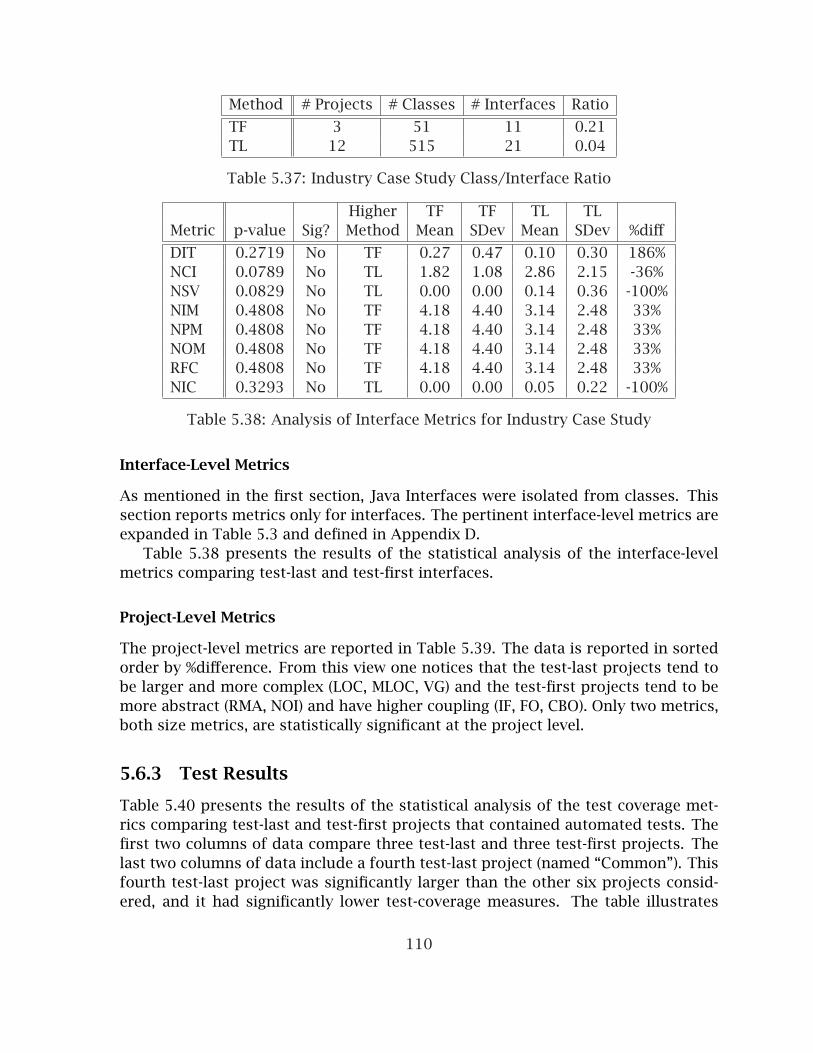
Method # Projects # Classes # Interfaces Ratio
TF 3 51 11 0.21TL 12 515 21 0.04
Table 5.37: Industry Case Study Class/Interface Ratio
Higher TF TF TL TLMetric p-value Sig? Method Mean SDev Mean SDev %diff
DIT 0.2719 No TF 0.27 0.47 0.10 0.30 186%NCI 0.0789 No TL 1.82 1.08 2.86 2.15 -36%NSV 0.0829 No TL 0.00 0.00 0.14 0.36 -100%NIM 0.4808 No TF 4.18 4.40 3.14 2.48 33%NPM 0.4808 No TF 4.18 4.40 3.14 2.48 33%NOM 0.4808 No TF 4.18 4.40 3.14 2.48 33%RFC 0.4808 No TF 4.18 4.40 3.14 2.48 33%NIC 0.3293 No TL 0.00 0.00 0.05 0.22 -100%
Table 5.38: Analysis of Interface Metrics for Industry Case Study
Interface-Level Metrics
As mentioned in the first section, Java Interfaces were isolated from classes. Thissection reports metrics only for interfaces. The pertinent interface-level metrics areexpanded in Table 5.3 and defined in Appendix D.
Table 5.38 presents the results of the statistical analysis of the interface-levelmetrics comparing test-last and test-first interfaces.
Project-Level Metrics
The project-level metrics are reported in Table 5.39. The data is reported in sortedorder by %difference. From this view one notices that the test-last projects tend tobe larger and more complex (LOC, MLOC, VG) and the test-first projects tend to bemore abstract (RMA, NOI) and have higher coupling (IF, FO, CBO). Only two metrics,both size metrics, are statistically significant at the project level.
5.6.3 Test Results
Table 5.40 presents the results of the statistical analysis of the test coverage met-rics comparing test-last and test-first projects that contained automated tests. Thefirst two columns of data compare three test-last and three test-first projects. Thelast two columns of data include a fourth test-last project (named “Common”). Thisfourth test-last project was significantly larger than the other six projects consid-ered, and it had significantly lower test-coverage measures. The table illustrates
110

TF TF TL TL HigherMetric p-value Sig? Mean StdDev Mean StdDev Method %diff
Two-sample t-testNSFavg 0.0235 Yes 0.15 0.25 5.56 7.13 TL -97%NOAavg 0.0564 No 0.33 0.58 2.58 3.53 TL -87%VGmax 0.0926 No 7.00 1.73 26.08 35.79 TL -73%LOC/Mod 0.0373 Yes 21.26 4.46 37.84 23.08 TL -44%CAavg 0.2544 No 4.58 1.66 7.45 7.64 TL -39%RMDavg 0.3765 No 0.22 0.15 0.33 0.26 TL -34%MLOCavg 0.4871 No 4.27 1.74 5.53 4.97 TL -23%CEavg 0.7899 No 4.67 3.79 5.44 5.77 TL -14%REU 0.8645 No 0.06 0.09 0.08 0.09 TL -14%VGavg 0.4255 No 1.70 0.32 1.97 0.91 TL -14%RMIavg 0.4357 No 0.52 0.11 0.59 0.25 TL -13%LCOMavg 0.9403 No 0.34 0.30 0.35 0.15 TL -4%NOCavg 0.9311 No 0.34 0.14 0.34 0.21 TF 3%NOFavg 0.9322 No 3.28 3.03 3.11 2.51 TF 6%NBDavg 0.3142 No 1.31 0.08 1.24 0.19 TF 6%FIavg 0.7333 No 2.06 0.59 1.91 0.80 TF 8%DITavg 0.7759 No 0.49 0.30 0.42 0.33 TF 14%NOMavg 0.7711 No 10.09 6.87 8.75 3.50 TF 15%CBOavg 0.5225 No 3.84 1.16 3.29 1.47 TF 17%FOavg 0.3602 No 1.78 0.58 1.38 0.67 TF 30%IFavg 0.7429 No 122.80 189.95 79.09 180.64 TF 55%PARavg 0.2826 No 0.97 0.42 0.61 0.27 TF 58%RMAavg 0.2175 No 0.29 0.18 0.11 0.11 TF 165%SPC 0.5179 No 13.00 18.36 4.73 5.50 TF 175%NOIavg 0.1155 No 1.08 0.52 0.36 0.60 TF 201%SIXavg 0.3258 No 0.74 0.68 0.24 0.32 TF 212%
Table 5.39: Analysis of Project Metrics for Industry Case Study
111

Line BranchLine Branch w/Common w/Common
Two-sample t-testp-value 0.0123 0.0003 0.0000 0.0000Significant? Yes Yes Yes YesHigher Method TF TF TF TFTF Mean 0.76 0.88 0.76 0.88Std Dev 0.30 0.32 0.30 0.32TL Mean 0.59 0.50 0.23 0.20Std Dev 0.39 0.49 0.36 0.39%difference 30% 78% 233% 344%
Table 5.40: Analysis of Test Coverage Metrics for Industry Projects with AutomatedTests
Project Approach Line Branch
Scanners TF 72% 94%Part Number Advanced Search, Part II TF 98% 100%Pagination TF 79% 100%Common TL 7% 8%Common Paramater TL 34% 39%Workflow TL 31% 24%Conformity Request Tracking TL 84% 74%
Table 5.41: Test Coverage Metrics for Industry Projects with Automated Tests
that even excluding this project, the test-first projects had significantly higher test-coverage both for line and branch coverage.
Table 5.41 presents the actual test coverage results for the seven projects withautomated unit tests. Table 5.42 presents additional test metrics for eight projectswith automated unit tests. The extra project PDD was not included earlier becausecoverage metrics were unable to be obtained. This data reveals that in the test-firstprojects, developers wrote significantly more testing code. This is demonstrated inthe test to source ratio. However, it is interesting to note that the test-first projectsdid not contain a significantly higher number of assert statements per LOC, class,or method. Combining this fact with the significantly higher test coverage of thetest-first projects and one might conclude that the test-first tests are of a higherquality (higher coverage), and they are more efficient (higher coverage with the samenumber of asserts), but that they may have required more effort (higher test LOC).
112

Project Approach SLOC TestLOC T/S Ratio
Scanners TF 1559 1683 1.08Part # Adv Search, Part II TF 842 1118 1.33Pagination TF 349 511 1.46Common TL 7807 473 0.06Common Parameter TL 678 150 0.22PDD TL 427 91 0.21Workflow TL 811 708 0.87Conformity Req Tracking TL 2071 1253 0.61
Two-sample t-testp-value 0.3660 0.2347 0.0031Significant? No No YesHigher Method TL TF TFTF Mean 916.67 1104.00 1.29Std Dev 608.45 586.13 0.20TL Mean 2358.80 535.00 0.39Std Dev 3111.20 472.93 0.33%difference -61% 106% 227%
Table 5.42: Test/Source Ratio Metrics for Industry Projects with Automated Tests
#Asserts/ #Asserts/ #Asserts/Project #Asserts LOC Class Method
Scanners 162 0.10 4.38 1.12Part # Adv Search, Part II 265 0.24 9.46 2.60Pagination 57 0.11 2.28 1.54Common 74 0.16 2.96 1.10Common Parameter 37 0.25 4.11 3.70PDD 7 0.08 1.75 0.70Workflow 116 0.16 5.04 1.45Conformity Req Tracking 108 0.09 3.00 1.06
Two-sample t-testp-value 0.2572 0.9687 0.4496 0.8372Significant? No No No NoHigher Method TF TF TF TFTF Mean 161.33 0.15 5.37 1.75Std Dev 104.00 0.08 3.69 0.76TL Mean 68.40 0.15 3.37 1.60Std Dev 46.43 0.07 1.25 1.20%difference 136% 2% 59% 9%
Table 5.43: Test Saturation Metrics for Industry Projects with Automated Tests
113

Chapter 6
Experiments in Academia
This chapter summarizes research conducted with student programmers in fivecourses at the University of Kansas. The five controlled experiments will be pre-sented starting with the software engineering experiments. In order to increasesample size and corresponding confidence in the results, data from the undergrad-uate and graduate software engineering experiments will be combined and againanalyzed in section 6.4. The Programming 1 and 2 experiments will be presentedlast. Section 6.6 will present the results from two experiments conducted in theProgramming 2 course in Fall 2005 and Spring 2006.
The chapter begins with a description of the metrics collected and the corre-sponding analysis performed. Each experiment and corresponding results are thendescribed in turn.
6.1 Metrics Collection and Analysis
The projects in the Undergraduate and Graduate Software Engineering courses arecomparable to those in Chapter 5 in that they used the Java Programming Lan-guage, the Eclipse IDE, and JUnit. In addition, the projects were semester-long teamprojects. As a result the metrics generated and analysis conducted will closely fol-low that of Chapter 5. In addition, productivity, student grade data, and individualpre and post experiment survey data will be analyzed for each experiment.
Unlike the software engineering courses, the Programming 1 and Programming 2projects were completed in the C++ programming language using a non-integrateddevelopment environment and simple assert statements for automated unit testingas described in Chapter 4. Students worked alone on two to three week projects inthese classes. As a result, different metrics tools were used. In particular, CCCC [57]was used to generate some project-level metrics. The same tool was used withthe Java projects. Krakatau Professional [77] was used to generate method, class,and additional project level metrics. These metrics are expanded in Table 6.1 andTable 6.2, and are described in Appendix D. Although many metrics overlap with
114

Metric Equivalent Expanded Name
V(G) V(G) Cyclomatic ComplexityV’(G) Enhanced Cyclomatic ComplexityeV(G) Essential ComplexityOC Operational ComplexityB BUG Halstead Bug PredictionD PD Halstead DifficultyE EFF Halstead EffortEXEC NOS Number of Executable StatementsLOC Lines of CodeN AHL Halstead Program LengthN1 Total Number of OperatorsN2 Total Number of Operandsn VOC Halstead Program Vocabularyn1 Number of Unique Operatorsn2 Number of Unique OperandsV VOL Halstead Program VolumeNEST NBD Maximum Number of LevelsNION Number of Input/Output NodesNP PAR Number of ParametersBRANCH Number of Branching NodesCDENS Control DensityCONTROL Number of control statementsNSC Number of SemicolonsNSTAT Number of StatementsRLOC Relative Lines of CodeSLOC Source Lines of Code
Table 6.1: C++ Method-level Metrics
the Java-based experiments, a few are different. The “Equivalent” column givesthe equivalent metric abbreviation from the Java-based experiments as described inTable 5.1, Table 5.2, and Table 5.4.
Productivity, student grade data, and individual pre and post experiment surveydata will be analyzed for each experiment. In addition, a longitudinal survey will beanalyzed. This survey was administered over the web in the subsequent semesterwith all students except the Programming 2 Spring 2006 students.
Test volume metrics will be evaluated for all experiments, but test coverage willnot be presented for the Programming 1 and 2 experiments as discussed in sec-tion 4.2.7. The analysis techniques will be the same as those used in Chapter 5.
115

Metric Equivalent Expanded Name
DIT DIT Depth of Inheritance TreeCBO CBO Coupling Between ObjectsCSA NIV+NSV Class Size (Attributes)CSAO Class Size (Attributes & Operations)CSI Class Specialization IndexCSO NOM Class Size (Operations)LCOM LCOM Lack of Cohesion of MethodsLOC Lines of CodeNAAC Number of Attributes AddedNAIC Number of Attributes InheritedNOAC Number of Operations AddedNOIC Number of Operations InheritedNOOC NORM Number of Operations OverriddenNPavgC PARAvg Average Number of Method ParametersOSavg MLOC Average Operation SizePA Private Attribute UsagePPPC Percentage Public/Protected MembersRFC RFC Response for ClassSLOC SL Source Lines of CodeTLOC TL Total Lines of CodeWMC WMC Weighted Methods in Class
Table 6.2: C++ Class-level Metrics
116

6.2 Undergraduate Software Engineering Experiment
This section presents results from the first academic study conducted in Summer2005 with undergraduate students in an upper-level software engineering courseat the University of Kansas. Results from this experiment were presented in April2006 at the Conference on Software Engineering Education and Training [49] atTurtle Bay, Hawaii.
6.2.1 Experiment Design and Context
This section will repeat and expand the experiment design and context presentedin section 4.2.5.
Students were asked to design and build an HTML pretty print system as de-scribed in Appendix B.1.6. This system was to take an HTML file as input and trans-form the file into a more human readable format by performing operations such asdeleting redundant tags and adding appropriate indentation. A sample applicationwith a graphical user interface is shown in Figure 4.30.
Students were taught and asked to follow a simplified form of the Unified Processincluding inception, elaboration, construction, and transition stages. The projectschedule was divided into two iterations with the first focusing on a text-based userinterface and a partial set of features. The second iteration added a graphical userinterface and additional features.
Students were asked to complete the pre-experiment survey and then were taughthow to write automated unit tests with the JUnit framework. All students were in-structed in how to write software in a test-first and test-last manner. The total timespent on JUnit and test-first/test-last programming training was less than one and ahalf hours. Students were then divided into three groups: two groups were to com-plete the project with a test-first approach and the third group was to complete theproject with a test-last approach. Students were allowed to self-select their teams,but Java programming experience was established as a blocking variable to ensurethat each team had at least one member with reasonable previous Java experience.Test-first/test-last team assignments were made after analyzing the pre-experimentquestionnaire to ensure the teams were reasonably balanced.
In actuality, only one team of three students applied test-first programming. Asecond “test-first” team of four students actually applied test-last programming.Despite being instructed to write automated unit tests, the final test-last team ofthree students reported that they “ran out of time” and performed only manualtesting. This team will be labeled the “No-Tests” team.
All teams completed a software requirements specification and a high-level ar-chitectural design. The test-last teams were asked to complete a detailed designprior to completing any significant coding. The test-first teams on the other handwere asked to use the test-first approach to allow the detailed design to emerge
117

Metric NOS NOE V(G) PL AHL VOC VOL
Analysis of Variance (ANOVA) ResultsNOS NOE V(G) PL AHL VOC VOL
F-ratio 5.9081 10.175 5.2868 4.9133 8.2043 4.6326 7.9815p-value 0.0161 0.0017 0.0227 0.028 0.0047 0.0328 0.0053Significant? Yes Yes Yes Yes Yes Yes Yes
Two-sample t-testp-value 0.0200 0.0033 0.0299 0.0323 0.0075 0.0368 0.0084df 132 99 115 140 108 145 107Significant? Yes Yes Yes Yes Yes Yes YesHigher Method TL TL TL TL TL TL TLTF Mean 7.43 0.02 2.02 63.18 43.77 17.40 212.36Std Dev 10.12 0.15 1.87 69.66 56.27 13.70 327.45TL Mean 12.15 0.15 2.97 91.11 82.51 22.57 438.82Std Dev 15.19 0.36 3.45 95.17 115.27 17.78 686.80%difference -39% -86% -32% -31% -47% -23% -52%
Table 6.3: Analysis of Method Metrics for Undergraduate SE Experiment, Part 1
as the software was developed. The test-first teams were asked to document theirdetailed design after the code was developed.
Student programmers used the Java Programming Language, the JUnit unit test-ing framework, and the Eclipse integrated development environment. Studentssubmitted electronic time sheets (see Appendix B for a sample) and software ona weekly basis. They presented their projects in the final class period and thencompleted the post-experiment survey after seeing each others presentations.
6.2.2 Internal Quality Results
This section reports, compares, and describes the internal design quality metricresults. The metrics are categorized at the method, class, and project level. An ad-ditional micro-evaluation of the one test-first project examines differences betweencode covered by tests and untested code.
Method-Level Metrics
Table 6.3 and Table 6.4 present the results of the statistical analysis of the method-level metrics comparing the test-first and test-last methods. A total of ninety-eighttest-first methods were compared to seventy-nine test-last methods.
This analysis demonstrates statistically significant differences with ten of thefourteen metrics. Figure 6.1 illustrates the differences in a radar chart. Each of the
118

Metric LVL PD EFF BUG MLOC NBD PAR
Analysis of Variance (ANOVA) ResultsF-ratio 1.1375 7.6426 8.0947 7.981 3.1153 0.0048515 1.0382p-value 0.2877 0.0063 0.005 0.0053 0.0795 0.9446 0.3098Significant? No Yes Yes Yes No No No
Two-sample t-testp-value 0.2866 0.0103 0.0098 0.0084 0.0824 0.9447 0.3093df 166 102 85 107 141 153 156Significant? No Yes Yes Yes No No NoHigher Method TF TL TL TL TL TL TLTF Mean 0.37 5.79 2.41 0.07 9.48 2.02 0.62Std Dev 0.32 5.11 6.52 0.11 12.93 1.26 0.99TL Mean 0.31 9.54 10.89 0.15 13.71 2.04 0.78Std Dev 0.31 11.86 27.89 0.23 17.17 1.38 0.95%difference 16% -39% -78% -52% -31% -1% -20%
Table 6.4: Analysis of Method Metrics for Undergraduate SE Experiment, Part 2
metrics has been normalized by multiplying the metric mean for each group (test-first and test-last) by a normalizing factor. The normalizing factor is calculated bydividing the maximum mean of all metrics by the maximum mean of the two (test-first and test-last) groups for the metric being plotted. This chart demonstrates thedegree and consistency by which the means of the test-last and test-first metricsvaried.
This data implies and the radar chart illustrates that software developed witha test-last approach is significantly larger (NOS, PL, AHL, VOC, and VOL), is signifi-cantly more complex (V(G), PD, NBD), and is less maintainable (PD, EFF, BUG) thansoftware developed with a test-first approach.
Class-Level Metrics
Table 6.5 presents the results of the statistical analysis of the class-level metricscomparing the test-last and test-first classes in sorted order by %difference withthe middle metrics eliminated for space. To save space, only the two-sample t-testp-values are reported. Although the ANOVA results strengthen the confidence, thet-test should be sufficient here to indicate significant differences between the twosamples.
Only five of the metrics demonstrated statistically significant differences. How-ever, this view illustrates some trends. The test-last classes tend to be larger andmore complex (NOS, V(G), WMC, VOL, BUG) and the test-first classes possibly tendto have better reuse (NII, FI) and perhaps be less cohesive (LCOM) and have highercoupling (FO, FI).
119

Higher TF TF TL TLMetric p-value Sig? Method Mean SDev Mean SDev %diff
NSV 0.2889 No TL 0.00 0.00 0.73 2.58 -100%NOEAvg 0.0197 Yes TL 0.01 0.05 0.30 0.43 -97%NOE 0.0526 No TL 0.09 0.43 0.80 1.26 -89%EFF 0.1046 No TL 10.17 17.11 57.37 104.63 -82%NSM 0.2523 No TL 0.23 0.53 1.27 3.35 -82%EFFAvg 0.1011 No TL 3.18 9.07 17.14 30.13 -81%VOLAvg 0.0745 No TL 223.17 427.58 620.51 738.73 -64%BUGAvg 0.0745 No TL 0.07 0.14 0.21 0.25 -64%AHLAvg 0.0653 No TL 43.84 68.08 113.08 125.32 -61%VOL 0.1246 No TL 897.71 1571.24 2311.10 3147.90 -61%BUG 0.1245 No TL 0.30 0.52 0.77 1.05 -61%PDAvg 0.0636 No TL 4.84 4.65 11.86 13.12 -59%AHL 0.1383 No TL 185.05 327.41 434.53 565.09 -57%PLAvg 0.0558 No TL 55.34 82.53 115.16 93.93 -52%PD 0.2099 No TL 24.48 44.03 50.25 68.19 -51%NOS 0.1626 No TL 31.41 49.79 64.00 77.08 -51%NOSAvg 0.1268 No TL 8.05 12.92 15.95 16.19 -50%WMC 0.2644 No TL 8.55 12.63 15.67 21.65 -45%V(G) 0.2644 No TL 8.55 12.63 15.67 21.65 -45%PL 0.2404 No TL 267.07 535.37 479.83 527.54 -44%VOCAvg 0.0380 Yes TL 15.10 14.37 26.86 17.15 -44%VOC 0.3158 No TL 73.55 143.84 118.87 124.84 -38%NPM 0.5753 No TL 1.68 5.65 2.67 4.86 -37%BL 0.1835 No TL 16.00 9.91 25.15 21.26 -36%V(G)Avg 0.2426 No TL 2.16 2.13 3.37 3.50 -36%
CL 0.2914 No TF 61.36 45.04 42.31 40.32 45%CD 0.0060 Yes TF 0.40 0.09 0.27 0.12 47%FI 0.2198 No TF 2.05 2.21 1.33 1.23 53%PFI 0.2198 No TF 2.05 2.21 1.33 1.23 53%PFO 0.3184 No TF 2.09 3.07 1.33 1.40 57%NIV 0.5126 No TF 2.32 5.35 1.47 2.29 58%LVLAvg 0.0045 Yes TF 0.46 0.20 0.27 0.18 72%LCOM_LH 0.2815 No TF 2.45 4.33 1.40 0.99 75%NOF 0.2051 No TF 4.64 6.95 1.69 2.39 174%NLC 0.4854 No TF 0.50 2.35 0.13 0.52 275%NAC 0.4854 No TF 0.50 2.35 0.13 0.52 275%NII 0.0063 Yes TF 0.55 0.51 0.13 0.35 309%LCOM_CK 0.3006 No TF 19.68 76.71 2.27 5.42 768%
Table 6.5: Sorted Class Metrics for Undergraduate SE Experiment
120

NOS
NOE
V(G)
PL
AHL
VOC
VOL
LVL
PD
EFF
BUG
MLOC
NBD
PAR
TFTL
Figure 6.1: Undergraduate SE Experiment Method Metrics Radar Chart
Project-Level Metrics
The project-level metrics are reported in Table 6.6. The data is reported in sortedorder by %difference. From this view one notices that the test-last projects tend tobe larger and more complex (LOC, MLOC, VG) and the test-first projects tend to havehigher coupling (IF, FO, CBO) and better cohesion (LCOM).
Analysis of Tested Code
An additional micro-evaluation was performed on the test-first code. Code that wascovered by automated unit tests was separated from code not covered by any tests.Table 6.7 reports differences with Weighted Methods per Class (WMC), CouplingBetween Objects (CBO), Nested Block Depth (NBD), Computational Complexity, andNumber of Parameters. All values for the 28% of methods that were tested directlyare within normal acceptable levels, but values for NBD, Complexity, and # Param-eters are flagged with warnings in the untested code. The tested methods had acomplexity average 43% lower than their untested counterparts. This difference isapproaching statistical significance at p=.08. In addition, tested classes had 104%lower coupling measures than untested classes.
6.2.3 Productivity
Table 6.8 summarizes the functionality implemented by the three teams. The test-first team implemented about twice as many features (12) as the no-tests and test-
121

TF TL TL HigherMetric Mean Mean StdDev Method %diff
NSFavg 0.00 0.79 1.11 TL -100%VGavg 2.44 3.96 3.63 TL -38%LOC/Mod 32.91 52.68 13.45 TL -38%MLOCavg 9.79 14.24 11.45 TL -31%PARavg 0.63 0.80 0.40 TL -21%VGmax 13.00 15.50 16.26 TL -16%NBDavg 2.06 2.10 1.28 TL -2%RMIavg 1.00 1.00 0.00 N/A 0%CAavg 0.00 0.00 0.00 N/A 0%CEavg 0.00 0.00 0.00 N/A 0%NOAavg 0.00 0.00 0.00 N/A 0%REU 0.00 0.00 0.00 N/A 0%SPC 0.00 0.00 0.00 N/A 0%FIavg 1.61 1.32 0.10 TF 22%NOMavg 6.75 4.62 2.90 TF 46%LCOMavg 0.38 0.25 0.25 TF 53%CBOavg 2.75 1.59 0.48 TF 73%SIXavg 0.01 0.00 0.00 TF 100%DITavg 0.04 0.00 0.00 TF 100%NOCavg 0.07 0.00 0.00 TF 100%RMDavg 0.08 0.00 0.00 TF 100%RMAavg 0.08 0.00 0.00 TF 100%NOIavg 1.00 0.00 0.00 TF 100%IFavg 2.93 0.00 0.00 TF 100%NOFavg 4.50 1.77 1.50 TF 154%FOavg 1.14 0.27 0.38 TF 324%
Table 6.6: Analysis of Project Metrics for Undergraduate SE Experiment
WMC CBO NBD Complexity #ParametersCode mean max mean max mean max mean max mean max
Tested 7.80 21 2.2 3 1.50 3 1.77 5 1.00 3Untested 13.55 53 4.5 20 2.20 6 2.53 13 0.48 6
Table 6.7: Metrics on Tested and Untested code of Test-First Project
122

Feature Test-First No-Tests Test-Last
remove xml data Yes w/defects No Nosplit long lines Yes Yes Yesindent tags Yes Yes w/defects Yesremove redundant tags Yes No Noremove carriage returns Yes Yes Yestags on individual lines Yes No Yes w/defectsremove extra whitespace Yes Yes Yessimplify empty tags Yes No Nomake tag case consistent Yes No Notext ui Yes Yes Yesgraphical ui Yes No Nouser can modify parameters Yes No No#Features Provided 12 5 6#Features Provided w/no defects 11 4 5
Table 6.8: Features Implemented
Team Total Effort Dev Effort Dev Effort/LOC Dev Effort/Feature
Test-First 6504 2239 2.13 186.58No-Tests 11385 7340 7.38 1468.00Test-Last 4450 2575 9.94 429.17
Table 6.9: Undergraduate SE Effort in Minutes
last teams (5 and 6), with similar numbers of defects. In addition, the test-first teamwas the only one to complete the graphical user interface. Despite implementingmore features, the test-first team did not invest the most time of all the teams.
Table 6.9 reports the amount of time each team spent on the project. Totaleffort includes time spent on all project activities including general meetings andresearch. Dev(elopment) Effort includes only time spent directly on the projectincluding analysis, design, code, test, fix, and review.
The test-first team spent less effort per line-of-code and they spent 88% less ef-fort per feature than the no-tests team, and 57% less effort per feature than thetest-last team. This data supports the rejection of the P1 null hypothesis, making itlikely that test-first programmers are more productive than test-last programmers.Individual productivity is known to vary widely among programmers so it is cer-tainly possible that the test-first team was blessed with one or more highly produc-tive programmers. However, the pre-experiment questionnaire indicates that therewas no statistically significant difference in the academic or practical backgroundof the teams.
Student-reported major and overall GPA’s were all above 2.5 and GPA differences
123

Figure 6.2: Undergraduate SE Time Distribution by Team
between the three teams was not statistically significant (all p>0.55). Students hadalmost identical backgrounds in C++ and a similar mix of experiences with othernon-Java programming languages. While the test-first team did report slightly moreJava programming experience, an analysis of variance did not indicate a significantdifference (ANOVA p=.247). Furthermore a two-sample t-test between each set ofteams showed no significant difference between the test-first and no-tests (p=0.62)and the test-first and test-last (p=0.16) teams.
Figure 6.2 displays how the teams spent their time on various phases of projectdevelopment. The chart displays times by phase as percentages of each team’s totaltime. Interestingly, while the test-first team wrote more tests (see next section), theyreported less time testing. Most likely they were unable to distinguish testing fromcoding because of the constant intermixing of the two.
Because the test-first team reported almost no time on analysis, we might as-sume that they performed analysis in what they call design. We note the significantanalysis and design investment of the no-tests team. Because the test-last team wasoriginally instructed to use a test-first approach, it is no surprise that the test-firstand test-last teams had similar proportions of time spent in analysis and design.
Because the project was time-bound by the class, teams were required to turnin their applications whether they thought they were complete or not. The authorobserved the teams on the final day prior to the project presentations. The test-last team was removing all code related to their graphical user interface because itwas not working. The no-tests team was still debugging code, dreary-eyed from alack of sleep. The test-first team was polishing their presentation for the next day.It is likely that the number of features and the portion of test and fix time would
124

Team # of classes LOC Test LOC LOC/method LOC/feature
Test-First 13 1053 168 12.10 87.75Test-First(less GUI) 11 670 168 11.75 55.83No-Tests 7 995 0 27.64 199.00Test-Last 4 259 38 7.40 43.17
Table 6.10: Undergraduate SE Code Size Metrics
have increased for the no-tests and the test-last team had students been allowed tofinish late. Students observed each other’s experiences and, while anecdotal, thisobservation complements the presented data and may account for differences inprogrammer perceptions discussed later.
Table 6.10 reports the size of the code implemented in terms of number ofclasses and lines of code. For comparison, we also give the code size of the Test-First application with only the text user interface. While the Test-First applicationimplemented more additional features besides the graphical user interface, the GUIwas a significant feature and this allows a more consistent comparison with the twoteams that only implemented a text user interface.
The test-first team implemented more code than the other two teams. We notethat both the test-first and test-last teams have a reasonable average method sizeand lines-of-code per feature, but the no-tests team apparently wrote long methodsand implemented an excessive amount of code for the provided functionality.
6.2.4 Test Results
This section presents the test density and coverage measurements for the under-graduate software engineering experiment. Table 6.11 presents the testing metricsfor the test-first and test-last projects. Recall that the third team wrote no auto-mated tests so they are not included here. Table 6.12 presents the testing metricscomparing the test-first project without the GUI with the test-last project. As men-tioned in the previous section, the test-first team was the only one to implementboth the textual and graphical user interface. Given that GUI’s are traditionally dif-ficult to implement, and that students were not taught techniques for testing GUI’s,it is not surprising that test coverage was poor on the GUI code.
The test-first metrics are better in all measures except asserts per lines of codeand asserts per class. When the GUI code is excluded, the test-first metrics are sub-stantially better with conditional coverage almost doubling the test-last numbers.Unfortunately the coverage metrics are still quite low with none of the values ex-ceeding 50%. Considering this was the student’s first exposure to automated unittesting, perhaps this is acceptable. As the graduate software engineering and theindustry experiments demonstrate, good coverage is attained with maturity.
125

Metric TF TL Higher Method %diff
T/S Ratio 0.16 0.15 TF 9%#Asserts/LOC 0.03 0.03 TL -2%#Asserts/Class 1 1.75 TL -43%#Asserts/Method 0.32 0.2 TF 61%Line Coverage 28% 25% TF 13%Cond Coverage 20% 15% TF 31%
Table 6.11: Test Metrics for Undergraduate SE Experiment
Metric TF TL Higher Method %diff
T/S Ratio 0.25 0.15 TF 71%#Asserts/LOC 0.17 0.03 TF 517%#Asserts/Class 2.55 1.75 TF 45%#Asserts/Method 1.56 0.2 TF 678%Line Coverage 44% 25% TF 77%Cond Coverage 31% 15% TF 99%
Table 6.12: Test Metrics for Undergraduate SE Experiment (Text UI only)
6.2.5 Programmer Perceptions
Pre and post-experiment surveys were administered to all programmers. Compar-isons between the two surveys in Table 6.13 revealed that all three teams perceivedthe test-first approach more positively after the experiment (up to 39% more) andinversely perceived the test-last approach more negatively (up to 30% more). Ta-ble 6.14 reports results from the statistical analysis of the changes from the preto post experiment survey for all responses. This data indicates that the improvedperception of the test-first approach was statistically significant as was an overallshift towards a test-first design approach.
Additionally, 89% of programmers thought test-first produced simpler designs,70% thought test-first produced code with fewer defects, and 75% thought test-firstwas the best approach for this project as illustrated in Figure 6.3.
In the post-experiment survey, all programmers who tried test-first indicated
Test-First Test-LastTeam Pre Post % Change Pre Post % Change
Test-First 3.67 4 9% 3.33 2.33 -30%No-Tests 1.5 2 33% 3.67 3.33 -9%Test-Last 2.33 3.25 39% 4 3.25 -19%
Table 6.13: Programmer Perceptions of Test-First and Test-Last (0 to 4 scale)
126
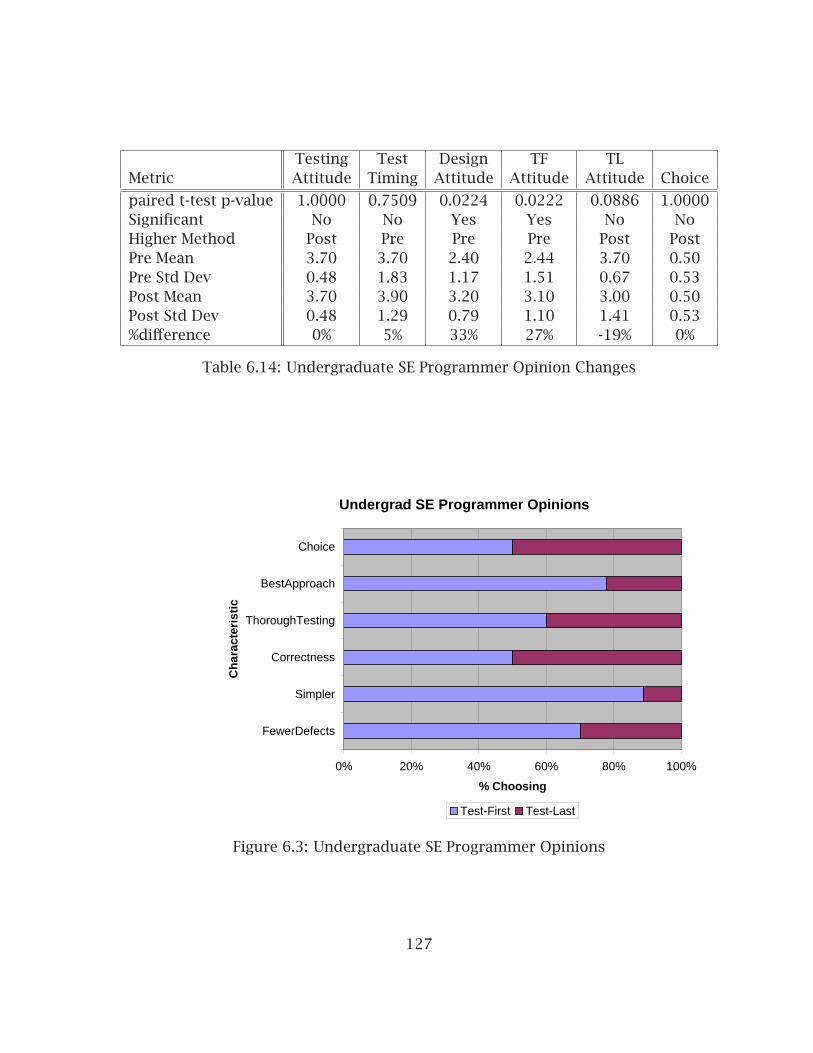
Testing Test Design TF TLMetric Attitude Timing Attitude Attitude Attitude Choice
paired t-test p-value 1.0000 0.7509 0.0224 0.0222 0.0886 1.0000Significant No No Yes Yes No NoHigher Method Post Pre Pre Pre Post PostPre Mean 3.70 3.70 2.40 2.44 3.70 0.50Pre Std Dev 0.48 1.83 1.17 1.51 0.67 0.53Post Mean 3.70 3.90 3.20 3.10 3.00 0.50Post Std Dev 0.48 1.29 0.79 1.10 1.41 0.53%difference 0% 5% 33% 27% -19% 0%
Table 6.14: Undergraduate SE Programmer Opinion Changes
Undergrad SE Programmer Opinions
0% 20% 40% 60% 80% 100%
FewerDefects
Simpler
Correctness
ThoroughTesting
BestApproach
Choice
Ch
arac
teri
stic
% Choosing
Test-First Test-Last
Figure 6.3: Undergraduate SE Programmer Opinions
127

they would use it again, supporting the rejection of the O2 null hypothesis. Allprogrammers from the no-tests team indicated they would prefer to use test-last,causing us to keep the O1 null hypothesis. Comments on their surveys indicatedthat the no-tests programmers are more comfortable with an approach that theyalready know. Programmers from the test-last team were split with half preferringto use test-first on future projects and half choosing test-last.
Programmers were also asked in the post-experiment survey to evaluate theirconfidence in the software they developed. Although most responses were similar,the test-first team did report higher confidence in the ability to make future changesto their software. This difference with the test-last team was nearly statisticallysignificant (p=.059).
6.2.6 Longitudinal Results
This section describes the results from the longitudinal survey. This survey wasadministered via an email request and a web survey late in the Fall 2005 semester.One of the primary goals of the longitudinal survey was to measure voluntary usageof the test-first or test-last approach after having participated in the experiment.
Five of the ten students completed the longitudinal survey. Four of the five pro-grammers reported using the test-first approach on subsequent projects in whichthey had the choice. Similarly, four of the five programmers indicated that theywould choose to use the test-first approach on future projects given the choice.
6.3 Graduate Software Engineering Experiment
This section presents results from the academic experiment conducted in Fall 2005with graduate students in the first course of the Masters in Software Engineeringprogram at the University of Kansas.
6.3.1 Experiment Design and Context
This section will repeat and expand the experiment design and context presentedin section 4.2.5.
This experiment took place in a graduate software engineering course that isthe first course in the Masters of Software Engineering program at the Univer-sity of Kansas. The course is a survey of software engineering and regularly in-cludes a semester-long team-based project. This course met during the Fall 2005semester and used the exact same semester-long project as the undergraduatecourse described in section 4.2.5 and Appendix B.1.6. The pre-experiment survey,TDD training, development process, weekly time sheet and code submissions, and
128

post-experiment survey also matched the same design and schedule as the under-graduate experiment.
The two primary differences from the undergraduate study were the academicand professional experience of the students and the meeting times of the course.All students in the course had completed at least a bachelors degree in a computingrelated field. All but one of the students reported at least one year of experiencein a computing related job and 44% of the students reported at least six years ofexperience in a computing related job. The course met one evening a week for asixteen week semester. The undergraduate course met three days per week for twohours per day in an eight-week summer session.
Students were divided into three teams of three students each. Java program-ming experience was again used as a blocking variable to ensure equitable technicalskills. Two teams were asked to use a test-first approach and one team was askedto use a test-last approach.
Similar to the undergraduate experiment, the test-last team did not accomplishwriting any automated unit tests. Unlike the undergraduate experiment though,both test-first teams were successful in writing automated unit tests. The authorprovided a three-hour guest lecture early in the semester. Because the Java Pro-gramming Language was new for a number of students, the lecture covered someJava fundamentals as well as training on JUnit and test-first and test-last program-ming.
In both the undergraduate and graduate experiments the author offered addi-tional assistance for any students struggling with JUnit and the test-first or test-lastapproach. A few students in both experiments requested minor help through email.One of the test-first teams in the graduate course requested a short (about one hour)hands-on tutorial to get started with JUnit.
Like in the undergraduate experiment, all teams completed a software require-ments specification and a high-level architectural design. The test-last team wasasked to complete a detailed design prior to completing any significant coding. Thetest-first teams on the other hand were asked to use the test-first approach to allowthe detailed design to emerge as the software was developed. The test-first teamswere asked to document their detailed design after the code was developed.
Student programmers used the Java Programming Language, the JUnit unit test-ing framework, and the Eclipse integrated development environment. Studentssubmitted electronic time sheets (see Appendix B for a sample) and software ona weekly basis. They presented their projects in the final class period and thencompleted the post-experiment survey after seeing each others presentations.
6.3.2 Internal Quality Results
This section reports, compares, and describes the internal design quality metricresults. The metrics are categorized at the method, class, and project level.
129

Metric NOS NOE V(G) PL AHL VOC VOL
Analysis of Variance (ANOVA) ResultsNOS NOE V(G) PL AHL VOC VOL
F-ratio 3.629 6.9498 1.0305 1.342 0.44549 2.1411 0.23171p-value 0.0608 0.0103 0.3134 0.2505 0.5066 0.1478 0.6317Significant? No Yes No No No No No
Two-sample t-testp-value 0.0673 0.0830 0.2483 0.1883 0.4290 0.1075 0.5593df 43 23 64 64 68 60 70Significant? No No No No No No NoHigher Method TL TL TL TL TL TL TLTF Mean 20.12 0.00 5.28 136.03 141.00 30.96 812.10Std Dev 23.02 0.00 5.88 153.77 214.08 24.13 1417.37TL Mean 31.17 0.13 6.63 176.15 172.54 39.04 961.10Std Dev 24.04 0.34 3.92 102.43 125.43 17.54 763.97%difference -35% -100% -20% -23% -18% -21% -16%
Table 6.15: Analysis of Method Metrics for Graduate SE Experiment, Part 1
Method-Level Metrics
Table 6.15 and Table 6.16 present the results of the statistical analysis of themethod-level metrics comparing the test-first and test-last methods. A total of fiftytest-first methods were compared to twenty-four test-last methods.
This analysis demonstrates statistically significant differences with only two ofthe fourteen metrics. Figure 6.4 illustrates the differences in a radar chart. Eachof the metrics has been normalized by multiplying the metric mean for each group(test-first and test-last) by a normalizing factor. The normalizing factor is calculatedby dividing the maximum mean of all metrics by the maximum mean of the two(test-first and test-last) groups for the metric being plotted. This chart demonstratesthe degree and consistency by which the means of the test-last and test-first metricsvaried.
Although few of the differences are significant, this data implies and the radarchart illustrates that software developed with a test-last approach is larger (NOS, PL,AHL, VOC, and VOL), more complex (V(G), PD, NBD), and possibly less maintainable(PD, BUG) than software developed with a test-first approach.
Class-Level Metrics
Table 6.17 presents the results of a simple analysis of the class-level metrics com-paring the test-last and test-first classes in sorted order by %difference with themiddle metrics eliminated for space. A statistical analysis makes no sense in this
130

Metric LVL PD EFF BUG MLOC NBD PAR
Analysis of Variance (ANOVA) ResultsF-ratio 3.7641 2.2848 0.011882 0.23151 2.624 1.7494 1.6826p-value 0.0563 0.135 0.9135 0.6319 0.1096 0.1901 0.1987Significant? No No No No No No No
Two-sample t-testp-value 0.0110 0.1132 0.8912 0.5595 0.0967 0.2114 0.2375df 65 53 71 70 50 41 37Significant? Yes No No No No No NoHigher Method TF TL TF TL TL TL TLTF Mean 0.16 17.24 30.45 0.27 22.10 2.74 1.24Std Dev 0.22 17.01 70.80 0.47 28.53 1.74 0.62TL Mean 0.07 23.31 28.79 0.32 33.17 3.33 1.46Std Dev 0.07 14.22 33.32 0.25 25.21 1.95 0.78%difference 122% -26% 6% -15% -33% -18% -15%
Table 6.16: Analysis of Method Metrics for Graduate SE Experiment, Part 2
NOS
NOE
V(G)
PL
AHL
VOC
VOL
LVL
PD
EFF
BUG
MLOC
NBD
PAR
TFTL
Figure 6.4: Graduate SE Experiment Method Metrics Radar Chart
131

case because the test-last team implemented the entire project in one class. Thedata is reported still and some trends can be identified. For instance the test-lastclass tends to be larger and more complex (MLOC, WMC, VOC, V(G)). Data from theundergraduate and graduate software engineering experiments will be combined inthe next section to allow for a statistical analysis.
The test-last software uses a procedural approach. The entire project is imple-mented in a single class. The one class consists of many static methods invokedfrom the main() method. These concerns are reflected in the NSM and MLOC mea-sures.
Project-Level Metrics
The project-level metrics are reported in Table 6.18. The data is reported in sortedorder by %difference. From this view one notices that the test-last projects tend tobe larger (LOC, MLOC), but the test-first project may be more complex (VG).
6.3.3 Productivity Results
This section reports, compares, and describes the volume of code produced and theamount of time students reported they spent on the projects. Unlike the under-graduate experiment, the three teams completed roughly the same project featuresalthough the interface and configurability did vary some between the projects.
Table 6.19 reports the amount of time each team spent on the project. Totaleffort includes time spent on all project activities including general meetings andresearch. Dev(elopment) Effort includes only time spent directly on the projectincluding analysis, design, code, test, fix, and review.
Table 6.20 reports the size of the code implemented in terms of number ofclasses and lines of code. Although LOC can be a poor measure of productivity, itis interesting to see how widely the time to code ratios vary. The test-first teamsinvested roughly half as much development time as the test-last team. One of thetest-first teams wrote nearly 3,000 lines of source and test code, while the otherwrote only a little over 500 lines of source and test code in slightly more develop-ment time. Based on author observations, the Test-First 2 team seemed to strugglemore with mastering the Java Programming Language which could account for thelower code volume. Nonetheless all of the teams managed to complete a core set offunctionality.
The average size of methods suggests that teams using the test-first approachtend to write smaller methods. This was seen in the MLOC, VOL, and VOC metricsreported in previous sections.
Figure 6.5 displays how the teams spent their time on various phases of projectdevelopment. The chart displays times by phase as percentages of each team’s totaltime. This chart visualizes the fact that the two test-first teams had a fairly even
132

Higher TF TF TLMetric Method Mean SDev Mean %diff
NIS TL 0.00 0.00 1.00 -100%NOE TL 0.00 0.00 3.00 -100%NOEAvg TL 0.00 0.00 0.13 -100%NSM TL 1.69 2.36 24.00 -93%CL TL 55.62 41.32 657.00 -92%NOS TL 77.38 60.02 748.00 -90%MLOC TL 85.00 61.84 796.00 -89%SL TL 98.77 72.20 869.00 -89%TL TL 178.46 125.12 1522.00 -88%PD TL 66.29 56.92 559.35 -88%PL TL 523.20 396.49 4227.50 -88%VOC TL 119.08 100.84 937.00 -87%WMC TL 20.31 17.06 159.00 -87%V(G) TL 20.31 17.06 159.00 -87%AHL TL 542.31 391.59 4141.00 -87%NPM TL 1.46 2.76 11.00 -87%VOL TL 3123.47 2437.50 23066.31 -86%BUG TL 1.04 0.81 7.69 -86%NOM TL 3.85 4.85 24.00 -84%EFF TL 117.10 117.59 690.85 -83%WMC TL 35.54 33.33 208.00 -83%NNP TL 2.23 2.31 13.00 -83%BL TL 26.00 17.45 110.00 -76%RFC TL 16.46 6.72 65.00 -75%IFO TL 5.69 3.33 19.00 -70%FO TL 6.85 4.56 20.00 -66%LVL TL 0.63 1.20 1.77 -64%
AHLAvg TF 235.61 168.05 172.54 37%LVLAvg TF 0.10 0.11 0.07 40%VOLAvg TF 1401.40 1131.46 961.10 46%BUGAvg TF 0.47 0.38 0.32 46%EFFAvg TF 56.92 56.58 28.79 98%
Table 6.17: Sorted Class Metrics for Graduate SE Experiment
133
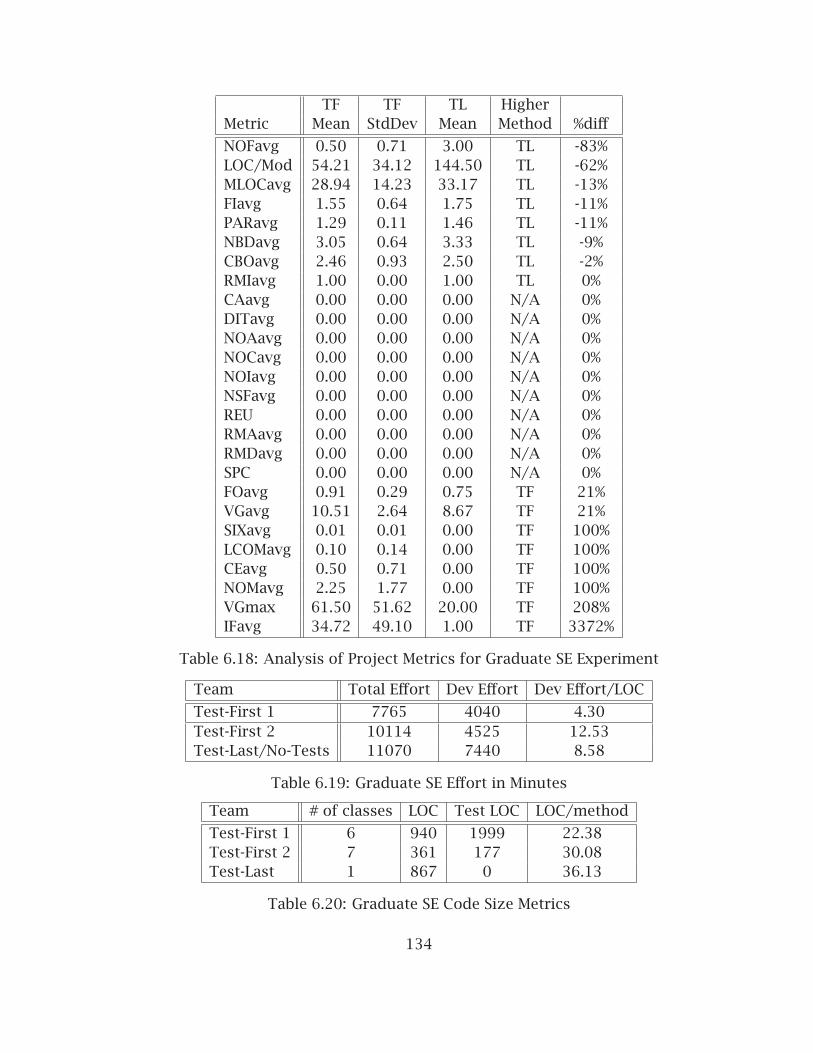
TF TF TL HigherMetric Mean StdDev Mean Method %diff
NOFavg 0.50 0.71 3.00 TL -83%LOC/Mod 54.21 34.12 144.50 TL -62%MLOCavg 28.94 14.23 33.17 TL -13%FIavg 1.55 0.64 1.75 TL -11%PARavg 1.29 0.11 1.46 TL -11%NBDavg 3.05 0.64 3.33 TL -9%CBOavg 2.46 0.93 2.50 TL -2%RMIavg 1.00 0.00 1.00 TL 0%CAavg 0.00 0.00 0.00 N/A 0%DITavg 0.00 0.00 0.00 N/A 0%NOAavg 0.00 0.00 0.00 N/A 0%NOCavg 0.00 0.00 0.00 N/A 0%NOIavg 0.00 0.00 0.00 N/A 0%NSFavg 0.00 0.00 0.00 N/A 0%REU 0.00 0.00 0.00 N/A 0%RMAavg 0.00 0.00 0.00 N/A 0%RMDavg 0.00 0.00 0.00 N/A 0%SPC 0.00 0.00 0.00 N/A 0%FOavg 0.91 0.29 0.75 TF 21%VGavg 10.51 2.64 8.67 TF 21%SIXavg 0.01 0.01 0.00 TF 100%LCOMavg 0.10 0.14 0.00 TF 100%CEavg 0.50 0.71 0.00 TF 100%NOMavg 2.25 1.77 0.00 TF 100%VGmax 61.50 51.62 20.00 TF 208%IFavg 34.72 49.10 1.00 TF 3372%
Table 6.18: Analysis of Project Metrics for Graduate SE Experiment
Team Total Effort Dev Effort Dev Effort/LOC
Test-First 1 7765 4040 4.30Test-First 2 10114 4525 12.53Test-Last/No-Tests 11070 7440 8.58
Table 6.19: Graduate SE Effort in Minutes
Team # of classes LOC Test LOC LOC/method
Test-First 1 6 940 1999 22.38Test-First 2 7 361 177 30.08Test-Last 1 867 0 36.13
Table 6.20: Graduate SE Code Size Metrics
134
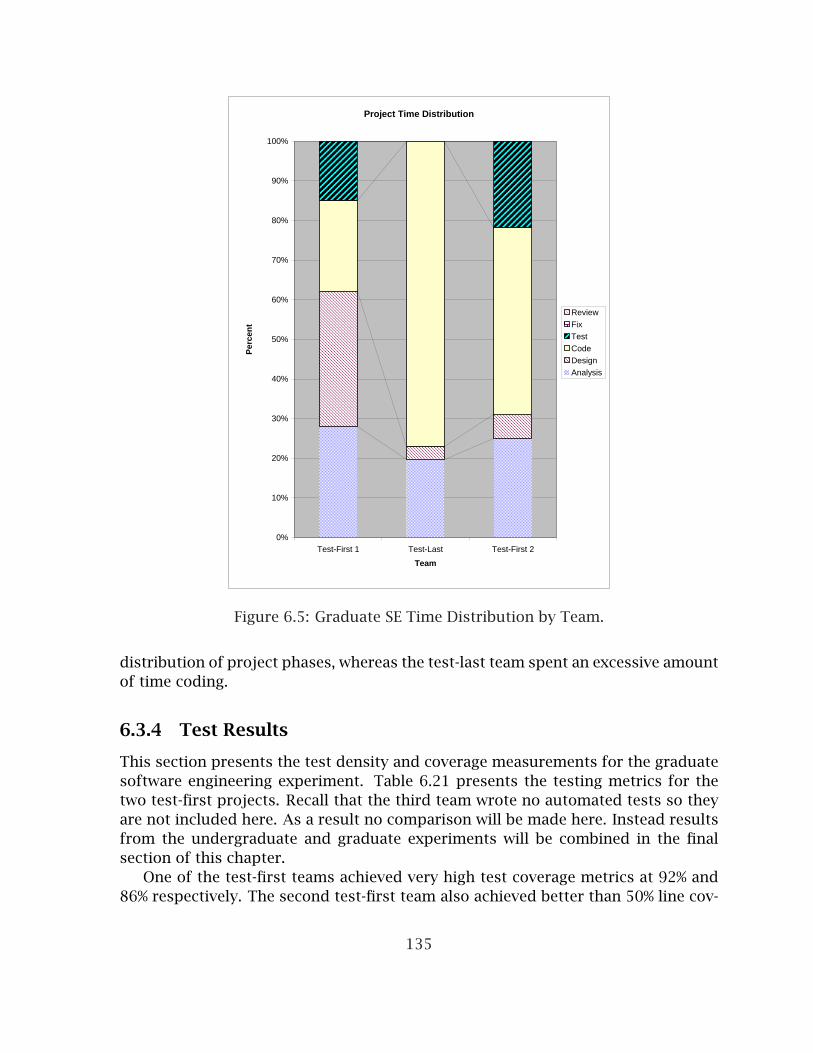
Project Time Distribution
0%
10%
20%
30%
40%
50%
60%
70%
80%
90%
100%
Test-First 1 Test-Last Test-First 2
Team
Per
cen
t
ReviewFixTestCodeDesignAnalysis
Figure 6.5: Graduate SE Time Distribution by Team.
distribution of project phases, whereas the test-last team spent an excessive amountof time coding.
6.3.4 Test Results
This section presents the test density and coverage measurements for the graduatesoftware engineering experiment. Table 6.21 presents the testing metrics for thetwo test-first projects. Recall that the third team wrote no automated tests so theyare not included here. As a result no comparison will be made here. Instead resultsfrom the undergraduate and graduate experiments will be combined in the finalsection of this chapter.
One of the test-first teams achieved very high test coverage metrics at 92% and86% respectively. The second test-first team also achieved better than 50% line cov-
135
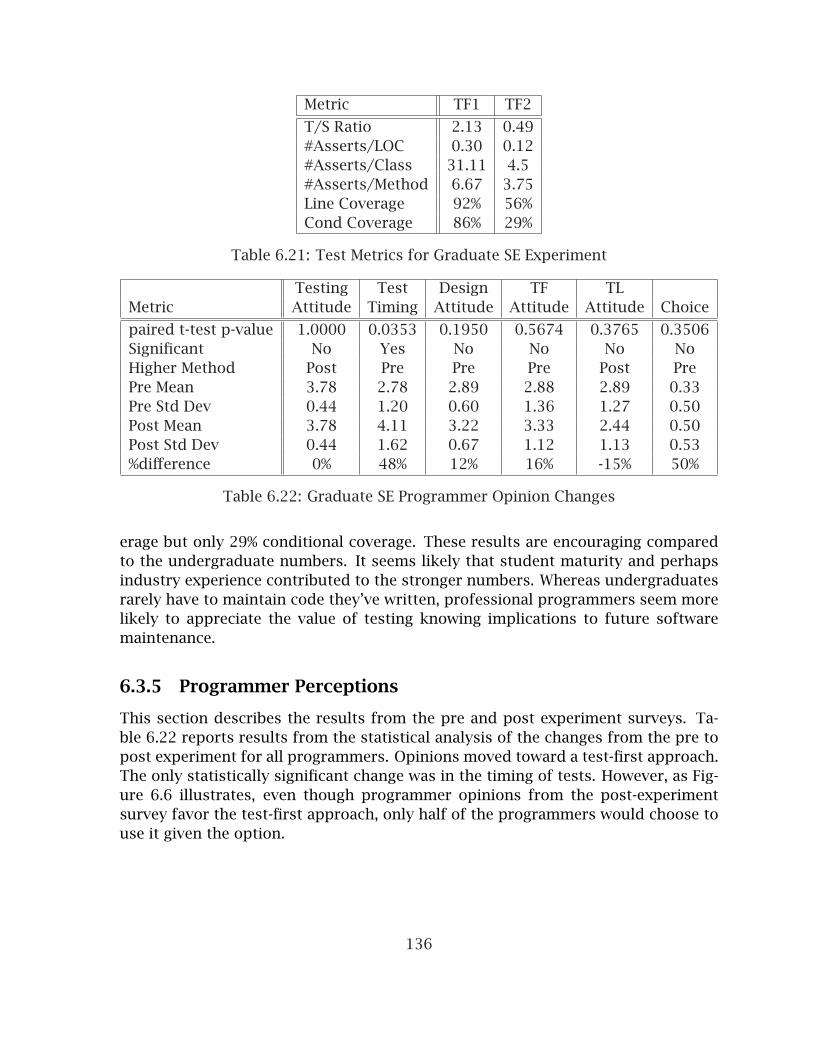
Metric TF1 TF2
T/S Ratio 2.13 0.49#Asserts/LOC 0.30 0.12#Asserts/Class 31.11 4.5#Asserts/Method 6.67 3.75Line Coverage 92% 56%Cond Coverage 86% 29%
Table 6.21: Test Metrics for Graduate SE Experiment
Testing Test Design TF TLMetric Attitude Timing Attitude Attitude Attitude Choice
paired t-test p-value 1.0000 0.0353 0.1950 0.5674 0.3765 0.3506Significant No Yes No No No NoHigher Method Post Pre Pre Pre Post PrePre Mean 3.78 2.78 2.89 2.88 2.89 0.33Pre Std Dev 0.44 1.20 0.60 1.36 1.27 0.50Post Mean 3.78 4.11 3.22 3.33 2.44 0.50Post Std Dev 0.44 1.62 0.67 1.12 1.13 0.53%difference 0% 48% 12% 16% -15% 50%
Table 6.22: Graduate SE Programmer Opinion Changes
erage but only 29% conditional coverage. These results are encouraging comparedto the undergraduate numbers. It seems likely that student maturity and perhapsindustry experience contributed to the stronger numbers. Whereas undergraduatesrarely have to maintain code they’ve written, professional programmers seem morelikely to appreciate the value of testing knowing implications to future softwaremaintenance.
6.3.5 Programmer Perceptions
This section describes the results from the pre and post experiment surveys. Ta-ble 6.22 reports results from the statistical analysis of the changes from the pre topost experiment for all programmers. Opinions moved toward a test-first approach.The only statistically significant change was in the timing of tests. However, as Fig-ure 6.6 illustrates, even though programmer opinions from the post-experimentsurvey favor the test-first approach, only half of the programmers would choose touse it given the option.
136

Graduate SE Programmer Opinions
0% 20% 40% 60% 80% 100%
FewerDefects
Simpler
Correctness
ThoroughTesting
BestApproach
Choice
Ch
arac
teri
stic
% Choosing
Test-First Test-Last
Figure 6.6: Graduate SE Programmer Opinions
6.3.6 Longitudinal Results
A longitudinal survey was administered via an email request and a web survey latein the Spring 2006 semester. One of the primary goals of the longitudinal surveywas to measure voluntary usage of the test-first or test-last approach after havingparticipated in the experiment.
Only three of the nine students completed the longitudinal survey. None of thethree indicated using a test-first or test-last approach with automated unit testson subsequent projects. Two of the three programmers indicated that they wouldchoose to use the test-first approach on future projects given the choice.
6.4 Combined Software Engineering Experiment
The previous two sections reported results from the experiments in the undergrad-uate and graduate software engineering courses. Because the two courses used thesame semester-long project, it seems appropriate to combine the data from thetwo experiments to increase confidence in the analysis. This section will reportthe combined results without repeating all of the experiment descriptions or theproductivity or evaluative results.
137

Metric NOS NOE V(G) PL AHL VOC VOL
Two-sample t-testp-value 0.0479 0.0004 0.1952 0.1079 0.1306 0.0840 0.1914Significant Yes Yes No No No No NoHigher Method TL TL TL TL TL TL TLTF Mean 11.87 0.01 3.16 88.65 77.77 22.14 422.06Std Dev 16.91 0.12 4.08 111.89 141.53 19.10 919.27TL Mean 16.58 0.15 3.83 110.92 103.49 26.41 560.51Std Dev 19.28 0.35 3.87 102.94 123.17 18.98 735.89%difference -28% -90% -17% -20% -25% -16% -25%
Table 6.23: Analysis of Method Metrics for Combined SE Experiments, Part 1
Metric LVL PD EFF BUG MLOC NBD PAR
Two-sample t-testp-value 0.3352 0.0811 0.5467 0.1915 0.1437 0.8054 0.4972Significant? No No No No No No NoHigher Method TF TL TL TL TL TL TLTF Mean 0.29 9.79 12.21 0.14 14.26 2.30 0.86Std Dev 0.30 12.12 44.01 0.31 21.11 1.49 0.92TL Mean 0.26 12.75 15.06 0.19 18.34 2.35 0.94Std Dev 0.29 13.68 30.05 0.25 20.96 1.62 0.96%difference 14% -23% -19% -25% -22% -2% -9%
Table 6.24: Analysis of Method Metrics for Combined SE Experiments, Part 2
6.4.1 Internal Quality Results
This section reports, compares, and describes the internal design quality metricresults. The metrics are categorized at the method, class, and project level.
Method-Level Metrics
Table 6.23 and Table 6.24 present the results of the statistical analysis of themethod-level metrics comparing the test-first and test-last methods. A total of 148test-first methods were compared to 103 test-last methods.
This analysis demonstrates statistically significant differences with only two ofthe fourteen metrics. Figure 6.7 illustrates the differences in a radar chart. Eachof the metrics has been normalized by multiplying the metric mean for each group(test-first and test-last) by a normalizing factor. The normalizing factor is calculatedby dividing the maximum mean of all metrics by the maximum mean of the two(test-first and test-last) groups for the metric being plotted. This chart demonstratesthe degree and consistency by which the means of the test-last and test-first metrics
138

NOS
NOE
V(G)
PL
AHL
VOC
VOL
LVL
PD
EFF
BUG
MLOC
NBD
PAR
TFTL
Figure 6.7: Combined SE Experiments Method Metrics Radar Chart
varied.Although only the differences on size (NOS) and exceptions (NOE) are significant,
this data implies and the radar chart illustrates that software developed with atest-last approach is larger (NOS, PL, AHL, VOC, and VOL), perhaps more robust(NOE), more complex (V(G), PD, NBD), and possibly less maintainable (PD, BUG) thansoftware developed with a test-first approach.
Class-Level Metrics
Table 6.25 presents the results of an analysis of the class-level metrics comparingthe test-last and test-first classes in sorted order by %difference with the middlemetrics eliminated for space. Because the two experiments are combined, sufficientdata exists for a statistical analysis.
The data indicates only a couple of possible trends. It appears that the test-first projects may have better reuse (FI, NII) and the test-last projects throw moreexceptions (NOE) but may be larger (NSV, NSM, NOS, AHL, VOL, PL), may be morecomplex (WMC, V(G)) and may possibly have higher coupling (RFC, IFO). Only theexceptions and comment metric differences are statistically significant.
Project-Level Metrics
The combined project-level metrics are reported in Table 6.26. The data is reportedin sorted order by %difference. From this view one notices that the test-first projectsmay be more abstract (RMA) and have better reuse (NOI, FI), but they may also have
139

Higher TF TF TL TLMetric p-value Sig? Method Mean SDev Mean SDev %diff
NSV 0.2879 No TL 0.00 0.00 0.69 2.50 -100%NIS 0.3332 No TL 0.00 0.00 0.06 0.25 -100%NOEAvg 0.0155 Yes TL 0.01 0.04 0.29 0.42 -98%NOE 0.0198 Yes TL 0.06 0.34 0.94 1.34 -94%NSM 0.2649 No TL 0.77 1.63 2.69 6.54 -71%NOS 0.2386 No TL 48.49 57.54 106.75 186.51 -55%AHL 0.2252 No TL 317.74 388.59 666.19 1075.48 -52%VOL 0.2406 No TL 1724.42 2193.72 3608.30 6014.34 -52%BUG 0.2406 No TL 0.57 0.73 1.20 2.00 -52%PD 0.2704 No TL 40.01 52.55 82.07 143.31 -51%NPM 0.3037 No TL 1.60 4.74 3.19 5.14 -50%PL 0.2243 No TL 362.20 498.28 714.06 1066.57 -49%EFF 0.3521 No TL 49.89 88.37 96.96 187.88 -49%WMC 0.2887 No TL 12.91 15.31 24.63 41.49 -48%V(G) 0.2887 No TL 12.91 15.31 24.63 41.49 -48%VOC 0.2239 No TL 90.46 129.87 170.00 237.45 -47%MLOC 0.3652 No TL 78.42 67.81 132.29 209.35 -41%SL 0.3425 No TL 97.13 85.80 159.50 229.00 -39%NOM 0.2673 No TL 4.09 6.03 6.44 7.22 -37%LCOM_HS 0.4145 No TL 0.21 0.37 0.32 0.49 -35%TL 0.4038 No TL 172.67 133.98 264.14 384.94 -35%CL 0.5524 No TL 58.25 42.20 86.21 168.79 -32%RFC 0.1650 No TL 14.71 15.89 21.75 16.56 -32%IFO 0.1004 No TL 6.03 5.08 8.88 5.74 -32%BL 0.2769 No TL 21.42 15.09 31.21 30.52 -31%LVL 0.5251 No TL 1.20 1.63 1.66 2.59 -27%
NBD 0.1169 No TF 2.81 1.31 2.17 1.10 29%EFFAvg 0.6131 No TF 23.14 43.30 17.87 29.26 30%PFO 0.4551 No TF 1.74 2.73 1.31 1.35 33%CD 0.0261 Yes TF 0.38 0.12 0.28 0.12 33%FI 0.3081 No TF 1.71 1.93 1.25 1.24 37%PFI 0.3081 No TF 1.71 1.93 1.25 1.24 37%NOF 0.5141 No TF 2.38 5.12 1.57 2.34 51%LCOM_LH 0.2699 No TF 2.06 3.65 1.31 1.01 57%NLC 0.5786 No TF 0.31 1.86 0.13 0.50 151%NAC 0.5786 No TF 0.31 1.86 0.13 0.50 151%NII 0.0722 No TF 0.34 0.48 0.13 0.34 174%LCOM_CK 0.2860 No TF 13.40 61.08 2.13 5.26 531%
Table 6.25: Sorted Class Metrics for Combined SE Experiments
140

higher coupling (CBO, FO), be more complex (VG), and be less cohesive (LCOM). Noneof the differences are statistically significant.
6.4.2 Test Results
This section presents the test density and coverage measurements for the combinedundergraduate and graduate software engineering experiments. Table 6.27 presentsthe testing metrics for the test-first and test-last projects.
Line coverage is significantly better in the test-first projects. All other test met-rics are much better in the test-first projects than the test-last projects, althoughthe differences are not all statistically significant. It is clear though that students insoftware engineering courses are much more likely to write more tests with bettertest coverage when using a test-first approach than when using a test-last approach.
6.5 Programming 1 Experiment
This section describes an experiment conducted in the Computer Programming 1(CS1) course in Fall 2005 at the University of Kansas.
6.5.1 Experiment Design and Context
This section will repeat and expand the experiment design and context presentedin section 4.2.5.
This experiment was designed to examine the ability of beginning programmersto adopt the test-first and test-last development approaches, and to determine ifthe approach used affects the quality of software produced at this level.
Figure 4.27 from Chapter 4 illustrates the experiment flow in the CS1 experiment.Because early projects were small and required very little design, this experimentwas conducted in the last half of the CS1 course. After students had completedthree projects and covered topics such as basic syntax, iteration control structures,elementary functions, and simple data structures such as arrays, the author pre-sented a guest lecture. The lecture was presented with the test-driven learningapproach in which automated unit testing using assert statements was introducedin the context of a lecture on functions. Although the TDL approach can be usedthroughout a course, it also seems reasonable to introduce tests when functions areintroduced as they are the primary testable unit. The pre-experiment survey wasadministered at the end of the guest lecture.
The lecture was then followed by two labs developed by the author and taughtby graduate teaching assistants. The first lab introduced automated unit testing inthe context of writing simple functions. The second lab reinforced practice withautomated unit tests in the context of writing recursive functions, using reference
141

TF TF TL TL HigherMetric p-value Sig? Mean StdDev Mean StdDev Method %diff
NSFavg 0.4226 No 0.00 0.00 0.52 0.91 TL -100%LOC/Mod 0.3762 No 47.11 27.08 83.28 53.86 TL -43%NOFavg 0.8360 No 1.83 2.36 2.18 1.27 TL -16%RMIavg N/A No 1.00 0.00 1.00 0.00 N/A 0%CAavg N/A N/A 0.00 0.00 0.00 0.00 N/A 0%NOAavg N/A N/A 0.00 0.00 0.00 0.00 N/A 0%REU N/A N/A 0.00 0.00 0.00 0.00 N/A 0%SPC N/A N/A 0.00 0.00 0.00 0.00 N/A 0%PARavg 0.8858 No 1.07 0.39 1.02 0.48 TF 5%FIavg 0.7427 No 1.57 0.45 1.46 0.26 TF 7%NBDavg 0.8064 No 2.72 0.73 2.51 1.15 TF 8%MLOCavg 0.8717 No 22.56 14.95 20.55 13.60 TF 10%LCOMavg 0.8893 No 0.19 0.19 0.17 0.23 TF 15%NOMavg 0.8064 No 3.75 2.88 3.08 3.36 TF 22%CBOavg 0.2815 No 2.55 0.68 1.89 0.63 TF 35%VGavg 0.5630 No 7.82 5.02 5.53 3.74 TF 41%SIXavg 0.2189 No 0.01 0.01 0.00 0.00 TF 100%DITavg 0.4226 No 0.01 0.02 0.00 0.00 TF 100%NOCavg 0.4226 No 0.02 0.04 0.00 0.00 TF 100%RMDavg 0.4226 No 0.03 0.04 0.00 0.00 TF 100%RMAavg 0.4226 No 0.03 0.04 0.00 0.00 TF 100%CEavg 0.4226 No 0.33 0.58 0.00 0.00 TF 100%NOIavg 0.4226 No 0.33 0.58 0.00 0.00 TF 100%FOavg 0.1164 No 0.98 0.25 0.43 0.39 TF 129%VGmax 0.3991 No 45.33 46.00 17.00 11.79 TF 167%IFavg 0.4042 No 24.12 39.28 0.33 0.58 TF 7137%
Table 6.26: Analysis of Project Metrics for Combined SE Experiments
Line Cond #Asserts/ #Asserts/ #Asserts/Coverage Coverage LOC Class Method
TF Mean 64% 49% 0.20 12.72 3.99Std Dev 25% 32% 0.09 15.96 2.56TL Mean 8% 5% 0.01 0.58 0.07Std Dev 14% 9% 0.02 1.01 0.12%difference 673% 847% 2080% 2080% 5886%Higher Method TF TF TF TF TFp-value 0.0394 0.1372 0.0656 0.3183 0.1174Significant? Yes No No No No
Table 6.27: Test Metrics for Combined SE Experiments
142

parameters, and function overloading. The labs introduced the difference betweentest-first and test-last programming and gave students hands-on experience withboth approaches. Although some TDD training occurred in the lecture prior toadministering the survey, the figure shows the survey coming before the trainingsince most of the training, particularly the hands-on training, occurred after thesurvey in the labs.
After completing the two labs, students were then asked to complete two pro-gramming projects. The first project (Project 4) required students to create a datastructure for representing a three-dimensional point and create functions that op-erate on such points. Functions included adding, subtracting, multiplying, and di-viding points, as well as functions to determine of two points were equal and tocalculate the Euclidean distance and dot product of two points. Students had notbeen introduced to classes so they generally used an array-based data structure andglobal functions in their solutions. As a result object-oriented metrics are not validand will not be reported for this project.
Students with student IDs ending in an even number were asked to complete thefirst project with a test-first approach and students with student IDs ending in anodd number were asked to complete the first project with a test-last approach.
The second project (Project 5) required students to create class-based data struc-tures for representing points and polygons. A textual user interface was to allowusers to specify a number of points in a polygon and the program was to calcu-late the perimeter and area of that polygon. Test-first/test-last assignments wereswitched on the second project so students with student IDs ending in an odd num-ber were asked to complete the second project with a test-first approach and stu-dents with student IDs ending in an even number were asked to complete the secondproject with a test-last approach.
At the beginning of the second project, students were provided with a solu-tion to the first project that included a full set of automated unit tests. The post-experiment survey was then administered in labs following the completion of thesecond project.
6.5.2 Internal Quality Results
This section reports, compares, and describes the internal design quality metricresults. The metrics are categorized at the method, class, and project level. Class-level metrics will only be reported for project 5 as discussed in the previous section.
Method-Level Metrics
Table 6.28 presents the results of the statistical analysis of the method-level metricscomparing the test-first and test-last methods in project 4. These metrics will all
143

Higher TF TF TL TLMetric p-value Sig? Method Mean SDev Mean SDev %diff
NOS 0.2286 No TF 20.19 36.56 17.83 25.02 13%V(G) 0.6470 No TF 2.83 4.26 2.71 3.69 4%AHL 0.8311 No TF 55.59 78.16 54.64 68.09 2%VOC 0.7669 No TF 19.00 14.81 18.75 12.78 1%VOL 0.6573 No TF 267.95 508.83 255.22 427.94 5%PD 0.8628 No TF 5.18 4.36 5.13 3.52 1%EFF 0.3904 No TF 3119.10 15692.34 2403.07 10474.24 30%BUG 0.5351 No TF 0.05 0.10 0.04 0.08 8%MLOC 0.3942 No TF 15.99 25.18 14.81 19.33 8%NBD 0.4801 No TF 0.48 1.55 0.42 1.38 15%PAR 0.0117 Yes TF 2.04 1.31 1.84 1.35 11%
Table 6.28: Analysis of Method Metrics for CS1 Experiment, Project 4
compare with the Java-based method metrics and represent primarily method sizeand complexity.
Figure 6.8 illustrates the differences in a radar chart. Each of the metrics hasbeen normalized by multiplying the metric mean for each group (test-first and test-last) by a normalizing factor. The normalizing factor is calculated by dividing themaximum mean of all metrics by the maximum mean of the two (test-first and test-last) groups for the metric being plotted. This chart demonstrates the degree andconsistency by which the means of the test-last and test-first metrics varied.
This data implies and the radar chart illustrates that software developed with atest-first approach is slightly worse in most metrics than software developed witha test-last approach. Test-first code was slightly larger and more complex and pre-dicted to take more effort. The differences were small and the number of parame-ters was the only metric with a statistically significant difference.
Table 6.29 presents the results of the statistical analysis of the method-levelmetrics comparing the test-first and test-last methods in project 5. Figure 6.9 illus-trates the differences in a radar chart. Interestingly the test-first project methodslook much better in this project. In fact, in eight of the eleven metrics the improve-ments over the test-last methods are statistically significant. This data implies thatbeginning programmers using the test-first approach produce methods with lowersize and complexity in object-oriented projects than methods produced with thetest-last approach. One must question what affect the order of treatments had onthe programmers. This question will be revisited in the testing section a bit later.
144

NOS
V(G)
AHL
VOC
VOL
PDEFF
BUG
MLOC
NBD
PAR
TFTL
Figure 6.8: CS1 Experiment Method Metrics Radar Chart, Project 4
Higher TF TF TL TLMetric p-value Sig? Method Mean SDev Mean SDev %diff
NOS 0.0050 Yes TL 3.87 9.01 5.03 12.87 -23%V(G) 0.0032 Yes TL 1.06 0.79 1.18 1.21 -10%AHL 0.0093 Yes TL 9.06 24.48 13.07 51.38 -31%VOC 0.0161 Yes TL 4.32 8.36 5.12 9.71 -16%VOL 0.0099 Yes TL 38.99 123.42 61.11 289.31 -36%PD 0.0105 Yes TL 1.14 2.86 1.45 3.64 -21%EFF 0.1231 No TL 345.23 2954.57 958.05 14001.03 -64%BUG 0.0228 Yes TL 0.01 0.03 0.01 0.07 -39%MLOC 0.0062 Yes TL 3.23 6.37 4.08 9.84 -21%NBD 0.3250 No TL 0.04 0.35 0.05 0.44 -28%PAR 0.1823 No TF 0.70 1.05 0.66 0.92 7%
Table 6.29: Analysis of Method Metrics for CS1 Experiment, Project 5
145

NOS
V(G)
AHL
VOC
VOL
PDEFF
BUG
MLOC
NBD
PAR
TFTL
Figure 6.9: CS1 Experiment Method Metrics Radar Chart, Project 5
Class-Level Metrics
This section reports the class-level metrics analyzed for the second CS1 project (5).The first project is excluded because solutions were prescribed to be proceduraland not use classes. The second project was the first one in which students usedclasses. This minimizes the relevance of these metrics, but they will be reported forcompleteness. Table 6.30 presents the class metrics in sorted order by % differencesbetween test-first and test-last projects. Metrics with all zero values are omitted forspace.
The data indicates that test-last projects tend to be larger (LOC, CSO) and morecomplex (WMC), but test-first projects tend to have more attributes (CSA) and pa-rameters per method (NP). All differences are small and only the lines-of-code metricdifference is statistically significant.
Project-Level Metrics
A small number of project-level metrics were collected and analyzed for the CS1projects. Many of the project-level metrics are object-oriented metrics and Project 4generally was not solved with objects and Project 5 had only one or two objects persolution. As a result these metrics are sparse. Table 6.31 and Table 6.32 presentthe project-level metrics for the two projects. Differences are small, but do followthe trend of switching from Project 4 to Project 5 along with the correspondingprogrammers as discussed earlier.
146

Higher TF TF TL TLMetric p-value Sig? Method Mean SDev Mean SDev %diff
TLOC 0.1024 No TL 18.87 11.10 24.10 27.26 -22%LOC 0.0254 Yes TL 16.61 4.48 19.13 9.42 -13%Osavg 0.2924 No TL 1.01 0.07 1.13 1.00 -10%WMC 0.2573 No TL 7.66 2.79 8.20 3.65 -7%RFC 0.5605 No TL 7.62 2.73 7.85 2.79 -3%CSO 0.6427 No TL 7.58 2.71 7.76 2.74 -2%NOAC 0.6427 No TL 7.58 2.71 7.76 2.74 -2%PPPC 0.4407 No TL 75.75 9.89 76.83 9.80 -1%SLOC 0.7544 No TL 14.78 3.19 14.91 3.06 -1%CSAO 0.8268 No TF 10.21 3.25 10.11 3.09 1%NPavgC 0.3013 No TF 0.85 0.62 0.78 0.35 9%CSA 0.2164 No TF 2.63 1.83 2.35 1.39 12%NAAC 0.2164 No TF 2.63 1.83 2.35 1.39 12%
Table 6.30: Sorted Class Metrics for CS1 Project 5
Higher TF TF TL TLMetric p-value Sig? Method Mean SDev Mean SDev %diff
LOC/Mod 0.4071 No TF 186.64 76.39 174.75 61.99 7%VGavg 0.5269 No TF 30.49 18.11 28.35 14.39 8%MLOCavg TF 20.46 18.06 13%
Table 6.31: Sorted Project Metrics for CS1 Project 4
Higher TF TF TL TLMetric p-value Sig? Method Mean SDev Mean SDev %diff
MLOCavg TL 4.41 5.62 -22%VGavg 0.1746 No TL 5.05 3.48 5.98 3.37 -16%LOC/Mod 0.1299 No TL 52.72 15.53 59.18 24.16 -11%FIavg 0.8794 No TL 0.46 0.51 0.48 0.52 -3%IFavg 0.9928 No TL 0.10 0.43 0.10 0.44 -1%CBOavg 0.9604 No TL 0.82 0.67 0.83 0.67 -1%FOavg 0.8410 No TF 0.36 0.22 0.35 0.23 3%
Table 6.32: Sorted Project Metrics for CS1 Project 5
147

6.5.3 Test Results
This section reports, compares, and describes the tests written by students in theCS1 projects. Students wrote automated unit tests as assert statements in a sep-arate function. The number of assert statements written were counted and ratioswere calculated for asserts per line-of-code, asserts per class, asserts per module,and asserts per method. The first project was generally solved with a proceduralapproach and the second project expected an object-oriented solution. Hence theobject-oriented metrics were only calculated for the second project.
Many students commented out the assert statements before submitting theirprojects. Due to the large number of project submissions, it was impractical toreinstate and check all tests to see if they passed. As a result, no coverage or testsuccess metrics were collected on the CS1 and CS2 projects. The assert countsincluded all assert statements, whether commented out or not, and were deemed apractical estimation of testing effort.
Table 6.33 reports the testing results for the CS1 projects 4 and 5. The test-first students wrote 52% more asserts in the first project. In the second project,the test-last programmers wrote 39% more asserts. Recall that in the first project,students with ID’s ending in an even number were asked to use a test-first approach.Then in the second project students were asked to switch approaches. This dataindicates that the same programmers wrote more tests in both projects regardlessof the approach they used. Because there were no statistically significant differencesin the two groups, one must question whether the first approach used somehowinfluenced the number of asserts written. Did this group write more asserts becausethey started out using the test-first approach? Did this approach somehow form ahabit or appreciation for writing tests that persisted even when using a test-lastapproach? Additional studies could pursue these questions.
When the results from the two projects are combined, the test-first projects havea 163% higher #Asserts/Module value. This was the only statistically significanttesting metric analyzed.
6.5.4 Productivity Results
This section reports, compares, and describes the volume of code produced andthe amount of time students reported they spent on the projects. The test-firstprogrammers on the first project reported spending 10% more time producing solu-tions that were 7% more lines of code than the test-last programmers. In the secondproject, the test-first programmers reported spending 11% more time producingsolutions that were 11% smaller than the test-last solutions.
Recall the testing results from these two projects indicated that the test-firstprogrammers wrote more tests on the first project and fewer tests on the secondproject. The test lines of code are included in the total lines of code comparisons
148

#Asserts/ #Asserts/ #Asserts/ #Asserts/Metric #Asserts LOC Module Class Method
Project 4p-value 0.1109 0.2555 0.0870Significant? No No NoHigher Method TF TF TFTF Mean 5.85 0.03 5.85Std Dev 6.68 0.03 6.68TL Mean 3.85 0.02 3.72Std Dev 5.28 0.03 5.06%difference 52% 35% 57%
Project 5p-value 0.1094 0.2489 0.1271 0.1025 0.1873Significant? No No No No NoHigher Method TL TL TL TL TLTF Mean 1.89 0.01 0.63 0.96 0.13Std Dev 2.94 0.02 0.98 1.48 0.21TL Mean 3.10 0.02 1.01 1.59 0.20Std Dev 4.18 0.02 1.38 2.10 0.26%difference -39% -28% -38% -39% -32%
Table 6.33: CS1 Test Metrics
149

Higher TF TF TL TLProject p-value Sig? Method Mean SDev Mean SDev %diff
Project 4 0.8516 No TF 95.26 5.72 95.05 5.30 0%Project 5 0.6645 No TL 87.77 13.91 89.04 14.72 -1%
Table 6.34: CS1 Project Evaluations
Quality Changes Reuse
p-value 0.0459 0.0242 0.0233Significant? Yes Yes YesHigher Method TF TF TFTF Mean 3.98 3.90 3.69Std Dev 1.25 1.24 1.34TL Mean 3.25 3.06 2.88Std Dev 1.74 1.76 1.64%difference 22% 27% 28%
Table 6.35: CS1 Programmer Opinions on Project 5
here. This could explain the differences in the size of the solutions. The time dataseems to indicated that beginning test-first programmers take slightly more timecompleting their solutions than the test-last programmers.
6.5.5 Subjective and Evaluative Results
This section presents results on student project grades. Table 6.34 reports resultsfrom an analysis of the grades assigned to the two CS1 projects. Graduate teachingassistants assigned the scores based on a rubric provided by the professor. Com-ponent scores were not tracked. The data indicates virtually no differences betweenthe test-first and test-last groups.
6.5.6 Programmer Perceptions
This section describes the results from the pre and post experiment surveys. Ta-ble 6.35 reports the statistically significant differences on project 5. The test-firstprogrammers indicated that they were more confident that the code they wrote wascorrect (Quality), they were more confident that they could make changes to theircode without breaking things (Changes), and they were more confident that theycould reuse their code in a future project (Reuse). The differences on project 4 werenot statistically significant.
Despite what may have been positive experiences with the test-first approach,Figure 6.10 illustrates from the post experiment survey that only 10% of the CS1
150

CS1 Programmer Opinions
0% 20% 40% 60% 80% 100%
FewerDefects
Simpler
Correctness
ThoroughTesting
BestApproach
Choice
Ch
arac
teri
stic
% Choosing
Test-First Test-Last
Figure 6.10: CS1 Programmer Opinions
programmers indicated that they would choose to use the test-first approach.
6.5.7 Longitudinal Results
This section describes the results from the longitudinal survey. Twenty-eight stu-dents completed the longitudinal survey in late Spring 2006. Ten of the twenty-eight(36%) reported using the test-first approach on a project where they had a choice.This number may be unusually high because many of these students participatedin the CS2 experiment in Spring 2006. Twenty-one reported voluntarily using thetest-last approach on a subsequent project. Only two students (7%) indicated thatthey would choose to use the test-first approach on future projects given the option.The data in this section has demonstrated that beginning programmers are clearlyuneasy about adopting the test-first approach.
6.6 Programming 2 Experiments
This section presents results from the two experiments conducted in the Program-ming 2 (CS2) course at the University of Kansas in fall 2005 and spring 2006. Stu-dents in both experiments were allowed to self-select which approach (test-first ortest-last) they used. Complete results will be presented for the fall 2005 experi-ment. However because only a very small number of students elected to use the
151

test-first approach in the second experiment, only partial results will be reportedfor the spring 2006 experiment.
6.6.1 Experiment Design and Context
This section will repeat and expand the experiment design and context presentedin section 4.2.5.
This experiment was designed to examine the ability of immature programmersto adopt the test-first and test-last development approaches, and to determine if theapproach used affects the quality of software produced at this level. The experimentwas first conducted in Fall 2005 with thirty-six students. The experiment was thenrepeated in Spring 2006 with fifty-four students.
Figure 4.28 from Chapter 4 illustrates the experiment flow in the two CS2 exper-iments. Students were given a very brief (five minutes) introduction to test-first andtest-last programming on the first day of the course, then given the pre-experimentsurvey. Students were introduced to automated unit testing using assert statementsearly in the semester in the third week lab. The lab presented examples and requiredhands-on exercises with automated tests using classes and simple and recursivefunctions. The lab presented both test-first and test-last approaches.
Students were then required to complete two programming projects. Studentswere asked to develop the projects with either a test-first or test-last approach.At the request of the course professor, students were allowed to self-select whichapproach they used. The following statement in the project description prescribesthis requirement:
You should develop this program in a test-first or a test-last manner asdescribed in Lab 3. You may choose which approach you use, but use theapproach throughout the development of the project. If you don’t carewhich approach you use, choose test-first if your KUID starts with aneven number and use test-last if your KUID starts with an odd number.
Table 6.36 reports the number of students electing to use each approach onthe CS2 projects. The low test-first numbers reveal early programmer reluctance toadopt the test-first approach. The Spring 2006 test-first sample size is so low thatmany metrics from that experiment will not be considered. Many of the studentsin the Spring 2006 experiment participated in the Fall 2005 CS1 experiment. Thisaligns with the post experiment survey results from the CS1 experiment.
Each programming project was to be completed in two or three weeks. Thefirst project in Fall 2005 required students to build an application that stored andmanipulated a list of drivers with traffic citations. The application had a textualuser interface that allowed the user to insert, delete, find, and print driver and cita-tion information. The public interface for the main list data structure class (called
152

Fall 2005 Spring 2006Approach Project 1 Project 2 Project 3 Project 1 Project 2 Project 3
TF 6 6 4 1 3 2TL 30 30 30 53 51 50
Table 6.36: Approach Selection in CS2 Projects
DriverTable) was prescribed in the project description. This class was specified tocontain a statically allocated array for storing the driver and citation information.Although much of the interface for the one data structure class was specified, stu-dents were expected to design at least two other classes. The project description isprovided in Appendix B.
The second project extended and modified the first project. The DriverTableclass was to be modified internally to use a pointer-based linked list instead of anarray-based list. The application was to allow multiple DriverTables and the classinterface was modified slightly. Exceptions and some recursive functions were alsoadded to the requirements. At the beginning of the second project, students wereprovided with a solution to the first project that included a full set of automatedunit tests.
Students were asked to use a test-first or test-last approach in the remainingthree projects of the semester. Software from these projects was also analyzed, butthey were not originally a part of the experiment. At least two of these remainingprojects had very procedural solutions (a grammar checker and an experimentalprofiler of sorting algorithms). Their design was more prescribed than the first twoprojects that were a part of the formal experiment.
The second CS2 experiment in Spring 2006 was designed to be similar to thefirst CS2 experiment that was conducted in Fall 2005. The Spring 2006 versionrequired a set of two projects that were very similar to those in Fall 2005 but in adifferent domain (airline flights instead of traffic citations). In both experiments thepost-experiment survey was administered after the completion of the third project.
6.6.2 Internal Quality Results
This section reports, compares, and describes the internal design quality metricresults. The metrics are categorized at the method, class, and project level.
Method-Level Metrics
This section presents results of a method-level analysis on all six of the projects inthe Fall 2005 and Spring 2006 CS2 experiments. The data for each project will bepresented in a table and a radar chart as before. For the radar charts, each of the
153

Higher TF TF TL TLMetric p-value Sig? Method Mean SDev Mean SDev %diff
NOS 0.0315 Yes TF 8.33 24.30 4.98 17.15 67%V(G) 0.1142 No TF 1.30 2.09 1.08 1.74 20%AHL 0.0577 No TF 20.06 81.45 10.31 46.05 95%VOC 0.0050 Yes TF 6.05 13.28 3.61 11.13 67%VOL 0.0903 No TF 107.30 492.99 54.64 281.53 96%PD 0.0258 Yes TF 1.11 2.71 0.71 2.38 56%EFF 0.1610 No TF 1109.97 6893.39 507.66 3122.79 119%BUG 0.0999 No TF 0.01 0.06 0.01 0.04 81%MLOC 0.0283 Yes TF 7.13 21.22 4.16 14.31 72%NBD 0.9598 No TF 0.10 0.47 0.10 0.60 2%PAR 0.7505 No TF 0.69 0.97 0.67 1.02 3%
Table 6.37: Analysis of Method Metrics for CS2 Experiment, Project 1
metrics has been normalized by multiplying the metric mean for each group (test-first and test-last) by a normalizing factor. The normalizing factor is calculated bydividing the maximum mean of all metrics by the maximum mean of the two (test-first and test-last) groups for the metric being plotted. This chart demonstrates thedegree and consistency by which the means of the test-last and test-first metricsvaried. Some observations will be drawn at the end of the section.
Table 6.37 presents the results of the statistical analysis of the method-levelmetrics comparing the test-first and test-last methods in the Fall 2005 CS2 Project1. Figure 6.11 illustrates the differences in a radar chart.
Table 6.38 presents the results of the statistical analysis of the method-levelmetrics comparing the test-first and test-last methods in the Fall 2005 CS2 Project2. Figure 6.12 illustrates the differences in a radar chart.
Table 6.39 presents the results of the statistical analysis of the method-levelmetrics comparing the test-first and test-last methods in the Fall 2005 CS2 Project3. Figure 6.13 illustrates the differences in a radar chart.
Table 6.40 presents the results of the statistical analysis of the method-level met-rics comparing the test-first and test-last methods in the Spring 2006 CS2 Project 1.Figure 6.14 illustrates the differences in a radar chart.
Table 6.41 presents the results of the statistical analysis of the method-levelmetrics comparing the test-first and test-last methods in Spring 2006 CS2 Project 2.Figure 6.15 illustrates the differences in a radar chart.
Table 6.42 presents the results of the statistical analysis of the method-levelmetrics comparing the test-first and test-last methods in Spring 2006 CS2 Project 3.Figure 6.16 illustrates the differences in a radar chart.
The sequence of six radar charts are surprisingly consistent. The methods fromthe test-first projects tend to have better results for nearly all metrics and many of
154

NOS
V(G)
AHL
VOC
VOL
PDEFF
BUG
MLOC
NBD
PAR
TFTL
Figure 6.11: CS2 Experiment Method Metrics Radar Chart, Project 1
Higher TF TF TL TLMetric p-value Sig? Method Mean SDev Mean SDev %diff
NOS 0.0357 Yes TF 8.97 25.10 6.05 20.87 48%V(G) 0.0331 Yes TF 1.39 1.58 1.20 1.80 16%AHL 0.1330 No TF 19.77 81.45 13.00 66.72 52%VOC 0.0003 Yes TF 7.55 13.11 4.88 12.34 55%VOL 0.2615 No TF 100.94 508.18 69.05 455.92 46%PD 0.0015 Yes TF 1.59 3.50 0.98 2.58 62%EFF 0.5108 No TF 1618.94 20765.41 876.86 14601.69 85%BUG 0.2354 No TF 0.02 0.10 0.01 0.07 63%MLOC 0.0466 Yes TF 7.83 22.81 5.32 18.63 47%NBD 0.0433 Yes TF 0.16 0.47 0.10 0.56 53%PAR 0.8269 No TF 0.79 1.06 0.78 1.03 2%
Table 6.38: Analysis of Method Metrics for CS2 Experiment, Project 2
155

NOS
V(G)
AHL
VOC
VOL
PDEFF
BUG
MLOC
NBD
PAR
TFTL
Figure 6.12: CS2 Experiment Method Metrics Radar Chart, Project 2
Higher TF TF TL TLMetric p-value Sig? Method Mean SDev Mean SDev %diff
NOS 0.2249 No TF 7.02 14.01 4.35 13.94 62%V(G) 0.2687 No TF 1.13 1.26 0.91 1.09 24%AHL 0.1247 No TF 15.61 34.23 7.42 28.70 110%VOC 0.0351 Yes TF 6.78 12.92 2.59 6.39 162%VOL 0.1057 No TF 76.37 188.08 29.66 117.04 158%PD 0.2043 No TF 1.42 2.83 0.85 3.06 67%EFF 0.4555 No TF 400.84 921.35 275.90 1927.71 45%BUG 0.1508 No TF 0.01 0.02 0.01 0.02 88%MLOC 0.2279 No TF 5.93 11.02 3.80 13.18 56%NBD 0.1857 No TF 0.26 0.68 0.12 0.40 111%PAR 0.8115 No TL 0.41 0.54 0.43 0.55 -5%
Table 6.39: Analysis of Method Metrics for CS2 Experiment, Project 3
156

NOS
V(G)
AHL
VOC
VOL
PDEFF
BUG
MLOC
NBD
PAR
TFTL
Figure 6.13: CS2 Experiment Method Metrics Radar Chart, Project 3
Higher TF TF TL TLMetric p-value Sig? Method Mean SDev Mean SDev %diff
NOS 0.0011 Yes TF 16.52 17.27 5.33 15.15 210%V(G) 0.0450 Yes TF 2.45 3.08 1.29 1.82 89%AHL 0.0283 Yes TF 22.52 30.29 9.91 32.43 127%VOC 0.0024 Yes TF 12.16 12.80 4.51 10.72 170%VOL 0.1099 No TF 100.36 175.66 48.08 192.04 109%PD 0.0139 Yes TF 3.08 4.21 1.10 3.05 180%EFF 0.2752 No TF 758.65 1674.30 418.57 3069.13 81%BUG 0.0725 No TF 0.02 0.03 0.01 0.03 129%MLOC 0.0086 Yes TF 10.68 12.63 4.27 11.66 150%NBD 0.3013 No TF 0.35 0.88 0.19 0.88 89%PAR 0.3526 No TF 0.97 1.11 0.78 1.13 24%
Table 6.40: Analysis of Method Metrics for Spring CS2 Experiment, Project 1
157

NOS
V(G)
AHL
VOC
VOL
PDEFF
BUG
MLOC
NBD
PAR
TFTL
Figure 6.14: Spring CS2 Experiment Method Metrics Radar Chart, Project 1
Higher TF TF TL TLMetric p-value Sig? Method Mean SDev Mean SDev %diff
NOS 0.0000 Yes TF 12.99 20.80 4.19 16.99 210%V(G) 0.0000 Yes TF 1.43 1.47 0.93 1.05 54%AHL 0.0063 Yes TF 15.59 36.50 8.15 41.00 91%VOC 0.0000 Yes TF 7.83 11.85 3.16 10.36 148%VOL 0.0708 No TF 72.17 218.30 42.77 259.21 69%PD 0.0000 Yes TF 1.45 2.41 0.57 1.88 156%EFF 0.7828 No TF 440.63 2177.37 394.32 3803.64 12%BUG 0.0517 No TF 0.01 0.03 0.01 0.04 71%MLOC 0.0000 Yes TF 7.30 12.66 3.36 12.83 117%NBD 0.0517 No TF 0.12 0.42 0.06 0.40 105%PAR 0.0310 Yes TF 0.74 0.99 0.59 0.93 27%
Table 6.41: Analysis of Method Metrics for Spring CS2 Experiment, Project 2
158

NOS
V(G)
AHL
VOC
VOL
PDEFF
BUG
MLOC
NBD
PAR
TFTL
Figure 6.15: Spring CS2 Experiment Method Metrics Radar Chart, Project 2
Higher TF TF TL TLMetric p-value Sig? Method Mean SDev Mean SDev %diff
NOS 0.0071 Yes TF 14.42 20.16 6.91 17.20 109%V(G) 0.0125 Yes TF 3.26 5.30 1.45 2.29 125%AHL 0.0091 Yes TF 36.75 66.45 12.88 40.06 185%VOC 0.0005 Yes TF 14.74 18.99 5.40 11.65 173%VOL 0.0184 Yes TF 193.15 400.70 63.91 228.84 202%PD 0.0086 Yes TF 3.48 5.55 1.47 4.09 137%EFF 0.1098 No TF 2493.45 7435.03 885.02 5442.03 182%BUG 0.0410 Yes TF 0.04 0.08 0.01 0.05 170%MLOC 0.0023 Yes TF 13.51 18.02 5.83 14.47 132%NBD 0.0963 No TF 0.60 1.46 0.27 1.13 123%PAR 0.4830 No TF 0.68 0.81 0.61 0.72 12%
Table 6.42: Analysis of Method Metrics for Spring CS2 Experiment, Project 3
159

NOS
V(G)
AHL
VOC
VOL
PDEFF
BUG
MLOC
NBD
PAR
TFTL
Figure 6.16: Spring CS2 Experiment Method Metrics Radar Chart, Project 3
the differences are statistically significant. In particular it appears that the test-firstmethods are smaller (MLOC, NOS) and less complex (V(G), VOC, AHL, NBD) than thetest-last methods. Also the test-first methods tend to have similar and sometimeshigher numbers of parameters (PAR) than the test-last methods.
Class-Level Metrics
This section reports the class-level metrics analyzed for the first two CS2 projectsfrom the Fall 2005. The third project is excluded because it was primarily solvedin a procedural fashion with few projects implementing classes. All three Spring2006 experiment projects are excluded because there were so few programmerswho chose to use a test-first approach. Table 6.43 and Table 6.44 present the classmetrics in sorted order by % differences between test-first and test-last projects forthese two projects. Metrics with all zero values are omitted for space.
The data indicates that the test-first programmers at this level may be morelikely to produce larger solutions (TLOC) that are more complex (WMC), are lesscohesive (LCOM), and have higher coupling (RFC).
Project-Level Metrics
Table 6.45, Table 6.46, and Table 6.47 present the project-level metrics for the threeFall 2005 CS2 projects. Because of the small test-first sample size, the Spring 2006CS2 projects are not reported. The object-oriented metrics in Project 3 should notbe given much weight because a majority of the solutions were implemented proce-durally.
160

Higher TF TF TL TLMetric p-value Sig? Method Mean SDev Mean SDev %diff
DIT 0.4197 No TL 0.00 0.00 0.03 0.16 -100%NAIC 0.5567 No TL 0.00 0.00 0.11 0.65 -100%NOCC 0.5567 No TL 0.00 0.00 0.03 0.16 -100%NOIC 0.8432 No TL 0.00 0.00 0.27 1.63 -100%PPPC 0.2572 No TL 64.80 24.29 71.72 13.29 -10%NPavgC 0.4448 No TL 0.90 0.32 0.97 0.43 -8%CSO 0.9193 No TL 9.22 2.98 9.64 3.78 -4%NOAC 0.7390 No TL 9.22 2.98 9.64 3.78 -4%CSAO 0.4917 No TL 12.33 3.31 12.55 4.23 -2%SLOC 0.8416 No TL 17.33 3.31 17.52 4.34 -1%LCOM 0.5546 No TF 0.83 2.87 0.80 3.95 4%CSA 0.9101 No TF 3.11 1.60 2.91 1.56 7%NAAC 0.9258 No TF 3.11 1.60 2.91 1.56 7%RFC 0.2989 No TF 12.17 4.25 10.99 4.22 11%Osavg 0.6567 No TF 2.01 1.57 1.82 2.04 11%WMC 0.1680 No TF 15.17 7.47 12.41 7.03 22%LOC 0.0948 No TF 39.78 23.16 27.56 19.69 44%TLOC 0.0258 Yes TF 101.83 75.59 56.12 60.96 81%
Table 6.43: Sorted Class Metrics for Fall 2005 CS2 Project 1
161

Higher TF TF TL TLMetric p-value Sig? Method Mean SDev Mean SDev %diff
DIT 0.3190 No TL 0.00 0.00 0.01 0.08 -100%NAIC 0.3190 No TL 0.00 0.00 0.01 0.17 -100%NOCC 0.3190 No TL 0.00 0.00 0.01 0.08 -100%NOIC 0.3190 No TL 0.00 0.00 0.06 0.75 -100%PA 0.0024 Yes TL 0.00 0.00 0.06 0.24 -100%NPavgC 0.1254 No TL 0.69 0.49 0.84 0.46 -18%PPPC 0.1999 No TL 56.21 36.42 65.32 32.96 -14%CSA 0.8603 No TL 2.13 2.20 2.20 2.26 -3%NAAC 0.8603 No TL 2.13 2.20 2.20 2.26 -3%Osavg 0.9421 No TL 1.23 0.95 1.25 1.61 -1%SLOC 0.9828 No TF 15.97 10.73 15.92 10.16 0%CSAO 0.7626 No TF 9.84 8.15 9.36 8.02 5%CSO 0.6682 No TF 7.72 6.65 7.16 6.54 8%NOAC 0.6682 No TF 7.72 6.65 7.16 6.54 8%RFC 0.3004 No TF 11.25 11.49 8.95 9.91 26%LOC 0.1951 No TF 33.81 31.53 25.93 26.14 30%WMC 0.2821 No TF 12.69 14.59 9.69 11.50 31%LCOM 0.7651 No TF 0.47 2.17 0.34 2.26 38%TLOC 0.0840 No TF 95.00 125.10 53.64 88.42 77%
Table 6.44: Sorted Class Metrics for Fall 2005 CS2 Project 2
162

Higher TF TF TL TLMetric p-value Sig? Method Mean SDev Mean SDev %diff
DITavg 0.1694 No TL 0.00 0.00 0.03 0.11 -100%NOCavg 0.1694 No TL 0.00 0.00 0.03 0.11 -100%VGavg 0.8840 No TF 8.76 3.76 8.50 4.07 3%FIavg 0.2374 No TF 1.94 0.49 1.65 0.61 18%LOC/Mod 0.4664 No TF 72.23 33.67 61.09 21.71 18%CBOavg 0.0926 No TF 2.76 0.60 2.23 0.75 24%FOavg 0.0532 No TF 0.81 0.23 0.57 0.17 42%MLOCavg TF 10.57 6.78 56%IFavg 0.1224 No TF 2.98 2.43 1.12 1.29 165%
Table 6.45: Sorted Project Metrics for Fall 2005 CS2 Project 1
Higher TF TF TL TLMetric p-value Sig? Method Mean SDev Mean SDev %diff
VGavg 0.2936 No TL 5.97 3.02 7.54 3.58 -21%LOC/Mod 0.7622 No TL 58.31 26.22 61.84 17.10 -6%FIavg 0.2500 No TF 1.57 0.26 1.41 0.46 11%CBOavg 0.0776 No TF 2.25 0.29 1.95 0.56 15%FOavg 0.0060 Yes TF 0.68 0.07 0.54 0.18 25%MLOCavg TF 10.97 7.97 38%DITavg 0.2579 No TF 0.25 0.14 0.16 0.20 49%NOCavg 0.2579 No TF 0.25 0.14 0.16 0.20 49%IFavg 0.1700 No TF 1.68 1.20 0.87 1.01 93%
Table 6.46: Sorted Project Metrics for Fall 2005 CS2 Project 2
The data suggests that the test-first projects may have larger (LOC/Mod, MLOC)solutions with higher coupling (CBO, FO, IF). The test-last solutions may be slightlymore complex (VG). Only the fan-out difference on Project 2 is significant.
6.6.3 Test Results
This section reports, compares, and describes the tests written by students in theCS2 projects. Similar to the CS1 experiment, students wrote automated unit tests asassert statements in a separate function. The number of assert statements writtenwere counted and ratios were calculated for asserts per line-of-code, asserts perclass, asserts per module, and asserts per method.
Many students commented out the assert statements before submitting theirprojects. Due to the large number of project submissions, it was impractical toreinstate and check all tests to see if they passed. As a result, no coverage or test
163

Higher TF TF TL TLMetric p-value Sig? Method Mean SDev Mean SDev %diff
DITavg 0.3253 No TL 0.00 0.00 0.02 0.09 -100%NOCavg 0.3253 No TL 0.00 0.00 0.02 0.09 -100%FOavg 0.0831 No TL 0.00 0.00 0.05 0.15 -100%IFavg 0.1607 No TL 0.00 0.00 0.03 0.12 -100%VGavg 0.5645 No TL 8.50 2.19 9.26 3.19 -8%CBOavg 0.1708 No TL 1.00 0.00 1.06 0.25 -6%FIavg 0.5309 No TL 1.00 0.00 1.01 0.12 -1%LOC/Mod 0.4532 No TF 40.92 9.11 36.72 13.37 11%MLOCavg TF 10.42 6.98 49%
Table 6.47: Sorted Project Metrics for Fall 2005 CS2 Project 3
#Asserts/ #Asserts/ #Asserts/ #Asserts/Metric #Asserts LOC Module Class Method
p-value 0.02456 0.0059 0.0263 0.0185 0.0145Significant? Yes Yes Yes Yes YesHigher Method TF TF TF TF TFTF Mean 34.00 0.06 4.72 9.13 1.29Std Dev 43.14 0.06 6.15 11.44 1.46TL Mean 11.61 0.02 1.58 2.87 0.45Std Dev 17.80 0.03 2.48 5.03 0.88%difference 193% 168% 200% 218% 186%
Table 6.48: CS2 Test Metrics
success metrics were collected on the CS1 and CS2 projects. The assert countsincluded all assert statements, whether commented out or not, and were deemed apractical estimation of testing effort.
Table 6.48 reports the aggregate testing results for all the CS2 projects. Individ-ual results from each project are not reported to save space. The results providestrong support for the claim that test-first programmers write more tests, even atan early level. All results were significant.
6.6.4 Productivity Results
This section reports, compares, and describes the volume of code produced andthe amount of time students reported they spent on the projects. The test-firstprogrammers reported spending 13% less time producing solutions that were 12%larger in lines of code than the test-last programmers on all of the CS2 projects.Recall that the lines of code includes test lines of code and the previous section
164
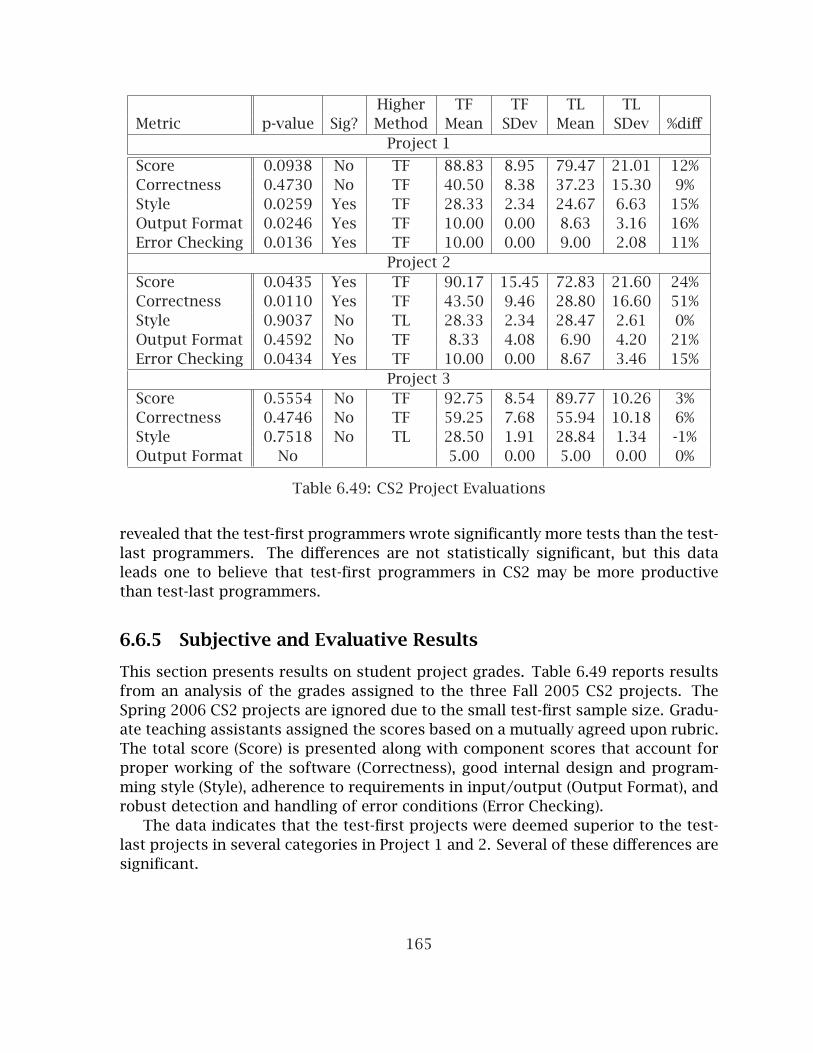
Higher TF TF TL TLMetric p-value Sig? Method Mean SDev Mean SDev %diff
Project 1
Score 0.0938 No TF 88.83 8.95 79.47 21.01 12%Correctness 0.4730 No TF 40.50 8.38 37.23 15.30 9%Style 0.0259 Yes TF 28.33 2.34 24.67 6.63 15%Output Format 0.0246 Yes TF 10.00 0.00 8.63 3.16 16%Error Checking 0.0136 Yes TF 10.00 0.00 9.00 2.08 11%
Project 2Score 0.0435 Yes TF 90.17 15.45 72.83 21.60 24%Correctness 0.0110 Yes TF 43.50 9.46 28.80 16.60 51%Style 0.9037 No TL 28.33 2.34 28.47 2.61 0%Output Format 0.4592 No TF 8.33 4.08 6.90 4.20 21%Error Checking 0.0434 Yes TF 10.00 0.00 8.67 3.46 15%
Project 3Score 0.5554 No TF 92.75 8.54 89.77 10.26 3%Correctness 0.4746 No TF 59.25 7.68 55.94 10.18 6%Style 0.7518 No TL 28.50 1.91 28.84 1.34 -1%Output Format No 5.00 0.00 5.00 0.00 0%
Table 6.49: CS2 Project Evaluations
revealed that the test-first programmers wrote significantly more tests than the test-last programmers. The differences are not statistically significant, but this dataleads one to believe that test-first programmers in CS2 may be more productivethan test-last programmers.
6.6.5 Subjective and Evaluative Results
This section presents results on student project grades. Table 6.49 reports resultsfrom an analysis of the grades assigned to the three Fall 2005 CS2 projects. TheSpring 2006 CS2 projects are ignored due to the small test-first sample size. Gradu-ate teaching assistants assigned the scores based on a mutually agreed upon rubric.The total score (Score) is presented along with component scores that account forproper working of the software (Correctness), good internal design and program-ming style (Style), adherence to requirements in input/output (Output Format), androbust detection and handling of error conditions (Error Checking).
The data indicates that the test-first projects were deemed superior to the test-last projects in several categories in Project 1 and 2. Several of these differences aresignificant.
165
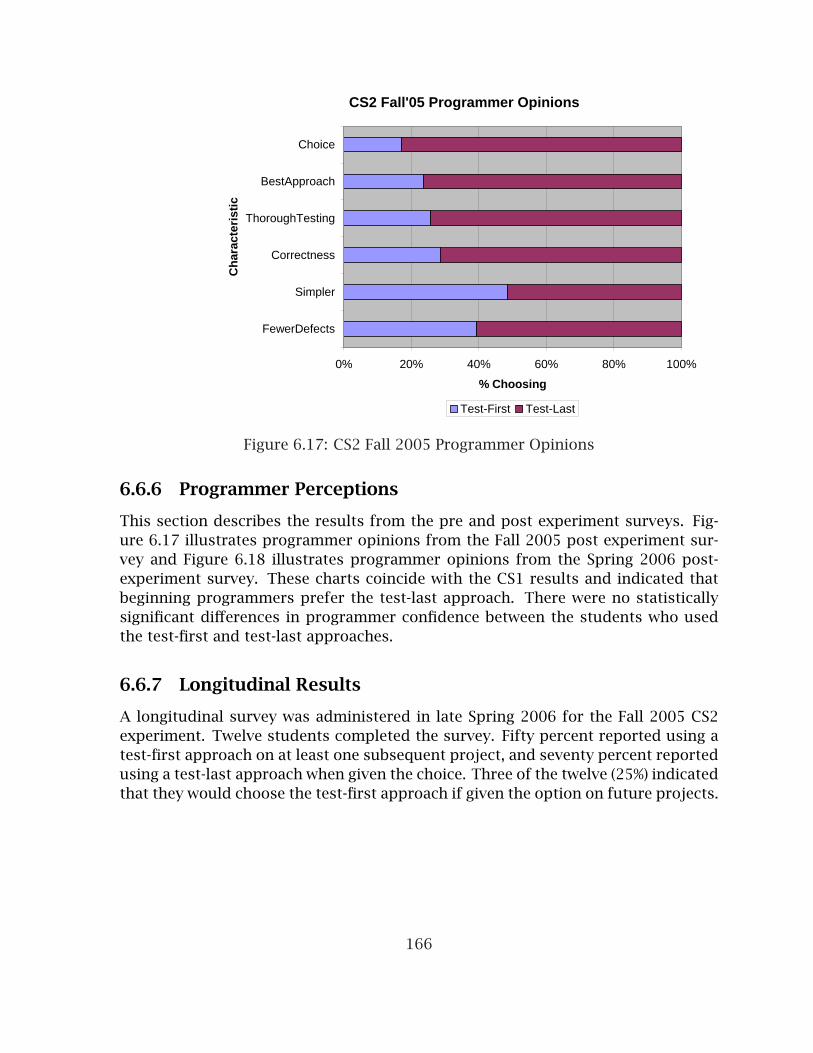
CS2 Fall'05 Programmer Opinions
0% 20% 40% 60% 80% 100%
FewerDefects
Simpler
Correctness
ThoroughTesting
BestApproach
Choice
Cha
ract
eris
tic
% Choosing
Test-First Test-Last
Figure 6.17: CS2 Fall 2005 Programmer Opinions
6.6.6 Programmer Perceptions
This section describes the results from the pre and post experiment surveys. Fig-ure 6.17 illustrates programmer opinions from the Fall 2005 post experiment sur-vey and Figure 6.18 illustrates programmer opinions from the Spring 2006 post-experiment survey. These charts coincide with the CS1 results and indicated thatbeginning programmers prefer the test-last approach. There were no statisticallysignificant differences in programmer confidence between the students who usedthe test-first and test-last approaches.
6.6.7 Longitudinal Results
A longitudinal survey was administered in late Spring 2006 for the Fall 2005 CS2experiment. Twelve students completed the survey. Fifty percent reported using atest-first approach on at least one subsequent project, and seventy percent reportedusing a test-last approach when given the choice. Three of the twelve (25%) indicatedthat they would choose the test-first approach if given the option on future projects.
166
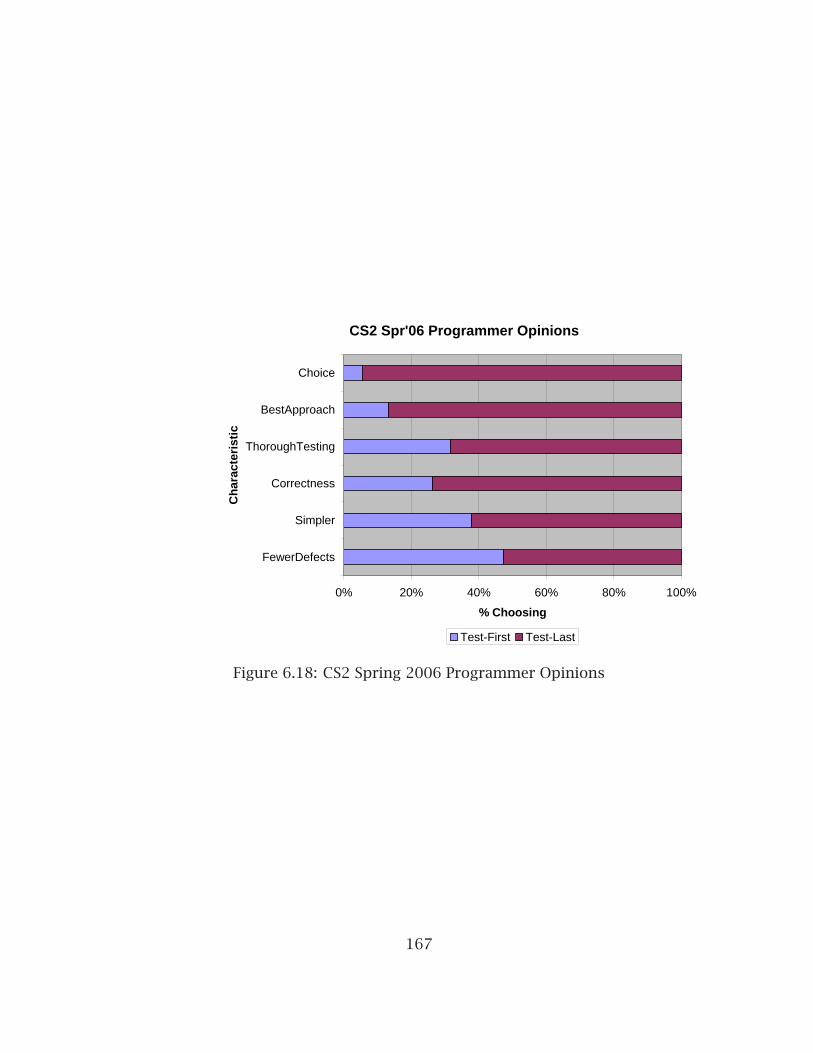
CS2 Spr'06 Programmer Opinions
0% 20% 40% 60% 80% 100%
FewerDefects
Simpler
Correctness
ThoroughTesting
BestApproach
Choice
Cha
ract
eris
tic
% Choosing
Test-First Test-Last
Figure 6.18: CS2 Spring 2006 Programmer Opinions
167

Chapter 7
Evaluation, Observation, and Discussion
This final chapter will summarize and evaluate the results of this research. Obser-vations will be drawn and possible conclusions will be proposed. Future work willalso be identified.
This research makes several substantial contributions. Foremost is the empiri-cal evidence regarding the effects of test-driven development on internal softwarequality. Section 7.1 will summarize this evidence and categorize it in terms of thedesirable quality attributes identified in Chapter 4. This evidence provides com-pelling motivation to adopt TDD in order to reduce code size and complexity, andincrease programmer testing and testability. The evidence also raises interestingquestions about how TDD affects coupling, cohesion, and reusability.
Section 7.2 discusses the external validity of the empirical results and reviewsthe significant impact that this research has already made. Peer-reviewed publica-tions and conference presentations, awards and grants received, and external aca-demic and industry presentations will be reviewed.
Several additional contributions result from this research and are discussed inSection 7.3. The research is the first significant examination of the effects of TDD oninternal software quality. As such, it establishes a benchmark to be reviewed andevaluated. This work provides a framework for conducting replicated studies insimilar and diverse environments that will reinforce and enlighten these results. Inaddition, this work contributes a novel approach to teaching computer science andsoftware engineering that has already received an enthusiastic response in somecircles.
Finally, the last section will summarize this work and propose future directionsfor related research.
7.1 Empirical Evidence of TDD Efficacy
The primary contribution of this research is the empirical evidence of the effectsthat applying TDD has on internal software quality. Chapter 5 and 6 presented a
168

large volume of empirical data along with some analysis. This section will summa-rize this data and revisit the initial hypotheses. Data will be grouped and visualizedwith bar charts to accommodate drawing conclusions. In the charts, bars to theright of zero indicate that the test-first project had the higher values. Bars to theleft of zero indicate that the test-last project had the higher values. The longerthe bar, the larger the difference between the test-first and test-last projects onthat particular metric. The reader will need to pay particular attention to whetherlarger values are desirable or not. For instance with testing coverage, larger valuesare more desirable. However with complexity metrics, smaller values are generallymore desirable.
The first section will focus on the significant improvements that the test-firstapproach has on software testing. The following sections will consider complexity,coupling, cohesion, and size metrics, then combine them to examine the effects ofTDD on the four desirable software characteristics of understandability, maintain-ability, reusability, and testability. Finally the last section will address the qualita-tive evidence in programmer attitudes as collected through the experiment surveys.
7.1.1 Quantitative Evidence: Testing
Figure 7.1 displays the % differences in testing metrics between the test-first andtest-last projects for the industry and academic software engineering course experi-ments and case study. In all of the testing metrics, higher values are generally moredesirable.
This figure demonstrates how test-first programmers consistently wrote moretests with higher test coverage. Many of these differences were statistically sig-nificant including line coverage (Combined SE experiment, industry case study),conditional/branch coverage (industry case study), and Test to Source (T/S) Ratio(industry case study).
Figure 7.2 displays the % differences in testing metrics between the test-firstand test-last projects for the beginning academic course experiments. In the firstCS1 project, the test-first programmers wrote substantially more tests than thetest-last programmers. However, in the second project when the programmers allswitched from a test-first to a test-last approach, they still wrote substantially moretests. Similar results were observed in an industry experiment. As discussed insection 5.4, when the same professional developers completed a test-last project af-ter having completed a test-first project earlier, their test volume and test-coveragestayed high, nearing the levels achieved on the test-first project.
In the Fall CS2 projects, the test-first programmers continued to use the test-first approach for all three projects and they consistently wrote more tests than thetest-last programmers. In the Spring CS2 project, however, only one programmerclaimed to use the test-first approach on the first project, but no tests were foundin their project. As a result the chart displays that the test-last programmers wrote
169
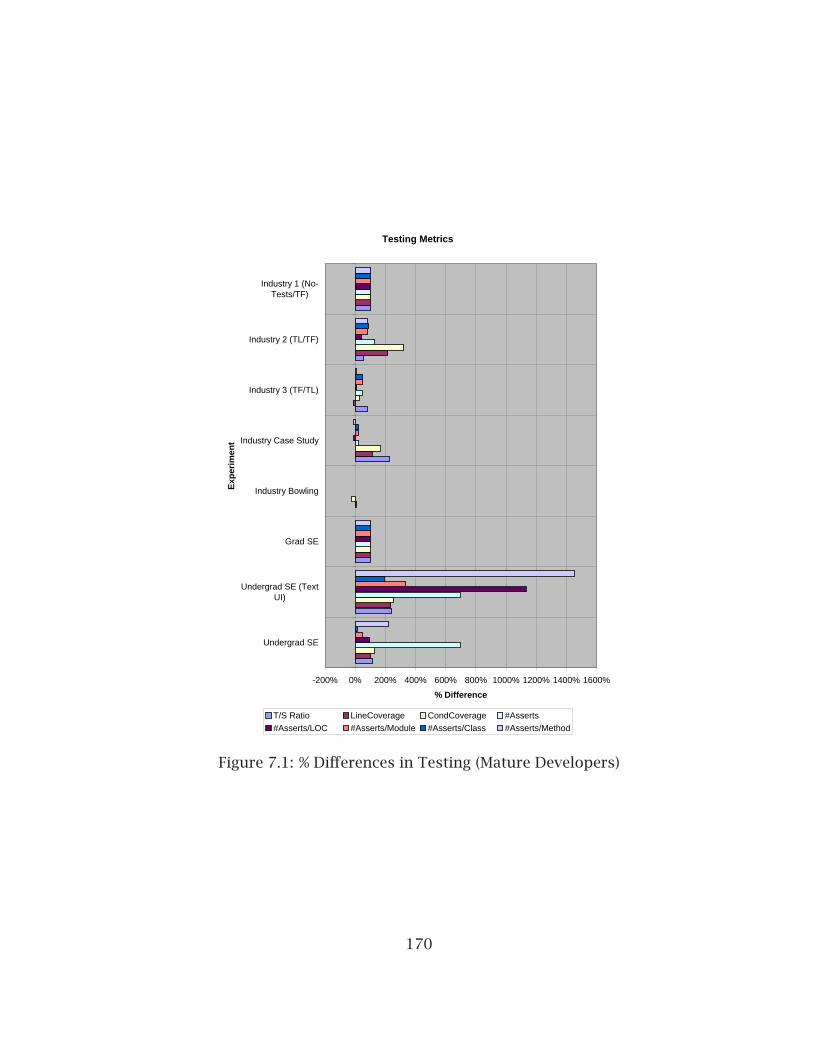
Testing Metrics
-200% 0% 200% 400% 600% 800% 1000% 1200% 1400% 1600%
Undergrad SE
Undergrad SE (TextUI)
Grad SE
Industry Bowling
Industry Case Study
Industry 3 (TF/TL)
Industry 2 (TL/TF)
Industry 1 (No-Tests/TF)
Exp
erim
ent
% Difference
T/S Ratio LineCoverage CondCoverage #Asserts#Asserts/LOC #Asserts/Module #Asserts/Class #Asserts/Method
Figure 7.1: % Differences in Testing (Mature Developers)
170
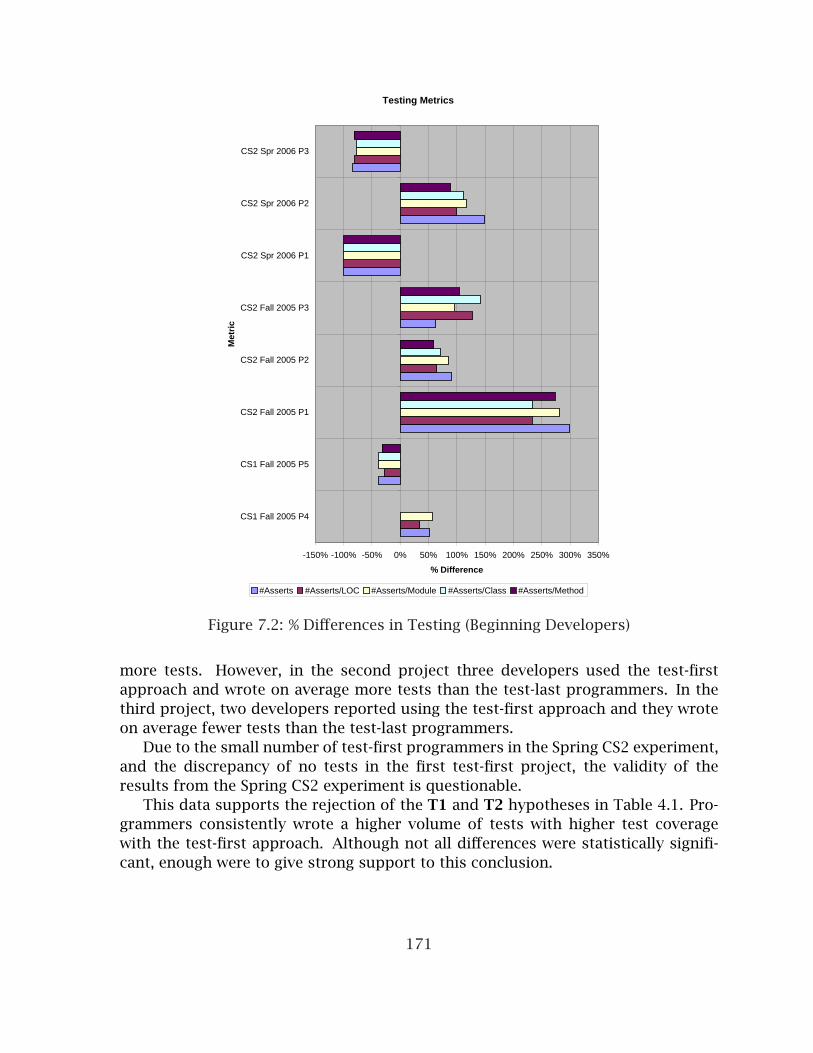
Testing Metrics
-150% -100% -50% 0% 50% 100% 150% 200% 250% 300% 350%
CS1 Fall 2005 P4
CS1 Fall 2005 P5
CS2 Fall 2005 P1
CS2 Fall 2005 P2
CS2 Fall 2005 P3
CS2 Spr 2006 P1
CS2 Spr 2006 P2
CS2 Spr 2006 P3
Met
ric
% Difference
#Asserts #Asserts/LOC #Asserts/Module #Asserts/Class #Asserts/Method
Figure 7.2: % Differences in Testing (Beginning Developers)
more tests. However, in the second project three developers used the test-firstapproach and wrote on average more tests than the test-last programmers. In thethird project, two developers reported using the test-first approach and they wroteon average fewer tests than the test-last programmers.
Due to the small number of test-first programmers in the Spring CS2 experiment,and the discrepancy of no tests in the first test-first project, the validity of theresults from the Spring CS2 experiment is questionable.
This data supports the rejection of the T1 and T2 hypotheses in Table 4.1. Pro-grammers consistently wrote a higher volume of tests with higher test coveragewith the test-first approach. Although not all differences were statistically signifi-cant, enough were to give strong support to this conclusion.
171

Complexity Metrics
-150% -100% -50% 0% 50% 100% 150% 200% 250% 300%
Undergrad SE
Undergrad SE (TextUI)
Grad SE
Industry Bowling
Industry Case Study
Industry 3 (TF/TL)
Industry 2 (TL/TF)
Industry 1 (No-Tests/TF)
Exp
erim
ent
% Difference
V(G) V(G) Class WMC PL AHL VOC VOL PD EFF BUG NBD
Figure 7.3: % Differences in Complexity (Mature Developers)
7.1.2 Quantitative Evidence: Complexity
Figure 7.3 displays the % differences in complexity metrics between the test-first andtest-last projects for the industry and academic software engineering course exper-iments and case study. Figure 7.4 displays the % differences in complexity metricsbetween the test-first and test-last projects for the beginning academic course ex-periments. In all of the complexity metrics, lower values are generally more desir-able.
The complexity figures tell an interesting story. It appears that beginning devel-opers tend to write more complex software when using the test-first approach withone exception. However more mature developers tend to write more complex codewith the test-last approach with two exceptions.
Two of the three exceptions noted might be explained by the observations from
172

Complexity Metrics
-100% -50% 0% 50% 100% 150% 200% 250% 300%
CS1 Fall 2005 P4
CS1 Fall 2005 P5
CS2 Fall 2005 P1
CS2 Fall 2005 P2
CS2 Fall 2005 P3
CS2 Spr 2006 P1
CS2 Spr 2006 P2
CS2 Spr 2006 P3
Exp
erim
ent
% Difference
V(G) V'(G) eV(G) WMC OC AHL VOC VOL PD EFF BUG NBD
Figure 7.4: % Differences in Complexity (Beginning Developers)
173

V(G)Experiment V(G) Cls WMC PL AHL VOC VOL PD EFF BUG NBD
UGrad SE Y Y Y Y Y Y Y YUGrad SE (TUI) Y Y Y Y Y YGrad SE Y Y Y YInd BowlingInd CS Y Y Y Y Y YInd 3 (TF/TL) Y Y Y Y Y Y Y Y Y Y YInd 2 (TL/TF) Y YInd 1 (NT/TF) Y Y Y Y Y Y Y Y Y
Table 7.1: Complexity Metrics w/Statistically Significant Differences (Mature Devel-opers)
Chapter 5 and Chapter 6. There we noted that many metrics switched/improvedwhen programmers used the test-last approach after having completed a projectwith the test-first approach. The second CS1 project and the industry experiment 3both involved teams applying the test-last approach after having recently completeda project with the test-first approach. In the second CS1 project the test-last devel-opers (who previously used the test-first approach) produced more complex code.In the industry experiment 3 the test-first approach produced higher values on themethod-level complexity measures, but the test-last approach produced higher val-ues on the class-level complexity measures. Perhaps the influence of experiencewith the test-first approach provides a residual effect that extends through futureprojects.
The remaining exception is in the industry experiment 2 where the test-firstapproach produced code that was generally more complex. The likely differencehere is that the two projects are of differing types. The test-last project was a utilityproject with library code available for many projects. The test-first project was acomplete web application.
If these exceptions are ignored or if the explanations provided are valid, thenthe conclusions are that beginning developers tend to write more complex codewith the test-first approach and more mature developers tend to write less com-plex code with the test-first approach. Many of these differences were statisticallysignificant. Figure 7.1 and Figure 7.2 report which differences were statistically sig-nificant at p < .05. A ’Y’ in a cell indicates that the metric was significant for thatexperiment. None of the experiments in Figure 7.2 had statistically significant dif-ferences for the WMC and EFF metrics so they are omitted for formatting. Althoughnot conclusive, this data supports the possible rejection of the Q1 hypothesis formature developers.
174

Experiment V(G) V’(G) eV(G) OC AHL VOC VOL PD BUG NBD
CS1 F05 P4CS1 F05 P5 Y Y Y Y Y Y Y Y Y YCS2 F05 P1 Y Y YCS2 F05 P2 Y Y Y Y YCS2 F05 P3 YCS2 S06 P1 Y Y Y Y Y Y YCS2 S06 P2 Y Y Y Y Y Y YCS2 S06 P3 Y Y Y Y Y Y Y
Table 7.2: Complexity Metrics w/Statistically Significant Differences (Beginning De-velopers)
7.1.3 Quantitative Evidence: Coupling
Figure 7.5 displays the % differences in coupling metrics between the test-first andtest-last projects for all of the experiments in which the typical solution containedat least two objects. The two CS1 projects and the CS2 project 3 were typicallysolved with a procedural approach or only a single class so they are excluded. TheSpring 2006 CS2 projects are also excluded because the test-first sample size wasso small. For both coupling metrics, lower values are generally more desirable.
This chart seems to indicate that the test-first approach increases coupling. Thetwo exceptions are the industry experiments 2 and 3. These projects were notedas exceptions in the complexity measures and the same rationale could apply here.Industry experiment 2 compares dissimilar projects (library vs web application) andindustry experiment 3 involves a test-last approach just after having completed atest-first approach project.
The CS2 project 2 average fan out was the only metric with a statistically sig-nificant difference. Thus we cannot claim that the test-first approach increasescoupling, but it points to an interesting trend that merits further evaluation. It maynot be a surprise that the test-first approach could increase coupling. The sectionson complexity and size indicate that the test-first approach seems to cause develop-ers to write smaller, less complex methods and classes. More connections betweenthese units may result.
An interesting question is whether the increased coupling is a good or bad cou-pling. Coupling can be bad when it is rigid and changes in one module cause changesin another module. However it can be argued that some coupling can be good, par-ticularly when the coupling is either configurable or uses abstract connections suchas interfaces or abstract classes. Such code can be considered to be highly flexibleand thus more maintainable and reusable. Figure 7.6 illustrates the abstractness inthe experiments. The metrics indicate the creation (NOI, NOA, RMA) and use (NII) ofinterfaces and abstract classes.
175
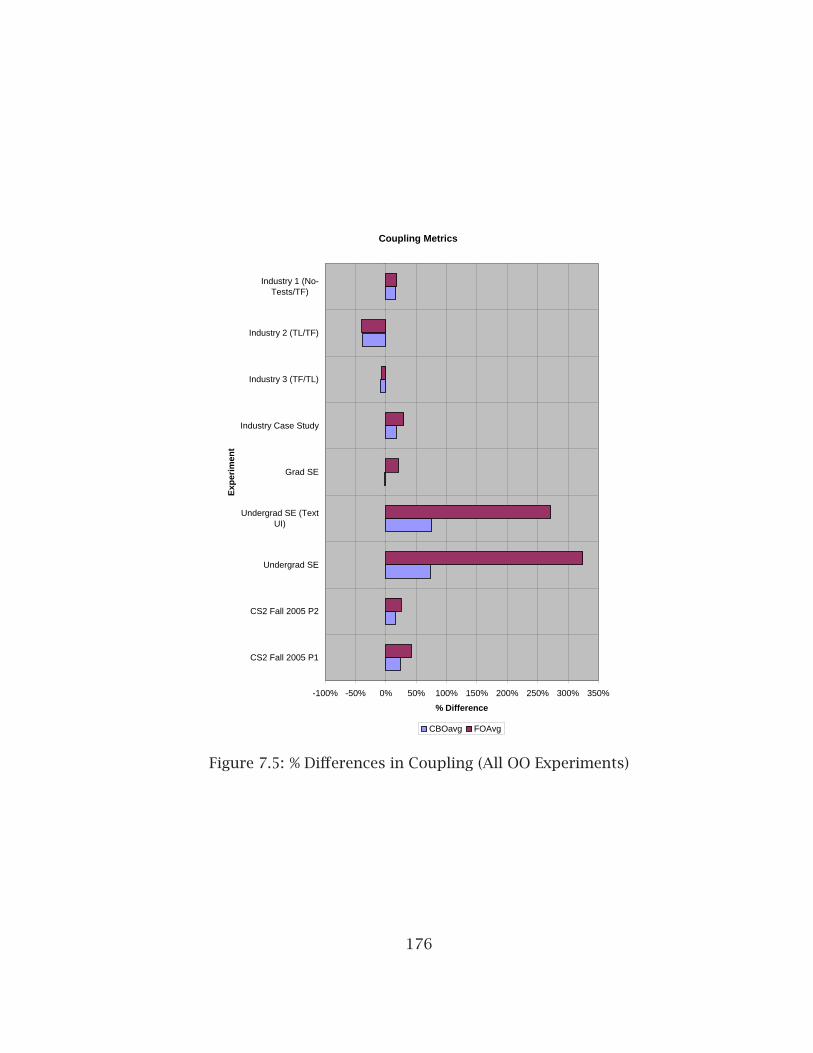
Coupling Metrics
-100% -50% 0% 50% 100% 150% 200% 250% 300% 350%
CS2 Fall 2005 P1
CS2 Fall 2005 P2
Undergrad SE
Undergrad SE (TextUI)
Grad SE
Industry Case Study
Industry 3 (TF/TL)
Industry 2 (TL/TF)
Industry 1 (No-Tests/TF)
Exp
erim
ent
% Difference
CBOavg FOAvg
Figure 7.5: % Differences in Coupling (All OO Experiments)
176

Abstractness Metrics
-150%
-100%
-50% 0% 50% 100% 150% 200% 250% 300% 350%
Undergrad SE
Undergrad SE (TextUI)
Grad SE
Industry Case Study
Industry 3 (TF/TL)
Industry 2 (TL/TF)
Industry 1 (No-Tests/TF)
Exp
erim
ent
% Difference
RMAavg NII NOIavg NOAavg
Figure 7.6: % Differences in Abstractness (All OO Experiments)
177
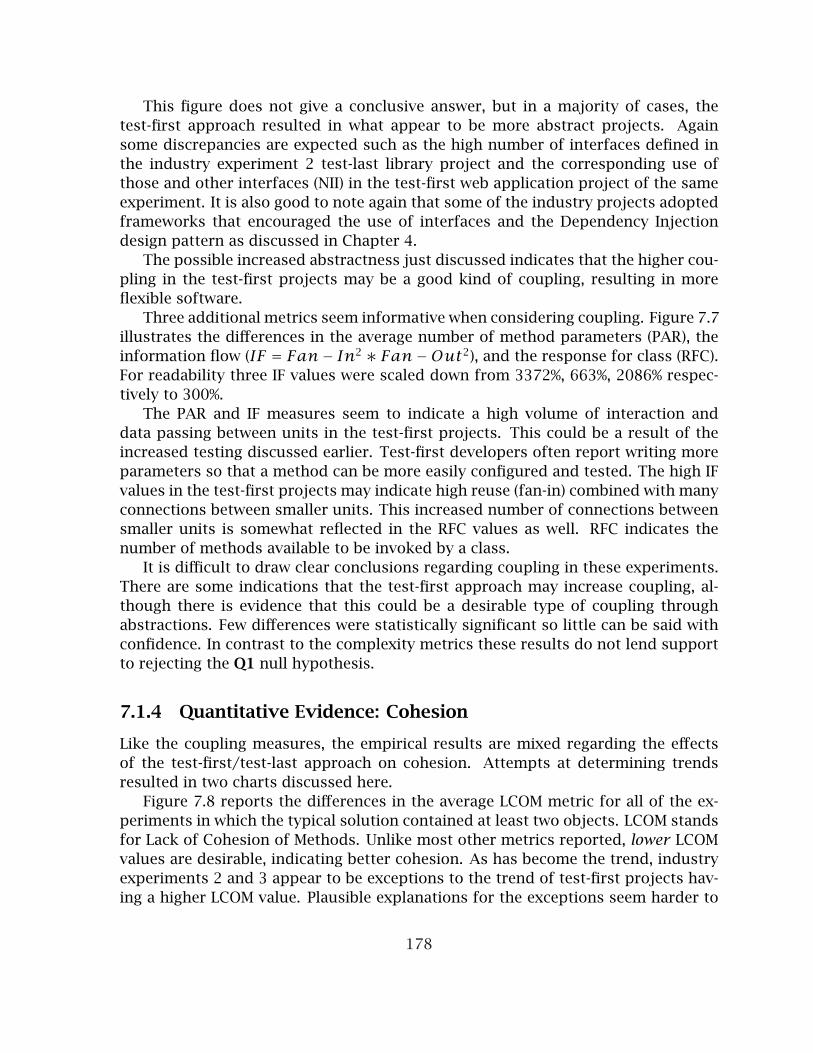
This figure does not give a conclusive answer, but in a majority of cases, thetest-first approach resulted in what appear to be more abstract projects. Againsome discrepancies are expected such as the high number of interfaces defined inthe industry experiment 2 test-last library project and the corresponding use ofthose and other interfaces (NII) in the test-first web application project of the sameexperiment. It is also good to note again that some of the industry projects adoptedframeworks that encouraged the use of interfaces and the Dependency Injectiondesign pattern as discussed in Chapter 4.
The possible increased abstractness just discussed indicates that the higher cou-pling in the test-first projects may be a good kind of coupling, resulting in moreflexible software.
Three additional metrics seem informative when considering coupling. Figure 7.7illustrates the differences in the average number of method parameters (PAR), theinformation flow (IF = Fan− In2 ∗ Fan−Out2), and the response for class (RFC).For readability three IF values were scaled down from 3372%, 663%, 2086% respec-tively to 300%.
The PAR and IF measures seem to indicate a high volume of interaction anddata passing between units in the test-first projects. This could be a result of theincreased testing discussed earlier. Test-first developers often report writing moreparameters so that a method can be more easily configured and tested. The high IFvalues in the test-first projects may indicate high reuse (fan-in) combined with manyconnections between smaller units. This increased number of connections betweensmaller units is somewhat reflected in the RFC values as well. RFC indicates thenumber of methods available to be invoked by a class.
It is difficult to draw clear conclusions regarding coupling in these experiments.There are some indications that the test-first approach may increase coupling, al-though there is evidence that this could be a desirable type of coupling throughabstractions. Few differences were statistically significant so little can be said withconfidence. In contrast to the complexity metrics these results do not lend supportto rejecting the Q1 null hypothesis.
7.1.4 Quantitative Evidence: Cohesion
Like the coupling measures, the empirical results are mixed regarding the effectsof the test-first/test-last approach on cohesion. Attempts at determining trendsresulted in two charts discussed here.
Figure 7.8 reports the differences in the average LCOM metric for all of the ex-periments in which the typical solution contained at least two objects. LCOM standsfor Lack of Cohesion of Methods. Unlike most other metrics reported, lower LCOMvalues are desirable, indicating better cohesion. As has become the trend, industryexperiments 2 and 3 appear to be exceptions to the trend of test-first projects hav-ing a higher LCOM value. Plausible explanations for the exceptions seem harder to
178
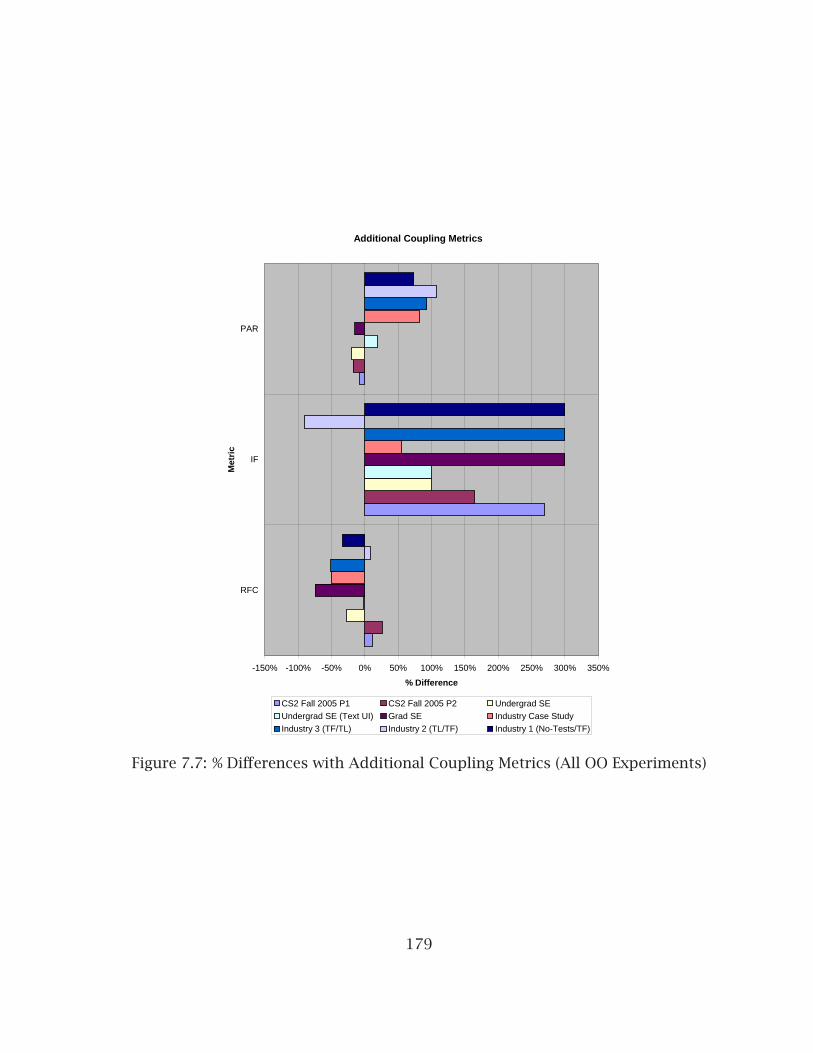
Additional Coupling Metrics
-150% -100% -50% 0% 50% 100% 150% 200% 250% 300% 350%
RFC
IF
PAR
Met
ric
% Difference
CS2 Fall 2005 P1 CS2 Fall 2005 P2 Undergrad SEUndergrad SE (Text UI) Grad SE Industry Case StudyIndustry 3 (TF/TL) Industry 2 (TL/TF) Industry 1 (No-Tests/TF)
Figure 7.7: % Differences with Additional Coupling Metrics (All OO Experiments)
179

LCOM
-150% -100% -50% 0% 50% 100% 150%
CS2 Fall 2005 P1
CS2 Fall 2005 P2
Undergrad SE
Undergrad SE (TextUI)
Grad SE
Industry Case Study
Industry 3 (TF/TL)
Industry 2 (TL/TF)
Industry 1 (No-Tests/TF)
Exp
erim
ent
% Difference
LCOM
Figure 7.8: % Differences in LCOM Metric (All OO Experiments)
come by in the case of cohesion. One might expect the test-last/library project ofindustry experiment 2 to have more cohesion than the test-first web application, butthis is not the case. Similarly it seems that the LCOM difference in industry exper-iment 3 would be much smaller if the proposed residual test-first effect discussedearlier applies. None of the differences were statistically significant so perhaps thereis nothing that can be said about the effects of the test-first/test-last approach oncohesion.
Figure 7.9 demonstrates the consistency in the academic experiments with co-hesion related metrics. In all of these experiments the test-first project had worsecohesion (higher LCOM), more methods, and more classes. The comparison withnumber of methods and number of classes makes sense with the academic exper-iments because all the projects within an experiment were solutions to the sameproblem. This was not the case in the industry experiments, except for the industry
180

Academic Cohesion Metrics
0% 50% 100% 150% 200% 250%
CS2 Fall 2005 P1
CS2 Fall 2005 P2
Undergrad SE
Undergrad SE (TextUI)
Grad SE
Exp
erim
ent
% Difference
#classes #methods LCOM
Figure 7.9: % Differences in Cohesion Metrics (Academic Experiments)
training/bowling experiment. The higher number of methods and classes with thetest-first approach was anticipated as smaller units are more testable, but the cor-responding decrease in cohesion is perhaps surprising. One might expect solutionswith more classes to have smaller and more cohesive classes. However this does notappear to be the case. Two of the differences in number of methods and number ofclasses in the CS2 projects were statistically significant.
Like the coupling measures, there are some indications that the test-first ap-proach may decrease cohesion. However differences were not statistically signifi-cant. As a result, the cohesion metrics do not lend support to rejecting the Q1 nullhypothesis.
181

Code Size Metrics
-100% -50% 0% 50% 100% 150% 200%
CS2 Fall 2005 P1
CS2 Fall 2005 P2
Undergrad SE
Undergrad SE (TextUI)
Grad SE
Industry Case Study
Industry 3 (TF/TL)
Industry 2 (TL/TF)
Industry 1 (No-Tests/TF)
Exp
erim
ent
% Differences
LOC/Mod WMC MLOC
Figure 7.10: % Differences in Code Size Metrics (All OO Experiments)
7.1.5 Quantitative Evidence: Size
This section considers differences in software size metrics. Figure 7.10 comparesdifferences in all of the experiments in which the typical solution contained at leasttwo objects. The three measures displayed are the average lines of code per module(LOC/Mod), the weighted methods per class (WMC) which is an indicator of thenumber of methods and their complexity in a class, and the average lines of codeper method (MLOC). The chart reveals the trend that beginning developers tend towrite larger methods and classes with the test-first approach, but that this trendseems to reverse as developers mature. Again we have a couple of exceptions withindustry experiments 2 and 3. The LOC/Mod metric was statistically significant forthe industry case study. This was the only experiment with enough modules toconsider this a valid comparison.
182

Academic Code Size Metrics
-100% -50% 0% 50% 100% 150% 200% 250%
NOS
NOV
#classes
#methods
Met
ric
% Difference
Undergrad SE Undergrad SE (Text UI) Grad SEIndustry Bowling CS2 Fall 2005 P1 CS2 Fall 2005 P2
Figure 7.11: % Differences in Academic Size Metrics
Figure 7.11 reports additional size metrics for the academic experiments thatcan be compared in total because they involve the same requirements. We see herethat test-first developers consistently implemented more classes and methods withmore variables, and that the total number of statements in a solution reversed infavor of smaller test-first solutions as developers matured. The number of methods,number of classes, WMC and NOS differences were statistically significant in theCS1 and CS2 experiments. The higher test-first NOS values are likely caused by theinclusion of more tests in the test-first solutions. Test code was separated fromsource code in all experiments except the CS1 and CS2 experiments.
Code size metrics are often criticized, but they are useful in some respects. Lesscode is generally more maintainable. Smaller modules are generally more reusableand testable. These results indicate that the test-first approach seems to influencemature developers to write more, smaller methods and classes.
183

Productivity
-60% -50% -40% -30% -20% -10% 0% 10% 20% 30%
CS1 Fall 2005 P4
CS1 Fall 2005 P5
CS2 Fall 2005 P1
CS2 Fall 2005 P2
CS2 Fall 2005 P3
Undergrad SE
Undergrad SE (TextUI)
Grad SE
Exp
erim
ent
% Difference
Time
Figure 7.12: % Differences in Programmer Productivity (Academic Experiments)
7.1.6 Quantitative Evidence: Productivity and Evaluation
Programmer productivity was examined in the academic experiments. Students re-ported the time they spent on each development project and comparisons weremade between the test-last and test-first groups. Figure 7.12 reports the % differ-ences between the groups for each experiment. The Spring 2006 CS2 experimentsare again excluded for lack of test-first examples. The bars to the left of zero indi-cate that the test-last programmers took more time on the project. Bars to the rightof the zero indicate that the test-first programmers took more time on the project.This chart indicates that the test-first programmers were more productive on all ofthe projects with predominately object-oriented designs. Despite this trend, noneof the differences were statistically significant so we are unable to reject the P1 nullhypothesis.
184

Output ErrorExperiment Time Score Correctness Style Format Checking
CS1 Fall 2005 P4 No NoCS1 Fall 2005 P5 No NoCS2 Fall 2005 P1 No No No Yes Yes YesCS2 Fall 2005 P2 No Yes Yes No No YesCS2 Fall 2005 P3 No No No No
Table 7.3: Statistical Significance in Evaluation Differences
The productivity measures must be considered alongside an evaluation of theproduct produced by the student programmers. If students report spending lesstime on an inferior product, little can be said. Figure 7.13 reports the differences instudent grades on the CS1 and CS2 projects. The grades were assigned by graduateteaching assistants and evaluate student projects in terms of overall score, externalcorrectness (observable features), program style (design quality, code style), outputformat, and degree of error checking for exceptional inputs.
The test-first projects were graded higher in the first two CS2 projects and theother project differences were negligible. Several of these differences were statisti-cally significant as reported in Table 7.3. No numeric grades were collected in thesoftware engineering courses so they are excluded. The author observed studentpresentations in each of the software engineering courses. Based on these obser-vations, the test-first products were judged to be at least as good as the test-lastproducts. This data indicates that programmers using the test-first approach maybe more productive while producing equal or better quality products than test-lastdevelopers. The data supports rejecting the Q1 hypothesis but only for the CS2projects.
7.1.7 Qualitative Evidence: Programmer Attitudes
Programmer opinions of the test-first and test-last approaches were measured ineach of the experiments. All programmers participating in the experiments wereasked to complete surveys at three points: prior to the experiment, shortly after theexperiment, and several months after the experiment.
Figures 7.14 and 7.15 report programmer opinions of the test-first and test-lastapproaches from the post-experiment surveys. The results have been grouped bydeveloper maturity. CS1 and CS2 programmers are in the ”Beginning” group, andindustry programmers and student programmers from the software engineeringcourses are in the ”Mature” group. The corresponding questions ask programmersto choose:
1. which approach they would choose in the future (Choice)
185

Subjective Metrics
-10% 0% 10% 20% 30% 40% 50% 60%
CS1 Fall 2005 P4
CS1 Fall 2005 P5
CS2 Fall 2005 P1
CS2 Fall 2005 P2
CS2 Fall 2005 P3
Exp
erim
ent
% Difference
Score Correctness Style Output Format Error Checking
Figure 7.13: % Differences in Program Evaluations (Academic Experiments)
186

Beginning Programmer Opinions
0% 20% 40% 60% 80% 100%
FewerDefects
Simpler
Correctness
ThoroughTesting
BestApproach
Choice
Ch
arac
teri
stic
% Choosing
Test-First Test-Last
Figure 7.14: Beginning Programmer Opinions of Test-First/Test-Lest Methods
2. which approach was the best for the project(s) they completed (BestApproach)
3. which approach would cause them to more thoroughly test a program (Thor-oughTesting)
4. which approach produces a correct solution in less time (Correct)
5. which approach produces code that is simpler, more reusable, and more main-tainable (Simpler)
6. which approach produces code with fewer defects (FewerDefects)
The charts illustrate that beginning programmers think the test-last approach isbetter and are more likely to choose it whereas more mature programmers think thetest-first approach is better and are more likely to choose it. The longitudinal surveyreported very similar results with 86% of beginning programmers choosing the test-last approach and 87% of mature programmers choosing the test-first approach.The two groups also vary on language (C++ and Java) and corresponding automatedunit-testing frameworks which may influence programmer opinions as well.
One should also note that the percentage of programmers choosing the test-firstmethod is always slightly less than the programmer opinions on other desirablecharacteristics. In other words, despite recognizing many valuable benefits of thetest-first approach, some programmers are still unwilling to choose it. A number ofcomments on the surveys corresponded with this trend. Several programmers noted
187

Mature Programmer Opinions
0% 20% 40% 60% 80% 100%
FewerDefects
Simpler
Correctness
ThoroughTesting
BestApproach
Choice
Ch
arac
teri
stic
% Choosing
Test-First Test-Last
Figure 7.15: Mature Programmer Opinions of Test-First/Test-Lest Methods
that even though they thought the test-first approach was better, they perceived itas being more difficult or very different from what they were comfortable with.
The beginning programmer survey data from Figure 7.14 was divided into twogroups: those who used the test-first approach on at least one project and those whoonly used the test-last approach on all projects. The former group contained a totalof 65 programmers and the latter group had 88 programmers. Figure 7.16 reportsthe percent of programmers preferring the test-first and test-last approaches on thesix characteristics out of programmers who used the test-first approach on at leastone project. Figure 7.17 reports the same information for the programmers whoused the test-last approach on all projects.
Likewise the mature programmer survey data from Figure 7.15 was divided intotwo groups: those who used the test-first approach on at least one project and thosewho only used the test-last approach on all projects. The former group contained atotal of 16 programmers and the latter group had 15 programmers. Figure 7.18 re-ports the percent of programmers preferring the test-first and test-last approacheson the six characteristics out of programmers who used the test-first approach onat least one project. Figure 7.19 reports the same information for the programmerswho used the test-last approach on all projects.
These charts demonstrate that mature programmers who try the test-first ap-proach almost unanimously like and choose the test-first approach. Beginning pro-grammers clearly have a preference for the test-last approach. However, the chartsillustrate that trying the test-first approach significantly increases the likelihood
188
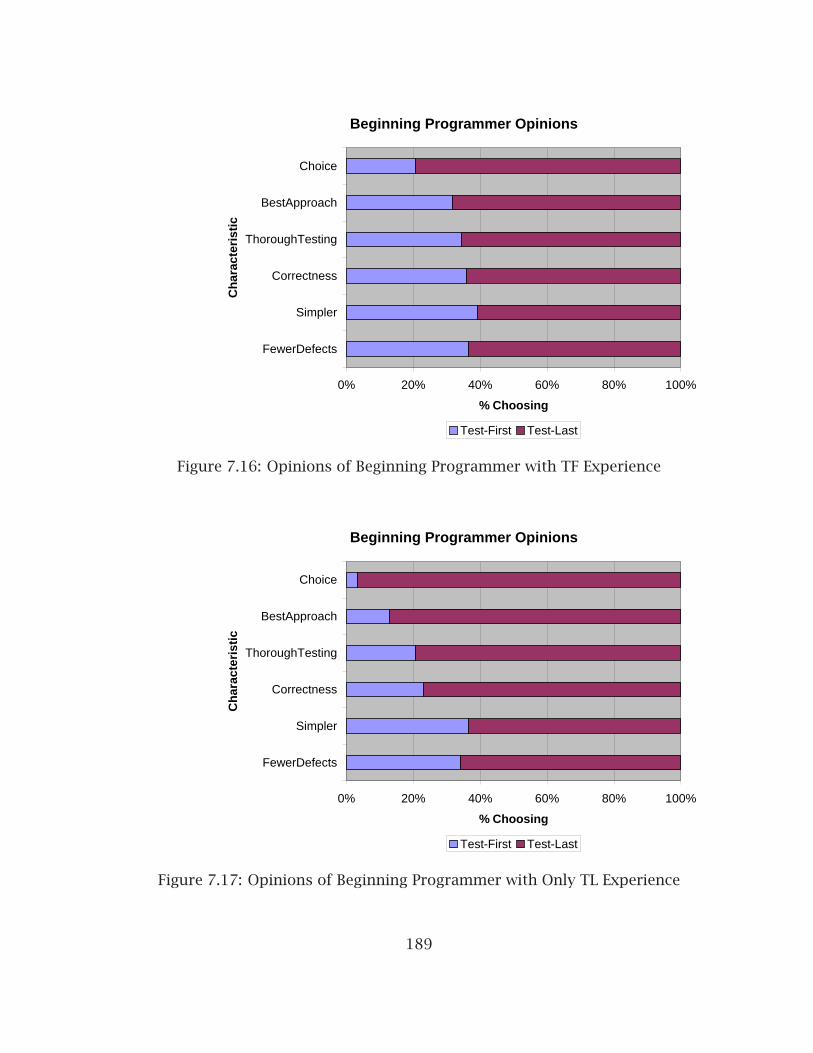
Beginning Programmer Opinions
0% 20% 40% 60% 80% 100%
FewerDefects
Simpler
Correctness
ThoroughTesting
BestApproach
Choice
Ch
arac
teri
stic
% Choosing
Test-First Test-Last
Figure 7.16: Opinions of Beginning Programmer with TF Experience
Beginning Programmer Opinions
0% 20% 40% 60% 80% 100%
FewerDefects
Simpler
Correctness
ThoroughTesting
BestApproach
Choice
Ch
arac
teri
stic
% Choosing
Test-First Test-Last
Figure 7.17: Opinions of Beginning Programmer with Only TL Experience
189

Mature Programmer Opinions
0% 20% 40% 60% 80% 100%
FewerDefects
Simpler
Correctness
ThoroughTesting
BestApproach
Choice
Ch
arac
teri
stic
% Choosing
Test-First Test-Last
Figure 7.18: Opinions of Mature Programmer with TF Experience
Mature Programmer Opinions
0% 20% 40% 60% 80% 100%
FewerDefects
Simpler
Correctness
ThoroughTesting
BestApproach
Choice
Ch
arac
teri
stic
% Choosing
Test-First Test-Last
Figure 7.19: Opinions of Mature Programmer with Only TL Experience
190

that programmers will see benefits with and may choose the test-first approach.Hypothesis O1 examines whether programmers prefer the test-first or test-last
approach. In the pre-experiment survey, beginning programmers had a statisticallysignificant higher opinion of the test-last approach over the test-first approach. Ad-ditionally 76% indicated that they would choose the test-last approach. Mature pro-grammers had a slightly (not statistically significant) higher opinion of the test-firstapproach and 62% indicated that they would use the test-first approach if giventhe chance. As a result, we must keep the O1 null hypothesis and assume thatprogrammers in general do not prefer the test-first approach.
Hypothesis O2 examines programmer opinions after having tried the test-firstapproach. The differences in choice as reported in Figures 7.16, 7.17, 7.18, and 7.19are statistically significant for both the beginning and mature developers. There-fore we can claim that developers (both beginning and mature) who try the test-first approach are significantly more likely to choose the test-first approach overthe test-last approach. Despite this significant difference, a majority of beginningdevelopers still would choose the test-last approach, while a majority of mature de-velopers would choose the test-first approach. These results allow us to reject theO2 null hypotheses for mature developers and claim that mature programmers pre-fer the test-first approach. Although the improvement is significant for beginningdevelopers, we still cannot say that they prefer the test-first approach.
7.1.8 Empirical Evidence Summary and Conclusions
Complexity, coupling, cohesion, size, and testing were identified as relevant compo-nents of the four quality characteristics: understandability, maintainability, reusabil-ity, and testability. Table 7.4 summarizes the results in these categories from theprevious sections. The table reports which approach had desirable values. A ’TL’in a cell indicates that the test-last approach produced more desirable values forthe corresponding experiment and characteristic. A ’TF’ in a cell indicates that thetest-first approach produced the more desirable values. Blank cells indicate thatresults were not valid or available for that particular experiment. The value ’Mixed’indicates that neither approach was consistently better for component metrics. Val-ues reported in red indicate that at least some of the metric differences for thatcharacteristic were statistically significant.
As discussed in the previous sections and illustrated here, it appears that thetest-first approach did improve internal software quality for mature developers interms of complexity, size, and testing. In addition, mature developers who haveapplied the test-first approach prefer it over a test-last approach. The evidence issignificant enough to make the following claims:
1. Mature developers applying the test-first approach are likely to write less com-plex code than they would write with a test-last approach.
191

Experiment Complexity Coupling Cohesion Size Testing
CS1 Fall 2005 P4 TL TFCS1 Fall 2005 P5 TF TLCS2 Fall 2005 P1 TL TL TL TL TFCS2 Fall 2005 P2 TL TL TL TL TFCS2 Fall 2005 P3 TL TFCS2 Spr 2006 P1 TL TLCS2 Spr 2006 P2 TL TFCS2 Spr 2006 P3 TL TLUndergrad SE TF TL TL TF TFUndergrad SE (Text UI) TF TL TL TF TFGrad SE TF Mixed TL TF TFIndustry Bowling TFIndustry Case Study TF TL TF TF TFIndustry 3 (TF/TL) TL TF TF Mixed TFIndustry 2 (TL/TF) TL TF TF Mixed TFIndustry 1 (No-Tests/TF) TF TL TL TF TF
Table 7.4: Quality Comparison Summary
2. Mature developers applying the test-first approach are likely to write moresmaller units (methods and classes) than they would write with a test-last ap-proach.
3. Developers at all levels applying the test-first approach are likely to write moretests and achieve higher test coverage than with a test-last approach.
4. Mature developers who have applied both the test-first and test-last approachare more likely to choose the test-first approach.
There was no clear best approach in terms of coupling and cohesion. It appearsthat a test-last approach may be best for beginning developers in terms of com-plexity, coupling and cohesion, but the test-first approach is preferable in terms oftesting. However external evaluations of the CS2 projects revealed some statisticallysignificant improvements in observed quality with the test-first projects.
Coupling, cohesion, complexity, size, and testing were identified as componentsof the desirable quality characteristics of understandability, maintainability, reusabil-ity, and testability. We cannot make the claim that the test-first approach improvesall of the characteristics completely. Hence we cannot reject the Q1 null hypothe-sis. However, this research has demonstrated that the test-first approach can causesignificant quality improvements by lowering code complexity, reducing the size ofmethods and classes, and increasing developer testing. The evidence merits reject-ing the T1 and T2 null hypotheses.
192

Further, section 6.2.2 provided evidence that code developed in a test-first man-ner and covered by automated unit tests was of a higher quality than code notcovered by such tests. This evidence was not sufficient to reject the Q2 null hy-pothesis, but some measures approached statistical significance. Given that thetest-first approach was shown to consistently improve test volume and test cover-age, it is likely that the simple existence of better tests will improve the internalquality of software. Combining this with the improvements in complexity and sizeprovide compelling motivation for organizations to consider adopting TDD.
The academic experiments revealed that test-first programmers tended to bemore productive, implementing equivalent or better solutions in less time. The dif-ferences were not statistically significant so we cannot reject the P1 null hypothesis.
Measures of programmer opinions indicated that programmers do not initiallyprefer the test-first approach so we must keep the O1 null hypothesis. Howeveropinions of the test-first approach significantly improve with practice. Some evi-dence indicates that opinions of the test-last approach may actually decrease withpractice. Mature developers who have tried the test-first approach do prefer thetest-first approach to the extent that we can reject the O2 null hypothesis.
7.2 Evaluation and External Validity
External validity involves demonstrating that results discovered in one study canbe reproduced elsewhere, and that the results generalize to broader environments.Three approaches are taken to evaluate this research. First, while the research wasbeing designed and conducted, informal reviews were requested from a number ofsources. Computer science faculty and dissertation committee members at the Uni-versity of Kansas reviewed the proposed studies in the oral comprehensive exam, asthe experiments were being integrated into the courses, and at the end of the firstexperiment. In addition, the author participated in the Doctoral Symposium at theOOPSLA’05 conference. In this forum, five faculty reviewers critiqued and advisedthe research plans and early results. At least one of the reviewers had recent expe-rience with empirical software engineering studies of this nature. Additional adviceand reviews were requested from outside faculty and researchers including LaurieWilliams from North Carolina State University and Steve McConnell with ConstruxSoftware.
The second evaluation of this research resulted from the range of experimentsand their environments, as well as the case study conducted in a professional en-vironment. Similar results across a range of academic and industry environmentsstrengthen the results, while differing results raise questions. As demonstrated inthe previous section, a number of similar results emerged in all or nearly all ofthe experiments. Some differences also emerged, pointing to possible effects of en-vironment and programmer maturity. Other differences have less obvious causes
193

and indicate that either the approach used has no effect on those aspects, or thatconfounding factors existed and further experiments are necessary.
The third evaluation of this research involves external peer-review. The followingsections discuss the publications and conference presentations, awards and grants,and external presentations resulting from this research. This research has enjoyedvery positive responses in a wide range of venues. Reviewer comments, publicationacceptance, and a prestigious international award serve as meaningful confirmationof the research’s validity.
7.2.1 Peer-Reviewed Publications
This research resulted in the following six peer-reviewed publications to date.
1. The background and framing of the problem appeared as a cover feature inthe September 2005 issue of IEEE Computer [45]. This provided very wideexposure early in the research.
2. Results from the first empirical study in the undergraduate software engineer-ing course were published and presented at the IEEE 19th Conference on Soft-ware Engineering Education and Training (CSEE&T’06) in North Shore, Oahu inApril 2006 [49].
3. The test-driven learning approach described in Appendix A was published andpresented at the ACM Technical Symposium of the Special Interest Group onComputer Science Education (SIGCSE’06) in Houston, Texas in March 2006 [50].
4. The research approach and early results were presented in the Doctoral Sym-posium and an extended abstract was published at the ACM SIGPLAN Confer-ence on Object Oriented Programming, Systems, Languages, and Applications(OOPSLA’06) in San Diego, California in October 2005 [47].
5. The research approach and early results were presented in the Poster Ses-sion and ACM Student Research Competition, and an extended abstract waspublished at the ACM SIGPLAN Conference on Object Oriented Programming,Systems, Languages, and Applications (OOPSLA’06) in San Diego, California inOctober 2005 [48].
6. The research approach and intermediate results were published in a full paperin the ACM Digital Library in conjunction with receiving third place in theGrand Finals of the ACM Student Research Competition [46].
The final results are being prepared for submission to IEEE Transactions on Soft-ware Engineering and a high level summary will be prepared for submission to IEEESoftware.
194

7.2.2 Awards and Grants
This research enjoyed significant external recognition. Most notably the author waspresented with the third place award in the Grand Finals of the ACM Student Re-search Competition sponsored by Microsoft. The award was presented along withthe Turing Award and other prestigious awards at the annual ACM Awards Banquetat the Westin St. Francis Hotel in San Francisco May 20, 2006.
Following the first two stages of the competition, the author was awarded thirdplace in the ACM Student Research Competition (SRC) at the OOPSLA’05 conferencein San Diego, CA in October 2005. This award qualified the author to participate inthe Grand Finals of the ACM SRC.
In summer 2005 the author received an ACM SIGCSE Special Projects Award insupport of the development and dissemination of the test-driven learning approach.In addition, the author was accepted to and given travel support for the OOPSLA’05Doctoral Symposium in San Diego, CA and the NSF-sponsored Academy of SoftwareEngineering Educators and Trainers (ASEE&T’06) symposium at the CSEE&T’06 con-ference in North Shore, Oahu.
7.2.3 Presentations
The author was fortunate to present this research in a number of venues. An earliersection mentioned the conference presentations in the OOPSLA’05 Doctoral Sym-posium, the OOPSLA’05 Poster Session, the SIGCSE’06 paper presentation, and theCSEE&T’06 paper presentation. In addition, the research was presented at OOP-SLA’05 to a panel of distinguished judges in the second round of the ACM StudentResearch Competition.
TDD training and research results were also presented in multi-day training ses-sions at Cessna Aircraft Company and Engenio Information Systems (formerly LSILogic). Also because the author was applying for faculty positions, a number ofpresentations were given on interview trips to universities across the United States.
7.3 Additional Contributions
In addition to the significant empirical results, this research contributes a frame-work for conducting empirical TDD studies which can be replicated. Further, thisresearch offers a pedagogical approach to teaching test-driven development.
7.3.1 Framework for Empirical TDD Studies
A valuable by-product of this research is a framework for conducting future studiesof TDD efficacy. Despite attempts to make this set of experiments as comprehensive
195

as possible, it is unlikely that a single set of studies can explore all aspects of a de-velopment approach. Plus as was noted earlier, additional studies will be necessaryto provide external validity through additional environments. By documenting howthis study was conducted and providing instruments, tools, and methods, futurestudies can be completed more efficiently.
All assessment tools including the pre and post experiment attitude surveys,information on software metric collection and analysis tools, and TDD training ma-terials are available through the appendices of this document and on the web. Ahome for test-driven development education has been established on the web athttp://www.simexusa.com/tdl/. It is hoped that this site will evolve and growto facilitate the community-driven communication of ideas on test-driven develop-ment, particularly in undergraduate education.
7.3.2 Pedagogical Contributions
Appendix A describes the test-driven learning approach developed in this research.It is the opinion of the author that the TDL approach has tremendous potential forimproving computer science pedagogy. A particular advantage of the TDL approachis that it requires no additional instruction time. It provides a strategy to improvetesting and design at virtually no cost besides the learning curve for the instructor.
Computer science educators have expressed enthusiastic interest in TDL. TheTDL approach was presented at the national technical symposium of the ACM Spe-cial Interest Group on Computer Science Education (SIGCSE) in Houston, Texas inMarch 2006. The presentation was very well attended and received significant in-terest with a long line of questioners following the talk. In a presentation the fol-lowing day, Lucas Layman from North Carolina State University highlighted the TDLapproach as an important idea that computer science educators should consideradopting. After learning about TDL in the Doctoral Symposium at OOPSLA’06,Robert Kessler from the University of Utah declared he now knew how he wasgoing to teach his next course. Also, following the presentation of the first aca-demic experiment at the Conference on Software Engineering Education and Train-ing (CSEE&T) in Hawaii in April 2006, a significant portion of the questions focusedon the TDL approach.
The TDL approach was only briefly utilized in the undergraduate Programming1 (CS1) and Programming 2 (CS2) experiments. It is hoped that the enthusiasm overTDL will result in the approach being attempted and studied in a full semester. It ispossible that complete lab or course text books will be written incorporating TDL.
196
7.4 Summary and Future Work
Despite many significant advances, software construction is still plagued with manyfailures. Development organizations struggle to make intelligent development methodadoption decisions due to a lack of maturity and a general lack of empirical evidenceof what methods are best in what contexts. While some individual programmers andorganizations have learned to value and apply disciplined, yet flexible methods, stu-dents do not generally graduate with these skills.
Test-driven development is a disciplined development practice that promises toimprove software design quality while reducing defects with no increased effort.This research carefully examined the potential of TDD to deliver these benefits.Empirical software engineering methods were applied in a set of formal controlledlongitudinal studies with undergraduate and graduate students at the University ofKansas and professional programmers in a Fortune 500 company.
This research has demonstrated that TDD can and is likely to improve some soft-ware quality aspects at minimal cost over a comparable test-last approach. In partic-ular it has shown statistically significant differences in the areas of code complexity,size, and testing. These internal quality differences can substantially improve exter-nal software quality (defects), software maintainability, software understandability,and software reusability.
Additional empirical studies should replicate the experiments of this research insimilar and new environments. It is anticipated that the author will replicate thisexperiment in 2006-2007 in the year-long senior capstone sequence of the softwareengineering major at California Polytechnic State University at San Luis Obispo, Cal-ifornia. This environment will examine mature undergraduate students working ona much larger project for an external client.
This research revealed a number of differences between TDD acceptance andefficacy in beginning and mature developers. These two groups also had the con-founding factor of using different languages (C++ and Java) and test frameworks(asserts and JUnit). Futures studies should examine if the use of Java and JUnitimproves TDD acceptance and efficacy in early programming courses.
Future studies could examine the question of how much up-front software ar-chitecture and design work should ideally be completed before engaging in the TDDprocess. These studies should consider scale and safety concerns of the projects.
An interesting situation was noted when the CS1 and industry experiment 3programmers went from a test-first to a test-last approach. In these situations,testing volume and coverage stayed high, near the levels of the test-first projects.Future studies could examine whether this trend continues over time. One couldstudy whether test-first programmers continue to write high volumes of tests withhigh test coverage, or whether these achievements taper over time.
In a private email, Steve McConnell of Construx Software suggested several ad-ditional studies such as comparing the test-first approach to an approach that in-
197

cluded formal inspections. Another suggestion was to study the learning curve ofthe test-first approach as well as programmer discipline with the test-first approachin practice. Some of the professional programmers in the study noted the high-levelof discipline required to stay with the test-first approach on a daily basis.
This research also has demonstrated that students at a certain maturity levelcan learn and apply TDD effectively. Pedagogical tools and resources have beendeveloped and disseminated through the test-driven learning approach. These ex-periments only applied the TDL approach in a small portion of several courses.Future studies should examine their efficacy when applied throughout an entirecourse. The TDL resources may have the potential to revolutionize in a subtle butsubstantial way the methods by which computer programming is taught.
As a result, it is believed that this research can have a significant impact onthe state of software construction. Some software development organizations willbe convinced to adopt TDD in appropriate situations. New textbooks can be writ-ten applying the test-driven learning approach. As students learn to take a moredisciplined approach to software development, they will carry this approach intoprofessional software organizations and improve the overall state of software con-struction.
198
Bibliography
[1] The CHAOS report. Technical report, Standish Group International, Inc., 1995.
[2] Computing curricula 2001. Journal on Educational Resources in Computing,1(3es):1, 2001.
[3] 2004 third quarter research report. Technical report, Standish Group Interna-tional, Inc., 2004.
[4] P. Abrahamsson, O. Salo, J. Ronkainen, and J. Warsta. Agile software devel-opment methods: review and analysis. Technical Report 478, Espoo, Finland:Technical Research Centre of Finland, 2002.
[5] P. Abrahamsson, J. Warsta, M.T. Siponen, and J. Ronkainen. New directions onagile methods: a comparative analysis. In Proceedings of the 25th InternationalConference on Software Engineering (ICSE-03), pages 244–254, Piscataway, NJ,May 3–10 2003. IEEE Computer Society.
[6] ACM. ACM curricula recommendations volume i: Computing curric-ula 1991: Report of the ACM/IEEE-cs joint curriculum task force, 1991.http://www.acm.org/education/curricula.html.
[7] Agile Alliance, 2004. http://www.agilealliance.org.
[8] Steven K. Andrianoff and David B. Levine. Role playing in an object-orientedworld. In SIGCSE ’02: Proceedings of the 33rd SIGCSE Technical Symposium onComputer Science Education, pages 121–125. ACM Press, 2002.
[9] Apache. http://www.mockobjects.com.
[10] Apache. http://jakarta.apache.org/cactus/.
[11] Apache. http://incubator.apache.org/derby/.
[12] David Astels. Test Driven Development: A Practical Guide. Prentice hall PTR,2003.
199

[13] E.G. Barriocanal, M.S. Urb’an, I.A. Cuevas, and P.D. P’erez. An experience inintegrating automated unit testing practices in an introductory programmingcourse. ACM SIGCSE Bulletin, 34(4):125–128, December 2002.
[14] K. Beck and et al., 2001. http://www.agilemanifesto.org.
[15] Kent Beck. Extreme Programming Explained. Addison-Wesley Longman, Inc.,2000.
[16] Kent Beck. Aim, fire. Software, 18(5):87–89, Sept.-Oct. 2001.
[17] Kent Beck. Test Driven Development: By Example. Addison-Wesley, 2003.
[18] B. Boehm. A spiral model of software development and enhancement. In Pro-ceedings of the International Workshop on Software Process and Software Envi-ronments. ACM Press, 1985.
[19] F. Brooks. The Mythical Man-Month. Addison-Wesley, 1975.
[20] Ilene Burnstein. Practical Software Testing. Springer-Verlag, 2003.
[21] Cenqua. Clover, 2006. http://www.cenqua.com/clover/.
[22] Henrik Baerbak Christensen. Systematic testing should not be a topic in thecomputer science curriculum! In Proceedings of the 8th Annual Conference onInnovation and Technology in Computer Science Education, pages 7–10. ACMPress, 2003.
[23] Mark Doliner. Cobertura, 2006. http://cobertura.sourceforge.net/.
[24] Eclipse. http://www.eclipse.org/org/press-release/feb2004foundationpr.html.
[25] S.H. Edwards. Rethinking computer science education from a test-first perspec-tive. In Proceedings of the 18th Annual ACM SIGPLAN Conference on Object-oriented Programming, Systems, Languages, and Applications: Educators’ Sym-posium, pages 148–155, 2003.
[26] S.H. Edwards. Using test-driven development in the classroom: providing stu-dents with automatic, concrete feedback on performance. In Proceedings of theInternational Conference on Education and Information Systems: Technologiesand Applications EISTA’03, August 2003.
[27] H. Erdogmus. On the effectiveness of test-first approach to programming. IEEETransactions on Software Engineering, 31(1):1–12, January 2005.
[28] H. Mills et al. Cleanroom software engineering. Software, pages 19–25, Sept.1987.
200

[29] Norman E. Fenton. Software Metrics: A Rigorous Approach. Chapman & Hall,Ltd., London, UK, UK, 1991.
[30] Allan Fisher and Jane Margolis. Unlocking the clubhouse: the carnegie mellonexperience. SIGCSE Bulletin, 34(2):79–83, 2002.
[31] M. Fowler. Inversion of control containers and the dependency injection pat-tern, 2003. http://www.martinfowler.com/articles/injection.html.
[32] Martin Fowler. Refactoring: Improving the Design of Existing Code. Addison-Wesley, 1999.
[33] Jr. Frederick P. Brooks. No silver bullet: essence and accidents of softwareengineering. IEEE Computer, 20(4):10–19, 1987.
[34] E. Gamma and K. Beck. http://www.junit.org.
[35] Erich Gamma, Richard Helm, Ralph Johnson, and John Vlisside. Design Pat-terns: Elements of Reusable Object-Oriented Software. Addison-Wesley, Read-ing, Massachusetts, 1995.
[36] D. Gelperin and B. Hetzel. The growth of software testing. Communications ofthe ACM, 31(6):687–695, 1988.
[37] Boby George and Laurie Williams. A structured experiment of test-driven de-velopment. Information and Software Technology, 46(5):337–342, 2004.
[38] T. Gilb. Software Metrics. Little, Brown, and Co., 1976.
[39] R.L. Glass, V. Ramesh, and I. Vessey. An analysis of research in computingdisciplines. Communications of the ACM, 47(6):89–94, June 2004.
[40] J.B. Goodenough and S.L. Gerhart. Toward a theory of test data selection. IEEETransactions on Software Engineering, 2:156–173, June 1975.
[41] Gorel Hedin, Lars Bendix, and Boris Magnusson. Introducing software engineer-ing by means of extreme programming. In Proceedings of the 25th InternationalConference on Software Engineering, pages 586–593. IEEE Computer Society,2003.
[42] Hasko Heinecke and Christian Noack. Integrating Extreme Programming andContracts. Addison-Wesley Professional, 2002.
[43] Brian Henderson-Sellers. Object-Oriented Metrics: Measures of Complexity.Prentice Hall, Upper Saddle River, NJ, USA, 1996.
[44] Watts Humphrey. Introduction to the Personal Software Process. Addison-Wesley, 1997.
201

[45] D. Janzen and H. Saiedian. Test-driven development: concepts, taxonomy andfuture directions. IEEE Computer, 38(9):43–50, Sept 2005.
[46] David Janzen. An empirical examination of test-driven development. SRCGrand Finals Third Place Winner, ACM Digital Library.
[47] David Janzen. Software architecture improvement through test-driven devel-opment. In OOPSLA, pages 240–241, 2005.
[48] David Janzen. Software architecture improvement through test-driven devel-opment. In OOPSLA, pages 222–223, 2005.
[49] David Janzen and Hossein Saiedian. On the influence of test-driven develop-ment on software design. In Nineteenth Conference on Software EngineeringEducation & Training, pages 141–148. IEEE-CS, 2006.
[50] David Janzen and Hossein Saiedian. Test-driven learning: Intrinsic integrationof testing into the cs/se curriculum. In Proceedings of the 37th SIGCSE Tech-nical Symposium on Computer Science Education, pages 254–258. ACM Press,2006.
[51] R. Jeffries.
[52] Rod Johnson, Juergen Hoeller, Alef Arendsen, Thomas Risberg, and Colin Sam-paleanu. Java Development with the Spring Framework. Wrox, Indianapolis,Indiana, 2005.
[53] Reid Kaufmann and David Janzen. Implications of test-driven development:a pilot study. In Companion of the 18th Annual ACM SIGPLAN Conferenceon Object-oriented Programming, Systems, Languages, and Applications, pages298–299. ACM Press, 2003.
[54] Michael Kolling and John Rosenberg. Guidelines for teaching object orienta-tion with java. In Proceedings of the 6th Annual Conference on Innovation andTechnology in Computer Science Education, pages 33–36. ACM Press, 2001.
[55] Software Measurement Laboratory, 2005. http://ivs.cs.uni-magdeburg.de/sw-eng/us/metclas/index.shtml.
[56] Craig Larman and Victor R. Basili. Iterative and incremental development: abrief history. IEEE Computer, 36(6):47–56, June 2003.
[57] Tim Littlefair. C and c++ code counter, 2003. http://cccc.sourceforge.net.
[58] Robert C. Martin. Agile Software Development: Principles, Patterns, and Prac-tices. Pearson Education, Inc., 2003.
202

[59] Vincent Massol and Ted Husted. JUnit in Action. Manning, 2004.
[60] E. Michael Maximilien and Laurie Williams. Assessing test-driven developmentat IBM. In Proceedings of the 25th International Conference on Software Engi-neering (ICSE-03), pages 564–569, Piscataway, NJ, May 3–10 2003. IEEE Com-puter Society.
[61] Bertrand Meyer. Applying “Design by Contract". IEEE Computer, 25(10):40–51,1992.
[62] R. Mugridge. Challenges in teaching test driven development. In Proceedings ofXP 2003, pages 410–413, May 2003.
[63] M.M. Muller and O. Hagner. Experiment about test-first programming. IEEEProceedings-Software, 149(5):131–136, 2002.
[64] M.M. Muller and F. Padberg. On the economic evaluation of XP projects. InProceedings of ESEC/FSE’03, pages 168–177, Sept 2003.
[65] James Noble, Stuart Marshall, Stephen Marshall, and Robert Biddle. Less ex-treme programming. In Proceedings of the Sixth Conference on Australian Com-puting Education, pages 217–226. Australian Computer Society, Inc., 2004.
[66] Mataž Pancur, Mojca Ciglaric, Matej Trampuš, and Tone Vidmar. Towards em-pirical evaluation of test-driven development in a university environment. InProceedings of EUROCON 2003. Computer as a Tool. The IEEE Region 8, vol-ume 2, pages 83–86, 2003.
[67] Andrew Patterson, Michael Kolling, and John Rosenberg. Introducing unit test-ing with BlueJ. In Proceedings of the 8th Annual Conference on Innovation andTechnology in Computer Science Education, pages 11–15. ACM Press, 2003.
[68] Patrick Peak and Nick Heudecker. Hibernate Quickly. Manning, Greenwich,Connecticut, 2006.
[69] R. Poston. Automating Specification-Based Software Testing. IEEE ComputerSociety Press, 1996.
[70] R.S. Pressman. Software Engineering: A Practitioner’s Approach, Sixth Edition.McGraw Hill, 2005.
[71] Jonathan Rasmusson. Introducing XP into greenfield projects: lessons learned.Software, 20(3):21–28, 2003.
[72] Jack Reeves. What is software design? C++ Journal, 2(2), 1992.
[73] D.J. Reifer. How good are agile methods? Software, 19:16–18, Jul/Aug 2002.
203

[74] W. Royce. Modeling the development of large software systems. In Proceedingsof Westcon, pages 328–339. IEEE CS Press, 1970.
[75] Frank Sauer. Eclipse metrics, 2006. http://metrics.sourceforge.net/.
[76] Jean-Guy Schneider and Lorraine Johnston. extreme programming at univer-sities: an educational perspective. In Proceedings of the 25th InternationalConference on Software Engineering, pages 594–599. IEEE Computer Society,2003.
[77] Power Software. Krakatau metrics professional, 2006.http://www.powersoftware.com/kp/.
[78] Man Machine Systems. Jstyle 5.0, 2006. http://www.mmsindia.com/jstyle.html.
[79] Unknown. Agile methodologies survey results, January 2003.http://www.shinetech.com/download/attachments/98/ShineTechAgileSurvey2003-01-17.pdf?version=1.
[80] Unknown. Why so many cplusplus test frameworks, 2004.http://c2.com/cgi/wiki?WhySoManyCplusplusTestFrameworks.
[81] Glenn Vanderburg. A simple model of agile software processes - or - extremeprogramming annealed. In OOPSLA, pages 539–545, 2005.
[82] VerifySoft. Ctc++, 2006. http://www.verifysoft.com/en_ctcpp.html.
[83] I. Vessey, V. Ramesh, and R.L. Glass. A unified classification system for researchin the computing disciplines. Technical Report TR-107-1, Indiana University,2002.
[84] Erez Volk, 2005. http://cxxtest.sourceforge.net/.
[85] W. Wayt Gibbs. Software’s chronic crisis. Scientific American (InternationalEdition) 271,, 271(3):72–81, 1994.
[86] L. Williams. The Collaborative Software Process. PhD thesis, The University ofUtah, August 2000.
[87] L. Williams, E.M. Maximilien, and M. Vouk. Test-driven development as a defect-reduction practice. In Proceedings of the 14th IEEE International Symposium onSoftware Reliability Engineering, pages 34–45, Nov. 2003.
[88] Laurie Williams and Robert Kessler. Pair Programming Illuminated. Addison-Wesley Longman, Inc., 2002.
[89] XProgramming.com. http://www.xprogramming.com/software.htm.
204
Appendix A
Test-Driven Learning
Test-driven learning (TDL) is an approach to teaching computer programming thatinvolves introducing and exploring new concepts through automated unit tests. TDLoffers the potential of teaching testing for free, of improving programmer com-prehension and ability, and of improving software quality both in terms of designquality and reduced defect density.
This paper introduces test-driven learning as a pedagogical tool. It will provideexamples of how TDL can be incorporated at multiple levels in computer scienceand software engineering curriculum for beginning through professional program-mers. In addition, the relationships between TDL and test-driven development willbe explored.
Initial evidence indicates that TDL can improve student comprehension of newconcepts while improving their testing skills with no additional instruction time. Inaddition, by learning to construct programs in a test-driven manner, students areexpected to be more likely to develop their own code with a test-driven approach,likely resulting in improved software designs and quality.
A.1 Introduction to TDL
Programmers often learn new programming concepts and technologies through ex-amples. Instructors and textbooks use examples to present syntax and exploresemantics. Tutorials and software documentation regularly present examples toexplain behaviors and proper use of particular software elements. Examples, how-ever, typically focus on the use or the interface of the particular software element,without adequately addressing the behavior of the element.
Consider the following example from the Java 1.5 API documentation:
void printClassName(Object obj){System.out.println("The class of " + obj +
205

" is " + obj.getClass().getName());}
While this is a reasonable example of how to access an object’s class and corre-sponding class name, it only reveals the desired interface. It teaches nothing aboutthe underlying behavior. To see behavior, one must compile and execute the code.While it is desirable to encourage students to try things out on their own, this canbe time consuming if done for every possible example, plus it significantly delaysthe presentation/feedback loop.
As an alternative, we can introduce a simple automated unit test that demon-strates both the interface and the expected behavior. For instance, we could replacethe above example with the following that uses the assert keyword1:
void testClassName1(){ArrayList al = new ArrayList();assert al.toString().equals("[]");assert al.getClass().getName()
.equals("java.util.ArrayList");}
This example shows not only the same interface information as the original ex-ample in roughly the same amount of space, but it also shows the behavior bydocumenting the expected results.
A second example below demonstrates the same interface using an Integer.Notice how these two examples also reveal the toString() results for an emptyArrayList ("[]") and an Integer ("5").2
void testClassName2(){Integer i = new Integer(5);assert i.toString().equals("5");assert i.getClass().getName()
.equals("java.lang.Integer");}
These examples demonstrate the basic idea of test-driven learning:
1Although assert has existed in many languages for some time, the assert keyword was intro-duced in Java with version 1.4 and requires extra work when compiling and running:javac -source 1.4 ClassTest.javajava -ea ClassTest
2If the toString() information is deemed distracting, this first assert could simply be left outof the example.
206

• Teach by example
• Present examples with automated tests
• Start with tests
Teaching by example has a double meaning in TDL. First TDL encourages instruc-tors to teach by presenting examples with automated tests. Second, by holding testsin high regard and by writing good tests, instructors model good practices that con-tribute to a number of positive results. Students tend to emulate what they seemodeled. So as testing becomes a habit formed by example and repetition, studentsmay begin to see the benefits of developing software with tests and be motivated towrite tests voluntarily.
The third aspect of TDL suggests a test-first approach. TDL could be applied ineither a test-first or a test-last manner. With a test-last approach, a concept wouldbe implemented, then a test would be written to demonstrate the concept’s use andbehavior. With a test-first approach, the test would be written prior to implementinga concept. By writing a test before implementing the item under test, attention isfocused on the item’s interface and observable behavior. This is an instance of thetest-driven development (TDD) [17] approach that will be discussed in section three.
A.2 TDL Objectives
Teaching software design and testing skills can be particularly challenging. Under-graduate curriculums and industry training programs often relegate design and test-ing topics to separate, more advanced courses, leaving students perhaps to thinkthat design and testing are either hard, less important, or optional.
This paper introduces TDL as a mechanism for teaching and motivating the useof testing as both a design and a verification activity, by way of example. TDL canbe employed starting in the earliest programming courses and continuing throughadvanced courses, even those for professional developers. The lead author hasintegrated TDL into CS1 and a four-day C++ course for experienced professionalprogrammers. Further, TDL can be applied in educational resources from textbooksto software documentation.
Test-driven learning has the following objectives:
• Teach testing for free
• Teach automated testing frameworks simply
• Encourage the use of test-driven development
• Improve student comprehension and programming abilities
207
• Improve software quality both in terms of design and defect density
Some have suggested that if objects are the goal, then we should start by teach-ing objects as early as the first day of the first class [8]. TDL takes a similar ap-proach. If writing good tests is the goal, then start by teaching with tests. If it isalways a good idea to write tests, then write tests throughout the curriculum. Ifquality software design is the goal, then start by focusing on habits that lead togood designs. Test-first thinking focuses on an object’s interface, rather than itsimplementation. Test-first thinking encourages smaller, more cohesive and moreloosely coupled modules [17], all characteristics of good design.
Examples with tests take roughly the same effort to present as examples withinput/output statements or explanations. As a result, TDL adds no extra strain ona course schedule, while having the benefit of introducing testing and good testingpractices. In other words TDL enables one to teach testing for free. It is possible thatthe instructor will expend extra effort moving to a test-driven approach, but oncemastered, the instructor may find the new approach simpler and more reusablebecause the examples contain the answers.
By introducing the use of testing frameworks gradually in courses, students willgain familiarity with them. As will be seen in sections four and five, tests can usesimple mechanisms such as assert statements, or they can utilize powerful frame-works that scale and enjoy widespread professional support. Depending on thelanguage and environment, instructors may introduce testing frameworks early orgradually.
When students observe both the interface and behavior in an example with tests,they are likely to understand a concept more quickly than if they only see the in-terface in a traditional example. Further, if students get into the habit of thinkingabout and writing tests, they are expected to become better programmers.
A.3 Related Work
Test-driven learning is not a radical new approach to teaching computer program-ming. It is a subtle, but potentially powerful way to improve teaching, both in termsof efficiency and quality of student learning, while accomplishing several importantgoals.
TDL builds on the ideas in Meyer’s work on Design by Contract [61]. Automatedunit tests instantiate the assertions of invariants and pre- and post-conditions.While contracts provide important and rigorous information, they fail to commu-nicate and implement the use of an interface in the efficient manner of automatedunit tests. Contracts have been suggested as an important complement to TDD [42].The same could be said regarding TDL and contracts.
TDL is expected to encourage adoption of TDD. Although its name implies thatTDD is a testing mechanism, TDD is as much or more about analysis and design as
208

it is about testing, and the combination of emphasis on all three stands to improvesoftware quality. Early research reports mixed results [45] regarding quality andproductivity improvements from TDD particularly on small software projects, how-ever recent research [27] suggests that a test-first approach increases the number oftests written and improves productivity, increasing the likelihood of higher qualitysoftware with similar or lower effort.
TDL was inspired by the Explanation Test [17] and Learning Test [17] testingpatterns proposed by Kent Beck, Jim Newkirk, and Laurent Bossavit. These patternswere suggested as mechanisms to coerce professional programmers to adopt test-driven development.
The Explanation Test pattern encourages developers to ask for and provide ex-planations in terms of tests. The pattern even suggests that rather than explaininga sequence diagram, the explanation could be provided by “a test case that containsall of the externally visible objects and messages in the diagram." [17]
The Learning Test pattern suggests that the best way to learn about a new facilityin an externally produced package of software is by writing tests. If you want to usea new method, class, or API, first write tests to learn how it works and ensure itworks as you expect.
TDL expands significantly on the Explanation and Learning Test ideas both in itsapproach and its audience. Novice programmers will be presented with unit testsas examples to demonstrate how programming concepts are implemented. Further,programmers will be taught to utilize automated unit tests to explore new concepts.
While the idea of using automated tests as a primary teaching mechanism isbelieved to be a new idea, the approach of requiring students to write tests in laband project exercises has a number of predecessors. Barriocanal [13] documentedan experiment in which students were asked to develop automated unit tests inprogramming assignments. Christensen [22] proposes that software testing shouldbe incorporated into all programming assignments in a course, but reports onlyon experiences in an upper-level course. Patterson [67] presents mechanisms in-corporated into the BlueJ [54] environment to support automated unit testing inintroductory programming courses.
Edwards [25] has suggested an approach to motivate students to apply TDDthat incorporates testing into project grades, and he provides an example of anautomated grading system that provides useful feedback. TDL pushes automatedtesting even earlier, to the very beginning in fact.
A.4 TDL in Introductory Courses
Test-driven learning can be applied from the very first day of the very first pro-gramming course. Textbooks often begin with a typical “Hello, World!” exampleor the declaration of a variable, some computation and an output statement. The
209

following is a possible first program in C++:
#include <iostream>using namespace std;
int main(){int age;cout << "What is your age in years?" << endl;cin >> age;cout << "You are at least "
<< age * 12<< " months old!" << endl;
}
This approach requires the immediate explanation of the language’s input/out-put facilities. While this is a reasonable first step, a TDL approach to the same firstprogram might be the following:
#include <cassert>
int main(){int age = 18;int ageInMonths;ageInMonths = age * 12;assert(ageInMonths == 216);
}
Notice how use of the assert() macro from the standard C library is used,rather than a full-featured testing framework. Many languages contain a standardmechanism for executing assertions. Assertions require very little explanation andprovide all the semantics needed for implementing simple tests. The assert ap-proach minimizes the barriers to introducing unit testing, although it does bringsome disadvantages. For instance, if there are multiple assert statements and onefails, no further tests are executed. Also, there is no support for independent testsor test suites. However, because the programs at this level are so small, the simplic-ity of assert statements seems to be a reasonable choice.
As a later example, a student learning to write for loops in C++ might be pre-sented with the following program:
#include <iostream>#include <cassert>using namespace std;
210

int sum(int min, int max);
int main(){assert(sum(3,7)==25);cout << "No errors encountered" << endl;
}
// This function sums the integers// from min to max inclusive.// Pre: min < max// Post: return-value = min + (min+1) + ...// + (max-1) + maxint sum(int min, int max){int sum = 0;for(int i=min;i<=max;i++){sum += i;
}return sum;
}
In a lab setting, the student might then be asked to write additional unit teststo understand the concept. For instance, they might add the following assert state-ments:
assert(sum(-2,2) == 0);assert(sum(-4,-2) == -9);
Later they might be asked to write unit tests for a new, unwritten function. Indoing so, they will have to design the function signature and perhaps implement afunction stub. This makes them think about what they are going to do before theyactually do it.
Once the programmer ventures beyond the lab into larger projects, tests can beseparated into a run_tests() function and tests can be partially isolated from eachother by placing them in independent scopes as in the following example:
#include <cassert>
class Exams{
211

public:Exams();int getMin();void addExam(int);
private:int scores[50];int numScores;
};
void run_tests();
int main(){run_tests();
}
void run_tests(){{ //test 1 Minimum of empty list is 0Exams exam1;assert(exam1.getMin() == 0);
} //test 1
{ //test 2Exams exam1;exam1.addExam(90);assert(exam1.getMin() == 90);
} //test 2}
TDL should not compete with other approaches in introductory courses. RatherTDL should complement and integrate well with various programming-first [2] ap-proaches such as imperative-first, objects-first, functional-first, and event-drivenprogramming among others.
A.5 TDL in later courses
TDL is applicable at all levels of learning. Advanced students and even professionalprogrammers in training courses can benefit from the use of tests in explanations.
As students gain maturity, they will need more sophisticated testing frame-works. Fortunately a wonderful set of testing frameworks that go by the name xUnithave emerged following the lead of JUnit [34]. The frameworks generally support
212

independent execution of tests (i.e. execution or failure of one test has no effect onother tests), test fixtures (common test set up and tear down), and mechanisms toorganize large numbers of tests into test suites.
The final example below demonstrates the use of TDL when exploring Java’sDefaultMutableTreeNode class. Such an example might surface when first intro-ducing tree structures in a data structures course, or perhaps when a programmeris learning to construct trees for use with Java’s JTree class. Notice the use ofthe breadthFirstEnumeration() method and how the assert statements demon-strate not just the interface to an enumeration, but also the behavior of a breadthfirst search. A complementary test could be written to explore and explain depthfirst searches. In addition, notice that this example utilizes the JUnit framework.
import javax.swing.tree.DefaultMutableTreeNode;
import junit.framework.TestCase;
public class TreeExploreTest extends TestCase {public void testNodeCreation() {DefaultMutableTreeNode node1 =
new DefaultMutableTreeNode("Node1");DefaultMutableTreeNode node2 =
new DefaultMutableTreeNode("Node2");DefaultMutableTreeNode node3 =
new DefaultMutableTreeNode("Node3");DefaultMutableTreeNode node4 =
new DefaultMutableTreeNode("Node4");node1.add(node2);node2.add(node3);node1.add(node4);Enumeration e = node1.breadthFirstEnumeration();assertEquals(e.nextElement(),node1);assertEquals(e.nextElement(),node2);assertEquals(e.nextElement(),node4);assertEquals(e.nextElement(),node3);
}}
A.6 Assessment and Perceptions
A short experiment was conducted in two CS1 sections at the University of Kansasin Spring 2005. The two sections were taught by the same instructor using a pop-ular C++ textbook. The experiment was conducted in three fifty-minute lectures
213

and one fifty-minute lab that covered the introduction of classes and arrays. Whileboth sections had been introduced previously to the assert() macro, during thisexperiment the first section was instructed using TDL and the second section waspresented examples in a traditional manner using standard output with the instruc-tor explaining the expected results.
At the end of the experiment, all students were given the same short quiz. Thequiz covered concepts and syntax from the experiment topics. In order to make thetwo sections homogeneous, two outliers (36 and 48 out of 100 on the first examprior to the TDL experiment) were removed from the sample, leaving all studentswith first exam scores above 73. The results given in Table A.1 indicate that the TDLstudents scored about ten percent higher on the quiz than the non-TDL students.While a larger study is needed before drawing any conclusions, the results indi-cate that TDL can be integrated without negative consequences and support furtherinvestigation into potential benefits.
Students Exam 1 Quiz 1100 total 10 total
TDL 13 86.15 7.84Non-TDL 14 86.71 7.14
Table A.1: TDL vs. Non-TDL Mean Scores
To gauge programmer perceptions of Test-First and Test-Last programming, asurvey was conducted at the beginning of a range of courses at the University ofKansas including CS2, an undergraduate software engineering course, and a gradu-ate software engineering course. Additionally, the survey was conducted at the endof a four-day training course for professional software developers in a large cor-poration after exposure to TDL. Students were briefly introduced to the differencesbetween Test-First and Test-Last programming, then asked their opinions of the twoapproaches and asked which approach they would use given the choice. Results aresummarized by course in Table A.2 and by years of programming experience in Ta-ble A.3. The Test-First (TF) and Test-Last (TL) opinions were recorded on a five-pointscale with 0 being the most negative and 4 the most positive.
As the data shows, while the groups all had similar opinions of the Test-First andTest-Last approaches, the more experienced programmers were much less likely tochoose a Test-First approach. Comments recorded on the surveys indicated thatthe predominant reason was a tendency to stick with what you know (Test-Last).Perhaps it is no surprise that younger students are more open to trying new ideas,but this points to the fact that early introduction of good ideas and practices mayminimize resistance.
214

No. of Avg. TF Avg. TL ChooseCourse Students Opinion Opinion TF
CS2 28 2.71 2.75 54%SE 10 2.63 3.70 50%SE(grad) 12 2.91 2.83 67%Industry 14 2.85 3.14 29%
Table A.2: TDD Survey Responses by Course
Exp. No. of Avg. TF Avg. TL Choose(Yrs) Students Opinion Opinion TF
<=10 55 2.75 3.00 55%>10 10 2.75 3.00 22%
Table A.3: TDD Survey Responses by Experience
A.7 Conclusions of early TDL study
This chapter has proposed a novel method of teaching computer programming byexample using automated unit tests. Examples of using this approach in a range ofcourses have been provided, and the approach has been initially assessed. Connec-tions between this approach and test-driven development were also explored.
This research has shown that less experienced students are more open to adopt-ing a Test-First approach, and that students who were taught for a short time withthe TDL approach had slightly better comprehension with no additional cost interms of instruction time or student effort. In addition, the benefits of modelingtesting techniques and introducing automated unit testing frameworks have beennoted.
Additional empirical research and experience is needed to confirm the positivebenefits of TDL without negative side-effects, but the approach appears to havemerit. It seems reasonable that textbooks, lab books, and on-line references couldbe developed with the TDL approach. Some materials are already available online athttp://www.simexusa.com/tdl/.
215

Appendix B
TDL and TDD Training Materials
This appendix presents several instructional materials developed in conducting thisresearch. Samples include lecture slides, labs and project descriptions.
B.1 Sample Academic Materials
B.1.1 CS1 Lecture Slides
The following slides were used in the CS1 guest lecture introducing automated unittesting and the test-first and test-last approaches.
216

Automated Unit Testing
EECS 168 Programming 1
David Janzen
Perfection is Impossible• No one writes perfect code the first time, every time
• How do we find out if code is correct?– Testing
• Forms of testing– Compiling tests for valid syntax
– Acceptance testing involves running the program as a user testing for correct operation
– Unit testing involves testing individual units (functions)
• Once we know there are defects, we must fix them through code review and debugging
Exhaustive Testing is Impossible• Even a simple one-parameter function can
have an infinite number of inputs
• So we test with a representative set of input/output combinations-14.8, -1, 0, 0.0001, 5.987, 22, 1025.9
float square(float number)
{
return number * number;
}
Manual Unit Testing• Individual units can be tested by writing drivers
// This function sums the integers from min to max inclusive.
// Pre: min < max
// Post: return-value = min + (min+1) + ... + (max-1) + max
int sum(int min, int max);
int main()
{
int first, second;
cout << “Enter two integers, the first smaller” << endl;
cin >> first >> second;
cout << “sum(“ << first << “,” << second << “) is “
<< sum(first,second) << endl;
return 0;
}
Automatic Unit Testing• Individual units can be tested by writing
automated tests with assert()
• assert() takes one boolean parameter#include <cassert>
int sum(int min, int max);
int main()
{
assert(sum(0,2) == 3);
assert(sum(-2,2) == 0);
assert(sum(3,7) == 25);
return 0;
}
assert()• If assert’s parameter is false, then program
execution is halted and a message is given#include <cassert>
int sum(int min, int max);
int main()
{
assert(sum(3,7) == 15);
return 0;
}
$./a.outassertion "sum(3,7) == 15" failed: file "sumtest.cpp", line 36
217
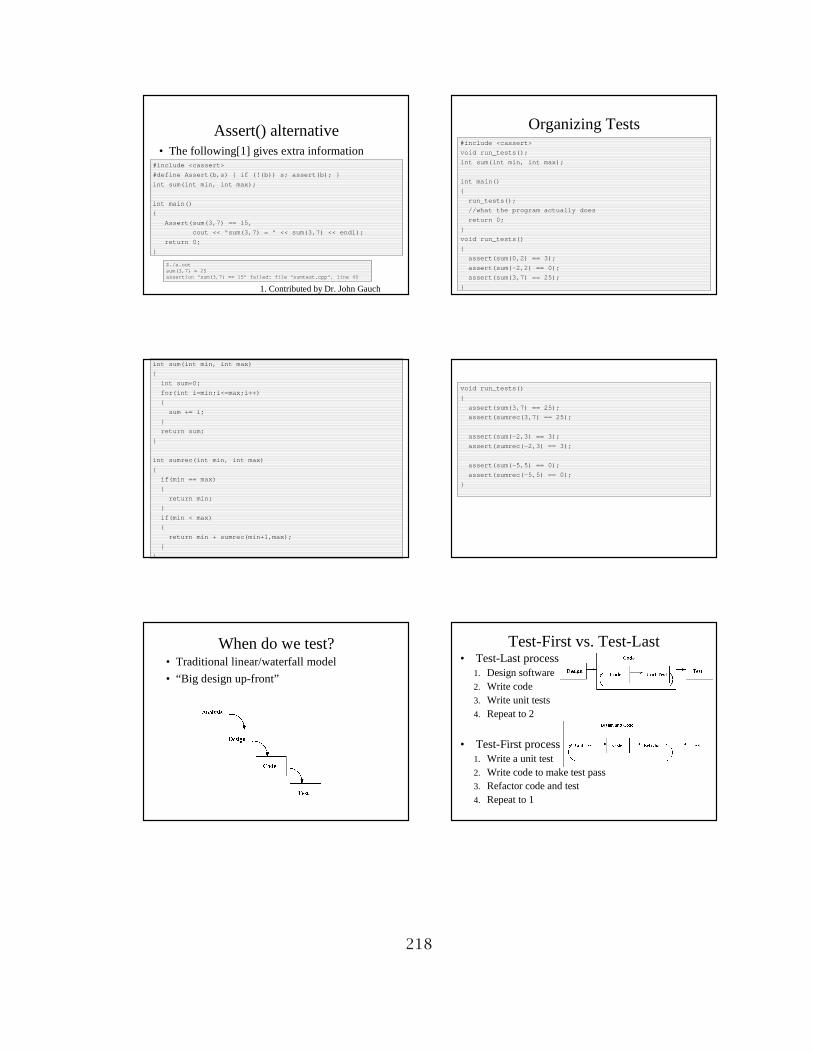
Assert() alternative• The following[1] gives extra information
#include <cassert>
#define Assert(b,s) { if (!(b)) s; assert(b); }
int sum(int min, int max);
int main()
{
Assert(sum(3,7) == 15,
cout << "sum(3,7) = " << sum(3,7) << endl);
return 0;
}
$./a.outsum(3,7) = 25assertion "sum(3,7) == 15" failed: file "sumtest.cpp", line 40
1. Contributed by Dr. John Gauch
Organizing Tests#include <cassert>
void run_tests();
int sum(int min, int max);
int main()
{
run_tests();
//what the program actually does
return 0;
}
void run_tests()
{
assert(sum(0,2) == 3);
assert(sum(-2,2) == 0);
assert(sum(3,7) == 25);
}
int sum(int min, int max)
{
int sum=0;
for(int i=min;i<=max;i++)
{
sum += i;
}
return sum;
}
int sumrec(int min, int max)
{
if(min == max)
{
return min;
}
if(min < max)
{
return min + sumrec(min+1,max);
}
}
void run_tests()
{
assert(sum(3,7) == 25);
assert(sumrec(3,7) == 25);
assert(sum(-2,3) == 3);
assert(sumrec(-2,3) == 3);
assert(sum(-5,5) == 0);
assert(sumrec(-5,5) == 0);
}
When do we test?• Traditional linear/waterfall model
• “Big design up-front”
Test-First vs. Test-Last• Test-Last process
1. Design software2. Write code3. Write unit tests4. Repeat to 2
• Test-First process1. Write a unit test2. Write code to make test pass3. Refactor code and test4. Repeat to 1
218

B.1.2 Sample CS1 Lab
EECS 168 - Laboratory Assignment 6The objective of this laboratory assignment is to introduce you to the notion of“problem decomposition” using functions. We will focus on defining new functions,calling functions, using return values, and debugging functions. In addition, auto-mated unit testing with assert() will be covered. This assignment has the followingsteps:
1. Generating random numbers
The rand function generates a random integer between 0 and RAND_MAX (asymbolic constant defined in the <stdlib.h> header file). The minimum valueof RAND_MAX must be at least 32767. If we want a to generate random num-bers to simulate the throw of a dice, then all we need is numbers between 1 -6. To achieve this the mod % operator is used:1 + rand % 6 will return a random number from 1 to 6.
The rand function is actually a pseudo-random number generator. Callingrand repeatedly produces a sequence of numbers that appears to be random.However, the sequence repeats itself each time the program is executed. Thefollowing example illustrates this.
The given program is a simulation of a very basic online Roulette spinningwheel. It is based on a single number bet. The returns usually are 35 to 1. Cutand paste this program into a cpp file and execute more than once. Follow thesequence of values closely.
//-------------------------------------------------------// Roulette.cpp// Program to demonstrate rand() and srand() functions.// Author Suchit Batheja// Fall 2003//-------------------------------------------------------
#include < iostream >#include < cstdlib >#include < ctime >using namespace std;
int main(){
int Number;double Bet;int Roule = 0;
219

// Repeat until user quitschar Ch = ’y’;while ((Ch == ’Y’) || (Ch == ’y’)){
// Get numberNumber = -1;while ((Number < 0) || (number > 36)){cout << "enter number to bet on (between 0 - 36) "
<< endl;cin >> Number;
}
// Get betBet = 0.0;while (Bet <= 0.0){cout << "enter bet amount" << endl;cin >> Bet;
}
// Spinning the wheelRoule = rand() % 37;
// After Spinningcout << "lucky number is " << roule << endl;if (number == roule){
cout << "congratulations!! you have won "<< (35 * bet) << endl;
}else{
cout << "oops you lost. better luck next time :-("<< endl;
}cout << endl << "play again y/n" << endl;cin >> Ch;
}return 0;
}
220

If you noticed, the random number sequence generated over different execu-tions are the same. This is useful if you wish to run the same experimentsagain, but not good for a game of chance. To overcome this problem a func-tion called srand(unsigned int) can be used to change the starting point of thesequence.
If the seed remains the same over multiple executions then the sequence gen-erated is again pseudo random. If the seed is made based on the system time,it will be different every time we run the program and we will get a differ-ent random sequence every time. Insert this line of code in your program:srand(time(NULL)); The seed is now set to the current time. Now see howlucky you get.
Program output
2. Writing automated unit tests with assert()
Another useful function (actually its a macro) in the C++ standard library isassert() . assert() is defined in the standard include file cassert. assert() takesone parameter which is a boolean expression. If the expression evaluates totrue, then nothing happens when the assert() is executed. If the expressionevaluates to false, then the program halts at that point and prints a messageindicating the line and the expression of the failing assert().
assert() statements can be added to your programs to test your code. Forinstance, the following program uses assert() to verify that the sum() functionworks correctly.
//-------------------------------------------------------// sum.cpp// Program to demonstrate assert() macro.// Author David Janzen// Fall 2005//-------------------------------------------------------#include <iostream>#include <cassert>using namespace std;
int sum(int min, int max);
int main(){
assert(sum(3,7)==25);
221

assert(sum(-2,3)==3);assert(sum(-5,5)==0);cout << "No errors encountered" << endl;
}
// This function sums the integers// from min to max inclusive.// Pre: min < max// Post: return-value = min + (min+1) + ...// + (max-1) + maxint sum(int min, int max){
int sum = 0;for(int i=min;i<=max;i++){sum += i;
}return sum;
}
Add three more assert statements to test the sum() function. For instance,pass in two negative numbers or make both parameters the same number.
Your main function
3. User defined functions
The following functions can be used to calculate the volumes of three differentsolids. Show how you should call each of these functions in the main functionto perform the specified tasks. Make sure the data types on parameters andreturn values match the function definitions.
//-------------------------------------------------------// Author: John Gauch// Date: Fall 2003 //tests added by David Janzen Fall 2005//-------------------------------------------------------#include <iostream>#include <cassert>using namespace std;
// Function prototypes
222

float cubeVolume( float sideLength );double sphereVolume( float sidelength );int cylinderVolume( float radius, int height );
// Calculate the volume of a cubefloat cubeVolume( float sideLength ){
return ( sideLength * sideLength * sideLength );}
// Calculate the colume of a spheredouble sphereVolume( float radius ){
return ( (4.0 / 3.0) * 3.14159 * radius * radius * radius );}
// Calculate the volume of a cylinderint cylinderVolume( float radius, int height ){
return (int) ( 3.14159 * radius * radius * height );}
// Main function to test volume functionsint main( int argc, char * argv[] ){
// Use assert() to write a test to compute// the volume of a cube whose sides are 4 long
// Use assert() to use a sphere radius and output volume
// Use assert() to calculate the volume of a Pepsi can
cout << "No errors encountered" << endl;
return 0;}
Your main function
4. Write a short function
N Factorial is equal to the product of all integers from 1 to N. Specifically,
223

factorial(N) = N x (N-1) x (N-2) x ... x 2 x 1. Write an iterative function thatperforms the N Factorial calculation. The function should take an int as aparameter and return an int as the result of the function.
Write a short program that uses assert() to test your factorial function. Placeall your assert() statements in a run_tests() function like this:
void run_tests();
int main(){
run_tests();}
void run_tests(){
{ //test 1assert( /* fill this in */ );
} //test 1
{ //test 2assert( /* fill this in */ );
} //test 2}
Tests like these are called unit tests because you are testing one unit (a func-tion) of your program. Writing tests after you have written some code is calledtest-last programming. An alternative is to do test-first programming whereyou write a test first, then write a function to make the test pass, then repeatto write another test. Notice that test-last programming primarily uses tests toverify that the code works correctly, while test-first programming forces youto make design decisions such as the function name, the function parameters,the function return type, and the function’s expected behavior when you arewriting the test. We will apply a test-first approach in lab next week.
Now that you have tested your factorial function, extend your program so thatit prompts the user for a value of the N to calculate factorial. The programshould output the result of the calculation, then prompt the user again. Itshould prompt the user until the user enters a value of zero. Then the programshould exit. Leave the tests in the program. You can comment out the call torun_tests() if you don’t want them run.
Here is a sample of what your output might look like:
224
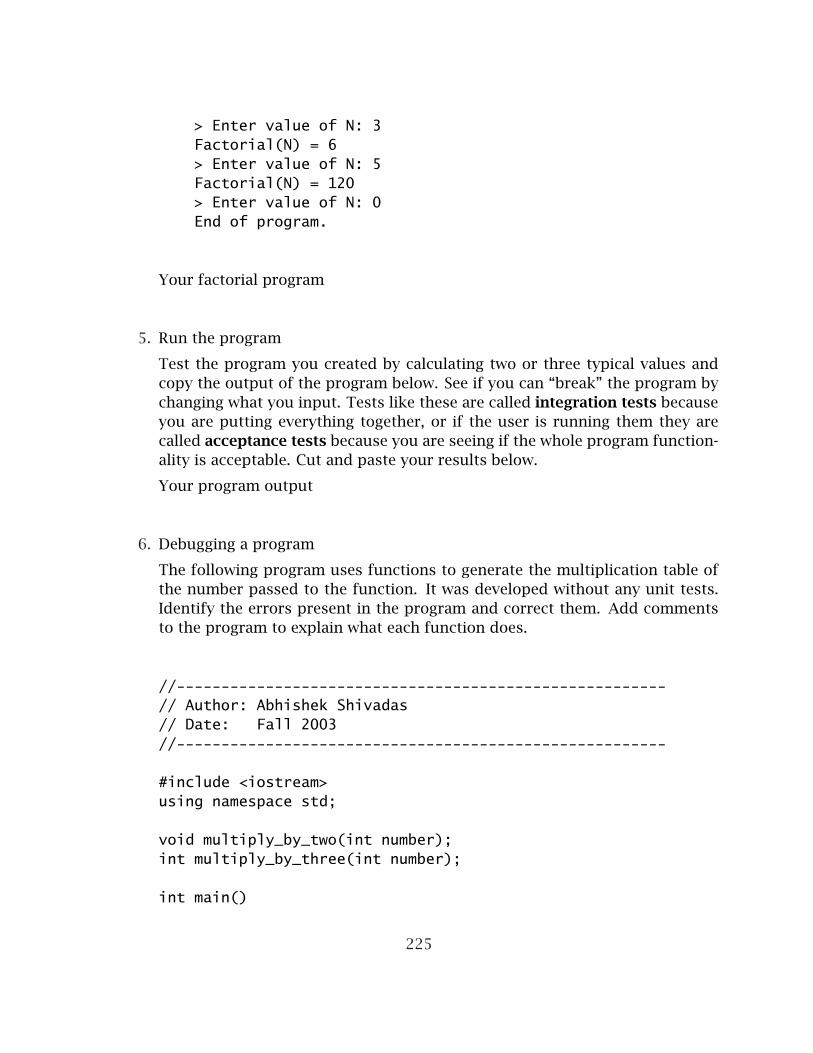
> Enter value of N: 3Factorial(N) = 6> Enter value of N: 5Factorial(N) = 120> Enter value of N: 0End of program.
Your factorial program
5. Run the program
Test the program you created by calculating two or three typical values andcopy the output of the program below. See if you can “break” the program bychanging what you input. Tests like these are called integration tests becauseyou are putting everything together, or if the user is running them they arecalled acceptance tests because you are seeing if the whole program function-ality is acceptable. Cut and paste your results below.
Your program output
6. Debugging a program
The following program uses functions to generate the multiplication table ofthe number passed to the function. It was developed without any unit tests.Identify the errors present in the program and correct them. Add commentsto the program to explain what each function does.
//-------------------------------------------------------// Author: Abhishek Shivadas// Date: Fall 2003//-------------------------------------------------------
#include <iostream>using namespace std;
void multiply_by_two(int number);int multiply_by_three(int number);
int main()
225

{
float number_two;char number_three;int number_four;
cout << "Enter the Number to multiply by two:" << endl;cin >> number_two;
cout << "Enter the Number to multiply by three:" << endl;cin >> number_three;
cout << "Enter the Number to multiply by four:" << endl;cin >> number_four;
}
void multiply_by_two(float number){
int i;for(i = number; i <= 9; i++)
cout << i << "times 2 is" << number * 2;
return i;
}
int multiply_by_three(int number){
int i;for(i == number; i <= 9; i++){
number = number * 3;cout << i << "times 3 is" << number * 3;
return number;}
}
int multiply_by_four(int number){
int i;boolean finished_calculating = true;
226

for(i = number; i <= 9; i++)cout << i << "times 4 is" << number * 4;
return finished_calculating;}
Create a C++ program called Number_Functions.cpp, and use “cut” and “paste”to copy the text above into the same. What errors do you get when you try tocompile the program? Before you start correcting these errors, edit the file toadd comments describing the purpose of the program, the author, and dateat the top of Number_Functions.cpp. Now, start entering your corrections tomake the compile errors go away. As a general rule, it is best to start with thefirst error message and recompile until that error is corrected.
For each correction, make a comment near the code you corrected indicatingwhat you did. This way, you can remember what you did. When you work onjoint programming projects everyone can keep track of changes to the code byreading everyone’s comments. Ponder over the warnings which appear whilecompiling the code and if possible try to correct the warnings as well. Theoutput of the above program should be like this:
"Number" times "2 or 3 or 4" is "Answer".....
9 times "2 or 3 or 4" is "Answer"
Corrected code
Output here
7. Submit Your Work
This lab assignment will be submitted electronically to the TAs once you fill inthe fields below and click on the “submit” button. You do NOT need to print acopy of this document to hand in.
Your full name: Your kuid number:
If you are ready to send the lab to the grader, click on the submit button.Otherwise, go back and fill in any missing pieces and then submit your work.
227
B.1.3 Sample CS2 Lab
EECS 268 - Laboratory 3
The primary objective of this lab is to learn testing approaches to improve pro-gramming practice. Automated unit testing with assert() will be covered. Secondaryobjectives include a review of programming with objects, and managing header filesand implementation files.
Testing and Debugging DiscussionNo one writes perfect code the first time, every time.
Even after code compiles , it must be tested to verify that it works the way theprogrammer thinks it should work (unit and integration testing ) and the way theclient thinks it should work (acceptance testing ).
Tests may reveal defects in the code and defects must be corrected. Often de-fects can be located and corrected simply by looking at the code and thinking aboutit. Sometimes defects are more difficult to find and fix. One approach with thesetypes of defects is to insert output statements into the code. This approach how-ever is not recommended as it is often very time-consuming and frustrating, plus itintroduces changes to the very code that you are testing and debugging. Anotherapproach is to use a debugger . A debugger is a tool that lets you “walk” throughthe program one line at a time and inspect variables (see their current values) as yougo. Last week in lab, we discussed debugging and gained experience with the DataDisplay Debugger (DDD) software. Debuggers are useful tools for finding the causesof defects after we already know there is a defect. Testing is used to discover theexistence of defects.
Entire programs can be tested directly by running the program with various inputsand checking for corresponding outputs. This process can be manual (by hand) orit can be automated using scripts, input/output files, file redirection, and diff tools.Individual units (e.g. functions) can also be tested directly by writing unit tests.We will look at a mechanism for writing automated unit tests in lab today. Auto-mated unit tests can be written before and as you write your program (Test-First )or they can be written after you have written your program (Test-Last ). The greatthing about automated unit tests is that you can run them over and over again veryquickly. If you make a change to your code, you can immediately run the tests tosee if you broke anything. Writing automated unit tests with assert() Suppose youare writing a Date class. The code written so far might look like the following:
In file Date.h
228

class Date {public:
Date();Date(int,int,int);int getMonth();int getDay();int getYear();
private:int month;int day;int year;
};
In file Date.cpp
#include "Date.h"
Date::Date(){month = 0;day = 0;year = 0;
}
Date::Date(int m, int d, int y){
month = m;day = d;year = y;
}
int Date::getMonth(){
return month;}
int Date::getDay(){
return day;}
int Date::getYear(){
229

return year;}
Although this code is fairly simple and probably works correctly, how would we testit? One approach is to write automated unit tests using the assert() macro. assert()is defined in the standard include file cassert. assert() takes one parameter whichis a boolean expression. If the expression evaluates to true, then nothing happenswhen the assert() is executed. If the expression evaluates to false, then the programhalts at that point and prints a message indicating the line and the expression ofthe failing assert(). A test driver might look like the following:
In file driver.cpp
#include "Date.h" #include <cassert>
void run_tests();
int main(){
run_tests();}
void run_tests(){
{ //test 1Date d;assert(d.getMonth() == 0);assert(d.getDay() == 0);assert(d.getYear() == 0);
}{ //test 2Date d(6,14,1924);assert(d.getMonth() == 6);assert(d.getDay() == 14);assert(d.getYear() == 1924);
}}
This test driver consists of two unit tests. Each test has been isolated in its ownblock and labelled with a comment. All of the unit tests have been separated ina function called run_tests(). This keeps the tests separate from the actual code,and makes it easy to turn off the tests if you want to (e.g. comment out the call torun_tests()). Note that you can still have main() perform whatever actions you wouldnormally put in main().
230

Assignment Part 1Create a directory for this lab. Copy the three files from above into this directoryand create a Makefile to compile them (see instructions from Lab 1 if you need helpwith creating the Makefile). Compile and run the program. If there are no errors,then nothing is printed and you are returned to a prompt.
Assignment Part 2Now introduce an error just to see what would happen. For instance, change thefirst assert to be
assert(d.getMonth() == 3);
instead of
assert(d.getMonth() == 0);
Compile and run the program again to see what is printed when the test fails.
Correct the test and make sure the tests all pass.
Assignment Part 3What would happen if we put in a month larger than 12 or less than 1? Let’s saythat we want our Date class to set the month to 1 if it is given a month outside therange 1 to 12. Later we will learn about a better solution to this problem in the formof exceptions , but for now we will just set the month to 1 for bad input. Add a testthat checks to see that giving a month larger than 12 results in the month being setto 1. Add the code so that if months are outside the range 1 to 12, then the monthis set to 1. Add similar code to set day to 1 if it is outside the range 1 to 31, andadd tests to see if it works. For now you may ignore leap years and assume thatall months have 31 days. Test-First Programming Now suppose you want to addnew functionality to your Date class such as a new member function that allowsyou to add a number of days to a Date. You have two choices. You could write thenew member function first, then write additional tests to see if your function workscorrectly. Or you could write the test first, run it (it should fail, if it doesn’t, ask whynot), then implement the code to make the test pass.
Test-first programming (or test-driven development ) involves the following steps:
1. Write a new test
2. Write just enough code to make the test pass
3. Improve the structure of the code and the test
231

4. repeat to 1
Completing the first three steps should be kept fairly short, maybe only about15 minutes. That means your tests are very focused and specific, not too broad orcomplex.
Assignment Part 4Write a test to call the function (that doesn’t yet exist) that adds a number of daysto a Date object. Run the test, see it fail, then write the simplest code you can thinkof to make it pass (don’t worry about wrapping around to the next month or yearin your first test, for example add 3 to January 2). Check the code and the test tosee if they are the simplest and cleanest that they can be. Now write another sim-ple test and make sure it works as well. If not, fix the code and/or the test. Nowwrite another test, perhaps one that causes the month to increment (e.g. add 5 toMarch 30). Again, don’t worry about leap years, but do account for different lengthmonths.Months with 28 or 29 days: FebruaryMonths with 30 days: April, June, September, NovemberMonths with 31 days: January, March, May, July, August, October, December
Continue this process in a test-first manner until you are happy with the new func-tion and confident that it works correctly. Test-Last Programming Test-last pro-gramming is similar to test-first except the tests are written after the code is imple-mented, not before. Notice that a test-last approach focuses on verifying that thecode you wrote works correctly. A test-first approach influences design decisionsbecause you have not yet written the code. With a test-first approach, you decidethe name of a function, its parameters, and its return types (i.e. its interface) aswell as its expected behavior when you write the test. A test-last approach assumesyou’ve already made these design decisions before you wrote the code that you arenow testing.
Assignment Part 5Use a test-last approach to add another function to the Date class that allows youto add a number of months to a Date (hint: you might have it call the function thatadds a number of days).
Assignment Part 6Using a test-first approach, add tests and the code to make sure that the two func-tions that you created above correctly handle leap years. If a test fails, rememberthat you can use DDD to step through your new code. The following rules defineleap year calculation:
232

1. Years divisible by four are leap years, unless...
2. Years also divisible by 100 are not leap years, except...
3. Years divisible by 400 are leap years.
Assignment Part 7Using either a test-first or a test-last approach, define a new class called Person withthe following members
• instance variables
– private firstName:string
– private lastName:string
– private payday:Date
• accessors and mutators for each instance variable
• incrementPayDay():void which moves the payday to two-weeks later
Be sure to define the class in a header file, e.g. Person.h, and implement it in aseparate implementation file, e.g. Person.cpp. Be sure all instance variables are de-clared private. Adjust your Makefile accordingly. Use the same approach (test-firstor test-last) until you are finished with this part.
Assignment Part 8When you are finished with all of the above, submit all header files, implemen-tation files and your Makefile as specified in the submission guidelines. Indicatewhether you used a test-first or a test-last approach in Part 7 by adding either TL(for test-last) or TF (for test-first) to the name of your tar file. For example, First-LastLab3TL.tar.gz for a test-last program.
233

B.1.4 Sample CS1 Project
EECS 168 - Programming Assignment 4Contributed by Dr. John Gauch
1. Problem Statement:
Most programming languages have built in data types for integers, floating pointnumbers, and characters, but there are many programming applications that requirespecialized data types. For example, in computer graphics we need to store (x,y,z)coordinates that define lines, planes, and other geometric objects.
The purpose of this programming assignment is to design, implement, and testa data structure for storing (x,y,z) coordinates together with a collection of opera-tions on these three-dimensional points. The assignment has three “hidden” goals:1) to give students exposure to the concept of abstract data types, 2) to give stu-dents more experience with arrays and functions, and 3) to give students practicedeveloping and testing moderate sized pieces of software.
There are many ways to represent (x,y,z) points in C++, but for this assignmentyou are required to use a one-dimensional array of length three integers for eachpoint in your program. Specifically, if you declare “int point[3];” then x will be storedin point[0], y will be stored in point[1], and z will be stored in point[2]. All of yourarithmetic and geometric operations on (x,y,z) points will make this assumption,and expect these arrays as input/output parameters.
Data structures are pretty boring unless there are useful operations you canperform on them that assist in the implementation of an application. For this as-signment, you are required to design, implement, and test the following operations:
Input - create a function that reads three consecutive numbers from the user andstores these in the x, y, and z coordinates of a point.
Output - create a function that prints points in the following format (1,3,5), withround brackets and commas separating the x, y, and z coordinates.
Equal - create a function that compares two (x,y,z) points and returns true if theyare equal to each other and false otherwise. This function should be very helpfulfor testing and debugging subsequent operations.
Addition (A), subtraction (S), multiplication (M), division (Q) - create four func-tions that take two points as input, and perform the corresponding arithmetic op-eration to create the output. Remember, operations are done on a coordinate-by-coordinate basis, so (1,2,3) + (6,4,2) = (7,6,5).
Euclidean Distance (E) - create a function that calculates the Euclidean distancebetween two (x,y,z) points. The result should be a scalar. Distance calculations areused in computer graphics to decide if one object is near another object, which isvery useful for preventing people from going through walls in video games.
Dot product (D) - create a function that calculates the dot product (also known
234

as the inner product) of two points. The result should be a scalar. The dot productis used in computer graphics to see if two vectors are perpendicular, which occurswhen their dot product is zero.
Cross product (C) - create a function that calculates the cross product (alsoknown as the outer product) of two points. The result should be another (x,y,z)point. The cross product is used in computer graphics to calculate the directionthat is perpendicular to two other vectors, which is helpful for finding surface nor-mals.
Finally, to test all of your operations, you need to implement a main programthat reads and executes a series of point operations using the single character shortforms above. For example, the command to calculate (1,2,3) + (6,4,2) would take theform “A 1 2 3 6 4 2”. Your program should output “(7,6,5)”. Your program shouldread and execute commands until an end-of-file is reached or until the user types“X” for exit.
Honors Students: Design and implement your program so it can handle N-dimensionalpoints. You will need to pass the size of each point together with the coordi-nates into each of the functions above. Note that cross products only work for3-dimensional points, so you will have to modify that function accordingly. Whenyou are implementing your command line interpreter, you will need to add the sizeof the array as the second argument before the list of coordinate values. For ex-ample, if N=2 you would enter “A 2 3 4 5 6” to calculate the value of (3,4) + (5,6).Since we have not learned about dynamic memory allocation yet, your program canallocate ’big’ static arrays and waste some space.
2. Design:The specifications for this program are fairly detailed, but there is still a lot of
software design that must be done before you start programming. First of all, youneed to find out what the formulas are for all of the operations above. Are thereany special cases for these formulas that need to be considered? Then you needto think about the control flow for this program. How do you want to break theproblem into pieces? How will you put these pieces together?
3. Implementation:Start your program with comments based on your design and add portions of
code a little at a time. Compile and test your program on a regular basis, so youalways have something that runs, even if it only does part of the job. Make sure youhave completed the easy tasks before you start writing code for the harder tasks.
For this assignment, we would like you to keep track of the time you spend de-veloping your program so you can develop time management skills and so we canlearn about how long students take to complete projects as they learn more aboutC++ and develop their skills. We will not be using this information to assign grades,
235

so short or long times are not a plus or a minus. One easy way to keep track ofyour time is to add a comment at the top of the file with the start and end time ofeach of your programming sessions. It is also helpful to add some notes on whatyou did during this time. When you are finished, you can add a comment with totalprogramming time.
4. Testing and Debugging:In the labs you have learned about two approaches for software testing that
make use of the “assert” function. In the “test first” approach, you write the soft-ware to test pieces of your program before you actually implement that operation.In the “test last” approach you write the testing software after you implement anoperation. In both cases, you correct problems as they are discovered, and developyour working program in an incremental way.
For this assignment, we would like students with even KUIDs to develop andtest their programs using the “test first” approach, and students with odd KUIDs touse the “test last” approach. In a later assignment, you can switch to the oppositetesting approach so you can decide which method suits your programming style.
We want to see what testing you performed while developing your program, soplease do not delete your assert code. Instead you can comment it out when youare finished testing that portion of the code.
5. Documentation:When you have completed your C++ program, write a short report (less than one
page long) describing what the objectives were, what you did, and the status of theprogram. Does it work properly for all test cases? Are there any known problems?Save this report in a separate text file to be submitted electronically.
6. Project Submission:In this class, we will be using electronic project submission to make sure that all
students hand their programming projects and labs on time, and to perform auto-matic analysis of all programs that are submitted. When you have completed thetasks above go to the class web site to submit your documentation, C++ program,and testing files.
The dates on your electronic submission will be used to verify that you met thedue date above. All late projects will receive reduced credit (50% off if less than 24hours late, no credit if more than 24 hours late), so hand in your best effort on thedue date.
You should also PRINT a copy of these files and hand them into your teachingassistant in your next lab. Include a title page that has your name and kuid, andattach your hand written design notes from above.
236

B.1.5 Sample CS2 Project
EECS 268: Fall 2005 Programming Project 1Project ObjectiveTo practice abstraction, recursion, automated unit-testing, and creation of a basicList ADT.
InstructionsThe division of motor vehicles wants you to write a program that will keep track ofsome drivers with traffic citations. Define a class Person with instance variables tostore:
1. Driver’s license number.
2. Name of a driver including first and last names.
3. Number of citations issued in the past three years.
Define a class DriverTable with an array of Person objects stored in ascendingorder by licNumber.
DriverTable(see below for a more detailed description of each class member)-drivers-size-findIndex(in licNumber: integer, in first: integer,in last: integer, out index: integer) {query}+createTable()+copyTable(in copyMe: DriverTable)+destroyTable()+isEmpty(): boolean {query}+getLength(): integer {query}+insert(in newDriver: Person, out success: boolean)+getDriver(in index: integer, out item: Person) {query}+remove(in licNumber: integer, out success boolean)+findDriver(in licNumber: integer, out item: Person, out success: boolean) {query}
If you are a little confused on exactly what each of the DriverTable methods shouldbe doing then this information may be of some help.
Instance Variables:
• drivers - This is a static sized array of Person objects. Since the spec does notsay how big your array should be it is up to you to decide.
237

• size - This is the number of Person objects in the array. Perhaps size is amisleading identifier for the variable since size might imply array capacityinstead of the number of people in the array.
Instance Methods:
• findIndex - This method is an "internal" (i.e. private) method that searches for agiven person. This method must be implemented as a recursive binary search.The first and last parameters of the method are the indices of the array to besearched. The method returns the index of the person with the given licensenumber. You can return -1 to indicate no person with given number exists.
• createTable - This method simply resets the DriverTable object to an emptyarray with zero people. For this project the method is not that interesting (youonly have to assign the the number of people to zero), but in Project 2 it willbe more interesting.
• copyTable - This method copies the people in the DriverTable object parameterinto the "this" DriverTable object. You probably won’t ever call this method inProject 1, but it may come in handy for Project 2.
• destroyTable - Like createTable, this method resets the DriverTable object toan array with zero people. Again, it will be more interesting in Project 2. Also,like copyTable, you probably won’t use it in Project 1.
• isEmpty - This method simply returns true if and only if the DriverTable objecthas zero Person objects in it. Otherwise it returns false.
• getLength - This method returns the number of people in the DriverTable.
• insert - This method inserts a Person object into the array in ascending orderbased on license number and returns true if and only if the person could beinserted. An example of when the method should return false is when thereis no more room in the array to insert another person. How are you going tohandle duplicate license numbers? Although the project description does notspecifically mention how to handle the situation, allowing duplicate licensenumbers doesn’t make much sense and you should disallow it.
• getDriver - This method returns the driver at a certain ordinal position in thelist of Person objects. Although arrays are indexed starting at position zero,general lists start with one. Hence, when one is passed in as the index thenyou will return driver[0]. You will find this method useful when you display theentire list of people. The project does specify how to handle invalid indices.Thus, that decision is left to you. Acceptable solutions include returning a nullPerson object, returning an additional boolean value, and using exceptions.
238

• remove - This method removes the Person object with the associated licensenumber and returns true if and only if that person was removed. Hence, themethod returns false when the license number was not found. This methodmust utilize the findIndex method.
• findDriver - This method returns the Person associated with a given licensenumber and returns true if and only if a person with that license numbercould be found. This method must utilize the findIndex method.
InputIn an input file, a sequence of commands will be given with one command per line.You are required to write a driver program to process the following commands.
I licNumber Name Number // insert a new driverR licNumber // remove a driver with given licNumberG index // find and output driver info of the given indexF licNumber // find and output info on driverD // output info on all drivers in Table
Sample input file:
I 41109 Chris Johnson 18I 32298 Martha Smith 2I 81132 Hillary Clinton 4G 2DR 12345R 32298DI 42112 Laurie Evans 0F 81132D
Sample output file:
Insert driver 41109 Chris Johnson 18
Insert driver 32298 Martha Smith 2
Insert driver 81132 Hillary Clinton 4
The driver in 2 position is: 41109 Chris Johnson 18
239

Current driver table has drivers:32298 Martha Smith 241109 Chris Johnson 1881132 Hillary Clinton 4Driver 12345 can not be removed
Driver 32298 is removed
Current driver table has drivers:41109 Chris Johnson 1881132 Hillary Clinton 4
Insert driver 42112 Laurie Evans 0
Driver 81132 Hillary Clinton 4 is found
Current driver table has drivers:41109 Chris Johnson 1842112 Laurie Evans 081132 Hillary Clinton 4
General Requirements
1. You may not use any global variables.
2. Each class must be defined with a pair of files: a header file describing themethods and instance variables, and a c++ file with the implementations.
3. Only header files may be #include-ed. Each c++ source file must be separatelycompiled via directives in your makefile .
4. All instance variables in all classes must be declared private.
5. The friend keyword cannot be used.
6. Your program must use argc/argv to take a single argument, the input file.
7. Methods remove() and findDriver() must call the internal findIndex() method.
8. You must use the recursive binary search algorithm in findIndex().
9. You should develop this program in a test-first or a test-last manner as de-scribed in Lab 3. You may choose which approach you use, but use the ap-proach throughout the development of the project. If you don’t care whichapproach you use, choose test-first if your KUID starts with an even number
240

and use test-last if your KUID starts with an odd number. Indicate which ap-proach you used by adding TL or TF to your project submission tar file.
10. Keep track of the time you spend on this project and send the total in theproject submission email.
Style Requirements
1. Your code must be well modularized. Your main function should simply calla couple other functions; they in turn should be well modularized. (See theModularity section on pages 27-28 of the text and follow those guidelines.)
2. You must use an appropriate documentation style, including comments de-scribing the purpose of methods and in-line comments. (See, for example, the“Key Concepts” section on page 43 of the text.)
3. Follow the code paragraphing conventions summarized on pages 40-42 of thetext.
SubmissionRead and follow the submission instructions when you are ready to submit your lab.
Grading
• Correctness (includes “General Requirements”): 50
• Style (includes “Style Requirements”): 30
• Output Format: 10
• Error Checking: 10
241
B.1.6 Sample SE Project
EECS810: Principles of Software Engineering Team Projects — Fall 2005
Professor Hossein Saiedian
Team ProjectOur software engineering class will be divided into groups of 3–4 students. Large
groups are chosen partly to challenge students in issues related to project manage-ment. Each team should elect a team leader (or administrator, or manager) who willbe responsible for coordinating the activities of the other team members as well ascommunicating with the instructor. Teams are encouraged to assign other roles tothe members, such as ‘Project Administrator,’ ‘Deputy Project Administrator,’ ‘Con-figuration Manager,’ ‘Quality Assurance Manager,’ ‘Maintenance Engineer,’ etc. Theteam administrator would also be responsible for final technical decisions as wellas making sure everyone comes to meetings and does their share of work. The fi-nal implementation should be in Java 1.4 (do not use 1.5). One of the unix-basedsystems on campus (e.g., eno.eecs.ku.edu) is acceptable but PC-based systems arealso OK. You must strive for operating systems compatibility. The projects will takemost of the semester with major write-ups at approximately 2/3-week intervals (1-week interval during summer sessions).
Brief Project DescriptionMany web-authoring systems and certain application software (e.g., Microsoft
FrontPage) as well as practically all web browsers provide for a facility to create andedit HTML pages. The resulting pages may provide nice looking web pages but theactual HTML code is usually awful and consists of badly formed lines (too long ortoo short), unnecessary white “space” (white space, tabs, blank lines), redundantand superfluous tags, and unaligned statements.
You are requested to specify the requirements and then develop a software thattakes as input a file containing HTML code and produces a “pretty-printed” versionof the contents of that file (where each line of code is a maximum of n characters,redundant and superfluous tags, and white spaces are removed, and when neces-sary, bodies of certain tags are indented, etc.). The objective is to make the HTMLcode readable and manually editable.
You are encouraged to complete this project in teams of three or four individu-als. You must strive for conforming to IEEE standards when possible.
Development ProcessYou should divide your development efforts into two iterations. The first iter-
ation should develop a “core” set of requirements including a text-based interface,per-line character limits, and removal of white space. The second iteration should
242

add functionality such as tag body indentation and removing redundant and super-fluous tags. The second iteration should also add a GUI-based interface for selectingthe input/output files, specifying parameters (e.g., number of target characters perline), and displaying the output HTML in a window.
Your team will be asked to apply either a test-last or test-first development ap-proach. Test-first programming (also called test-driven development) is the practiceby which an automated test case is written before the code is implemented. The im-plemented code is written to pass the test case. The design of the system emergesas the programmer repeatedly writes tests, then writes the code to make the testspass, then improves both the code and tests in short rapid iterations. Test-lastprogramming is the practice by which a test case is written after the code is im-plemented. The design of the system is usually developed before any substantialamount of code is written. You are expected to write automated unit tests usingJUnit whether you are applying a test-first or test-last approach.
Professionalism is ImportantYou will be graded on the quality of the work you produce, not on how many
hours a week you spend on it. Use your energy and time wisely. However, you arerequested to create professionally-looking documents, not only for “clients,” butalso for communication among yourselves. Portfolios, labeled theme binders, etc.,are recommended. Choose a name for your group and always write team members’names on the project assignments you turn in. Each part of project worths approxi-mately 50 points and is graded based on accuracy, consistency, and completeness ofits contents as well as its organization (e.g., appropriate title, section and paragraphnames) and appearance (e.g., consistent page numbers). For each document to beturned in, include a title that identifies the document (e.g., “Requirements Specifica-tion for the ... System”), the name of the team, names of the team members, coursetitle, instructor’s name, and date.
Even though it is expected that some members of your group will be better writ-ers, some better programmers, and so on, you are not to divide the labor on thesegrounds. This class is to be a learning experience, and each of you should get a sub-stantial amount of practice in all of these areas, not just the ones you are alreadygood at. You will not be graded directly on your writing style, but good writingoften conveys ideas more clearly than poor writing. Thus, it is to your advantage toorganize your thoughts and write well. Note that document length is not equivalentto quality. Also, it is a good idea to use the same editor and document prepara-tion system for all documents to make modifications and elaboration into a moredetailed document easier.
It is very important that project assignments be completed on time to allow youto complete the entire project on schedule.
243

Keep a Log of Your ActivitiesEveryone should maintain a log of the time you spent on the project and a de-
scription of what you did during that time. The logs will help you see how youspend your time and help you make better predictions of the time needed by thedifferent phases of a software project.1 It is also a good idea to record the reasonfor a computer run, the amount of CPU time, the changes since the last time, theresult of run, and so forth. It would always be interesting to look back and see howmuch time you really spent on the project in front of a terminal and how much youspent away from it.
Project Demonstration and PresentationThe last weeks of classes are reserved for project presentations and demonstra-
tions. Presentations should be formal and will take place in the classroom. All teammembers should participate and contribute to the presentations. Each team willalso have about 30 minutes to present the best features of your system and allowsome time for questions and feedback from the audience. If your system has beenproperly debugged, you can let the audience tell you what to type to show off yourerror handling and user help facilities. Everyone in the group should participate.You can have each person explain their part of the system or have one person typ-ing while another is talking. You may want to give out a short description of yourproject. Because the time is so short, it is important to practice what you are go-ing to say and do. A complete, bound version of your project should be turned induring the last week of classes.
Your completed project worths about 40% of your overall grade for the course.The completed project will be graded at the end of the semester for completeness,correctness, documentation, consistency and uniformity.
Essential Project Deliverables and Completion DatesThe following are essential project deliverables and their expected completion
dates:
1. Software Project Management Plan . . . . . . . . . . . . . . . . . . . . . . . . . . . . . . September 12
2. Software Requirements Specification and User’s Manual . . . . . . September 19
3. Software Design
(a) Design for entire system (test-last groups) . . . . . . . . . . . . . . . . . . . . . October 17
(b) Design from iteration 1 (test-first groups) . . . . . . . . . . . . . . . . . . . . . .October 17
(c) Design updated from iteration 2 (test-first groups) . . . . . . . . . . . .October 31
1In fact, many industrial organizations require this sort of time-keeping.
244
4. Implemented/Tested Product . . . . . . . . . . . . . . . . . . . . . . . . . . . . . . . . . . . . November 21
Turn in a binder. Your team project binder should include:
• An updated version of all previous parts of the project
• A manual with clear instructions on how to install and run
• A printed copy of the source program
• Source program and executable code on a floppy or a CD
5. Weekly Deliverables . . . . . . . . . . . . . . . . . . . . . . . . . . . . . . . . . . . . . . . . . . . . . . Every Monday
Every Monday the project leader should turn in the following items electroni-cally (to [email protected] and cc: [email protected]):
• time logs for each individual team member
• summary report with team totals by activity
• software (including JUnit tests) written to date
• software metrics to date
The time logs and summary report should report time spent by activity (e.g.requirements analysis, design, coding/unit testing, integration testing, meet-ings, etc.). The logs and report should account for the previous week (Sundaythrough Saturday).
Software should include production and test code along with build scripts.Software should only include “checked-in” code so that only one version ofcode is submitted.
Software metrics should report data aggregated by production and test code.You are encouraged to use a metrics collection tool such asCCCC (http://sourceforge.net/projects/cccc).
6. Presentations . . . . . . . . . . . . . . . . . . . . . . . . . . . . . . . . . . . . . . . . . . . . . . . . . . . . . . . . December 5
Presentations and demonstrations should be limited to 30 minutes and shouldinclude an explanation of the software architecture, your team approach todesigning the solution, and sample demos. Live demos are fine, provided thatyou have prepared everything (e.g., compiled programs, prepared test files, etc)in advance. Also, discuss any noble feature of your product (e.g., extensibility,portability) as well as any limitations that it has.
Project Points: 300Each of the above deliverables worths 50 points. Furthermore, “time log,” docu-
mentation, summary reports, and measurement collection also 50 points (they area required part of the project).
Although some may activities require more efforts, points are equally distributedto emphasize the importance of each.
245

B.1.7 Sample SE Time Sheet
Table B.1 contains a sample time sheet submitted by each team in the softwareengineering semester-long projects.
Time Sheet Name: Week Ending:Enter data in minutes
Date Sun. Mon. Tues. Wed. Thurs. Fri. Sat. Total
Learning Tools 0Research 0General Team Meeting 0General Project Mgmt 0Analysis 0Design 0Coding 0Unit Testing 0Integration Testing 0Regression Testing 0Fixing Defects 0Code Documentation 0Code Reviews 0User Documentation 0Project Presentation 0
000000
Total 0 0 0 0 0 0 0 0
Table B.1: Sample Time Sheet
246

B.2 Sample Professional Training Materials
B.2.1 Sample TDD Training Slides
Introduction to JUnit and Test-Driven Development
David Janzen
EECS 810 Principles of Software Engineering
eXtreme Programming (XP)• Core Practices
• Whole Team/On-Site Customer• Planning Game• Small Releases• Customer Tests• Collective Ownership• Coding Standard• Continuous Integration• Metaphor• Sustainable Pace• Test-Driven Development• Pair Programming• Simple Design• Refactoring• See http://www.xprogramming.com/xpmag/whatisxp.htm• See “Extreme Programming Explained: Embrace Change” by Kent Beck
Extreme Best Practices• If customer feedback is good
– then have a customer always on-site
• If code reviews are good– then always perform code reviews through pair
programming
• If early integration is good– then continuously integrate
• If unit-testing is good– then require unit-tests and do them first
– plus make them automated so they are run often
Test-Driven Development• Disciplined development approach• Emerging as stand-alone practice from agile methods
– Utilized in agile and traditional development processes
• Reverses traditional micro workflow
– test code code test
• More about design than testing1
• Supported by automated testing frameworks• Also known as
– Test-First Programming– Test-Driven Design
1. Beck, “Aim, Fire”, IEEE Software 2001
Types of Testing
• Unit Testing (TDD focuses here)– Testing individual units (typically methods)– White/Clear-box testing performed by original programmer
• Integration and Functional Testing– Testing interactions of units and testing use cases
• Regression Testing– Testing previously tested components after changes
• Stress/Load Testing– How many transactions/users/events/… can the system handle?
• Acceptance Testing– Does the system do what the customer wants?
TDD Flow• Test-last process
1. Design software2. Write code3. Write unit tests4. Repeat to 2
• TDD process1. Write a unit test2. Write code to make test pass3. Refactor code and test4. Repeat to 1
247

Simple TDD Example//Write a test in test folderpackage bank;import junit.framework.TestCase;public class TestBank extends TestCase {
public void testCreateBank() {Bank b = new Bank();assertNotNull(b);
}}
//Test and fail>javac TestBank.java//won’t compile because Bank class doesn’t exist
Simple TDD Example//Write Bank class in src folderpackage bank;public class Bank {
public Bank() {}
}
//Test and pass>javac TestBank.java//now we need a driver to execute this and other tests and tell us if
they pass or fail; JUnit to the rescue
Introduction to JUnit• JUnit is a Unit Testing framework• Developed by Erich Gamma and Kent
Beck• Freely available at junit.org• Installs simply
– Unzip junit.zip into a directory– Add junit.jar (with path) to CLASSPATH
• Multiple TestRunnersjava junit.swingui.TestRunner TestBank
java junit.textui.TestRunner TestBank
java junit.awtui.TestRunner TestBank
Introduction to JUnit
• Tests can be automatically discovered with reflection
• Tests can be organized into suites• Each unit test is run in its own
classloader to avoid side effects• Standard resource initialization
and reclamation methods (setUpand tearDown)
• Integration with other tools such as Ant and Eclipse
JUnit HowTo• Import the JUnit framework
• Create a subclass of TestCase
• Write methods in the form testXXX()• Use assertXXX() methods
• Compile test and functional code; Run a TestRunner to execute tests; Keep the bar green!
import junit.framework.*;
public class TestBank extends TestCase {
public void testCreateBank() {
Bank b = new Bank();
assertNotNull(b);
}
JUnit from the Command Line• From the test directory, compile TestBank.java with
javac –sourcepath ..\src –d . TestBank.java• Run the JUnit tests that you just wrote with
java junit.swingui.TestRunner TestBank• Keep the bar green!
248

JUnit in Eclipse• Eclipse has integrated JUnit
• Create a new project in Eclipse1. Select File->New->Project
2. Select “Java Project” and click Next
3. Give the project the name “TDDExamples”
4. Create src and test source folders
5. Select the Libraries tab and then click “Add External Jars”, find and select the junit.jar on your system (look in Eclipse/plugins/org.junit_3.8.1/)
6. Click Finish
Organizing projects
• The more classes in a package or project, the more tests you will have
• When you ship your production code, you won’t want to include the testing code
• How do you keep production and testing code separate, but in the same package so the test code has access to everything?
Organizing projects• One solution is to
create “separate but equal” parallel packages
• Place the source code and test code in the same package, but in separate directory structures
• See the bank package to the right
Organizing projects in Eclipse
• Create a project named TDDExamples.
• Setup the parallel packages (bank under src and test folders).
• Set the build path to include bank/src and bank/test and to output to bank/bin.
Running JUnit in Eclipse• Right-click on TestBank.java and select
Run->Run As->JUnit Test
Eclipse should open JUnit and execute the tests.
Simple TDD Example: Second Testimport junit.framework.TestCase;public class TestBank extends TestCase {
public void testCreateBank() {Bank b = new Bank();assertNotNull(b);
}public void testCreateBankEmpty() {
Bank b = new Bank();assertEquals(b.getNumAccounts(),0);
}}
//Test and fail>javac TestBank.java//won’t compile because Bank doesn’t have getNumAccounts()
249
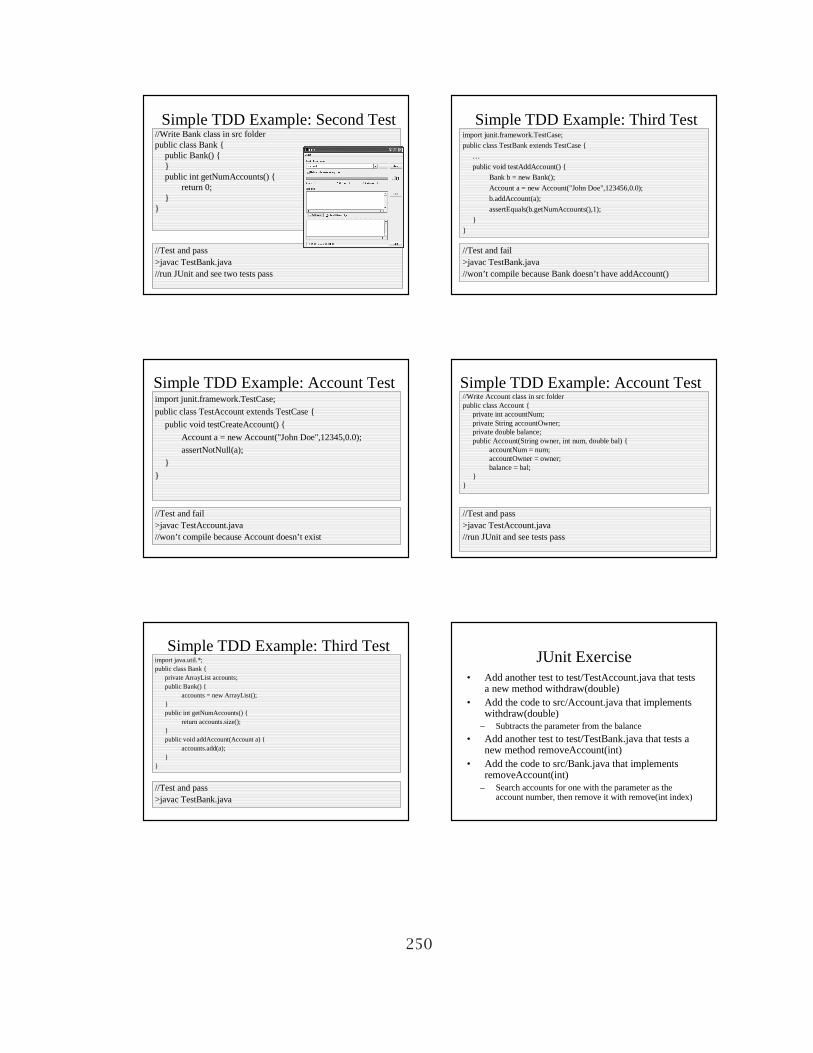
Simple TDD Example: Second Test//Write Bank class in src folderpublic class Bank {
public Bank() {}public int getNumAccounts() {
return 0; }
}
//Test and pass>javac TestBank.java//run JUnit and see two tests pass
Simple TDD Example: Third Testimport junit.framework.TestCase;
public class TestBank extends TestCase {
…
public void testAddAccount() {
Bank b = new Bank();
Account a = new Account("John Doe",123456,0.0);
b.addAccount(a);
assertEquals(b.getNumAccounts(),1);
}
}
//Test and fail>javac TestBank.java//won’t compile because Bank doesn’t have addAccount()
Simple TDD Example: Account Testimport junit.framework.TestCase;
public class TestAccount extends TestCase {
public void testCreateAccount() {
Account a = new Account("John Doe",12345,0.0);
assertNotNull(a);
}
}
//Test and fail>javac TestAccount.java//won’t compile because Account doesn’t exist
Simple TDD Example: Account Test//Write Account class in src folderpublic class Account {
private int accountNum;private String accountOwner;private double balance;public Account(String owner, int num, double bal) {
accountNum = num;accountOwner = owner;balance = bal;
}}
//Test and pass>javac TestAccount.java//run JUnit and see tests pass
Simple TDD Example: Third Testimport java.util.*;public class Bank {
private ArrayList accounts;public Bank() {
accounts = new ArrayList();}public int getNumAccounts() {
return accounts.size();}public void addAccount(Account a) {
accounts.add(a);}
}
//Test and pass>javac TestBank.java
JUnit Exercise• Add another test to test/TestAccount.java that tests
a new method withdraw(double)• Add the code to src/Account.java that implements
withdraw(double)– Subtracts the parameter from the balance
• Add another test to test/TestBank.java that tests a new method removeAccount(int)
• Add the code to src/Bank.java that implements removeAccount(int)
– Search accounts for one with the parameter as the account number, then remove it with remove(int index)
250

Fixtures• Notice redundancy in test methods
• Common test setup can be placed in a method named setUp() which is run before each test
import junit.framework.TestCase;public class TestBank extends TestCase {
public void testCreateBank() {Bank b = new Bank();assertNotNull(b);
}public void testCreateBankEmpty() {
Bank b = new Bank();assertEquals(b.getNumAccounts(),0);
}}
setUp()import junit.framework.*;public class TestBank extends TestCase {
private Bank b;public void setUp() {
b = new Bank();}public void testCreateBank() {
assertNotNull(b);}public void testCreateBankEmpty() {
assertEquals(b.getNumAccounts(),0);}public void testAddAccount() {
Account a = new Account("John Doe",123456,0.0);b.addAccount(a);assertEquals(b.getNumAccounts(),1);
}}
setUp() is run before each test
tearDown()• tearDown() is run after each test
– Used for cleaning up resources such as files, network, or database connections
import junit.framework.TestCase;public class TestBank extends TestCase {
private Bank b;public void setUp() {
b = new Bank();}public void tearDown() {
b = null;}…
}
tearDown() is run after each test
TestSuites
• TestCases can be organized into TestSuites
• If no TestSuite is defined, then all code is placed in a default TestSuite and test cases are discovered automatically.
• You can explicitly create a TestSuite that contains some or all TestCases or other TestSuites you want.
TestSuite()• Each TestCase class can have a suite() method
import junit.framework.*;public class TestBank extends TestCase {
private Bank b;public static Test suite() {
return new TestSuite(TestBank.class);}public void setUp() {
b = new Bank();}public void testCreateBank() {
assertNotNull(b);}…
Combining all TestSuite()• Each TestCase class can have a suite() method
import junit.framework.*;import bank.*;
public class TestAll extends TestCase {public static Test suite() {
TestSuite suite = new TestSuite("All TDDExamples tests");suite.addTest(TestAccount.suite());suite.addTest(TestBank.suite());return suite;
}}
Could add TestBank.classif TestBank doesn’t havesuite() defined
251
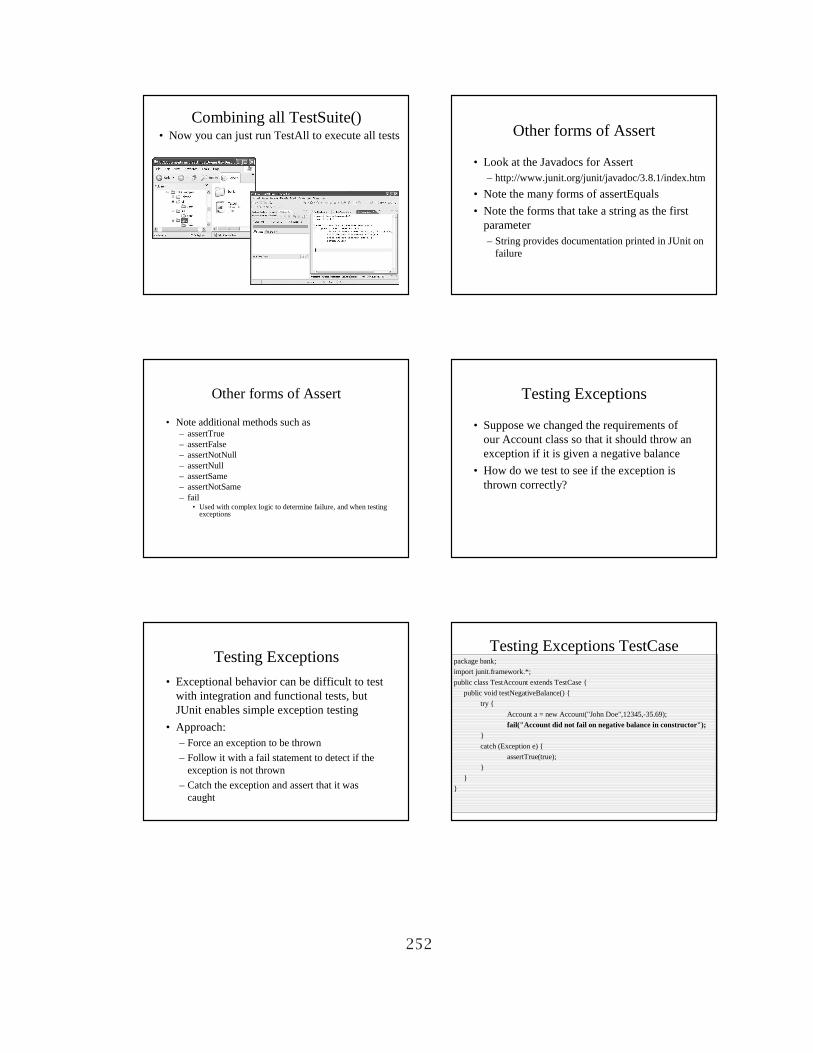
Combining all TestSuite()• Now you can just run TestAll to execute all tests Other forms of Assert
• Look at the Javadocs for Assert– http://www.junit.org/junit/javadoc/3.8.1/index.htm
• Note the many forms of assertEquals
• Note the forms that take a string as the first parameter– String provides documentation printed in JUnit on
failure
Other forms of Assert
• Note additional methods such as – assertTrue– assertFalse– assertNotNull– assertNull– assertSame– assertNotSame– fail
• Used with complex logic to determine failure, and when testing exceptions
Testing Exceptions
• Suppose we changed the requirements of our Account class so that it should throw an exception if it is given a negative balance
• How do we test to see if the exception is thrown correctly?
Testing Exceptions
• Exceptional behavior can be difficult to test with integration and functional tests, but JUnit enables simple exception testing
• Approach:– Force an exception to be thrown
– Follow it with a fail statement to detect if the exception is not thrown
– Catch the exception and assert that it was caught
Testing Exceptions TestCasepackage bank;
import junit.framework.*;
public class TestAccount extends TestCase {
public void testNegativeBalance() {
try {
Account a = new Account("John Doe",12345,-35.69);
fail("Account did not fail on negative balance in constructor");}
catch (Exception e) {
assertTrue(true);
}
}
}
252

Testing Exceptions Failure Testing Exceptions Examplepackage bank;
public class Account {private int accountNum;private String accountOwner;private double balance;public Account(String owner, int num, double bal) throws Exception {
accountNum = num;accountOwner = owner;balance = bal;if (bal < 0.0) {
balance = 0.0;throw new Exception("Negative balance not allowed.");
}}
}
Testing Exceptions Not Thrown• Second Approach:
– Place a fail statement in the catch handler to make sure an exception was not thrown
package bank;
import junit.framework.*;
public class TestAccount extends TestCase {
public void testCreateAccount() {
try {
Account a = new Account("John Doe",12345,0.0);
assertNotNull(a);
} catch (Exception e) { fail("Should not throw exception"); }
}
Allowing TDD to drive design• Suppose we need to add the ability to get
the account with the largest balancepublic class TestBank extends TestCase {
public void testGetLargestAccount() {
try {
Account small = new Account("Bob Jones",45678,12.34);
b.addAccount(small);
Account big = new Account("Jim Smith",12345,123456.78);
b.addAccount(big);
Account medium = new Account("Sam Smith",67890,1234.56);
b.addAccount(medium);
assertEquals(b.getLargest().getBalance(),big.getBalance(),.01);
} catch (Exception e) {}
}Note use of delta with doubles
Allowing TDD to drive designimport java.util.*;
public class Bank {
privateArrayList accounts;
public Bank() {
accounts = new ArrayList();
}
public int getNumAccounts() {
return accounts.size();
}
public void addAccount(Account a) {
accounts.add(a);
}
public Account getLargest() {
return ((Account)(accounts.get(0)));
}
}
This won’t work!Need ability to sort easily
ArrayList is hard-codedSelecting Internal Data Structure
• Bank is currently coupled to ArrayList
• There are many possible data structures with corresponding advantages/disadvantages– ArrayList (low overhead but slow sorting)
– TreeSet (high overhead but fast sorting)
– TreeMap (high overhead, sorting, fast individual access)
253
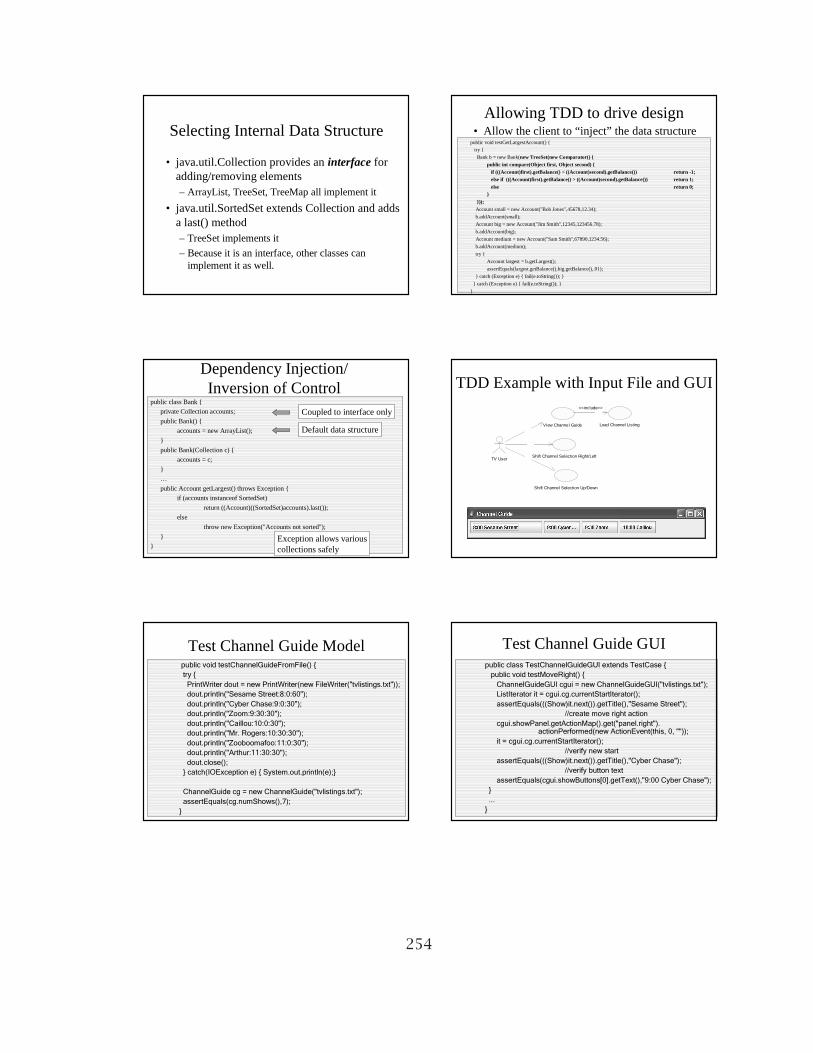
Selecting Internal Data Structure
• java.util.Collection provides an interface for adding/removing elements– ArrayList, TreeSet, TreeMap all implement it
• java.util.SortedSet extends Collection and adds a last() method – TreeSet implements it
– Because it is an interface, other classes can implement it as well.
Allowing TDD to drive design• Allow the client to “inject” the data structure
public void testGetLargestAccount() {
try {
Bank b = new Bank(new TreeSet(new Comparator() {public int compare(Object first, Object second) {
if (((Account)first).getBalance() < ((Account)second).getBalance()) return -1;else if (((Account)first).getBalance() > ((Account)second).getBalance()) return 1;else return 0;
}}));Account small = new Account("Bob Jones",45678,12.34);
b.addAccount(small);
Account big = new Account("Jim Smith",12345,123456.78);
b.addAccount(big);
Account medium = new Account("Sam Smith",67890,1234.56);
b.addAccount(medium);
try {
Account largest = b.getLargest();
assertEquals(largest.getBalance(),big.getBalance(),.01);
} catch (Exception e) { fail(e.toString()); }
} catch (Exception e) { fail(e.toString()); }
}
Dependency Injection/Inversion of Control
public class Bank {
private Collection accounts;
public Bank() {
accounts = new ArrayList();
}
public Bank(Collection c) {
accounts = c;
}
…
public Account getLargest() throws Exception {
if (accounts instanceof SortedSet)
return ((Account)((SortedSet)accounts).last());
else
throw new Exception("Accounts not sorted");
}
}Exception allows variouscollections safely
Coupled to interface only
Default data structure
TDD Example with Input File and GUI
TV User
View Channel Guide
Shift Channel Selection Up/Down
Load Channel Listing
<<include>>
Shift Channel Selection Right/Left
Test Channel Guide Modelpublic void testChannelGuideFromFile() {
try {
PrintWriter dout = new PrintWriter(new FileWriter("tvlistings.txt"));
dout.println("Sesame Street:8:0:60");
dout.println("Cyber Chase:9:0:30");
dout.println("Zoom:9:30:30");
dout.println("Caillou:10:0:30");
dout.println("Mr. Rogers:10:30:30");
dout.println("Zooboomafoo:11:0:30");
dout.println("Arthur:11:30:30");
dout.close();
} catch(IOException e) { System.out.println(e);}
ChannelGuide cg = new ChannelGuide("tvlistings.txt");
assertEquals(cg.numShows(),7);
}
Test Channel Guide GUIpublic class TestChannelGuideGUI extends TestCase {
public void testMoveRight() {
ChannelGuideGUI cgui = new ChannelGuideGUI("tvlistings.txt");
ListIterator it = cgui.cg.currentStartIterator();
assertEquals(((Show)it.next()).getTitle(),"Sesame Street");
//create move right action
cgui.showPanel.getActionMap().get("panel.right"). actionPerformed(new ActionEvent(this, 0, ""));
it = cgui.cg.currentStartIterator();
//verify new start
assertEquals(((Show)it.next()).getTitle(),"Cyber Chase");
//verify button text
assertEquals(cgui.showButtons[0].getText(),"9:00 Cyber Chase");
}
...
}
254

Testing with Mock Objects
• A mock object is an object created to stand in for an object that your code will be collaborating with. Your code can call methods on the mock object, which will deliver results as set up by your tests.
• In other words, in a fine-grained unit test, you want to test only one thing. To do this, you can create mock objects for all of the other things that your method/object under test needs to complete its job.
EasyMock• EasyMock is a third-party library for
simplifying creating mock objects
• Download EasyMock1.2 for Java1.3 from www.easymock.org– EasyMock 2.0 depends on Java 1.5
• Extract download
• Add easymock.jar to project
Testing Bank with EasyMockpackage bank;
import java.util.Collection;
import org.easymock.MockControl;
import junit.framework.TestCase;
public class TestBank extends TestCase {
private Bank b;
privateMockControl control;
private Collection mock;
protected void setUp() {
control = MockControl.createControl(Collection.class);
mock = (Collection) control.getMock();
b = new Bank(mock);
}
public void testNumAccounts() {
mock.size();
control.setReturnValue(7);
control.replay();
assertEquals(b.getNumAccounts(),7);
control.verify();
}
}
Recording what we we expect:size() should be called, returning 7
Collection is mock.We want to test Bank,not Collection
Import MockControl
Turn on mock with replay()
Check expectations with verify()
Failing Expectations
Testing getLargest() with EasyMockpackage bank;
import java.util.SortedSet;import org.easymock.MockControl;
import junit.framework.TestCase;
public class TestBank extends TestCase {
…
public void testGetLargest() {
control = MockControl.createControl(SortedSet.class);
SortedSet mock = (SortedSet) control.getMock();
b = new Bank(mock);
mock.last();
try{
control.setReturnValue(new Account("Richie Rich",77777,99999.99));
control.replay();
assertEquals(b.getLargest().getBalance(),99999.99,.01);
} catch (Exception e) { fail("testGetLargest should not throw exception"); }
control.verify();
}
}
last() should be called on mock
When to use Mock Objects• When the real object has non-deterministic
behavior (e.g. a db that is always changing)• When the real object is difficult to set up• When the real object has behavior that is hard to
cause (such as a network error)• When the real object is slow• When the real object has (or is) a UI• When the test needs to query the object, but the
queries are not available in the real object• When the real object does not yet exist
* from http://c2.com/cgi/wiki?MockObject
255

B.2.2 Bowling Assignment
Bowling Exercise:Write the Java code to calculate and print the score of a game of bowling. The rulesof bowling are given below. Input should be read from a file. Each line of the inputfile should contain one game. The file format is:
bowlerID: frame1throw1 frame1throw2, frame2throw1 frame2throw2, ...,frame10throw1 frame10throw2 frame10throw3
wherea. bowlerID is an integer with up to 8 digitsb. If throw1 is 10 in a frame then throw2 will be blankc. Throw3 in frame10 may not existFor instance, one line might be:12345: 6 2, 8 1, 10, 4 0, 6 4, 2 3, 5 4, 10, 8 2, 4 5The program should print the bowlerID and final score of all games to an output
file in the same order as the games were in the input file. The program should beinvoked with a command-line interface like the following:
Bowling input.txt output.txt
An Overview of the Rules of Bowling [58]
Bowling is a game that is played by throwing a cantaloupe-sized ball down a narrowalley toward ten wooden pins. The object is to knock down as many pins as possibleper throw.
The game is played in ten frames. At the beginning of each frame, all ten pinsare set up. The player then gets two tries to knock them all down.
If the player knocks all the pins down on the first try, it is called a “strike,” andthe frame ends.
If the player fails to knock down all the pins with the first ball, but succeeds withthe second ball, it is called a “spare.”
After the second ball of the frame, the frame ends even if there are still pinsstanding.
A strike frame is scored by adding ten, plus the number of pins knocked downby the next two balls, to the score of the previous frame.
A spare frame is scored by adding ten, plus the number of pins knocked downby the next ball, to the score of the previous frame.
Otherwise, a frame is scored by adding the number of pins knocked down by thetwo balls in the frame to the score of the previous frame.
If a spare is thrown in the tenth frame, the player may throw one more ball tocomplete the score of the spare.
Likewise, if a strike is thrown in the tenth frame, then the player may throw twomore balls to complete the score of the strike.
256

Thus, the tenth frame may have three balls instead of two.
The score card above shows a typical, if rather poor, game. A darkened triangleindicates a spare. A darkened square indicates a strike.
In the first frame, the player knocked down 1 pin with his first ball and fourmore with his second. Thus, his score for the frame is a five.
In the second frame, the player knocked down four pins with his first ball andfive more with his second. That makes nine pins total, added to the previous framemakes fourteen.
In the third frame, the player knocked down six pins with his first ball andknocked down the rest with his second for a spare. No score can be calculatedfor this frame until the next ball is rolled.
In the fourth frame, the player knocked down five pins with his first ball. Thislets us complete the scoring of the spare in frame three. The score for frame threeis ten, plus the score in frame two (14), plus the first ball of frame four (5), or 29.The final ball of frame four is a spare.
Frame five is a strike. This lets us finish the score of frame four which is 29 + 10+ 10 = 49.
Frame six is dismal. The first ball went in the gutter and failed to knock downany pins. The second ball knocked down only one pin. The score for the strike inframe five is 49 + 10 + 0 + 1 = 60.
The rest you can probably figure out for yourself.Hints on Java I/O found in Examples/Bowling/Bowling.java:
import java.io.*;import java.util.StringTokenizer;
public class Bowling {public static void main(String []args) {BufferedReader in = null;PrintWriter out = null;if (args.length < 2) {System.out.println("Usage: Bowling <inputfile> <outputfile>");System.exit(0);
}try {in = new BufferedReader(new FileReader(args[0]));
} catch (IOException e) {System.out.println("Unable to open input file");System.exit(0);
257

}try {out = new PrintWriter(new FileWriter(args[1]));
} catch (IOException e) {System.out.println("Unable to open output file");System.exit(0);
}try {String line;int bowlerID;int ball;while((line = in.readLine()) != null) {a
StringTokenizer t = new StringTokenizer(line," ");bowlerID = Integer.parseInt(t.nextToken());while(t.hasMoreTokens()) {ball = Integer.parseInt(t.nextToken());
}out.print(bowlerID);out.print(’ ’);out.println("score goes here");
}out.close();
}catch (IOException e) {System.out.println("Something went wrong processing file");System.exit(0);
}}
}
258
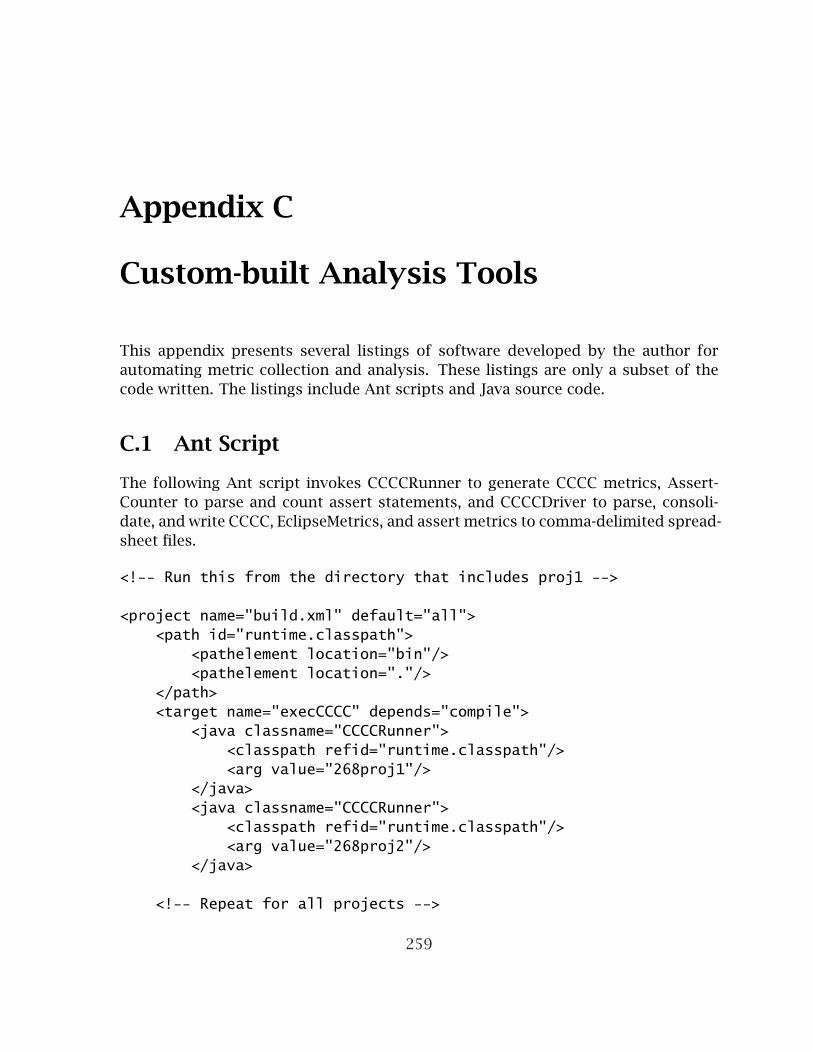
Appendix C
Custom-built Analysis Tools
This appendix presents several listings of software developed by the author forautomating metric collection and analysis. These listings are only a subset of thecode written. The listings include Ant scripts and Java source code.
C.1 Ant Script
The following Ant script invokes CCCCRunner to generate CCCC metrics, Assert-Counter to parse and count assert statements, and CCCCDriver to parse, consoli-date, and write CCCC, EclipseMetrics, and assert metrics to comma-delimited spread-sheet files.
<!-- Run this from the directory that includes proj1 -->
<project name="build.xml" default="all"><path id="runtime.classpath">
<pathelement location="bin"/><pathelement location="."/>
</path><target name="execCCCC" depends="compile">
<java classname="CCCCRunner"><classpath refid="runtime.classpath"/><arg value="268proj1"/>
</java><java classname="CCCCRunner">
<classpath refid="runtime.classpath"/><arg value="268proj2"/>
</java>
<!-- Repeat for all projects -->
259

</target><target name="countAsserts" depends="compile">
<java classname="AssertCounter"><classpath refid="runtime.classpath"/><arg value="268proj1"/><arg value="cpp"/>
</java><java classname="AssertCounter">
<classpath refid="runtime.classpath"/><arg value="268proj2"/><arg value="cpp"/>
</java>
<!-- Repeat for all projects -->
</target><target name="clean">
<delete dir="bin"/></target><target name="init">
<mkdir dir="bin"/></target><target name="compile" depends="init">
<javac srcdir="src" destdir="bin"><classpath refid="runtime.classpath"/>
</javac></target><target name="ccccProcess" depends="compile">
<java classname="CCCCDriver" ><classpath refid="runtime.classpath"/><arg value="268proj1"/>
</java><java classname="CCCCDriver" >
<classpath refid="runtime.classpath"/><arg value="268proj2"/>
</java>
<!-- Repeat for all projects -->
</target><target name="all"
depends="compile,execCCCC,countAsserts,ccccProcess"></target>
260

</project>
C.2 CCCCRunner
import java.io.File;
public class CCCCRunner {public static void main(String [] args) {try {
File f = new File(args[0]);String [] dirs = f.list();for(int i=0;i<dirs.length;i++) {File dir = new File(args[0] + File.separator + dirs[i]);if (dir.isDirectory()) {
System.out.println("CCCC Processing " + args[0] +File.separator + dirs[i]);
String comando [] = {"C:/Program Files/CCCC/cccc.exe","*.cpp", "*.h", "*.java" };
Runtime.getRuntime().exec(comando,null,dir);}
}} catch (Exception e) {}
}}
C.3 AssertCounter
import java.io.File; import java.io.FileOutputStream;
public class AssertCounter {public static void main(String [] args){ //expects dir name and "cpp" or "java"if (args.length < 2) {
System.out.println("usage: AssertCounter <dir> <extension>");System.exit(-1);
}if (!(args[1].equals("cpp") || args[1].equals("java"))) {
System.out.println("usage: AssertCounter <dir> <extension>");System.out.println("<extension> must be \"cpp\" or \"java\"");System.out.println("You gave "+args[0]+" and "+args[1]);
261
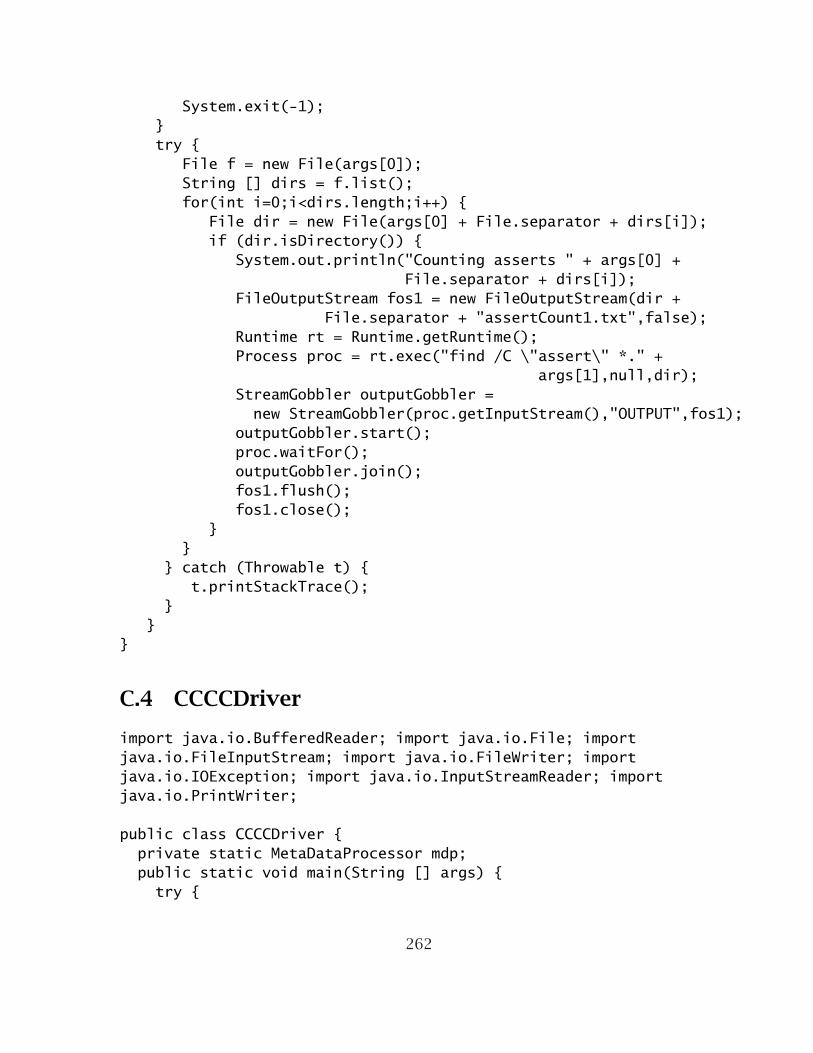
System.exit(-1);}try {
File f = new File(args[0]);String [] dirs = f.list();for(int i=0;i<dirs.length;i++) {
File dir = new File(args[0] + File.separator + dirs[i]);if (dir.isDirectory()) {
System.out.println("Counting asserts " + args[0] +File.separator + dirs[i]);
FileOutputStream fos1 = new FileOutputStream(dir +File.separator + "assertCount1.txt",false);
Runtime rt = Runtime.getRuntime();Process proc = rt.exec("find /C \"assert\" *." +
args[1],null,dir);StreamGobbler outputGobbler =new StreamGobbler(proc.getInputStream(),"OUTPUT",fos1);
outputGobbler.start();proc.waitFor();outputGobbler.join();fos1.flush();fos1.close();
}}
} catch (Throwable t) {t.printStackTrace();
}}
}
C.4 CCCCDriver
import java.io.BufferedReader; import java.io.File; importjava.io.FileInputStream; import java.io.FileWriter; importjava.io.IOException; import java.io.InputStreamReader; importjava.io.PrintWriter;
public class CCCCDriver {private static MetaDataProcessor mdp;public static void main(String [] args) {try {
262
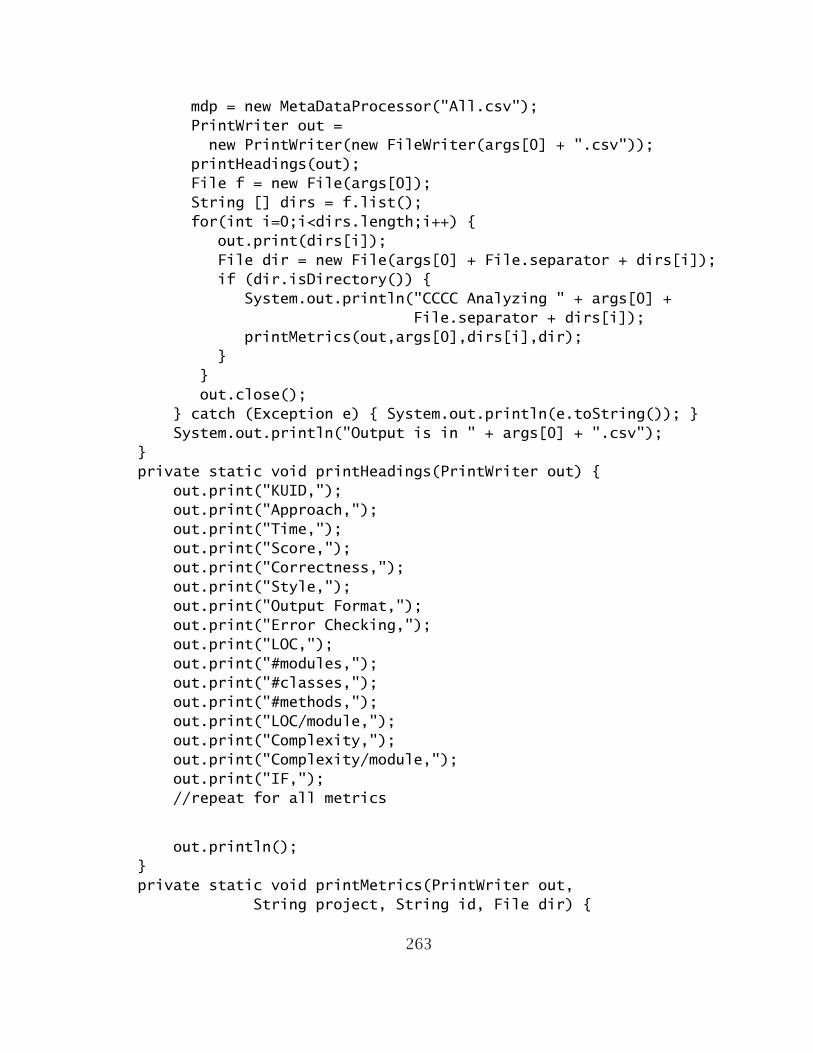
mdp = new MetaDataProcessor("All.csv");PrintWriter out =new PrintWriter(new FileWriter(args[0] + ".csv"));
printHeadings(out);File f = new File(args[0]);String [] dirs = f.list();for(int i=0;i<dirs.length;i++) {
out.print(dirs[i]);File dir = new File(args[0] + File.separator + dirs[i]);if (dir.isDirectory()) {
System.out.println("CCCC Analyzing " + args[0] +File.separator + dirs[i]);
printMetrics(out,args[0],dirs[i],dir);}
}out.close();
} catch (Exception e) { System.out.println(e.toString()); }System.out.println("Output is in " + args[0] + ".csv");
}private static void printHeadings(PrintWriter out) {
out.print("KUID,");out.print("Approach,");out.print("Time,");out.print("Score,");out.print("Correctness,");out.print("Style,");out.print("Output Format,");out.print("Error Checking,");out.print("LOC,");out.print("#modules,");out.print("#classes,");out.print("#methods,");out.print("LOC/module,");out.print("Complexity,");out.print("Complexity/module,");out.print("IF,");//repeat for all metrics
out.println();}private static void printMetrics(PrintWriter out,
String project, String id, File dir) {
263

String file = dir.toString() + File.separator +".cccc/cccc.xml";
CCCCAnalyzer ca = new CCCCAnalyzer(file);String emafile = dir.toString() + File.separator +
"metrics.xml";EclipseMetricsAnalyzer ema =
new EclipseMetricsAnalyzer(emafile);Project p = null;if (mdp != null) {
p = mdp.getProject(project,id);}
String loc,modules,classes,methods;int asserts;if (p != null) {
out.print("," + p.getApproach());out.print("," + p.getTime());out.print("," + p.getScore());out.print("," + p.getCorrectness());out.print("," + p.getStyle());out.print("," + p.getOutputFormat());out.print("," + p.getErrorChecking());
}else {
out.print(", , , , , , , ");}out.print("," + (loc = ca.getAttribute("lines_of_code")));out.print("," + (modules = ca.getAttribute("number_of_modules")));out.print("," + (classes = ca.getNumClasses()));out.print("," + (methods = ca.getNumMethods()));out.print("," + ca.getAttribute("lines_of_code_per_module"));out.print("," + ca.getAttribute("McCabes_cyclomatic_complexity"));out.print("," +
ca.getAttribute("McCabes_cyclomatic_complexity_per_module"));out.print("," + ca.getAttribute("IF4"));\\repeat for CCCC metrics
out.print("," + ema.getProjectAttributeValue(1,"NSM","value"));out.print("," + ema.getProjectAttributeValue(1,"NSM","avg"));//repeat for all Eclipse Metrics
264

out.print("," + (asserts = getAsserts(dir)));float iloc,imodules,iclasses,imethods;iloc = Integer.parseInt(loc);imodules = Integer.parseInt(modules);iclasses = Integer.parseInt(classes);imethods = Integer.parseInt(methods);if (iloc > 0) {
out.print("," + (asserts/iloc));}else {
out.print(", ");}if (imodules > 0) {
out.print("," + (asserts/imodules));}else {
out.print(", ");}if (iclasses > 0) {
out.print("," + (asserts/iclasses));}else {
out.print(", ");}if (imethods > 0) {
out.print("," + (asserts/imethods));}else {
out.print(", ");}
out.println();}private static int getAsserts(File dir) {
int count = 0;try {
FileInputStream fis = new FileInputStream(dir +File.separator + "assertCount1.txt");
InputStreamReader isr = new InputStreamReader(fis);BufferedReader br = new BufferedReader(isr);String line=null;while ( (line = br.readLine()) != null) {
265

int index = line.lastIndexOf(’:’);if(index>0) {
count += Integer.parseInt(line.substring(index+2));}
}} catch (IOException ioe) {
ioe.printStackTrace();}return count;
}}
C.5 CCCC Analyzer
import java.io.File; import java.io.IOException;
import javax.xml.parsers.DocumentBuilder; importjavax.xml.parsers.DocumentBuilderFactory; importjavax.xml.parsers.FactoryConfigurationError; importjavax.xml.parsers.ParserConfigurationException;
import org.w3c.dom.Document; import org.w3c.dom.NodeList; importorg.xml.sax.SAXException; import org.xml.sax.SAXParseException;
public class CCCCAnalyzer {private Document doc;public CCCCAnalyzer(String fileName) {
try {File f = new File(fileName);doc = DocumentBuilderFactory.newInstance().
newDocumentBuilder().parse(f);} catch (Exception e) {
System.out.println("Could not parse " + fileName);}
}
public String getAttribute(String att) {NodeList nodes = doc.getElementsByTagName(att);return nodes.item(0).getAttributes().
getNamedItem("value").getNodeValue();}
266

public String getNumClasses() {NodeList nodes =doc.getElementsByTagName("procedural_summary");
nodes = nodes.item(0).getChildNodes();int count=0;for(int i=1;i<nodes.getLength();i=i+2) { //for each module
if(validClassName(nodes.item(i).getChildNodes().item(1).getChildNodes().item(0).toString()))
count++;}return new Integer(count).toString();
}public String getNumMethods() {
NodeList nodes = doc.getElementsByTagName("oo_design");nodes = nodes.item(0).getChildNodes();int count=0;for(int i=1;i<nodes.getLength();i=i+2) { //for each module
if(validClassName(nodes.item(i).getChildNodes().item(1).getChildNodes().item(0).toString())) {count = count + new Integer(nodes.item(i).
getChildNodes().item(3).getAttributes().getNamedItem("value").getNodeValue()).intValue();
}}return new Integer(count).toString();
}private boolean validModuleName(String name) {
if( name.equals("String") ||name.equals("String[]") ||name.equals("Vector") ||name.equals("ArrayList") ||name.equals("Integer") ||name.equals("Double") ||name.equals("Long") ||name.equals("Boolean") ||name.equals("ofstream") ||name.equals("ifstream") ||name.equals("ostream") ||name.equals("istream") ||name.equals("iostream") ||name.equals("bool") ||
267

name.equals("string") ||name.equals("int") ||name.equals("short") ||name.equals("long") ||name.equals("unsigned int") ||name.equals("unsigned short") ||name.equals("unsigned long") ||name.equals("char") ||name.equals("float") ||name.equals("long double") ||name.equals("double"))
return false;else return true;
}private boolean validClassName(String name) {
if(name.equals("anonymous") ||name.equals("String") ||name.equals("String[]") ||name.equals("Vector") ||name.equals("ArrayList") ||name.equals("Integer") ||name.equals("Double") ||name.equals("Long") ||name.equals("Boolean") ||name.equals("ofstream") ||name.equals("ifstream") ||name.equals("ostream") ||name.equals("istream") ||name.equals("iostream") ||name.equals("bool") ||name.equals("string") ||name.equals("int") ||name.equals("short") ||name.equals("long") ||name.equals("unsigned int") ||name.equals("unsigned short") ||name.equals("unsigned long") ||name.equals("char") ||name.equals("float") ||name.equals("long double") ||name.equals("double"))
return false;
268

else return true;}
private String getMaxTemplate(String tagName, int index) {NodeList nodes = doc.getElementsByTagName(tagName);nodes = nodes.item(0).getChildNodes();int max=0;for(int i=1;i<nodes.getLength();i=i+2) { //for each module
if(validClassName(nodes.item(i).getChildNodes().item(1).getChildNodes().item(0).toString())) {
int current = new Integer(nodes.item(i).getChildNodes().item(index).getAttributes().getNamedItem("value").getNodeValue()).intValue();
if (current > max)max = current;
}}return new Integer(max).toString();
}private String getAvgTemplate(String tagName, int index) {
NodeList nodes = doc.getElementsByTagName(tagName);nodes = nodes.item(0).getChildNodes();int sum=0;int count=0;for(int i=1;i<nodes.getLength();i=i+2) { //for each module
if(validClassName(nodes.item(i).getChildNodes().item(1).getChildNodes().item(0).toString())) {
int current = new Integer(nodes.item(i).getChildNodes().item(index).getAttributes().getNamedItem("value").getNodeValue()).intValue();
sum += current;count++;
}}return new Double(((double)sum)/count).toString();
}private String getMaxProcTemplate(String tagName, int index) {
NodeList nodes = doc.getElementsByTagName(tagName);nodes = nodes.item(0).getChildNodes();int max=0;for(int i=1;i<nodes.getLength();i=i+2) { //for each module
if(validModuleName(nodes.item(i).getChildNodes().item(1).
269

getChildNodes().item(0).toString())) {int current = new Integer(nodes.item(i).
getChildNodes().item(index).getAttributes().getNamedItem("value").getNodeValue()).intValue();
if (current > max)max = current;
}}return new Integer(max).toString();
}private String getAvgProcTemplate(String tagName, int index) {
NodeList nodes = doc.getElementsByTagName(tagName);nodes = nodes.item(0).getChildNodes();int sum=0;int count=0;for(int i=1;i<nodes.getLength();i=i+2) { //for each module
if(validModuleName(nodes.item(i).getChildNodes().item(1).getChildNodes().item(0).toString())) {
int current = new Integer(nodes.item(i).getChildNodes().item(index).getAttributes().getNamedItem("value").getNodeValue()).intValue();
sum += current;count++;
}}return new Double(((double)sum)/count).toString();
}
public String getMaxLOCperModule() {return getMaxProcTemplate("procedural_summary",3);
}
public String getMaxComplexityPerModule() {return getMaxProcTemplate("procedural_summary",5);
}
//repeat for all aggregate metrics
}
270

Appendix D
Metrics
This appendix summarizes some of the metrics used in analyzing software.
D.1 Robert C. Martin Suite
The following metrics and definitions come from [58].
Afferent Coupling (CA)
The number of classes outside a package that depend on classes inside the package.
Efferent Coupling (CE)
The number of classes inside a package that depend on classes outside the package.
Instability (I)
CE / (CA + CE)
Abstractness (A)
The number of abstract classes (and interfaces) divided by the total number of typesin a package.
Normalized Distance from Main Sequence (D)
| A + I - 1 |, this number should be small, close to zero for good packaging design.
271

D.2 Eclipse Metrics
The following metrics and definitions come from [75] and [43].
D.2.1 Class Metrics
Specialization Index
Average of the specialization index, defined as NORM * DIT / NOM.
Number of Overridden Methods
Total number of methods in the selected scope that are overridden from an ancestorclass.
D.3 JStyle
The following definitions come from JStyle 5.0 online help [78].
D.3.1 Project-wide Metrics
Number of Packages
Total number of distinct packages in the project. A package in Java convenientlygroups similar packages. Classes that are not defined in a package belong to thedefault package, represented in JStyle as "#default#".
Number of Modules
The total number of source files included in the project.
Number of Interfaces
The total number of interfaces (public and nonpublic) defined in the project.
Number of Classes
The total number of classes defined in the project. This measure includes top-level(public and nonpublic), local, and inner classes. Not included in the measure areclasses that are referenced but whose definitions are not available in the project.
272

Number of Public Classes
The total number of classes defined using the "public" qualifier. Public classes thatbelong to a package can be referenced in other packages, whereas nonpublic classescannot be referenced that way.
Number of Final Classes
The total number of classes defined using the "final" qualifier. This includes publicas well as nonpublic classes. By definition, a final class does not allow another classto be derived from it.
Number of Abstract Classes
The total number of classes defined using the “abstract” qualifier. This includespublic as well as nonpublic classes.
Number of Top-level Classes
The total number of classes (public and nonpublic) defined at the top level. Themeasure does not include inner, local and anonymous classes.
Number of Inner Classes
The total number of non-static inner classes (public and nonpublic) in the project.Includes inner classes at all levels of nesting, not just top-level ones.
Number of Nested Classes
A nested class is a "static" class defined inside another class. This measure gives thetotal number of such nested classes (public and nonpublic, at all levels of nesting)in the project.
Number of Local Classes
A Local class is one that is defined within code blocks such as a method body,constructor or initialization block. Such a class is inaccessible outside of the blockin which it is defined. Local classes cannot be qualified as "public" or "static".
This measure gives the total number of local classes in the project, includinganonymous classes.
273
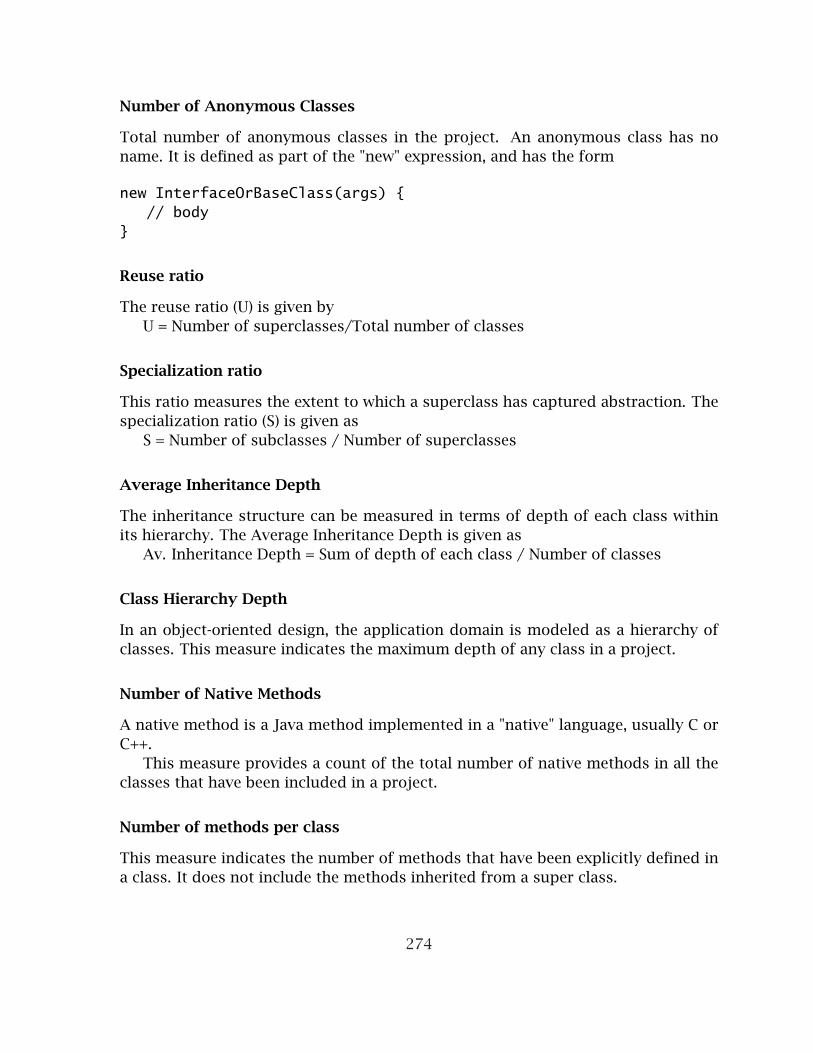
Number of Anonymous Classes
Total number of anonymous classes in the project. An anonymous class has noname. It is defined as part of the "new" expression, and has the form
new InterfaceOrBaseClass(args) {// body
}
Reuse ratio
The reuse ratio (U) is given byU = Number of superclasses/Total number of classes
Specialization ratio
This ratio measures the extent to which a superclass has captured abstraction. Thespecialization ratio (S) is given as
S = Number of subclasses / Number of superclasses
Average Inheritance Depth
The inheritance structure can be measured in terms of depth of each class withinits hierarchy. The Average Inheritance Depth is given as
Av. Inheritance Depth = Sum of depth of each class / Number of classes
Class Hierarchy Depth
In an object-oriented design, the application domain is modeled as a hierarchy ofclasses. This measure indicates the maximum depth of any class in a project.
Number of Native Methods
A native method is a Java method implemented in a "native" language, usually C orC++.
This measure provides a count of the total number of native methods in all theclasses that have been included in a project.
Number of methods per class
This measure indicates the number of methods that have been explicitly defined ina class. It does not include the methods inherited from a super class.
274

Method size
This measure denotes the total number of statements per method of a project.
D.3.2 Module-wide Metrics
Total Lines
This measure provides a count of the total number of lines in a module. It includesthe source lines, blank lines, and comment lines.
Comment Lines
This measure indicates the total number of comment lines in a module.
Blank Lines
This measure indicates the total number of blank lines in a module.
Source Lines
This measure indicates the total number of actual lines of code (LOC) in a module.
Comment Density
The comment density is given by the formula: Comment density = Number of com-ment lines / Total number of lines
JStyle reports comment density for individual modules.
Number of Classes & Interfaces
This measure indicates the total number of classes and interfaces defined in a mod-ule.
D.4 Class-wide Metrics
Inheritance Depth
The Inheritance Depth of a class indicates its position in the class hierarchy. In Java,the Object class is the root of all classes and is at level 0. A class directly derivedfrom Object is at level 1 and so on. For this measure to be reported correctly for
275

your project, make sure that all external classes are correctly resolved. Unresolvedclasses may cause an incorrect depth to be reported.
Number of Interfaces Implemented
A Java class may implement zero or more interfaces. This measure indicates thetotal number of interfaces implemented by a class.
Number of classes implementing interface
This measure provides a count of the total number classes implementing an inter-face.
Number of Instance Variables
This measure provides the total number of instance variables in a class.
Number of Static Variables
This measure provides the total number of static variables in a class.
Number of Static Methods
This measure indicates the total number of the static methods in the class.
Number of Instance Methods
This measure indicates the total number of instance methods that have been explic-itly defined in a class.
Number of Native Methods
This measure indicates the number of native methods declared in a class.
Number of Primitive Methods
This metric is a measure of the total number of methods in a class that use onlyprivate fields.
Number of NonPrimitive Methods
This measure indicates the total number of methods in a class that do not useprivate fields.
276

Number of Methods
This measure provides a count of the total number of methods that have been ex-plicitly defined in a class.
Weighted Methods Complexity (WMC)
WMC calculates the structural complexity on a class level. In a class of n methods,each of cyclomatic complexity Vij(G), the Weighted Methods Complexity is calcu-lated as per the following formula.WMC =∑nj=1 Vij(G), where i represents the ith class.
Response For Class (RFC)
This measure captures the size of the response set of a class. The response set ofa class consists of all the methods called by local methods. RFC is the sum of thenumber of local methods and the number of methods called by local methods. It isgiven by RFC = |RS|, where RS = Mi ∪ j{Rij}
Here Mi represents the set of all methods in the class (total n) and {Rij} repre-sents the set of methods called by Mi.
An equivalent definition isRFC = NLM + NRM,where,NLM = number of local methodsNRM = number of remote methods.
Lack of Cohesion of Methods (LCOM)
The cohesion of a class is characterized by how closely the local methods are relatedto the local instance variables in a class. LCOM is defined as the number of disjoint(that is, non-intersecting) sets of local methods.
For all computations of LCOM, constructors, and methods that are abstract,static, or synthesized (by the compiler - JStyle) are not taken into consideration.Similarly, static fields and synthesized fields are ignored. Also local and anony-mous classes defined inside a method are not considered as part of the method butare treated as independent classes and hence have no impact on the LCOM of theouter class. Similarly, inner classes do not have any impact on the LCOM of a class.The fields and methods used are those that belong to the class for which LCOM iscomputed, super classes and super interfaces are not taken into consideration.
277

LCOM (Chidamber-Kemerer)
Chidamber and Kemerer define LCOM as a count of the number of method pairswhose similarity is zero minus the count of method pairs whose similarity is notzero. The degree of similarity, Ψ between two methods is given by Ψ(M1,M2) =|1 ∩ |2
If there are no common properties then, similarity = 0.
Consider a class C with n methods M1, M2, ...Mn. Let {Ij} = set of instance vari-ables used by method Mi. There are n such sets {I1}...{In}.
If P = {(Ii, Ij), Ii ∩ Ij = ∅} andQ = {(Ii, Ij), Ii ∩ Ij 6= ∅} thenIf (P > Q), LCOM(Chidamber-Kemerer) = P-QOtherwise, LCOM(Chidamber-Kemerer) = 0
For a perfectly cohesive class the value of LCOM (Chidamber-Kemerer) is 0, and fora totally non-cohesive class the LCOM (Chidamber-Kemerer) value equals (n(n-1))/2where n represents the total number of methods present in the class.
LCOM (Li-Henry)
Li and Henry defined LCOM as the number of disjoint sets of methods, where anytwo methods in the same set share at least one local instance variable.
In LCOM (Li-Henry), a value of 1 represents a perfectly cohesive class, whereas fora totally non-cohesive class the value equals the total number of methods presentin the class.
LCOM (Henderson-Sellers)
Consider a set of methods {Mi}(i = 1, ...m) accessing a set of attributes {Aj}(j =1, ...a). Let the number of methods which access each datum be Mu(Aj). ThenLCOM∗ = ((1/a∑aj=1m(Aj))−m)/1−mThe value of LCOM (Henderson-Sellers) is 0 for a perfectly cohesive class and
greater than 0 for non-cohesive classes.
Number of Inner Classes
This metric indicates the total number of (non-static) inner classes defined in a class.
Number of Inner Static Classes
This measure indicates the total number of top-level static classes defined in a class.
278

Number of Local Classes
This measure denotes the total number of local classes in various methods of aclass including anonymous local classes.
Number of Anonymous Classes
This measure gives the number of anonymous classes in various methods of a class.
Number of Children
This measure gives a count of the number of classes that are directly derived froma class.
Fan-in
This measure indicates the total number of classes that are dependent on a particu-lar class. Only the classes that are directly dependent on a class are considered forcalculating Fan-in.
For example, if two classes A and B use class C, the Fan-in of class C is 2.A large value of Fan-in is suggestive of high reuse.
Fan-out
This measure gives the number of classes that are used by a particular class. All theclasses that are directly used by a class including inherited classes are consideredfor calculating the Fan-out. For example, if class A uses three classes B, C, and D,then Fan-out for class A is 4 (this value includes the Object class too).
A large value of Fan-out is suggestive of tight coupling.
Intra-Package Fan-in
This metric is a measure of the number of classes that are dependent on a specificclass within a package.
Intra-Package Fan-out
This measure provides a count of the number of classes that are used by a specificclass within a package.
279

Inter-package Fan-in
This measure indicates the number of classes outside a package that are dependenton a specific class.
Inter-package Fan-out
This metric denotes the number of classes outside a package that is used by aspecific class.
D.4.1 Method-wide Metrics
Number of Statements
This measure indicates the actual number of statements in a method.
Number of Exceptions thrown
This measure indicates the number of exceptions thrown by a method.
Cyclomatic Number
Cyclomatic number proposed by McCabe is one of the widely used measures tounderstand the structural complexity of a program. This number, based on a graph-theoretic concept, counts the number of linearly independent paths through theprogram.
If G is the control flow graph of program P, and G has e edges (arcs) and n nodes,then Cyclomatic number
V(G) = e - n + 2Or, more simply, if d is the number of decision nodes in G, then Cyclomatic
numberV(G) = d + 1The value of d for the Java constructs is listed below.
Java Constructs Value of d
if...then 1if...then...else 1for 1while 1do...while 1case statements 1
JStyle computes V(G) for every method in a class, not to the module as a whole.
280
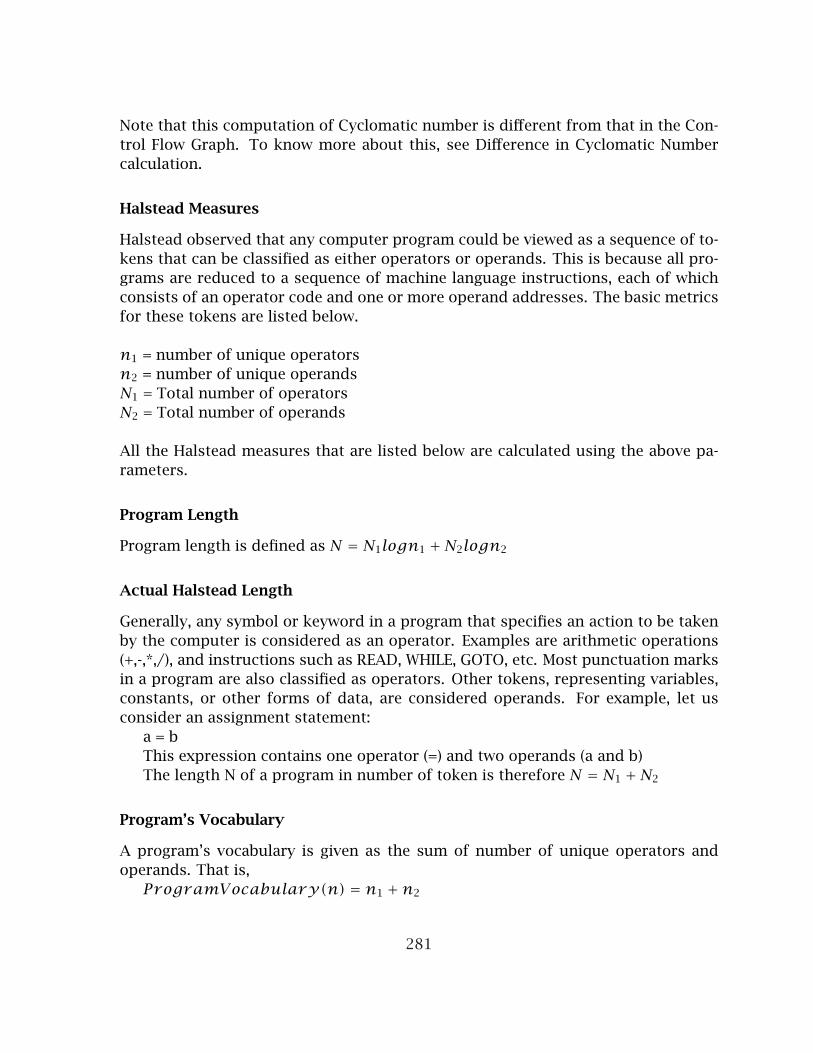
Note that this computation of Cyclomatic number is different from that in the Con-trol Flow Graph. To know more about this, see Difference in Cyclomatic Numbercalculation.
Halstead Measures
Halstead observed that any computer program could be viewed as a sequence of to-kens that can be classified as either operators or operands. This is because all pro-grams are reduced to a sequence of machine language instructions, each of whichconsists of an operator code and one or more operand addresses. The basic metricsfor these tokens are listed below.
n1 = number of unique operatorsn2 = number of unique operandsN1 = Total number of operatorsN2 = Total number of operands
All the Halstead measures that are listed below are calculated using the above pa-rameters.
Program Length
Program length is defined as N = N1logn1 +N2logn2
Actual Halstead Length
Generally, any symbol or keyword in a program that specifies an action to be takenby the computer is considered as an operator. Examples are arithmetic operations(+,-,*,/), and instructions such as READ, WHILE, GOTO, etc. Most punctuation marksin a program are also classified as operators. Other tokens, representing variables,constants, or other forms of data, are considered operands. For example, let usconsider an assignment statement:
a = bThis expression contains one operator (=) and two operands (a and b)The length N of a program in number of token is therefore N = N1 +N2
Program’s Vocabulary
A program’s vocabulary is given as the sum of number of unique operators andoperands. That is,ProgramVocabulary(n) = n1 +n2
281

Program Volume (V)
The volume of a program is related to the number of mental comparisons requiredto write a program of length N. This measure is given by: V = Nlog2n
In the above expression, N = N1 +N2 and n = n1 +n2.
Substituting these values in the expression for volume, we get V = (N1+N2)log2(n1+n2)
Program Level (L)
Program Level L is defined asL = 2n2/n1N2
Program Difficulty (D)
Difficulty is the inverse of Program Level.D = 1/L
Development Effort (E)
Development Effort is defined asE = V/L
Bug Predicted
Bug predicted is defined asBugs predicted = Volume/3000
D.5 Krakatau Professional
The following metrics and definitions come from [77]. Some minor corrections havebeen made.
D.5.1 Project Metrics
DPIT - Depth of Project class Inheritance Tree
This metric measures the maximum depth of the class inheritance tree for the wholeproject. Large values for DPIT tend to indicate that leaf classes will be inheritingmany methods and members from parent classes making their behaviour difficult to
282

predict. Of course, deep inheritance also indicates that classes are less specialisedand so increases possibilities for reuse.
NORC - Number Of Root Classes
This measures the number of discrete class hierarchies present in the project. Alarge value for NORC will suggest that a large amount of effort for testing will berequired (since test cases for each hierarchy will need to be developed). This metricmust be interpreted carefully where (for example) all classes inherit from the ‘Ob-ject’ class; technically there is only one class hierarchy but notionally and practicallythere could be more.
LOC - Lines Of Code
Lines Of Code is the traditional measure of size for a project. LOC includes sourcecode lines, whitespace lines and comment lines and so is a more primitive measurethan SLOC.
SLOC - Source Lines Of Code
SLOC measures the number of lines containing actual program source code. SLOCis LOC minus whitespace lines and comment lines. Because SLOC measures onlysource code lines, some consider it a better guide to actual project size than LOC.
NFILES - Number of Files
NFILES measures the number of files in a project. This metric is a primitive measureof project size.
MHF - Method Hiding Factor
MHF is a metric from the MOOD (Metrics for Object-Oriented Development) suite.MHF is calculated as a fraction. The numerator is the sum of the invisibilities of allmethods defined in all classes. The invisibility of a method is the percentage of thetotal classes from which this method is not visible. The MHF denominator is thetotal number of methods defined in the project.
AHF - Attribute Hiding Factor
AHF is a metric from the MOOD (Metrics for Object-Oriented Development) suite.AHF is calculated as a fraction. The numerator is the sum of the invisibilities of allattributes defined in all classes. The invisibility of an attribute is the percentage of
283

the total classes from which this method is not visible. The AHF denominator is thetotal number of attributes defined in the project.
MIF - Method Inheritance Factor
MIF is a metric from the MOOD (Metrics for Object-Oriented Development) suite andis calculated as a fraction. The MIF denominator is the sum of inherited methodsin all classes in the project. The MIF denominator is the total number of availablemethods (locally defined plus inherited) for all classes.
AIF - Attribute Inheritance Factor
AIF is a metric from the MOOD (Metrics for Object-Oriented Development) suite andis calculated as a fraction. The AIF numerator is the sum of inherited attributesin all classes in the project. The AIF denominator is the total number of availableattributes (locally defined plus inherited) for all classes.
POF - Polymorphism Factor
POF is a metric from the MOOD (Metrics for Object-Oriented Development) suite andis calculated as a fraction. The POF numerator is the sum of overriding methods inall classes. This is the actual number of possible different polymorphic situations.Indeed, a given message sent to a class can be bound, statically or dynamically, to anamed method implementation. The latter can have as many shapes (morphos) asthe number of times this same method is overridden (in that class’s descendants).The POF denominator represents the maximum number of possible distinct poly-morphic situations for that class as the sum for each class of the number of newmethods multiplied by the number of descendants. This maximum would be thecase where all new methods defined in each class would be overridden in all of theirderived classes.
COF - Coupling Factor
COF is a metric from the MOOD (Metrics for Object-Oriented Development) suiteand is calculated as a fraction. The COF denominator stands for the maximum pos-sible number of couplings in a system with TC classes. The client-supplier relation(represented by Cc => Cs) means that Cc(client class) contains at least one non-inheritance reference to a feature (method or attribute) of class Cs (supplier class).The COF numerator then represents the actual number of couplings not imputableto inheritance.
284

AVCALLS - Average number of calls
The metric measures the average number of calls made by methods and functionsin the call tree.
AVPATHS - Average Paths
The average number of paths in the call tree. As the value of this metric increases,the testing and debugging becomes more difficult. This measures the difficulty oftesting. Applications with large values of component levels may contain a largenumber of untested paths that tend to be unexpectedly executed. This problem canplague client/server applications.
COM_LOC - Comment Lines of Code
This metric measures the total number of lines of code in the project which containcomments.
COM_RAT - Comment Ratio
This metric measures the ratio of comment lines of code (COM_LOC) to total linesof code including whitespace and comments (LOC).
TCOM_RAT - True Comment Ratio
This metric measures the ratio of comment lines of code (COM_LOC) to source linesof code (excluding whitespace and comments (SLOC).
D.5.2 File Metrics
LOC - Lines Of Code
The number of lines of code in a file provides a primitive measure of effort taken tounderstand or maintain the contents of that file.
SLOC - Source Lines Of Code
This metric measures only the number of lines in a file containing source code.SLOC is LOC minus whitespace lines and comment lines.
285

NTC - Number of Top-level Classes
The number of top-level classes in a file should usually not exceed 1. If there ismore than one top-level class, then this file may be considered particularly unusualor complex.
NTM - Number of Top-level Methods
Under normal circumstances, it is quite reasonable to have several top-level meth-ods in a file.
N1 - Total Number of Operators
N1 is the total number of operators used in a file. This is used as an input to theHalstead Software Science metrics.
N2 - Total Number of Operands
N2 is the total number of operands used in a file. This is used as an input to theHalstead Software Science metrics.
n1 - Number of Unique Operators
n1 is the number of unique operators used in a file. This is used as an input to theHalstead Software Science metrics.
n2 - Number of Unique Operands
n2 is the number of unique operands used in a file. This is used as an input to theHalstead Software Science metrics.
N - Halstead Program Length
N is calculated as N1+N2 and is a general measure of program length for a givenfile.
n - Halstead Program Vocabulary
n is calculated as n1+n2 and is a measure of the number of unique operands andoperators used in a particular file. This can provide an impression of comprehensi-bility/complexity for that file.
286

V - Halstead Program Volume
V is the program volume metric from the Halstead Software Science metrics. This iscalculated as V=N*(LOG2 n).
D - Halstead Difficulty
D is the difficulty metric from the Halstead Software Science metrics. This is calcu-lated as D=(n1/n2)*(N2/n2).
E - Halstead Effort
E is the effort metric from the Halstead Software Science metrics. This is calculatedas E=D*V.
AVCALLS - Average Calls
AVCALLS measures the average number of calls to subordinate logical units frommethods and functions in a particular file. Therfore, this metric is a measure ofFAN-OUT.
C_COM - C style comments
This metric measures the number of C style (/* ... */) comments used in a particularfile. This can help to measure the extent of documentation for a file.
CPP_COM - C++ style comments
This metric measures the number of C++ style (// ...) comments used in a particularfile. This can help to measure the extent of documentation for a file.
COM_LOC - Comment Lines of Code
COM_LOC measures the number of lines of code in a file which contain comments.Lines containing more than one comment are only counted once. Like C_COM andCPP_COM, COM_LOC is a measure of the extent of documentation in a source file.
COM_RAT - Comment Ratio
This metric measures the ratio of comment lines of code (COM_LOC)ato total linesof code including whitespace and comments (LOC).
287

TCOM_RAT - True Comment Ratio
This metric measures the ratio of comment lines of code (COM_LOC) to source linesof code (excluding whitespace and comments (SLOC).
D.5.3 Class Metrics
CSA - Class Size in Attributes
CSA measures class size by counting the number of attributes of a class (not includ-ing inherited attributes). If a class has a high number of attributes, it may be wiseto consider whether it would be appropriate to divide the class into subclasses.
CSO - Class Size in Operations
CSO measures class size by counting the number of operations (methods) in a class(not including inherited methods). If a class has a high number of methods, itmay be wise to consider whether it would be appropriate to divide the class intosubclasses.
CSAO - Class Size in Attributes and Operations
CSAO is the sum of CSA and CSO. Results should be interpreted as for the individualCSA and CSO metrics.
PPPC - Percentage of Package, Public and Protected members in a Class
Members which have package level protection are visible to other classes in the samepackage. Public members are available to classes in all packages and protectedmembers are available to subclasses. Therefore, extensive use of such membersviolates the encapsulation principle. This metric allows us to see the proportion of’vulnerable’ members in a class. A large proportion of such members means that theclass has high potential to be affected by external classes and means that increasedeffort will be needed to test such a class thoroughly.
NOCC - Number Of Child Classes
This metric counts the number of classes which inherit from a particular class (i.e.the number of classes in the inheritance tree down from a class). As this valueincreases, it is obvious that the particular class is being re-used well. However, itis also important to consider that where there are many child classes, are they allgenuinely appropriate members of the parent class? In this case, the abstraction of
288

the class may be poor. It is also true that as NOCC increases, the amount of testingrequired for each child class will increase.
DIT - Depth in Class Inheritance Tree
This metric reports how deeply a class resides in the class inheritance tree. Highvalues imply that a class is quite specialised.
RFC - Response For a Class
This metric measures the number of methods that can be invoked in response to amessage to an object of a class. For larger values of RFC, it is obvious that requiredtesting effort becomes greater as does the overall design complexity of the class.
CBO - Coupling Between Object classes
The value for CBO is the number of classes which a particular class refers to. Thisis a measure of how cohesive (and therefore reusable) a particular class is likely tobe. References can be uses of classes as member types, parameter types, methodlocal variable types or casts.
LOCM - Lack Of Cohesion of Methods
LOCM measures the percentage of methods that do not access a specific attributeaveraged over all attributes in the class. A low percentage indicates high couplingbetween methods which indicates high testing effort (since many methods can affectthe same attributes) and potentially low reusability.
NOOC - Number of Operations Overridden by a Class
NOOC measures the number of inherited operations which a class overrides. Highvalues for NOOC tend to indicate design problems; subclasses ’should’ generallyadd to and extend the functionality of the parent classes rather than overridingthem.
NOAC - Number of Operations Added by a Class
This metric measures the number of operations added by a class (inherited opera-tions are not counted). As this value becomes larger for a class, the functionality ofthat class becomes increasingly distinct from that of the parent classes. In this case,it should be considered whether this class should genuinely be inheriting from theparent or if it could be broken down into several, smaller classes.
289

WMC - Weighted Methods per Class
WMC is a count of the methods in a class (weighted according to complexity). Thevalue of WMC can indicate whether this class is likely to be suitable for re-use.
CSI - Class Specialisation Index
CSI provides a measure of specialisation for a class. The higher value for CSI, themore likely that a particular class does not conform to the abstraction of it’s super-classes.
OSavg - Average Operation Size
This metric provides a measure of the average size of the operations (methods) fora particular class. Any conventional functional metric can be used to determineoperation ‘size’ but the standard cyclomatic complexity metric (and variations ofthis) will yield ‘realistic’ results. In OO development, it is desirable to have small,fine-grained methods, so higha values for OSavg are a warning that it may helpimprove code quality if some methods in the class were broken down.
NPavgC - Average Number of Parameters for methods in a Class
Methods with a high number of parameters generally require considerable testing(as their input can be highly varied). Also, large numbers of parameters lead tomore complex, less maintainable code. This metric provides an average number ofparameters for methods in a class (not including inherited methods).
AC - Attribute Complexity
Attribute Complexity is defined as the sum of R(i) where R(i) is the value of eachattribute in the class evaluated from the table below. Summing R(i) for a class givesthis metric value. AC is from the work of Chen & Lu.
Type Value
Boolean/Integer 1Char 1Real 2
Array 3-4Pointer 5
Record, Struct or Object 6-9File 10
290

OpCom - Operation Complexity
The definition for operation complexity is the sum of O(i) where O(i) is operation i’scomplex value as McCabe complexity V(g). Summing the O(i) for each operation inthe class gives this metric value.
LOC - Lines Of Code comprising a Class
LOC is a primitive metric to measure the size of a class. It is included for traditionalreasons.
D.5.4 Method Metrics
NP - Number of Parameters
NP is simply a measure of the number of parameters that a method accepts. Highvalues for NP can mean that a method will require extensive testing (since the rangeof possible inputs may be greater). As a rule of thumb, methods with many param-eters also tend to be more specialised and so are less likely to be reusable.
V(G) - Cyclomatic Complexity
Cyclomatic Complexity measures the number of possible paths through an algo-rithm by counting the number of distinct regions on a flowgraph. This representsthe cognitive complexity of the method.
V’(G) - Enhanced Cyclomatic Complexity
V’(G) brings together the notions of cyclomatic and operational complexity (by di-viding OC by V(G)). This provides the average operational complexity for decisionpoints in a method and is a strong indicator of the overall cognitive complexity ofthe method.
eV(G) - Essential Complexity
eV(G) is a measure of the structure of testable paths in a component. Values ex-ceeding the threshold (7) usually signal an unstructured implementation of controllogic. To calculate, we develop a directed graph to represent the control structureof the logical unit. This graph should contain only the four basic and simple struc-tured constructs: sequence, selection, iteration and case. We only keep structureswhich contain occurences of unstructured constructs (break, continue, goto) andrecalculate complexity on this graph. This measures the difficulty and feasibility of
291

the testing as the presence of unstructured constructs increases effort of testing aswell as future code modifications.
LOC - Method Lines Of Code
LOC is a primitive metric to measure the size of a method. It is included for tradi-tional reasons.
OC - Operational Complexity
This metric assigns weights to operations which can occur in expressions. Thevalues of weights for all the expressions in a method are summed to provide avalue for OC. This is complementary to V(G) since it looks at the complexity of theexpressions which are being evaluated rather than the number of decision points inthe method.
RLOC - Relative Lines Of Code
This metric measures the lines of code in a method relative to the containing class.This is a primitive means to measure the proportional significance of a method.
NEST - Maximum Number of Levels
Since the 1950’s, cognitive sciences studies have shown that groups that containmore than seven pieces of information are increasingly harder for people to under-stand in problem solving. To measure this, we count the number of If...Then orIf...Then...Elses in a nest. Logical units with a large number of nested levels mayneed implementation simplification and process improvement.
N1 - Total Number of Operators
N1 is the total number of operators used in a file. This is used as an input to theHalstead Software Science metrics.
N2 - Total Number of Operands
N2 is the total number of operands used in a file. This is used as an input to theHalstead Software Science metrics.
n1 - Number of Unique Operators
n1 is the number of unique operators used in a file. This is used as an input to theHalstead Software Science metrics.
292
n2 - Number of Unique Operands
n2 is the number of unique operands used in a file. This is used as an input to theHalstead Software Science metrics.
N - Halstead Program Length
N is calculated as N1+N2 and is a general measure of program length for a givenfile.
n - Halstead Program Vocabulary
n is calculated as n1+n2 and is a measure of the number of unique operands andoperators used in a particular file. This can provide an impressionof comprehensibility/complexity for that file.
V - Halstead Program Volume
V is the program volume metric from the Halstead Software Science metrics. This iscalculated as V=N*(LOG2 n).
D - Halstead Difficulty
D is the difficulty metric from the Halstead Software Science metrics. This is calcu-lated as D=(n1/n2)*(N2/n2).
E - Halstead Effort
E is the effort metric from the Halstead Software Science metrics. This is calculatedas E=D*V.
CALLS - Number of Calls
CALLS is the number of calls from a method/function to subordinate logical units(methods/functions). This is a measure of the degree of FAN-OUT.
BRANCH - Number of Branching Nodes
Higher values indicate possible use of “gotos” and/or abnormal exits from controlstructures such as loops. This problem is an indicator of unstructured design andincreases the testing difficulty. For components written in C, a higher value may bepermitted due to the legitimate use of C “breaks” in a “switch” statement.
293
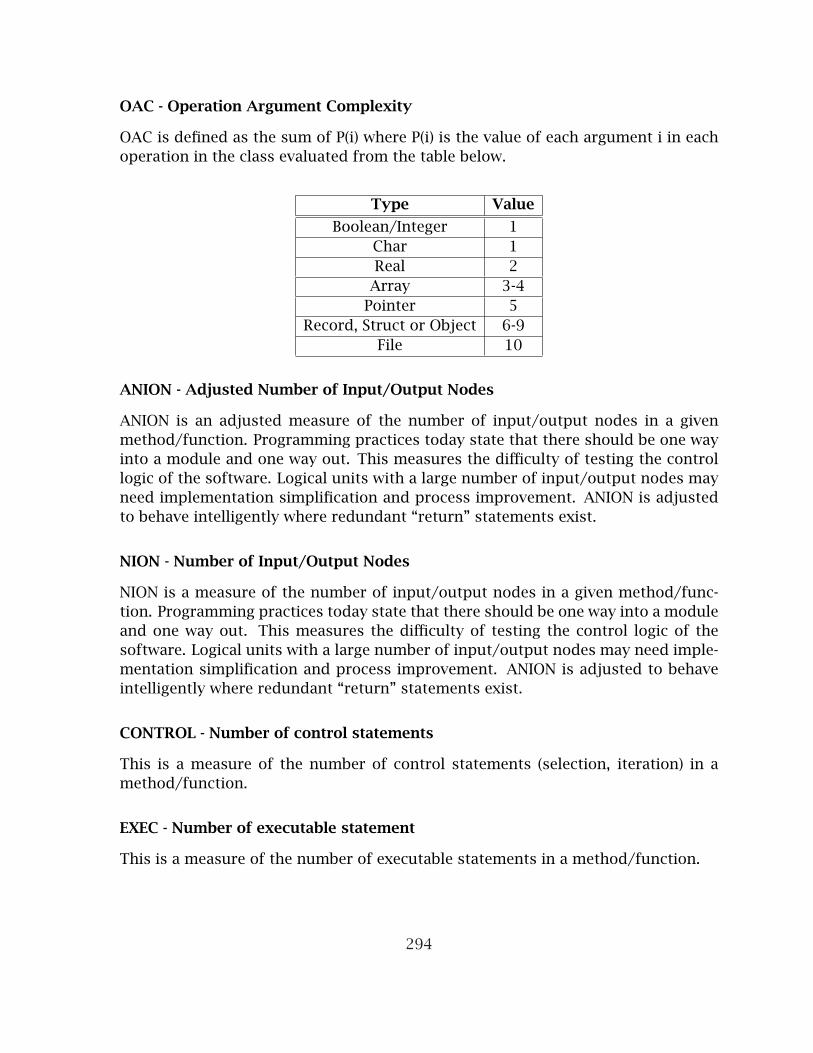
OAC - Operation Argument Complexity
OAC is defined as the sum of P(i) where P(i) is the value of each argument i in eachoperation in the class evaluated from the table below.
Type Value
Boolean/Integer 1Char 1Real 2
Array 3-4Pointer 5
Record, Struct or Object 6-9File 10
ANION - Adjusted Number of Input/Output Nodes
ANION is an adjusted measure of the number of input/output nodes in a givenmethod/function. Programming practices today state that there should be one wayinto a module and one way out. This measures the difficulty of testing the controllogic of the software. Logical units with a large number of input/output nodes mayneed implementation simplification and process improvement. ANION is adjustedto behave intelligently where redundant “return” statements exist.
NION - Number of Input/Output Nodes
NION is a measure of the number of input/output nodes in a given method/func-tion. Programming practices today state that there should be one way into a moduleand one way out. This measures the difficulty of testing the control logic of thesoftware. Logical units with a large number of input/output nodes may need imple-mentation simplification and process improvement. ANION is adjusted to behaveintelligently where redundant “return” statements exist.
CONTROL - Number of control statements
This is a measure of the number of control statements (selection, iteration) in amethod/function.
EXEC - Number of executable statement
This is a measure of the number of executable statements in a method/function.
294

NSTAT - Number of statements
NSTAT is a measure of the total number of statements in a method/function. Thisis calculated as CONTROL+EXEC.
CDENS - Control Density
This is a measure of the “richness” of decision nodes in a module. A high densitymodule will be more difficult to maintain than a less dense one. We count thenumber of control statements and the number of complex executable statements.Control density is the ratio of control statements to the total number of statements.
QCP_MAINT - Quality Criteria Profile (Maintainability)
MAINTAINABILITY=3 * Halstead Length + Number of statements + Maximum levels+ 2 * Cyclomatic Number + Number of Branching Nodes
QCP_CRCT - Quality Criteria Profile (Correctness)
CORRECTNESS=Halstead Difficulty + Number of statements + 2 * Cyclomatic Num-ber
295
Appendix E
Metrics Tools
This appendix presents a comparison of twelve metrics tools evaluated in conduct-ing this research. Identifying, acquiring, and determining the metrics produced byeach tool was a non-trivial task. The results of this search are presented here inhopes of aiding other researchers.
Table E.1, Table E.2, and Table E.3 present the metrics produced by the twelvemetrics tools. All metrics generated by any of these tools are listed. In the “Level”column, M indicates Method, C indicates Class, P indicates Project, K indicates Pack-age, and F indicates File.
Table E.4 assigns abbreviation names for each metric tool and identifies whatlanguages each tool supports.
Table E.5, Table E.6, and Table E.7 present the metrics produced by each of thetwelve metrics tools. An ’x’ indicates that a tool generates that particular metric.The table identifies what metrics are generated by which tools and identifies overlapbetween tools.
296

Metric Metric Description Level
TLOC Total Lines of Code M,C,PCA Afferent Coupling KRMD Normalized Distance KNOC Number of Classes KNOC Number of Classes PSIX Specialization Index C,KRMI Instability KNOF Number of Attributes C,File,KNOP Number of Packages PMLOC Method Lines of Code MWMC Weighted methods per Class C,File,KWMCv Weighted methods per Class (visible/public)NORM Number of Overridden Methods C,File,KNBD Nested Block Depth M,C,File,KPAR Number of Parameters M,C,File,KNRP Number of Return Points M,C,PIC Interface complexity (params + returns) M,C,PRMA Abstractness KNOI Number of Interfaces PCE Efferent Coupling KNOM Number of Modules (Files) PNPC Number of Public Classes PNFC Number of Final Classes PNAbC Number of Abstract Classes PNTC Number of Toplevel Classes PNTSC Number of Toplevel(Static Inner Class) PNIC Number of Inner Classes PNLoC Number of Local Classes PNAC Number of Anonymous Classes PREU Reuse ratio PSPC Specialization ratio PAID Average Inheritance Depth PCHD Class Hierarchy Depth PNNM Number of Native Methods PNMC Number of methods per class - Mean PNMCs Number of methods per class - Standard Deviation P
Table E.1: Metrics Description 1
297

Metric Metric Description Level
MSAvg Method size - Mean PMSSd Method size - Standard Deviation PTL Total Lines FileCL Comment Lines FileCOM Comment Lines C,PC_COM in-line comments File,PBL Blank Lines FileSL Source Lines FileNCSS Source Lines M,C,KCD CommentDensity FileL_C lines of code per line of commentDIT Depth of Inheritance Tree CNII Number of Interfaces Implemented CNCI Number of classes implementing interface CNIV Number of Instance Variables CNSV Number of Static Variables CNOV CNIM Number of Instance Methods CNSM Number of Static Methods CNNM Number of Native Methods CNPM Number of Primitive Methods CNNP Number of NonPrimitive Methods CNOM Number of Methods CWMC Weighted Methods Complexity CRFC Response For Class CLCOM_CK Lack of Cohesion of Methods(Chidamber-Kemerer) CLCOM_LH LCOM (Li-Henry) CLCOM_HS LCOM (Henderson-Sellers) CNIC Number of Inner Classes CNIS Number of Inner Static Classes CNLC Number of Local Classes CNAC Number of Anonymous Classes CNOC Number of Children CFI Fan-in CFO Fan-out CPFI Intra-Package Fan-in CPFO Intra-Package Fan-out CIFI Inter-package Fan-in CIFO Inter-package Fan-out CNOS Number of Statements M
Table E.2: Metrics Description 2
298

Metric Metric Description Level
NOE Number of Exceptions thrown MV(G) Cyclomatic Number MFC functional complexity (interface + cyclomatic) MMVG McCabe’s Cyclomatic Complexity M,C,PPL Halstead Program Length MAHL Actual Halstead Length MVOC Halstead Program’s Vocabulary MVOL Halstead Program Volume MLVL Halstead Program Level MPD Halstead Program Difficulty MEFF Halstead Development Effort MBUG Halstead Bug Predicted MMI Halstead Maintainability IndexJavadocs lines of Java docsM_C Cyclomatic Complexity per comment C,PIF4 Information Flow C,PIF4v Information Flow (visible) C,PIF4c Information Flow (concrete) C,PCBO coupling between objects CNOTe Number of exported types KCYC Cyclic Dependencies KDIP Dependency Inversion Principle CDCYC Direct Cyclic Dependency KEP Encapsulation Principle KLSP Limited Size Principle KAVPATHS average depth of paths PNSC number of semicolons PANION adjusted number of I/O nodes MBRANCH number of abnormal exits MCDENS control density MCONTROL number of control statements MRLOC relative size of code MeVG essential complexity MV’G extended complexity MAHF attribute hiding factor PAIF attribute inheritance factor PMHF method hiding factor PMIF method inheritance factor PPOC polymorphism factor PNEST nests of like constructs
Table E.3: Metrics Descriptions 3
299

Tool Abbreviation Language Supported
CMT++ CM C++Essential Metrics EM C++depend.sh (ObjectMentor) DP C++CCCC CC C,C++,JavaRSM RS C,C++,C#,JavaEclipse Metrics EC JavaJstyle 5.0 JS JavaJavaNCSS JN JavaJdepend JD JavaRefactorIT RI JavaCMJava CM JavaEssential Metrics EJ Java
Table E.4: Metrics Tool Language Support
300
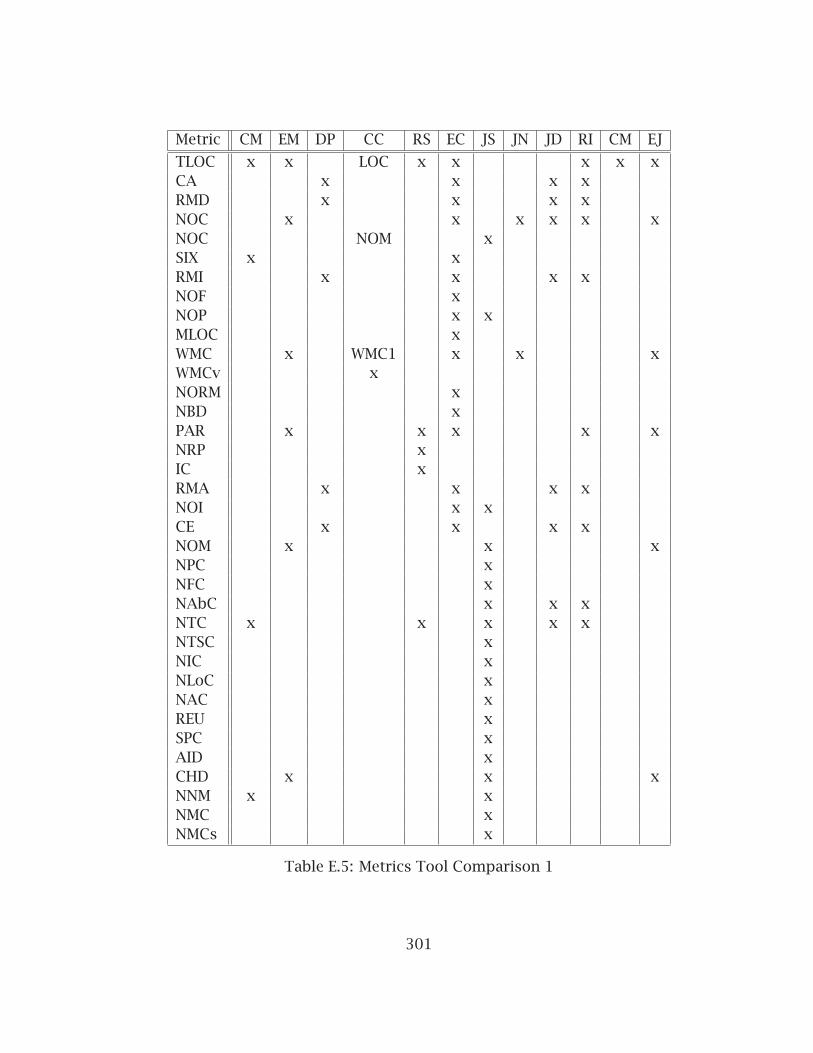
Metric CM EM DP CC RS EC JS JN JD RI CM EJ
TLOC x x LOC x x x x xCA x x x xRMD x x x xNOC x x x x x xNOC NOM xSIX x xRMI x x x xNOF xNOP x xMLOC xWMC x WMC1 x x xWMCv xNORM xNBD xPAR x x x x xNRP xIC xRMA x x x xNOI x xCE x x x xNOM x x xNPC xNFC xNAbC x x xNTC x x x x xNTSC xNIC xNLoC xNAC xREU xSPC xAID xCHD x x xNNM x xNMC xNMCs x
Table E.5: Metrics Tool Comparison 1
301
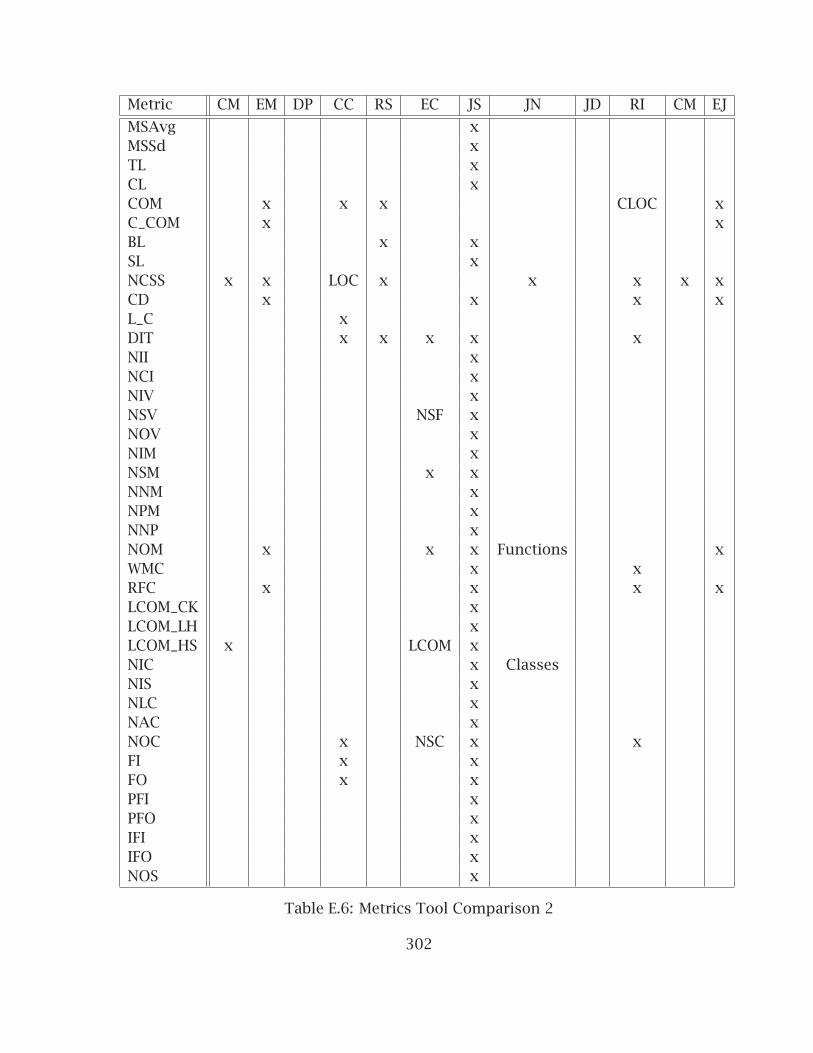
Metric CM EM DP CC RS EC JS JN JD RI CM EJ
MSAvg xMSSd xTL xCL xCOM x x x CLOC xC_COM x xBL x xSL xNCSS x x LOC x x x x xCD x x x xL_C xDIT x x x x xNII xNCI xNIV xNSV NSF xNOV xNIM xNSM x xNNM xNPM xNNP xNOM x x x Functions xWMC x xRFC x x x xLCOM_CK xLCOM_LH xLCOM_HS x LCOM xNIC x ClassesNIS xNLC xNAC xNOC x NSC x xFI x xFO x xPFI xPFO xIFI xIFO xNOS x
Table E.6: Metrics Tool Comparison 2
302

Metric CM EM DP CC RS EC JS JN JD RI CM EJ
NOE xV(G) x x x x x CCN x x xFC xMVG xPL x x xAHL xVOC x x xVOL x x x x xLVL x x xPD x x xEFF x x xBUG x x xMI x x x xJavadocs xM_C xIF4 xIF4v xIF4c xCBO x xNOTe xCYC xDIP xDCYC xEP xLSP xAVPATHS x xNSC x xANION x xBRANCH x xCDENS x xCONTROL x xRLOC x xeVG x xV’G x xAHF x xAIF x xMHF x xMIF x xPOC x xNEST x x
Table E.7: Metrics Tool Comparison 3
303

Appendix F
Surveys
This appendix presents the survey instruments used in this research.
F.1 Academic Pre-Experiment Survey
Survey on Programming Attitudes EECS 268 Programming II
This survey is designed to evaluate your programming experience and your per-ceptions and use of testing and design practices.
What is your KU ID? __________________
Previous College Computer Science Courses (programming based)How many college computer science courses have you taken at KU or elsewhere thatcontained a substantial computer programming component?
01234 or more
Previous Other Computer Science Courses (programming based)How many non-college computer science courses have you taken that contained asubstantial computer programming component?
none1 semester in high school2 semesters in high school3 or more semesters in high school1 semester or more elsewhere (short course or vocational school)
304

Previous Computer Programming ExperiencePlease rate your level of competence with the following programming languages?Circle one number for each language/group of languages. Use the following scale:
1. Never programmed in this language.
2. Minimal experience. Maybe compiled a test program.
3. Some experience. Wrote one or two small programs.
4. Substantial experience. Wrote several small to medium-sized programs.
5. Extensive experience. Wrote many programs.
C++ 1 2 3 4 5Java 1 2 3 4 5Visual Basic 1 2 3 4 5Python, Perl or other scripting based languages 1 2 3 4 5JavaScript, html, ASP or other web based languages 1 2 3 4 5Other, please specify ________________ 1 2 3 4 5
Time Since Last ProgrammingWhen did you last write a computer program in the following language? Circle onenumber for each language/group of languages. Use the following scale:
1. Never programmed in this language before.
2. Within last three months.
3. Four to twelve months ago.
4. One to three years ago.
5. More than three years ago.
C++ 1 2 3 4 5Java 1 2 3 4 5Visual Basic 1 2 3 4 5Python, Perl or other scripting based languages 1 2 3 4 5JavaScript, html, ASP or other web based languages 1 2 3 4 5Other, please specify ________________ 1 2 3 4 5
Attitude Towards TestingHow important is it to test computer programs that you have written?
305
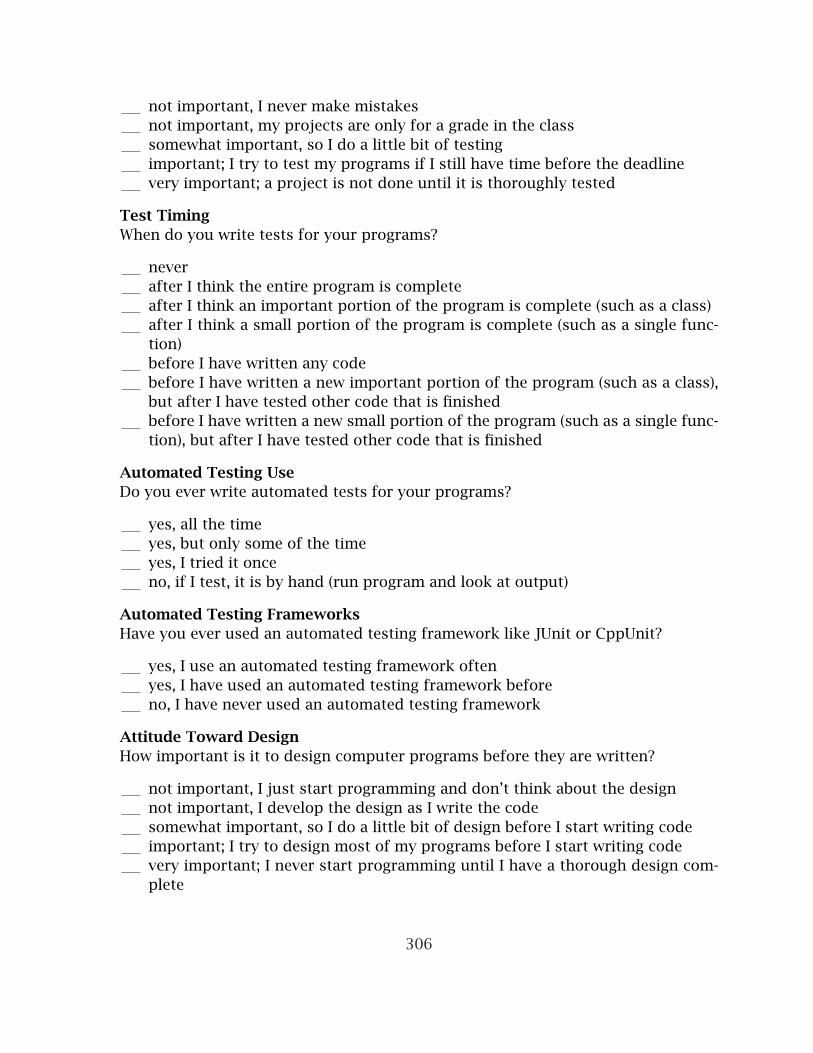
not important, I never make mistakesnot important, my projects are only for a grade in the classsomewhat important, so I do a little bit of testingimportant; I try to test my programs if I still have time before the deadlinevery important; a project is not done until it is thoroughly tested
Test TimingWhen do you write tests for your programs?
neverafter I think the entire program is completeafter I think an important portion of the program is complete (such as a class)after I think a small portion of the program is complete (such as a single func-tion)before I have written any codebefore I have written a new important portion of the program (such as a class),but after I have tested other code that is finishedbefore I have written a new small portion of the program (such as a single func-tion), but after I have tested other code that is finished
Automated Testing UseDo you ever write automated tests for your programs?
yes, all the timeyes, but only some of the timeyes, I tried it onceno, if I test, it is by hand (run program and look at output)
Automated Testing FrameworksHave you ever used an automated testing framework like JUnit or CppUnit?
yes, I use an automated testing framework oftenyes, I have used an automated testing framework beforeno, I have never used an automated testing framework
Attitude Toward DesignHow important is it to design computer programs before they are written?
not important, I just start programming and don’t think about the designnot important, I develop the design as I write the codesomewhat important, so I do a little bit of design before I start writing codeimportant; I try to design most of my programs before I start writing codevery important; I never start programming until I have a thorough design com-plete
306
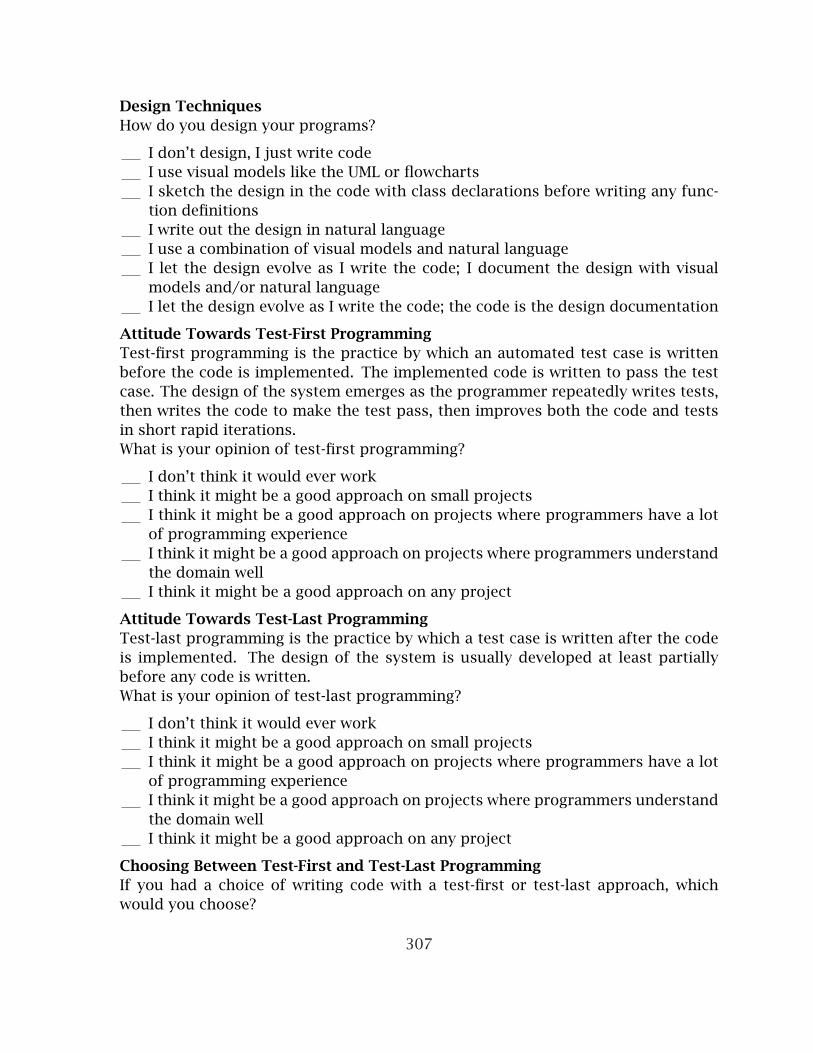
Design TechniquesHow do you design your programs?
I don’t design, I just write codeI use visual models like the UML or flowchartsI sketch the design in the code with class declarations before writing any func-tion definitionsI write out the design in natural languageI use a combination of visual models and natural languageI let the design evolve as I write the code; I document the design with visualmodels and/or natural languageI let the design evolve as I write the code; the code is the design documentation
Attitude Towards Test-First ProgrammingTest-first programming is the practice by which an automated test case is writtenbefore the code is implemented. The implemented code is written to pass the testcase. The design of the system emerges as the programmer repeatedly writes tests,then writes the code to make the test pass, then improves both the code and testsin short rapid iterations.What is your opinion of test-first programming?
I don’t think it would ever workI think it might be a good approach on small projectsI think it might be a good approach on projects where programmers have a lotof programming experienceI think it might be a good approach on projects where programmers understandthe domain wellI think it might be a good approach on any project
Attitude Towards Test-Last ProgrammingTest-last programming is the practice by which a test case is written after the codeis implemented. The design of the system is usually developed at least partiallybefore any code is written.What is your opinion of test-last programming?
I don’t think it would ever workI think it might be a good approach on small projectsI think it might be a good approach on projects where programmers have a lotof programming experienceI think it might be a good approach on projects where programmers understandthe domain wellI think it might be a good approach on any project
Choosing Between Test-First and Test-Last ProgrammingIf you had a choice of writing code with a test-first or test-last approach, whichwould you choose?
307

test-firsttest-last
Why?
AgeHow old are you today?
18 to 22 years23 to 26 years27 to 35 yearsover 35 years
GenderWhat is your gender?
MaleFemale
RaceWhich category best fits your race?
WhiteAfrican or African AmericanAsianHispanicOther
ClassificationHow does the university currently classify you?
FreshmanSophomoreJuniorSeniorGraduateOther
MajorWhat is your major?
Computer ScienceComputer EngineeringElectrical EngineeringOther: please specify
308

Overall GPAWhat is your overall GPA?
3.5 – 4.03.0 – 3.52.5 – 3.02.0 – 2.51.5 – 2.01.0 – 1.5below 1.0
Major GPAWhat is your GPA in your major?
3.5 – 4.03.0 – 3.52.5 – 3.02.0 – 2.51.5 – 2.01.0 – 1.5below 1.0
Additional CommentsIs there anything else related to this study that you would like to comment on thatwe have missed or that you would like to add?
F.2 Academic Post-Experiment Survey
Survey on Programming Attitudes EECS 268 Programming 2This survey is designed to evaluate your programming experience and your percep-tions and use of testing and design practices.
KUID
What is your KU ID? ______________________
Approach UsedWhat approach did you use on the projects completed in class so far?
Test-First Test-Last Neither
Project 1 (array-based DriverTable) ________ ________ ______Project 2 (linked-list DriverTable) ________ ________ ______
309

Project 3 (grammar) ________ ________ ______
Confidence of Software QualityI am confident that the code I wrote for Project 1 and 2 is correct.
strongly agreeagreesomewhat agreeneither agree or disagreesomewhat disagreedisagree
Confidence of Software ChangesI am confident that I could make changes to the code I wrote for Project 1 and 2without breaking things.
strongly agreeagreesomewhat agreeneither agree or disagreesomewhat disagreedisagree
Confidence of Software ReuseI am confident that I could reuse the code I wrote for Project 1 and 2 in anotherfuture project.
strongly agreeagreesomewhat agreeneither agree or disagreesomewhat disagreedisagree
Attitude Towards TestingHow important is it to test computer programs that you have written?
not important, I never make mistakesnot important, my projects are only for a grade in the classsomewhat important, so I do a little bit of testingimportant; I try to test my programs if I still have time before the deadlinevery important; a project is not done until it is thoroughly tested
Test TimingWhen do you think is the best time to write tests for your programs?
310
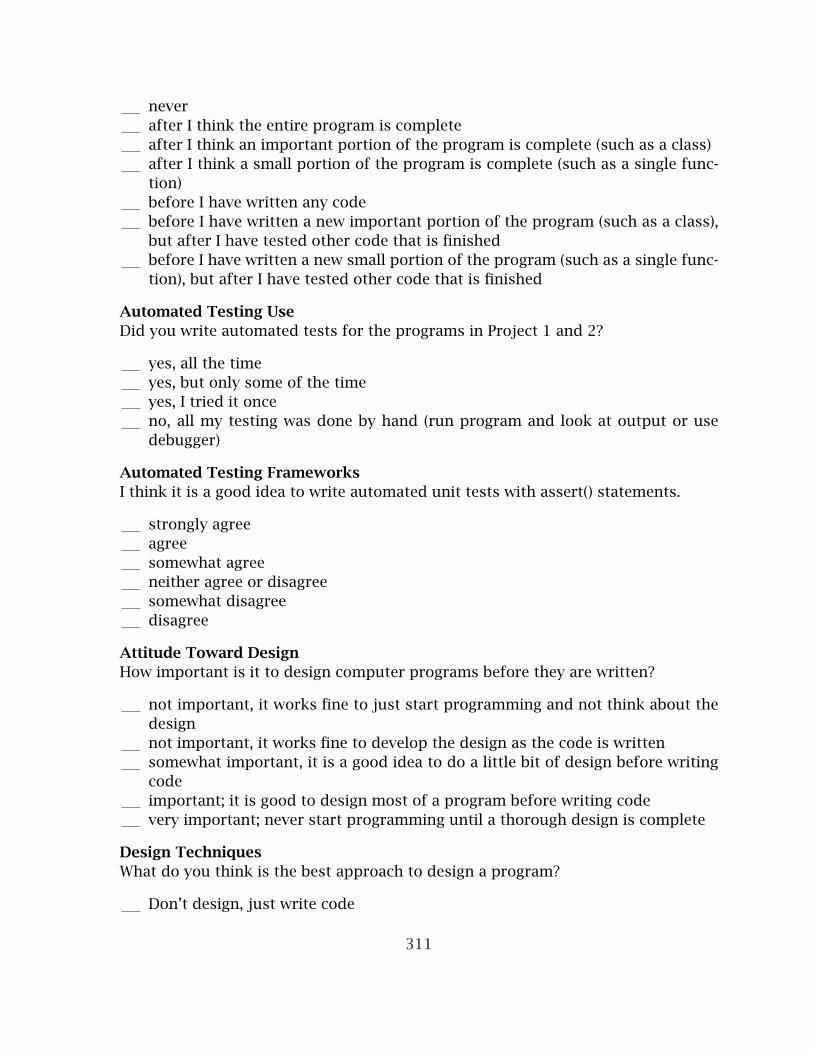
neverafter I think the entire program is completeafter I think an important portion of the program is complete (such as a class)after I think a small portion of the program is complete (such as a single func-tion)before I have written any codebefore I have written a new important portion of the program (such as a class),but after I have tested other code that is finishedbefore I have written a new small portion of the program (such as a single func-tion), but after I have tested other code that is finished
Automated Testing UseDid you write automated tests for the programs in Project 1 and 2?
yes, all the timeyes, but only some of the timeyes, I tried it onceno, all my testing was done by hand (run program and look at output or usedebugger)
Automated Testing FrameworksI think it is a good idea to write automated unit tests with assert() statements.
strongly agreeagreesomewhat agreeneither agree or disagreesomewhat disagreedisagree
Attitude Toward DesignHow important is it to design computer programs before they are written?
not important, it works fine to just start programming and not think about thedesignnot important, it works fine to develop the design as the code is writtensomewhat important, it is a good idea to do a little bit of design before writingcodeimportant; it is good to design most of a program before writing codevery important; never start programming until a thorough design is complete
Design TechniquesWhat do you think is the best approach to design a program?
Don’t design, just write code
311
Use visual models like the UML or flowchartsSketch the design in code with class declarations before writing function defini-tionsWrite out the design in natural languageUse a combination of visual models and natural languageLet the design evolve as the code is written; document the design with visualmodels and/or natural languageLet the design evolve as the code is written; the code is the design documenta-tion
Attitude Towards Test-First ProgrammingTest-first programming is the practice by which an automated test case is writtenbefore the code is implemented. The implemented code is written to pass the testcase. The design of the system emerges as the programmer repeatedly writes tests,then writes the code to make the test pass, then improves both the code and testsin short rapid iterations.What is your opinion of test-first programming?
I don’t think it would ever workI think it might be a good approach on small projectsI think it might be a good approach on projects where programmers have a lotof programming experienceI think it might be a good approach on projects where programmers understandthe domain wellI think it might be a good approach on any project
Attitude Towards Test-Last ProgrammingTest-last programming is the practice by which a test case is written after the codeis implemented. The design of the system is usually developed at least partiallybefore any code is written.What is your opinion of test-last programming?
I don’t think it would ever workI think it might be a good approach on small projectsI think it might be a good approach on projects where programmers have a lotof programming experienceI think it might be a good approach on projects where programmers understandthe domain wellI think it might be a good approach on any project
Perception of Test-First and Test-Last ProgrammingRegardless of the approach you used, which approach do you think produces codewith fewer defects, test-first or test-last?
test-first
312

test-last
Perception of Test-First and Test-Last ProgrammingRegardless of the approach you used, which approach do you think produces codethat is simpler, more reusable, and more maintainable, test-first or test-last?
test-firsttest-last
Perception of Test-First and Test-Last ProgrammingRegardless of the approach you used, which approach do you think produces acorrect solution in less time, test-first or test-last?
test-firsttest-last
Perception of Test-First and Test-Last ProgrammingRegardless of the approach you used, do you think you are more likely to thoroughlytest a program with the test-first or the test-last approach?
test-firsttest-last
Perception of Test-First and Test-Last ProgrammingRegardless of the approach you used, for the course project you just completed,which do you think was the best approach, test-first or test-last?
test-firsttest-last
Why?
Choosing Between Test-First and Test-Last ProgrammingIf you had a choice of writing code with a test-first or test-last approach, whichwould you choose?
test-firsttest-last
Why?
Additional CommentsIs there anything else related to this study that you would like to comment on thatwe have missed or that you would like to add?
313

F.3 Industry Pre-Experiment Survey
Survey on Programming AttitudesThis survey is designed to evaluate your programming experience and your percep-tions and use of testing and design practices.
College EducationCheck the most appropriate description of your college experience.
Never attended collegeAttended some college, no computer-related coursesAttended some college, some computer-related coursesCompleted BA/BS, non-computing major/minorCompleted BA/BS, computing-related major/minorCompleted BA/BS and some graduate work, non-computing major/minorCompleted BA/BS and some graduate work, computing-related major/minorCompleted graduate degree (MS/PhD), non-computing major/minorCompleted graduate degree (MS/PhD), computing-related major/minor
Work ExperienceHow many years have you worked in a computing-related job?
<11-56-1011-20>20
Employee IDWhat is your Employee ID? ______________________
AgeHow old are you today?
< 25 years26 to 35 yearsover 35 years
GenderWhat is your gender?
MaleFemale
RaceWhich category best fits your race?
314

WhiteAfrican or African AmericanAsianHispanicOther
Computer Programming ExperienceHow many years have you worked in a job that had a significant computer program-ming component?
<11-56-1011-20>20
Previous Computer Programming ExperiencePlease rate your level of competence with programming languages prior to this class.Circle one number for each language/group of languages. Use the following scale:
1. Never programmed in this language.
2. Minimal experience. Maybe compiled a test program.
3. Some experience. Wrote one or two small programs.
4. Substantial experience. Wrote several small to medium-sized programs.
5. Extensive experience. Wrote many programs.
C++ 1 2 3 4 5Java 1 2 3 4 5Visual Basic 1 2 3 4 5Python, Perl or other scripting based languages 1 2 3 4 5JavaScript, html, ASP or other web based languages 1 2 3 4 5Assembly 1 2 3 4 5Other, please specify 1 2 3 4 5
Time Since Last ProgrammingWhen did you last write a computer program in the following languages prior to thisclass? Circle one number for each language/group of languages. Use the followingscale:
1. Never programmed in this language before.
315

2. Within last three months.
3. Four to twelve months ago.
4. One to three years ago.
5. More than three years ago.
C++ 1 2 3 4 5Java 1 2 3 4 5Visual Basic 1 2 3 4 5Python, Perl or other scripting based languages 1 2 3 4 5JavaScript, html, ASP or other web based languages 1 2 3 4 5Assembly 1 2 3 4 5Other, please specify 1 2 3 4 5
Testing KnowledgeDo you know the difference between unit testing and integration testing?
yesno, but I’ve heard those termsno, I have no idea what you are talking about
Attitude Towards TestingHow important is it to unit test computer programs that you have written?
not important, I never make mistakesnot important, my projects are not for production or someone else will test itsomewhat important, so I do a little bit of unit testingimportant; I try to unit test my programs if I still have time before the deadlinevery important; my part is not done until it is thoroughly unit tested
Test TimingWhen do you write unit tests for your programs?
neverafter I think the entire program is completeafter I think an important portion of the program is complete (such as a class)after I think a small portion of the program is complete (such as a single func-tion)before I have written any codebefore I have written a new important portion of the program (such as a class),but after I have tested other code that is finishedbefore I have written a new small portion of the program (such as a single func-tion), but after I have tested other code that is finished
316

Automated Testing UseDo you ever write automated unit tests for your programs?
yes, all the timeyes, but only some of the timeyes, I tried it onceno, if I test, it is by hand (run program and look at output)
Automated Testing FrameworksHave you ever used an automated testing framework like JUnit or CppUnit?
yes, I use an automated testing framework oftenyes, I have used an automated testing framework beforeno, I have never used an automated testing framework
Attitude Toward DesignHow important is it to design computer programs before they are written?
not important, I just start programming and don’t think about the designnot important, I develop the design as I write the codesomewhat important, so I do a little bit of design before I start writing codeimportant; I like most of the design complete before I start writing codevery important; I never start programming until I have a thorough design com-plete
Design TechniquesHow do you design your programs?
I don’t design, I just write codeI use visual models like the UML or flowchartsI sketch the design in code with class declarations before writing function defi-nitionsI write out the design in natural languageI use a combination of visual models and natural languageI let the design evolve as I write the code; I document the design with visualmodels and/or natural languageI let the design evolve as I write the code; the code is the design documentation
Attitude Towards Test-First ProgrammingTest-first programming is the practice by which an automated test case is writtenbefore the code is implemented. The implemented code is written to pass the testcase. The design of the system emerges as the programmer repeatedly writes tests,then writes the code to make the test pass, then improves both the code and testsin short rapid iterations.What is your opinion of test-first programming?
317

I don’t think it would ever workI think it might be a good approach on small projectsI think it might be a good approach on projects where programmers have a lotof programming experienceI think it might be a good approach on projects where programmers understandthe domain wellI think it might be a good approach on any project
Attitude Towards Test-Last ProgrammingTest-last programming is the practice by which a test case is written after the codeis implemented. The design of the system is usually developed at least partiallybefore any code is written.What is your opinion of test-last programming?
I don’t think it would ever workI think it might be a good approach on small projectsI think it might be a good approach on projects where programmers have a lotof programming experienceI think it might be a good approach on projects where programmers understandthe domain wellI think it might be a good approach on any project
Choosing Between Test-First and Test-Last ProgrammingIf you had a choice to writing code with a test-first or test-last approach, whichwould you choose?
test-firsttest-last
Why?
F.4 Industry Post-Experiment Survey
Survey on Programming AttitudesThis survey is designed to evaluate your programming experience and your percep-tions and use of testing and design practices.
Employee IDWhat is your Employee ID? ______________________
Confidence of Software QualityI am confident that the code I wrote for the course exercise is correct.
strongly agree
318

agreesomewhat agreeneither agree or disagreesomewhat disagreedisagree
Confidence of Software ChangesI am confident that I could make changes to the code I wrote for the course exercisewithout breaking things.
strongly agreeagreesomewhat agreeneither agree or disagreesomewhat disagreedisagree
Confidence of Software ReuseI am confident that I could reuse the code I wrote for the course exercise in a futureproject.
strongly agreeagreesomewhat agreeneither agree or disagreesomewhat disagreedisagree
Attitude Towards TestingHow important is it to unit test computer programs that you have written?
not important, I never make mistakesnot important, my projects are not for production or someone else will test itsomewhat important, so I do a little bit of unit testingimportant; I try to unit test my programs if I still have time before the deadlinevery important; my part is not done until it is thoroughly unit tested
Test TimingWhen do you think is the best time to write tests for your programs?
neverafter I think the entire program is completeafter I think an important portion of the program is complete (such as a class)after I think a small portion of the program is complete (such as a single func-tion)
319

before I have written any codebefore I have written a new important portion of the program (such as a class),but after I have tested other code that is finishedbefore I have written a new small portion of the program (such as a single func-tion), but after I have tested other code that is finished
Automated Testing UseDid you write automated tests for the program in the course exercise?
yes, all the timeyes, but only some of the timeyes, I tried it onceno, all my testing was done by hand (run program and look at output or usedebugger)
Automated Testing FrameworksI think it is a good idea to write automated tests.
strongly agreeagreesomewhat agreeneither agree or disagreesomewhat disagreedisagree
Attitude Toward DesignHow important is it to design computer programs before they are written?
not important, it works fine to just start programming and not think about thedesignnot important, it works fine to develop the design as the code is writtensomewhat important, it is a good idea to do a little bit of design before writingcodeimportant; it is good to design most of a program before writing codevery important; never start programming until a thorough design is complete
Design TechniquesWhat do you think is the best approach to design a program?
Don’t design, just write codeUse visual models like the UML or flowchartsSketch the design in code with class declarations before writing function defini-tionsWrite out the design in natural languageUse a combination of visual models and natural language
320

Let the design evolve as the code is written; document the design with visualmodels and/or natural languageLet the design evolve as the code is written; the code is the design documenta-tion
Coding EffortHow many minutes do you estimate you spent writing the code for the course exer-cise?
(in minutes)
Code CompletenessWhat percent of the course project requirements do you think you implemented?
% (0-100%)
Attitude Towards Test-First ProgrammingTest-first programming is the practice by which an automated test case is writtenbefore the code is implemented. The implemented code is written to pass the testcase. The design of the system emerges as the programmer repeatedly writes tests,then writes the code to make the test pass, then improves both the code and testsin short rapid iterations.What is your opinion of test-first programming?
I don’t think it would ever workI think it might be a good approach on small projectsI think it might be a good approach on projects where programmers have a lotof programming experienceI think it might be a good approach on projects where programmers understandthe domain wellI think it might be a good approach on any project
Attitude Towards Test-Last ProgrammingTest-last programming is the practice by which a test case is written after the codeis implemented. The design of the system is usually developed at least partiallybefore any code is written.What is your opinion of test-last programming?
I don’t think it would ever workI think it might be a good approach on small projectsI think it might be a good approach on projects where programmers have a lotof programming experienceI think it might be a good approach on projects where programmers understandthe domain wellI think it might be a good approach on any project
321
Perception of Test-First and Test-Last ProgrammingRegardless of the approach you used, which approach do you think produces codewith fewer defects, test-first or test-last?
test-firsttest-last
Perception of Test-First and Test-Last ProgrammingRegardless of the approach you used, which approach do you think produces codethat is simpler, more reusable, and more maintainable, test-first or test-last?
test-firsttest-last
Perception of Test-First and Test-Last ProgrammingRegardless of the approach you used, which approach do you think produces acorrect solution in less time, test-first or test-last?
test-firsttest-last
Perception of Test-First and Test-Last ProgrammingRegardless of the approach you used, do you think you are more likely to thoroughlytest a program with the test-first or the test-last approach?
test-firsttest-last
Perception of Test-First and Test-Last ProgrammingRegardless of the approach you used, for the course exercise you just completed,which do you think was the best approach, test-first or test-last?
test-firsttest-last
Why?
Choosing Between Test-First and Test-Last ProgrammingIf you had a choice of writing code with a test-first or test-last approach, whichwould you choose?
test-firsttest-last
Why?
Additional CommentsIs there anything else related to this study that you would like to comment on thatwe have missed or that you would like to add?
322

F.5 Industry Design Quality Review Scorecard
Quality Review Thank you for agreeing to review projects for this study! Your inputis very valuable. This scorecard is designed to evaluate the quality of one softwareproject. Please read the project description here. Note the CVS name for checkingthe source code out in order to complete the review. If you are unsure how to dothis, please contact David Janzen at [email protected] or 316-288-0469. Onceyou have checked out the project source code, spend no more than one to two hoursreading through the code. Do not contact the authors as one objective of this exer-cise is to measure the understandability of the code. Then complete the followingsurvey. Thank you again for your time.
Employee IDWhat is your employee ID? __________________
Software Development ExperienceHow many years have you been developing software professionally?
less than 11 to 23 to 56 to 1011 to 2020 or moreNo answer
Highest DegreeSelect the most appropriate description of your college experience.
Never attended collegeAttended some college, no computer-related coursesAttended some college, some computer-related coursesCompleted BA/BS, non-computing major/minorCompleted BA/BS, computing-related major/minorCompleted BA/BS and some graduate work, non-computing major/minorCompleted BA/BS and some graduate work, computing-related major/minorCompleted graduate degree (MS/PhD), non-computing major/minorCompleted graduate degree (MS/PhD), computing-related major/minorNo answer
Project ReviewedWhat project are you reviewing?
323
UnderstandabilityOverall, how would you rate the software you reviewed in terms of understandabil-ity?Understandability refers to the ability of a typical developer in your organization toread and understand the design and code of the system without significant assis-tance. Design/code simplicity and architectural clarity/consistency are contributingfactors to good understandability.
1 - Very difficult to understand23 - Average understandability45 - Very easy to understandNo answer
MaintainabilityOverall, how would you rate the software you reviewed in terms of maintainability?Maintainability refers to the ability of a typical developer in your organization tomaintain the design and code of the system without significant assistance. Lowcoupling, high cohesion, and simplicity are contributing factors to good maintain-ability.
1 - Very difficult to maintain23 - Average maintainability45 - Very easy to maintainNo answer
ReusabilityOverall, how would you rate the software you reviewed in terms of reusability andextensibility?Reusability refers to the ability of a typical developer in your organization to reuseand/or extend the design and code of the system without significant assistance. Lowcoupling, high cohesion, simplicity and the use of mechanisms such as interfacesand certain design patterns such as factory and template method are contributingfactors to good maintainability.
1 - Very difficult to reuse/extend23 - Average reuseability/extensibility45 - Very easy to reuse/extendNo answer
324

TestabilityOverall, how would you rate the software you reviewed in terms of testability?Testability refers to the ability of a typical developer in your organization to testthe system without significant assistance. Low coupling, high cohesion, simplicityand the use of certain design patterns are contributing factors to good testability.
1 - Very difficult to test23 - Average testability45 - Very easy to testNo answer
Overall Design QualityOverall, how would you rate the software you reviewed in terms of overall designquality?
1 - Very low design quality23 - Average design quality45 - Very high design qualityNo answer
Feel free to make any additional comments here.
F.6 Academic Longitudinal Survey
Survey on Programming Attitudes - EECS Follow-Up SurveyThis survey is designed to evaluate your programming experience and your percep-tions and use of testing and design practices during the current semester (not lastsemester when you were in 268).
KUIDWhat is your KU ID? __________________
Programming-Based CoursesHow many courses are you enrolled in this semester that require programmingprojects?
012
325

345 or moreNo answer
Programs WrittenHow many programs have you written this semester (for classes or otherwise)?
012345 or moreNo answer
Option to Write Automated TestsOf the programs in the previous question, on how many programs could you havechosen to write automated unit tests (such as with JUnit, assert(), ...)?
012345 or moreNo answer
Write Automated TestsOf the programs in the previous question, on how many programs did you chooseto write automated unit tests (such as with JUnit, assert(), ...)?
012345 or moreNo answer
Test-Last ApproachOf the programs in the previous question, on how many programs did you chooseto use a test-last approach?
0
326

12345 or moreNo answer
Test-First ApproachOf the programs in the previous question, on how many programs did you chooseto use a test-first approach?
012345 or moreNo answer
Automated Testing UseTo what degree did you write automated tests for your programs this semester?
all the timeonly some of the timeI tried it oncenone, all my testing was done by hand (run program and look at output or usedebugger)No answer
Confidence of Software QualityI am confident that the code I wrote this semester is correct.
strongly agreeagreesomewhat agreeneither agree or disagreesomewhat disagreedisagreeNo answer
Confidence of Software ChangesI am confident that I could make changes to the code I wrote this semester withoutbreaking things.
strongly agree
327

agreesomewhat agreeneither agree or disagreesomewhat disagreedisagreeNo answer
Confidence of Software ReuseI am confident that I could reuse the code I wrote this semester in another futureproject.
strongly agreeagreesomewhat agreeneither agree or disagreesomewhat disagreedisagreeNo answer
Attitude Towards TestingHow important is it to test computer programs that you have written?
not important, I never make mistakesnot important, my projects are only for a grade in the classsomewhat important, so I do a little bit of testingimportant; I try to test my programs if I still have time before the deadlinevery important; a project is not done until it is thoroughly testedNo answer
Test TimingWhen do you think is the best time to write tests for your programs?
neverafter I think the entire program is completeafter I think an important portion of the program is complete (such as a class)after I think a small portion of the program is complete (such as a single func-tion)before I have written any codebefore I have written a new important portion of the program (such as a class),but after I have tested other code that is finishedbefore I have written a new small portion of the program (such as a single func-tion), but after I have tested other code that is finishedNo answer
Automated Testing FrameworksI think it is a good idea to use automated testing frameworks like JUnit.
328

strongly agreeagreesomewhat agreeneither agree or disagreesomewhat disagreedisagreeNo answer
Attitude Toward DesignHow important is it to design computer programs before they are written?
not important, it works fine to just start programming and not think about thedesignnot important, it works fine to develop the design as the code is writtensomewhat important, it is a good idea to do a little bit of design before writingcodeimportant; it is good to design most of a program before writing codevery important; never start programming until a thorough design is completeNo answer
Design TechniquesWhat do you think is the best approach to design a program?
DonŠt design, just write codeUse visual models like the UML or flowchartsSketch the design in code with class declarations before writing function defini-tionsWrite out the design in natural languageUse a combination of visual models and natural languageLet the design evolve as the code is written; document the design with visualmodels and/or natural languageLet the design evolve as the code is written; the code is the design documenta-tionNo answer
Attitude Towards Test-First ProgrammingTest-first programming is the practice by which an automated test case is writtenbefore the code is implemented. The implemented code is written to pass the testcase. The design of the system emerges as the programmer repeatedly writes tests,then writes the code to make the test pass, then improves both the code and testsin short rapid iterations. What is your opinion of test-first programming?
I don’t think it would ever workI think it might be a good approach on small projects
329

I think it might be a good approach on projects where programmers have a lotof programming experienceI think it might be a good approach on projects where programmers understandthe domain wellI think it might be a good approach on any projectNo answer
Attitude Towards Test-Last ProgrammingTest-last programming is the practice by which a test case is written after the codeis implemented. The design of the system is usually developed at least partiallybefore any code is written. What is your opinion of test-last programming?
I don’t think it would ever workI think it might be a good approach on small projectsI think it might be a good approach on projects where programmers have a lotof programming experienceI think it might be a good approach on projects where programmers understandthe domain wellI think it might be a good approach on any projectNo answer
Perception of Test-First and Test-Last ProgrammingRegardless of the approach you used, which approach do you think produces codewith fewer defects, test-first or test-last?
test-firsttest-lastNo answer
Perception of Test-First and Test-Last ProgrammingRegardless of the approach you used, which approach do you think produces codethat is simpler, more reusable, and more maintainable, test-first or test-last?
test-firsttest-lastNo answer
Perception of Test-First and Test-Last ProgrammingRegardless of the approach you used, which approach do you think produces acorrect solution in less time, test-first or test-last?
test-firsttest-lastNo answer
330
Perception of Test-First and Test-Last ProgrammingRegardless of the approach you used, do you think you are more likely to thoroughlytest a program with the test-first or the test-last approach?
test-firsttest-lastNo answer
Perception of Test-First and Test-Last ProgrammingRegardless of the approach you used, for the course project you just completed,which do you think was the best approach, test-first or test-last?
test-firsttest-lastNo answer
Why?
Choosing Between Test-First and Test-Last ProgrammingIf you had a choice of writing code with a test-first or test-last approach, whichwould you choose?
test-firsttest-lastNo answer
Why?
Additional CommentsIs there anything else related to this study that you would like to comment on thatwe have missed or that you would like to add?
F.7 Industry Longitudinal Survey
Survey on Programming Attitudes - Industry Follow-Up SurveyThis survey is designed to evaluate your programming experience and your percep-tions and use of testing and design practices.
Employee IDWhat is your employee ID? __________________
Software Development ExperienceHow many years have you been developing software professionally?
331
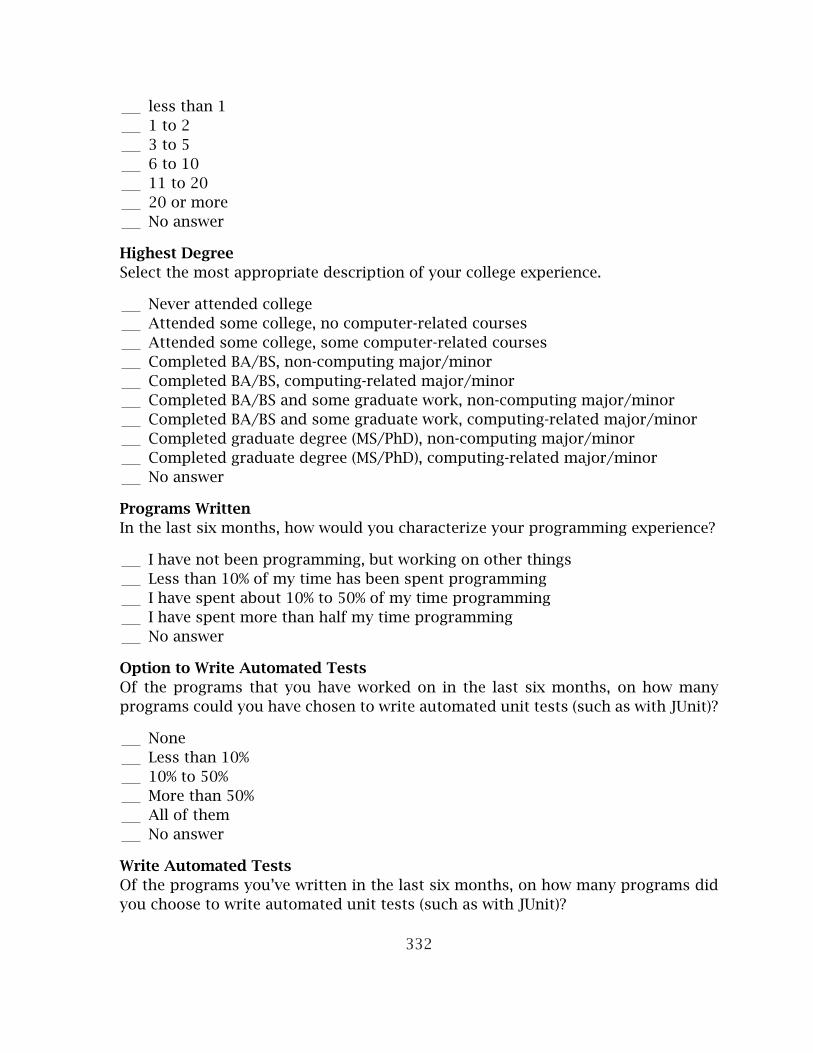
less than 11 to 23 to 56 to 1011 to 2020 or moreNo answer
Highest DegreeSelect the most appropriate description of your college experience.
Never attended collegeAttended some college, no computer-related coursesAttended some college, some computer-related coursesCompleted BA/BS, non-computing major/minorCompleted BA/BS, computing-related major/minorCompleted BA/BS and some graduate work, non-computing major/minorCompleted BA/BS and some graduate work, computing-related major/minorCompleted graduate degree (MS/PhD), non-computing major/minorCompleted graduate degree (MS/PhD), computing-related major/minorNo answer
Programs WrittenIn the last six months, how would you characterize your programming experience?
I have not been programming, but working on other thingsLess than 10% of my time has been spent programmingI have spent about 10% to 50% of my time programmingI have spent more than half my time programmingNo answer
Option to Write Automated TestsOf the programs that you have worked on in the last six months, on how manyprograms could you have chosen to write automated unit tests (such as with JUnit)?
NoneLess than 10%10% to 50%More than 50%All of themNo answer
Write Automated TestsOf the programs you’ve written in the last six months, on how many programs didyou choose to write automated unit tests (such as with JUnit)?
332

NoneLess than 10%10% to 50%More than 50%All of themNo answer
Test-Last ApproachOf the programs in the previous question, on how many programs did you chooseto use a test-last approach?
NoneLess than 10%10% to 50%More than 50%All of themNo answer
Test-First ApproachOf the programs in the previous question, on how many programs did you chooseto use a test-first approach?
NoneLess than 10%10% to 50%More than 50%All of themNo answer
Automated Testing UseTo what degree did you write automated tests for your programs in the last sixmonths?
all the timeonly some of the timeI tried it oncenone, all my testing was done by hand (run program and look at output or usedebugger)No answer
Confidence of Software QualityI am confident that the code I wrote in the last six months is correct.
strongly agreeagree
333
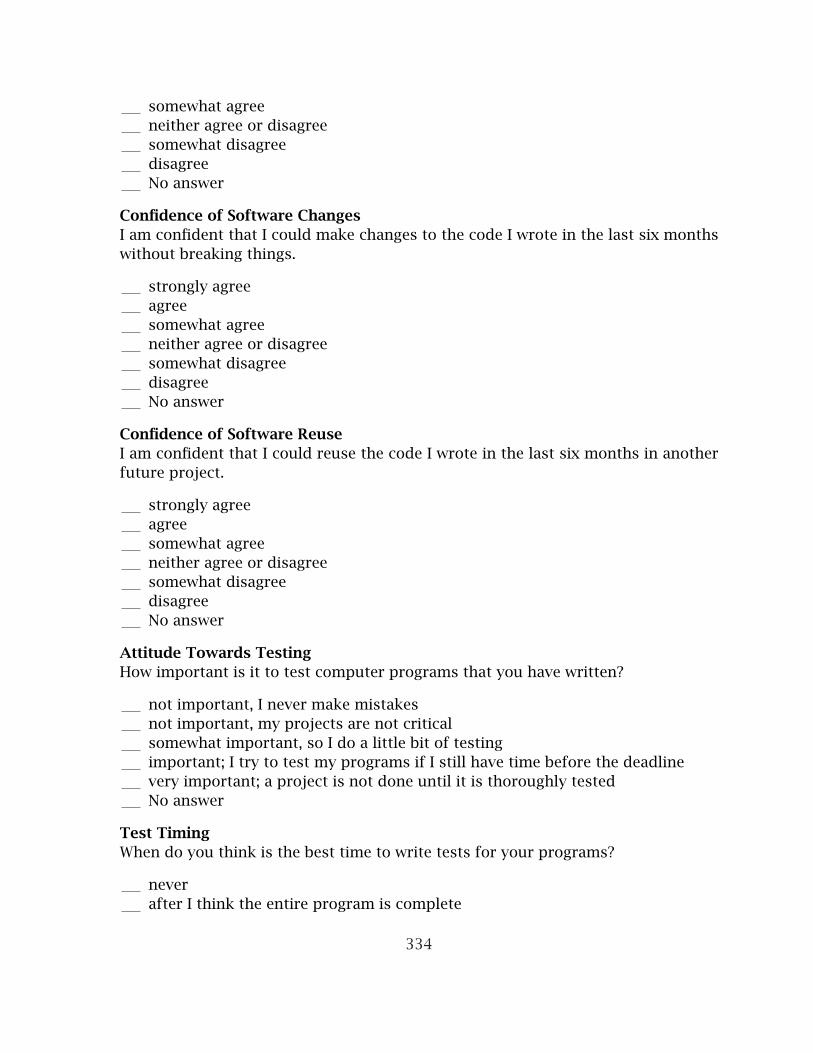
somewhat agreeneither agree or disagreesomewhat disagreedisagreeNo answer
Confidence of Software ChangesI am confident that I could make changes to the code I wrote in the last six monthswithout breaking things.
strongly agreeagreesomewhat agreeneither agree or disagreesomewhat disagreedisagreeNo answer
Confidence of Software ReuseI am confident that I could reuse the code I wrote in the last six months in anotherfuture project.
strongly agreeagreesomewhat agreeneither agree or disagreesomewhat disagreedisagreeNo answer
Attitude Towards TestingHow important is it to test computer programs that you have written?
not important, I never make mistakesnot important, my projects are not criticalsomewhat important, so I do a little bit of testingimportant; I try to test my programs if I still have time before the deadlinevery important; a project is not done until it is thoroughly testedNo answer
Test TimingWhen do you think is the best time to write tests for your programs?
neverafter I think the entire program is complete
334
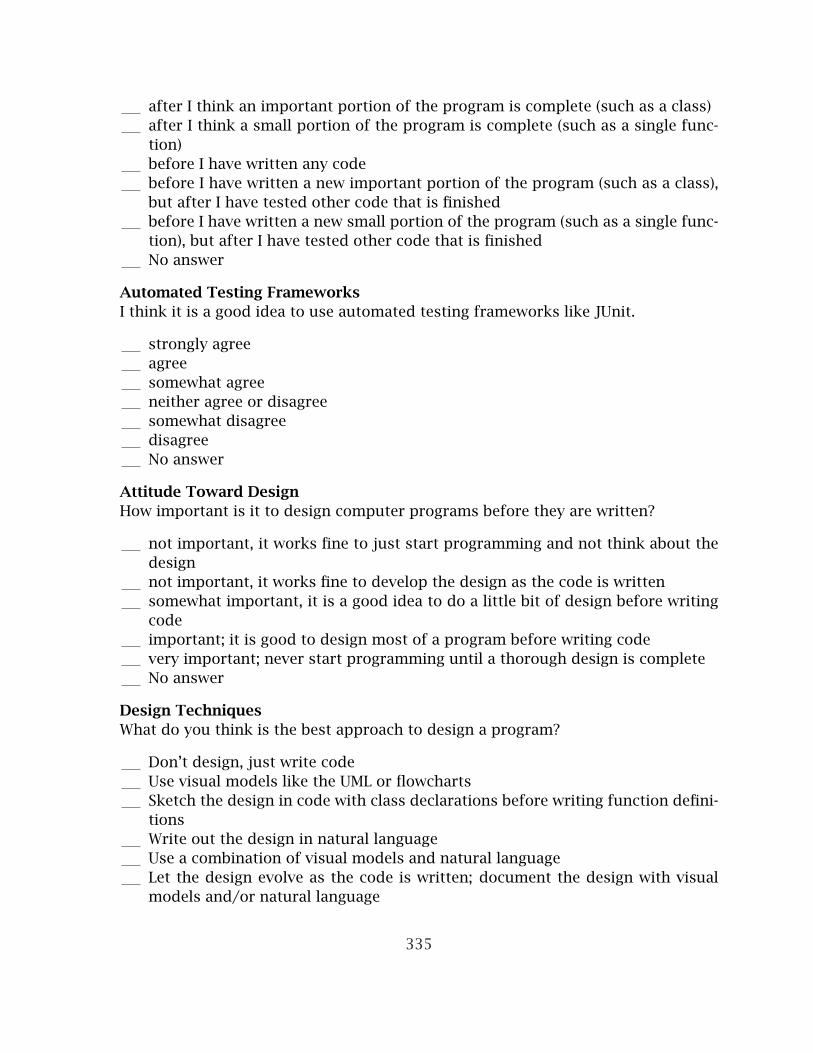
after I think an important portion of the program is complete (such as a class)after I think a small portion of the program is complete (such as a single func-tion)before I have written any codebefore I have written a new important portion of the program (such as a class),but after I have tested other code that is finishedbefore I have written a new small portion of the program (such as a single func-tion), but after I have tested other code that is finishedNo answer
Automated Testing FrameworksI think it is a good idea to use automated testing frameworks like JUnit.
strongly agreeagreesomewhat agreeneither agree or disagreesomewhat disagreedisagreeNo answer
Attitude Toward DesignHow important is it to design computer programs before they are written?
not important, it works fine to just start programming and not think about thedesignnot important, it works fine to develop the design as the code is writtensomewhat important, it is a good idea to do a little bit of design before writingcodeimportant; it is good to design most of a program before writing codevery important; never start programming until a thorough design is completeNo answer
Design TechniquesWhat do you think is the best approach to design a program?
Don’t design, just write codeUse visual models like the UML or flowchartsSketch the design in code with class declarations before writing function defini-tionsWrite out the design in natural languageUse a combination of visual models and natural languageLet the design evolve as the code is written; document the design with visualmodels and/or natural language
335
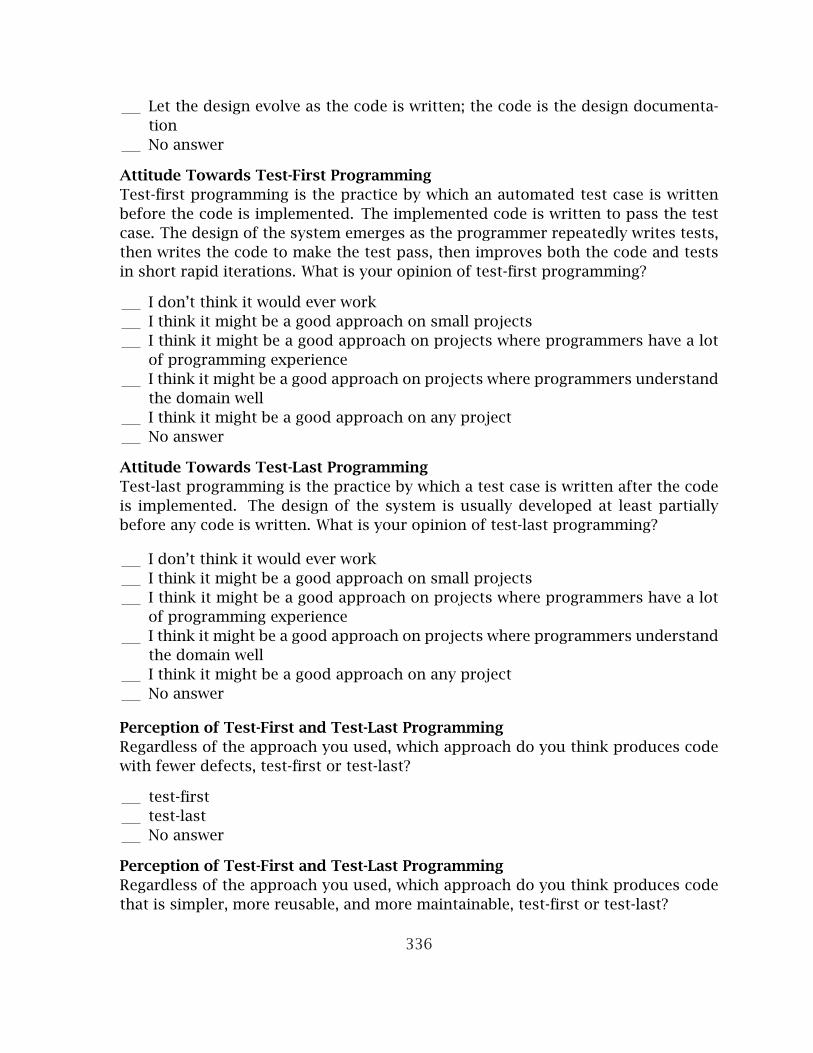
Let the design evolve as the code is written; the code is the design documenta-tionNo answer
Attitude Towards Test-First ProgrammingTest-first programming is the practice by which an automated test case is writtenbefore the code is implemented. The implemented code is written to pass the testcase. The design of the system emerges as the programmer repeatedly writes tests,then writes the code to make the test pass, then improves both the code and testsin short rapid iterations. What is your opinion of test-first programming?
I don’t think it would ever workI think it might be a good approach on small projectsI think it might be a good approach on projects where programmers have a lotof programming experienceI think it might be a good approach on projects where programmers understandthe domain wellI think it might be a good approach on any projectNo answer
Attitude Towards Test-Last ProgrammingTest-last programming is the practice by which a test case is written after the codeis implemented. The design of the system is usually developed at least partiallybefore any code is written. What is your opinion of test-last programming?
I don’t think it would ever workI think it might be a good approach on small projectsI think it might be a good approach on projects where programmers have a lotof programming experienceI think it might be a good approach on projects where programmers understandthe domain wellI think it might be a good approach on any projectNo answer
Perception of Test-First and Test-Last ProgrammingRegardless of the approach you used, which approach do you think produces codewith fewer defects, test-first or test-last?
test-firsttest-lastNo answer
Perception of Test-First and Test-Last ProgrammingRegardless of the approach you used, which approach do you think produces codethat is simpler, more reusable, and more maintainable, test-first or test-last?
336
test-firsttest-lastNo answer
Perception of Test-First and Test-Last ProgrammingRegardless of the approach you used, which approach do you think produces acorrect solution in less time, test-first or test-last?
test-firsttest-lastNo answer
Perception of Test-First and Test-Last ProgrammingRegardless of the approach you used, do you think you are more likely to thoroughlytest a program with the test-first or the test-last approach?
test-firsttest-lastNo answer
Perception of Test-First and Test-Last ProgrammingRegardless of the approach you used, for the most recent project you just com-pleted, which do you think would have been the best approach, test-first or test-last?
test-firsttest-lastNo answer
Why?
Choosing Between Test-First and Test-Last ProgrammingIf you had a choice of writing code with a test-first or test-last approach, whichwould you choose?
test-firsttest-lastNo answer
Why?
Additional CommentsIs there anything else related to this study that you would like to comment on thatwe have missed or that you would like to add?
337