an empirical study of a cs 1 studio experience designing, visual
TRANSCRIPT

An Empirical Study of a CS 1 Studio Experience 1
Running head: An Empirical Study of a CS 1 Studio Experience
Designing, Visualizing, and Discussing Algorithms within a CS 1 Studio Experience: An
Empirical Study
Christopher D. Hundhausen & Jonathan L. Brown
Visualization and End-User Programming Laboratory
School of Electrical Engineering and Computer Science
Washington State University
P.O. Box 642752
Pullman, WA 99164-2752
{hundhaus, jbrown}@eecs.wsu.edu

An Empirical Study of a CS 1 Studio Experience 2
Abstract
Within the context of an introductory CS1 unit on algorithmic problem-solving, we are exploring
the pedagogical value of a novel active learning activity—the “studio experience”—that actively
engages learners with algorithm visualization technology. In a studio experience, student pairs
are tasked with (a) developing a solution to an algorithm design problem, (b) constructing an
accompanying visualization with a storyline, and finally (c) presenting that visualization for
feedback and discussion in a session modeled after an architectural “design crit.” Is a studio
experience educationally valuable? What kind of technology can best support it? To explore
these questions, we conducted an empirical study of two alterative CS1 studio experiences in
which students used one of two different kinds of algorithm development and visualization
technology: (a) a text editor coupled with art supplies, or (b) ALVIS Live!, a computer-based
algorithm development and visualization tool. We found that the students who used ALVIS
Live! developed algorithms with significantly fewer semantic errors. Moreover, discussions
mediated by ALVIS Live! had significantly more student audience contributions, and retained a
sharper focus on the specific details of algorithm behavior, leading to the collaborative
identification and repair of semantic errors. In addition, discussions mediated by both ALVIS
Live! and art supplies contained substantial evidence of higher order thinking. Based on our
results, we make recommendations for educators interested in exploring studio-based
approaches, and we propose an agenda for future research into studio-based learning in computer
science education.
Keywords: computer-mediated communication; cooperative/collaborative learning; evaluation of
CAL systems; teaching/learning strategies; post-secondary education.

An Empirical Study of a CS 1 Studio Experience 3
1. Introduction
Pedagogical algorithm visualization (AV) technology (see Stasko & Hundhausen, 2004
for a review) produces graphical representations of the dynamic behavior of computer
algorithms. The goal of the technology is to assist learners in understanding how computer
algorithms work. While early research into pedagogical AV focused on developing AV systems,
more recent research has focused on empirically evaluating the pedagogical effectiveness of the
technology. Focusing on a significant subset of this work, a recent meta-study of 24
experimental studies of AV effectiveness (Hundhausen, Douglas, & Stasko, 2002) identified an
important trend: the more actively learners were involved in activities involving AV technology,
the better they performed.
Given this trend, a key focus of recent AV research has been to explore approaches and
technology that get learners more actively engaged with AV technology. Naps et al. (2003)
present a framework of five progressively active levels of learner engagement that have been
considered by AV research:
Level 1: Viewing a visualization (see, e.g., Stasko, Badre, & Lewis, 1993).
Level 2: Responding to questions concerning a visualization (see, e.g., Byrne,
Catrambone, & Stasko, 1999)
Level 3: Changing a visualization (see, e.g., Lawrence, Badre, & Stasko, 1994).
Level 4: Constructing a visualization (see, e.g., Stasko, 1997).
Level 5: Presenting a visualization for feedback and discussion (see, e.g.,
Hundhausen, 2002).
Inspired by the "studio-based" instructional method used to teach architectural design
(see, e.g., Boyer & Mitgang, 1996), we have been exploring approaches and technology to

An Empirical Study of a CS 1 Studio Experience 4
facilitate levels 4 and 5 in the above framework: visualization construction and presentation. Our
general approach has been to give groups of students a particular algorithm design problem to
solve. They are asked to construct an algorithm visualization that illustrates their solution, and
then to present that visualization to their peers and instructor for feedback and discussion in a
presentation session modeled after an architectural “design crit” (Doidge, Sara, Parnell, &
Parsons, 2000).
In architectural design education, “design crits” are seen as providing an ideal forum for
stimulating educationally beneficial discussions. In addition to eliciting constructive comments
about each student’s specific design and design rationale, “design crits” typically generate
higher-level discussion about the general principles and methods being explored in the course.
Likewise, we hypothesize that, in AV presentation sessions, student-constructed visualizations
can serve as powerful mediational resources (Roschelle, 1994) that bridge the gap between
expert and learner perspectives, ultimately enabling pedagogically beneficial conversations about
algorithm design to take place.
In previous studies, we explored this “studio-based” approach within the context of a
junior-level algorithms course (Hundhausen, 2002). In this course, student groups were given
"visualization assignments" in which they had several weeks to develop their own visualizations
of algorithms under study. They then presented their visualizations for feedback and discussion
during presentation sessions scheduled after the assignment due date.
A key observation in these studies was that students benefited from constructing and
presenting their own visualizations not only because this exercise increased their motivation and
level of interest in algorithms, but also because it stimulated meaningful discussions about
algorithms. At the same time, we observed that the type of AV technology used by students had a
An Empirical Study of a CS 1 Studio Experience 5
significant impact both on the focus of students’ activities during the construction phase of the
assignment, and on the focus of the conversations during the presentation sessions. In particular,
when students used Samba (Stasko, 1997), a “high tech” (computer-based) AV tool, to construct
their visualizations, they tended to spend inordinate amounts of time steeped in low-level
implementation details; consequently, they tended to share “programming war stories” when
they ultimately discussed their visualizations with the class. In contrast, when students used “low
tech” materials (pens, paper, scissors) to construct their visualizations, they tended to focus their
attention squarely on the algorithm itself both in the construction phase, and in the conversations
that took place in the presentation phase.
Given the potential educational value of “low tech” visualization construction and
presentation activities documented in our prior studies, we set out in prior research (see
Hundhausen & Douglas, 2002) to develop a computer-based AV tool to support visualization
construction and presentation in an advanced algorithms course. The main goal of that tool was
two-fold: (1) to focus learners on algorithms, rather than on low-level graphics programming,
during the process of constructing algorithm visualizations; and (2) to mediate educationally-
beneficial discussions about those algorithms. However, because of the sheer complexity of
developing a tool with a broad enough scope to support the design and visualization of the kinds
of complex algorithms taught in an advanced algorithms course, we quickly decided to change
the focus of our tool from advanced algorithms to single-procedure, introductory algorithms.
This switch in focus led us to a new high-level research question: Given our previous
findings in an advanced undergraduate algorithms course, might learners benefit from engaging
in visualization construction and presentation activities earlier in their computer science careers,
when they are first learning to program? To explore this possibility, this article presents an

An Empirical Study of a CS 1 Studio Experience 6
empirical study of AV construction and presentation activities within an "algorithms first" (Joint
Task Force on Computing Curricula, 2001) CS1 course. Focusing on a “studio experience” that
augmented an introductory unit on algorithmic problem solving within two separate offerings of
the CS1 course at Washington State University, this study set out to address three key research
questions:
RQ1. Will the process of constructing personalized visual representations that depict
solutions to algorithm design problems help CS1 students to better understand
their solutions?
RQ2. Will the process of presenting personalized visual representations engage students
and the instructor in pedagogically beneficial conversations about the correctness
and procedural behavior of algorithms?
RQ3. What form of AV technology can best support the above two processes: simple
art supplies, which were so successful in our past studies of visualization
construction and presentation (“low tech”), or ALVIS Live! (Hundhausen &
Brown, 2005b), a specialized computer-based algorithm development and
visualization environment we have developed for this purpose (“high tech”)?
In the remainder of this article, we present the empirical study, its key results, and their
implications for CS1 pedagogy. After reviewing related work in Section 2, we present
background information on the study in Section 3. In Section 4, we describe the field techniques
employed by our study. Section 5 presents our key observations, while Section 6 uses our
observations as a basis both for addressing our research questions, and for identifying directions
for future empirical research. Finally, we conclude in Section 7 by considering the implications
of our findings for CS educators interested in exploring studio-based learning activities.

An Empirical Study of a CS 1 Studio Experience 7
2. Related Work
A legacy of previous computer science education research shares our interest in
empirically investigating the novel use of AV in computer science courses. In work that greatly
inspired our initial ethnographic studies of a junior-level algorithms course (Hundhausen, 2002),
Stasko (1997) gave visualization construction (but not presentation) assignments to students in
his junior-level algorithms course. Through questionnaires administered at the end of the course,
he learned that students generally enjoyed the assignments and felt that the assignments helped
them to better understand the algorithms they visualized. Likewise, in a second-semester
programming course, Gurka (1996) relied on student diary keeping to explore students’ use of an
AV package, as compared to their use of other course resources and activities. She found that
student use of AV constituted 35% of their course activity, and that they most often used
algorithm visualization to help them complete course programming assignments.
More recently, Hübscher-Younger and Narayanan (2003a; 2003b) conducted a series of
empirical studies that explored a novel pedagogical approach in which second- and third-
semester CS students created and posted their own algorithm visualizations to the web; peers
could then view, discuss, and rate each other’s visualizations on-line. In addition to analyzing
students’ ratings of each other’s visualizations, the researchers performed a metaphoric analysis
of students’ visualizations. Their results indicated that students who constructed their own
visualizations learned significantly more than students who only rated and discussed other
students’ visualizations. Moreover, students’ ratings of each other’s visualizations varied most
widely with respect to the characteristics of pleasure and salience. A follow-up study showed
students learned most from student-constructed visualizations that were rated highest with
respect to those characteristics.
An Empirical Study of a CS 1 Studio Experience 8
The work presented here differs from the above studies of AV in three key respects: (a)
its focus on a CS1 course as opposed to an upper-division CS course; (b) its focus on AV
presentation, in addition to AV construction; and (c) its commitment to using a broad range of
ethnographic field techniques to obtain a rich perspective on learning activities involving AV.
A large body of computer science education research shares our goal of increasing the
number of students—especially underrepresented students—who successfully complete the CS1
course. Using specialized visually-oriented programming environments and AV technology to
enhance CS1 courses is one means to that end, and has been explored by several CS educators,
including Naps (1990), Dann et al. (2000), Ben-Bassat Levy et al. (2003), and Carlisle et al.
(2005). While some of this work shares our commitment to rigorously evaluating the educational
benefits of learning exercises involving AV technology, none of it focuses on the use of AV
technology as part of a novel, “studio-based” teaching approach.
3. Study Background
The study reported here focused on two consecutive offerings of CptS 121 (“Program
Design and Development”), the introductory computer science course at Washington State
University. Offered within the School of Electrical Engineering and Computer Science, the
course is a requirement for all engineering majors in the School. Because it caters to a broad
engineering audience, the instructional language of this semester-long course is C.
Like many other CS1 courses throughout the country, the CptS 121 course has suffered
from a notoriously high attrition rate averaging 43 percent over the past six semesters (n = 1001
students). To address this problem, we have been exploring an introductory five-week
“algorithms-first” unit that aims to provide a gentler introduction to programming—one free of
the baggage of a traditional programming language like C. Supported by the Schneider and
An Empirical Study of a CS 1 Studio Experience 9
Gersting text (2000), our “algorithms first” unit uses plain English and pseudocode to explore
algorithmic problem solving.
In the “algorithms-first” unit, three weekly lectures motivate, formulate, and solve
progressively more complex algorithm design problems. Augmenting these lectures is a series of
studio experiences in which students create and present their own visual solutions to algorithm
design problems related to the ones presented in lectures. These Studio Experiences were the
focus of the study presented here.
In the remainder of this section, we provide more background on the participants in the
study, and the “studio experiences” in which they engaged. We begin by describing the students,
instructors, and teaching assistants who participated in the study. Next, we outline the structure
and content of the studio experiences we investigated. Finally, we describe the “low tech” and
“high tech” versions of the programming and AV technology used by students in the two
alternative offerings of the course we studied.
3.1 Participants
The Fall, 2004 offering of CptS 121 started out with 206 students, of whom 107
ultimately completed the course with a passing grade (a 48% attrition rate). In this offering of
the course, we observed a total of 41 students, who were split across two studio different studio
experience sessions. In the remainder of this paper, we will refer to these sessions as the Art
Supply sessions, because students in these sessions used art supplies to construct their
visualizations. Note that
In contrast, the Spring, 2005 offering of CptS 121 initially enrolled 124 students, of
whom 67 ultimately completed the course with a passing grade (a 45% attrition rate). In this
offering of the course, we observed 38 students, who, once again, were split across two different

An Empirical Study of a CS 1 Studio Experience 10
studio experience sessions. Henceforth, we will refer to these sessions as the ALVIS sessions,
because students in these sessions used the ALVIS Live! programming and visualization
environment (Hundhausen & Brown, 2005b) to construct their visualizations.
The students who participated in the Art Supply sessions we observed were
predominantly male (91.1 percent), with an average age of 21.7 (sd = 2.5.). Similarly, the
students who participated in the ALVIS sessions we observed were predominantly male (92.0
percent), with a mean age of 21.9 years (sd = 2.3). The students in both the Art Supply and
ALVIS sessions varied greatly with respect to their previous programming experience. Roughly
40 to 50 percent of the students came in to the course with no prior programming experience.
The remaining 50 to 60 percent of the students had at least some programming experience, either
in a high school course, or on their own.
In addition, two graduate teaching assistants (not including the authors) helped to run the
studio experiences that we observed. The teaching assistants took attendance, gave introductory
instructions, made themselves available for help while students developed their algorithmic
solutions, and helped to facilitate the presentation sessions at the end of each studio experience.
3.2 The Studio Experiences
Two studio experience sessions were included in each of the CptS 121 courses we
considered. The studio experience sessions took place during the regularly-scheduled two hour
and fifty minute lab periods in the second and fourth weeks of each course. It is important to note
that, in this paper, we consider only those observations made in the second studio experience
session of each semester, and that the studio experience sessions were identical across semesters,
except for the fact that students in each semester used different technology to create their

An Empirical Study of a CS 1 Studio Experience 11
algorithmic solutions and accompanying visualizations (art supplies vs. ALVIS; see next
subsection).
In the studio experience sessions we observed, students were encouraged, but not
required, to work in self-selected pairs. Each pair was given one of twelve different algorithm
design problems, which required students to rearrange, merge, or otherwise manipulate the
integer elements of arrays. Table 1 presents three examples of the algorithm design problems that
were assigned.
Students in all studio experience sessions wrote their solutions in SALSA, the
pseudocode-like language that is supported by the ALVIS environment (see Table 2 for a
summary of the language). Students had been taught SALSA in the previous three weeks of
lectures, and were provided with a one-page SALSA quick reference guide for use in the studio
experience. Most solutions required fewer than 30 lines of SALSA, and involved nested iteration
over arrays.
In addition, pairs were required to create visualizations of their solutions, and they were
encouraged to personalize those visualizations by developing a storyline to portray the step-by-
step behavior of their algorithmic solutions. During the last 45 minutes of each studio
experience, student pairs were required to present their visual solutions to their peers and
instructor for feedback and discussion. In particular, student presenters were asked to give a brief
description of the problem they solved. Following that, each pair was asked to walk through each
of their visualizations, providing a “play by play” of the key algorithmic steps. Finally, the pair
was asked to provide a big-O analysis of their alternative algorithms, along with a justification
for their analysis.

An Empirical Study of a CS 1 Studio Experience 12
3.3 Supporting Technology: Art Supplies and ALVIS Live!
As mentioned above, the problems and format of the studio experiences we observed
were identical across the two semesters of our study in all respects except one: the technology
used by students to create their algorithmic solutions and accompanying visualizations.
In the Art Supply sessions that took place in the first semester of the study, students were
asked to use a text editor (Notepad or Word) to develop pseudocode solutions to their algorithm
design problems. To make their solutions more concrete, they were then asked to use
transparencies, pens, and scissors to create homemade animations illustrating the operation of
their algorithms on sample input data sets (see Figure 1 for a sample visualization). Finally,
students used an overhead projector to present their homemade animations to the class.
In contrast, in the ALVIS sessions of the following semester, students used a new version
of the original ALVIS software (Hundhausen & Douglas, 2002) called ALVIS Live!
(Hundhausen & Brown, 2005b) to code their algorithms and customize visualizations of those
algorithms. Pictured in Figure 2, the ALVIS Live! environment enables novice programmers to
develop single-procedure algorithms in a pseudocode-like language called SALSA. On every
edit, the line of algorithm code being edited in the “Script Window” is reevaluated, leading to the
dynamic update of an accompanying visualization in the “Animation Window.” Alternatively,
the user can use the Toolbox Tools on the right to directly lay out and animate program objects
(variables and arrays) in the Animation Window. Through such direct manipulation, SALSA
code is dynamically inserted into the Script Window on the right.
ALVIS Live! generates standard visual representations of variables, arrays, and array
indexes (see Figure 3). In addition, ALVIS Live! supports three customization features designed
to support storytelling. First, users can customize a variable’s representation simply by clicking

An Empirical Study of a CS 1 Studio Experience 13
on the variable and choosing a pre-defined picture from a gallery, or sketching out a new picture
with a sketchpad editor. Second, users can create a custom background to serve as a backdrop for
a story simply by choosing a pen tool and directly sketching on the background. Third, users can
introduce “dialog” into their animations through the use of a “say” command, which allows a
variable to “speak” through a cartoon-like speech bubble. Students in the ALVIS sessions were
encouraged to use these features to build story-based visualizations, which they then presented
on a big screen using an LCD projector (see Figure 4 for a sample ALVIS custom visualization).
4. Field Techniques
Our study employed five different ethnographic field techniques. First, we employed
participant observation as a primary field technique in all sessions, in which we assumed the role
of volunteer teaching assistants. In this capacity, we both observed student pairs, and assisted
them on request. In addition, the first author helped the teaching assistant in charge of each
studio session to facilitate the presentation sessions; the second author passively observed the
presentation sessions.
With respect to the first author’s role as a participant observer in the study, it is important
to point out that students in one of the Art Supply sessions came from a lecture section taught by
the first author. We openly acknowledge the conflict of interest posed by the first author’s
presence as an observer in these two sessions; indeed, it could have been the case that his status
as the course instructor influenced student participation. At the same time, we would like to
underscore that we observed one additional Art Supply session that included students who came
from a lecture section taught by an instructor unaffiliated with this research. Moreover, all of the
ALVIS sessions consisted of students who came from an independent instructor’s lecture
section. Thus, we believe that, on balance, we were able to obtain a set of observations that were

An Empirical Study of a CS 1 Studio Experience 14
relatively free of the potential bias brought about by having an instructor observe his own
students.1
Second, we used videotaping as a primary field technique in all sessions. We videotaped
the algorithm and visualization development activities of selected pairs of participants in the Art
Supply sessions. In the ALVIS sessions, we instead used specialized screen recording software
to produce audio and video recordings of all students’ coding activities. In both the Art Supply
and ALVIS sessions, we videotaped all of the visualization presentation sessions. These videos,
many of which were thoroughly transcribed, formed the foundation for the post-hoc video
analyses we present in section 5.2.
Third, we used artifact collection as a secondary field technique in all sessions. We
collected all of the code and homemade visualizations developed by students in the studio
experience sessions. We subsequently evaluated students’ code to determine its semantic
correctness, and we subsequently analyzed students’ visualizations with respect to their use of
stories and visual elements.
Fourth, we used interviewing as a secondary field technique in the Art Supply sessions. In
order to pursue themes that emerged from our observations of these sessions, we audiotaped, and
subsequently transcribed, brief interviews with selected students and teaching assistants.
Finally, we used questionnaires as a secondary field technique in all sessions. We
administered a written exit questionnaire containing open-ended questions that asked students to
reflect on how they approached the activities they undertook in studio experiences, and what
they thought of them.
1 In fact, we can back this claim with statistical evidence. We statistically compared the two Art Supply sessions with respect to all of the measures reported in Section 5. With the exception of the percentages of instructor and student presenter contributions, we failed to find any statistically significant differences between the two sessions.

An Empirical Study of a CS 1 Studio Experience 15
5. Observations
In the studio experience sessions that we observed, there was a clear division between (a)
the task of coding the algorithm in pseudocode and developing an accompanying visualization;
and (b) presenting their algorithm and visualization to the class for feedback and discussion. In
the two subsections that follow, we organize our observations around these two primary
activities. Within each subsection, we have three aims: (a) to provide a high-level feel, grounded
in our empirical record, for how students went about the activity; (b) to provide a high-level
analysis of the outcomes (code, visualizations, discussions) of the activity; and (c) to highlight
the ways in which students’ activities and products differed between the Art Supply and ALVIS
sessions.
5.1 Algorithm and Visualization Development
In the first phase of the studio experiences we observed, student pairs used either a text
editor (Art Supply sessions) or ALVIS Live! (ALVIS sessions) to construct SALSA pseudocode
solutions to the algorithm design problems assigned to them. They were also asked to produce
accompanying visualizations to help explain how their algorithmic solutions worked. Although,
in the ALVIS sessions, the ALVIS tool itself produced a generic visual representation at the level
of variables, arrays, and array indices; (see Figure 3 for an example), we observed that both Art
Supply and ALVIS pairs consistently deferred the task of developing a visual story until after the
algorithm was initially developed. In the remainder of this section, we first focus on what student
pairs did as they coded their algorithms and developed their accompanying visualizations. We
then consider the semantic correctness of their algorithms. Finally, we look at the form and
content of the accompanying visualizations.

An Empirical Study of a CS 1 Studio Experience 16
5.1.1 Development Activities
To better understand how students spent their time on algorithm development, we
analyzed the video we took of the Art Supply and ALVIS pairs’ algorithm and visualization
development activities. Because we recorded such a large amount of video (202 minutes from
the Art Supply sessions and 798 minutes from the ALVIS sessions), we decided to randomly
sample the video for the purposes of the analysis. In particular, we analyzed 123 randomly
selected one-minute video snapshots: 60 from the Art Supply sessions, and 63 from the ALVIS
sessions. In order to ensure that our sample was representative of students’ activities, our random
selection of snapshots made sure to sample equally from each student pair for whom we had
video footage (nine Art Supply pairs and nine ALVIS pairs).
Our analysis process began by developing the eleven category activity classification
system presented in Table 3. It is important to note that student pairs occasionally performed two
or more of the activities in our classification system simultaneously. To account for this
possibility, we associated with each category a priority (see Table 3) that allowed us always to
code the activity that occurred at a given point in time into exactly one category.
To ensure that our category definitions were reliable, the two authors independently
coded 20 percent of the sample using the definitions. We achieved an agreement level of 90
percent and a corresponding kappa statistic value of 0.88 (the kappa statistic compensates for
chance agreement—see Shrout & Fleiss, 1979). Given this high level of agreement, we
concluded that our classification system was sufficiently reliable, and the second author
proceeded to code the remaining 80 percent of the sample.
Figure 5 presents the results of that analysis: a comparison of how students in the Art
Supply and ALVIS sessions spent their time on algorithm and visualization development.

An Empirical Study of a CS 1 Studio Experience 17
According to a chi-square test, the two conditions differed significantly with respect to how
much time they spent in each activity category, χ2(1, N = 7380) = 1054.02, p < 0.0001. Three
noteworthy observations can be made from the breakdowns presented in Figure 5. First, pairs in
both sessions spent the majority of their time (57 to 59 percent) coding their solutions, and
talking with each other about their solutions. This is not surprising, given that student pairs were
tasked with collaboratively generating algorithms.
Second, it appears that student pairs in the Art Supply sessions relied more heavily on
discussions with teaching assistants than did student pairs in the ALVIS sessions (20 percent vs.
7 percent). We observed that the Art Supply pairs in particular struggled to complete their
solutions. In addition to being unsure about correct SALSA pseudocode language syntax, Art
Supply students commonly complained about the lack of execution feedback provided by the
text editor they were using. This lack of feedback led to a low level of confidence that their code
was correct. As one student put it in an interview,
[I was] not very confident [that my algorithm was correct as written], because when you write it, it's hard to conceptualize in your mind what it does. But if you actually run it, it would be easier; you can see if it's right or wrong instantly.”
As was the case for many students, this Art Supply student concluded that most challenging part
of the coding exercise was “to see if [the code] was right.” It was not surprising, then, that a key
task of the teaching assistants who oversaw the Art Supply sessions was to step through students’
code for them and tell them whether it was correct.
A third observation to be made from the data in Figure 5 is that both the Art Supply and
ALVIS students spent similar proportions of time (15 to 20 percent) engaged in activities that did
not lead to visible coding progress. Through a follow-up analysis of students’ unproductive time
chunks, we found that 80% of the Art Supply students in our sample experienced one or more

An Empirical Study of a CS 1 Studio Experience 18
“stuck” periods of at least 2.5 minutes during which they made no visible progress in coding
their solutions. In their effort to generate correct solutions, several of these Art Supply students
simply gave up until they could summon a teaching assistant for help. In contrast, no student
pairs in the ALVIS sessions had even one “stuck” period of at least 2.5 minutes. In fact, the
longest “stuck” period we could find in our ALVIS session video samples was only 30 seconds.
Indeed, we observed that, even when ALVIS pairs became “stuck,” they were still able to engage
in constructive activities, such as reviewing the execution of their code so far.
5.1.2 Algorithmic Solutions
Given the differences between the Art Supply and ALVIS students with respect to how
they spent their algorithm development time, a key question arises: Did these process differences
lead to notable product differences—that is, did one group of students develop code that was
more correct than that of the other? Table 4 presents the results of analyzing the semantic
correctness of the code written by the student pairs who participated in the sessions we observed
(n = 44 Art Supply code solutions and 42 ALVIS code solutions; each pair wrote two, and, in
some cases, three solutions).
As the table indicates, ALVIS students committed roughly half as many semantic errors
per algorithmic solution as the Art Supply students, which translates to a four-fold advantage if
one averages the errors on a per-line basis. According to a non-parametric Kruskal-Wallis test,
the difference between the number of semantic errors per line in the Art Supply and ALVIS
sessions is statistically significant (df = 1, H = 4.53, p = 0.03). Thus, as might have been
predicted, the edit-time visual feedback provided by the ALVIS environment resulted not only in
students’ needing fewer interventions by a teaching assistant, but also in students’ developing
code that was significantly more correct.

An Empirical Study of a CS 1 Studio Experience 19
5.1.3 Visualizations
We now turn to a brief analysis of the second product of the studio sessions: students’
visual representations of their algorithmic solutions, which potentially had an accompanying
storyline or theme. To perform this analysis, the two authors collaboratively classified each
student visualization with respect to five “yes-no” story-related content categories:
(a) personalized content—the visualization includes personalized elements;
(b) story content—the visualization is based on some sort of storyline or scenario;
(c) “for show” story content—the visualization includes story content that is largely “for
show” in that it does not relate to the underlying algorithm.
(d) sophisticated story content—the visualization includes story content that served to
motivate, or provide an analogy for, the underlying algorithm’s behavior; and
(e) character dialog content—the visualization includes character dialog.
Although a chi-squared test found no statistically significant differences between the two
treatments with respect to these categories, χ2(1, N = 104) = 3.35, p = 0.5015, the following three
observations provide an overall feel for the story content of the two treatments’ visualizations.
First, 70 percent of the Art Supply pairs, and 84 percent of the ALVIS pairs, chose to personalize
their visualizations with custom visual elements, including custom variable pictures, background
doodles, and custom “cutouts” that could be animated (in the case of the Art Supply
presentations). We suspect that the slightly higher level of personalization present in the ALVIS
visualizations was a result of two main factors: (a) ALVIS pairs tended to have more time to
invest in personalizing their visual presentations, because they tended to finish coding faster; and
(b) the ALVIS tool made personalization easier than did art supplies, because specific
personalization features were built in.

An Empirical Study of a CS 1 Studio Experience 20
Second, we observed that students’ visualizations varied with respect to their story
content. Thirty five percent of the Art Supplies pairs, and 16 percent of the ALVIS pairs,
produced visualizations that lacked any kind of story content at all. The level of story content
present in the visualizations of the remaining pairs varied from simple background themes that
were purely “for show” and did not relate to the underlying algorithm (10 percent of the Art
Supply pairs and 26 percent of the ALVIS pairs), to more sophisticated storylines that served to
motivate, or provide an analogy for, the underlying algorithm’s behavior (55 percent of the Art
Supply pairs and 58 percent of the ALVIS pairs).
Third, we observed a higher incidence of character dialog in the ALVIS visualizations
(63 percent versus 20 percent). To explain this difference, we note that the ALVIS tool provides
both a “say” command, which makes it easy to create character dialog, and a background
drawing tool, which makes it easy to create a background theme or scenario. We speculate that
the existence of this latter tool accounted for the higher incidence of background scenarios in the
ALVIS visualizations, which, in turn, lowered the incidence of ALVIS visualizations with no
story or scenario at all.
5.2 Visualization Presentation and Discussion
In the final phase of the Studio sessions, which was allotted 45 minutes, student pairs
presented their visualizations to the class for feedback and discussion. The 20 Art Supply
presentations we observed lasted an average of 3.81 minutes (sd = 2.22). The 19 ALVIS
presentations we observed were longer on average: 4.78 minutes (sd = 2.39). According to a non-
parametric Kruskal-Wallis test (the duration data were not normally distributed, so we could not
use a parametric test), no significant difference existed between the presentation lengths of the
two condtions (df = 1, H = 2.84, p = 0.092).

An Empirical Study of a CS 1 Studio Experience 21
A lab instructor (the first author and/or one of the teaching assistants) facilitated each of
the presentation sessions. To that end, he or she followed a four-step protocol, which served to
give the presentation sessions a similar structure:
1. Call on a student group to come up to the overhead projector (in the Art Supply
sessions) or the computer connected to the LCD projector (in the ALVIS sessions) to
give their presentation.
2. Ask the student group to explain the algorithm design problem that they solved.
3. Ask the student group to provide a “play by play” as they walk through each of their
two algorithm visualizations.
4. Ask the student group to perform Big-O analyses of their alternative algorithms, and
to justify their analyses.
We videotaped all student presentations in their entirety. In the remainder of this section,
we first describe the process by which we transformed our videotapes into data. We then present
four different analyses of the data:
1. an analysis of who contributed to the discussions (a contribution analysis);
2. an analysis of what was said (a content analysis);
3. an analysis of the ways in which participants referred to the algorithms that they
discussed (a reference analysis); and
4. an analysis of the extent to which participants’ talk exhibited evidence of higher-order
thinking (a higher-order thinking analysis).
5.2.1 Data Transformation Process
In order to carry out the analyses presented in the next subsections, we first had a skilled
transcriptionist transcribe all of the verbal utterances from the presentation videotapes. In

An Empirical Study of a CS 1 Studio Experience 22
addition to accurately transcribing the video, the transcriptionist had two secondary tasks. First,
in the process of transcribing the video, the transcriptionist determined who said each utterance,
and associated a speaker label (Instructor, TA, Presenter, or Audience) with each utterance.
Second, the transcriptionist partitioned the transcriptions into segments, where a segment was
defined as single, verbally-expressed thought or idea. Note that, in some cases, long sentences
had to be broken up into smaller pieces in order to adhere to this rule. The speaker-labeled
segments of the transcription became the basis of the analyses below. In particular, our
contribution analysis considers percentages of segments spoken by each speaker type, whereas
our content, reference, and higher-order thinking analyses compare percentages of segments
classified by various talk categories.
In order to establish the reliability of the classification schemes on which our content,
reference, and higher-order thinking analyses are based, the two authors independently coded 20
percent of the 1,255 ALVIS presentation segments, along with 20 percent of the 1,065 Art
Supply segments, into our content, reference, and higher-order thinking categories (see the
following subsections for the definitions of our coding categories).

An Empirical Study of a CS 1 Studio Experience 23
Table 5 presents the results of our reliability check. As the table indicates, we achieved
agreement levels that ranged from 92 percent to 99 percent. The corresponding kappa statistic
values ranged from 0.83 to 0.98. Since we achieved agreement levels above 90 percent and
kappa values above 0.8, we concluded that our coding category definitions were sufficiently
reliable. Each of us then proceeded to code half of the remaining segments.
5.2.2 Contribution Analysis
Figure 6 presents a high-level analysis of the extent to which each participant type
(instructor/TA, student presenters, or student audience) contributed to the Art Supply and ALVIS
presentation discussions. Here, a “contribution” is defined as a single segment (see above). The
bar heights reflect the average percentage of segments spoken by each participant type across the
20 Art Supply and 19 ALVIS presentations.
As Figure 6 indicates, the instructor/TA and the student audience participated more
extensively in the ALVIS sessions than in the Art Supply sessions, whereas the student
presenters participated less extensively in the ALVIS sessions than in the Art Supply sessions.
According to a nonparametric Kruskal-Wallis test2, the difference in levels of instructor,
presenter, and audience participation were significant (instructor/TA: df = 1, H = 9.55, p =
0.002; student presenter: df = 1, H = 11.95, p = 0.0005; student audience: df = 1, H = 10.81, p =
0.001).
Upon closer inspection of our data, we can identify a confounding factor. the person who
facilitated each presentation session. Whereas the first author facilitated all 20 ALVIS
presentations, he facilitated only 11 of the 18 Art Supply presentations; the remaining seven Art
2 The data we consider in our contribution, content, reference, and higher-order thinking analyses are ratios with varying denominators, which we report as percentages. According to Shapiro-Wilk tests, these data fail to meet the normality assumption of the parametric analysis of variance (ANOVA) test. As a result, we employ the non-parametric Kruskal-Wallis ANOVA to test for statistical significance throughout these analyses.
An Empirical Study of a CS 1 Studio Experience 24
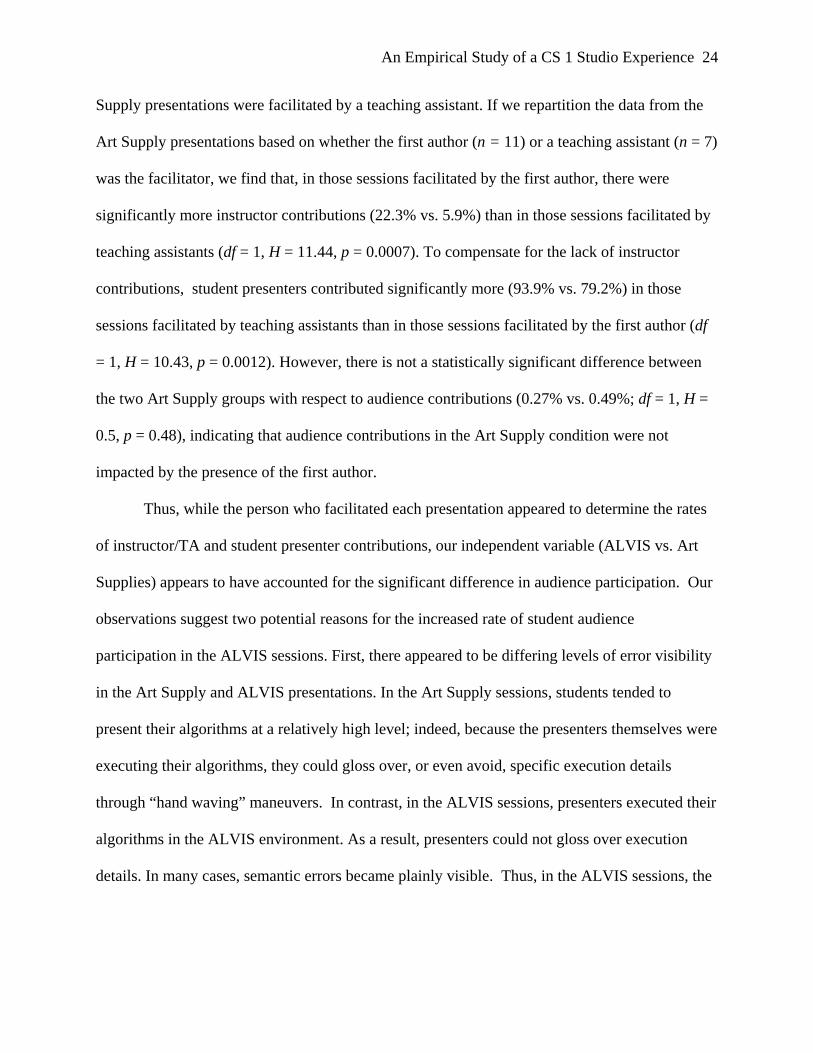
Supply presentations were facilitated by a teaching assistant. If we repartition the data from the
Art Supply presentations based on whether the first author (n = 11) or a teaching assistant (n = 7)
was the facilitator, we find that, in those sessions facilitated by the first author, there were
significantly more instructor contributions (22.3% vs. 5.9%) than in those sessions facilitated by
teaching assistants (df = 1, H = 11.44, p = 0.0007). To compensate for the lack of instructor
contributions, student presenters contributed significantly more (93.9% vs. 79.2%) in those
sessions facilitated by teaching assistants than in those sessions facilitated by the first author (df
= 1, H = 10.43, p = 0.0012). However, there is not a statistically significant difference between
the two Art Supply groups with respect to audience contributions (0.27% vs. 0.49%; df = 1, H =
0.5, p = 0.48), indicating that audience contributions in the Art Supply condition were not
impacted by the presence of the first author.
Thus, while the person who facilitated each presentation appeared to determine the rates
of instructor/TA and student presenter contributions, our independent variable (ALVIS vs. Art
Supplies) appears to have accounted for the significant difference in audience participation. Our
observations suggest two potential reasons for the increased rate of student audience
participation in the ALVIS sessions. First, there appeared to be differing levels of error visibility
in the Art Supply and ALVIS presentations. In the Art Supply sessions, students tended to
present their algorithms at a relatively high level; indeed, because the presenters themselves were
executing their algorithms, they could gloss over, or even avoid, specific execution details
through “hand waving” maneuvers. In contrast, in the ALVIS sessions, presenters executed their
algorithms in the ALVIS environment. As a result, presenters could not gloss over execution
details. In many cases, semantic errors became plainly visible. Thus, in the ALVIS sessions, the

An Empirical Study of a CS 1 Studio Experience 25
presentation sessions served as forums for collaboratively fixing semantic errors in presenters’
algorithms, leading to increased opportunities for audience participation.
Note that, in addition to the error visibility promoted by ALVIS, two other characteristics
of the ALVIS software created increased opportunities for student participation:
• the limited vocabulary of visual elements available for use in students’ visualizations,
which led to more discussions about which elements to use; and
• bugs in the ALVIS software itself, which led to more discussions regarding how to work
around or remedy problems students encountered with the software.
We will elaborate on these increased opportunities for student participation in greater detail
in the content analysis presented below.
A second possible reason for the higher rate of audience participation in the ALVIS
sessions stems from our observation that students in the ALVIS sessions seemed to finish their
coding activities more quickly than did students in the Art Supply sessions. Thus, when it came
time for the presentations, we observed that nearly all pairs of students in the ALVIS sessions
had at least one of their two algorithms working, so that they could give their full attention to the
presentation sessions. In contrast, we observed that many students in the Art Supply sessions
failed to finish coding their algorithms in the two hours they were allotted. This meant that they
continued to work on their presentations while other students were presenting—an endeavor that
effectively prevented them from participating in other students’ presentations.
5.2.3 Content Analysis
Having presented a high-level analysis of who contributed to the presentations, we now
consider what was actually talked about. By iteratively reviewing our transcripts, we gradually
developed 11 primary content categories that captured the full range of content discussed in the

An Empirical Study of a CS 1 Studio Experience 26
presentation sessions (see Table 6). We proceeded to code all segments into these categories,
leading to the Art Supply and ALVIS content breakdowns presented in Figure 7.
In this figure, bar heights represent the average percentages, on a presentation-by-
presentation basis, of segments dedicated to each content category; the accompanying table
provides raw percentages; statistically significant differences, according to non-parametric
Kruskal-Wallis tests, are outlined. Note that the figure and accompanying table also break down
each category of talk according to speaker type. In the bar graph, the lines that transect each bar
separate the percentage of student talk (which falls below the line) from the percentage of
instructor/TA talk, thus providing a sense of the extent to which talk varied by speaker type.
As this figure illustrates, there appears to be a clear pattern of differences that holds
relatively well across speaker type. In particular, Algorithm Behavior and Algorithm Efficiency
were the dominant topics in both the Art Supply and ALVIS presentations. This is not surprising,
given that the presentations focused on presenting and analyzing algorithms. At the same time,
several notable differences between Art Supply and ALVIS presentation content stand out:
• A higher percentage of segments in the Art Supply presentations were dedicated to
algorithm behavior (66.7% versus 47.3%), a difference that is statistically significant (df
= 1, H = 9.04, p = 0.0027).
• ALVIS presentations dedicated roughly 6.5 percent of their conversations to coding
errors and error fixes, whereas virtually none of the talk in the Art Supply presentations
focused on these topics. According to Kruskal-Wallis tests, both the difference in Error
Talk, and the difference in Error Fixes talk, are statistically reliable (Error Talk: df = 1, H
= 3.70, p = 0.05; Error Fixes: df = 1, H = 4.55, p = 0.03); however, Holm’s procedure
(Holland & Copenhaver, 1988), which guards against Type I errors, rejected these two
An Empirical Study of a CS 1 Studio Experience 27
differences as being statistically significant, so one must be cautious in drawing definitive
conclusions from this result.
• Nearly five percent of the talk in the ALVIS presentations was focused on the ALVIS
tool (Tool Talk), whereas none of the talk in the Art Supply presentations focused
specifically on the art supplies themselves. This difference is statistically significant (df =
1, H = 11.73, p = 0.0006).
• Whereas 5.5 percent of the ALVIS presentation talk focused on visual elements of the
presentations, only one percent of the Art Supply presentation talk focused on visual
elements. This difference is statistically reliable (df = 1, H = 10.22, p = 0.001).
• The ALVIS presentations contained more than two times as much On Task talk as the Art
Supply presentations (13.3% vs. 6.2%), a difference that is statistically reliable (df = 1, H
= 20.72, p = 0.0001).
Clearly, the biggest content difference between the Art Supply and ALVIS presentations
lies in the category of Algorithm Behavior, to which the Art Supply presentations dedicated
nearly 20 percent more of their talk. Given this, it would appear, at first glance, that the Art
Supply participants engaged in more relevant conversations with respect to the pedagogical
objectives of the presentation sessions. However, on closer inspection, it turns out that the large
difference in Algorithm Behavior talk is tied to the differences in Error talk, Tool talk, Visual
Elements talk, and On-Task talk noted above. If we take a closer look at what might have caused
these differences, we can gain substantial insight into the pedagogical tradeoffs between art
supplies and a computer-based tool like ALVIS within the context of interactive presentations.
In the Art Supply presentations, we observed that talk about algorithm behavior tended to
be at a higher level of abstraction. Student presenters typically presented their pseudocode, and

An Empirical Study of a CS 1 Studio Experience 28
then “handwaved” their way through a sample execution of that code. This led to numerous high-
level monologues about how algorithms worked. For example, consider the following Art Supply
presentation segment, which illustrates the handwaving that took place:
For ours we had to allow the input of integers between 1 and 100. And we created an array however large, and put them in ascending order from highest to lowest. On one of them we were supposed to use 2 arrays. So we set up our first array. Our while loop scans through one time and it goes to the highest number. After it’s done, it moves down to the second array and it moves the array iterator for the second array to the right. The next time it scans and finds the highest number it’ll synchronize. Notice that the presenter covered the algorithm at such a high level of abstraction that it
was difficult for the audience to follow the algorithm, let alone detect errors.
In stark contrast, owing to their basis in “live” code, ALVIS presentations tended to be
more grounded in the detailed execution of the algorithm. This allowed the discussion to focus
more intently on the specific details of the algorithms being presented, as the following segment
of one ALVIS group’s presentation of the partition algorithm illustrates (P1 and P2 are the
presenters, A is an audience member, and I is the lab instructor):
P2: So when get here to the while loop, it’s just going to set current to that position, instead of swapping.
… I: Is there an error in your program. (Noticing the visual display) … P2: Yeah, there is a problem. I: Oh, you can’t deal with duplicates. P1: Yeah, we forgot to put that in. P2: We just didn’t think the odds of duplicates were too high. I: Well, it does happen from time to time. A: There’s two 97’s there. (Noticing the duplicates in the visual display) P1: It doesn’t matter in this case, because if the pivot is matched by another, then
there’s trouble because it doesn’t know what to do when it equals instead of greater or less than.
I: Ah, well that’s easy to fix. How would you fix that? P1: You put in an else at the very end that says else equals to I: Or you could change the if here to less than or equal to, and then just add one else.

An Empirical Study of a CS 1 Studio Experience 29
ALVIS presentations’ firm grounding in live code tended not only to focus discussions
more intently on actual execution behavior, but also to expose bugs and problems in the ALVIS
software itself. Such bugs and problems, in turn, sometimes became the focus of discussion, as in
the following sequence, in which the instructor and TA guide the presenter through the process
of doctoring a line of code so that it is acceptable to ALVIS:
I: OK, delete the whole line and retype it in. I: And move Tom right. I: That didn’t delete the boxes though. TA: You have to delete everything on that line, I think. I: There you go. Arguably, such Tool Talk bears little relevance to algorithms, and ends up being little
more than a distraction. We speculate that, as ALVIS Live! evolves into a more robust piece of
software, the incidence of such Tool Talk will greatly diminish.
Notice that the significantly higher incidences of Error talk, Error Fixes talk, and Tool
talk in the ALVIS presentations account for roughly half of the 20 percent difference in
Algorithm Behavior talk. The remainder of that difference can be accounted for by marked
discrepancies in two additional categories of talk: Visual Elements talk and On Task talk.
Let us first explore the difference in Visual Elements talk, which constituted 5.5% of the
ALVIS presentations, but only one percent of the Art Supply presentations. Recall that, in
ALVIS presentations, presenters more frequently received suggestions from the instructor or
audience regarding how their visualizations could better illustrate the algorithm. One common
suggestion was to turn a simple variable into an array index, which, in ALVIS, appears directly
adjacent to the array cell to which it refers. The following exchange, initiated by an audience
member, illustrates this kind of Visual Elements talk:
A: You figure J as the index and it would be easier to see. I: Yeah, that might be easier to see.

An Empirical Study of a CS 1 Studio Experience 30
I: Why don’t you go up there and say set J to index zero. TA: You might need to remove the create variable J also. A: It might not index. I: Don’t create it, delete that there. I: There you go. While such talk does not directly address issues of algorithm behavior and efficiency, it
would nonetheless appear educationally beneficial insofar as it invites students to put themselves
in the shoes of a teacher, and to think about how best to illustrate how an algorithm works
through a visual representation.
Why did the ALVIS tool promote significantly more of this kind of talk? Based on
Suthers’s representational guidance hypothesis (Suthers, 2001), we speculate that the small
vocabulary of visual elements supported by ALVIS constrains students’ design choices to the
point where they are able to systematically consider and talk about alternative representations. In
contrast, the Art Supplies medium is almost completely unconstrained. As a result, the medium
is unable to highlight for possible discussion the representational choices that students actually
have to make as they design their visualizations.
The final large content difference between the Art Supply and ALVIS presentations was
in the category of On Task talk, which relates to the presentation task at hand, but not directly to
the algorithms being presented. For example, the instructor or TA, as a matter of protocol, asked
the presenters what problem they solved, and what the efficiencies of their solutions were. In
addition, instructors and TAs often interjected utterances to move a presentation along, such as
“Do you have another solution?” Likewise, as they presented their solutions, presenters often
talked with each other about who should handle what part of the presentation.
One possible explanation for the fact that the ALVIS presentations contained
significantly more On-Task talk might be found in our contribution analysis results, which

An Empirical Study of a CS 1 Studio Experience 31
showed that the ALVIS presentations were, in general, more interactive than the Art Supply
presentations: the instructor and audience participated significantly more, while the presenters
participated significantly less. We speculate that one way instructors in the ALVIS presentations
increased their level of participation was by asking more On Task questions, which, as a side
effect, increased the level of audience participation. This is borne out in Figure 7, which
illustrates that instructors dedicated twice as many segments to On Task talk in the ALVIS
presentations as in the Art Supply presentations. At the same time, Figure 7 shows that ALVIS
students also dedicated twice as many segments to On Task talk. We can account for this
increase by noting that such segments were often in direct response to instructor On Task
segments.
In sum, we surmise that the significant difference in On Task talk was due to the higher
level of interactivity in the ALVIS presentations, which led to the need for more coordination
between conversational participants in the form of On Task talk.
5.2.4 Reference Analysis
In addition to considering what was talked about, we wanted to explore the ways in
which participants referred to the algorithms they were talking about. For this purpose, we
defined the four “reference” codes described in Table 7. Note that, unlike the primary codes,
these codes were not mutually exclusive; a given segment could be coded into as few as 0 of
these categories, and into as many as all four of these categories.
Figure 8 presents the percentages of all segments that were coded into the four reference
categories. These percentages are further broken down by the two speaker types—instructor/TA
and student. As the figure indicates, between one-eighth and one-fifth of participants’ utterances

An Empirical Study of a CS 1 Studio Experience 32
were phrased in terms of elements of their stories3, whereas roughly one-sixth of their utterances
were phrased in terms of the visual elements of their visualizations. If we consider the union of
these two sets of utterances, we find that nearly one-fourth (23.9%) of all ALVIS utterances, and
nearly one-third of all Art Supply utterances (32.8%), were phrased in terms of either story
elements, visual elements, or both. It thus appears that participants in both conditions made
extensive use of their stories and visualizations as resources for discussing algorithms—an
observation that underscores the communicative value of storytelling and visual representations
in discussions about algorithms.
Somewhat surprisingly to us, discussions in both conditions referred substantially less
often (roughly 5 percent of the time) to specific lines of algorithm code, even though that code
was always displayed in ALVIS, and even though that code was frequently displayed on the
overhead projector as part of Art Supply presentations. While presentations in both conditions
contained a roughly equal percentage of references to code, it is interesting to note the markedly
different situations in which the Art Supply and ALVIS conditions referred to code. In the case
of the Art Supply presentations, the presenters themselves were most often the ones who referred
to code, and they did so most often as a way of explaining their algorithms to the audience, as in
the following exchange by two Art Supply presenters who walk the audience through the code
displayed on the overhead:
P2: Yeah, we’ve set up a couple of if statements in the, uh… P2: Um, this is kind of a comparison, down here. (referring to code) P1: Yeah. P2: This is the third if statement right here. (referring to code) P2: That’s your comparison. P2: And then the else statement was if A was less than B, it wouldn’t be as great as if it was
less than A.
3 While the Art Supply presentations appear to have had substantially more story references than did the ALVIS presentations (21.7% vs. 12.8%), the difference was not statistically significant (df = 1, H = 0.65, p = 0.42).

An Empirical Study of a CS 1 Studio Experience 33
In the ALVIS presentations, in contrast, we observed that the presenters, the audience,
and the instructor/TA all referred to code under a completely different set of circumstances—
namely, when they were trying to diagnose and fix errors that were identified either by the
presenters themselves, or by an anomaly in the visualization. Consider, for example, the
following ALVIS presentation vignette, which is laden with code references:
P1: It keeps running into the Y thing. I: Could someone help him with that? A: The inner one should be less. I: While A is less than cells of… … I: Yeah, while Y is less than cells of A3. I: Why doesn’t it terminate? I: Does Y not ever get there? TA: Did it get outside the loop on its own, or does it just run forever? P1: Oh, it gets outside the loop on its own.
Notice that, in the above vignette, instead of serving as a resource for presenting the
algorithm (as was the case in the Art Supply presentations), the code was used as a resource for
collaboratively hand-simulating and debugging the presenter’s algorithm—in this case, for the
purpose of remedying an execution anomaly that arose during the presentation.
5.2.5 Higher Order Thinking Analysis
Finally, in order to help gauge the extent to which the presentation discussions were
educationally valuable, we turn to an analysis of the degree to which participant discussions
contained evidence of higher order thinking, which, according to Lewis and Smith (1993),
“occurs when a person takes new information and information stored in memory and interrelates
and/or rearranges and extends this information to achieve a purpose or find possible answers in
perplexing situations” (p. 136, as quoted in Herrington & Oliver, 1999). Rather than employing
one of the many existing classifications of higher-order thinking (see, e.g., Ennis, 1993; Lewis &
An Empirical Study of a CS 1 Studio Experience 34
Smith, 1993; Resnick, 1987), we opted to ground our higher order thinking categories firmly in
the local circumstances or our presentations. Through examining our presentation transcripts vis-
à-vis the pedagogical goals of the studio experience, we identified four specific ways in which
one might demonstrate higher order thinking through discussing algorithms:
• Generalization—Generalizing algorithm behavior beyond a specific execution.
• Warrant—justifying algorithm behavior or efficiency.
• Comparison—Comparing the behavior or efficiency of multiple algorithms.
• Big-O—Using Big-O terminology to analyze the efficiency of an algorithm (which itself
is a form of generalization).
These four kinds of discussion formed the four higher order thinking categories defined
more precisely in Table 8. Like the reference codes, these codes modified the primary content
codes; however, with one exception (namely, something could be both a generalization and a
comparison), at most one of these codes could apply to a given segment.
Figure 9 presents the percentages of all segments that were coded into our four higher-
order thinking categories. These percentages are further broken down by the two speaker
types—instructor/TA and student. On inspection of these data, we see two general trends. First,
fewer than six percent of the segments in either condition were dedicated to any one higher order
thinking category, suggesting that utterances that contained evidence of higher order thinking
constituted a small proportion of participants’ overall talk. However, if we consider the set of
segments that is the union of these four categories, we find that 18.0 percent of all Art Supply
segments, and 12.8 percent of all ALVIS segments, actually contained evidence of these forms
of higher order thinking. While there exists no statistically significant difference between the two
conditions with respect to the percentage of all higher-order thinking talk (df = 1, H = 2.84, p =

An Empirical Study of a CS 1 Studio Experience 35
0.092), higher-order thinking nonetheless constituted a notable proportion (roughly one-eighth to
one-sixth) of all participant talk in both conditions.
Second, as indicated in Figure 9, the Art Supplies presentations contain slightly higher
percentages of higher order thinking talk in all four categories. While practically small, the
difference in one of the four categories, Warrant, reached statistical significance (df = 1, H =
3.90, p = 0.048). Recall, from Table 8, that our coding system actually distinguished nine types
of warrants. To explore this difference further, we performed a follow-up analysis in which we
tested for differences with respect to each of the nine warrant types. We found that the
statistically significant difference between the Art Supplies and ALVIS conditions emerged with
respect to only two specific types of warrants: (a) the use of a storyline to justify why the
algorithm behaves the way it does (“STAB” warrants); and (b) the use of algorithm behavior to
justify a given efficiency analysis (“ABAE” warrants). These two types of warrants, in fact, were
the most common ones across all of the Art Supply and ALVIS presentations.
Why did participants in the Art Supplies presentations enlist more “STAB” warrants?
One possible explanation can be drawn from our reference analysis, which found that the Art
Supply presenters referred to their storylines more frequently as they discussed the algorithms
they were presenting (20.9 percent vs. 11.9 percent of the total segments; see Figure 8).
Evidently, Art Supply presenters made a greater effort to explain and justify their algorithms
through the use of story elements than did ALVIS presenters, who seemed to rely more on the
ALVIS tool than on their own narratives to explain the execution of their algorithms. In fact, an
important byproduct of ALVIS animations was a “free” narrative in the form of speech bubble
dialog, which, as previously noted, 63 percent of the ALVIS animations included.

An Empirical Study of a CS 1 Studio Experience 36
The difference in “ABAE” warrants proves more difficult to explain. As a matter of
protocol, students in both conditions were prompted to provide a Big-O efficiency analysis of
their algorithms, and to justify that analysis. Indeed, an inspection of the transcripts reveals that
most “ABAE” warrants came in close proximity to such instructor prompts. Perhaps, in the Art
Supply presentations, the instructor and TA gave better prompts, or made a greater effort to elicit
efficiency justifications. Alternatively, perhaps the Art Supply students were, by chance, better at
justifying their efficiency analyses. However, we see no reason to conclude that the increased
rate of “ABAE” warrants in the Art Supply condition was a result of the medium itself. We
instead speculate that it stemmed from individual differences that were beyond the control of this
study.
6. Discussion
Given the observations and analyses presented in the previous section, what insights have
we gained into our three original research questions, and what research remains for the future? In
this section, we discuss our results vis-à-vis those three questions, and propose directions for
future research.
6.1 Does the Construction of Personalized AVs Aid Algorithm Understanding?
We have presented a diverse set of observations of how novices go about the process of
constructing algorithmic solutions and accompanying visual representations with differing
representational tools. In addition, we have analyzed the code and visualizations that resulted
from that process. We observed that the construction of visualizations engaged students actively
in the course, and that many students derived pleasure from the process. However, aside from the
result that students who used ALVIS to construct their algorithmic solutions had significantly
fewer errors than students who used art supplies, we failed to gather any concrete evidence that

An Empirical Study of a CS 1 Studio Experience 37
students actually learned through the process of algorithm construction. Perhaps the process did
not benefit students’ understanding per se, but rather increased students’ general level of
engagement and enjoyment. In future research, we would like to use an attitude questionnaire in
order to see if this is the case. Alternatively, one might speculate that the algorithm construction
process “primed” students for the presentation discussions, which, as we showed, engaged
students in higher order thinking. In future research, we might explore this “priming” effect by
comparing discussions that follow algorithm construction activities against discussions that
follow an alternative learning activity, such as studying or interacting with predefined algorithm
visualizations.
6.2 Does the Presentation of Personalized AVs Lead to Educationally Beneficial Conversations?
We gathered a rich set of data that enabled us to analyze (a) who contributed in the
presentation discussions, (b) what was talked about, (c) how it was talked about, and (d) the
extent to which higher order thinking was present. In the transcripts we analyzed, we found
many examples of educationally beneficial conversations, especially in the ALVIS presentations,
in which students’ visualizations provided a powerful mediational resource (Roschelle, 1994) for
collaboratively identifying and repairing semantic code errors. In addition, we found that
between 13 percent (ALVIS) and 18 percent (Art Supply) of presentation talk contained
evidence of four kinds of higher order thinking that we regard as hallmarks of expertise in
algorithmic problem solving: warrants, generalizations, comparisons, and Big-O analyses.
While our analysis is an initial step toward identifying the ways in which students might
benefit from algorithm presentations, future research will need to go further by (a) determining
the extent to which such higher order thinking utterances actually make correct assertions, and
(b) linking the conversations that take place in presentation sessions to concrete learning

An Empirical Study of a CS 1 Studio Experience 38
outcomes. In addition, although we observed some audience participation in the presentation
sessions, we cannot say at this point that these sessions benefited anyone except the presenters
themselves. Indeed, several questions for future research remain:
• Did students in the audience actually learn each other’s algorithms through the
presentations?
• Did constructing their own algorithms somehow “prime” them to learn other algorithms?
• Does a student have to make a contribution in order to learn?
6.3 What Form of AV Technology Best Supports the Above Processes?
In presenting our observations and analyses, we took great care to note process and
product differences between the Art Supply and ALVIS students. In fact, based on our results,
were able to identify four key differences:
• The ALVIS tool appeared to promote a faster coding process, with fewer “stuck” periods,
and less reliance on expert help.
• The ALVIS tool promoted the development of algorithms with significantly fewer
semantic errors, and with greater story content.
• The ALVIS tool appeared to promote conversations with a sharper focus on the specific
details of algorithm behavior, leading to increased audience participation, which resulted
in the collaborative identification and repair of semantic errors.
• The Art Supplies presentations had a slightly higher incidence of higher order thinking
segments, including a small but significantly higher percentage of warrants. However, we

An Empirical Study of a CS 1 Studio Experience 39
question whether this difference was attributable to the art supplies medium itself, or
whether it was an artifact of individual differences beyond the control of the study.
The ALVIS tool thus appears to have three key advantages over art supplies within the
context of the CS1 studio experiences explored here. At the same time, the art supplies medium
cannot be seen as a failure, as we observed somewhat higher percentages of higher order
thinking utterances within the Art Supplies presentations.
It is interesting to juxtapose these findings with those of our previous study of the use of
art supplies and a computer-based tool to support a similar studio-based learning experience
within an upper-division (third-year) algorithms course (Hundhausen, 2002). In that prior study,
we found art supplies to be superior to the computer-based tool, SAMBA (Stasko, 1997), for two
reasons. First, when they constructed their visualizations, students who used art supplies
remained focused on the underlying algorithms, whereas students who used SAMBA tended to
become steeped in the (irrelevant) details of low-level graphics programming. Second, when it
came time for students to present their visualizations for feedback and discussions, the
presentations mediated by art supplies tended to stimulate conceptual discussions about the
algorithms being presented, whereas the presentations mediated by SAMBA tended to stimulate
discussions about the programming toil that students endured in order to create their
visualizations.
Recall that we originally developed the ALVIS tool specifically to support the studio-
based learning exercises explored here. We wanted to build a tool that had all of the advantages
of art supplies as both a construction medium (quick, easy) and presentation medium (natural,
flexible). By masking low-level programming details, ALVIS appears to have succeeded in
focusing students on the programming task at hand, rather than on low-level graphics

An Empirical Study of a CS 1 Studio Experience 40
programming, as was the case with SAMBA. Moreover, unlike SAMBA, and similar to art
supplies, ALVIS appears to have successfully mediated discussions about algorithms.
In fact, our findings suggest that ALVIS actually had a key advantage over art supplies:
namely, it focused discussions more intently on algorithm details, leading to the collaborative
identification and repair of semantic errors. In our prior study, we did not observe such detailed
discussions of semantic errors. Rather, discussions mostly remained on a higher conceptual level,
which perhaps enabled conversational participants to cope with the increased complexity of the
algorithms they were discussing. Although we did not grade the semantic correctness of the
algorithms that students created with art supplies in our prior study, we speculate that students in
the art supplies presentations missed at least some opportunities to identify and correct semantic
errors. An interesting question for future research thus concerns the potential advantages of a
tool like ALVIS for advanced algorithms: Should such a tool obscure low level programming
details (as does art supplies), so that students focus on higher level conceptual issues, which
would appear to be more relevant in an advanced course? Can such a high-level focus be brought
about while still ensuring a high degree of semantic correctness?
With regard to the ALVIS tool used in this study, we see two key improvements for
future work. First, we will need to further refine the ALVIS tool so that the incidence of Tool
Talk (which proved a distraction in the presentations) decreases. Second, we will need to explore
ways in which the ALVIS tool can better promote higher order thinking in both the visualization
construction and presentation phases of the studio experience.
7. Summary, Limitations, and Implications
In this article, we have presented an observational study of CS1 studio experiences—
novel pedagogical activities in which students construct algorithmic solutions to algorithm

An Empirical Study of a CS 1 Studio Experience 41
design problems, personalize those solutions with visual representations and storylines, and
finally present their solutions to their peers and instructor for feedback and discussion. Through a
diversity of ethnographic field techniques, we have gathered a rich set of data that has allowed us
to gain preliminary insights into both the potential pedagogical value of these activities, and the
kind of technology that can best support these activities.
Because the study presented here was conducted within regularly scheduled university
courses, its design was necessarily quasi-experimental. It is important to note two key limitations
of this design. First, we were unable to control for individual differences in the students who
participated in each of the two treatments. Thus, we cannot rule out the possibility that the
differences we observed between treatments were due, at least in part, to individual differences
in programming abilities, which are known to be generally large in novice populations.4 Second,
we were unable to control for individual differences in the teaching assistants who led the studio
experiences we observed. It is certainly possible that one of the teaching assistants was more
skillful than the other at assisting students as they wrote their algorithms, and at serving as a
facilitator in the student visualization presentation sessions. Likewise, since one of the two
teaching assistants taught multiple studio experience sessions, it could have been the case that
the teaching assistant was more effective in some of those sessions than others. We therefore
cannot rule out the possibility that differences in teaching assistants’ abilities could have
accounted, at least in part, for the differences we observed between the two treatments. Clearly,
our inability to control for individual differences, both in the student participants and in the
1 Note that, if we had gathered data on students’ prior programming abilities (through, e.g., a pre-test), we might have been able to factor programming ability into our analyses. Unfortunately, we failed to collect such data.

An Empirical Study of a CS 1 Studio Experience 42
teaching assistants, limits one’s ability to generalize our study’s findings beyond the specific
course in which our study was conducted.
Based on the results and analyses presented here, we can make the following specific
recommendations to computer science educators interested in exploring the use of studio-based
learning methods in their own courses:
1. Make sure that novice students have consistent access to knowledgeable experts
during the coding process. We were surprised by the difficulties that students in our
study had as they developed algorithms in pseudocode. It is not enough simply to sit
pairs of novice students in front of a computer and ask them to write pseudocode
Even when a novice programming environment like ALVIS Live! is enlisted, students
will still need consistent access to skilled teaching assistants.
2. Make sure to give students enough time to develop their algorithmic solutions. As we
found in our Art Supply sessions, two hours may not have been enough for novice
students to fully develop two alternative algorithmic solutions and accompanying
visual presentations. Our observations suggest that, if students do not have enough
time to complete the coding process prior to their presentations, the level of
participation in the presentations will suffer.
3. Make sure to have skilled facilitators for the presentation sessions. Our study found
that novice students will be reluctant to participate in discussions about algorithms
unless they are specifically drawn in to them. While the humor associated with
storytelling and visual presentations can help in that regard, we believe that the
pedagogical value of presentation discussions, as well as the level of participation in
such discussions, hinges on skilled facilitators who ask the “right” questions. The

An Empirical Study of a CS 1 Studio Experience 43
“right” questions, based on our findings, are those that use students’ own
representations as a basis for posing questions about algorithmic behavior and
efficiency.
The ultimate aim of the studio experiences explored here is to engage students in a
process of reflective practice described by Schon (1983): to get students to think about the
process of coding an algorithm, to share their insights with others, and ultimately to become
participants in a vibrant community of “schooled algorithmaticians.” Our observations suggest
that a studio-based pedagogy is a step in the right direction, but will require more refinement in
order to achieve our pedagogical goals.
Acknowledgments
This article is an expanded version of a paper originally presented at the 2005 ACM
ICER Workshop (Hundhausen & Brown, 2005a). We are grateful for the insightful suggestions
and feedback we received both from the reviewers of that paper, and from the attendees of the
workshop. We are thankful for our participants: the students and instructors who agreed to allow
us conduct this study within two offerings of CptS 121 at Washington State University. Laura
Girardeau transcribed and helped to analyze the visualization presentation sessions considered in
this paper. This research is funded by the National Science Foundation under grant nos.
0406485 and 0530708.
References
Ben-Bassat Levy, R., Ben-Ari, M., & Uronen, P. (2003). The Jeliot 2000 program animation system. Computers & Education, 40(1), 1-15.
Boyer, E. L., & Mitgang, L. D. (1996). Building community: a new future for architecture Education and Practice. Princeton, NJ: The Carnegie Foundation for the Advancement of Teaching.
Byrne, M. D., Catrambone, R., & Stasko, J. T. (1999). Evaluating animations as student aids in learning computer algorithms. Computers & Education, 33(4), 253-278.
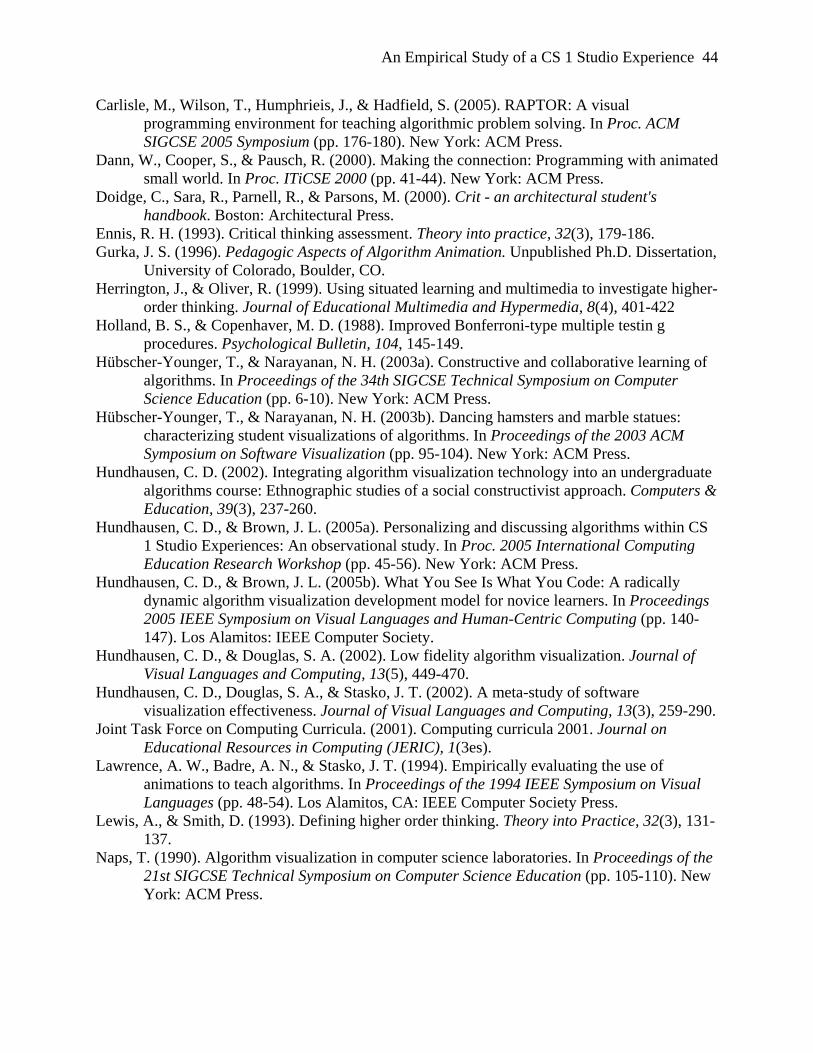
An Empirical Study of a CS 1 Studio Experience 44
Carlisle, M., Wilson, T., Humphrieis, J., & Hadfield, S. (2005). RAPTOR: A visual programming environment for teaching algorithmic problem solving. In Proc. ACM SIGCSE 2005 Symposium (pp. 176-180). New York: ACM Press.
Dann, W., Cooper, S., & Pausch, R. (2000). Making the connection: Programming with animated small world. In Proc. ITiCSE 2000 (pp. 41-44). New York: ACM Press.
Doidge, C., Sara, R., Parnell, R., & Parsons, M. (2000). Crit - an architectural student's handbook. Boston: Architectural Press.
Ennis, R. H. (1993). Critical thinking assessment. Theory into practice, 32(3), 179-186. Gurka, J. S. (1996). Pedagogic Aspects of Algorithm Animation. Unpublished Ph.D. Dissertation,
University of Colorado, Boulder, CO. Herrington, J., & Oliver, R. (1999). Using situated learning and multimedia to investigate higher-
order thinking. Journal of Educational Multimedia and Hypermedia, 8(4), 401-422 Holland, B. S., & Copenhaver, M. D. (1988). Improved Bonferroni-type multiple testin g
procedures. Psychological Bulletin, 104, 145-149. Hübscher-Younger, T., & Narayanan, N. H. (2003a). Constructive and collaborative learning of
algorithms. In Proceedings of the 34th SIGCSE Technical Symposium on Computer Science Education (pp. 6-10). New York: ACM Press.
Hübscher-Younger, T., & Narayanan, N. H. (2003b). Dancing hamsters and marble statues: characterizing student visualizations of algorithms. In Proceedings of the 2003 ACM Symposium on Software Visualization (pp. 95-104). New York: ACM Press.
Hundhausen, C. D. (2002). Integrating algorithm visualization technology into an undergraduate algorithms course: Ethnographic studies of a social constructivist approach. Computers & Education, 39(3), 237-260.
Hundhausen, C. D., & Brown, J. L. (2005a). Personalizing and discussing algorithms within CS 1 Studio Experiences: An observational study. In Proc. 2005 International Computing Education Research Workshop (pp. 45-56). New York: ACM Press.
Hundhausen, C. D., & Brown, J. L. (2005b). What You See Is What You Code: A radically dynamic algorithm visualization development model for novice learners. In Proceedings 2005 IEEE Symposium on Visual Languages and Human-Centric Computing (pp. 140-147). Los Alamitos: IEEE Computer Society.
Hundhausen, C. D., & Douglas, S. A. (2002). Low fidelity algorithm visualization. Journal of Visual Languages and Computing, 13(5), 449-470.
Hundhausen, C. D., Douglas, S. A., & Stasko, J. T. (2002). A meta-study of software visualization effectiveness. Journal of Visual Languages and Computing, 13(3), 259-290.
Joint Task Force on Computing Curricula. (2001). Computing curricula 2001. Journal on Educational Resources in Computing (JERIC), 1(3es).
Lawrence, A. W., Badre, A. N., & Stasko, J. T. (1994). Empirically evaluating the use of animations to teach algorithms. In Proceedings of the 1994 IEEE Symposium on Visual Languages (pp. 48-54). Los Alamitos, CA: IEEE Computer Society Press.
Lewis, A., & Smith, D. (1993). Defining higher order thinking. Theory into Practice, 32(3), 131-137.
Naps, T. (1990). Algorithm visualization in computer science laboratories. In Proceedings of the 21st SIGCSE Technical Symposium on Computer Science Education (pp. 105-110). New York: ACM Press.

An Empirical Study of a CS 1 Studio Experience 45
Naps, T. L., Roessling, G., Almstrum, V., Dann, W., Fleischer, R., Hundhausen, C., et al. (2003). ITiCSE 2002 working group report: Exploring the role of visualization and engagement in computer science education. SIGCSE Bulletin, 35(2), 131-152.
Resnick, L. (1987). Education and learning to think. Washington, DC: National Academy. Roschelle, J. (1994). Designing for cognitive communication: epistemic fidelity or mediating
collaborative inquiry? The Arachnet Electronic Journal on Virtual Culture, 2(2). Schneider, G. M., & Gersting, J. L. (2000). An invitation to computer science. Pacific Grove,
CA: Brooks/Cole. Schon, D. (1983). The reflective practitioner: how professionals think in action. New York:
Basic Books. Shrout, P. E., & Fleiss, J. L. (1979). Intraclass correlations: uses in assessing rater reliability.
Psychological Bulletin, 36(2), 420-428. Stasko, J., Badre, A., & Lewis, C. (1993). Do algorithm animations assist learning? An
empirical study and analysis. In Proceedings of ACM INTERCHI'93 Conference on Human Factors in Computing Systems (pp. 61-66). New York: ACM Press.
Stasko, J. (1997). Using student-built animations as learning aids. In Proceedings of the ACM Technical Symposium on Computer Science Education (pp. 25-29). New York: ACM Press.
Stasko, J., & Hundhausen, C. D. (2004). Algorithm visualization. In S. Fincher & M. Petre (Eds.), Computer Science Education Research (pp. 199-228). Lisse, The Netherlands: Taylor & Francis.
Suthers, D. (2001). Towards a systematic study of representational guidance for collaborative learning discourse. Journal of Universal Computer Science, 7(3).

An Empirical Study of a CS 1 Studio Experience 46
Tables
Table 1. Three Sample Algorithm Design Problems
Problem Title Problem Description
Concatenate Lists
Design two alternative algorithms that create an array containing n random integers between 1 and 50. Your algorithms should create a new list that is twice as long as the original list. The new list should contain two copies of the sequence of elements that appear in the original array: one full sequence followed by a copy of that sequence.
Reverse Order Inputted Numbers
Design two alternative algorithms that prompt the user to input integer values, one at a time, until a negative integer is entered. After each integer is inputted, your algorithms should insert it into an array. The end result should be that the values appear in descending order from largest to smallest. Note that the negative value should not be inserted into the list.
Merge Lists
Design at least two alternative algorithms that create two lists containing n random integers between 1 and 100 that are in ascending order. After that, your algorithms should build a third list of length 2n in which the elements of the two source lists are in ascending order.
Table 2. Summary of the SALSA Pseudocode Language Command Meaning
create Creates new variables, arrays, and array indexes (special variables that reference array cells) set Creates and sets the value of new variables and array indexes on the fly, or changes the values
of existing variables, arrays, and array indexes input Prompts the user for a variable’s value; the variable is created if it does not already exist populate Fills the empty cells of an array with new values print Outputs a value to the user if…elseif…else…endif Specifies blocks of code that execute conditionally based on the results of Boolean tests while…endwhile Specifies a loop that executes as long as the Boolean test evaluates to true move Moves a variable, array, or array index to a new location swap Causes two variables or array indexes to change positions say Causes a variable or array index to “speak” a text string through an animated speech bubble

An Empirical Study of a CS 1 Studio Experience 47
Table 3. Categories Used to Code Students’ Algorithm and Visualization Development Activities Priority Category Description
1 Executing code The video depicts the group executing their code in ALVIS, or hand-simulating their code.
1 Dealing with crashes or freezes The video depicts the group figuring out or recovering from an ALVIS crash or freeze.
2 Talking to TA The video depicts (the voice of) a TA or instructor talking with a student pair about a problem solution.
3 Working on solution The video depicts an explicit change in the text or visualization of the pair’s problem solution.
4 Conversing The video depicts (the voices of) the members of the pair talking to each other.
5 Looking at/for examples The video depicts the pair looking at or for internet resources or example material.
5 Reviewing syntax The video depicts the pair looking at the SALSA quick reference guide with which they were provided.
5 Reviewing problem description The video depicts the pair looking at the (on-line or hardcopy) problem description
5 Reviewing feedback The video depicts the pair reviewing the visual feedback or error messages produced by ALVIS.
6 No detectable progress The video depicts the pair in a “stuck” state: there is no change in the pair’s problem solution or visualization, no effort to consult outside materials, and no conversation.
6 Other The video depicts the pair talking about an off-task topic, saving their document (in the ALVIS condition), or doing something else that is not contributing to progress toward their problem solution.
Table 4. Average Number of Semantic Errors in the Algorithmic Solutions of Art Supply and ALVIS Students
Lines of code per solution
Semantic errors per solution
Semantic errors per line of code
Group M SD M SD M SD Art Supply 19.07 7.77 0.77 0.95 0.04 0.01 ALVIS 21.55 6.56 0.36 0.78 0.01 0.01

An Empirical Study of a CS 1 Studio Experience 48
Table 5.Results of Reliability Check of Coding Categories Coding scheme or category Defined in % Agreement Kappa statistic
11 Mutually-Exclusive Primary Content Categories Table 6 92 0.88 Story Table 7 94 0.85 Visual Elements Table 7 95 0.83 Algorithm Code Table 7 99 0.90 Problem Statement Table 7 99 0.98 Warrant Table 8 99 0.91 Generalization Table 8 99 0.93 Comparison Table 8 98 0.87 Big O Table 8 99 0.88
Table 6. Primary Content Categories Content Category Description
Algorithm Behavior Talk that makes mention of the variables, arrays, and/or step-by-step behavior of the presenters’ algorithms. Note that this category had priority over all other categories; any utterance that referred, even implicitly, to the algorithm was coded in this category.
Algorithm Efficiency Talk that generalizes algorithm behavior, perhaps by enlisting Big-O terminology, in response to the instructor's explicit request for an efficiency analysis.
Story Talk that is focused on the story that presenters used to describe their algorithm, without reference to how the story related to the algorithm or visual elements. Reading a speech bubble qualified as talk in this category, as long as there was no reference to the algorithm. Segments coded in this category were automatically modified by the Story modifier.
Visual Elements Talk that is focused on the visual elements of the presenters’ presentation, without reference to either the story or the algorithm. For example, talk directed toward changing the algorithm in order to improve its visual appearance (e.g., changing a variable to an index) was coded in this category. Segments coded in this category were automatically modified by the VE modifier.
Story-Visual Elements Talk that explicitly maps visual elements to elements of the story, or vice versa. Talk in this category did not refer to the underlying algorithm. Segments coded in this category were automatically modified by both the Story and the Visual Elements modifiers.
Errors Talk that is focused on algorithmic errors in the presenters’ code. Error Fixes Talk that is focused on fixing algorithmic errors in the presenters’ code. Tool
Talk that is focused on aspects of the ALVIS environment or the art supply materials, including talk directed toward identifying or repairing unexpected freezes and/or problems with the display.
Laugh An instance of laughter, which was always transcribed as a distinct segment. (There was no judgment for this category.)
On Task Talk that related to the presentation task being performed (e.g., “Tell me what algorithm you did.” “What’s the big-O of the algorithm?” “How would you fix it?” “That’s all we had.”)
Off Task Any other talk that did not relate to the presentation task being performed.
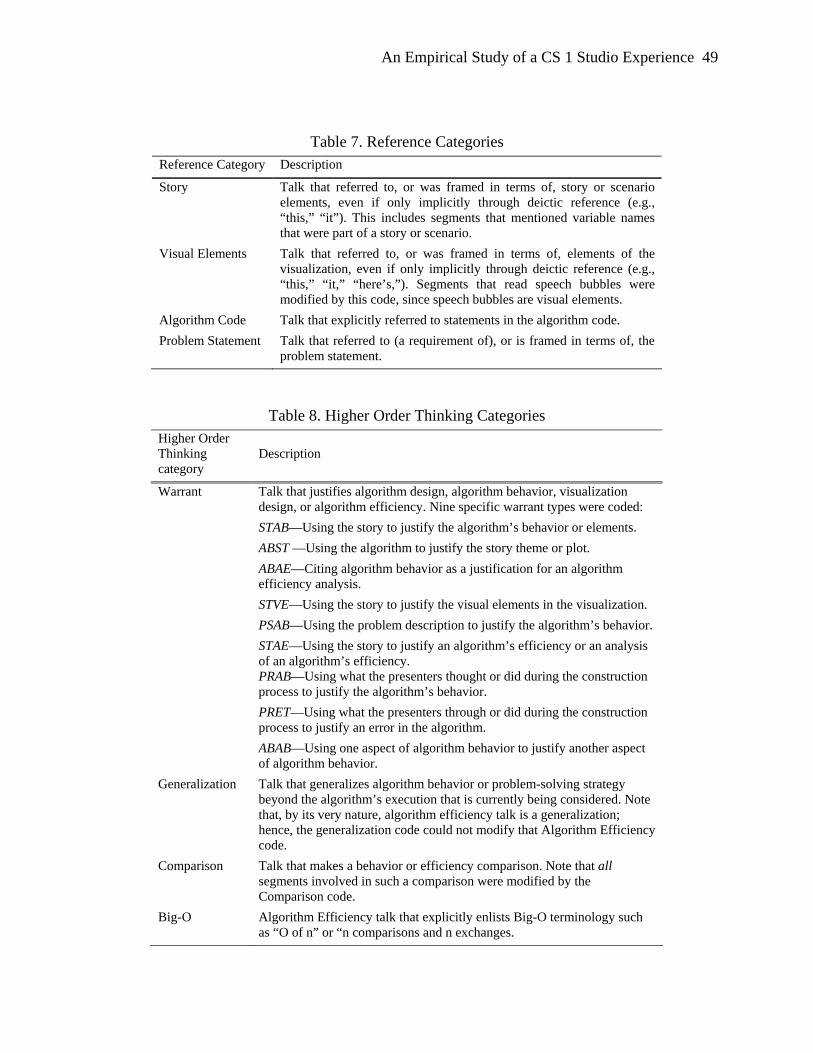
An Empirical Study of a CS 1 Studio Experience 49
Table 7. Reference Categories Reference Category Description
Story Talk that referred to, or was framed in terms of, story or scenario elements, even if only implicitly through deictic reference (e.g., “this,” “it”). This includes segments that mentioned variable names that were part of a story or scenario.
Visual Elements Talk that referred to, or was framed in terms of, elements of the visualization, even if only implicitly through deictic reference (e.g., “this,” “it,” “here’s,”). Segments that read speech bubbles were modified by this code, since speech bubbles are visual elements.
Algorithm Code Talk that explicitly referred to statements in the algorithm code. Problem Statement Talk that referred to (a requirement of), or is framed in terms of, the
problem statement.
Table 8. Higher Order Thinking Categories Higher Order Thinking category
Description
Warrant Talk that justifies algorithm design, algorithm behavior, visualization design, or algorithm efficiency. Nine specific warrant types were coded: STAB—Using the story to justify the algorithm’s behavior or elements. ABST —Using the algorithm to justify the story theme or plot. ABAE—Citing algorithm behavior as a justification for an algorithm efficiency analysis. STVE—Using the story to justify the visual elements in the visualization. PSAB—Using the problem description to justify the algorithm’s behavior. STAE—Using the story to justify an algorithm’s efficiency or an analysis of an algorithm’s efficiency. PRAB—Using what the presenters thought or did during the construction process to justify the algorithm’s behavior. PRET—Using what the presenters through or did during the construction process to justify an error in the algorithm. ABAB—Using one aspect of algorithm behavior to justify another aspect of algorithm behavior.
Generalization Talk that generalizes algorithm behavior or problem-solving strategy beyond the algorithm’s execution that is currently being considered. Note that, by its very nature, algorithm efficiency talk is a generalization; hence, the generalization code could not modify that Algorithm Efficiency code.
Comparison Talk that makes a behavior or efficiency comparison. Note that all segments involved in such a comparison were modified by the Comparison code.
Big-O Algorithm Efficiency talk that explicitly enlists Big-O terminology such as “O of n” or “n comparisons and n exchanges.
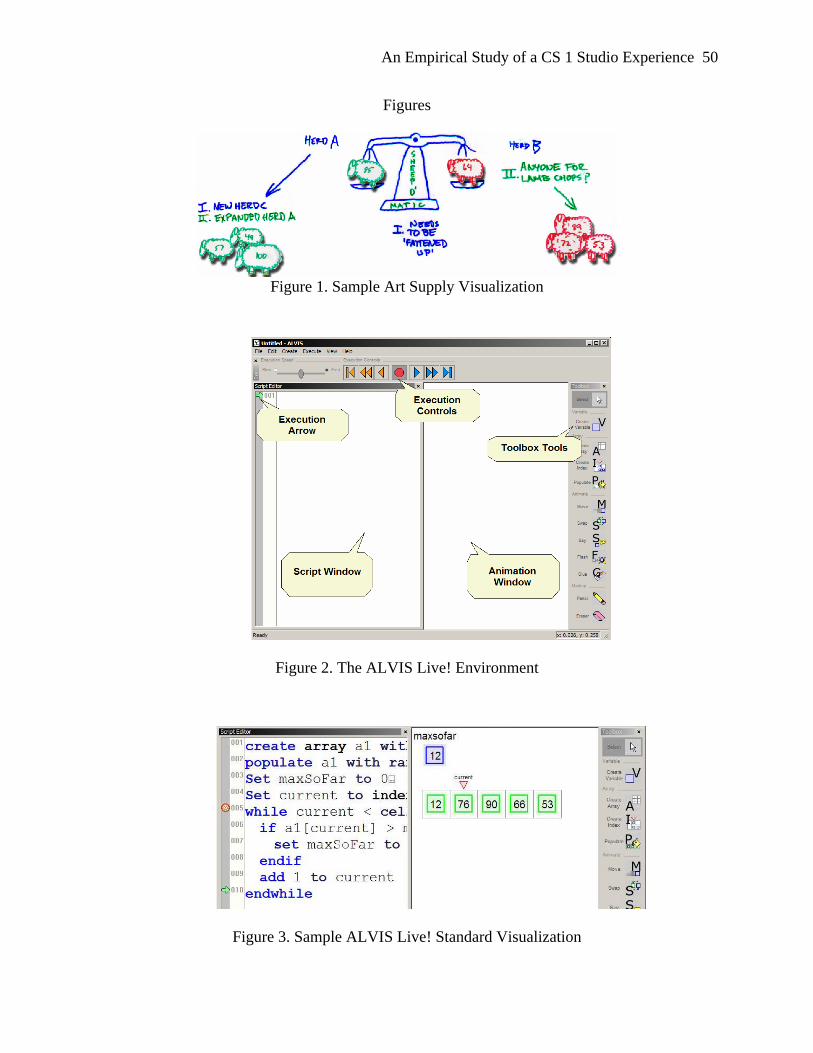
An Empirical Study of a CS 1 Studio Experience 50
Figures
Figure 1. Sample Art Supply Visualization
Figure 2. The ALVIS Live! Environment
Figure 3. Sample ALVIS Live! Standard Visualization

An Empirical Study of a CS 1 Studio Experience 51
Figure 4. Sample ALVIS Live! Custom Visualization
Figure 5. Comparative Breakdown of How Students Spent Their Time on Algorithm Development

An Empirical Study of a CS 1 Studio Experience 52
0%10%20%
30%40%50%60%70%
80%90%
100%
Instructor/TA Student Presenter Student Audience
Participant Type
% o
f utt
eran
ces
Art Supplies
ALVIS
Figure 6. Comparison of Participant Contributions
Algo.
Behav. Algo. Effic. Story Visual
Elts. Error Error Fixes Tool On
Task Art Supplies
Instr./TA 3.5% 5.5% 0.7% 0.0% 0.0% 0.0% 0.0% 3.5% Student 63.6% 10.7% 7.9% 0.9% 0.0% 0.0% 0.0% 2.6%
Total 67.1% 16.3% 8.6% 1.0% 0.0% 0.0% 0.0% 6.2% ALVIS
Instr./TA 7.4% 4.7% 0.5% 1.7% 1.5% 1.5% 2.7% 7.0% Student 40.7% 9.5% 5.5% 3.7% 1.4% 1.2% 2.0% 6.9%
Total 48.1% 14.2% 6.0% 5.5% 2.9% 3.7% 4.8% 13.9%
Primary Content Category
Figure 7. Percentages of Art Supply and ALVIS presentation talk dedicated to each content category. Lines that transect each bar divide the student contribution (which falls below) from
instructor/TA contribution (which falls above) to each category. Statistically significant content category differences (p ≤ 0.05), as detected by Kruskal-Wallis tests, are outlined. Note that the
Error Talk and Error Fixes differences were later rejected by Holm’s procedure.

An Empirical Study of a CS 1 Studio Experience 53
Story Visual
Elements Algorithm
Code Problem
Statement Art Supplies
Instr./TA 0.8% 0.5% 0.2% 0.0% Student 20.9% 15.9% 4.9% 1.7%
Total 21.7% 16.5% 5.1% 1.7% ALVIS
Instr./TA 0.9% 2.3% 2.2% 0.3% Student 11.9% 15.3% 2.7% 2.6%
Total 12.8% 17.6% 4.9% 2.9%
Reference Category
Figure 8. Percentages of Art Supply and ALVIS presentation talk dedicated to each reference category. Lines that transect each bar divide the student contribution (which falls below) from the instructor/TA contribution (which falls above) to each category. Note that there were no
statistically significant reference category differences.
Warrant Generalization Comparison Big-O Art Supplies
Instr./TA 0.0% 0.9% 0.7% 1.4% Student 4.0% 3.1% 4.8% 3.8%
Total 4.0% 4.0% 5.7% 5.2% ALVIS
Instr./TA 0.3% 0.7% 0.5% 1.2% Student 1.6% 2.7% 4.4% 2.3%
Total 2.0% 3.4% 4.9% 3.5%
Higher Order Thinking Category
Figure 9. Percentages of Art Supply and ALVIS presentation talk dedicated to each higher order thinking category. Lines that transect each bar divide the student contribution (which falls below) from the instructor/TA contribution (which falls above) to each category. Statistically significant
higher order thinking category differences (p ≤ 0.05) are outlined.