an empirical study of factors affecting inflation in ... · munich personal repec archive an...
TRANSCRIPT

Munich Personal RePEc Archive
An empirical study of factors affecting
inflation in Republic of Tajikistan
Qurbanalieva, Nigina
College of Asia Pacific Studies, Ritsumeikan Asia Pacific University,
Beppu, Oita, Japan
3 December 2013
Online at https://mpra.ub.uni-muenchen.de/51888/
MPRA Paper No. 51888, posted 05 Dec 2013 19:26 UTC

An empirical study of factors affecting inflation in Republic
of Tajikistan
by
Qurbanalieva Nigina* (
Abstract
This paper investigates the core factors affecting the price level in republic of Tajikistan by using
‘auto regressive distributed lags’ and Johansen-Juselius cointegration models. The empirical
analysis is based on a dataset of demand pull and cost push inflation indicators. We used the
monthly data for a period of 2005 to 2012. The findings of this study reveal that in the long run
exchange rate, world wheat prices, world oil prices and labor supply Granger cause the price
level. Nevertheless, in the short run only world wheat price and labor supply has significant
impact. In case of demand pull inflation, in the long run, GDP gap, remittances inflow, and real
wages are endogenously determined in the system as they significantly affect the price level. But
in the short run, GDP gap, remittances inflow, broad money, government expenditure and real
wages Granger causes the price level. Furthermore, there is a bi-directional Granger causality
between GDP gap and remittances inflow. Also, real wage Granger causes the government
expenditures. The GDP gap Granger causes the real wage, implying the scenario that a major
cause of under production is the low level of employment. Finally the price level also Granger
causes the real wage, is a reflection of a negative relationship between them.
Keywords: Inflation, Tajikistan, Cost push, Demand Pull, ARDL, Cointegration
*Graduate school of Asia Pacific Studies, Ritsumeikan Asia Pacific University, Japan. [email protected]

1. Introduction
Throughout the post-Soviet era the actual challenges to the socio-economic stance of Republic of
Tajikistan was unstable towards inflation as many other transition economies. The economic
backwardness in Tajikistan had recorded two hyperinflation events: the first one was in
April’93–December’93 when cumulative inflation was about 3,635.7% and during August’95–
December’95, it showed 839.2% (Fischer, Sahay, & Vegh, 2002).
Fundamentally, the main causes of chronological high inflation till 2000 were political turmoil,
unhealthy economic conditions, high fiscal deficits, administrative prices and incomplete
reconstruction of the state enterprises. In addition, hyperinflation in the economy of Tajikistan
attributed non-reliance of population to the domestic currency, financial system and further
development of the economy. The vague course policy during the transition time led socio
economic chaos and speed up price level astronomically. Nevertheless, the stabilization and
liberalization policies for the economic rehabilitation had not been strong enough to avoid
hyperinflation during the period under consideration.
It declares constantly that inflation had been reduced from double digit to single but if one looks
at the historical trend of inflation in Republic of Tajikistan, the situation is quite reverse, as
Republic of Tajikistan enjoyed only short episodes of lower inflation level. Specially, the price
level of tradable goods in comparison with the non-tradable goods was more volatile, and
contributed to the rising headline inflation process (Figure 1).

Figure 1: Fluctuation of Annual Inflation in the Republic of Tajikistan during 2000-2012. An
increasing trend is significant during 2002-04 and slight decrease afterward.
Source: Author’s compilation on National Bank of Tajikistan’s data
The volatility of inflation has exposed by the inertial supply and demand shocks. The
fluctuations in World oil price have contributed a significant portion in the production costs both
for food and non-food goods. It stimulates directly being a component of consumer basket for the
measurement of inflation in the country.
The prices of consumer goods push inflation upward because Wheat is one of the main crops in
Republic of Tajikistan. However, a major portion of the consumer basket consist food and
energy items, compounded 57.6% from which share of food products is 21.5% and energy 4.7%
(Al-Eyd et al., 2012). In addition, continues devaluation of domestic currency (Somoni) against
the US dollar during the financial crisis was another factor for the sharp increase in the price
level. Moreover, high remittance inflow gave an additional infusion to the behavior of consumers
in the Tajik economy.

The tendency of evolution of inflation has some unfavorable internal and global economic
conditions as shown in the following table (Figure 2).
Figure: Economic indicators of Tajikistan during 2005-2012
Indicators Unit 2005 2006 2007 2008 2009 2010 2011 2012
GDP growth (%) 6.7 7.0 7.8 7.9 3.9 6.5 7.4 7.5
State budget expenditure (Million Somoni)
1403 1620 3475 5058 5643 6452 8254 9071
Budget (deficit) surplus (Million Somoni)
12 38 221 282 (100) 101 242 525
Total labor resource (Thousand People)
3893 4047 4210 4310 4435 4530 4664 4796
Employment (Thousand People)
2112 2137 2150 2168 2219 2233 2249 2291
Trade (deficit) surplus (Million USD)
(421) (324) (987) (1863) (1559) (1463) (1930) (2419)
Exchange rate (average) (Somoni / USD)
3.1166 3.2984 3.4425 3.4026 4.1427 4.3790 4.6102 4.7627
Broad money (Million Somoni)
1027 1864 3327 3176 4275 5055 7131 8330
Source: Author’s compilation on the data from Banking Statistics Bulletin
The proven danger attached with the volatility inflation as it discourages saving, investment and
absorption of purchasing power. The frequent movements in inflation create an unfavorable
economic condition by deterioration of businesses as well as consumers’ confidence. Similarly,
unexpected variation in inflation level begets its magnitude to jump high. Natural, spontaneous
inflation changes, replace domestic currency to foreign currency in the public and financial
operations, which is one of the original reasons of high dollarization level in Tajikistan. Under
volatile inflation process, credit provided by financial institutions have short term, and to depict
form an upfront barrier of high nominal interest rate in Tajikistan.
The National Bank of Tajikistan could not adopt inflation targeting regime, but its
priority objective is to curb the price stability for the long term. In this regards, the monetary
authority prognosis the rate for ensuring years, but the gap between projected and actual
inflation was high (Figure-3).

Figure 3: The Gap of actual and projected inflation during the period 2003-2012
Source: Author’s compilation on National Bank of Tajikistan’s data
The multidimensional approach analysis of the inflation process and its speed encourage judging
the discretion of economic policies for smoothing volatility of inflation. The inflation in
Republic of Tajikistan was exported by various factors so the evaluation of specific episodes of
problem would be relatively reliable guidelines for central bank’s decisions.
The principle idea of this research is to determine the factors affecting inflation in Republic of
Tajikistan during 2005-2012, by applying ‘auto regressive distributed lags’ (ARDL) model on
the basis of cost-push and demand-pull inflation concepts. This study signifies the issue for
prompt attention to the analysts and policymakers in Republic of Tajikistan and it will be
relatively easy to explain political and economic causes of inflation in Tajikistan. The relevance
of this study aims at comparing with previous studies on the relevant subject. The analytical
consistency with theoretical concepts of inflation in case of transition economies makes it quite
valid. The empirical models are developed according to the indigenous features of the national
economic phenomenon in Tajikistan.
This paper is organized as follows. Section 2 includes the literature review of various points
raised by other researchers. Section 3 addresses on theoretical background of inflation with

controversial views of different schools of thought. Section is based on empirical framework,
data description and significant findings. Section 5 represents our conclusions.
2. Literature Review
The literature survey consists on previous studies on determinants of inflation in Tajikistan and
other transition economies. The limited empirical literature and scanty of analysis on the
macroeconomic issues of Tajikistan depend upon the lack of availability of historical data, non
argumentative and inconsistent results of the analysis in the transformation of economic system
and structural reforms. In general, the bulky dispute of studies focuses on the approach of an
interrelated monetary inflation process in Tajikistan.
Zavkiev (2005) investigated both short run behavior of inflation and long run relationship of
prices with their determinants. In the long run, prices are determined by exchange rate, money
supply, real-output and interest rates. While in the short run, money supply, GDP growth and
interest rate significantly affect the price level. He estimated a model of inflation by the
instrumentality of the Johanson cointegration approach and single equation error correction
model. The coefficient of adjustment for price level to its long-run equilibrium was high and also,
the elasticity of price with respect to exchange rate is the second dominant long run factor
affecting the inflation in Tajikistan. Other significant variables, such as real GDP and interest
rates are semi-elastic in his conclusions.
On the same grounds Tashrifov (2005) uses the structural Vector Autoregressive (VAR) model
to get the dynamic responses of inflation and output with monetary and exchange rate
innovations in the economy of Tajikistan for the period 1996~2003. The main difference
between the short-run and long-run restrictions of his models is that in the short run monetary
and exchange rate innovations have a greater impact on variation in inflation, while in the long
run these policy innovations are more effective in enhancing growth. Thus, the NBT’s monetary
and exchange rate policies have contributed significantly in attaining low inflation and high real
output of Tajikistan’s transitional economy between 1998 and 2003. On the basis of analyses, he
concludes that transitional developing economies can adopt monetary and exchange rate policies

(in particular money supply, interest rate and nominal exchange rate to attain a low level of
inflation.
Recently in the empirical study conducted by Alturki and Vtyrina (2010) demonstrates the
significant impact of broad money growth in determining inflation in both the short and long
terms in Tajikistan. The analysis also shows the strong impact of the exchange rate and
international inflation on local prices. They attributed various transmission mechanisms: interest
rate, exchange rate and narrow credit channel by applying the Vector Error Correction Model
(VECM) and Autoregressive Moving Average Model (ARMA). Though, they encouraged the
limited ability to control the inflation by the National Bank of Tajikistan, and fragile
effectiveness of monetary instruments such as inefficient interest rate channels for exerting
inflation rate.
On the other hand, National Bank of Tajikistan in many analytical reports on ‘Inflation Surveys’
during 2009 to 2012, illustrated that non monetary factors put pressure on prices and core
inflation a tendency of stability. As antecedent, the core inflation is not involved in
administrative/ tariff increase and seasonal as well as external factors. It composed of the modest
change of prices for production under the influence of supply and demand in the domestic
market (National Bank of Tajikistan, 2012).
Theoretically, the sources of inflations’ phenomena exposure basically by the cost push effects
and result of oil or food shocks. After 2007-2008 (Global Financial Crisis) an upsurge in global
food and oil prices transmitted into higher domestic food prices in developing economies,
specially those depends heavily on imports, that is why, sensitivity of global prices in
determination of volatility in domestic inflation becomes more relevant. The impact of external
factors is substantial as the global food prices push domestic inflation to raise in the developing
countries because in the measurement of a basket of consumer’s good the share/ weight of food
is high. During 2011, the international Wheat prices rose about 99.6% but the domestic prices in
Tajikistan increased only 30%-40% (Al-Eyd and Amaglobeli, 2012).

Al-Eyd et el. (2012) investigate the implications of high global food prices on the price level in
Central Asian countries including Tajikistan and concludes that Tajikistan’s economy shows
some significant short-run influence from the global commodity prices especially Wheat price
shock. Their study based on (ARDL) model with seven lags and revealed that an increase in
aggregate demand, nominal exchange rate depreciation, and global food prices have immediate
convertibility on inflation. Moreover, there is an indication of weak institutional framework for
monetary policy since monetary transmission appears limited at short horizons in this case.
Similarly, the fiscal stance averted pressure on price. They recommend support price stability
and guard against pro-cyclicality. A balanced approach is much needed to maintain the essential
support to the vulnerable sectors of the society. Existing social safety nets should be employed to
protect the most vulnerable groups from the pass-through of higher commodity prices.
Previous studies on inflation concerning with similar economic history, institutional structure
and political conditions like Tajikistan allow us to shed light on the possible factors affecting to
the upsurge inflation. As various factors revealed instability in price levels, a broad study on
inflation with the virtue of multidimensional approach modeling are important for determining
the disinflation tools.
After post communism period, shifting from administrative control to price liberalization system
many transition economies faced a disease of hyperinflation due to bumpy and inconsistent
policies. Nevertheless, the price stability still remains the absolute priority task of stabilization
strategy, and some of the countries taking the inflation targeting framework as a satisfactory
regime for lowering inflation performance and macroeconomic stability. On the other hand, the
precondition economic stance makes irrepressible price volatility due to the exposure of external
and internal shocks. In terms of economic specification, economic openness, institutional
structure and financial development etc. provoke inflation inertia during the transitory period.
Adigozalov (2009) examines determinant of inflation in Azerbaijan during 2000-2009 by
applying co integration modeling. The concept of the model targeted to capture external and
internal factors of inflation such as broad money (M3), oil GDP and non-oil GDP, nominal
effective exchange rate, credit and deposit rates. The empirical results show an appreciation of
domestic currency has multiple effects on inflation. In addition, the elasticity of non-oil GDP is
higher than the GDP of oil. Being an exporter of oil, Azerbaijan extract a boom in foreign asset
inflow to the economy that affects to the exchange rate while domestic liquidity expansion
reinforcing inflation process. The spillover effect of external factor, expressed as higher prices in
trading partners and exchange rate depreciation, the lack of independent monetary policy with a
combination of pegged exchange rate, contribute to inflation process in the long run. The short
term inflation shock that exacerbated by supply side bottleneck manifested as production of long
term determinants of inflation in Azerbaijan.
To investigate the impact of globalization and trade openness Meraj (2013) used ARDL
approach within ECM-VAR framework and found a causal relationship between GDP and trade
(exports and imports) and has positive impact of trade on economic growth in case of Least
Developed Countries (LDCs). To study inflation in Georgia, Maliszewski (2003) uses the
empirical analysis within the theoretical framework of aggregate demand and supply in three
markets i.e. goods, exchange rate and money. He found a strong effect of exchange rate
fluctuation on the price level, the behavior of money had also a significant effect in large lag
period. The existing supply shocks in agriculture have a significant short-term impact, while
import prices of oil have a relatively small impact on inflation. This scenario is common for
dollarized and rapidly fluctuated demand for money in the transition economies. Accordingly,
the economic history of a country's enduring hyperinflation provide serious challenges for price
stabilization policy, considering that fact that general public remind the past event, and economy
becomes very sensitive to external and internal shocks.
In the other research segments the variables on the basis of demand pull and cost push theories
were driven a structural inflation function as an equilibrium error correction model
(Leheyda, 2005). She used cointegration approach, which distinguishing the short-term and long-
term effects and develop a general model that embeds with several hypotheses for inflation in
Ukraine for the period 1997~2003. She found that in inflationary process the strong effect of
exchange rate was in a lag of one month. The unit labor cost contributed in the short term
inflation, money demand, purchasing power parity, foreign prices and mark-up relationships are
the factors for long-run upsurge in the price. The Granger causality between the wages and prices

uni-directionally runs from the wages to the prices. He proposed the exchange rate transmission
mechanism instead of using the other channels like interest rate for the price stability.
Ranaweera (2003) by using an error correlation approach investigated the impact of
disequilibrium in domestic markets and external shock on inflation in Uzbekistan for 1994-2000.
The Uzbek economy specified the wide gap between the official and market exchange rate,
imbalance in foreign exchange market. Nevertheless, the disequilibrium in market is not driven
by the prices but foreign exchange market had significant influence on it. The imbalance in the
product and money market also caused the price level to go up.
The structural co-integrating VAR has modeled by Kim (2001) to analyze the impact of
monetary, labor and external sector to the inflation in Poland during 1990-1999. He pointed out
that the labor and external sector are appreciable in inflation pressure. However, after 1994 they
have inversely effected. The appreciation of national currency (Zloty) constrained inflation,
while a cost push effect has driven excessive wage stimulation. The monetary sector had passive
influence to the price fluctuation. He observed that Poland being a transition economy had
initially high inflation (about 580% per annum in 1990) but after the successful implementation
of stabilization programs for the price stability, the inflation rate significantly declined.
Pahlavani and Rahimi (2009) conducted a study to find the determinants of inflation in Iran by
applying ARDL model. Their empirical model is based on the special economic peculiarity
which includes variables as GDP, expected inflation, liquidity, imported inflation and the
dummy variable presenting the effect of Iran/Iraq war on Iran’s economy. The time series data
has used for a period of 1971 to 2006. Their results explain that the liquidity, exchange rate,
expected inflation rate and the rate of imported inflation granger cause inflation in the Iranian
economy. Similarly, the war with Iraq continuing eight years had an effect on the inflation rate in
Iran. The expected inflation has the most significant impact on inflation being a endogenous to
the system. It stipulates structural challenges, transaction cost, and a lack of exchange market.
The second endogenous factor impacted on price level is excessive liquidity which invoked
budget deficits. Moreover, another determinant of inflation is the instability of exchange rate,
which appeared through unification policy.

In a comparative study of inflation in Bangladesh and India over a period of 1979 -2010, Paul
and Zaman (2013) used ‘auto regressive distributed lag’ (ARDL) approach and found the
dominance of monetary effects after counter adjustments of supply shocks. In addition to it, their
study reveals that the inflation rate was rapidly rose whenever the money supply grew in
Bangladesh than in India, implying the scenario of an inconsistent pattern of money supply from
the central banks of both countries. The inflation differential between India and Bangladesh is
mainly due to the significant differential in money supply. They also shed light on Friedman’s
hypothesis that primary factors which affect inflation are monetary factors. The supply shocks
were not explicitly expressed in the upsurge of price. The significance level of economic
indicators i.e. remittances, world inflation and exchange rate were not high. The estimation did
not show the effects of the output gap to the price level in both countries. The dummy variables
in the analysis applied to capture the financial crisis of 1990 in India and the fuel price shock in
2008.
Many transitions and developing countries have adopted inflation targeting (IT) framework,
restrained money supply and practiced pegged exchange rate regime for the purpose of
minimizing the price volatility. However, one of the serious obstacles is a vulnerability to the
external and domestic shocks, and limited monetary policy framework to combat with inflation
phenomenon. The economies experienced hyperinflation in their past history has structural
problems such as independence and transparency of the central banks. Notwithstanding, in
consideration with the advantages of IT, an enhanced credibility of the economic policy, weaken
the impact of inflation expectation and socioeconomic stability. The developing countries like
Armenia, Georgia, Moldova, Albania and Ghana use IT as the anchor of their economic strategy.
Similarly, the building blocks of inflation targeting improve inflation performance and have
limited effects on trade-off between inflation and output. This point exhibits in the empirical
study on the impact of IT to LIC by difference-in-difference and the propensity score matching
approaches. The idea of this study is to define the behavior of economic indicators of inflation
and real GDP. They test the inflation fluctuation and growth volatility before and after IT in 10
emerging markets and 29 less income countries who adopted the IT criteria. The results of their
analysis revealed that in IT framework the inflation was less volatile, growth variability was not
affected and there was very limited evidence of impact on economic growth (Gemayel, Jahan &
Peter, 2011).
Worthwhile to note here that the economies who successfully achieved targeted inflation had
antecedent macroeconomic stance such as healthy financial institution, developed financial
markets, absence of fiscal dominance, independence of the central bank and effective working
transmission mechanism. Another important element is existent technical infrastructure and
methodology, including macroeconomic data for appropriate modeling, forecasting capability of
monetary institute and forecasting ability of possible scenarios / determinant of inflation
(Freedman and Ötker-Robel, 2010).
For an empirical investigation and detailed understanding of the determinants of inflation, the
next section covers the theoretical background and reviews of various schools of thought.
3. Theoretical framework
Various economic scholars and practical experiences have justifies that inflation remains an
actual problem for achieving socio-economic stability and long term economic development,
specially in transition economies. The restraint of inflationary pressure is the primary purpose of
majority of the central banks.
Inflation is an inevitable property of any economy in the world. Infact, it is not a simple rising of
the general price level but more complex natural economic phenomenon within a particular
economic system. It is an indicator of a healthy economy and fall of the market value
(Aurangzeb & Haq, 2012).
“The root of inflation is an endemic reaction of economic policies and diverse factors, and
challenge in one of the direction of economy which interferes in price stability. To tackle the
lack of consistency between fiscal, monetary and exchange rate policies, structural factors (such
as the degree of capital mobility and the existence of wage and price inertia), credibility
problems, and the stance of expectations regarding the policies” (Agenor & Montiel, 1999. p.
398). One of the shortcomings in macroeconomic policy is that it deteriorates the economic
stability such as inflation volatility in the country. In this connection, investigation is useful in
two strands together i.e. the effective policy and the theoretical statement. It is precious to note
here that both strands are logical and clearly interlinked. Any stabilization policy should reflect
the causal nexus associated with each particular evidential theory (Bastos, 2002).
The theoretical considerations formulated in terms of two aspects i.e. demand-pull and cost-push
of inflation make a comprehensive and coherent summary of several explanations for the source
of inflation in the short and long run. The controversies surrounding these two differentiated
theories of inflation are based on the major debates of various orthodox competing schools of
economics and their advocates. Notwithstanding, the stale concepts, they still keep actuality and
widely used in empirical and theory implication by contemporary researchers.
Demand-pull approach: The traditional and most common type of inflation, generated by
forced up inflationary pressures, driven through excess demand for goods and services made up
the expression of components of aggregate demand. Initially the advocates of the classical school,
Keynesian and Monetarist had devised the different principles to understand the demand pull
inflationary process. According to the Keynesians, it is a result of income disturbances and
shocks to the economy such as oil price increases or increase in other input factors. In contrast
with, the Monetarists convince that it occurs because of excess aggregate demand and
inappropriate monetary responses to the economic situations.
According to the Keynesian theory, the demand pull inflation can be interpreted as a positive
relationship between inflation and output and negative with unemployment. Hence, an
acceleration of employment results in increased aggregate demand, which leads to further hiring
by the firms to meet the enhanced demand and to increase the output. But due to the capacity
constraints increase in output will eventually become so small that the price of the goods will rise.
With general acceptance of demand pull mechanism is the Keynesian “inflation gap” model,
which was originated by John Maynard Keynes (1940) and Arthur Smithies (1942). They
explicitly indicate with special reference to the war effects. The integration of inflation pressure
is neither the source of excess or “extra” demand nor any interest rate disequilibrium but the
additional expenditure incurred by the governments. They posit that as the wages lag behind the

prices inflation becomes a redistribution process for which some social class has to pay the
income to fill the “inflationary gap”.
The Keynesians school of thought, virtues the occurrence of demand-pull inflation as the lack of
production capacity during the phase of excess aggregate demand under the assumption of full
capacity utilization or a mismatch in speed of adjustment. On contrary, the Classical economists
look at the change of aggregate money supply which serves for the transaction as a source of
inflation. They argue that the accelerating money supply grows faster than the ability of the
economy to supply the appropriate goods and services. For Monetarists, inflation is exclusively a
monetary phenomenon arises from excessive demand. The concept points out in a perfectly
competitive economy and in the absence of other externalities, market forces operate through the
price mechanism. An optimum allocation of resources is assured when market clearing prices
prevail. The Monetarists convince that the money supply is a “dominant, though not exclusive”
factor which affects prices in both short-run and in long-run, and output in short run only.
Cost-push approach: The higher production costs and productivity maximized, companies
cannot maintain the profit margins by producing the same amounts of goods and services.
Consequently, the increased costs pass on to the final consumers, causes a rise in the general
price level. The long term cost-push effect revives stagflation in the economy. One of the factor
which affect the input pirces to jump up is the scacity of raw materials, abrupt increase in world
prices, including oil and fuel prices. It also occurs due to the vulnerability to the external
economic shocks such as commodity price volatility in the world market and the exchange rate
depreciation. The increase in production costs put an inflationary pressure on the shoulders of
firms because to hire highly qualified labor force the firms need to increase the wages but
successfully tranfers this incidence of production cost to the consumers by raising their output
prices
When an economy approaches full employment the reserves of the unemployed gradually
disappears which encourage the laborers and their representatives to demand an increase in their
wages. In order to prevent this wage increase from eating into profits, employers subsequently
raise their output prices and keep the mark-up intact. Eventually, the real wage brings down

again to with higher food prices. A demand for real wage resistance leads to a wage-price spirals
that propagate through the indexation mechanism. A supply-side shock sparks off a chronic
inflation process in a fully employed economy. The depreciation of domestic currency could
affect the price of imported goods such as foodstuff, raw materials and capital equipments,
specially in a small open economy considered to be a price-taker.
4. Empirical Approach A huge amount of past studies with large scale models explore the conceptual correspondence
and empirical estimates to get the structural factors affecting the inflation trend. In this context,
a specific economic theoretical study consideration allows the elucidating selection of the
variables, which are relevant to spell out inflation within the selected approach. Various
quantitative analyses of inflation and complicated approaches have been developed on the basis
of the global and domestic economy. Sims (1980) criticized strongly in his macroeconomic
models selection and provided the following disadvantages:
1) The economic theory is not rich enough to provide a dynamic specification that
identifies all of the underlying relationships, and
2) The estimation and inference is complicated because endogenous variables may appear
on both sides of the equations, causing simultaneity problems. Thus, vector auto
regression (VAR) models are the most favorable method for the macro econometric in
practice.
4.1 The Data
The data set used in this study is of secondary nature and has been collected from various
sources like National Bank of Tajikistan and WDI of the World Bank. It is a monthly data related
to the factors affecting the price level (both demand and supply side). The dataset comprises
consumer price index (CPI), world oil price (WOP), broad money (BM), exchange rate (EX),
remittance-inflow (RM), real wage (RW), gross domestic product gap (GDP), world wheat price
(WWP), government expenditure (GEX) and economically active population (LBR). The period
under consideration is from January’2005 to December’2012; all values are in million U.S dollar
except CPI.

We transformed all data series into natural logarithm to get more precise results. Microsoft Excel
and econometric software package E-Views have used for the compilation of the data. Figure-1
below shows the graphical trend of all indicators over time.
Figure-1: The graphical pattern of all variables used in this study. (BM) represents broad money, (CPI) is consumer price index, (EX) is exchange rate, (GDP) represents output gap, (GEX) is government expenditure, (LBR) is a proxy for labour supplied and measured through economically active population. While, (RMT), (W), (WOP) & (WWP) represent inflow remittances, real wage, world oil prices and world wheat prices respectively. Since all variables are trending over time, the likelihood of cointegration between them is very high.

BM CPI EX GDP GEX LBR RMT W WOP WWP
Mean 869.11 0.83 3.90 402.21 174.41 2,095.39 171.48 28.44 79.45 250.23
Median 863.81 0.70 3.50 359.47 163.71 2,101.40 166.35 29.01 74.81 235.43
Maximum 1,747.63 6.30 4.77 932.68 423.88 2,188.00 451.09 43.13 132.55 439.72
Minimum 208.15 -0.80 3.04 116.26 18.48 1,871.90 9.45 19.79 41.53 140.88
Std. Dev. 424.04 0.84 0.62 201.97 105.38 69.13 111.18 5.83 22.70 72.81
Skewness 0.12 3.18 0.18 0.73 0.50 -1.11 0.49 0.35 0.30 0.41
Kurtosis 2.10 20.23 1.35 2.75 2.47 4.45 2.54 2.18 2.11 2.18
Jarque-Bera 3.44 1,349.36 11.43 8.69 5.16 28.03 4.68 4.67 4.62 5.38
Probability 0.18 0.00 0.00 0.01 0.08 0.00 0.10 0.10 0.10 0.07
Sum 83,434.53 79.31 374.07 38,612.16 16,743.02 201,157.10 16,462.44 2,729.76 7,627.35 24,022.34
Sum Sq. Dev. 17,082,036.00 67.50 36.78 3,875,254.00 1,055,011.00 453,997.20 1,174,210.00 3,232.62 48,947.30 503,679.70
Observations 96 96 96 96 96 96 96 96 96 96
Table-1: The descriptive statistics of the variables
4.2 The Models
To test the long run relationships between the indicators, one of the best methods in respect with
the time series data is autoregressive distributed lag (ARDL) models. The cointegration analysis
with ARDL may involve lagged values of the dependent variable, current and lagged values of
one or more explanatory variables. This advantage of ARDL compares other regression models,
in variables is to examine differing optimal number of lags and could be applied irrespective
order of integration. The ARDL model has developed by Pesaran and Shin (1997) and further
fine-tuned by by Pesaran (2001).
Starting from the general form of auto regressive distributed lag is as below:
As for this study we specify two different approaches i.e. one to capture the effects of the supply
side determinants and the other to get the relationship of demand side factors with the price level.
The ARDL is very convenient empirical tool for multidimensional diagnosis of the determinant
)1(111
0
tt
m
j
jtj
n
i
itit ECTxyy
catalyst of Tajik inflation with a various lags as well. The theoretical background guides in
selection of endogenous of the models in two following approaches:
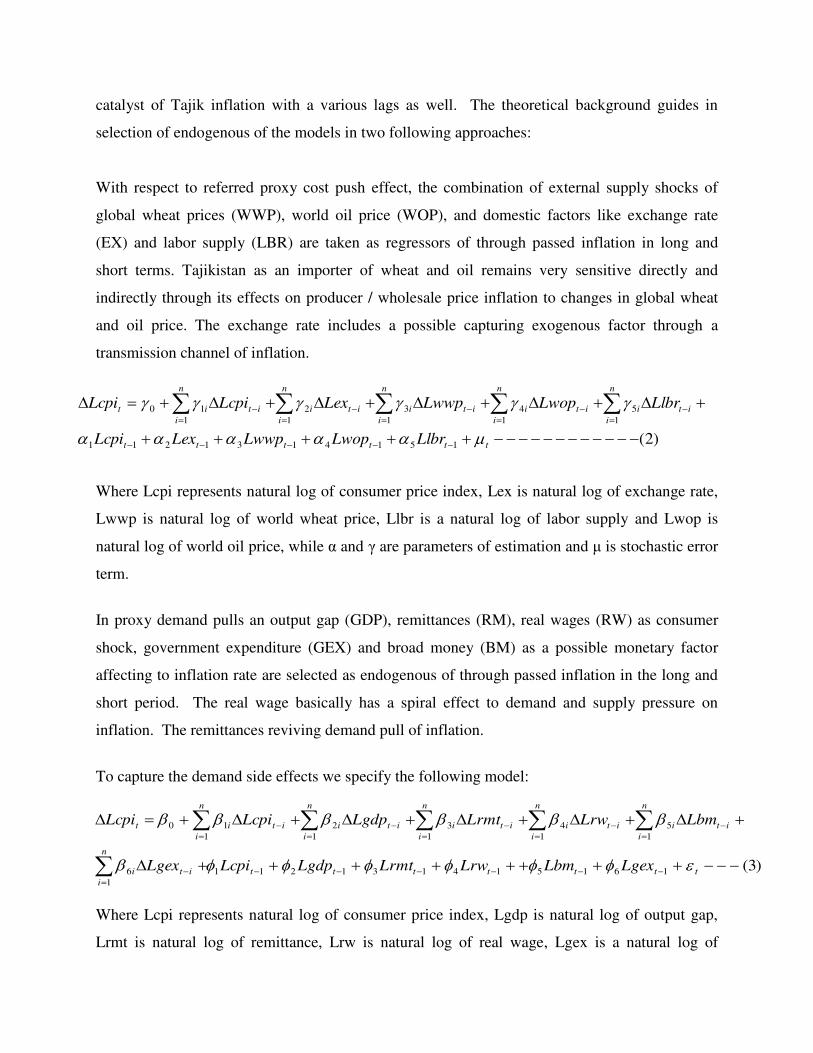
With respect to referred proxy cost push effect, the combination of external supply shocks of
global wheat prices (WWP), world oil price (WOP), and domestic factors like exchange rate
(EX) and labor supply (LBR) are taken as regressors of through passed inflation in long and
short terms. Tajikistan as an importer of wheat and oil remains very sensitive directly and
indirectly through its effects on producer / wholesale price inflation to changes in global wheat
and oil price. The exchange rate includes a possible capturing exogenous factor through a
transmission channel of inflation.
Where Lcpi represents natural log of consumer price index, Lex is natural log of exchange rate,
Lwwp is natural log of world wheat price, Llbr is a natural log of labor supply and Lwop is
natural log of world oil price, while α and γ are parameters of estimation and μ is stochastic error
term.
In proxy demand pulls an output gap (GDP), remittances (RM), real wages (RW) as consumer
shock, government expenditure (GEX) and broad money (BM) as a possible monetary factor
affecting to inflation rate are selected as endogenous of through passed inflation in the long and
short period. The real wage basically has a spiral effect to demand and supply pressure on
inflation. The remittances reviving demand pull of inflation.
To capture the demand side effects we specify the following model:
Where Lcpi represents natural log of consumer price index, Lgdp is natural log of output gap,
Lrmt is natural log of remittance, Lrw is natural log of real wage, Lgex is a natural log of
)2(1514131211
15
14
13
12
110
tttttt
n
i
iti
n
i
iti
n
i
iti
n
i
iti
n
i
itit
LlbrLwopLwwpLexLcpi
LlbrLwopLwwpLexLcpiLcpi
)3(1615141312111
6
15
14
13
12
110
ttttttt
n
i
iti
n
i
iti
n
i
iti
n
i
iti
n
i
iti
n
i
itit
LgexLbmLrwLrmtLgdpLcpiLgex
LbmLrwLrmtLgdpLcpiLcpi

government expenditure and Lbm is natural log of broad money, β and ϕ are parameters of
estimation and ε is random disturbance term.
4.3 Testing for Order of Integration
As a first step we check the order of integration in all of our variables because stochastic
disturbance followed by the series of a non-stationary series does not allow converging to their
long run average value. Therewith, a specious result is returned when we apply regression on
non-stationary series to another non-stationary series. In order to test and convert our variables
into stationary we used Augmented Dickey-Fuller and Phillips-Perron unit root testing
procedures to our variables.
Table-2: Unit root testing through two major testing methods i.e. Augmented Dickey-Fuller and Phillips-Perron. All the variables are non-stationary and become stationary after first differencing except government expenditures, remittances inflow and real wage which requires double differencing to make them stationary.
a: significant at 1% level after second differencing in ADF *, **, *** show 1%, 5% and 10% level
Both ‘augmented dickey-fuller’ (ADF) and ‘phillips-perron’ (PP) tests confirm that all the
variables are integrated of order 1 except lgex, lrmt and lrw which are integrated of order 2. In
Variables
Augmented Dickey-Fuller Philips-Perron
At Level Δ At Level Δ
Constant without Trend
Constant and Trend
Constant without Trend
Constant and Trend
Constant without Trend
Constant and Trend
Constant without Trend
Constant and Trend
Lbm -1.812 -1.650 -10.380* -10.529* -1.792 -1.694 -10.377* -10.500*
Lcpi -4.099* -4.414* -9.853* -9.867* -4.125 -4.308 -11.761* -12.623*
Lex -1.178 -3.118 -3.185*** -3.177*** -0.670 -2.146 -5.311* -5.289*
Lgdp -2.835*** -0.942 -4.503* -4.823* -4.205* -6.697* -14.295* -14.210*
Lgexa -0.570 -1.789 -1.692 -1.619 -5.637* -5.577* -22.628* -22.444*
Llbr -3.252** -4.741* -3.166*** -3.149 -3.251** -4.730* -9.515* -9.578*
Lrmta -2.175 -3.256 -1.969 -2.083 -2.546 -3.277** -7.935* -7.883*
Lrwa -0.911 0.594 -2.406 -2.402 -2.869** -6.290* -17.284* -17.199*
Lwop -2.689*** -3.726** -6.239* -6.218* -2.444 -2.923 -6.269* -6.251*
Lwwp -1.886 -2.263 -7.589* -7.550* -1.629 -1.998 -7.546* -7.506*

order to make I(I) variables stationary, first differencing is appropriate and for I(2) variables
double differencing is required.
4.4 Testing for Cointegration
4.4.1 Model for capturing the determinants of cost push inflation
4.4.1.1. Johansen-Juselius Technique
After getting confirmation about the integration characteristics of our variables, we proceeds
further, to test the cointegration between them. Two cointegration techniques have used in this
study i.e. Johansen-Juselius (1990) and ‘auto regressive distributed lag’ (ARDL) developed by
Pesaran-Smith (2001).
To test the cointegration between variables through Johansen-Juselius (1990) technique, it is
required to establish a ‘vector auto regression’ (VAR) model, in order to identify the number of
cointegrating vectors by trace and maximum Eigen value tests’ statistics.
As a first step we identify the lag length in our VAR model through the specified criterion.
‘likelihood ratio’ (LR), ‘final prediction error’ (FPE), ‘akaike information criterion’ (AIC), and
‘hannan-quinn information criterion’ (HQ) proposed two lags. Nevertheless, ‘schwarz
information criterion’ (SIC) suggests one lag. Initially we choose three lags on the basis of
abovementioned criteria for the VAR model of this study.
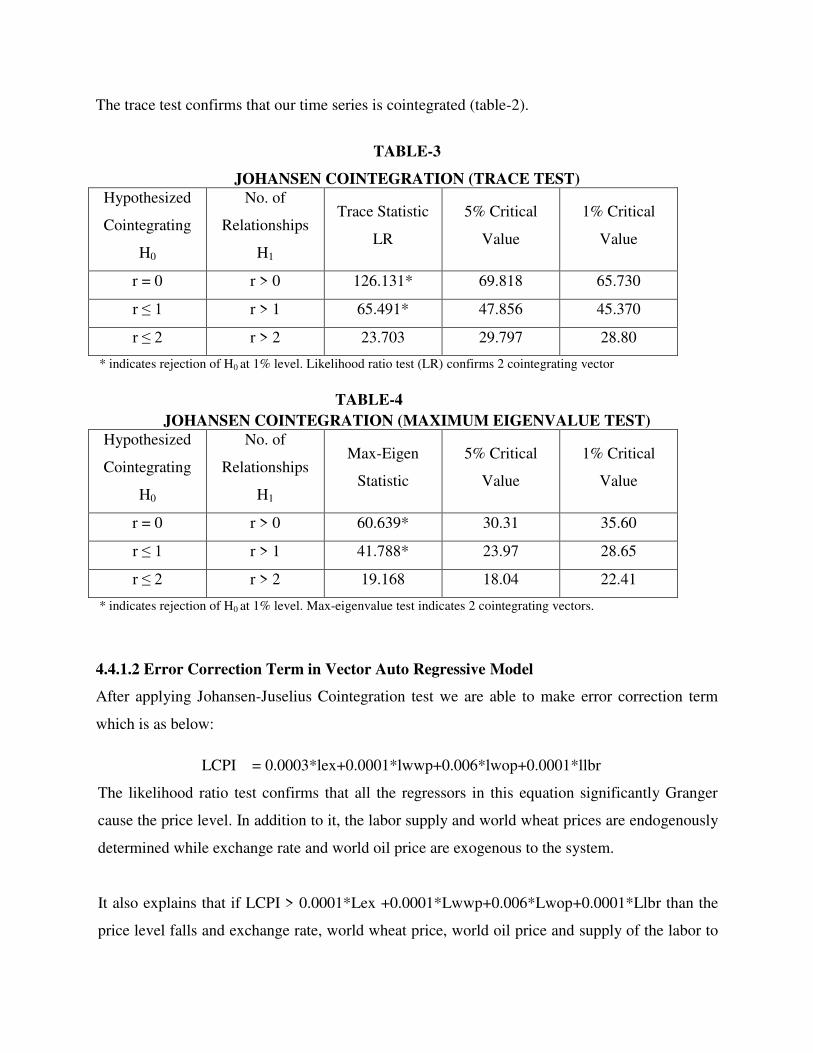
The trace test confirms that our time series is cointegrated (table-2).
TABLE-3
JOHANSEN COINTEGRATION (TRACE TEST)
Hypothesized
Cointegrating
H0
No. of
Relationships
H1
Trace Statistic
LR
5% Critical
Value
1% Critical
Value
r = 0 r > 0 126.131* 69.818 65.730
r ≤ 1 r > 1 65.491* 47.856 45.370
r ≤ 2 r > 2 23.703 29.797 28.80
* indicates rejection of H0 at 1% level. Likelihood ratio test (LR) confirms 2 cointegrating vector
TABLE-4
JOHANSEN COINTEGRATION (MAXIMUM EIGENVALUE TEST)
Hypothesized
Cointegrating
H0
No. of
Relationships
H1
Max-Eigen
Statistic
5% Critical
Value
1% Critical
Value
r = 0 r > 0 60.639* 30.31 35.60
r ≤ 1 r > 1 41.788* 23.97 28.65
r ≤ 2 r > 2 19.168 18.04 22.41
* indicates rejection of H0 at 1% level. Max-eigenvalue test indicates 2 cointegrating vectors.
4.4.1.2 Error Correction Term in Vector Auto Regressive Model
After applying Johansen-Juselius Cointegration test we are able to make error correction term
which is as below:
LCPI = 0.0003*lex+0.0001*lwwp+0.006*lwop+0.0001*llbr
The likelihood ratio test confirms that all the regressors in this equation significantly Granger
cause the price level. In addition to it, the labor supply and world wheat prices are endogenously
determined while exchange rate and world oil price are exogenous to the system.
It also explains that if LCPI > 0.0001*Lex +0.0001*Lwwp+0.006*Lwop+0.0001*Llbr than the
price level falls and exchange rate, world wheat price, world oil price and supply of the labor to

rise to restore the equilibrium. In the price level each month 58.83% of the discrepancy from the
long run equilibrium is corrected.
4.4.1.3 Auto Regressive Distributed Lags (ARDL)
As a first step we check the cointegration between variables by using the ‘auto regressive
distributed lag’ (ARDL) model.
From equation (2) we establish the following mode:
If 054321 then it signifies that there is no cointegration among the
variables.
TABLE-5
ARDL COINTEGRATION TESTING
F/Wald-Test of zero restriction
The Johansen-Juselius test confirms 2 cointegration vectors in our equation which also confirms
by the ARDL test. It rejects the null hypothesis of ‘no cointegration’ between variables as the
estimated F-value lies outside the upper bound of the critical values.
)4(1514131211
15
14
13
12
110
tttttt
n
i
iti
n
i
iti
n
i
iti
n
i
iti
n
i
itit
LlbrLwopLwwpLexLcpi
LlbrLwopLwwpLexLcpiLcpi
F TEST VALUE = 5.68 P-value (0.0001)
CRITICAL VALUE I(0) I(I)
5% 2.86 4.01
10% 2.45 3.52
Critical values from table C1-iii of Pesaran et.al (2001)

4.4.1.4 Granger Causality in ARDL
After getting the confirmation of cointegration we proceed further and test the Granger causality
in our model variables. The empirical results are as below:
TABLE-5
Granger Causality in ARDL
Likelihood Ratio Test Parenthesis ( ) indicates p-values of F-statistics and p-values for student t-statistics in case of ECT
Variable ∆Lcpi ∆Lex ∆Lwwp ∆Lwop ∆Llbr
Lags ∆Lcpi 1.289(0.287) 0.082(0.969) 0.071(0.974) 1.314(0.277) 0.499(0.684)
Lags ∆Lex 0.386(0.764) 2.106(0.108) 0.775(0.512) 2.003(0.122) 0.221(0.881)
Lags ∆Lwwp 2.894(0.042) 0.629(0.599) 2.566(0.062) 1.001(0.298) 1.051(0.374)
Lags ∆Lwop 0.292(0.831) 0.020(0.996) 0.731(0.537) 3.958(0.012) 0.589(0.624)
Lags ∆Llbr 2.911(0.042) 0.757(0.522) 0.274(0.843) 1.605(0.197) 0.021(0.995)
ECTt-1 2.543(0.055) 0.582(0.661) -0.013(0.937) -0.216(0.141) 0.013(0.485)
4.4.1.5 Empirical Results
To test the factors affecting the price level through the supply side cost push effects by using two
econometric approaches i.e. Johansen-Juselius and Auto Regressive Distributed Lags (ARDL).
The empirical results of this study are not reflected that in the long run all the right hand side
variables Granger cause the price level. Nevertheless, in the short run world wheat price and
labor supply Granger cause the price level significantly. This imply the fact that in the case of
Tajikistan the world wheat price has gigantic influence because it secondarily affect the domestic
wheat price which is a major candidate in the calculation of consumer price index. Secondly, the
supply of labor has a huge role in the price level as the rural-urban migration disintegrates the
equilibrium in the labor market. Theoretically speaking shortage of labor affects the factor price
in the short run and possibly influence the general price level which is also confirms by the
Granger causality test of this study.
4.4.2 Model for capturing the determinants of demand pull inflation
4.4.2.1. Johansen-Juselius Cointegration
We have already established the order of integration between the variables used to capture the
demand pull effects. We proceed further by using the equation-3 for the empirical analysis by
following the same pattern we used to get the cost push inflation determinants.
We formulate a VAR and used the lag length as specified by the information criteria. All the
information criterions i.e. ‘likelihood ratio’ (LR), ‘final prediction error’ (FPE), ‘akaike
information criterion’ (AIC), ‘hannan-quinn’ (HQ) and ‘schwarz information criterion’ (SIC)
suggest eight lags are appropriate for this VAR. Consequently, we choose eight lags on the basis
of abovementioned criteria.
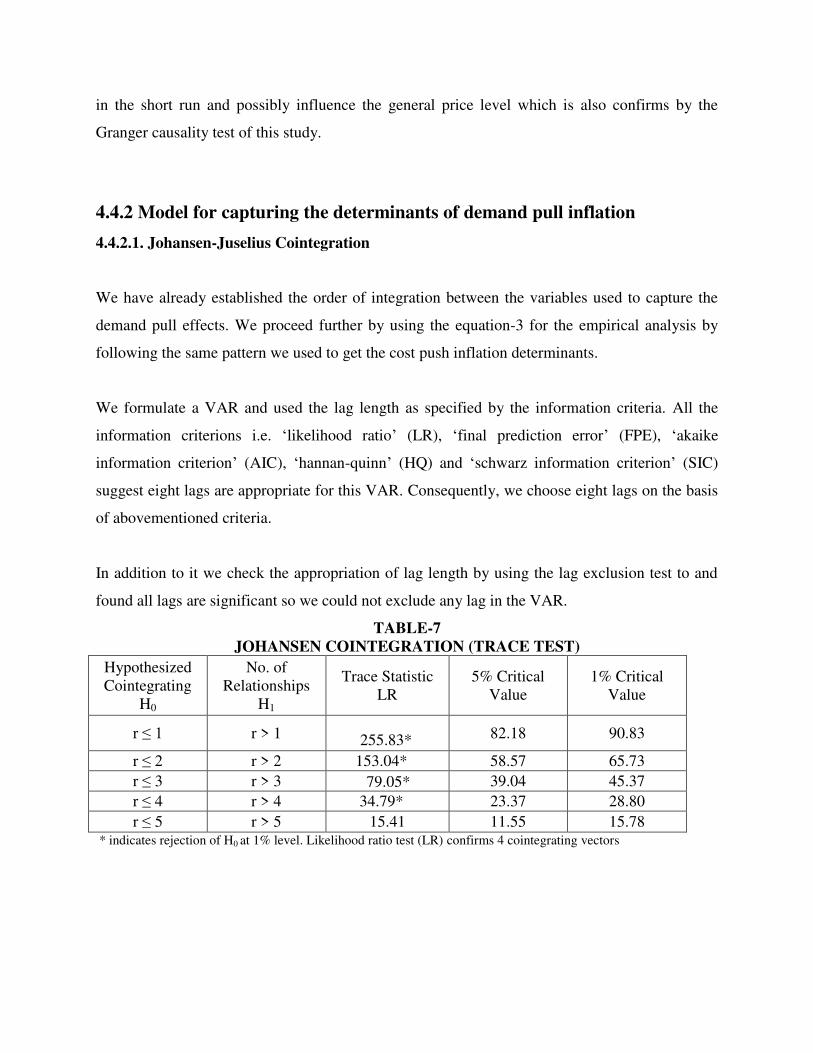
In addition to it we check the appropriation of lag length by using the lag exclusion test to and
found all lags are significant so we could not exclude any lag in the VAR.
TABLE-7
JOHANSEN COINTEGRATION (TRACE TEST)
Hypothesized Cointegrating
H0
No. of Relationships
H1
Trace Statistic LR
5% Critical Value
1% Critical Value
r ≤ 1 r > 1
255.83*
82.18 90.83
r ≤ 2 r > 2 153.04*
58.57 65.73 r ≤ 3 r > 3 79.05*
39.04 45.37 r ≤ 4 r > 4 34.79*
23.37 28.80 r ≤ 5 r > 5 15.41 11.55 15.78
* indicates rejection of H0 at 1% level. Likelihood ratio test (LR) confirms 4 cointegrating vectors

TABLE-8
JOHANSEN COINTEGRATION (MAXIMUM EIGENVALUE TEST)
Hypothesized Cointegrating
H0
No. of Relationships
H1
Max-Eigen Statistic
5% Critical Value
1% Critical Value
r ≤ 1 r > 1
102.79*
36.65 42.05
r ≤ 2 r > 2 73.99*
30.31 35.60 r ≤ 3 r > 3 44.25*
23.97 28.65 r ≤ 4 r > 4 19.37
18.04 22.41 r ≤ 5 r > 5 15.02 11.55 15.78
* indicates rejection of H0 at 1% level. Max-eigenvalue test indicates 3 cointegrating vectors
4.4.2.2. Granger Causality in Johansen-Juselius Model
We established our error correction term after normalization of variables to get the Granger
causality in ECM-VAR in Johansen-Juselius model. The empirical results shown inconsistent
pattern as in the short run we could not get any conclusive evidence of Granger causality in our
demand pull inflation equation. We further check our results by using ARDL for demand pull
effects:
4.4.2.3. Auto Regressive Distributed Lags (ARDL)
We iterate the same procedure which we used in our cost push model for the specification of
auto regressive distributed lags (ARDL). Following the equation (3) for the testing of the
Granger causality:
ttttttt
n
i
iti
n
i
iti
n
i
iti
n
i
iti
n
i
iti
n
i
itit
LgexLbmLrwLrmtLgdpLcpiLgex
LbmLrwLrmtLgdpLcpiLcpi
1615141312111
6
15
14
13
12
110)3(

If 0654321 then it signifies that there is no cointegration among the
variables.
TABLE-9
ARDL COINTEGRATION TESTING
F/Wald-Test of zero restriction
The empirical results could not establish the cointegration in ARDL as the estimated F-value lies
in inconclusive region. Though, we proceed further and check our error correction model to get
the idea about cointegration between variables.
4.4.2.4 Granger Causality in ARDL
After getting the confirmation of cointegration we proceed further and test the Granger causality
in our model variables. The empirical results are as below:
TABLE-10
Granger Causality in ARDL
Likelihood Ratio Test
Parenthesis ( ) indicates p-values of F-statistics and p-values for student t-statistics in case of ECT
Variable ∆Lcpi ∆Lgdp ∆Lrmt ∆Lbm ∆Lgex ∆Lrw
Lags ∆Lcpi 1.228(0.315) 1.061(0.411) 0.293(0.963) 0.746(0.650) 1.967(0.080) 1.920(0.080)
Lags ∆Lgdp 9.877(0.000) 7.436(0.000) 4.540(0.008) 0.543(0.656) 1.869(0.152) 3.784(0.018)
Lags ∆Lrmt 6.715(0.000) 2.141(0.072) 3.912(0.004) 0.596(0.703) 1.427(0.231) 0.583(0.743)
Lags ∆Lbm 6.697(0.003) 0.781(0.465) 0.390(0.679) 0.164(0.849) 0.249(0.780) 0.131(0.877)
Lags ∆Lgex 12.879(0.001) 1.755(0.193) 0.122(0.728) 0.483(0.491) 0.144(0.706) 0.0005(0.982)
Lags ∆Lrw 5.506(0.025) 0.135(0.714) 0.924(0.342) 0.016(0.899) 18.813(0.000) 0.356(0.554)
ECTt-1 0.870(0.000) -0.866(0.000) -0.370(0.016) 0.011(0.781) 0.103(0.743) -0.279(0.000)
F TEST VALUE = 2.805 P-value (0.1174)
CRITICAL VALUE I(0) I(I)
5% 2.62 3.79
10% 2.26 3.35
Critical values from table C1-iii Pesaran et.al (2001)

5. Conclusions
Over a few years inflation remains a big problem for the economy of Republic of Tajikistan so
that this study investigates the prime factors affecting the price level by using the econometric
techniques namely ‘auto regressive distributed lags’ (ARDL) and Johansen-Juselius
cointegration within the VAR framework. We used the dataset which comprises the demand pull
and cost push inflation indicators. We used monthly data for a period of 2005 to 2012 for
Granger causality tests to know the exact impact of demand and supply side factors to the price
level.
To test the factors affecting the price level through the supply side cost push, our empirical
results suggest that in the long run exchange rate, world wheat prices, world oil prices and labor
supply are endogenously determined in the system as their error correction terms are significant
except broad money and government expenditures. Nevertheless, in the short run world wheat
price and labor supply Granger cause the price level significantly. This imply the fact that in the
case of Tajikistan the world wheat price has gigantic influence because it secondarily affect the
domestic wheat price which is a major candidate in the calculation of consumer price index.
Secondly, the supply of labor has a huge role in the price level as the rural-urban migration
disintegrates the equilibrium in the labor market. The shortage of labor affect the factor prices in
the short run and possibly influence the general price level which also confirms the Granger
causality in their relationship.
For Demand side determinants of inflation, our results are quite consistent and suggest that in the
long run, GDP gap, remittances inflow, and real wages are endogenously determined in the
system as they significantly affect the price level. But in the short run, GDP gap, remittances
inflow, broad money, government expenditure and real wages Granger causes the price level.
Furthermore, there is a bi-directional Granger causality between GDP gap and remittances
inflow. Also, real wage Granger causes the government expenditures implying more fiscal
burden on government. The GDP gap Granger causes the real wage, implying the scenario that a
major cause of under production is the low level of employment. Finally the price level also
Granger causes the real wage, is a reflection of a negative relationship between them.

References:
Adigozalov, S. 2009. Determinant of inflation in Azerbaijan: A cointegration Approach, Baku.
Agenor, P. and Montiel, P. 1999. Development Macroeconomics. Princeton University Press,
New Jersey, United Kingdom.
Al-Eyd, A., Amaglobeli, D., Shukurov, B and Sumlinski, M. 2012. Global Food Price Inflation
and Policy Responses in Central Asia. IMF Working Paper Series No. WP/12/86.
Source: http://www.imf.org/external/pubs/ft/wp/2012/wp1286.pdf (Accessed on
September 23, 2013).
Alturki, F. and Vtyurina, S. 2010. Inflation in Tajikistan: Forecasting Analysis Monetary Policy
Challenges. IMF Working Paper Series No. WP/10/17. Source:
http://www.imf.org/external/pubs/ft/wp/2010/wp1017.pdf. (Accessed on 10th July 2013).
Arndt, H.W. 1985. The Origins of Structuralism, World Development 13(2): 151-159.
Asian Development Bank Report. 2011. Global Food Price Inflation and Developing Asia.
Source:http://203.131.219.245/oldbranches/n_puey/news/world%20bank/Global%20Food
%20Price%20Inflation%20and%20Developing%20Asia.pdf (Accessed on 27th September,
2013).
Aurangzeb and Ul-Haq, A. 2012. Determinants of Inflation in Pakistan. Universal Journal of
Management and Social Science №2(4).
Bastos, C. 2002. Price stabilization in Brazil: a classical interpretation for an indexed nominal
interest rate economy. University of Hong Kong Libraries, ISBN/ISSN: 0493782419.
Source: http://sunzi.lib.hku.hk/ER/detail/hkul/2679635 (Accessed on 14 July, 2013).
Bernholz, P. 2003. Monetary Regimes and Inflation: History, Economic and Political
Relationships. United Kingdom: Edward Elgar Publishing Limited.
Cagan, P. 1956. The Monetary Dynamics of Hyperinflation: In Study in the Quantity Theory of
Money, edited by Milton Friedman. University of Chicago Press, Chicago.
Cheng, H. L. and Papi, L. 1997. An Econometric Analysis of the Determinant of Inflation in
Turkey. IMF Working Paper Series No. WP / 97 / 170 Source:
http://www.imf.org/external/pubs/ft/wp/wp97170.pdf (Accessed on 25th May, 2013).

Dalziel, P. 2001. Money, Credit and Price Stability. London: Routledge. Taylor and Francis
Group. EC 4P 4EE.
Domac, I. and Elbirt. 1999. The determinant of inflation in Albania, Policy Research Working
Paper, World Bank. Washington DC.
Fischer, S., Sahay, R. and Vegh, C. 2002. Modern Hyper and High Inflations. Journal of
Economic Literature, Vol. XL, 837-880.
Freedman, C., and Otker-Robel, I. 2010. Important Elements for Inflation Targeting for
Emerging Economies. IMF Working Paper Series No. WP/10/113. Source:
http://www.imf.org/external/pubs/ft/wp/2010/wp10113.pdf (Accessed on 14th
November, 2013).
Gemayel, E., Jahan, S. and Peter, A. 2011. What Can Low-Income Countries Expect from
Adopting Inflation Targeting? IMF Working Paper Series No. WP/11/276. Source:
http://www.imf.org/external/pubs/ft/wp/2011/wp11276.pdf (Accessed on 14th
November, 2013).
Hansen, B. 1998. A study in the theory of inflation. Georgy Allen & Unvin Ltd, London.
IMF. 2013. General Data Dissemination System. Source:
http://dsbb.imf.org/Pages/GDDS/DQAFViewPage.aspx?ctycode=TJK&catcode=NA
G00&Type=CF (Accessed on 13th November, 2013).
International Bank for Reconstruction and Development Bank / World Bank. 1993. China: The
achievement and Challenge of Price Reform. A World Bank country study.
Washington, D.C., USA.
Kibritçioğlu, A. 2002. Causes of Inflation in Turkey. A Literature Survey with Special Reference
to Theories of Inflation. Forthcoming in: Inflation and Disinflation in Turkey 43-76.
Kim, B. 2001. Determinants of Inflation in Poland: A Structural Cointegration Approach,
Discussion Papers №16. Iinstitute of economics in Transition BOFIT. Bank of
Finland. ISBN 951-686-815-0, ISSN 1456-5889.
Leheyda, N. 2005. Determinants of Inflation in Ukraine: a Cointegration Approach, Center for
Doctoral Studies in Economics and Management (CDSEM), University of
Mannheim.

Maliszewski, W. 2003. Modeling of Inflation in Georgia. IMF Working Paper Series No.
WP/03/212. Source: http://www.imf.org/external/pubs/ft/wp/2003/wp03212.pdf
(Accessed on 9th November, 2013).
Meraj, M. 2013. Impact of globalization and trade openness on economic growth in Bangladesh,
Ritsumeikan Journal of Asia Pacific Studies (RJAPS) 32: 40-50.
National Bank of Tajikistan’s Inflation Review. 2012. Source:
http://nbt.tj/files/Monetary_policy/obzor_infl/obzor_infl_12_2012_tj.pdf (Accessed
on 9th November, 2013).
Parkin, M. 1994. The theory of inflation. The international Library of critical writing in
economics. An Elgar Reference collection. Galliard (Printers) Ltd, Great Yarmouth.
Great Britain.
Paul, B. and Zaman, H. 2013. When and why does Bangladesh’s Inflation differ from Indian’s?
Working Paper Series No. 1301. Chief Economist Unit (CEU). Source:
http://www.bb.org.bd/pub/research/workingpaper/wp1301.pdf. (Accessed on 12th
November, 2013).
Ranaweera, T. 2003. Market Disequilibria and Inflation in Uzbekistan, 1994-2000. World Bank
Policy Reserch Paper 3144. Source:
http://elibrary.worldbank.org/doi/pdf/10.1596/1813-9450-3144 (Accessed on 13th
November, 2013).
Romer, D. 2006. Advanced Macroeconomics. Third Edition. New-York: McGraw-Hill / Irwin
Companies, Inc.
Silva, L. A. V. 2008. A Monetarista - Structuralist Debate on Inflation. Revista Chilena de
Economía y Sociedad. UTEMP.
Sims, C. A. 1980. Macroeconomics and Reality, Econometerica 48(1):1-49, Source:
http://www.ekonometria.wne.uw.edu.pl/uploads/Main/macroeconomics_and_reality.
pdf (Accessed on 13th November, 2013).
Statistical Agency under the President of the Republic of Tajikistan. 2012. Socioeconomic
Situation in Tajikistan for January’12-February’12.

Tashrifov, M. 2005. Monetary Policy Model of Tajikistan: A Structural Vector Autoregression
Approach. Working Papers. Asia Pacific School of Economics and Government.
Australian National University.
Wiedmann, M. 2011. Money, Stock Price and Central Banks. A Cointegrated VAR Analysis.
Physica-Verlag. A Sprnger Company. Germany.
World Economic Outlook. 2011. Tensions from the Two-Speed Recovery: Unemployment,
Commodities, and Capital Flows. IMF. Source:
http://www.imf.org/external/pubs/ft/weo/2011/01/index.htm (Accessed on 13th
November, 2013).