an empirical study of the industrial marketing mix / jean
TRANSCRIPT


LIBRARY
OF THE
MASSACHUSETTS INSTITUTE
OF TECHNOLOGY


sis
WORKING PAPER
ALFRED P. SLOAN SCHOOL OF MANAGEMENT
MASS. inST. TECH.
DEC 9 75
nFVJEY LiBRARV,
AN EMPIRICAL STUDY OF THE INDUSTRIAL MARKETING MIX
Jean-Marie Choffray
WP 800-75 July 1975
MASSACHUSETTSINSTITUTE OF TECHNOLOGY
50 MEMORIAL DRIVE
CAMBRIDGE, MASSACHUSETTS 02139


AN EMPIRICAL STUDY OF THE INDUSTRIAL MARKETING MIX
Jean-Marie Choffray
WP 800-75 July 1975

M-l-T. LIBRARIES
DEC 10 1975
RECEIVED

-2-
Acknowledgt ments
I wish to thank Professor Gary L. Lilian of the Sloan School of
Management at M.I.T. He not only provided the data and the necessary
computer time to analyze it, he also offered much useful advice on how
the data might be analyzed and the results presented.
Thanks are also due to Professor Alvin J. Silk for his critical
comments on an earlier draft of this paper.
0725818


-3-
ABSTRACT
An empirical study is made of how personal selling, advertising and
technical service expenditures are associated with industrial products' gross
contribution to profit. The implications of a multiplicative model relat-
ing the average gross contribution per customer to industrial marketing
spending rates are discussed. Robust regression is used to estimate the
model's parameters on the basis of a sample of 50 industrial products.
Results indicate that personal selling expenditures are the single
most important factor of the industrial marketing mix. They do not support
the hypothesis that increasing returns to scale exist in industrial marketing.
They also shed some light on the possible substitution between personal
selling and industrial communication expenditures.


-4-
Introduction
The relationship of Industrial marketing activities to a product's
contribution to profit has not been well established. Recently, a review
appeared of the existing information on the effectiveness of industrial
marketing activities, particularly the effectiveness of industrial adver-
tising in terms of sales and profits (see Lllien et al. [1]). The authors
concluded that only a limited number of empirical studies were available.
They did Identify evidence of economies of scale, threshhold effects and
interaction effects between industrial communication and personal selling.
This paper investigates on the basis of data collected through the
ADVISOR research project [2] how personal selling, advertising and technical
service expenditures are related to Industrial products' gross contribution
to profits.
Our decision to use the gross contribution to profits as a measure
to be related to these "budgeted" marketing activities comes from the fact
that the gross contribution to profits is made up of three components —
unit price, average total cost, and quantity sold which could all be influenced
by the level of these marketing activities.
The relation between a product price and the company's marketing
activities has been analyzed by Palda [3]. He considers that any pricing
decision must be taken against the background of the firm's total marketing
strategy, so that a product price appears more as a dependent variable than
as an Independent one. Recently, Lambin [4], argued that "consumers exhibit
lower price responsiveness in high-intensity advertising markets than they
do when the advertising level is low. Companies therefore have the opportunity

-5-
to charge above-normal prices." Lambin mentions, however, that this oppor-
tunity tends to be limited by the use of price controls. The question is:
is this comment applicable to industrial markets?
The relation between the quantity of a product sold and the company's
marketing activities is one of the basic postulates of marketing theory
and often the justification for these expenditures. If we accept this
postulate for industrial products, the relation between the firm's marketing
activities and the average cost of production is clearer. Usually when
the company operates below capacity, an increase in the quantity produced
leads to a decrease in the average product cost.
In this paper, we relate the average gross contribution of industrial
products, on a customer basis, to the spending rate for personal selling,
technical service, and advertising activities. Our results indicate that
a substantial part of the variation in industrial products' gross contribu-
tion to profit may be explained with these three marketing activities. As a re-
gression model is only descriptive, dealing with measures of association
rather than causal relationships [5], a strong interpretation of our results
needs the assumption that industrial marketing activities do indeed affect
a product's gross contribution to profit.
Interpreted this way, our results underline the importance of personal
selling in the industrial marketing mix. They do no support the hypothesis
that increasing returns to scale exist in industrial marketing. Finally,
they allow us to speculate about substitution between personal selling and
advertising expenditures.


-6-
Data Collection Procedure
Our analysis has been performed on data received from five out of
twelve industrial companies that participate in the ADVISOR research project.
Each of these companies was requested to provide information about as many
industrial products as it could. No special requirements were set concerning
the characteristics of the products to be selected.
Data were collected by questionnaire. The specific information re-
quested arose from a series of personal interviews with industrial marketing
managers about the key variables that they take into account in budgeting
decisions. More than 190 elements of information were introduced in the
questionnaire. The questions were grouped into six broad areas;
- Company characteristics
- Product qualities
- Cost; profit information
- Growth, production and distribution
- Use; customer and competitive characteristics
- Advertising, personal selling and technical service
Due to the confidentiality of some of the requested information,
companies were allowed to multiply actual numbers by a "security coefficient."
'iliis protection mechanism introduces a small random component in some of the
data so that the actual amount is only known with a 10% margin. We expect
the effect of this random component on our results is limited due to the
way we defined the variables.
Our sample consists of 50 industrial products that range from raw
materials and chemicals to more elaborate products such as machinery and
equipment. Most are in one of the first three stages in the product life


-7-
cycle and are associated with oligopolistic markets.
Definition of the Variable Under Study and PreliminaiTr Analysis
Our purpose is to study the relationship between industrial products'
gross contribution to profits and the associated level of personal selling,
technical service and advertising expenditures. We have attempted to define
these variables in such a way that they would have both an operational mean-
ing within the industrial marketing decision making context, and could be
estimated on the basis of the available data.
Our analysis has been limited to mainly seven variables whose definitions
follow:
A ; A _ refers to the Advertising spending rate per potentialcustomer in 1973 and 1972 respectively.
P ; P _ refers to the P^ersonal selling spending rate per poten-^ ^ tial customer in 1973 and 1972.
S ; S _ refers to the technical £ervice spending rate peractual customer in 1973 and 1972.
G refers to the average gross contribution to profitper actual customer in 1973. This amount is obtainedby the following relation
G= (p-c)q/n , wheret *^t t ^t t
p = average unit price for the product in 1973.
c= average total cost of production for the product,
only excluding marketing costs.
q = total quantity sold in 1973.
n = actual number of customers In 1973.t


-8-
In addition to these seven variables, we defined several dummy vari-
ables to control for a stage in the life cycle effect and for a company
specific effect. These last variables were expected to represent the com-
posite effect of many company-product characteristics not explicitly intro-
duced in the model.
Note that some of these variables were defined on the basis of the
actual number of customers while others were on the basis of the potential
number of customers. Indeed, it makes more sense to relate industrial ad-
vertising and personal selling spendings to the potential number of customers
as a large part of these expenditures is aimed at drawing in new customers.
On the other hand, the average gross contribution to profits, and technical
service expenditures are related to the actual number of customers. In
this study, the potential number of customers was considered to be the total
number of customers for the industry reported in the questionnaire.
A preliminary statistical analysis of the seven variables of interest
was made and is reported in Choffray [6]. Empirical distributions for these
variables were found to be highly skewed. Measures of centrality were very
sensitive to a few extreme observations and the need for stabilizing trans-
formations was evident. A logarithmic transformation was used, and consider-
ably improved the stability of the various measures of centrality.
A correlation analysis was also performed (see Choffray [6] for
details). It was found that the advertising spending rate in 1972 was more
strongly related to the average contribution to profit than the advertising
spending rate in 1973, suggesting that industrial communication expenditures
might have a delayed effect on the product's contribution to profit.


-9-
In order to deterniine if the effect of advertising expenditures on
the average contribution to profits was direct or indirect — with personal
selling expenditures as an interviewing variable — we used a method suggested
by Simon [7]. The partial correlation between advertising spending rate
and average contribution to profit keeping personal selling expenditures
constant appeared to be •CSi.18. This doesn't allow us to reject the hypothesis
that the advertising spending rate has a specific effect on the average gross
contribution to profits of industrial products. On the other hand, the pnr-
tial correlation coefficient between technical service spending rate and
average contribution to profit, keeping personal selling expenditures con-
stant, turned out to be ^ .06. This indicates that the effect of technical
service expenditures on the average gross contribution of industrial products
might be deeply intertwined with that of personal selling.
The Model
Assume a relation between the three Industrial marketing spending rates
under study and the average gross contribution to profit of the following,
multiplicative form:
G = K n M^ ,
J'
where the M 's represent the various marketing spending rates.
This model has some important characteristics. It allows for inter-
actions between predictor variables and its interpretation provides Inter-
esting insights into the process of how industrial marketing spending rates
might affect products' gross contribution to profits. In this respect It
can easily be shown that


-10-
1 - a represents the elasticity of Industrial product gross contri-bution with respect to marketing spending rate M .
2 - the nature of returns to scale can be inferred from the simplesummation of the model parameters: E a .
J^
3 - the rate of substitution of marketing activity M for marketingactivity M Is given by
dM a. M
^11 " " dM^ " ^ ^In addition, this model is linear in the logarithms. Given the
available data, the new dependent variable will be more nearly normal than
if the original values had been used. The statistical tests on the para-
maters of this multiplicative model will then be more meaningful than if
a simple linear model relating the original "rates" had been used.
The use of a multiplicative model has important limitations:
- First, it is clear that the model does not allow for a negative average
gross contribution to profits as all M are always > 0. This does not
raise a crucial problem, however, due to the definition we gave of the
gross contribution as the difference between sales and total production
cost. Indeed, one might reasonably assume that companies discontinue
production, when their average production cost is constantly higher than
their selling price.
- Second, assuming ol > 0, the model allows for infinite contribution to
profits when infinite amounts are spent on marketing activity M . For
this reason, it is clear that the model must only be considered aH .i uhc-
ful approximation of the true relation within the range of the observed
data.


-11-
- Third, the model Implies that the "effect" of an additional dollar in
any M is the same for all industrial companies represented in the sample,w
Parameter Estimation
There are several estimation problems related to our data. The first
is that the independent variables in our model are subject to error. Indeed,
the use of security coefficients resulted in the introduction of a random
component in the reported marketing spending amounts.
Regression techniques, used to estimate the model parameters, assume
that only the dependent variable — i.e. the average gross contribution to
profits — is subject to error. When both the dependent and the Independent
variables are subject to error, least squares regression becomes highly
inefficient [8]. In order to estimate our model, we then assume that random
fluctuations of the Independent variables are negligible.
Another problem is multicollinearity. This is not unexpected as the
several spending rates are intercorrelated and further, that for any given
marketing activity, say personal selling, the autocorrelcation of its spending
rate over time is quite high.
This multicollinearity problem, has two important implications.
- First, ordinary least squares regression usually lead to large standard
deviations of the estimated parameters a . These coefficients are often
large in absolute value, and may even have the wrong sign.
- Second, due to the interdependency among the predictor variables it
becomes more difficult to select those which are most meaningful.


-12-
For these reasons, we decided to use Ridge regression, an excellent
description of which is given by Hoerl and Kennard [9] and [10]. The idea
underlying Ridge regression is that we can study the sensitivity of the
regression estimates to the multicollinearity problem, by adding a small
positive constant k on the diagonal of (X'X), where X denotes the matrix
of predictor variables. The important point is that we know that for some
value of k, our estimates will be closer to the true value of the parameters
than the ordinary least squares estimates.
Our first task is to reduce the original set of six marketing spending
rates — ^^_i » ^^» ^t i» ^j-» ^t-»^ _i — ^° ^^ included in the final model.
The use of the Ridge Trace [10] as a way to identify the most meaningful
subset of prediction variables led to the selection of A ^, P , S .
The Ridge Trace for the corresponding model
a a aG = K A % P P
S^
t t-1 t t
appears in the Appendix, Exhibit I. This Trace is fairly stable. This
is specifically true for a* , the standardized coefficient of A , and toa t-1
* *a lesser extent for a and a . The question of deciding whether S should
p s ° t
be dropped from the model is unclear. The effect of technical service and
personal selling spending rates on the average gross contribution to profits
are deeply intertwined so that both variables may in fact represent the
same basic factor. We decided however to keep S in the model on the haslH
that conceptually we expected the technical spending rate to havi- .i Ht-paruLe
effect — weak perhaps — on the dependent variable.

-13-
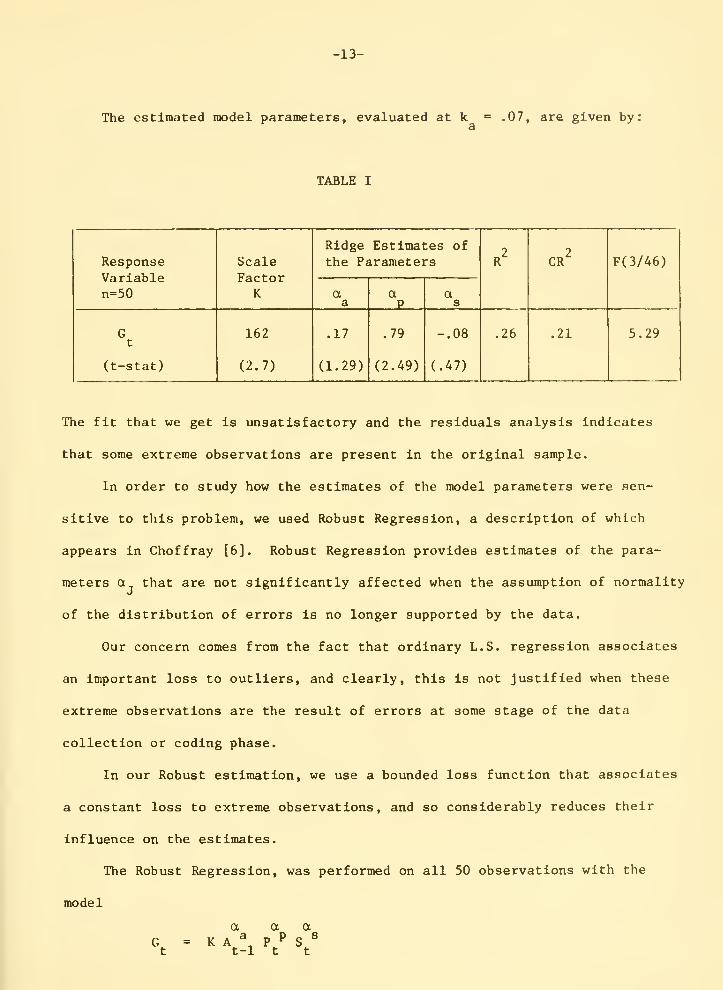
The estimated model parameters, evaluated at k = .07, are given by!3
TABLE I
ResponseVariablen=50


-14-
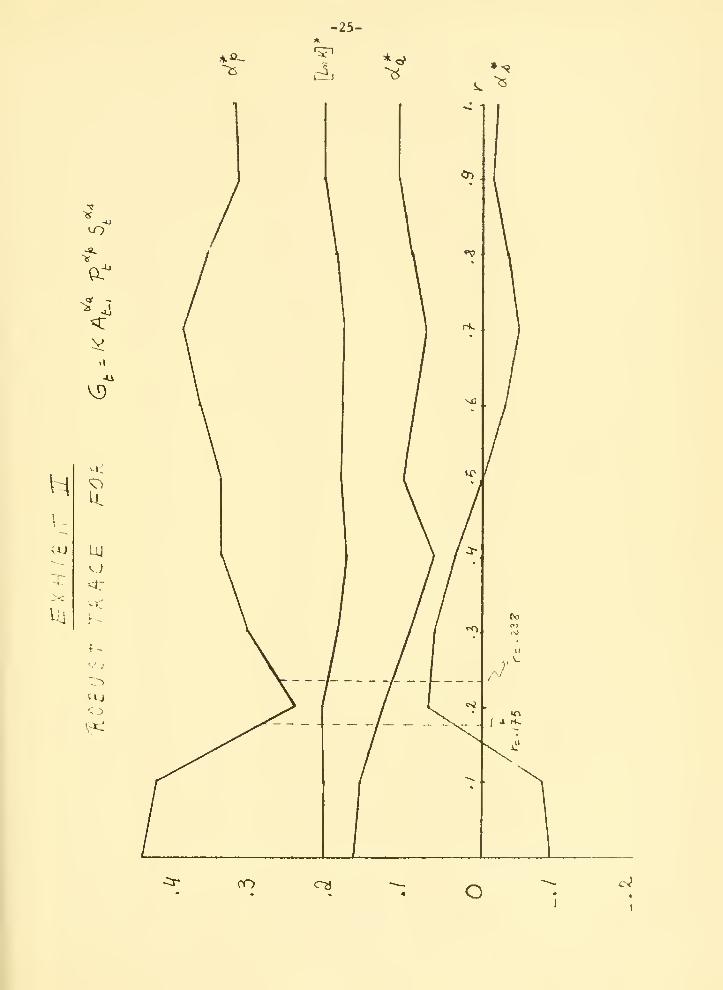
The Robust Trace for this model is shown in the appendix. Exhibit II. The
Trace relates the standardized regression coefficients to the parameter r.
When r=l, the Trace reproduces the Least Absolute Residual (LAR) estimates
of the parameters, and for r=0, it reproduces the least squares estimates.
As r increases, more points are considered as extreme and are set aside.
The estimates of the model parameters are sensitive to a few individual
sample points. Note however that the relative importance of the coefTlclents
*does not change. The standardized coefficient a is the largest of the three,
*independently of the value of r. The coefficient of A _ , a is fairly
*stable. As expected, the only problem concerns a , the standardized coef-
s
flcient of S , whose sign changes over the range of r.
The interest of a Robust regression lies in the residuals analysis.
Indeed, at r=.175 we know that our estimates are 95% efficient and we would
like to know how many points of the original sample have been effectively
discarded. For this reason we have included in the appendix, the residuals
and weights of the original observations corresponding to r=.175 and r=.238.
These values of r correspond approximately to an efficiency of .95, and .80
respectively.
For r = .175, the Robust procedure discards 8 points and gives a weight
2less than .7 to two other points. The resulting weighted R = .57. For
r = .238, 7 additional points receive a weight less than .7 and the resulting
2weighted R is .64. We will not consider larger values of r, which result
in a low efficiency of the estimates and a substantial reduction of the
effective sample.

-15-
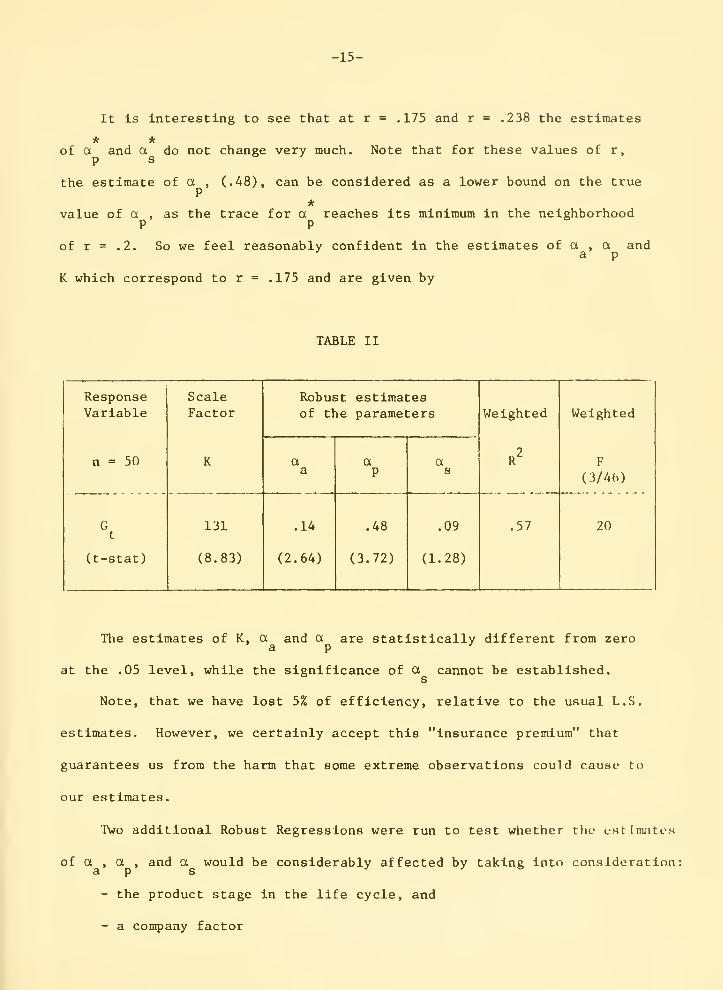
It is interesting to see that at r = .175 and r = .238 the estimates
* *of a and a do not change very much. Note that for these values of r,
P s
the estimate of a , (.48), can be considered as a lower bound on the trueP
*value of a , as the trace for a reaches its minimum in the neighborhood
P P
of r = .2. So we feel reasonably confident in the estimates of a , a anda p
K which correspond to r = .175 and are given by
TABLE II
ResponseVariable
n = 50
Gt
(t-stat)

-16-
In order to introduce these effects into the model, we defined two
dummy variables to account for the stage in the life cycle effect — z, , z« —
and four others — K , K , K , K — to represent the company-specific
effect. These variables were introduced in the model so that their coefficient
would affect the scale factor. Results are presented in Table III for r=.175.
These results imply a life cycle effect on product contribution to
profits. Indeed for a given level of marketing spending rates industrial
products that are in stage I of the life cycle have relatively higher average
gross contribution (K ~ $666) than products that are in stage II (K ~ $153),
and than products that are in stage III (K - $138). Note that the explicit
consideration of the stage in the life cycle in our model did not Improve
2the fit substantially. Indeed, the weighted R at r •= .175, which Ik now
.63, was .57 when only the three marketing variables were considered.
The presence of a company-product effect is especially evident for
company number 10. This may suggest that some variables related to indus-
trial products' gross contribution to profits have been omitted from the
model and should be introduced in further analysis. When we introduce a
company effect, a , the coefficient of the technical spending rate becomes
statistically different from zero. Note also that the fit is significantly
2improved, as the weighted R is now .83.
For comparison purposes, we have reproduced in Table IV the main resultH
of our analyses concerning the hypothesized effect of advertising (a ),
personal selling (a ) and technical service (a ) spending rates on theP s
average gross contribution to profits of industrial products.


-17-
TABLE III
Model I: LnG = LnK + C,Z, + CZ^ + a LnA , + a LnP + a LnSt 112 2a t-1 p t St


-18-
The scale factor, K, has not been introduced in this table as:
- the value of K depends on the stage in the product life cycle andon the company under consideration.
- the value of K does not affect the analysis of the results of our study,
TABLE IV
Robust Estimates of the Parameters
r = .175
model

-19-
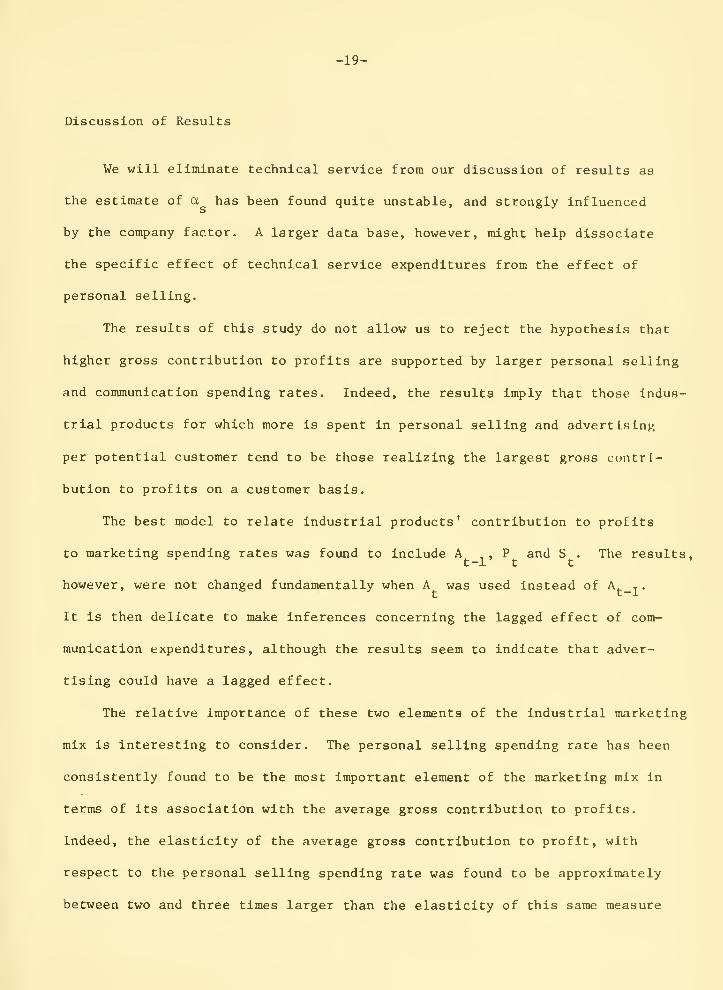
Discussion of Results
We will eliminate technical service from our discussion of results as
the estimate of a has been found quite unstable, and strongly influenced
by the company factor. A larger data base, however, might help dissociate
the specific effect of technical service expenditures from the effect of
personal selling.
The results of this study do not allow us to reject the hypothesis that
higher gross contribution to profits are supported by larger personal selling
and communication spending rates. Indeed, the results imply that those indus-
trial products for which more is spent in personal selling and advert Is inj.-,
per potential customer tend to be those realizing the largest gross contri-
bution to profits on a customer basis.
The best model to relate Industrial products' contribution to profits
to marketing spending rates was found to include A _ , P and S . The results,
however, were not changed fundamentally when A was used instead of A -. .
It is then delicate to make inferences concerning the lagged effect of com-
munication expenditures, although the results seem to indicate that adver-
tising could have a lagged effect.
The relative importance of these two elements of the industrial marketing
mix is interesting to consider. The personal selling spending rate has been
consistently found to be the most important element of the marketing mix in
terms of its association with the average gross contribution to profits.
Indeed, the elasticity of the average gross contribution to profit, with
respect to the personal selling spending rate was found to be approximately
between two and three times larger than the elasticity of this same measure


-20-
with respect to the advertising spending rate. If we were to make the
(strong) assumption of causality, the model then implies that the budget
should be allocated in such a way that the ratio of the communication spend-
ing rate to the personal selling spending rate equals the ratio of the
elasticity of the average gross contribution with respect to both of them.
I.e., A/P = a /a , where a /a was found to lie in the interval [.33, .501.a p a p
L.JAs these two marketing spending rates are both defined with respect to the
number of potential customers, our data indicate that the overall industrial
advertising budget should represent between 1/3 and 1/2 of the total personal
selling budget! This contrasts with the median ratio (- .11) found in our
sample.
The substitution between personal selling and communication expenditures
is also interesting to discuss. The rate of substitution of communication
for personal selling is given by
s =-^ = i . Aa,p dP a ' P
a
As the ratio a /a varies approximately in the interval [2,3] we can get anP 3
estimate of the upper and lower bounds on S when we know the current levela,p
of both A and P. On the basis of the observed data it appears that a reason-
*able estimate of A/P is 1/6. So, if we assume that the estimated relation
is indeed true, the bounds on S are:a,p
S(upper) ^ ^
a,p
S^^°""> = .33
a,p
*This estimate is based on the ratio of the average spending rate foradvertising and personal selling in 1973.


-21-
Again, a causal interpretation of our model could lead to more spending (on
the average) for advertising at the expense of personal selling in our sample.
As far as the nature of returns to scale is concerned, the results indi-
cate that the sum of a , a , and a is consistently less than 1. So. thesea p s
results do not support the hypothesis that increasing returns to scale, in
terms of products' gross contribution to profits exist in industrial market-
ing.
Conclusions
The results of this study allowed us to give tentative answers to some
important questions faced by industrial marketers. Specifically, our results
indicate that:
- the hypothesis according to which industrial marketing activities
support larger contribution to profits cannot be rejected.
- personal selling expenditures are the most important element of the
industrial marketing mix in terms of its association with products'
gross contribution to profit.
- the hypothesis according to which industrial marketing activities
produce decreasing returns to scale is supported by the available
data.
Finally, if our model is given a causal interpretation, then companies
represented in the sample could be overspending on personal selling.
By using personal selling, communication and technical service spending
rates, we were able to "explain" 57% of the total variation in industrial
products' contribution to profits. As noted earlier, the importance of the
company effect confirms that some important product-market characteristics


-22-
were omitted from the model. Future research should concentrate on the iden-
tification of these characteristics and on their integration in a model.
Many problems we encountered in this study were associated with the
use of cross-sectional data to estimate a model of response to industrial
marketing activities. From a methodological point of view, the use of
cross-sectional data to estimate such a model presents serious weaknesses
that have been discussed by Quandt [11].
Despite these weaknesses, the study provides some indications about
how industrial marketing activities might work. The use of time series
data could allow us to dig deeper into the industrial marketing mix
problem.


-23-
APPENDIX


-24-
io
EXHIBIT I . niVQB TRPiC&
Model G,-_ K f\,';p'' ^1^
Al i~-
^.5 5K.
J>3o
^80

-25-
a"
V<l
UJ
CO c-?J o


HOhUbT REQRBSS^IOh/ RESIDUALSr- .176
-26-
H::.hliIi„iM
Riil-i
1
c!
4
I'.LtililjIlL
11
li::
1-J
141516i?lb19ee£1
C.:'.)
C'v
C-.-"..-
cli:;.
Jl
4i4c:.
4-:^
444:3
4t:.
4?4i::
i. . :::;0£:':;'!:j
-i::i!.999!:.£V'
1 u a I r"
7. 4t.?£ib. 749i::-.I;:i
G. i.:i6ti5iS3
b. IbbV be:
0. I:::l!:::.4b:j'ri
1 .;.:::4b3c:
fel. l?':::'cb£
-L!.b57'919t;i.t-17V!;.9
-•0. b6U!:>63I. n o'-'-c r r
• b. olbi::.:bb
1 .b':'y!:ic:
-&. 1 obi 7 3-1 » i:;:4£44
1.41339-b.7'7M.b3
0. 0!:j9':i47
I:::! •• c!':"'b4-.:'
1 , t.:::'it.3
•b,':j4bibfc
bu .1. l:.:7 Jti
1 „919,,:.:£
I . 0b9U3LI. :.;..'. i707'
4
bl MS4b 4
1
-0.4,.:;:3 7' 7 7'
••0.i::::83L::5
i . 4500?~i:.! . b349i::!
i:.l . 1 1 b i 9b . •J'd'd.i'' i H-
0.,31ba3c::
-I•-!
•; --ii:;:
) » i •.-•'TI_'..I
7'. c:7''6oi
0.3lbc:!:r.l
0.34334c:c:.03c:S
•i.::i. '^iti-^V-titi:.?
0.69917!:.b.35';.b
b. 134397.3V436b. bi303£.49639-0.3£77330. t-4b643
0l:;..i,biri


nosusr REGaEssior^ REbtoun i S -28-
r i .i3 &
kirn LbiiilJHL NLlLJiT
le11
IS131415161?18IS£B£1
£4t.:-
U.-.J
c-'b
C i'
ele-
cts
3f\
zi(~<
4k>
'•H.:.
4h
:^:.!:-i
1 . i::.t;ii:::i35
1.0041
3
l„£l:.93i?u44l:::i£^:i
3.7563'::'
3. i 13^943« 1357631:1. UbtJobli. . c4'~io?
8. 340733-O. 7t.7
3.3U0U>:3•-3, 113334
1 .. SSbcJ•-0. 353363
i .331530. 101331.1 . ikt.SVI . t3035
••0.7413733. 103733
.1. . V'ti:;::::::!
3„ i7t. ly•3. J. 30501:.:. 0£i!:..0U
1 . U363 J.
I::l . ..:::3 1 cA 1
••1:1. 0t..L£0;.::;
-U„353J4y•0.315313i. 44335
-3. ::::ti:j33
b.e4317t.0. 7713630.433367, i0£i::.3
? . 33 151K.. 353135Li. v.i3iZl':::':.:>^-i-
; ., 'ii:.; r" « i : ..:!•, I...
I
1:1-435-103I-!., t..>.6i::i73
b- -,I. ill:
:
3
o , £3t-:-.7.
. t:3 ,:.:::
'...bly,:;,:;.:;
£.507tiS-0.333571H. 634433
';: I. !:::!::; tub3 ''5
0.c.03t.47
h.


-29-
REFERENCES
[1] Gary L. Lilien, et^. al . , "Industrial Advertising Effects and BudgetingPractices: A Review," Working Paper 761-75, Sloan School of Management,M.I.T., January 1975.
[2] ADVISOR, "ADvertising I^ndustrial Products: £tudy of Operating Relation-ships," is an M.I.T.-A.N.A. joint research project whose objective is
to study and model the industrial advertising budgeting process. Fora description of this project, see Gary L. Lilien, "How Many Dollarsfor Industrial Advertising? Project ADVISOR," Working Paper 735-74,
Sloan School of Management, M.I.T., September 1974.
[3] Kristian S. Palda, Pricing Decisions and Marketing Policy , Prentice-Hall, Englewood Cliffs, New Jersey, 1971.
[4] Jean-Jacques Lambin, "What is the Real Impact of Advertising?" HarvardBusiness Review , May-June 1975, p. 146.
[5] Jean-Jacques Lambin, "Measuring the Profitability of Advertising: An
Empirical Study," Journal of Industrial Economics , Vol. XVII (April
1969), p. 86.
[6] Jean-Marie Choffray, "An Empirical Study of the Relation between Indus-
trial Products' Profitability and Marketing Spending Rates," UnpublishedResearch Paper, Alfred P. Sloan School of Management, M.I.T., May 1, 1975,
[7] Herbert A. Simon, "Spurious Correlation: A Causal Interpretation,"Journal of the American Statistical Association , Vol. 49, 1954, p. 467.
[8] Ronald J. Wonnacott and Thomas H. Wommacott, Econometrics , John Wileyand Sons, Inc., 1970, p. 164-167.
[9] Arthur E. Hoerl and Robert W. Kennard, "Ridge Regression: Biased Esti-mation for Nonorthogonal Problems," Technometrics , Vol. 12, No. 1,
February 1970.
[10] Arthur E. Hoerl and Robert W. Kennard, "Ridge Regression: AppHcatlonHto Non-Orthogonal Problems," Technometri ca, Vol. 12, No. 1, February
1970, pp. 70-85.
[11] Richard E. Quandt, "Estimating the Effect of Advertising: Some Pitfalls
in Econometric Methods," Journal of Marketing Research , May 1974,
p. 51-60.


Date Due

HD28.M4 14 no.796- 75Kearl, James R/Appendix to task III :
'''liiiiiiililiiiiiiilii3 TDflO DOO bSb 311
^_ w no.797- 75jinzberg, Mich/lmplementation as a pro724723. D*BKS _ .00024261
3 TDflD ODD 7DM 035
w no.798- 75ftnand, Sudeep./lntertemporal portfolio
72587P , _ D»BKS. _00.0l98G5
II I II ill
3 TOflO DDO b4S"?bT
w no.799- 75Shapiro, Jerem/OR models for enerqy pi
724715 _ DxBKS 00019872
3 TOflO OQO bMS T3M
w no800- 75
ii?o*,''o^-Je3"/An empirical study of t
/2b818 DxBKS 00019882
3 TOflO ODD bMb 171
w no.801- 75Bailyn, Lotte./Researcti as a cognitive724718 p*BKS 00019863
'}:''!?
3 TOAD ODD bMS hlH
HD28.IVI414 no,802-75Rockart, Jofin /Computers and the learn725169 D*BKS 00185564
III ft":'ii"i"|«'r|' [If T'' ,:'"rf"'iniiii
3 TDflD DOS '711:,' 13T
w no-803- 75Runge, Dale. /The potential evil in h725165 D
iiiiiiii
*BKS 000111! I
71
3 TOflO ODD bMS TOO
