an empirical study on the relationship between r&d and ... 3_5_9.pdf · an empirical study on...
TRANSCRIPT
Journal of Applied Finance & Banking, vol. 3, no. 5, 2013, 107-119
ISSN: 1792-6580 (print version), 1792-6599 (online)
Scienpress Ltd, 2013
An Empirical Study on the Relationship between R&D
and Financial Performance
Feng-Jui Hsu1, Mu-Yen Chen
2,*, Yu-Cheng Chen
3 and Wei-Chieh Wang
4
Abstract
This study investigates the relationship between R&D investment, patent filings and
financial success for firms. Firms which have high degrees of R&D investment and large
numbers of patents are referred to as “high innovation energy corporations”. This study investigates the financial performance of such firms among a sample of Taiwanese high-
tech companies from 2000 to 2011. Findings indicate that the lag between R&D expense
and benefit, and the lead periods for patents (i.e., the duration of the application process)
significantly affect stock returns. Moreover, these delays and a firm’s R&D expense rate also impact net sales. In other words, firms with a high level of innovative energy have
better stock returns and net sales, but such firms do not have an advantage in terms of
operating income. Empirical results indicate that higher R&D expenses increase operating costs which, in turn, decreases operating income despite increased net sales.
JEL classification numbers: G14, G32.
Keywords: Innovative energy, financial performance, stock return, net sales, operating income
1 Introduction
Since the 1970s, Taiwan’s government has promoted the development of domestic high-tech industries. The combination of technology and engineering requirements in such
1National Chung Hsing University, Taiwan, Assistant Professor, No.250, Guoguang Rd., South
Dist., Taichung City 40227, Taiwan (R.O.C.) 2National Taichung University of Science and Technology, Taiwan, Associate Professor, No.129,
Sec. 3, Sanmin Rd., North Dist., Taichung City 40401, Taiwan (R.O.C.) 3National Chung Hsing University, Taiwan, Professor, No.250, Guoguang Rd., South Dist.,
Taichung City 40227, Taiwan (R.O.C.) 4National Chung Hsing University, Taiwan, Master, No.250, Guoguang Rd., South Dist., Taichung
City 40227, Taiwan (R.O.C.)
Article Info: Received : July 10, 2013. Revised : August 7, 2013.
Published online : September 1, 2013

108 Feng-Jui Hsu, Mu-Yen Chen, Yu-Cheng Chen and Wei-Chieh Wang
firms generate significant numbers of well-paying jobs, thus fueling economic
development. In Taiwan, high-tech products account for more than 50% of GDP, and government policy focuses on promoting the development of intellectual property through
R&D investment and patents. As defined by Galbraith (1969), intellectual property is the
product of mental work. The production of intellectual property requires mastery of
knowledge and organizational skills, and can give firms a competitive industrial advantage (Edvinsson, 1997). Intellectual property is a form of intangible asset, and
modern companies are more dependent on such assets than before, with both firms and
nations devoting significant and increasing resources to produce or procure new technologies to ensure future profitability. Firms engage in research and development to
secure patent rights which can be commercialized.
This research examines the relationship between R&D results and firm operating performance. Unlike previous studies, this study not only considers R&D expenditures
but also includes an analysis of the total number of patents secured. Firms can secure
patents either by engaging in proprietary R&D or by purchasing existing patents from
other companies. Purchasing patents provides firms a way to increase the company’s intellectual property, but does little to increase the firm’s R&D experience. Developing
patentable technologies in-house increases the firm’s core R&D capability, which may
have a significant positive effect on its operating performance. Jones et al. (2001) noted a negative correlation between the proportion of externally-sourced patents or technologies
and operating performance.
This study investigates the impact of R&D capability on a firm’s financial performance by using historical data from Taiwanese companies from 2000 to 2011, and aims to
answer the following questions: (1) how does R&D strength relate to a firm’s stock price,
(2) how does R&D strength relate to a firm’s operating performance, and (3) does a firm’s
total number of patents influence firm performance? Empirical results indicate that the lag periods of R&D expenses and the lead time for patent applications significantly affect
stock returns. Moreover, net sales revenue is related to the R&D expense lag, patent
application lead time, and R&D expense rate (defined as the ratio of R&D expenses to total expenses). In addition, firm performance is positively correlated with the number of
patents the firm owns. That is to say, firms with greater innovative strength have better
stock returns and net sales, but operating income not affected. Expanding R&D expenses
is found to increase operating costs, thus decreasing operating income despite a net increase in sales.
2 R&D Expenditure and Firm Performance
Research and development is an essential expenditure in high-tech industries, but there is no linear relation between R&D investment and returns. Successful R&D improves firm
performance while failed efforts are treated as sunk costs. High-tech products command
premium prices in the marketplace. Improving and maintaining competitiveness often requires significant investments in R&D.
However, new technologies derived from R&D may not necessarily be translated into
commercially successful products. Baker and Freeland (1975) showed that the R&D and
product development processes are fraught with uncertainty leading to failure to achieve expectations. For example, newly designed products may run into unexpected
manufacturing problems, or may prove to not be commercially viable. In addition, profits

An Empirical Study on the Relationship between R&D and Financial Performance 109
from new products may fail to justify the R&D expense required to develop the products,
resulting R&D expenditures becoming a sunk cost. Nevertheless, Nelson (1982) indicated that accumulating R&D experience over time has a positive impact on current R&D
activity. Empirical studies indicate that R&D activity can improve a firm’s future
performance. Edvinsson and Malone (1997) showed that intellectual property produced
by R&D investment must be properly understood and appropriately managed to increase future firm performance. Lev and Sougiannis (1999) found that once an R&D expense is
added to a firm’s capitalization, it becomes a risk factor related to the firm’s future returns
and also has a positive impact on subsequent stock returns. Toivanen et al. (2002) showed that the R&D and innovation of UK firms have a positive influence on market value.
Bharadwaj et al. (1999) found that investing in R&D increases firm productivity and
creates conditions for quick and efficient innovation in the IT industry. Each time firms engage in innovation or R&D, they transform financial and human resources into
accumulated experience, knowledge, and capability, which become the firm’s main
intangible assets. Madanmohan et al. (2004) showed that improvements to a firm’s human
resources or technology will have a positive impact on the company’s overall technological capability. Finally, studies have identified a time lag effect on R&D
activity, due to the time required to transform R&D inputs into practical applications.
Hirschey and Weygandt (1985) showed that R&D expenditures have a deferred return of 5 to 10 years.
Patents can be regarded as the product of R&D, and R&D expenditures which fail to
produce patents can be seen as a loss for the firm. Thus, some empirical studies have attempted to use the number of patents secured by a firm as a key factor in performance
analysis. Lilien and Yoon (1989) showed that firms with more patents are better able to
innovate and improve upon existing products. Crèpon et al. (1998) found significant
correlations between R&D expenditure, firm size, market share, and technological demand. In addition, R&D which results in useful patents also has a positive impact on
firm productivity, which is related to firm performance (Hall & Bagchi-Sen, 2002). Thus,
the intensity of a firm’s R&D activity and the number of patents the firm secures are related to overall performance (Beneito, 2006). Some empirical studies have shown that
simultaneously implementing multiple technologies can result in improved management
performance, and firms with more patents and patent citations exhibit better corporate
governance (Ernst, 1995; Deng et al., 1999; De Carolis, 2003; Miller et al., 2007).
3 Methodology and Data
3.1 Research Hypothesis
Based on previous studies, R&D expenditures are related to firm performance and patents
can be regarded as the output of R&D. However, patents can also be obtained through
acquisition, alliance, or merger. The sample selection for this study first considers R&D
expenditures and uses the R&D expense rate to control for the size effect. In our analysis, we regard firms with high R&D expense rates as being active in terms of R&D, and firms
holding higher numbers of patents are classified as having strong R&D capacity. The
research hypotheses investigated here are listed as follows:

110 Feng-Jui Hsu, Mu-Yen Chen, Yu-Cheng Chen and Wei-Chieh Wang
H1:Firms with high R&D expenditures and high numbers of patents enjoy improved
financial returns.
H2a:R&D expenditures and patent holdings have a significant impact on a firm’s net
sales.
H2b:High R&D expenditures and high numbers of patents significantly improve firm
operating income.
3.2 Data
A sample of high-tech firms was selected from the Taiwan Economic Journal (TEJ) from
2000 to 2011, with detailed patent data obtained from the Taiwan Intellectual Property Office. Firms were selected from a variety of industries, including telecommunications,
information technology, consumer electronics, semiconductors, precision optical
machinery, the automated chemical industry, chemicals and pharmaceuticals, and solar energy utilities. In these industries, not all R&D investments result in products, and the
delay between investment and mass production varies significantly among the industries.
Three industries with particularly long lag time to commercialize R&D investments were
thus removed from consideration. Sample selection was conducted in two stages. First, we chose firms in the highest
quartile for R&D expense rate in each industry. From these, we then selected firms in the
highest quartile for patent ownership in each industry. Table 1 summarizes the 588 samples obtained from 2000 to 2011 from industries
including semiconductor manufacturing (136 samples), display panel manufacturers (65
samples), computer and computer peripheral manufacturers (219 samples),
telecommunications and information technology firms (85 samples), and other electronics manufacturers (83 samples).
3.3 Methodology
Our analysis of R&D activity and operating performance of our selected sample proceeds
in three regression equations.
Table 1: Sample Statistics Description
Industry Semico-
nductor Panels Computers
Telecommunications
& IT
Other
electronics
Total
sample
Year n % n % n % n % n % n %
2000 9 1.53 4 0.68 12 2.04 3 0.51 5 0.85 33 5.61
2001 11 1.87 5 0.85 13 2.21 3 0.51 5 0.85 37 6.29
2002 11 1.87 5 0.85 16 2.72 5 0.85 6 1.02 43 7.31
2003 11 1.87 5 0.85 18 3.06 7 1.19 6 1.02 47 7.99
2004 11 1.87 5 0.85 19 3.23 8 1.36 7 1.19 50 8.50
2005 11 1.87 5 0.85 19 3.23 8 1.36 7 1.19 50 8.50
2006 12 2.04 6 1.02 20 3.40 8 1.36 7 1.19 53 9.01

An Empirical Study on the Relationship between R&D and Financial Performance 111
2007 12 2.04 6 1.02 20 3.40 8 1.36 8 1.36 54 9.18
2008 12 2.04 6 1.02 20 3.40 8 1.36 8 1.36 54 9.18
2009 12 2.04 6 1.02 20 3.40 9 1.53 8 1.36 55 9.35
2010 12 2.04 6 1.02 21 3.57 9 1.53 8 1.36 56 9.52
2011 12 2.04 6 1.02 21 3.57 9 1.53 8 1.36 56 9.52
N 136 23.13 65 11.05 219 37.24 85 14.46 83 14.12 588 100
Note: 1. Sample period is from 2000 to 2011.
2. % denotes the percentage of the whole sample represented by each industry. 3. N and n respectively denote the number of the whole sample and number of firms in
each industry.
𝑅𝑒𝑡𝑢𝑟𝑛𝑖 ,𝑡 = 𝛼0 + 𝛼1𝑅𝑑𝑒𝑥𝑝𝑖,𝑡 + 𝛼2𝑅𝑑𝑟𝑎𝑡𝑖𝑜𝑖,𝑡 + 𝛼3𝑃𝑎𝑡𝑒𝑛𝑡𝑖 ,𝑡 + 𝛼4𝑆𝑖𝑧𝑒𝑖,𝑡 + 𝛼5𝐼𝑡𝑡 + 𝛼6𝐼𝑃𝐼𝑡 + 𝛼7𝑈𝑀𝐸𝑃𝑡 + 𝛼8𝐷𝑌_𝐶𝑃𝑖 ,𝑡 + 𝛼9𝐷𝑌_𝐶𝑖 ,𝑡 + 𝛼10𝐷𝑌_𝐸𝑖,𝑡 + 𝜀𝑖 ,𝑡 (1)
𝑁𝑒𝑡𝑠𝑎𝑙𝑒𝑖,𝑡 = 𝛽0 + 𝛽1𝑅𝑑𝑒𝑥𝑝𝑖,𝑡 + 𝛽2𝑅𝑑𝑟𝑎𝑡𝑖𝑜𝑖,𝑡 + 𝛽3𝑃𝑎𝑡𝑒𝑛𝑡𝑖,𝑡 + 𝛽4𝑆𝑖𝑧𝑒𝑖,𝑡 + 𝛽5𝐼𝑡𝑡 + 𝛽6𝐼𝑃𝐼𝑡 + 𝛽7𝑈𝑀𝐸𝑃𝑡 + 𝛽8𝐷𝑌_𝐶𝑃𝑖 ,𝑡 + 𝛽9𝐷𝑌_𝐶𝑖 ,𝑡 + 𝛽10𝐷𝑌_𝐸𝑖,𝑡 + 𝜀𝑖 ,𝑡 (2)
𝑂𝑝𝑟𝑡𝑖 ,𝑡 = 𝛾0 + 𝛾1𝑅𝑑𝑒𝑥𝑝𝑖,𝑡 + 𝛾2𝑅𝑑𝑟𝑎𝑡𝑖𝑜𝑖,𝑡 + 𝛾3𝑃𝑎𝑡𝑒𝑛𝑡𝑖 ,𝑡 + 𝛾4𝑆𝑖𝑧𝑒𝑖 ,𝑡 + 𝛾5𝐼𝑡𝑡 + 𝛾6𝐼𝑃𝐼𝑡 + 𝛾7𝑈𝑀𝐸𝑃𝑡 + 𝛾8𝐷𝑌_𝐶𝑃𝑖,𝑡 + 𝛾9𝐷𝑌_𝐶𝑖 ,𝑡 + 𝛾10𝐷𝑌_𝐸𝑖,𝑡 + 𝜀𝑖 ,𝑡 (3)
where Returni,t (Vendatraman & Ramanujam, 1986), Netsalei,t, and Oprti,t are
respectively the return, net sales and operating income of firm i in year t. There are two
types of independent variables. The first is firm characteristics including Rdexpi,t, Rdratioi,t, Patenti,t, and Sizei,t, (Kim & Sorensen, 1986) respectively denoting R&D
expenditure, R&D expense ratio, number of patents, and firm size. The second is
microeconomic variables, including Itt (Cutler et al., 1989), IPIt (Berger & Ofek, 1995), and UMEPt, respectively denoting the market interest rate, the industrial production
index, and the unemployment rate. All industries were divided into four groups using
three dummy variables, DY_CPi,t, DY_Ci,t, and DY_Ei,t, respectively denoting the computers and computer peripherals, telecommunications and IT, and other electronics;
all others are included in the panel or semiconductor industries.
4 Empirical Results
4.1 Sample Characteristics
Table 2 summarizes statistical data for the whole sample. The mean, minimum, and
maximum returns were respectively 18%, -86%, and 403% with a 73% standard deviation for the return variable. This high standard deviation indicates a high degree of volatility in
stock returns. In addition, the mean, minimum and maximum net sales were 17.17, 11.43,
and 21.74, respectively, with a median of 17.31. The proximity of the mean and median
for the net sales variable indicates that the sample distribution is relatively centralized. The mean, minimum, and maximum operating income were 9.78, -17.96, and 18.86,
respectively. The means for R&D expenditures, R&D expense ratio, number of patents,

112 Feng-Jui Hsu, Mu-Yen Chen, Yu-Cheng Chen and Wei-Chieh Wang
size, market interest rate, industrial production index, and unemployment were 12.38,
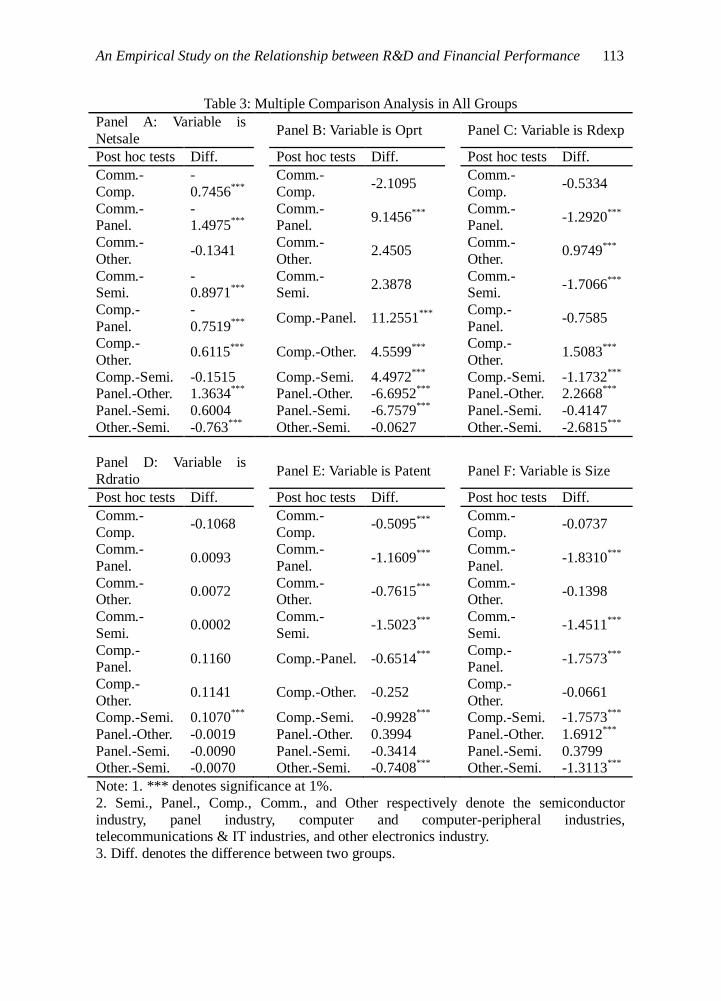
0.05%, 4.22, 17.21, 4.22%, 6.15%, and 4.46%, respectively. To determine the relationship between the intensity of R&D activity and firm
performance, multiple comparison analysis tests were used to identify differences among
the various groups. Significant differences are found for Netsale, Oprt, Rdexp, Rdratio,
Patent, and Size variables, but not for Return. Table 3 shows the empirical results. In the R&D expenditure variable, there is no significance between the semiconductor industry
and the panel industry, while these two industries have the highest R&D expenditure of all
industries represented in the sample. In the R&D expense rate variable, significant differences are only found in the computer and computer peripheral industry and the
semiconductor industry. In terms of patent variables, the semiconductor and panel
industries had the highest number of patents in the sample, but the difference not significant. The semiconductor and panel industries were also largest in terms of firm
size. According to Table 3, the only difference between the semiconductor and panel
industries was found in terms of operating income; thus these two industries are grouped
together for subsequent analysis.
Table 2: Sample Characteristics
Variables Mean Min. Q1 Median Q3 Max. Std Dev. N
Return (%) 0.18 -0.86 -0.27 0.01 0.40 4.03 0.73 518 Netsale (ln) 17.17 11.43 16.38 17.31 18.23 21.74 1.70 573
Oprt (ln) 9.78 -17.96 11.96 13.95 15.37 18.86 10.68 573
Rdexp (ln) 12.38 0.00 11.76 12.73 13.61 15.93 2.32 573 Rdratio (%) 0.05 0.00 0.01 0.01 0.02 4.97 0.35 573
Patent (n) 4.22 0.00 3.53 4.39 5.27 8.40 1.45 573
Size (ln) 17.21 11.78 16.24 17.32 18.43 21.15 1.68 573 It (%) 4.22 2.56 2.88 3.85 4.21 7.38 1.62 573
IPI (%) 6.15 -32.04 -8.06 7.47 18.71 47.76 19.57 573
UMEP (%) 4.46 3.27 3.86 4.58 5.03 5.74 0.67 573
DY_CP (D1) 0.38 0.00 0.00 0.00 1.00 1.00 0.49 573 DY_C (D2) 0.15 0.00 0.00 0.00 0.00 1.00 0.36 573
DY_E (D3) 0.14 0.00 0.00 0.00 0.00 1.00 0.35 573
Note: 1. Min, Q1, Q3, Max, and Std Dev. respectively denote minimum, first quartile, third quartile, maximum, and standard deviation.
2. Return, Rdratio, It, IPI, and UMEP are in %.
3. Netsale, Oprt, Rdexp, and Size are in logarithm form.
4. Return, Netsale, Oprt, Rdexp, Rdratio, Patent, Size, It, IPI, UMEP, DY_CP, DY_C, and DY_E respectively denote stock return, net sales, operating income, R&D expenditures,
R&D expenseratio, number of patents, firm size, market interest rate, industrial
production index, unemployment rate, computer industry dummy, telecommunications and IT industry dummy, and other electronics industry dummy.
An Empirical Study on the Relationship between R&D and Financial Performance 113
Table 3: Multiple Comparison Analysis in All Groups
Panel A: Variable is
Netsale Panel B: Variable is Oprt Panel C: Variable is Rdexp
Post hoc tests Diff. Post hoc tests Diff. Post hoc tests Diff.
Comm.-
Comp.
-
0.7456***
Comm.-
Comp. -2.1095
Comm.-
Comp. -0.5334
Comm.-Panel.
-1.4975
***
Comm.-Panel.
9.1456***
Comm.-
Panel. -1.2920
***
Comm.-
Other. -0.1341
Comm.-
Other. 2.4505
Comm.-
Other. 0.9749
***
Comm.-Semi.
-0.8971
***
Comm.-Semi.
2.3878 Comm.-
Semi. -1.7066
***
Comp.-
Panel.
-
0.7519***
Comp.-Panel. 11.2551
***
Comp.-
Panel. -0.7585
Comp.-
Other. 0.6115
***
Comp.-Other. 4.5599
***
Comp.-
Other. 1.5083
***
Comp.-Semi. -0.1515 Comp.-Semi. 4.4972***
Comp.-Semi. -1.1732***
Panel.-Other. 1.3634
*** Panel.-Other. -6.6952
*** Panel.-Other. 2.2668
***
Panel.-Semi. 0.6004 Panel.-Semi. -6.7579***
Panel.-Semi. -0.4147
Other.-Semi. -0.763***
Other.-Semi. -0.0627 Other.-Semi. -2.6815***
Panel D: Variable is
Rdratio Panel E: Variable is Patent Panel F: Variable is Size
Post hoc tests Diff. Post hoc tests Diff. Post hoc tests Diff.
Comm.-
Comp. -0.1068
Comm.-
Comp. -0.5095
***
Comm.-
Comp. -0.0737
Comm.-
Panel. 0.0093
Comm.-
Panel. -1.1609
***
Comm.-
Panel. -1.8310
***
Comm.-Other.
0.0072 Comm.-
Other. -0.7615
***
Comm.-Other.
-0.1398
Comm.-
Semi. 0.0002
Comm.-
Semi. -1.5023
***
Comm.-
Semi. -1.4511
***
Comp.-Panel.
0.1160
Comp.-Panel. -0.6514***
Comp.-
Panel. -1.7573
***
Comp.-
Other. 0.1141
Comp.-Other. -0.252
Comp.-
Other. -0.0661
Comp.-Semi. 0.1070***
Comp.-Semi. -0.9928***
Comp.-Semi. -1.7573***
Panel.-Other. -0.0019 Panel.-Other. 0.3994 Panel.-Other. 1.6912***
Panel.-Semi. -0.0090 Panel.-Semi. -0.3414 Panel.-Semi. 0.3799 Other.-Semi. -0.0070 Other.-Semi. -0.7408
*** Other.-Semi. -1.3113
***
Note: 1. *** denotes significance at 1%.
2. Semi., Panel., Comp., Comm., and Other respectively denote the semiconductor
industry, panel industry, computer and computer-peripheral industries, telecommunications & IT industries, and other electronics industry.
3. Diff. denotes the difference between two groups.

114 Feng-Jui Hsu, Mu-Yen Chen, Yu-Cheng Chen and Wei-Chieh Wang
Table 4 presents the variable coefficient correlation matrix. In terms of endogenous parameters, return and operating income have lower
coefficients and are not significantly different from R&D expenditure, R&D expense ratio, and number of patents. However, the coefficients between net sales and R&D expenditure, R&D expense ratio, and number of patents is respectively 0.502, 0.167, and 0.611,
which are all positive and significant. This result supports hypothesis H2a: “R&D expenditures and patent holdings have a significant
impact on a firm’s net sales”. In terms of external parameters, the sample exhibits higher R&D intensity, and the number of patents is
positive and significant with R&D expenditures. Furthermore, firm size has positive correlations of 0.475 and 0.583 respectively with R&D expenditure and number of patents, and has a negative correlation of -0.28 with R&D expense ratio. This demonstrates that large-
scale firms have relatively greater economic capacity to engage in continuous R&D, thus allowing them to accumulate more R&D
experience and intellectual property. Judge et al.(1985) noted that multicollinearity may occur between two variables if one coefficient exceeds 0.8. However, all coefficients in Table 4 are below 0.8.
Table 4: Variable Coefficient Correlation Return Netsale Oprt Rdexp Rdratio Patent Size It IPI UMEP DY_CP DY_C DY_E
Return 1 Netsale 0.00445 1 Oprt 0.155*** 0.235*** 1 Rdexp -0.0606 0.502*** 0.0548 1 Rdratio 0.0209 0.167*** 0.0472 0.0993* 1 Patent -0.0835 0.611*** -0.00598 0.381*** 0.0643 1
Size -0.0352 0.800*** 0.0818 0.475*** -0.280*** 0.583*** 1 It -0.0533 -0.0336 0.0614 -0.00332 -0.0642 -0.220*** 0.0129 1 IPI 0.492*** -0.00815 0.0133 -0.0338 0.00269 0.0228 0.0146 -0.319*** 1 UMEP 0.264*** -0.0405 -0.104* -0.0114 0.00346 -0.0927* 0.0147 0.107* 0.292*** 1 DY_CP -0.0316 0.0722 -0.0926* 0.266*** -0.0594 0.292*** 0.283*** 0.0345 0.00315 0.0135 1 DY_C 0.00389 -0.162*** 0.0449 -0.106* -0.0447 -0.238*** -0.143** -0.0533 -0.00246 -0.0296 -0.230*** 1 DY_E 0.00540 -0.124** -0.0492 -0.284*** -0.0528 -0.0138 -0.105* 0.00608 -0.00232 0.0155 -0.228*** -0.171*** 1
Note:1. *, **, and *** denote the significance at 10%, 5%, and 1%, respectively. 2. Return, Netsale, Oprt, Rdexp, Rdratio, Patent, Size, It, IPI, UMEP, DY_CP, DY_C, and DY_E respectively denote stock return, net
sales, operating income, R&D expenditure, R&D expense ratio, number of patents, firm size, market interest rate, industrial production
index, unemployment rate, computer and computer-peripheral industry dummy, telecommunications and IT industry dummy, and other electronics industry dummy.
An Empirical Study on the Relationship between R&D and Financial Performance 115
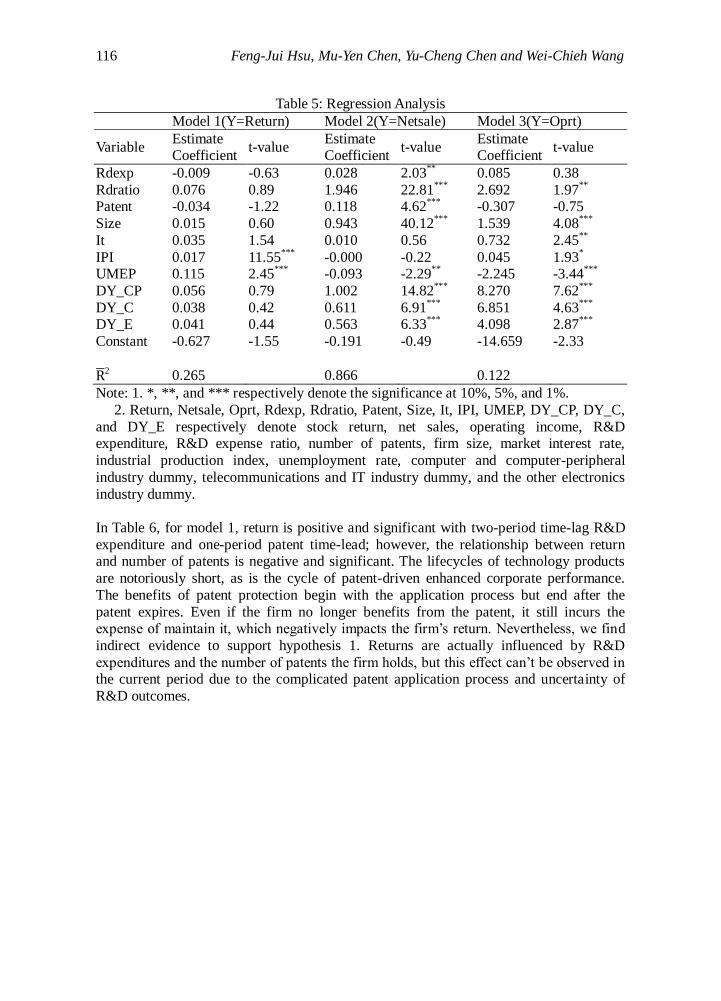
4.2 Empirical Results and Discussion
This study focuses on determining whether a firm’s R&D activities benefit its
performance in terms of returns, net sales, and operational performance. Table 5 shows
the regression analysis results based on three models. In model 1, the coefficient of the
regression result for return is insignificant with R&D expenditure, R&D expense ratio, and number of patents, which is contrary to expectations. There are two possible
explanations for this. First, high R&D intensity firms normally invest relatively large
amounts of resources in R&D activities. Thus, R&D expenditure, R&D expense ratio, and even the number of patents won’t influence investor expectations for the firm’s stock
price performance. Second, investors are unable to predict the commercial benefits of a
firm’s emerging patents. Therefore, the number of patents a firm secures does not affect
stock price or stock return. In model 2, net sales are positively and significant with R&D expenditure, R&D expense ratio, and number of patents, and thus supports hypothesis
H2a. Furthermore, net sales are correlated with firm size, industry characteristics, and
economic conditions. In model 3, operating income is positive and significant with R&D expense ratio, which supports H2b. R&D entails significant capital outlays which will
have a critical impact on year-end operating income given a relatively high R&D expense
ratio. Empirically, R&D inputs are shown to provide deferred benefits. The deferral duration
may be affected by the time-lag between R&D investment and the production of a desired
outcome, or the time-lag in applying R&D outputs to products or services. In other words,
the input of R&D expenditures might take some years to have an impact on firm performance. To capture the time-lag effect on R&D activity, two variables were added to
our regression analysis: time-lag for two periods of R&D expenditures (Rdexp(+2)) and
lead time for one year prior to the patent announcement (i.e., Patent(-1)). Given the short lifecycle of high-tech products, firms seek to commercialize R&D outputs as quickly as
possible. Thus innovations may be applied to products before the patents are secured,
producing leading results. According to Lin (2007), R&D expenditures continue to have a positive influence on earnings after two time-lag periods. Table 6 presents the time-lag
regression analysis.
116 Feng-Jui Hsu, Mu-Yen Chen, Yu-Cheng Chen and Wei-Chieh Wang
Table 5: Regression Analysis
Model 1(Y=Return) Model 2(Y=Netsale) Model 3(Y=Oprt)
Variable Estimate Coefficient
t-value Estimate Coefficient
t-value Estimate Coefficient
t-value
Rdexp -0.009 -0.63 0.028 2.03**
0.085 0.38
Rdratio 0.076 0.89 1.946 22.81***
2.692 1.97**
Patent -0.034 -1.22 0.118 4.62
*** -0.307 -0.75
Size 0.015 0.60 0.943 40.12***
1.539 4.08***
It 0.035 1.54 0.010 0.56 0.732 2.45**
IPI 0.017 11.55***
-0.000 -0.22 0.045 1.93*
UMEP 0.115 2.45***
-0.093 -2.29**
-2.245 -3.44***
DY_CP 0.056 0.79 1.002 14.82***
8.270 7.62***
DY_C 0.038 0.42 0.611 6.91***
6.851 4.63***
DY_E 0.041 0.44 0.563 6.33
*** 4.098 2.87
***
Constant -0.627 -1.55 -0.191 -0.49 -14.659 -2.33
R 2 0.265 0.866 0.122
Note: 1. *, **, and *** respectively denote the significance at 10%, 5%, and 1%.
2. Return, Netsale, Oprt, Rdexp, Rdratio, Patent, Size, It, IPI, UMEP, DY_CP, DY_C,
and DY_E respectively denote stock return, net sales, operating income, R&D expenditure, R&D expense ratio, number of patents, firm size, market interest rate,
industrial production index, unemployment rate, computer and computer-peripheral
industry dummy, telecommunications and IT industry dummy, and the other electronics
industry dummy.
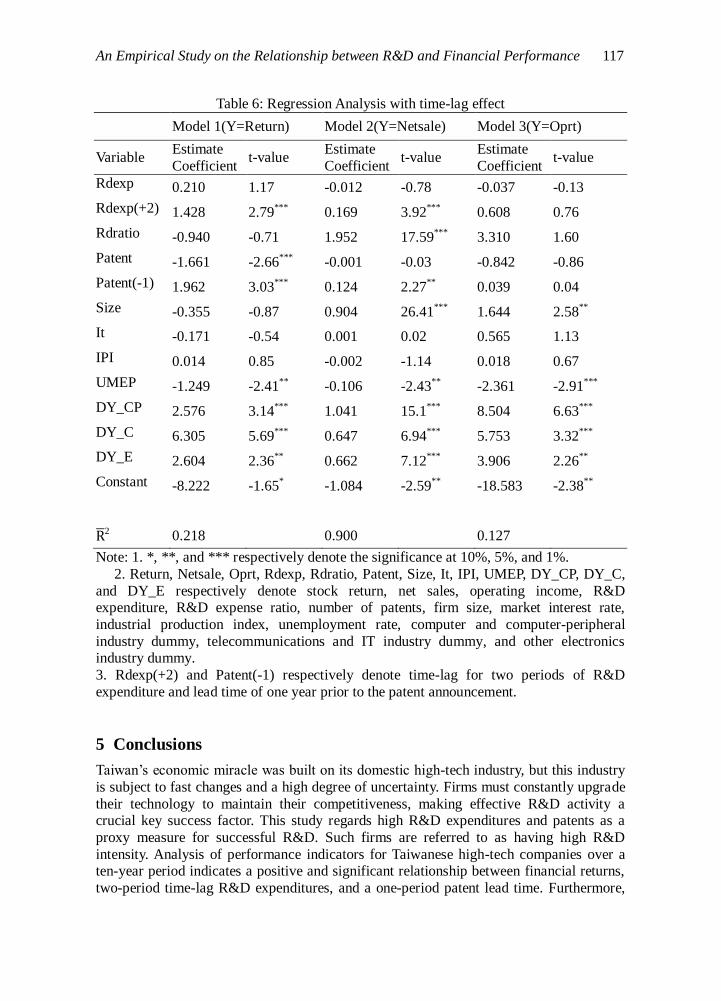
In Table 6, for model 1, return is positive and significant with two-period time-lag R&D
expenditure and one-period patent time-lead; however, the relationship between return and number of patents is negative and significant. The lifecycles of technology products
are notoriously short, as is the cycle of patent-driven enhanced corporate performance.
The benefits of patent protection begin with the application process but end after the
patent expires. Even if the firm no longer benefits from the patent, it still incurs the expense of maintain it, which negatively impacts the firm’s return. Nevertheless, we find
indirect evidence to support hypothesis 1. Returns are actually influenced by R&D
expenditures and the number of patents the firm holds, but this effect can’t be observed in the current period due to the complicated patent application process and uncertainty of
R&D outcomes.
An Empirical Study on the Relationship between R&D and Financial Performance 117
Table 6: Regression Analysis with time-lag effect
Model 1(Y=Return) Model 2(Y=Netsale) Model 3(Y=Oprt)
Variable Estimate
Coefficient t-value
Estimate
Coefficient t-value
Estimate
Coefficient t-value
Rdexp 0.210 1.17 -0.012 -0.78 -0.037 -0.13
Rdexp(+2) 1.428 2.79***
0.169 3.92***
0.608 0.76
Rdratio -0.940 -0.71 1.952 17.59***
3.310 1.60
Patent -1.661 -2.66***
-0.001 -0.03 -0.842 -0.86
Patent(-1) 1.962 3.03***
0.124 2.27**
0.039 0.04
Size -0.355 -0.87 0.904 26.41***
1.644 2.58**
It -0.171 -0.54 0.001 0.02 0.565 1.13
IPI 0.014 0.85 -0.002 -1.14 0.018 0.67
UMEP -1.249 -2.41**
-0.106 -2.43**
-2.361 -2.91***
DY_CP 2.576 3.14***
1.041 15.1***
8.504 6.63***
DY_C 6.305 5.69***
0.647 6.94***
5.753 3.32***
DY_E 2.604 2.36**
0.662 7.12***
3.906 2.26**
Constant -8.222 -1.65* -1.084 -2.59
** -18.583 -2.38
**
R 2 0.218 0.900 0.127
Note: 1. *, **, and *** respectively denote the significance at 10%, 5%, and 1%.
2. Return, Netsale, Oprt, Rdexp, Rdratio, Patent, Size, It, IPI, UMEP, DY_CP, DY_C,
and DY_E respectively denote stock return, net sales, operating income, R&D expenditure, R&D expense ratio, number of patents, firm size, market interest rate,
industrial production index, unemployment rate, computer and computer-peripheral
industry dummy, telecommunications and IT industry dummy, and other electronics industry dummy.
3. Rdexp(+2) and Patent(-1) respectively denote time-lag for two periods of R&D
expenditure and lead time of one year prior to the patent announcement.
5 Conclusions
Taiwan’s economic miracle was built on its domestic high-tech industry, but this industry
is subject to fast changes and a high degree of uncertainty. Firms must constantly upgrade
their technology to maintain their competitiveness, making effective R&D activity a crucial key success factor. This study regards high R&D expenditures and patents as a
proxy measure for successful R&D. Such firms are referred to as having high R&D
intensity. Analysis of performance indicators for Taiwanese high-tech companies over a ten-year period indicates a positive and significant relationship between financial returns,
two-period time-lag R&D expenditures, and a one-period patent lead time. Furthermore,
118 Feng-Jui Hsu, Mu-Yen Chen, Yu-Cheng Chen and Wei-Chieh Wang
net sales are positively significant with R&D expenditure, R&D expense ratio, and
number of patents, while lagged R&D expenditure is also positive and significant with net sales. Operating income is positive and significant with R&D expense ratio, but the
lagged variables are insignificant with operating income. That is to say, high-tech industry
firms with high R&D intensity will have better stock returns and net sales, but worse
operating income. Firms with high R&D intensity may have increased operating expenses and reduced operating income. Though R&D activity increases net sales, increased
operating costs finally result in reduced operating income. In addition, the contribution of
R&D activity to operating income may not materialize for quite some time. According our empirical results, high R&D intensity firms may enjoy abnormal stock
price returns, but there is no impact on operating income. This implies that more time is
needed for R&D inputs to contribute to operating income, or that such inputs have no impact on operating income at all. However, managers may be influenced by investor
misapprehension that R&D investment can provide quick benefits to financial results, and
thus continue to expand R&D investments in a bid to raise their firm's stock price.
References
[1] N. Baker and J. Freeland, Recent advances in R&D benefit measurement and project
selection methods, Management science, 21(2), (1975), 1164-1175. [2] P. Beneito, The innovative performance of in-house and contracted R&D in terms of
patents and utility models, Research Policy, 35(4), (2006), 502-517.
[3] P. G. Berger and E. Ofek, Diversification's effect on firm value, Journal of financial economics, 37(1), (1995), 39-65.
[4] A. S. Bharadwaj, S. G. Bharadwaj and B. R. Konsynski, Information technology
effects on firm performance as measured by tobin's q, Management science, 45(7),
(1999), 1008-1024. [5] D. M. Cutler, J. M. Poterba and L. H. Summers, What moves stock prices, The
Journal of Portfolio Management, 15(3), (1989), 4-12.
[6] B. Crèpon, E. Duguet and J. Mairessec, Research, innovation and productivity: An econometric analysis at the firm level, Economics of Innovation and new
Technology, 7(2), (1998), 115-158.
[7] D. M. De Carolis, Competencies and imitability in the pharmaceutical industry: An analysis of their relationship with firm performance, Journal of management, 29(1),
(2003), 27-50.
[8] Z. Deng, B. Lev and F. Narin, Science and technology as predictors of stock
performance, Financial Analysts Journal, 55(3), (1999), 20-32. [9] L. Edvinsson, Developing intellectual capital at skandia, Long range planning,
30(3), (1997), 366-373.
[10] L. Edvinsson and M. S. Malone, Intellectual capital: Realizing your company's true value by finding its hidden brainpower, Collins, March, (1997), 26-28.
[11] H. Ernst, Patenting strategies in the german mechanical engineering industry and
their relationship to company performance, Technovation, 15(4), (1995), 225-240.
[12] J. K. Galbraith, How to control the military, New American Library, 1969. [13] L. A. Hall and S. Bagchi-Sen, A study of R&D, innovation, and business
performance in the canadian biotechnology industry, Technovation, 22(4), (2002),
An Empirical Study on the Relationship between R&D and Financial Performance 119
231-244.
[14] M. Hirschey and J. J. Weygandt, Amortization policy for advertising and research and development expenditures, Journal of Accounting Research, 23(1), (1985), 326-
335.
[15] G. K. Jones, A. Lanctot JR and H. J. Teegen, Determinants and performance impacts
of external technology acquisition, Journal of Business venturing, 16(3), (2001), 255-283.
[16] G. G. Judge, W. E. Griffiths, R. C. Hill, H. L.¨utkepohl and T. C. Lee, The Theory
and Practice of Econometrics, Second edition, Wiley, New York, 1985. [17] W. S. Kim and E. H. Sorensen, Evidence on the impact of the agency costs of debt
on corporate debt policy, Journal of Financial and quantitative analysis, 21(2),
(1986), 131-144.
[18] B. Lev and T. Sougiannis, Penetrating the book‐to‐market black box: The R&D
effect, Journal of Business Finance & Accounting, 26(3), (1999), 419-449.
[19] G. L. Lilien and E. Yoon, Determinants of new industrial product performance: A
strategic re-examination of the empirical literature, Engineering Management, IEEE
Transactions on, 36(1), (1989), 3-10. [20] M. L. Lin, The Impacts of Research and Development on Operation Performance
and Equity Valuation, Journal of Tainan University of Technology, 23(1), (2007),
115-133. [21] T. R. Madanmohan, U. Kumar and V. Kumar, Import-led technological capability: A
comparative analysis of indian and indonesian manufacturing firms, Technovation,
24(12), (2004), 979-993. [22] D. J. Miller, M. J. Fern and L. B. Cardinal, The use of knowledge for technological
innovation within diversified firms, Academy of Management Journal, 50(2),
(2007), 307-325.
[23] R. R. Nelson, The role of knowledge in R&D efficiency, The Quarterly Journal of Economics, 97(3), (1982), 453-470.
[24] O. Toivanen, P. Stoneman and D. Bosworth, Innovation and the market value of uk
firms, 1989–1995*, Oxford Bulletin of Economics and Statistics, 64(1), (2002), 39-61.
[25] N. Venkatraman and V. Ramanujam, Measurement of business performance in
strategy research: A comparison of approaches, Academy of management review, 11(4), (1986), 801-814.