an end user perspective on the cost of solar photovoltaic
TRANSCRIPT

An End User Perspective on the Cost of Solar
Photovoltaic Energy Systems Installed by
Commercial Organizations
Kenton D. Swift
May 14, 2012

Do Commercial Solar PV System
Installations Make Economic Sense?
Potential users of solar photovoltaic energy
systems (solar PV systems) are confused as to
whether such systems make economic sense
2

Why are potential end users confused?
• The factors impacting returns from solar PV
systems vary dramatically based on location,
and across time
• These factor include:
• Levels of solar radiation,
• Government and utility incentives, and
• The cost of grid produced electricity
3

Purpose of Study
• The purpose of this study is to compare financial returns
from the installation commercial solar PV systems in
specific locations across the US for 2012
• Returns are calculated using local solar radiation levels,
and electricity costs, and all available tax incentives and
rebates
4

For Business Organizations the Solar PV
System Purchase Decision is a
Capital Budgeting Decision
• Site Specific Information is needed • Business organizations want site specific comparisons between the
total cost of a solar PV system and grid produced electricity
• Simple parity is not enough • capital must be committed to purchase a solar PV system, and
capital is limited
• The return from the solar PV system must be
favorable • An investment in a solar PV system must provide a return that
compares favorably to other investment opportunities
5

This Study Provides Capital Budgeting
Results in Two Forms • The results are provided in two forms:
1. Internal Rate of Return (IRR)
oThe internal rate of return of the solar PV system
compared to grid produced electricity
2. Levelized Cost of Electricity (LCOE)
oThe levelized cost of the electricity (LCOE) produced
by the solar PV system compared to the LCOE of
grid produced electricity
6

Considering Loans in the Analysis
• In capital budgeting, financing is normally
separated from the analysis of the return on the
asset being purchased --- except, for calculating
the cost of capital rate used in discounting future
cash flows
7

Cost of Capital
• A cost of capital rate must be used in the LCOE
calculations
• A firm’s cost of capital is the weighted average
cost of each type of capital including DEBT and
EQUITY
• The weighted average cost of capital used in this
study = 7.0%
8
Debt Equity

Factors to Consider in Solar PV System
Investment Decision • Present and Future Cost of Electricity
• Solar Radiation
• Financial Incentives
• Tax and other incentives provided by federal, state, and
local governments, and by utility companies
• PV System Cost and Performance
Note: the data used in the study is site specific to
the extent possible
9

Case Studies for This Study
• 50-kilowatt commercial installation of a solar PV system in the following four locations:
• Honolulu, Hawaii
• Newark, New Jersey
• Phoenix, Arizona
• Minneapolis, Minnesota
10

System Assumptions
• System size - 50-kilowatts
• System life – 25 years
• Installed cost before incentives - $5.25 per DC watt
($262,500 total)
• DC-to-AC Derate factor – 77%
• Performance degradation – 20% over the system’s 25
year life
• Inverter cost – 9.5% of the installed system cost;
replaced after 13 years
11

General Assumptions
• Solar radiation – panels are flat-plate collectors
pointed south with a tilt angle equal to the site’s latitude
• Initial price of electricity - Average retail price for
commercial and industrial users for the first 10 months of
2011 in the state where the solar PV system is installed
• Nominal annual electricity inflation rate – 1.6%
12

Income Tax Assumptions
• Income tax rates – Marginal income tax rate is the top
corporate federal rate (35%), and the top state rate
• Depreciation – The solar PV system is a 5-year
MACRS asset, and 50% bonus depreciation is allowed in
the first year under IRC Sec. 168(k) for 2012
• Federal income tax credit – A 30% federal income
tax credit is available
• Grants and rebates – Fully taxable in the year
received
13

Case Studies - Location Information
14
Honolulu
Newark
Phoenix
Minneapolis
Initial system cost before
rebates and credits $274,313 $262,500 $262,500 $262,500
State income tax credit 35% 10%
Maximum state corporate income tax
rate 6.4% 9.0% 6.968% 9.8%
Utility rebates/performance-based
payments SREC* PBI* Average annual hours of
solar radiation per day 5.7 4.5 6.5 4.6 Initial price of electricity
per kilowatt-hour $0.301 $0.127 $0.082 $0.076

Honolulu
• Inputs:
• Solar radiation per day = 5.7
• Top corporate income tax rate = 6.4%
• Sales (excise) tax on purchase = 4.5%
• State income tax credit = 35% of installed cost
• Price of electricity = $0.301
• Results:
• LCOE of solar PV system – after incentives = $0.038
• LCOE of grid produced electricity = $0.202
• Internal Rate of return on system installation = 33.32%
15

Newark
• Inputs:
• Solar radiation per day = 4.5
• Top corporate income tax rate = 9.0%
• Significant Solar Renewable Energy Certificates (SRECs)
available for 15 years
• Price of electricity = $0.127
• Results:
• LCOE of solar PV system – after incentives = $0.042
• LCOE of grid produced electricity = $0.081
• Internal Rate of return on system installation = 10.16%
16

Phoenix
• Inputs:
• Solar radiation per day = 6.5
• Top corporate income tax rate = 6.968%
• State income tax credit = 10% of installed cost up to $25,000
• Performance Based Incentives (PBIs) available - $0.08/kwh
• Price of electricity = $0.082
• Results:
• LCOE of solar PV system – after incentives = $0.068
• LCOE of grid produced electricity = $0.055
• Internal Rate of return on system installation = 5.36%
17
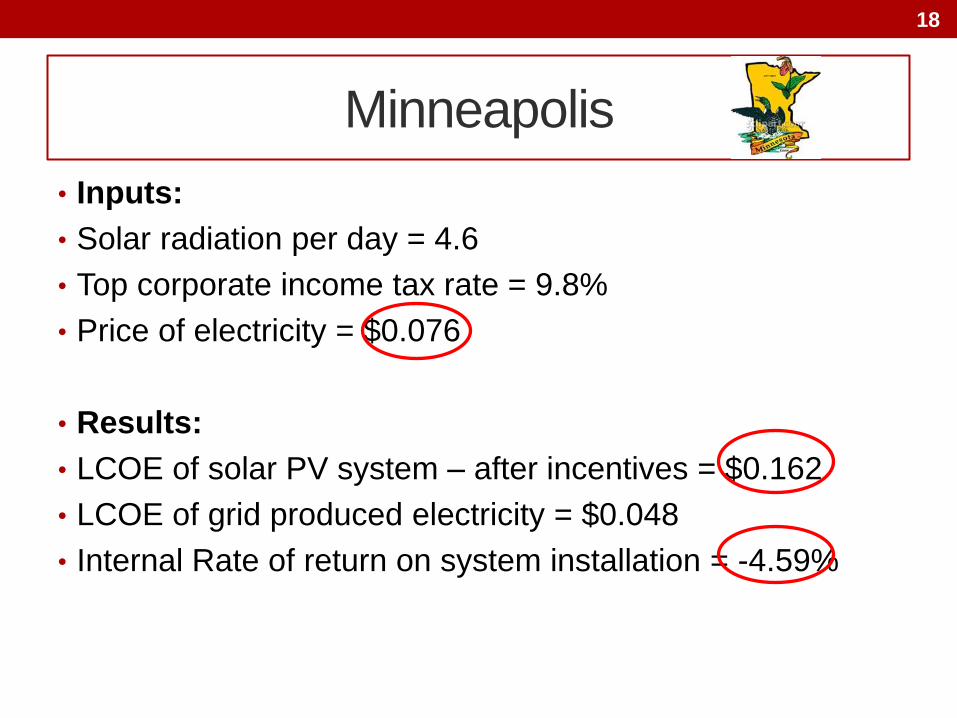
Minneapolis
• Inputs:
• Solar radiation per day = 4.6
• Top corporate income tax rate = 9.8%
• Price of electricity = $0.076
• Results:
• LCOE of solar PV system – after incentives = $0.162
• LCOE of grid produced electricity = $0.048
• Internal Rate of return on system installation = -4.59%
18

Results - Summary
Honolulu
Newark
Phoenix
Minneapolis
LCOE of PV
system after all
incentives $0.038 $0.042 $0.068 $0.162
LCOE of grid
produced
electricity $0.202 $0.081 $0.055 $0.048
Internal rate of
return (IRR)
over 25-year life 33.32% 10.16% 5.36% -4.59%
19

Summary and Conclusions
• The results demonstrate that financial returns from solar
PV systems vary dramatically depending on the location
where they are installed
• The IRRs from the case studies vary from a return of
33.32% to a return of -4.59%
• The reasons for the variations in return include:
• State incentives
• Grid produced electricity rates
• Levels of solar radiation
20