an environmen review and strategy · 3-10 uncontrolled boiler nox 3-11 sox emissions 3-12 fbc stack...
TRANSCRIPT

June 1993 • NREL{fP-420-5637
Electricity from An Environmen and Strategy
• Iomass: Review
Antares Group Inc. Landover, MD
• ..... ·��-· •. . •. ., �-·-· -
• National Renewable Energy Laboratory A Division of Midwest Research Institute Operated for the U.S. Department of Energy Under Contract No. DE-AC02-83CH10093

' I 1
Feedstock Production
Electricity from Biomass: An Environmental Review and Strategy
Prepared for:
National Renewable Energy Laboratory Golden, Colorado
and
Solar Thermal & Biomass Power Program Office of Solar Energy
U.S. Department of Energy
----�-� � Transportation
storage
Prepared by:
•
ANTARES GROUP INC.
Power Generation
8240 Professional Place, Suite 207 Landover, Maryland 20785
{301 } 731-1 900
NREL/TP- 4 2 0- 5 6 37 • UC Category: 2 4 7 • DE930 1 0038 NREL technical monitor: R.P. Overend
Prepared under subcontract no. VZ- 2 - 1 2 170- 1
___,..� ft Transmission

This publication was reproduced from the best available camera-ready copy
submitted by the subcontractor and received no editorial review at NREL.
NOTICE
NOTICE: This report was prepared as an account of work sponsored by an agency of the United States government. Neither the United States government nor any agency thereof, nor any of their employees, makes any warranty, express or implied, or assumes any legal liability or responsibility for the accuracy, completeness, or usefulness of any information, apparatus, product, or process disclosed, or represents that its use would not infringe privately owned rights. Reference herein to any specific commercial product, process, or service by trade name, trademark, manufacturer, or otherwise does not necessarily constitute or imply its endorsement, recommendation, or favoring by the United States government or any agency thereof. The views and opinions of authors expressed herein do not necessarily state or reflect those of the United States government or any agency thereof.
Printed in the United States of America Available from:
National Technical Information Service U.S. Department of Commerce
5285 Port Royal Road Springfield, VA 22161
Price: Microfiche A01 Printed Copy A07
Codes are used for pricing all publications. The code is determined by the number of pages in the publication. Information pertaining to the pricing codes can be found in the current issue of the following publications which are generally available in most libraries: Energy Research Abstracts (ERA); Government Reports Announcements and Index (GRA and/); Scientific and Technical Abstract Reports (STAR); and publication NTIS-PR-360 available from NTIS at the above address.
4' .. f. • Printed on recycled paper ...

' l j I i
I , I
I J
- i i
- l l
l I r .)
ACKNOWLEDGEMENTS
The authors of this report would l ike to acknowledge those individuals who contributed to its development in concept, performance, and review.
At the National Renewable Energy Laboratory in Golden, Colorado, Drs. Ralph Overend and Richard Bain provided valuable guidance in establishing the objectives of this document and valuable comments during its performance and review. Messrs. Robert Annan and Gary Burch in the Office of Solar Energy Conversion of the U.S. Department of Energy sponsored our research. At ANTARES GROUP INC., Michael Panich reviewed earlier drafts and provided creative new ideas while Pete McCallum, Melanie Bennett, and Chuck Kovarik aptly lent research assistance and editorial review. We also appreciate the numerous government and industry reviewers who took part in the peer review process and commented on an earlier draft of the report.
Christian P. Demeter Edward E. Gray E. Scott Piscitello

TABLE OF CONTENTS
1.0 SUMMARY OF ENVIRONMENTAL ISSUES AND TRENDS ................... 1-1
1.1 INTRODUCTION . . . . ... . . . . . . . . . . . . . . . . .... . . ... . .......... 1-1
1.2 CLEAN AIR AND CONVENTIONAL POLLUTANTS . ...... . . . ........ 1-3
1.3 CLEAN AIR AND AIR TOXICS . . . . . . . . . . . . ......... . .. . . . ...... 1-5
1.4 THE CLEAN WATER ACT OF 1977 . . . . . . . . . . . . . . . . . . . . . . . . . . . . . 1-6
1.5 SOLID AND HAZARDOUS WASTES . . ... . . ....... . ... . .. . ...... 1-7
1.6 FEDERAL GOVERNMENT ENVIRONMENTAL CONCERNS . . . . . . . . . . . 1-7
1.7 TOXIC SUBSTANCES CONTROL . . . . . . ..... . ....... . .. . . . . ... . 1-8
1.8 PESTICIDES . . . . . . . . . . . . . . . . . . . . . . . . . . . . . . . . . . . . . . . . . . . . . 1-8
1.9 ENDANGERED SPECIES . . . . . . . . . . . . . .. . .. . .. . . . . . . . . . . .... . 1-8
• •
2.0 REGULATORY CONTEXT . . . . . . . . . . . . . . . . . . . . . ..... . . . . . . .. . ... . . . . . 2-1 1
2.1 INTRODUCTION . . .. . . . . . . . . . . . . . . . . . . . ... . .. . . ... . . . ...... 2-1
2.2 CLEAN AIR ACT AMENDMENTS OF 1990 ....................... 2-1
2.2.1 Ambient Air Quality . . . . . . . . . . . . . . . . . . . . . . . . . . . . . . . . . . . . 2-1
2.2.2 Hazardous Air Pollutants . . . . . . . . . . . . . . . . . . . . . . . . . . . . . . . . 2-7
2.2.3 Acid Rain . . . . . . . . . . . . . . . . . . . . . . . . . . . . . . . . . . . . . . . . . . . 2-9
2.2.4 Operating Requirements and Permits . .. . . . . . . . . . . ...... . . . 2-1 2
2.3 THE CLEAN WATER ACT OF 1977 ............................ 2-1 4
2.3.1 Non-Point Pollution . . . ....... . . . .. . . . . . .... . . ... . ..... 2-1 5
2.3.2 Point Source Effluent Umitations . . . . . . .... . . . . . . . . . . .. . .. 2-1 7
2.3.3 Point Source Water Quality Criteria . . . . . . . . . . . . . . . . . . . . . . . 2-2 0
2.4 RESOURCE CONSERVATION AND RECOVERY ACT OF 1976 ....... 2-2 2
2.4.1 Subtitle C - Hazardous Waste Management . . . . . . . . . . . . . . . . . 2-2 2
2.4.1 .1 Combustion Ash . . . . . . . . . . . . . . . . . . . . . . . . . . 2-2 3
2.4.1.2 Waste Wood or Residue Resource? . . . . . . . . . . . . 2-2 4
2.5 NATIONAL ENVIRONMENTAL POLICY ACT OF 1969 .............. 2-2 6
2.6 OTHER RELEVANT ENVIRONMENTAL LEGISLATION . . . . . . ..... . . 2-2 8
2.6.1 Toxic Substances Control Act of 1976 . . . . . . . . . . . . . . . . . . . . . 2-2 8
2.6.2 Federal Insecticide, Fungicide, and Rodenticide Act of 194 7 . . . . . 2-2 8
2.6.3 Endangered Species Act of 1973 . . . . . . . . . . . . . . . . . . . . . . . . . 2-2 9
3.0 BIOMASS POWER SYSTEMS ENVIRONMENTAL CHARACTERIZATION . . . . .... 3-1
3.1 INTRODUCTION . . . . . . . . . . . ..... . . . . . . . . . . .... . . . . . . ... . . . . 3-1
3.2 BIOMASS FUEL PRODUCTION, HANDLING, AND STORAGE . . . . . . . . . 3-3
3.2.1 Technology Overview . . . . . . . . . . . . . . . . . . . . . . . . . . . . . . . . . . 3-3
3.2.2 Environmental Effects and Controls . . . .. . . . .... . . . . . . . . .... 3-5
3.2.3 Regulated Waste Streams and Impacts .. . . ..... . . .. . ... . . . . 3-8
3.2.4 . Feedstock Composition Characteristics Affecting Conversion ...... 3-9
3.3 FLUIDIZED-BED CONVERSION . . . . . . . . . ... . . . . . . . . . .. . . ..... 3-1 2
3.3.1 Technology Overview . . . . .. . . . . . . . . . . . ..... . . .. . . . . . .. 3-1 2
3.3.2 Environmental Discharges and Controls . . . . . . . . . ... . . . . . . .. 3-1 4
3.3.3 Regulated Waste Streams . . . . . . . . . . . . . . . . . . . . . . . . . . . . . . 3-2 1
3.4 GASIFICATION GAS TURBINE TECHNOLOGY . . . . .... . .. . . .... . . 3-3 2
ii
"' .
' ·, r i
,; ...

' t
I 1 >
. I !
. I I
.v
··r )
J I
. )
I . l
. .Y
' . j l I . (
3.4.1 Technology Overview . . . . . . . . . . . . . . . . . . . .. . . . . . . . . . . . . . 3-3 2
3.4.2 Environmental Discharges and Controls ... . . ..... . . . ... . ... 3-3 4 3.5 BIOCRUDE GAS TURBINE TECHNOLOGY . . . . . . . . . . . . . . . . . . . . . . 3-4 4
3.5.1 Technology Overview . . . . . . . . . . . . . . . . . . . . . . . . . . . . . . . . . 3-4 4
3.5.2 Environmental Discharges and Controls . . . . . . ............. . 3-4 6
3.5.3 Regulated Waste Streams . .. . ... · . . . . . . . . . . . . . . . . . . . . . . . 3-4 9
4.0 THE BIOMASS POWER ENVIRONMENTAL PROGRAM . .. . ....... . ... . . .... 4-1
4.1 INTRODUCTION ... . ... . . ........ . .... . . ..... . . . . . ...... . . . 4-1
4.2 PROGRAM INTEGRATION AND OUTREACH ELEMENT . . . . ... . . . . . . 4-4
4.2.1 Environmental Assessment Baseline and Full Fuel Cycle Program Sub-Element . . ... . . . . . . .. . .. . . . . . . . . . ...... . . ...... . 4-4
4.2.2 Regulatory and Legislative Monitoring Activity Sub-Element . . . . . . 4-5
4.2.3 Technology Transfer, Communications, Education Sub-Element . . . 4-6
4.2.4 Budgeting and Oversight Sub-Element . . ...... . .. . ......... . 4-6
4.3 RURAL DEVELOPMENT AND THE ENVIRONMENT ELEMENT .. . . . . .. 4-8
4.3.1 Rural Areas Assessment Sub-Element .. . . . . ... . ... . . . ..... . 4-8
4.3.2 Habitat Assessment Element . . ..... . . . . .. . ....... . . . ..... 4-9
4.3.3 DFSS Environmental Issues Program Element ....... . . .. . . ... 4-9
4.4 CLEAN AIR RESEARCH ELEMENT ............................ 4-1 1
4.4.1 Air Toxics Research Program . . ...... . . . . ..... . . . .. . . . . . 4-1 1
4.4.2 The NOx Sub-Element .. . . ... . . . .. . . . .. . ... . . . ........ . 4-1 1
4.4.3 S02 Reduction Sub-Element . . .. . .. . . . ... . ........ . . . ... 4-1 2
4.4.4 C02 Sequestration Program . . . . . . . . . . . . . . . . . . . . . . . . . . . . 4-1 3
4.5 CLEAN WATER AND WATER AVAILABILITY RESEARCH ELEMENT . . . 4-1 5 4.5.1 Water Quantity, Availability Sub-Element .. . . . . . . . . . . . . . .... 4-1 5
4.5.2 Water Quality Program Sub-Element . . . . . . . . .......... . . . . 4-1 5
4.6 RESIDUE AND BYPRODUCT TECHNICAL AND MARKET RESEARCH ELEMENT . . . . . . . . . . . . . . . . . . . . . . . . . . . . . . . . . . . . . . . . . . . . . . . 4-1 7
4.6.1 Byproduct Markets (Ash and Char) and Characterizations Study Sub-Element . . . . . . .. . . ... . . . . . . . . . . ......... . .. . . . . 4-1 7
4.6.2 Wood Residue Characterization and Assessment Sub-Element . . . 4-1 8
4.6.3 Pyrolysis Oil Testing Sub-Element . . . .. . . . .... . ... . ..... . . 4-1 9
4.7 INTERNATIONAL ENVIRONMENTAL OPPORTUNITIES ELEMENT . ... 4-2 0
APPENDICES
Appendix A: Clean Air Act Implementation Plan Appendix B: Mandatory Class I Areas Appendix C: Relevant Mandated CAAA Studies Appendix D: Ultimate Analysis and Ash Composition Data Appendix E: Emission Rate Units
iii

EXHIBITS
2-1 Federal and State of Hawaii Ambient Air Quality Standards 2-2 Areas Designated Non attainment for PM-1 0 Particulates 2-3 Areas Designated Nonattainment for Ozone 2-4 EPA's Expected NOx RACT, lb/MMBtu 2-5 NESCAUM Recommended NOx RACT 2-6 EPA Air Contaminant Emission Threshold Limits 2-7 California Study Results 2-8 Agricultural Chemicals 2-9 Effluent Limitations, 1982 2-10 EPA Water Quality Criteria for Priority-Pollutant Elements 2-11 NEPA Compliance Decision Tree 2-12 Biomass Feedstocks and Endangered Species Sites
3-1 Technology Options 3-2 Feedstock Sources 3-3 Environmental Impacts of Feedstock Production Processes 3-4 _ Sampling of Biomass Feedstocks 3-5 Ash Content of Fuels 3-6 FBC Cycle 3-7 Evaluation Matrix for Environmental Impacts 3-8 PICs Generated by FBC 3-9 Concentrations of Metals in Particulates 3-10 Uncontrolled Boiler NOx 3-11 SOx Emissions 3-12 FBC Stack Emissions for Existing Facilities 3-13 FBC Stack Emissions for New Facilities 3-14 Annual Ash Quantities 3-15 Ash Metal Concentrations 3-16 Regeneration Effluents 3-17 Cooling Tower Effluents 3-18 Integrated Gasification Combined Cycle 3-19 Materials Evaluated for Environmental Impacts 3-20 NoX Emissions for JGCC 3-21 Particulates in IGCC 3-22 Trace Metal Concentrations for IGCC 3-23 IGCC Stack Emissions for New Facilities 3-24 IGCC Stack Emissions for Existing Facilities 3-25 Ash Production Levels 3-26 Biocrude:..fired Steam Injected Combustion Turbine 3-27 Materials Evaluated for Environmental Impacts
4-1 SOLAR 2000 Milestones for Biomass Power 4-2 SOLAR 2000 Environmental Building Blocks for Biomass Power
iv
Page# 2-2 2-4 2-5 2-6 2-6 2-7 2-9 2-16 2-18 2-21 2-27 2-30
3-1 3-4 3-5 3-9 3-10 3-12 3-15 3-16 3-18 3-20 3-21 3-23 3-24 3-26 3-27 3-29 3-30 3-34 3-35 3-37 3-38 3-39 3-40 3-41 3-42 3-45 3-46
4-2 4-3
' .
- y
L) ,���
,_ �
t:l !::1
fn ,i .. "
i"'F!
� -i -' ·I
(}
�)
� �
' ., it �
" c
. , ••
� � '! i .. _
� !
�-�
n
"

, I
t
'· J
j
As BACT
BAT BOT BMP c Ca CAAA
CaO cc CCA CEQ
CFR Cl co C02 Cr CWA CZMA
DFSS
DO DOE dscf DSM EERE
EIS
EP ESP EPA
EPRI
FBC FBN FBNOX FFB FGD FIFRA
FONSI
Acronyms and Abbreviations
arsenic best available control technology best available technology bone dry ton best management practice carbon calcium Clean Air Act Amendments calcium oxide Oime) combined cycle chromated copper arsenate Council on Environmental Quality Code of Federal Regulations chlorine carbon monoxide carbon dioxide chromium Clean Water Act Coastal Zone Management Act dedicated feedstock supply system dissolved oxygen U.S. Department of Energy dry standard cubic foot demand-side management Energy Efficiency and Renewable Energy (U.S. DOE) environmental impact statement extractive procedure electrostatic precipitators Environmental Protection Agency Electric Power Research Institute fluidized-bed combustor fuel-bound nitrogen fuel-bound nitrogen oxides fabric filter baghouse flue gas desulfurization Federal Insecticide, Fungicide and Rodenticide Act finding of no significant impact
v
FS FWS
GIS
GT GW GWe H HAP HAT HC HEC Hg HGCU HON HPEC
HRSG
IGT
IPP
IPCC
ISTIG
K kWh LAER
LISA
MACT
MCW MMBtu
Mn MW MWe N Na NAAQS
U.S. Forest Service U.S. Fish and Wildlife Service geographic information system gas turbine gigawatts gigawatts electric hydrogen hazardous air pollutant humid air turbine hydrocarbon herbaceous energy crop mercury hot gas cleanup hazardous organic NESHAP high-productivity energy crop heat recovery steam generator hydrogen sulfide integrated gasification combined cycle Institute of Gas Technology independent power producer Intergovernmental Panel on Climate Change intercooled steam-injected gas turbine potassium kilowatt hour lowest achievable emissions rates low impact sustainable agriculture maximum achievable control technology moisture content wet basis million British thermal units manganese megawatts megawatts electric nitrogen sodium National Ambient Air Quality Standards

NEPA National Environmental Policy Act
NESCAUM -- Northeast States for Coordinated Air Use Management
NESHAP National Emission Standards for Hazardous Air Pollutants
NOAA National Oceanographic and Atmospheric Administration
NOx nitrogen oxides N02 nitrogen dioxide NPDES National Pollutant
Discharge Elimination System
NPS National Park Service NREL National Renewable Energy
Laboratory 0 Oxygen OSHA Occupational Safety and
Health Administration PAHs polycyclic aromatic
hydrocarbons Pb lead PC pulverized coal PCBs polychlorinated biphenyls PDU process development unit PFBC pulverized fluidized-bed
combustor PG&E Pacific Gas and Electric Co. PIC product of incomplete
combustion PICHTR Pacific International
Center for High Technology Research
PM1o particulate matter smaller than 10 microns
POMs polycyclic organic materials POTW publicly owned treatment
works ppbw parts per billion weight ppmv parts per million volume ppmvd parts per million volume,
dry basis PSD Prevention of Significant
Deterioration PUC public utility commission RACT reasonably available control
technology RCRA Resource Conservation
and Recovery Act s sulfur SCR selective catalytic
reduction
SIP state implementation plan SNCR selective non-catalytic
reduction S02 sulfur dioxide sox sulfur oxides SRWC short-rotation woody crop STIG steam-injected gas turbine TAC Timber Association of
California TCLP Toxic Characterization
Leaching Procedure TPD ton per day TSCA Toxic Substances Control
Act TVA Tennessee Valley Authority USDA U.S. Department of
Agriculture voc volatile organic
compound WEPCO Wisconsin Electric Power
Company WTB whole tree burner
vi
..
Q' ((
' �( .:-,, �
rlj
�
' � ; .,
� �-
A""
r!
.: '
- J
s
-. _;
r .1
�.;.
,...,
'· � ... __
"�'
\ :i 13.'!t
-; �
• •
ft ! ' ,] "' IIi
!" � :I i
� �
'� d
......
·. �
I r
1 .0 SUMMARY OF ENVIRONMENTAL ISSUES AND TRENDS
1 .1 INTRODUCTION
Energy research and development program managers now recognize the prominent role environmental issues have in technology R&D planning. The recently enacted Energy Policy Act of 1992 is peppered with references to cooperative work between the Department of Energy (DOE) and the Environmental Protection Agency (EPA). In February 1991 , the DOE and the Commission of The European Communities signed a joint statement to .. develop a comparative analytical methodology and develop the best range of estimates of external costs from secondary sources•• for eight fuel cycles and four conservation options. President Clinton recently announced that the United States intends to comply with the C02 reduction provisions of the Rio Accord. No energy producing technology is completely benign to the environment, but environmental impacts, if properly valued and managed, can be mitigated with minimal adverse impact on economic growth. Indeed, potential growth opportunities exist for new technologies which convert energy efficiently and at competitive costs. The environmental assessment and strategy for the DOE Biomass Power Program, laid out in the fol lowing chapters, presents a realistic review and strategic plan for biomass power program managers to augment the Biomass Power R&D program. It suggests a proactive approach working with multiple parties interested in the successful commercialization of a biomass power industry, including feedstock growers, state regulators, Forest Service and agricultural agents, utilities and independent power producers, rural electric cooperatives, environmental activists, and others. Confronting environmental concerns and informing the public about environmental benefits 11Up front .. will be a keystone in the Biomass Power Environmental Strategy.
Significant environmental benefits can be obtained by using biomass fuels in direct combustion, gasification, or pyrolysis systems, although some uncertainties still exist. Sulfur dioxide (SO� and carbon dioxide (CO� production will be far lower for biomass power systems than for coal combustion and conversion systems. Emissions of potential air taxies from direct combustion of biomass and combustion of biocrude oils will require further characterization, but will probably be less problematic than the air taxies emissions from coal or coal-derived liquids. Water quality impacts should be smaller for biomassfueled systems than for coal-fueled systems due to smaller systems Q.e., 50 MW for biomass versus 1 00-1 000 MW for coal) and fewer fuel pile leachate concerns. Water usage in biomass combustion (Rankine cycle and integrated gasification combined cycle) is comparable to that in coal combustion. Feedstock growth could require significant use of water and petrochemical-based fertilizer, pesticides and herbicides - raising concern about nutrient and soil run-off and the absolute renewable nature of the biomass feedstock. Solid waste, in the form of ash, is general ly viewed as non-hazardous and is generally produced in smaller quantities than in coal-fueled systems. Solid waste production is lower because of the relatively low ash content of biomass fuel. The classification of some biomass feedstock as waste can, however, be problematic, especially at the state regulatory level. Long-term ecological effects such as
1-1

destruction/alteration of wildlife habitat, loss of or improvements to biodiversity, and sustainability of soil productivity are other issues unique to the biomass fuel resource, and deserve further attention. Occupational health and safety issues will also require some study. The harvesting and handling of wood presents occupational hazards comparable to those of coal mining, except that more accidents and injuries are associated with biomass harvesting. However, biomass does not have the long-term health risks associated with coal, such as chronic lung disease.
To develop a biomass environmental review and strategy requires some understanding of both the value that we, as a society, place on the environment and what the potential environmental impacts of biomass are. The value we place on the environment is not yet fully realized in our current market system, although attempts have been made to value environmental externalities and include these values in, for example, new electric power generation. Unfortunately, the linkages between the environmental emissions and actual damages are difficult to quantify. Attempts to value these damages have to date been limited to case studies. The political process, however, has attempted to respond to the social problem of pollution with a wide range of laws and regulations at the Federal, state, and local levels. Chapter 2 of this report, Regulatory Context, reviews some of the more important laws which will affect the Biomass Power Program's environmental strategy. The emphasis is on the Federal jurisdiction not because of pre-eminence or authority, but because of simplicity. State laws and regulations are far too varied to be discussed in detail in this report -- an observation which itself presents an obstacle for development of biomass power. State laws are referred to for illustrative examples, as appropriate in this report, for example, when they may be more stringent than their Federal counterparts. The Federal laws discussed and analyzed in Chapter 2 are the following:
• The Clean Air Act Amendments of 1990 • The Clean Water Act of 1977 • The Resource Conservation and Recovery Act of 1976 • The National Environmental Policy Act of 1969 • The Toxic Substances Control Act of 1976 • The Federal Insecticide, Fungicide and Rodenticide Act of 1947 • The Endangered Species Act of 1973
Other important laws, The Occupational Safety and Health Act (OSHA), the Food, Agriculture, Conservation and Trade Act of 1990 {FACT Act), and the Coastal Zone Management Act are also mentioned occasionally in this report.
It should be clear that the EPA and other government agencies have been developing regulations at an extraordinary pace and the information contained in this chapter is up-todate as of publication. Information contained here should also be taken as the authors' interpretations and not as authoritative guidance.
1-2

) I I
I
I
F
'
I (
Another requirement for developing an environmental strategy is ·to identify the existing or potential environmental concerns and benefits of biomass power systems. Chapter 3 does this for the feedstock supply system in combination with three power combustion and conversion systems:
• fluidized bed combustion; • integrated gasification combined cycle; and • biocrude gas turbine technology.
These conversion systems were chosen to reflect representative cases of existing directfired technology, advanced high-efficiency gasification technology and advanced liquid fuels conversion technology.
The feedstock system and the technology systems are discussed in the same chapter because neither can stand alone for economic, engineering, and environmental reasons. Clearly, an adequate, reliable, and low-cost feedstock supply is required for the biomass system to be competitive with alternative fuels. The feedstock must be grown, handled and prepared to specifications so that proper combustion conditions can be achieved. This will help improve efficiency and reduce pollution per unit heat input, reducing both product cost and environmental pollution per megawatt or barrel of biocrude produced. Transportation and harvesting impacts are not discussed in detail because the technologies rely on petroleum-based fuels and although important to the 11full fuel cycle11 are not the primary research emphasis of the Biomass Power Program.
After assessing the regulatory context and the environmental footprints of the biomass technologies, Chapter 4 presents the Biomass Power Environmental Strategy Plan. It is composed of six major elements. They are:
• Program Integration and Outreach • Rural Development and the Environment • Clean Air Research • Clean Water and Water Availabi lity Research • Residue and Byproduct Technical and Market Research • International Environmental Opportunities
Several issues and trends wil l , when compared to the current state of biomass power technology, require attention in the Biomass Power Environmental Strategy Plan. These issues concern all environmental media and have important effects on potential new biomass power plant sites. They are briefly discussed below.
1 .2 CLEAN AIR AND CONVENTIONAL POLLUTANTS
Strict nonattainment provisions of the new Clean Air Act Amendments (CAAA) require revised state implementation plans (SIPs) which may restrict the development of new biomass power facilities to certain locales. Therefore, initial
1-3

demonstration and first commercial units should be located in less environmentally sensitive areas to speed introduction of the technology into the marketplace while the pollutant control technology is developed.
New power plants will have more difficulty obtaining permits to generate electricity than older units because of more stringent regulation imposed on new units. To ease this process, DOE and industry must characterize nitrogen dioxide (NO:J and volatile organic compound (VOC) emissions from biomass facilities and fund further efforts to reduce these precursors to tropospheric ozone at the source, and in so doing, expand the geographic market for the technology. Opportunities to repower old units should be investigated in light of current environmental decisions easing permitting rules on modifications to existing facilities. Also, field test results for technologies with sound environmental performance must be disseminated to decision-makers such as public utility commissions (PUCs), lenders, major environmental groups and developers.
· Electric power accounts for about 30 percent of domestic anthropogenic sources of C02• If the U.S. follows through on the administration's desire to adhere to the 11Rio Accord .. to limit C02 emissions to 1 990 levels by the year 2000, biomass power may have a role in the strategy. Further investigation of the no-net C02 claim is required, as is investigation of the cost of a biomass C02 emission reduction option compared to those of other fuel switching strategies, efficiency improvements and transmission and distribution improvements.
Biofuels contain a range of nitrogen levels. Wood wastes for example may have nitrogen contents as low as 0.1% (weight basis), while agricultural residues may have levels as high as 1 .5%. Biofuels which contain higher fuel-bound nitrogen levels may pose compliance problems with new source performance standards (NSPS) and ambient air quality regulations on NOx. Therefore, further research on minimizing fuel-bound nitrogen in pre-combustion feedstock or in postcombustion clean-up technologies is required.
Feedstock storage and handling within the power station boundary is a significant component of the total station capital and operating costs, and also has environmental implications. Particulate and VOC emissions from these handling processes must be further characterized to ensure that environmental regulations can be met without incurring significant additional cost. Control of fugitive emissions from biomass fines should also be considered.
An 802 compliance strategy for Phase II units under Title IV of the CAAA is the cofiring of biomass with coal . DOE can assist industry by identifying potential units which would comply with regulations by cofiring biomass, and by working with utilities to evaluate cofiring biomass.
1 -4

l J
\ . l
I ' !
)
--1' - _)
Biomass-fired power plants bum low sulfur content fuel, and therefore, owners of new facilities will not be required to purchase sulfur dioxide allowances to permit the new facility. This is a direct cost savings to a developer of biomass power. Therefore, DOE should inform the utility industry and PUCs of these potential savings to help promote this power generation option.
The renewable energy and conservation allowances contained in litle IV amount to a minuscule incentive and will probably be obtained by existing demand-side management (DSM) programs. But valuing environmental externalities is a growing trend with many PUCs. Although the Biomass Program strives for biomass technology to stand on its own merits without artificial incentive mechanisms, mechanisms that directly value the environmental benefits of biomass power should at least be monitored. DOE should also consider a more proactive role as a contributor of data and analysis.
A growing trend in power production is the 802 allowance trading system which, · if successful , will extend the concept of tradeable emission allowances to other
pollutants. N02 will probably be next. However, even water discharges regulated under the National Pollutant Discharge Elimination System (NPDES) will be impacted by this system (see Chapter 2). While using biomass may earn 802 allowances, other regulated emissions, if traded, would be comparable to fossil fuel systems.
Regulations being promulgated under the CAAA and related EPA administrative actions have become more amenable to sustaining growth in the power industry. The Wisconsin Electric Power Company (WEPCO) decision and the ruling on minor permit adjustments are important examples. This flexibility·: would be especially important in repowering and cofiring applications.
1 .3 CLEAN AIR AND AIR TOXICS
Currently, electric utility steam generating units are exempt from taxies regulations. However, an EPA study, to be completed by November 1 993, may have costly impacts if toxic controls are required on stationary sources. Pyrolytic oil production and distribution may be subject to potential regulation as an industrial source of toxics. It is recommended that characterization of toxic air emissions from woodfired boilers, gasifiers, and conversion facilities commence on a pilot scale immediately. California has some data, but there is a paucity of information available. This characterization program must include studies of the effect of variations in fuel stocks and combustion conditions on eventual emissions of toxic air pollutants. Fuel stocks and combustion processes which produce fewer air toxic precursors may be a favorable alternative to costly add-on toxic controls.
Residual risk studies and other studies are being performed with EPA leadership. Results of these studies, especially those on residual risks of emitted pollutants to human health, may have a significant impact on the biomass program. Therefore,
1 -5

the biomass program should coordinate with other DOE program offices to, at a minimum, monitor, if not actively participate in conducting and reviewing selected studies mandated by the CAAA.
Several state programs regulating toxic air emissions already exist Even though the Federal legislation wil l encourage a tendency toward conformity, developers must be aware of variations among state programs which may impose stricter regulations than the Federal government
Treated wood byproducts or residues are a potential supplemental fuel source for plants sited in urban or suburban locations. A recently released study of combustion emissions for waste wood indicates that the use of treated wood as a fuel does not significantly alter the emissions profile of industrial wood-fired boilers (NYSERDA 1 992) . The report did indicate that chromated copper arsenate (CCA)-treated wood represented a special concern and it estimated that emissions of arsenic and chromium from combustion of these sources could exceed state guidelines for ambient air quality in some cases.
1 .4 THE CLEAN WATER ACT OF 1 977
A dedicated feedstock supply system (DFSS) faces non-point pollutant concerns similar to traditional agricultural systems. These include pesticide and nutrient runoff and soil erosion into receiving waters. Biomass grown in a DFSS tends to require less pesticide and fertilizer application than most non-energy crops. It would benefit the industry if DOE and USDA would work with growers to insure that innovative practices and best management practices are used in the production of feedstocks. Further research should be sponsored in this area, beginning with existing available feedstocks and moving to genetically altered species over time.
Water is a major input into the growth of most types of feedstock. Therefore, an adequate supply of water must be assured to provide a consistent supply of feedstock. Identifying sites which have adequate natural water supplies or low cost irrigation systems, and identifying or developing feedstock crops which are drought resistant or have relatively low demand for water will be necessary to ensure fuel reserves.
Because the biomass program lacks data on characteristics and composition of waste streams, a program to begin wastewater characterization is necessary. If biomass power results in multiple waste streams and numerous potential toxic pollution components, this could lead to complex NPDES permitting. Choosing system components and processes which minimize the potential for concentrating toxics would ameliorate these issues. For example, dry ash receiving systems eliminate a wastewater stream completely. Similarly, anti-corrosion and antibiofouling additives must be as environmentally benign as possible.
1-6
p .
< . .

. l !
1 y
)
Among important trends observed affecting the water resotJrce: states are moving toward integrated water management programs which coordinate water quantity and water use requirements; market incentive mechanisms are being investigated to allow pollutant trades within point source and even among point/non-point sources discharging into the same receiving waters; there is increasing discussion about eliminating or modifying current water subsidy programs, primarily in the West, to better allocate water according to market signals.
� 1 .5 SOLID AND HAZARDOUS WASTES
' \
J
I
- i
·'
---1 . r
1 .6
Many waste generators do not know if their waste is hazardous or not. States impose confusing and varied regulatory schemes. For this reason, biomass waste/byproducts must be analyzed to determine if they contain any hazardous components and if they pose a risk to humans or the environment. A program must be developed to address the variations in waste and byproduct regulations.
In many areas of the country, the need for larger landfills and the scarcity of landfill space will increase dumping or tipping fees, and encourage greater efforts to recycle or minimize waste production. Wood waste - treated or untreated - can supplement biomass supply and ease landfill concerns, but state regulations are varied and confusing, often leading to under-reporting of the biomass resource. Treated wood is subject to special scrutiny and may not be a viable source for biomass power production. Biomass residues are not a waste, but a resource, and should be promoted as such. If seen in this light, biomass residues will face less stringent and more consistent regulation.
The Resource Conservation and Recovery Act (RCRA) reauthorizatiop bil l came up in the Senate in 1 992, but was not passed. If and when it does pass, it will impact most aspects of hazardous and solid waste regulation. Current and potential biomass facility owners and DOE policy-makers should monitor and participate in administrative actions and reauthorization decisions regarding RCRA.
FEDERAL GOVERNMENT ENVIRONMENTAL CONCERNS
Biomass power demonstration projects sponsored by the Federal government will require environmental review under the National Environmental Policy Act (NEPA). Therefore, early coordination within DOE's NEPA Program Office and timely completion of environmental reviews within the limits established by law are necessary to keep projects on schedule. Preparation of a generic programmatic Environmental Impact Statement may be considered.
Environmental review requirements under other environmental laws subsequent to NEPA have made NEPA compliance more complex. NEPA review, therefore, should be viewed as a .. down payment .. on the eventual effort required to gain a
1 -7

fully permitted facility. Care should be taken to conduct comprehensive assessments and to maintain data and knowledge which are to be used in later permitting efforts.
1 .7 TOXIC SUBSTANCES CONTROL
The Toxic Substances Control Act (TSCA) may impact power plant byproducts/wastes if they are used and/or sold. The ash remaining from some conversion processes can be used as a soil amendment, in asphalt, or for other purposes, but further characterization is needed. The pyrolysis process produces oils which can be sold and refined into chemicals. Any substance such as this, that is distributed in commerce, falls under TSCA regulation. If the biomass program wants to take advantage of the versatility of these byproducts, DOE or its laboratories and industry must begin pre-manufacturing tests of pyrolysis oils and possibly ash to comply with EPA regulations.
The EPA wil l soon be taking some cost-cutting actions which, it claims, will not sacrifice human health and the environment. These actions include amending the pre-manufacture notification exemption rules, and modifying the chemical inventory exemptions.
1 .8 PESTICIDES
A proposed update to the Federal Insecticide, Fungicide and Rodenticide Act (FIFRA) regarding new tolerances and exemptions for pesticides on raw commodities was due by the end of 1 992, and a proposal on pesticide disposal is expected in early 1993, both of which may impact biomass production. These issues are crucial to pesticide applicators/users and must be monitored to ensure current regulations are followed.
The EPA's Office of Prevention, Pesticides, and Toxic Substances may take some cost-saving actions, including creating incentives to use reduced-risk pesticides. DOE should investigate these reduced-risk pesticides for application to biomass feedstock production.
1 .9 ENDANGERED SPECIES
The Endangered Species Act (ESA) will impact both forest and farm energy crop systems. Because of the coincidence of biomass resources with existing listed endangered species, Biological Assessments are expected to be required. A properly managed system, however, can create habitat for all species. Work should continue with the Audubon Society and others to manage the biomassfeedstock systems as a true multi-use resource.
1 -8
/ .
' . "

J
l I
An emerging trend in forestry is the management of lands for biodiversity. Just as tree production addresses the problems of marginal farmland and soil erosion, forests can be managed to enhance biodiversity. According to the 2� Annual Report of the Council on Environmental Quality (CEQ), 11The trend in forestry is toward managing forests as complex ecosystems made up of interdependent communities of plants, animals, and microbes . . . •• (CEQ 1992).
These are the issues which will be integrated into the Biomass Power Program Environmental Strategy presented in Chapter 4 along with the program elements which will help assure the safe and environmentally sound commercialization of biomass power technology.
1-9

2.0 REGULATORY CONTEXT
2.1 INTRODUCTION
This chapter describes the environmental regulatory context within which the Biomass Power Program and its constituency will operate. Most environmental regulation has been on the books for years - even before the EPA was established in 1 970. But revolutionary changes are now occurring, particularly with market-based approaches to pollutant reduction and the shift in public sentiment toward valuing technologies which produce a cleaner and healthier environment. Understanding the regulatory context and identifying key trends will assist in attaining the eventual commercialization goals tor biomass power and feedstock supply systems by helping to identity effective R&D program elements tor a Biomass Program Environmental Strategy.
2.2 CLEAN AIR ACT AMENDMENTS OF 1 990 {CAAA) PUBLIC LAW 101 ·549, 101ST CONGRESS, NOVEMBER 1 5, 1 990
Responding to national concerns about air pollution, Congress passed and the President signed the .CAAA of 1 990. Developing regulations under the CAAA will dominate the EPA's regulatory agenda during the next several years, since the amended air act requires issuing 1 20 rules by 1 995. The most recent regulatory agenda is shown in Appendix A. The provisions of the CAAA legislation are directed toward three major concerns: nonattainment, acid rain, and airborne toxics. The nonattainment provisions attempt to reduce emissions of carbon monoxide and/or gases that cause tropospheric ozone o .e., nitrogen oxides and volatile organic compounds) in regions where ambient carbon monoxide or ozone levels have exceeded those considered safe to human health by the EPA. Acid rain, caused primarily by sulfur dioxide and nitrogen oxides emissions from coal combustion, has been a long-standing issue among regions and between the U.S. and Canada. By implementing stringent reductions of sulfur dioxide from coal-fired faci lities, imposing a national emissions cap, and using the market to trade pollution rights, it is expected that the CAAA will reduce the adverse effects of acid deposition in the most economically efficient manner. Only seven airborne toxics have been regulated by EPA since the Clean Air Act was first passed in 1 970. Unsatisfied with the pace of toxics regulation, Congress, through the CAAA, has imposed a schedule to regulate a proposed 1 89 airborne toxics. The CAAA are composed of eleven titles. Only the ones most relevant to the Biomass Power program are summarized here.
2.2.1 Ambient Air Quality
Title I provides for attainment and maintenance of National ambient air quality standards (NAAQS) tor each of six .. criteria .. air pollutants. They are: tropospheric ozone; carbon monoxide (CO); particulate matter (PM-1 0); sulfur dioxide (SO�; nitrogen dioxide (NO�; and lead. Each pollutant is regulated separately. Failure to meet the standard tor any
2-1
r 1l !
:i � .
' ...

l
' - I
--- r
pollutant may result in the withholding of a facility permit. Federal Ambient Air Quality Standards are shown in Exhibit 2-1 along with an example of Hawaii 's standards, which are in some cases more stringent than the Federal standard. Hawaii was chosen because it is the site of the 1 00 tons per day (tpd) biomass gasifier scale-up facility. Under the new Act, each state is required to designate areas within its borders as nonattainment, attainment, or unclassifiable for each pollutant and to provide means to bring nonattainment areas into compliance in a specified time period through a state implementation plan (SIP) .
Nonattainment areas will be stratified by degree of nonattainment for each pollutant. The areas for ozone, for example, will be stratified into five categories (extreme, severe, serious, moderate and marginal) -- each regulated differently. These geographical area attainment requirements wil l , in turn, drive the implementation of specific state controls (not Federal CAAA controls) on industrial facilities and other sources. Thus, litle I may
EXHIBIT 2-1 Federal and State of Hawaii Ambient Air Quality Standards
Federal Hawaii Pollutant {J.tg/m� {J.tg/m�
Ozone (OJ 1-hour average 235 100
Carbon Monoxide (CO) 1-hour average 40,000 10,000 8-hour average 10,000 5,000
Nitrogen Dioxide (NO:J Annual Average 100 70
Sulfur Dioxide (SO:J 3-hour average 1,300 1,300 24-hour average 365 365 Annual average 80 60
Total Suspended Particulate Matter 24-hour average N/A 150 Annual Average N/A 60
Suspended Particulate Matter (PM10)8 24-hour average 150 N/A Annual average 50 N/A
Source: CFR, 1989; State of Hawaii, 1986
apM10: Particulate Matter less than 10 microns in diameter Onhalable)
N/A: Not applicable
2-2
.. ... ,

impact site locations of new or retrofit biomass facil ities depending on SIP requirements. Particulate and N02 emissions are of special concern to biomass combustion facilities. Offset requirements in serious or severe nonattainment areas for these pollutants will make it difficult to site systems as they will be required to obtain more than equal reductions in these pollutants from other sources in the same area.
As of October 1 991 , Los Angeles was the only nonattainment area for N02• Exhibit 2-2 displays nonattainment areas for PM-1 0. States containing non-attainment areas are highlighted in solid colors. Note that the Southeast, Great Plains, New York and New England states bordering New York are all areas of potential biomass fuels development and are fortunately in PM-1 0 attainment areas. Unfortunately, N02 and Volatile Organic Compounds (VOCs) are precursor pollutants to ozone formation and nonattainment areas for ozone are more widespread in the Southeast (see Exhibit 2-3). Therefore, the biomass program can expect regulations of N02 to be strict in nonattainment areas for ozone.
The EPA recently proposed guidance under Title I that requires existing major sources of NOx in ozone nonattainment areas or ozone transport regions (Maine to Virginia) to install reasonably available control technology (RACT). EPA's expected RACT standard for electric util ities is shown in Exhibit 2-4. State controls may be more restrictive. The Northeast States Coordinated for Air Use Management (NESCAUM) has proposed limits in two phases shown in Exhibit 2-5. These stricter standards are likely to be adopted since states risk losing highway funds if they fail to bring their polluted areas into attainment. New major sources in those areas must install controls to meet lowest achievable emissions rates (LAER) and reduce emissions from other sources to offset any increase in NOx emissions. Currently, most states also require best available control technologies (BACT) and LAER for major new sources or modifications to existing sources in nonattainment areas. Selective catalytic reduction (SCR)-type control (selective non-catalytic reduction or SNCR for circulating fluidized bed boilers), for example, would be considered BACT for NOx control despite its high cost. Extreme nonattainment areas will be required to use advanced control technologies to control N02 •
. EPA has promulgated regulations for areas which have attained NAAQS. These Prevention of Significant Deterioration (PSD) requirements apply to .. attainment areas .. to ensure that air quality does not significantly deteriorate yet still allow for future industrial growth. PSD reviews are necessary for new or modified projects in attainment or unclassified areas for each pollutant mentioned previously. A preconstruction review and use of BACT is required. BACT has been determined on a case-by-case basis in areas meeting ambient air quality standards by states having an EPA-approved SIP taking into consideration energy, environmental and economic impacts. Typically, states have pressed for stringent controls in this so-called 11top down .. approach. Less stringent control could only be imposed if industry demonstrated why less costly and less effective control was better. Industry has generally opposed this burden of proof arrangement. Recently, EPA has discussed changing its policy to allow industry to make initial determinations on what constitutes BACT. The new administration would, most likely, maintain the existing policy, reserving the strong decision-making authority for the state
2-3
I " .

��
1\:) I �
en 0 c a <D
mm ;g;g �z .gP1 �0 . ::J COD) ...... -
6� 1\:)...., U)o c
Q) � Q) ::J c. m �-C/) �-0 ::J C/) :;I <D ::J c. C/) JJ <D "0 0 _::::1. ...... co co 0
� -�
�. , ,, AJ.UIII � ' '
.-..,, •lr' I
AREAS DESIGNATED NONATTAINMENT FOR PM10 PARTICULATES, BY EMISSION TYPE
KEY TO PRNCIPlE EMISSION TVPE
• AREAS NONATTAINMEHT DUE TO STAnONARY 8CIIJfa EMISSIONS • AREAS NONATTAIHMEHT DUE II PART TO WIQOO SMOKE EMISSIONS • AREAS NONATTAINMEHT DUE II PART TO FUGITIIIE DUST EaassiONS • AREAS NONATTAINMENT DUE TO YJI.nPLE TYPES Of' BISSIOHS
CIRClE DIAMETER $ INDICATES RElA nilE SIZE Of' AFFECTED POPUI.AnON
�,� �
m � -m =i �

Cl> c: 0 N 0 .... 0
.... .... c: Cl> E c:
·-
as i c: 0
z , Cl>
... as c: C)
·-
� c tn as e <
Source:
EXHIBIT 2-3
11 . ·& l J i I I j 11 11
b 6 ••
(I
EPA National Air Quality and Emissions Trends Report, 1 990 EPA 450/4-91 -023
2-5
! 2 ; 81 ;
ce c 0
:� � i � ·� � ::J
.e 0 z

1 )
! I
J 1
!' i
EXHIBIT 2-4 EPA's Expected NOx RACT, lb/MMBtu (30-day average)
I Fuel I Tangential I Wall I Cyclone I Stokers
Gas/Oil 0.2 0.3 0.55
Coal/Wet Bottom N/A 0.7 0.7
Coal/Dry Bottom 0.45 0.5 N/A
EXHIBIT 2-5 NESCAUM Recommended NOx RACT
Phase I Recommended NOx RACT, lb/MMBtu 1
Fuel Tangential Wall Cyclone Stoker
Gas only 0.20 0.20 N/A N/A
Gas/Oil 0.25 0.25 0.43 N/A
CoaJ/Wet 1 .00 1 .00 0.55 N/A Bottom
CoaJ/Dry Bottom 0.38 0.43 N/A 0.322
1) Based on 24-hour average for coal-fired boilers and 1-hour average for gas/oil-fired boilers. 2) For stokers that use 25 percent or more solid fuels other than coal (e.g., wood or tires) , the
recommended limit is 0.33 lb/MMBtu.
Interim Phase I I NOx Umit
Oil/Gas 0.1 lb/MMBtu (1 -hour average)
CoaJ 0.21 lb/MMBtu (24-hour average)
0.55
N/A
0.7
I
regulators even though there is strong industry opposition. Perhaps the best solution is for all parties to examine new source review policy and negotiate solutions to cut back on permitting delays, complexities and confusion surrounding the law.
EPA threshold limits for classification as a major source subject to PSD for a project similar to a biomass gasifier project are shown in Exhibit 2-6, with some states regulating more stringently. Connecticut lists any source emitting 1 00 tons per year or more of an
2-6

EXHIBIT 2-6 EPA Air Contaminant Emission Threshold Umits for Major Sources Subject to PSD Review
Pollutant
carbon monoxide reactive organic gases nitrogen oxide sulfur dioxide particulate matter
Emission Rate (tons/year)
250 250 250 250 250
attainment pollutant as a major source subject to PSD review. PSD requirements for firms ·applying for construction in Class I areas come under the most scrutiny. These areas are either parks or wilderness areas Oisted in Appendix B) - often found in rural settings where biomass resources are available and where a typical biomass power station may be located. Assurances must be made that scenery will be protected and that other adverse effects will not occur. In a recent ruling, the EPA remanded a construction permit granted by the Commonwealth of Virginia to construct a 66.5 MW coal-fired plant near two Class I areas 1 5 kilometers north of the James River Face wilderness and 56 km southwest of the Shenandoah National Park.
2.2.2 Hazardous Air Pollutants
Title I l l regulates and controls air toxics. The 1 990 amendments provided a statutory list of 1 89 substances presumed to require regulation as air toxics, although this list can be modified through administrative procedures within EPA The list is not expected to be modified much because the statute is geared more toward control of pollution sources than individual pollutants. The CAAA do not seek to control on a pollutant-by-pol lutant basis but by type of industry. Industrial sources are the most immediately affected. These could include industries providing inputs to the biomass power industry, such as the pesticide production industry. Utility studies are underway which may lead to future regulation in the utility sector. Technology-based standards relying on maximum achievable control technology (MACT) are required if emission limits are exceeded. MACT is defined as the emission control achieved by the best-performing 1 2 percent of existing sources. An early reduction rule allows an emission source to receive a six-year waiver to meet MACT requirements if it voluntarily agrees to reduce emissions by 90% by January 1 , 1 994. Residual risk (risks to human health posed by uncontrolled emissions) standards may be proposed after a study of human health effects.
Generally, for wood-fuel systems, polycyclic aromatic hydrocarbons (PAHs), heavy metals and aldehydes present a concern. Non-harvested wood fuels could emit a number of regulated pollutants depending on specific contaminants contained in the wood. This may
2-7

include chromium in preservatives, formaldehyde in glues, lead and titanium in paints. Within a year, EPA will report to Congress on health hazards of power plant emissions of HAPs and describe alternative control technologies. EPA must regulate power plant HAPs, if appropriate, after the study. Several other studies of interest to the biomass program and required by the CAAA are shown in Appendix C.
Under CAAA, .. major sources.. are stationary sources that emit 1 0 tpy of any listed
1 hazardous air pollutant or a total of 25 tpy of all HAPs combined. Most source categories [ emit between 20 and 27 pollutants. A common misconception is that the 1 0 tpy and 25 tpy criteria are the emissions control levels. These criteria are used only to classify sources for regulation. Commercial or industrial plants identified as .. major sources .. wil l be listed by category and subcategory with levels of emission control prescribed for each category. Although regulation is an ongoing process, the EPA has published an initial list of major sources, but sources identified as electric utility steam generating units under section 1 1 2(a) (8) of the CAAA shall not be subject to emission standards pending the findings of the study mentioned above. Major sources on EPA's initial l ist which concern the Biomass program are, under the topic of fuel combustion: industrial boilers and stationary turbines; under liquids distribution: organic liquids distribution; and under the category of production of organic chemicals: synthetic organic chemical manufacturing. Pyrolysis oils and gasification fuels could fall within these source categories.
l
l i
The latest rule proposed under the National Emission Standard for Hazardous Air Pollutants for hazardous organic chemicals (hazardous organic NESHAP or HON) would reduce emissions of 1 49 toxic substances from 370 synthetic organic chemical manufacturers in 40 states. New and existing chemical manufacturing facilities would have to control emissions from distillation, reactor, and air oxidation process vents, wastewater operations, storage vessels, transfer operations and equipment leaks. Industries subject to HON use chemical manufacturing to produce synthetic organic chemical manufacturing industry (SOCMI)-Iisted chemicals and generate HAPs. The equipment leak provisions of HON also apply to seven types of non-SOCMI processes including pesticide production.
Industry recently supported an EPA decision to include emission averaging provisions in its proposed HON emission standards. Companies can either apply the control technologies to each regulated emission point or use emission averaging to meet standards.
Additionally, smaller toxics generators may be classified as .. area sources .. and may also be subject to regulations. In this case, the EPA administrator is required within five years of CAAA enactment to list categories of area sources representing 90 percent of the area source emissions of the 30 most hazardous HAPs in the largest urban areas. Regulations of area sources are to be promulgated by 2000. Special treatment is also accorded to a subset of specific pollutants: alkylated lead compounds, polycyclic organic materials (POMs), hexachlorobenzene, mercury, polychlorinated biphenyls (PCBs), and dioxins. Regulations are to be promulgated to control sources that represent at least 90 percent of the emissions for each of these special toxics.
2-8

California has already developed an air taxies program specific· to wood-fired boilers. Metals and volatile organic compounds are emphasized. A study completed to support the California program showed aldehydes and benzene, chromium and selenium emitted at low levels. Exhibit 2-7 shows the results of the California study which are discussed later in Chapter 3.
2.2.3 Acid Rain
Title IV, the acid rain provisions of the CAAA, provide for reduction of annual S02 emissions by 1 0 mill ion tons from 1 980 levels and for annual N02 emission reductions of approximately 2 mill ion tons from 1 980 levels in the continental U.S. N02 emissions are to be reduced through low-NOx burner retrofits. The EPA recently proposed the first phase NOx l imits under Title IV. The l imits for so-called Group I boilers are:
- Tangentially fired boilers
Wall-fired dry bottom boilers (except boilers using cell burners)
0.45 pound/MMBtu
0.5 pound/MMBtu
The proposal would allow utilities to average emissions rates of several units at one facility, thus reducing the cost of compliance by allowing utility management to find themost cost effective approach. The proposal offers two options for control applied to coalfired boilers including tangentially fired boilers and dry bottom wall-fired boilers and wet wall-fired boilers (cyclone and cell burners won't be regulated until 1 997) . One option requires the inclusion of overfire air. The other option would exclude overfire air from the
EXHIBIT 2-7 California Study Results
Trace Element
Arsenic Beryllium Cadmium Chromium
Copper Lead
Manganese Nickel Zinc
Amount* (PPM by weight)
90 - 230 < 20
1 0 - 1 90 75 - 520
500 - 1 700 300 -1 300
2000 - 1 3000 55 - 1 500
6200 - 26000
* PPM of particulate catch for a range of combustion systems.
Source: Sassenrath, 1 991 .
2-9

\ !
definition of Jow-NOx burner technology for wall-fired units. Managers who install low-NOx technology but demonstrate they cannot meet standards would be granted Jess stringent emission limits. A compliance deadline extension could also be granted if operators prove the technology is ·not available in sufficient supply to meet compliance deadlines. State officials and environmental activists are not pleased with the EPA proposal, citing the available evidence that NOx plays a significant role in smog formation.
The reductions for 502 will be accomplished in two phases. Phase I will reduce the 502 emission rates of the 1 1 0 dirtiest plants in the 48 contiguous states to 2.5 lb/MMBtu by January 1 , 1 995. Phase I I sets an emission rate ceiling of 1 .2 lb SOJMMBtu for all generating units larger than 25 MW by January 1 , 2000. The cornerstone of the Title is the introduction of marketable pollution rights or 502 emission allowances. Each allowance is equivalent to one ton of 502 and emitters are annually allocated a number of allowances equal to 2.5 lb/MMBtu of furnace heat input times fuel consumption during a 1 985-1987 baseline operating period for Phase I. In Phase I I , the factor is reduced to 1 .2 1b/MMBtu times baseline fuel consumption. Allocations of pollution allowances for the Phase I I program were announced by EPA in the July 7, 1 992 Federal Register. Allowances can be bought, sold, and banked for future use in an attempt to introduce pollutant restrictions with market-based initiatives.
On March 29, 1 993 the first auction and sale of sulfur dioxide allowances was conducted by the Chicago Board of Trade. Trading on the Chicago floor was limited to those allowances set aside by the EPA (2.8 percent of the total) to help stimulate the allowance trading market. The weighted average value for Phase I 1 995 allowances was $1 55 per allowance (range of $1 31 to $450) and for Phase II allowances was $1 34 per allowance (range of $1 22 to $31 0) (PUF 1 993}. Participants included private investors, public interest groups arid brokers, but activity was dominated by utility companies. The Board will run the annual public allowance auction and administer direct sales. It also announced a series of periodic private auctions designed to complement EPA's annual sale.
Prior to the Board's first auction, five utilities and one industrial concern announced trades of acid rain allowances, amounting to the rights to emit up to 45,000 tons of sulfur dioxide. The average allowance value in the trades was established at a price of about $275/allowance. Wisconsin Power and Ught Co. sold 1 0,000 tons of pollution allowances to the Tennessee Valley Authority in Knoxville, Tennessee and 1 5,000 to 25,000 tons of allowances to Duquesne Ught Co. in Pittsburgh, Pennsylvania. Ohio Edison Co. wil l purchase 5,000 502 allowances annually over 5 years, beginning in 1 995, from Alcoa Generation Corporation. Alcoa is the first non-utility playing in the allowance market; it is part owner of a power plant in Indiana. United Il luminating, a Connecticut utility, has sold an option for 5,000 Phase II allowances to an unidentified buyer to be available in the year 2000. Although these trades are small relative to a utility's overall compliance plan, (TVA's Cumberland plant in Tennessee wil l use scrubbers to reduce emissions by 350,000 tpy for example, dwarfing the 1 0,000 allowance purchase} a market is forming
2-1 0

in allowance trades. Wholesale Power Services, a subsidiary of PSI Resources, has established an on-line S02 allowance electronic bulletin board for utilities seeking to buy or sell allowances.
Compliance options receiving considerable attention for Phase I include instal lation of flue gas desulfurization (FGD) equipment (i .e., scrubbers), fuel switching to low-sulfur coals, cofiring natural gas, purchasing emission allowances, and reducing output from or retiring a unit. Options which are viewed as longer-term or Phase II strategies involve coal cleaning, and retrofitting or repowering with clean coal technologies. Another option recently receiving attention is cofiring biomass as a moderate-Btu (approximately 8800 Btu/dry lb) renewable resource with a sulfur content below 0.1 % (Piscitello 1 992). Retrofitting a coal plant to burn biomass generally requires an additional fuel handling system and boiler modifications, although operation of such a plant is very similar to that of a coal plant. Operational considerations of cofiring include decreased boiler efficiency (due to the relatively high moisture content of the biomass) and boi ler derating (resulting in part from increased flue gas and air flow rates).
Recently, the EPA announced that utility pollution control projects would be exempt from rigorous and time-consuming new source review requirements under the CAAA. However, the Act specifies that existing facilities that are modified may be considered new sources of pollution subject to stricter standards. The so-called WEPCO rule, named for the Wisconsin Electric Power Co. , addressed utilities' concern that modifications required under various CAAA programs would subject them to the same level of review as new pollution sources. However, the rule exempts pollution control projects from new source review unless EPA determines that such projects would not be environmentally beneficial. EPA also said that other physical and operational changes will be excluded from new source review unless they cause an increase in emissions. The rule includes a methodology for estimating increases in emissions. While this step has been praised by utility advocates, many environmental advocates such as the Natural Resource Defense Council are threatening to pursue lawsuits, arguing that utilities can continue to grandfather old, dilapidated plants which upgrade operations, and thereby avoid new source review.
Section 404 (f) of litle IV (Energy Conservation and Renewable Energy) includes provisions for earning credits from S02 emissions avoided through energy conservation measures (i .e., demand side management or DSM) or renewable energy Q.e., energy derived from biomass, solar, geothermal, or wind) . These allowances are earned for every kWh generated by renewables or saved by DSM, regardless of the emission rate and ceil ing. The earned credits will be allocated from the 300,000 allowances in the Energy Conservation and Renewable Energy Reserve on a first-come, first-served basis. The number of additional credits which can be earned is equivalent to the emission tonnage considered avoided by DSM or renewable energy:
avoided emissions = kWh * 0.004 2000
2-1 1

) \ /
I J }
I
t
Therefore, for every gigawatt-hour (GWh = 1 06 kWh) produced by biomass in a cofired boiler, two allowances will be given to the utility from the allowance reserve. These credits are in addition to any allowances which the utility saved by not emitting S02• However, the tonnage of S02 actually avoided by cofiring biomass may exceed 1 6 tons per GWh generated from biomass. (The actual tonnage avoided is a function of the coal sulfur content and target emission rate.) Therefore, the credits earned are only a small (<1 5%) portion of the emissions potentially offset. EPA has predicted that the 300,000 allowances in the reserve will be accounted for within approximately five years, mostly by DSM programs.
A second stipulation of Section 404 (f) concerns the period of applicability. A utility owning a Phase I unit (i .e. , a Phase I utility) can only earn credits from the Energy Conservation and Renewable Energy Reserve for energy which displaces S02 before January 1 , 1 995. Ukewise a Phase II utility can only earn credits for energy which displaces S02 before January 1 , 2000. Thus, to earn credits, the DSM or renewable technology must be installed and must be offsetting S02 emissions prior to the date on which the util ity must comply with Title IV. For Phase I utilities which would consider cofiring biomass with coal, the period of applicability precludes earning credits under Section 404 (f) . When considering the number of allowances set aside, it becomes apparent that Phase I I utilities may only be able to earn credits for a few years. Utilities might seriously consider biomass cofiring and other renewable technologies as an 802 reduction strategy if the period of applicability were not limited and if credits could be earned throughout the life of the plant.
2.2.4 Operating Requirements and Permits
Title V of the CAAA addresses permits which are the operative regulating req4irement of all pollution sources. On June 25, 1 992, EPA issued a final rule requiring all major sources of air pollution to obtain an operating permit. This rule is one of the most important regulations established under the CAAA, as it provides some nationwide consistency to state air permitting programs (there are currently more than 40 state permit programs). The permit brings all sources into the acid rain allowance program and will allow for future regulation of air taxies, and will provide a foundation for expanded marketbased opportunities to reduce air pollution. A permit includes a written description of the activities of a facility, to help industry and state, local , and Federal permitting authorities determine what has to be done to bring the facil ity into compliance with the law. All major sources would be subject to permit requirements and this would help states develop easier implementation plans to bring the areas up to national ambient air quality standards. The rule's provision on minor permit amendments is one of its m ost controversial aspects and likely to be challenged in the courts. Under that section, sources can change their facil ity or operation as long as the change does not exceed an emissions threshold set out in Title I of the Act, the highest threshold being about 40 tons for most criteria pollutants. The threshold varies depending on degree of non-attainment. The threshold is lower for areas with worse pollution. Los Angeles for example is classified as extreme non-attainment and could have a 1 0-ton threshold for most criteria pollutants. Facilities exceeding their limits must go through a lengthy and complex new
2-1 2

source review process. A source wanting to modify its plant or operation must give the state permitting authority seven days notice of a change. For minor permit modifications the source can proceed with the change immediately. The Title describes permit application, puts administrative procedures in place and establishes state and Federal authorities. That section also authorizes penalties for violations and economic sanctions on delinquent states. Permits must be renewed every 5 years and fees will be charged to obtain permits. DOE-sponsored R&D pilot or demonstration units may require waivers or temporary source permits. For small businesses, EPA is to establish a small business stationary source technical and environmental compliance assistance program.
New Source Performance Standards (40 CFR Part 60 sub-parts 0, D(a), D(b), D(c)) are not new under the Clean Air Act Amendments. They were authorized by Congress in the Clean Air Act of 1 970 and in amendments prior to 1 990. They require discussion because they impose regulatory requirements on proposed new power plants on the theory that they would replace old uncontrolled power plants and thus, in the long run, improve air quality. EPA is responsible for establishing, reviewing and revising NSPS. Revisions were made in 1 977 for fossil fuel-fired steam generators capable of com busting greater than 73 megawatts (250 million Btu/hour) heat input and again in 1 987 for smaller generators constructed after June 1 984 but before January 1 986 and greater that 29 MW {1 00 million Btu/hour) and again in September 1 990 for very small generators between 2.9 MW (1 0 mill ion Btu/hour) and 29 MW (1 00 million Btu/hour). They provide new emission standards for particulate matter, S02, NOx, and opacity l imits associated with the PM standard. Standards vary by fuel type (solid, liquid, gaseous) and by combination of fuels (bituminous coal and wood residue or anthracite coal and wood waste). The reader is referred to 40 CFR Part 60 to determine applicable standards. More detail is also provided in Chapter 3 of this report.
NSPS also apply to existing sources .subject to substantial modification to deter piecewise modification to existing plants to the extent that they are rebuilt without undergoing new source review. New Source Review may be required if existing coal-fuel units are repowered with biomass-fuel equipment.
2-1 3

}
l
2.3 THE CLEAN WATER ACT OF 1 977 PUBLIC LAW 92-500
Although originally on the legislative agenda for the 1 02"d Congress, it now appears that there is little chance for reauthorization of the Clean Water Act (CWA) before 1 994. A proposal to include clean water funding in an infrastructure investment bill could eliminate the drive to reauthorize the CWA. The new administration and Congress will need time to deal with the complexity of the amendments which will significantly affect the new law. The House Public Works and Transportation Committee has yet to report out a bil l ; however, insight into trends in clean water regulation which may impact the biomass power program can be gleaned by examining the Senate draft reauthorization bill (51 082) . Language contained in the Senate version includes suggestions to use market incentives, i .e. , pollutant trading similar to offsets and allowance trades in clean air legislation. The language includes not only stationary or 11point11 sources as targets for the market mechanics but also ••non-point" sources such as farmlands and fields whose runoff pollutes not from an easily identifiable pipe but over a large, dispersed, not easily controlled area. The point source discharge system could be implemented to allow point source dischargers currently regulated by National Pollutant Discharge Elimination System (NPDES) permits to avoid costly treatment upgrades by paying for or otherwise arranging for equal or greater reductions in discharges from other facilities that discharge into the same receiving waters. The EPA Office of Water is currently studying a point/non-point trade program to increase the use of market incentives in containing non-point sources. Because a DFSS involves non-point sources, the efforts of the EPA in that area should be monitored. The Environmental Defense Fund, an active environmental group, believes that 70 percent of the remaining threat to water quality is derived from non-point sources. This issue is most important to a DFSS program.
Water related issues which may affect the Biomass Program fall into two major categories - water quality and water quantity. This section will emphasize the former under the purview of the CWA, but concern should be noted regarding the latter in light of increasing competition for water supplies, vulnerability of both surface and shallow groundwater supplies to drought, and declining groundwater levels associated with increasing use. The United States Geological Survey (USGS) in the Department of the Interior (DOl) provides hydrologic information used to manage the nation's water supply. The Federal government owns most of the nation's storage and water conveyance faci lities, but most water management responsibility lies with the states. Most states wil l require a demonstration of adequate water resources before permits to construct are granted. Some states are moving toward a more fully integrated approach to water management. For example, North Carol ina NPDES permitting, monitoring and enforcement activities are being coordinated with watershed quantity limits for each of the state's watersheds. A dedicated fuel supply system which depends on water as a major production input will obviously be impacted. The issue of water scarcity has caused an increasing level of discussion regarding pricing reforms which would eliminate water subsidies and allocate water suppl ies according to market signals. States may be moving toward greater resource efficiency while protecting water quality and intended uses of their water.
2-1 4

2.3.1 Non-Point Pollution
According to a recent report by the Council on Environmental Quality (CEQ), agricultural sources are the leading cause of water quality impairment, contributing to 60 percent of impaired stream miles and 57 percent of impaired lake acres. While measures of some conventional pollutants are improving, such as dissolved oxygen, fecal bacteria, and phosphorus, other pollutant concentrations appear to be increasing such as dissolved solids, chloride, and nitrogen. Improving trends are associated with better wastewater treatment facilities while declining trends are associated with increased fertilizer applications, highway salts, and other non-point sources. The implications are obvious for a DFSS. Chemicals are a major input to the agricultural activity surrounding a DFSS. Fertilizers containing nitrogen, phosphorus, and potash can accumulate to adverse levels in surface and ground water. Pesticides can harm non-target species, accumulate in food chains, encourage development of resistant pests, and enter the atmosphere through spraying or the aquatic environment through sediment runoff or leaching. Fertilizer use is down somewhat in the United States, but pesticide use is up slightly from the 1 970s, as shown in Exhibit 2-8. Many Federal programs in the agricultural industry currently use a regulatory strategy of non-point sources which incorporates soil conservation and pollutant minimizing goals. The Food, Agriculture, Conservation, and Trade Act of 1 990 (The 1 990 Farm Bill) strengthened the conservation title in the 1 985 Farm Bill to encourage new attitudes among Federal soil and water conservation agencies, state and local cooperatives, and farmers. It provides incentives to farmers to adopt alternative farming methods such as low impact sustainable agriculture (LISA). The forest title of the 1 990 Act contains a tree-planting initiative to encourage erosion control. These incentives deserve further examination as they may assist the DFSS business person and help enhance wildlife habitat, conserve soils, and protect water quality.
The Agricultural Water Quality Incentives Program provides payments and technical assistance to landowners who reduce the flow of pollutants to surface or ground waters. Funding for fiscal year 1 992 was $6.7 mill ion. The 1 990 Farm Bill supports sourcereduction research, nutrient management and evaluation of agricultural non-point pollution. The Farm Bill will be up for reauthorization in 1 993 and the DOE Biomass Program should monitor testimony carefully to assess possible impacts on a DFSS.
A related Act which will impact potential DFSS sources located in coastal areas of the U.S. is the Coastal Zone Management Act (CZMA) as amended in 1 990. State non-point source programs are currently being reviewed. EPA recently issued guidelines to states to prepare non-point controls. State program plans must be submitted to EPA and the National Oceanic and Atmospheric Administration (NOAA). Approved programs are to be implemented within three years and will include erosion and sediment control , nutrient, pesticide and irrigation management. Specific measures have been developed by EPA in consultation with NOAA to control non-point source pollution from agriculture, silviculture, urban runoff, hydromodification, and marinas. Many Best Management Practice (BMP) studies have shown that no-till agriculture can reduce nitrate leaching and promote faster breakdown of pesticides prone to leaching into groundwater. More timely applications of pesticides can increase effectiveness, lower costs and reduce
2-1 5

t )
j J
EXHIBIT 2-8 Agricultural Chemicals
Mill ion Tons of Primary Nutrients 2 5 �--------------------------------------------------�
1 5
1 0
5
o�--��--��--��--��--��--��--��--���� 194 0 195 2 1964
Fertilizer Use
Mil l ion Pounds of Active Ingredients
1976 1991
�0.----------------------------------------------------.
200
100
0 1 964 1 971 1982 1 987
Pesticide Use ri!iiJ Herbicides • Insecticides [l Fungicides
Source: U.S. Department of Agriculture, Economic Research Service Resources: Inputs, Outlook and Situation Report
2-1 6
1 989 1 991

environmental impacts. Improvements in storage and handling of potential contaminants, such as bulk sales to reduce the number of containers needing disposal, can reduce environmental impacts simply and cost-effectively. These suggestions are reflected in the guidelines. The guidance also suggests several management practices for forestry operation including pre-harvesting planning and establishing streamside management areas to protect against soil disturbance.
Several incentive programs and organizations exist to assist farmers with non-point controls. A Coastal State Organization has formed to press Congress for non-point pollution funding during CWA reauthorization proceedings in 1 993.
2.3.2 Point Source Effluent Umitations
The goals of the CWA are among the most ambitious of any environmental legislation. These goals include attaining swimmable and fishable waters throughout the nation and zero discharge of pollutants into waterways. The EPA, in cooperation with the states, currently establishes limits of specific pollutants that may be discharged by sewage treatment plants and industrial facilities based on best available technologies (BAT) and the economic costs of compliance. EPA enforces compliance through permits issued by states under the National Pollutant Discharge Elimination System (NPDES). For industrial dischargers, including steam generating units, EPA has established stringent standards applicable to specific industries to control up to 1 29 toxic pollutants.
The November 1 9, 1 982 Federal Register (47 FR 52290 et seq.) contained effluent guidelines, pretreatment standards and new source performance standards (NSPS) for the steam electric power plant point source category. Pretreatment standards require that industrial dischargers remove or treat all pollutants that could pass through a municipal treatment system untreated or which could adversely affect the performance of the system. Toxic pollutants are the primary concern of these regulations. Exhibit 2-9 summariz�s the 1 982 1imitations on the discharge of pollutants from steam electric power plants - a source category which, unless modified by future revision to CWA, can be used for comparison with biomass technology discharge. Under the 1 982 CWA amendment, EPA surveyed the steam electric power industry's discharges to determine which priority pollutants (taxies) were detectable in various wastewater streams. No limitations were issued for four types of wastewater, including nonchemical metal cleaning waste, FGD wastewater, runoff from material storage and construction areas (other than coal-pile runoff) and thermal discharge, although EPA reserves the right to propose future regulations.
EPA has segmented major waste streams into the following:
Once-through cooling - cooling water passed through the main condenser in one to two passes, then to waste.
Cooling-tower blowdown - recirculated cooling water discharge.
2-1 7

EXHIBIT 2-9 Effluent Limitations, 1 982
Pollutant
All discharges pH ( except once-through cooling ) PCBS
Low-volume wastesc TSS O&G
Bottom-ash transport watera,d TSS O&G
Flyash transport waterc TSS O&G
Chemical metal-cleaning wastes• TSS O&G Copper Iron
Boiler blowdown TSS O&G Copper Iron
Once-through cooling water Free available chlorine Total residue chlorine
Cooling-tower blowdown Free available chlorine Z inc Chromium Phosphorus Other corrosion inhibitors Other 12 4 priority pollutants
Best Available Technology (BAT) mgh
Max . • Avg .b
100* 20*
100* 2 0*
100* 20*
100* 20*
1 . 0 1 . 0
0 . 2
0 . 5 1 . 0 0 . 2
6 . 0-9 . 0 No discharge
30* 15*
3 0* 15*
30* 15*
3 0* 15*
0 . 2 1 . 0 0 . 2
( in added maintenance chemicals ) No detect . amt .
Coal-pile runoff TSS ( promulgated in 1980 ) 5 0 �um for any one day . �verage of daily values for 30 consecutive days . "probable BCT limits shown with an asterisk; BAT withdrawn 1982 . dconcentration/12 . 5 . Use for mass limit set in 1974 BAT . eoi�ided into nonchemical and chemical categories , 1982 . � TSS = Total Suspended Solids
O&G = oil and grease
2-1 8

Fly ash and bottom ash transport water - wastewater from transporting ash to the ash disposal area.
Low volume waste - boiler blowdown, ion-exchange water treatment, water evaporator blowdown, heater clarification wastes, cooling-tower basin cleaning, house service water, lab and sampling drains, floor drains, roof drains.
Chemical metal cleaning - water from cleaning boiler water sides and steam sides, feedwater heaters, condensers, etc. with chemical solvents.
Nonchemical metal cleaning - wastewater from cleaning gas sides of boiler, air pre-heaters, coolers, condensers, etc. with water containing no chemical additives.
Fuel-storage runoff - drainage from storage areas.
Materials storage runoff - drainage from storage areas other than fuel .
Flue-gas desulfurization - blowdown from the desulfurization system.
Thermal discharges - heat contained in cooling water discharge.
A current debate under the CWA reauthorization concerns the thermal discharge exemptions that power plants have enjoyed to date. These discharge exemptions were granted if a plant's thermal plume did not significantly affect a waterway's ecology. Environmental groups such as the Natural Resource Defense Council oppose the socalled section 31 6(e) exemptions in the CWA and are currently lobbying the U.S. Senate to repeal the exemptions and thus require installation of cooling towers on the 679 power units with waste discharge exemptions. If the exemptions are repealed, the cost could be significant to the emerging biomass power industry.
The 1 29 priority pollutants are regulated if discharged from cooling tower blowdown. Once-through cooling water for example typically does not show detectable amounts of 1 1 2 of the 1 29 priority pollutants. The same is true for low-volume boi ler blowdown and chemical metal cleaning wastes. Other pollutants, although detectable, are present in such small concentrations that existing technologies could not reduce them further. Thus they are not regulated. Seven types of PCBs are regulated (Arochor 1 242, 1 254, 1 221 , 1 232, 1 248, 1 260, and 1 01 6}.
In addition to concentration guidelines, the 1 982 effluent guidelines specify mass limitations. Mass limits are calculated by multiplying concentration times discharge flow. Therefore, for steam generation units, there are no pound-per-megawatt requirements. EPA, recognizing that no relationship exists between the mass of pollutant discharged and the amount of power produced (that relationship being governed by fuel type, cooling system or other systems used, etc.) , raises another issue regarding which flows and which flow levels should be selected at each power plant as a basis for permitting mass limitations. This becomes very important for utilities which are providing peak load
2-1 9

service or following changing loads throughout a _period. Industry typically argues for discharge flow calculations at maximum design limits, citing regulatory requirements to provide power on demand at any given moment.
Several issues illuminate the complexity of the EPA's water discharge regulations. For example, permit requirements, although relatively easy to understand for separate discharge streams, become more problematic when streams are mixed prior to discharge. This is not an unlikely scenario in most plant operations. The potential exists for cooling tower blowdown to be mixed with ash transport water in an ash disposal pond, but each stream has a different discharge limit. Another example is rainfall on ash ponds. Rainfall adds to the flow through the pond, and although this stream is unregulated, it impacts total suspended solid discharge concentrations and mass limits.
Another issue concerning once-through cooling systems is pollutants entering the cooling intakes from the water supply. Accurate sampling of water intake is required for permit applications. Cooling system equipment can cause insecticides or herbicides from upstream runoff to concentrate in amounts greater than allowed in the permits, and this could further impact water discharge concentrations.
2.3.3 Point Source Water Quality Criteria
EPA has established water quality criteria with the goal of protecting human health and welfare and protecting the propagation of fish, shellfish, and wildlife, and preserving recreational opportunities. The current water quality criteria are shown in Exhibit 2-1 0. If the state water quality criteria and standards can not be met by effluent guidelines in the existing NPDES permit, then the state can impose more stringent limits on pollution in the permit consistent with EPA's water quality criteria. An outcome would most likely be more stringent l imits on existing regulated pollutants plus new l imits on taxies not currently regulated under present guidelines.
The discharge limits based on best available technology were shown previously in Exhibit 2-9. These include regulation of pH, Total Suspended Solids (TSS), oil and grease, iron, copper, chromium, zinc, and total dissolved chlorine. However, toxic discharges of arsenic, nickel , cadmium, lead, and selenium have been shown to be in excess of the established water quality criteria for coal-fired power plant sources and thus may be subjected to new, more stringent discharge permit restrictions.
Also shown in Exhibit 2-9 and discussed earlier, the principal pollutant in once-through cooling systems is total residual chlorine used to control biological growth in the system . Dissolved and suspended matter i n cooling tower blowdown which may contain corrosion inhibitors (chromate and zinc, or zinc and polyphenols) are of concern. Materials used to construct cooling towers which leach into cooling water can be a concern. Both fly ash and bottom ash may be sources of pollutants during transport, but further characterization studies must be performed on biomass asli constituents.

EXHIBIT 2·1 0 EPA Water Quality Criteria for Priority p·onutant Elements
Element Arsenic Cadmium Chromium
(+ 6) Copper Lead Mercury Nickel Selenium Zinc
units = JA.g/L
Freshwater Maximum 30-day avg.
1 40 72 4.5 4.5
1 1 .0 7.2
1 5.7 1 0.8 64 2.5
1 .1 0.2 1 800 96
260 35 320 47
2-21
Seawater Maximum 30-day avg.
1 20 63 38 1 2
1 200 54
3.2 2.0 220 8.6
1 .9 0.1 1 40 7.1 41 0 54 1 70 58

)
2.4 RESOURCE CONSERVATION AND RECOVERY ACT OF 1 976 {RCRA) USC TITLE 42, SECTION 3251 ET SEQ., PUBLIC LAW 94-580
i The Resource Conservation and Recovery Act of 1 976, also known as The Solid Waste Disposal Act (PL 94-580), which regulates the management of solid and hazardous wastes, is currently up for reauthorization. Neither the Senate legislation (S976) nor the House version (HR3865) reached the floor in 1 992. No group - environmentalists, industry, or others - has pushed for introduction in 1 993. It appears that the 1 03rd
Congress itself is awaiting signals from the new administration on priorities before acting. When the legislation is introduced, itwill provide a potential opportunity for the biomass program to affect solid waste considerations or vice versa. A likely outcome will be that administrative changes made by the President unilaterally will be the only RCRA action in 1 993.
2.4.1 SubtiUe C • Hazardous Waste Management
Anyone who handles a solid waste must determine if that waste is hazardous or not. To do this, Subtitle C - Hazardous Waste Management, must be examined.
The EPA identifies and lists hazardous wastes. The criteria for identifying the characteristics of hazardous wastes are the following: a waste is hazardous if it may cause, or add to, an increase in mortality, or irreversible or incapacitating il lness; or, if it presents a risk to human health or the environment when managed improperly; and can be detected via knowledge or an available standardized test. A solid waste will be listed as hazardous if it meets one of the following criteria: ignitability, corrosivity, reactivity, toxicity, fatal to humans (or animals) in low doses, or contains toxic constituents. It is the generator's responsibility to determine if h is waste exhibits one or more of the above characteristics, if it is not already identified by the EPA. Generally, ash is excluded from Federal hazardous waste regulations (see below), but for ash derived from a biomass combustion facility, state governments may require corrosivity and toxicity testing. Corrosivity is measured by a pH value of aqueous material of less than or equal to 2 or greater than or equal to 1 2.5. Toxicity is tested by the Toxic Characterization Leaching Procedure (TCLP) prescribed by the EPA. The TCLP is considered to be more stringent than the previously used Extractive Procedure Toxicity Test (EP Tox Test). Municipal waste streams, including biomass and residue ash, can pose special problems in this case. Ash generated from the combustion of municipal waste containing biomass is often considered h�ardous not necessarily because of scientific test results but because of the polarized politics of municipal waste management.
Generators of hazardous waste must follow certain standards which vary based on whether the waste is treated, stored, or disposed of on- or off-site. 11A generator must not treat, store, dispose of, transport, or offer for transport, hazardous waste without having received an EPA identification number. . ... Hazardous waste may be accumulated on-site for 90 days or less without a permit, provided that certain storage procedures are followed. A manifest, designating one facil ity and one alternate facility for disposal of the waste, must be prepared before transport, except when the vehicle transporting is owned
2-22

by the reclaimer of the waste. Also, before transport, hazardous waste must be packaged, labeled, marked, and placarded according to Department of Transportation regulations. The generator must also keep copies of all manifests, Biennial Reports (EPA form which covers the previous year's activity) and Exception Reports (filed when a generator has not received confirmation of delivery of a waste), and keep records of test results or analyses. Several of the above policies, as well as the Hazardous Materials Transportation Act, also apply to transporters of hazardous waste. The EPA has the authority to enter, inspect and obtain samples from any establishment where hazardous waste is located, and to make that information, unless it is confidential, avai lable to the public.
There · are several provisions which exclude certain solid wastes from Subtitle C regulation. Some of these are:
solid wastes, from growing and harvesting crops, which are returned to the soil as fertilizer;
fly ash waste, bottom ash waste, and slag waste generated mainly from coal and fossil fuel combustion;
cement ki ln dust waste;
certain wastes intended to be beneficially re-used, recycled, or reclaimed. This includes used oil that may exhibit a characteristic of hazardous waste but is recycled.
Of import to the Biomass Program are the provisions excluding waste from the growing and harvesting of crops returned to the soil as fertilizer, exclusion of combustion ash, and certain wastes intended to be beneficially recovered. The last category may be interpreted to include certain managed wood wastes. These topics are addressed next.
2.4.1 .1 Combustion Ash
Although the Federal EPA would generally consider biomass power combustion ash as a non-hazardous waste, as with the air pollution control program, the EPA has delegated some RCRA authority to the states if state programs meet or exceed Federal standards. Most states have developed regulatory programs for solid and hazardous wastes which meet the criteria.
Ash produced from a power production process is almost always defined as a solid waste. Some ash, however, is used as a soil amendment for acidic soils, as an ingredient in concrete, as a road-base, as fill material , as sanitary landfill cap material, or even as an agent used to neutralize acid gas emissions in coal-fired power plants. Thus, ash can be considered a marketable product. Normally, ash is not considered a hazardous waste, but ash characterization can be required by state or Federal officials, or by potential purchasers of ash to ensure the consistent quality of the product. Ash
2-23

from municipal incinerators, however, can be considered hazardous by some states. The concern is the potential for ash to leach heavy metals and other contaminants into ground or surface waters. Thus the distinction must be made between municipal incinerator ash and power plant ash.
A temporary moratorium on regulating municipal ash as a hazardous waste has recently expired and states can now regulate more strictly if they desire. A recent memorandum from EPA Headquarters to regional administrators indicated that municipal waste combustion ash is not subject to RCRA regulation as a hazardous waste. Neither the proposed Senate or House bills to re-authorize RCRA would designate municipal ash as a hazardous waste, although this ash would be subject to Subtitle C requirements for inspection, analysis, monitoring, testing, and enforcement.
The classification of wood waste combustion products by solid waste regulations has critical impact on the review and permitting process. Variations occur by state and are not examined in detail here. But it is at the state authority level where the biomass power program may receive the most resistance to the notion of ash as a byproduct rather than as a waste material.
2.4.1 .2 Waste Wood or Residue Resource?
States typically make a distinction between clean, harvested wood and recycled or treated, non-harvested wood waste. Biomass developers must be aware of individual state definitions and impacts on permit reviews. Waste wood as a feedstock can be viewed as fall ing under solid waste regulations with criteria such as source of wood and point of use (on-site mill waste or off-site delivery of fuel) being judgement criteria. In general, states define harvested wood, yard waste, pallet waste and mill residue used onsite as clean wood fuels. Chemically treated wood is often referred to as adulterated wood and regulated more strictly than clean wood. Adulterated wood must pass standards for control of non-combustible material before use is approved.
If state regulations do not distinguish clean wood waste or residues from treated or adulterated waste wood, or if ambiguities exist, a significant barrier to an expanding biomass industry can result because of supply limitations and uncertainties. Developers are quick to point out the benefit of combusting wood waste. Combusting relieves pressure on l imited landfill space (often disposal in landfills is banned outright for treated waste) , provides a stable market for waste wood and avoids decomposing wood waste which creates methane, a greenhouse gas more active than C02•
Public interest groups and some permitting officials discourage siting of new combustion faci lities which are interpreted as waste disposal facilities. The facility must be perceived instead to be a power generation facil ity. Care must be taken to not be considered a municipal waste incinerator, as the public perception will be more negative and the regulatory process more complicated. A review of four state approaches was presented at a recent National Biofuels Conference (Donovan 1 992) . It was reported that states' solid waste regulations tend to define a wood-fired facility as an incinerator, an energy
2-24

or resource recovery facility, or as a wood residue boiler, depending on whether it is used primarily for disposal or for energy recovery. If clean wood is used, typically it is for energy production (process heat or electricity) and thus the disposal versus energy issue is relatively clear. Use of treated wood is often a problem, with hybrid waste regulations being employed which draw from both ash and fuel regulations for wood boilers and municipal sol id waste facilities; New York defines a facility as an incinerator if it burns any solid waste, but distinguishes among types of incinerators. An energy recovery incinerator burning untreated, 11Ciean11 wood waste is exempt from classification as a solid waste management facility and does not require that permit. If a facility's fuel is obtained from treated sources, it is a process incinerator requiring a solid waste facility permit. Wisconsin considers combustion of treated wood as incineration. However, it regulates the facility as a wood residue combustion system because solid waste officials can only regulate ash disposal, not the combustion facility itself. Other states subsume incineration or any recovery under such categories as transformation facilities, as in California, or resource recovery facilities in North Carol ina. Adding to the confusion are jurisdictional variations among state authorities where regulatory reviews can be performed primarily at state or district air or water quality agencies. A program may be needed to sort through the myriad of state differences to present a clear picture of the status of biomass combustion-produced ash, and definitions of wood fuels and combustion facilities.
2-25

2.5 NATIONAL ENVIRONMENTAL POLICY ACT OF 1 969 {NEPA) USC TITLE 12, SECTION 4321 ET SEQ.
NEPA requires Federal agencies to consider environmental impacts of their proposed major actions. This ensures that alternative actions are weighed and that public participation occurs during the course of NEPA review. A Federal action includes any action undertaken directly by Federal agencies, such as operating programs, constructing facilities, and providing funding to others to pursue some action which may impact the environment. Also, any decision on whether to grant permission to others, including private businesses, state and local governments, to proceed with a project having environmental impact may require NEPA review. The Council on Environmental Quality (CEQ) oversees NEPA review and has established regulations for all Federal agencies. Most Federal agencies have issued regulations to implement NEPA but have found that environmental review requirements have proliferated with the enactment of subsequent legislation, making NEPA compliance more complex. Working under a ten-point directive from the Secretary of Energy, DOE has been working with CEQ to update NEPA procedures.
To document a NEPA analysis, agencies are required to prepare either an environmental assessment (EA} or an Environmental Impact Statement (EIS) which addresses the potential impact of a proposed action and alternatives to that proposal. The level of documentation varies depending upon the significance of the environmental impact. The EA is a concise public document that analyzes the environmental impact of a proposed project in sufficient detail to determine the level of significance of the impacts. A finding of no significant impact (FONSI) is a public document which briefly explains why a proposed project will not have any significant effects on the environment and why, therefore, there is no need to prepare a more detailed EIS. Frequently, both a Federal and a state EA will be conducted. In these cases, both assessments must conclude that environmental impacts are minimal by issuing a FONSI, otherwise an EIS will be required. An EIS is a more detailed statement required when a Federal action significantly affects the quality of the environment. It must include an analysis of reasonable alternatives to the proposed action. A record of decision (ROD) is a public document that reflects the agency's final decision and rationale behind that decision and commitments to monitoring and mitigation of impacts. A decision tree for DOE NEPA implementation is shown in Exhibit 2-1 1 .
Proposed DOE-funded or co-funded demonstration of biomass combustion, conversion or DFSS technology will require NEPA review. Depending on the extent of Federal involvement, use of any lands for DFSS or residue harvest may require NEPA review. Currently, a NEPA review is in progress for the 1 00 ton/day biomass gasification demonstration facility in Hawaii . The experience developed during this NEPA review wil l be invaluable in illustrating the complexity of moving forward with government-funded construction of biomass power systems which may impact the environment.
2-26

1\) �
Identify proposed federal action
Yes
No
• Prepare memorandum to ftle
No
� Prepare ftndlng of 'no elgnlflcant Impact"
•
•
Scoplng
• Not required for leglsla11ve proposals
Complete EIS �lmplementa11on� plan
Prepare L.-draft EIS r--
.----® • Scoplng
meetings (optional) t r �� t
.... making
--.. Prepare
ftnal EIS ...
Internal re\llew and I ... 1 approval
Public rei/lew
• 30-day minimum
-- Decision making
• No sooner than 90 days after clrcu· lation of draft EIS and 30 days after c!rcula11on of EIS
..
•
Record of decision I ...,1 �:nent
•AcUon limited unUI decision ls reoorded
•state the decision •1 dentiftcsUon of
environmentally preferable altema· tive and rationale
• Alternative selected and rationale
•Mitiga11ng measures
U.S. Department of Energy Decision Tree for Implementing NEPA Procedures (Souros: DOE Eny!roomADtal Cgmpl!anoe GuidA 1980)
Internal Public re\llew and I -_ approval r-- review 1--
.... Conduct NEPA follow-up
• Public hearing (If appropriate)
• 45 day minimum
To rAl.-1
•Conditional gran1s, perml1s, approvals, and funding
•Inform coopera11ng and commenting agencies
•Make monitoring data available to public
� ii =i � ...
z m � c CD D. !! . 0 :::s ':J CD CD

2.6 OTHER RELEVANT ENVIRONMENTAL LEGISLATION:· TSCA, FIFRA, AND ENDANGERED SPECIES ACT
2.6.1 Toxic Substances Control Act of 1 976 USC Title 1 5, Section 2601
TSCA was established to identify and control toxic chemical hazards to human health and the environment. To make informed decisions regarding chemicals, the EPA has the authority to collect information from manufacturers and processors of chemicals on any possible risks. If data on a chemical is not available, TSCA also enables the EPA to require testing by the manufacturer for toxicity. To prevent a new, untested substance from entering the market, manufacturers/processors must give 90 days notice of intent to manufacture/process. This gives the EPA the opportunity to examine chemicals and determine what kind of control , if any, is needed. This rule also applies to chemicals which will be used for a new purpose C'significant new use"). However, an exemption may be applied for if the new purpose is one which the EPA has determined does not pose · unreasonable risk of injury to health · or the environment.
The Act contains a broad range of controls for chemicals that present a risk to health or the environment. These controls range from labeling requirements to total prohibition. A chemical may be regulated during any stage of its life: manufacturing, processing, distribution in commerce, use or disposal. The EPA may require that manufacturers and processors do the following: make and retain records of processes used; conduct tests to assure compliance with TSCA requirements; and notify distributors or anyone who may be exposed to the chemical of any risk of injury. If a chemical clearly poses an imminent hazard, the Agency may. petition the court for removal of the chemical from commerce and for relief against the manufacturer. Under TSCA, the EPA requires manufacturers, processors and distributors to keep records (from 5 to 30 years) of any adverse effects caused by the substance, and to notify the Agency if risk of injury is discovered.
2.6.2 Federal Insecticide, Fungicide, and Rodenticide Act of 1 947 7 USC 1 36, et seq.
FIFRA regulates the registration of all pesticides, and their distribution and application. The EPA evaluates test data on pesticides submitted by applicants based on any potential risks posed to humans through groundwater consumption. Several factors will contribute to the movement of pesticides into groundwater. These include: the chemical and physical characteristics of the pesticide; rate, timing and method of application of pesticides; local climate; soil type; and depth of aquifer. To apply a "restricted use•• pesticide, all applicators, whether commercial or private, must be certified by the EPA or the state.
FIFRA is discussed because pesticides will be used during the growing of biomass for biomass energy systems. A possible impact of FIFRA would be a slowdown in production or a possible loss of money if a certain pesticide were to be recalled while in use.
2-28

Questions concerning water pollution, such as leaching or runoff are included in the Clean Water Act discussion. Air pollution questions will be answered by the Clean Air Act (Amendments) .
2.6.3 Endangered Species Act of 1 973 U.S. Fish and Wildlife Service, Dept of Ule Interior
The Endangered Species Act is yet another major environmental law up for reauthorization in the 1 03rd Congress with implications for the Biomass Power Program. Congress declared that the U.S. has pledged itself to conserve the various species of fish, wildlife and plants facing extinction. The purposes of this act are to provide a means of protecting endangered and threatened species, and to conserve the ecosystems on which they depend. Regarding endangered fish and wildlife, it is i l legal to 11take•• , that is 11harass, harm , pursue, hunt, . . . .. etc. any listed species or to attempt any of these, within the U.S. With respect to endangered plants, it is unlawful to remove or take into possession, damage or destroy any species from a Federal jurisdiction, or 11damage, destroy, remove, cut or dig up .. a plant in another area in knowing violation of a state or criminal trespass law. However, the Secretary of the Interior may permit a taking if it is incidental to an otherwise lawful act. The application to take a species must be accompanied by a conservation plan, and anyone can apply for this exemption, but they must first consult with the Secretary, submit a biological assessment, and have refrained from any irreversible commitment of resources. The penalties for violations of this act range from $500 to $50,000 or one year in prison.
Because all Federal agencies must comply with this act, their actions should not jeopardize the continued existence of any endangered or threatened species or result in destruction or adverse modification of the habitat of such species. Every agency or applicant must obtain a list of species in the area from the Fish and Wildlife Service. If there will clearly be 11no effect11 (e.g., there are no listed species), then nothing further needs to be done. If, however, the project is .. not likely to have an adverse effect, .. a biological assessment must be performed by the applicant. The results of the assessment, along with reasons why an adverse effect is not likely, must be provided to the Secretary. If the Secretary concurs, the project can be built; if not, an informal consultation involving discussions ensues. If these discussions are insufficient to clarify the situation, a formal consultation wi ll then occur. A consultation period can last for 90 or more days, after which the Secretary will present his opinion on the matter. Regardless of the extent to which a species or critical habitat will be impacted, the Secretary will set requirements that must be complied with in order to implement an action.
The Endangered Species Act impacts not only the actual construction of the power plant, but also any dedicated feedstock supply. Because a DFSS requires several years before harvesting, the first power plants will most likely be located close to industrial wood waste sources. These areas, primarily the South and Northwest, are also the areas with the highest number of endangered and threatened species (see Exhibit 2-1 2) . A biomass feedstock system of, say, 1 00 one-square-mile farms spread over a 25-mile radius, would
2-29

,.
EXHIBIT 2-12
Location of Biomass Feedstocks, Agricultural Residues and Forest Resources
g Agricultural residues � Wood resources and residues [] Agricultural and wood residues 0 LDw Inventory
Source: Electricity from Biomass, DOE,
April 1992
Number of Listed Species in Each FWS Region, Through Fiscal Year 1 991
0 Q, -:ec.
(Region 1 ) {) HAWAII
Note: The total number of listed species under FWS' jurisdiction is 638. Source: Fish and Wildlife Service
2-30

have a very good chance of being home to endangered and/or threatened species. Therefore, before any land purchase for feedstock purposes occurs, a thorough biological assessment and consultations with the Secretary of the Interior must be conducted. Also, since species are not static, it may benefit a plant to perform periodic biological assessments.
Recent events concerning the 111isting .. system for species will l ikely have strong impacts on biomass feedstocks, as well as all wood products industries. In a Federal district court settlement, the Bush administration agreed to change the system which determines the list of endangered and threatened species. Until now, there has been a two- to threeyear lag time between filing a petition to list a species and the final determination. This lag has caused the extinction of several species. The Fish and Wildlife Service of the Interior Department has now agreed to propose for listing and expedite the listing of hundreds of species which have warranted protection but, until now, have received none.
The general regulatory trends toward market incentive mechanisms and regulatory negotiation extend to the ESA. The endangered red-cockaded woodpecker may benefit from innovative credit-trading schemes in the Southeastern states (WSJ 1 993a). The Fish and Wildlife Service and the Environmental Defense Fund are working to create marketable and transferable endangered species certificates. Landowners would acquire these certificates by allowing pairs to breed then sending fledglings to live on Federal lands. An economic value or credit would be determined and attached to the certificate, which could then be sold or traded to others. A credit would enable landowners to cut trees or take action which would destroy habitat. In Washington state, Georgia Pacific recently negotiated with the Interior Department to protect the 1 1 3 red-cockaded woodpecker colonies by maintaining a 200-foot buffer zone around each colony (WSJ 1 993b). About 1 00 acres of habitat for colony foraging will also be provided by Georgia Pacific using selective tree-cutting to minimize its losses in those areas.
The most significant, recent trend, however, may be the .. multispecies, ecosystem approach .. , which the Fish and Wildlife Service now officially recognizes. Instead of spending significant resources processing several individual species from the same area, the ecosystem can be evaluated and protected as one unit in one comprehensive plan. These new regulatory trends are all designed to preempt battles and litigation over saving individual species. What the effects will be on tree production in the South and Northwest remains an open issue.
2-31

~ Power Generation Stokers Fluidized beds Whole tree burner Simple cycle gas turbine ST/G Combined cycles Fuel cells
EXHIBIT 3-1 Technology Options
Harvesting
Woody energy crops Herbaceous energy crops
Processing Drying Hogging Pelletizing Separation Classifying Screening Gasification Pyrolysis
3-1
Field Pre-processing
Chipping Baling
Storage
Open Covered
� Transportation
Truck Rail Barge
3.0 BIOMASS POWER SYSTEMS ENVIRONMENTAL CHARACTERIZATION
3.1 INTRODUCnON
Power production from biomass and its effect on the environment extend beyond the power plant gate to incorporate the full fuel cycle of production/procurement, harvesting, processing, and delivery. These operations are analogous to the mining, dril ling, refining, and delivery of fossil fuels for power production. Exhibit 3-1 depicts current and future options for the various biomass power operations. For the power producer, biomass fuels can be produced and harvested as energy crops from a DFSS, or purchased as urban wood waste or residues from the wood products industry (e�g., mill shavings) . Such feedstocks may be chipped or shredded on the fuel supplier's site prior to transportation to the generating station. Once at the plant, the fuel may undergo further processing prior to combustion for power generation.
Today's systems utilize wood residues and wastes in a direct-fired Rankine cycle. Future systems will use DFSS energy crops with an intermediate thermochemical process Q.e., gasification, pyrolysis) to produce fuel gas or biocrude oil which can be fired in high-
tt.1'fr Production
Woody energy crops Herbaceous energy crops Wood products industry
residues (untreated) Urban wood waste (treated)

efficiency, gas turbine-based power cycles. In both the near- and iong-term, it will be the acceptability of environmental discharges and impacts from the entire production-togeneration fuel cycle which will determine the success of biomass power.
lhe discussion of environmental characteristics is presented in four parts. Section 3.2 treats all aspects of feedstock production from planting to harvesting, preprocessing and delivery to the plant gate. Storage of raw feedstocks is also discussed in this section. Generally, all of the issues raised in this section are applicable to all types of conversion processes. lhe choices of species, soil conditions, and production and harvesting techniques affect the chemical and physical characteristics of the delivered feedstock. For waste sources, the possibility of chemical treatment is a major factor affecting feedstock composition. As such, they directly affect the environmental characteristics of the conversion processes described in succeeding sections.
lhree general classes of conversion technology are evaluated in separate sections: Section 3.3, direct combustion steam power systems; Section 3.4, gasification combined cycle · systems; and Section 3.5, biocrude gas turbine power systems. While acknowledging that feedstock composition will affect environmental emissions for each of the conversion technologies, data on emissions levels is available only for a few specific feedstocks. lhus, the results presented on conversion represent typical wood or agriculture residues used in systems today, but by no means capture the environmental characteristics for all fuel types.
A second limitation on the findings of this report is related to the choice of representative plant and equipment configurations. Fluidized bed boilers were used as the standard configuration for direct combustion steam cycle power systems because of their capability to burn a wide array of waste fuels. The most common configuration in current use is still a conventional stoker-grate style boiler, and this has significantly different characteristics with respect to specific air emissions such as CO and VOCs. Cofiring of pulverized coal and biomass in conventional pulverized coal (PC) boilers presents another divergent case. Even within a generic class of combustor/boilers, variations in design and operating conditions add to the complexity of evaluating environmental characteristics.
For the gasification gas turbine class, the discussion focuses primarily on a standard combined cycle configuration. Steam injection and simple cycle gas turbines are just a few of the possible variants on power production from a gasified biomass feedstock. Combined cycles are the primary choice for base and intermediate load power above 50 MWe in the market today and are likely to be so for gasification systems of the future.
For the conversion of biocrude oils, there is very little data on the measured emissions of power conversion systems. The basic configuration chosen for this case is a fast pyrolysis reactor producing a biocrude oil suitable for gas turbine use. lhe steam injected gas turbine was chosen to represent a suitable conversion technology for either independent power production or cogeneration in the under 50 MWe scale. Because of the lack of measured data for emissions, the evaluation is considered to be very preliminary.
3-2

3.2 BIOMASS FUEL PRODUCTION, HANDLING, AND STORAGE
3.2.1 Technology Overview
Biomass fuel feedstocks are expected to evolve predominantly from residues (i .e., lowor negative-valued wastes) from commercial and industrial activities to a dedicated supply system where energy crops are grown, harvested, and sold as primary products. One of the key benefits of the production side of the fuel cycle is the capture of atmospheric C02 during the growing cycle. The uptake offsets the C02 emissions from power generation and results in a theoretical zero-net C02 fuel-to-electricity cycle.
Different feedstocks have distinct environmental and physical characteristics which wil l impact both feedstock production and power generation. This section focuses on the direct impacts of production, delivery, and on-site handling. Feedstock characteristics that have significant impacts on conversion are introduced in this section and discussed in succeeding chapters.
Process Description
Biomass feedstocks for power conversion systems have even broader characteristics than the wide array of coals currently used by electric utilities. Their varied chemical and physical characteristics affect every aspect of operations.
Feedstocks, and feedstock production, can be classified into two major categories: primary feedstocks produced specifically as power generation fuels, and secondary feedstocks such as co-products and residues from other commercial • ,activities. Exhibit 3-2 lists many sources and their characteristics for power production.
For primary feedstocks, energy crops fall into two general categories: woody and herbaceous crops. The proposed species of energy crops represent a spectrum of species from hybrid poplars harvested on a five-year cycle, to annual crops such as switch grass. Crops such as hybrid willows represent a conceptual m idpoint in the spectrum with production and harvesting characteristics that bridge the two more general categories. The production techniques for these resources will vary from traditional agricultural practices for herbaceous crops to highly specialized planting and harvesting methods for short rotation woody crops.
Environmental Impacts Summary
The types of environmental effects produced by intensively cultured biomass energy crops are similar to those of traditional crops in agriculture and forestry. Some of the effects have social and environmental dimensions to consider regarding public reaction to the industry's development and growth.
3-3

Uncontrolled biomass production can deplete soils of nutrients. ·It will be necessary to ensure that enough organic material is retained to maintain soil fertility and ensure a sustainable biomass resource. Erosion and leaching of pesticides and herbicides can degrade surface waters. In extreme cases, groundwater may be impacted. Secondary effects of chemical treatments may also impact living organisms like earthworms and insects which are actually beneficial to the soil . These impacts are identical to the repercussions which other agricultural practices have historically faced. The means of controlling waterway degradation from soil erosion and excess supplements will depend, to a large degree, upon responsible land management. Biomass energy crops will be held to at least the same standard of care expected of all agricultural practices.
Another environmental issue surrounding the DFSS is emissions from equipment used to plant, maintain, harvest, and transport the feedstocks. Although well understood, these emissions could become a concern if they are perceived to offset C02 uptake benefits or contribute to the total discharges of criteria pollutants since they are usually produced in proximity to the power plant.
Beyond the traditional environmental concerns of ambient air, water, and solid discharges, changes in plant communities and associated wildlife and habitat are a concern
EXHIBIT 3-2 Feedstock Sources
PRIMARY SOURCES
Dedicated woody crops
Dedicated herbaceous crops
Selective forest thlnnlngs
SECONDARY SOURCES
Wood products Industry wastes
Agricultural Wastes
Waste wood
FEEDSTOCK CHARACTERISTICS
High cost, 3-6 year growth cycle with additional coppice cycles, Typical forestry harvesting Issues
High cost, 1 season growing cycle, Perennials and annual variations, Typical agricultural production Issues
Moderate cost, Removal of In-forest wastes Improves remaining stock, Tree tops and limbs from logging operations, Felled trees
FEEDSTOCK CHARACTERISTICS
Low cost, Hog fuel (chips and bark), Generally untreated, From sawmills, pulp mills
Relatively Inexpensive,
May have high nitrogen, mineral contents,
Includes pits, hulls, and prunlngs
Moderate cost,
From landfills and transfer stations,
Includes demolition wood, debris from gardeners, drop boxes from Industrial operations,
Varying levels of contamination
3-4

associated with energy crop production. This concern is unlike others in that the impacts will be site-specific and may only be quantified during demonstration, not in the laboratory.
3.2.2 Environmental Effects and Controls
The environmental impacts of feedstock production processes are complex, as indicated in the simplified diagram shown in Exhibit 3-3. Not only are discharges or emissions from processing a concern, but also the physical impacts of production processes (e.g. , clearing and harvesting) on the environment.
Production Chemicals
To achieve adequate yields, dedicated fuel supply lands will require various amounts of fertilizers, herbicides, insecticides, and fungicides. Portions of the applied chemicals will be absorbed or ••taken up11 by the plant, while some will be leached into groundwater, lost to erosion, dissipated to the atmosphere, or removed as runoff. Distribution to each of
EXHIBIT 3-3 Environmental Impacts of Feedstock Production Processes
EVALUATION MATRIX FOR ENVIRONMENTAL IMPACTS Chemical/Physical Agents
Generated by Biomass Feedstock Production
Fertilizers, Insecticides
Combustion Products
PICs, NOx
Biomass Removal
Increased erosion Habitat effects
Soli Disturbance and Stabilization
Accel��ated by human
3-5
Environmental Media
Waste Streams
AIR Stack exhaust Spraying
LAND
Erosion Nutrient Depletion
WATER Sink for runoff Sink for chemicals
HABITAT
Land and Water

these sinks is particular for each chemical. For example, 75% of· applied herbicides are distributed to the atmosphere, while only 1 0-1 5% of nitrogen-based fertilizers (i .e., Nfertilizers) carry over to the air.
Soil Disturbance
Soil erosion is naturally affected by wind and water, and accelerated by the impact of human activities. Mechanical movement by rain and wind of agricultural soil into streams, rivers, and bays causes sedimentary occlusion. Soil sedimentation causes changes in water depth and bottom materials, affecting the growth of aquatic plants and animals. Rainfall and irrigation (quantities and distribution) cause erosion, but this can be ameliorated by land management practices such as holding ponds, contouring, no-till practices, etc. Concerning woody biomass, crop residue coverage such as coppicing (reducing the crop to a thicket) , rather than retained mass, may reduce soil erosion by water and wind compared to many other agricultural uses. Planting stabilizing grasses without affecting woody crop growth also holds the promise of reducing erosion.
Sedimentation is part of the natural geological cycle of land growth and water siltation which has many beneficial attributes, such as developing highly productive estuarine marshes. But geological sedimentation and agricultural soil erosion occur over vastly different time periods. It is the rapid loss of soil into waterways that is overwhelmingly deleterious. Currently, some 26% of U.S. cropland (44 million hectares) has waterborne soil erosion which exceeds permissible rates. About 23% of cropland in the Great Lakes region is adversely affected by windborne soil erosion.
Combustion Discharges
Discharges to the atmosphere from combustion of fossil fuels will occur from two sources in the production-through-transport phases: diesel-fueled farm equipment used to establish, maintain, and harvest the feedstocks; and diesel-fueled trucks used to transport the fuel from the supply site to the power plant. Emissions from these sources will include products of incomplete combustion (PICs, such as hydrocarbons and carbon monoxide) , NOx, C02, particulates, and S02 (from assumed low-sulfur diesel fuel). Although total emissions from farm equipment will be similar for each site, total transportation emissions will be dependent on the hauling distance from the farm to the power plant.
Energy Crop Growth Effects
Growing energy crops will emit non-methane aromatic hydrocarbons to the atmosphere. To date, isoprene and monoterpene emissions have been characterized for above-ground portions of herbaceous crops, and foliage of woody crops. Isoprene emissions from hybrid poplars, for example, are in the 1 70-1 400 lb/acre/year range (Perlack 1 992) . Emissions in this range are at or below the VOC emission rates for forest areas and therefore may not present an impediment to commercialization.
3-6

As crops are grown on virgin, nutrient-rich soil , organic and inorgaAic matter from the soil are absorbed by roots and subsequently removed from the soil . Although the formation of compounds in the soil may take centuries, degradation can be very rapid. For example, the pristine soil of North Carolina and the Great Plains originally contained from 2 - 8 % organic matter. Today organic concentrations in these soils are 50-65% of the original levels (Kitani 1 989) . Although the soil may be replenished with fertilizers and other soil amendments, these additives present their own environmental concerns, as discussed above.
Biomass Decomposition in Field and Storage
Once harvested, biomass feedstocks which decompose will emit C02 to the atmosphere. In general , the amount of C02 captured by aboveground biomass in one year will be liberated in the same period if the feedstock is allowed to decompose (Perlack 1 992) . Thus C02 can originate from stored biomass and residues left on the field after harvest.
Biodiversity and Habitat
The environmental effects of production operations on wildlife are currently unknown. These concerns are magnified in wetland and other sensitive or protected areas. Harvesting equipment and the associated exhaust and noise regulations are under development. No researchers currently anticipate limitations on harvesting and transport of biomass. However, endangered or protected species now l iving on agricultural land may be in danger of habitat modification if the land is util ized for energy crop production. These effects need to be monitored to ensure that negative impacts are addressed promptly as the biomass industry develops. There are also opportunities to improve habitat through biomass plantings and habitat protection awareness through education and outreach.
Biodiversity, defined as genetic variability within a species, or as variability of species within a population, also means species and ecosystem diversity and preservation. Because energy crops have not reached field applications, the inputs required to determine the effects on biodiversity have not been resolved. In general, on a regional basis, when energy crops are grown on lands with broad backgrounds, biodiversity may worsen; when established on lands with existing monocultures, biodiversity may improve.
Related to the biodiversity issue is concern for insects and disease ravaging an energy crop. At the microsite scale, it is known that monocultural plant systems, such as those used in agriculture (and possibly a DFSS) are more susceptible to insects and disease than naturally occurring multicultural systems. For example, winged pests of the grasshopper type will destroy an entire region's priority plant through well-understood en masse incursions. Natural , multicultural systems limit the accessibility of such priority food plants and also have the opportunity to develop various natural immunities to prevent the ravishing of an entire crop. A potential solution is the planting of energy crops and food and fiber crops in an integrated fashion. This strategy both reduces the risk of plagues and provides landscape value through a sense of variation in the colors and
3-7

textures in the planting area. Researchers are aware of and must implement planting of natural or genetically altered crops which do not have undesirable effects such as unwanted invasion into natural habitats. Exotic species are generally discouraged.
3.2.3 Regulated Waste Streams and Impacts
Air Emissions
As discussed above, the majority of air emissions will originate from diesel-fueled farm equipment and transport vehicles, and will consist of CO, HCs, NOx, S02, C02, and particulates. These emissions are negligible relative to those from other sources in the feedstock production-to-electricity system and will be controlled by transportation regulations. These regulations are beyond the scope of this work. C02 and CH4 will also be released from decaying energy crops, while actively growing feedstocks will contribute VOCs to the atmosphere. However, it is unlikely these emissions will be regulated.
Land ·concerns
Primary land concerns include soil erosion caused by water and wind, and the depletion of nutrients from virgin soi l , and soil compaction from equipment use. Although soil erosion in general is not governed by an exclusive Federal regulation, the CZMA may_ regulate agricultural land erosion which directly impacts coastal areas. Additionally, there is a growing consensus to regulate non-point sources of water pollution. The 1 990 FACT Act strongly encourages soil conservation in its conservation compliance and sod buster provisions. If reauthorized, the CWA is seen as a probable mechanism for regulation. Although absorbed nutrients may be replenished with fertilizers, the application of such chemicals creates additional concerns associated with dispersion of soil additives into water bodies and the atmosphere. Soil compaction can lead to loss of porosity in the soil and further complicate erosion control .
Water Discharges
Two general classes of water bodies will be affected by energy crop production: groundwater and surface water. Soil amendments (herbicides, fertilizers, etc.) wi ll contribute to contamination of both classes, while topsoil runoff will contribute only to surface water contamination. Regulation concerning erosion was discussed above. Under FIFRA, use of harmful pesticides may be restricted or suspended. Energy crops using such soil amendments could suffer yield and financial losses if the pesticide is recalled. Runoff may also be subject to CZMA and any new CWA regulations.
Biodiversity and Habitat
The Endangered Species Act conserves endangered and threatened species and their critical habitats. If such wildlife and/or habitats are found on proposed energy feedstock land, the DFSS will be difficult to permit. However, such circumstances will be sitespecific.
3-8

3.2.4 Feedstock Composition Characteristics Affecting Conversion
Fuel composition has direct impacts on the _ performance of and discharges from thermochemical and power conversion processes. In turn, soil nutrients and wood product additives have direct effects on the composition of biomass fuels. Soil amendments applied to commodity crops appear in the associated agricultural wastes used in power systems. This will also be true for energy crops. Commonly utilized nitrogen and potassium fertilizers can contribute to fuel-bound NOx and ash stagging difficulties. Although required in smaller quantities, sulfur-based additives may contribute to increased S02 emissions. Chlorine is required by plants in extremely small quantiti es but has been applied when severe deficiencies are detected. If absorbed by the feedstocks, chlorine-based dioxin and furan emissions may result. Exhibit 3-4 provides a comparison of an agricultural and a woody feedstock for biomass power facilities. Similarly, urban wood wastes may contain elevated levels of certain constituents as a result of additives such as adhesives, preservatives, and coatings. Although the levels of inorganic material (i .e., ash} in treated and untreated biomass fuels are comparable, additives generally result in increased concentrations of metals including mercury, copper, lead, arsenic, and chromium. In particular, CCA-treated wood contains elevated levels of arsenic and chromium which may result in state emission guideline violations (NYSERDA 1 992}.
Noncombustible, nonvolatile portions of the fuel are the primary constituents of ash or air particulate emissions. Exhibit 3-5 below shows that biomass fuels have relatively low ash content compared to other solid fuels. Ash content in wood is an intrinsic characteristic
EXHIBIT 3-4 Sampling of Biomass Feedstocks
Feedstock
MCW HHV (Btu/lb.) Ash Fusion (0F}*
Composition (by weightt N s Na K Ash
* Softening Temperature + Dry Basis
Source: Furman, 1 992
Mill Wood Waste Bagasse (Low Bark} (Pelletized)
6% Dry 8980 6960 2230 2400-2500
0.45% 0.87% 0.04% 0.06% 0.02% 0.09% 0.05% 0.52% 0.90% 7.80%
3-9

EXHIBIT 3-5 Ash Content of Fuels ·
Fuel
Biomass
Black oak1
Pine sawdusf Cedar1
Oak bar�
Coal
West Virginia Rank 01
Texas lignite3
Illinois Bituminous3
Refuse derived fuel (RDF)
Collected in fall4
Collected in summe�
1 - Bushnell, 1 989 2 - de Lorenzi, 1 953 3 - Elliott, 1 989 4 - Canova, 1 992
Ash content (wt. % dry)
0.1
0.5
2.0
5.3
4.0
1 2.8
1 7.4
10. 6
2 7.7
and varies with species and the available mineral content in the soil . Ash content is, however, generally elevated in fuels derived from portions of trees where essential functions occur, mainly the inner bark and foliage (OMNI 1 988). Timbers removed from the forest and dragged along the forest floor may collect additional inorganic material o .e., dirt and sand) and, subsequently, have increased ash content in their bark. As mentioned above, treated wood wastes have similar ash contents to untreated biomass ..
Combustible constituents such as sulfur and nitrogen in the fuel produce acidic gases and ozone precursors which are controlled by the air regulations. The sulfur content of most biomass feedstocks is very low, less than 0. 1 % by weight. Fuel-bound nitrogen (FBN) is on the other hand closer to 1% by weight.
Other constituents that should be monitored include trace metals, including alkali metals such as potassium or sodium which tend to produce operational problems in boilers and gas turbines, and toxic metals such as cadmium, lead or mercury which can pose health risks if present in sufficient concentrations. The levels of toxic metals may be elevated in treated resources.
3-1 0

Chlorides or chlorinated hydrocarbons can cause potential air problems. These chemical species are more common in residues of intensively cultivated crops than in woody residues or in crops grown for energy production. Chloride levels in treated, urban wood wastes are similar to those in untreated wood residues.
3-1 1

3.3 FLUIDIZED-BED CONVERSION
3.3.1 Technology Overview
For solid fuels, fluidized-bed combustion boilers (FBCs) hold several advantages over other direct combustion technologies. These benefits include environmental advantages, efficiency gains, and fuel flexibility. However, FBCs have design and operational procedures different from stokers, pile burners, and other traditional biomass combustion systems. Problems experienced in the '70s and early '80s with relatively new FBC technology led to concern among mainstream power plant operators. In the past decade, most of these concerns have been overcome and the FBC has gained in acceptability in the biomass power and electric utility industries as a suitable choice for combustion of diverse mixes of biomass and fossil fuels.
Fluidized-Bed Reactor Process Description
The core of the FBC boiler/steam turbine power cycle (Exhibit 3-6) is the fluidized-bed reactor where solid fuel (biomass) , an inert heat transfer medium (usually sil ica sand) , and, in some cases, a sorbent, are suspended and intimately mixed or 11fluidized11 by combustion air which is evenly distributed from the bottom of the reactor. The bed's
EXHIBIT 3-6 FBC Cycle
Fuel '
_ _ _ _ _ _ _ _ L _ _ _ �et st�-Steam · · · · .. . . . : . . . . . . . : I
I C:·.:.:.: ·..:;.. ) � Cy- ! FBC
I · '- : · clone · - .
I Generator ; �· · ! : Baghouse L -+ ') ....-: ..J � .. . . nTI . . . . . . . . �
I__, . . . · :· P¥ �3-oJ F-=:....::r-=-=
� r---· I nncrons j
Stack L.-1---J + St� I j . � I lE��-
Legend
- - - _ .,.. Air . . . . . . . . Flue gas
-- Water - - • Steam _ _ , . _.,.. Fuel ---- PM, Tramp,
Bed Material, Ash
3-1 2
Pump
Air
- · Tramp material

turbulence creates increased fuel residence time which, in combination with the turbulence, creates lower carbon loss and higher combustion efficiency. This combination of air, sand, and fuel resembles a boiling liquid (hence the name for the design). The inert material acts as a thermal flywheel for combustion by storing thermal energy, mixing with the fuel and sorbent, and heating the fuel to the ignition temperature. Thorough mixing of the fuel and heat transfer material maintains uniform temperatures throughout the bed, thereby minimizing peak temperatures. In some designs, in-bed heat exchangers help to maintain bed temperatures below the ash deformation limits (while providing feedwater heating). These latter features allow the FBC to be used with fuels possessing low ash deformation temperatures which would otherwise create operation and maintenance difficulties. Sorbent injection also permits ••problem .. fuels to be burned in an FBC by capturing compounds that are either regulated or can cause operational problems.
Heavier solids are removed from the bottom of the combustor and separated into light and heavy fractions with vibrating screen conveyors. Heavy fractions (e.g., glass or agglomerated bed material) are disposed of and lighter material (e.g., ash or unburned fuel) is recirculated to the bed. Recirculating lighter fractions helps to limit carbon losses from bottom ash. The hot combustion product gases (i .e., flue-gas) exit the combustor at the top of the reactor and pass through a primary cyclone which removes heavy particulate matter (> 30 microns) . This material is also returned to the FBC and again carbon losses are reduced. Flue-gas exiting the cyclone passes through a series of heat exchangers (superheater, steam generator, economizer, etc.) and the particulate removal system (electrostatic precipitator or baghouse) before discharging to the atmosphere through the stack.
Water/Steam Loop
Water is pumped to a steam drum which contains a mixture of water and saturated steam. Water is drawn (by gravity) from the bottom of the drum and flows through boiler tubes located in the bed o .e., the in-bed boiler tubes) where a portion of the water is converted to steam. The mixture returns to the steam drum and the water is recycled through the in-bed heating elements. The steam entering the drum is removed from the top of the drum (steam rises) where i t flows to additional heat exchangers. Steam exiting the final heat exchanger drives a steam turbine/generator. Steam exiting the turbine is condensed, polished (i .e. , treated) and then pumped back to the FBC. The water used to cool the low pressure steam from the steam turbine is cooled in a cooling tower.
Cool ing Tower
In the condenser of a Rankine cycle, heat is transferred from turbine exhaust (low pressure steam) to cooling water. The transferred thermal energy is then released from the cooling water to the atmosphere through the use of a cooling tower where air and cooling water come into contact. Water from the cooling tower is collected in a basin and pumped back to the condenser where the cycle begins again.
3-1 3

Environmental Impacts Summary
Fluidized bed technology offers several environmental advantages over the conventional spreader stoker boiler. Because bed temperatures are uniform and peak temperatures are minimized, thermal NOx emissions are insignificant. Furthermore, reactors are designed with sorbent injection ports as a means of controlling potential pollutants and other materials that may cause operational problems. The primary pollutants of concern for FBCs are, therefore, trace amounts of organics and metals derived from the feedstocks and present in both ash and stack discharges. This is especially true when firing certain types of waste wood fuels. Well-designed systems burning untreated biofuels will not exceed current state and Federal limits for metal emissions. This, however, may not be the case for treated fuels, in particular, those treated with CCA. Nevertheless, all pollutants should be monitored and evaluated as new RCRA, CWA, and CAAA regulations are promulgated. States with tougher environmental regulations may present problems for siting and operating FBC systems.
3.3.2. Environmental Discharges and Controls
Exhibit 3-7 1ists chemicals/materials generated in biomass FBC systems which, if present in sufficient concentrations, can exceed regulatory limits. These materials either enter the power conversion system with the fuel and/or other consumables, or are generated in the power generation process (primarily combustion) . They tend to be regulated by their concentrations in plant waste streams shown at the right of the diagram. In the paragraphs that follow, the materials of possible concern are discussed by how they are generated, factors affecting their generation, and their relative impacts on the plant waste streams. The discussion of the waste streams follows with an evaluation of the potential for waste stream constituents to trip regulatory limits.
Products of Incomplete Combustion
During combustion, maximum thermal energy is released from the fuel when 1 ) all the carbon contained in the fuel is converted to C02, 2) al l the hydrogen is converted to water, and 3) all the sulfur is converted to S02• When these reactions do not go to completion, PICs will be entrained in the flue gas. Although there is no universally accepted definition, the EPA defines PICs as organic compounds detected in the flue gas stream of a combustion process. Organic compounds may also be found in the ash and char removed from the power generation system. PICs can, therefore, include partially reacted organics, organics formed by destruction and recombination of fuel stream organics, and fuel stream organics. PICs which are included as criteria pollutants under NAAQS include CO and hydrocarbons (HCs). PICs also include special classes of hydrocarbons and other noteworthy compounds.
The amount of PICs generated in fluidized beds is generally lower than in other biomass combustion technologies 0 .e., stokers and dutch ovens) due to bed turbulence and longer fuel residence time which enable the fuel organics to be more fully oxidized. CO emissions (a benchmark of combustion efficiency and other PIC emissions) from biomass-
3-1 4

I I
'
, I I
. I I I
. I I I '·
. j
I I
'j I I - j
. I
EXHIBIT 3-7 Evaluation Matrix for Environmental Impacts
POWER PRODUCTION Material/Chemical Agents
Generated by Biomass Power Systems
PICa
CO, Cxt·bc, PAHs
Particulates
Acid Gas Precursors
NOx, SOx
Water Treatment Metal oxides, sulfates ates
Environmental Media
Plant Waste streams
AIR
LAND
fired fluidized beds range from 1 4 - 250 ppm. Data on other PICs is limited. In 1 988, the California Air Resources Board tested emissions of criteria and non-criteria pollutants from wood-fired boilers (Undner 1 990) . Responding to California's Air Toxic ••Hot Spots .. Law, the Timber Association of California {TAC, now the California Forestry Association) inventoried possible air toxic emissions from wood-fired boilers (Sassenrath 1 991 ) . Results for fluidized beds are shown below. Note that at stack conditions, PAHs Oncluding dioxins and furans) appear in both the gaseous emissions and particulates. However, only data for gaseous emissions were reported, as shown in Exhibit 3-8. It should be noted that treated residues do not result in increased levels of PIGs; rather, the emission levels depend on combustion efficiency.
Trace Metals
With the exception of mercury, metals entering the FBC process are not volatile at stack conditions. As a result, metals are primarily concentrated in the ash and discharge through the solid waste stream. A portion of the fly ash, however, will pass through the particulate control equipment and be discharged to the atmosphere, with mercury. Data on metal concentrations in biomass fuels and trace metal emissions from wood-fired
3-1 5

EXHIBIT 3-8 PICs Generated by Fee·
I Product
co Formaldehyde 1
Acetaldehyde1
Benzene1
Phenols1
PAHs1·(al
Naphthalene Acenaphthylene Acenaphthene Fluorene Phenanthrene Anthracene Fluoranthene Pyrene Benzo(A)anthracene Chrysene Benzo(B&K)fluoranthene Benzo(A)pyrene Benzo(GHI)perylene Dibenz(AH)anthracene I ndeno(1 23CD)pyrene Dioxins2.(a)
Furans2·(a)
(a) gaseous stack emissions reported 1 - Sassenrath, 1991 2 - Undner, 1 990
- I Concentration
1 4-250 ppm
21 ppbv
1 3 ppbv
8 ppbv
Not detected
330 JLg/dscm 0.07 JLg/dscm o JLg/dscm 0.02 JLg/dscm 0.48 JLg/dscm o JLg/dscm 0.21 JLg/dscm o.os JLg/dscm 0.01 JLg/dscm 0.02 JLg/dscm 0 JLg/dscm 0 JLg/dscm o JLg/dscm 0 JLg/dscm 0 JLg/dscm 0.023 ng/dscm 0.209 ng/dscm
]
boilers (especially fluidized beds) is very limited. Further compounding the trace metal emission analysis are contaminants which enter the combustor with the fuel (e.g. , wood additives, sand, dirt, rocks, etc.) and which may contain mercury. The data which does exist shows wood-fired boilers to emit mercury at levels of 0.0-2.4 micrograms/dry standard cubic foot (dscf) (0-90 �-tQ/dry normal cu. meter) (Sassenrath 1 991 ) . Metal concentrations in the solid waste stream are discussed below.
Particulates
Unlike conventional stoker boilers, bottom ash waste streams from biomass-fired FBCs are negligible. Due to its relatively low density, nearly 1 00% of the biomass ash is entrained in the upward flowing flue gas exiting the FBC. Although the larger fractions of fly ash will be captured by the primary cyclone and recycled to the combustion bed, these particles will eventually break up or erode into smaller fragments which will flow through the cyclone. Therefore, all of the ash in the biomass will eventually enter the series of heat exchangers (economizer, boiler tubes, superheater, and, in some cases,
3-1 6
. '
l .] . �
;,j jl . 'i i

l
I I . 1
. I . I I
I,
I J
. 1 I J
'
I . J
), I
I I
reheater) which follow the cyclone. Experience dictates that 5-1 0% of the fly ash will be removed from the flue gas stream in the heat exchangers as a result of changes in direction of the gas flow and heat exchanger elements positioned in the gas stream.
Due to its relatively high density, the bed heat transfer material wil l generally not be entrained in the flue gas. The media which is entrained is large enough to be removed from the stream by the primary cyclone and returned to the combustor. Therefore, stack particulate emissions will not include bed material.
For FBCs, two high-efficiency particulate removal systems are used: electrostatic precipitators (ESPs) and fabric filter baghouses (FFBs or simply "baghouses"). ESPs apply an electrostatic charge to particles which are subsequently collected on highly charged plates. These surfaces are then mechanically vibrated (rapped) to remove particulates to a col lection hopper. In baghouses, particulates are removed when the flue gas stream flows through a dense fabric material. Uke ESPs, FFBs m ust be periodically cleaned of particulate matter. This can occur by applying pulsed, high pressure air or reverse air, or by shaking the filters. Both systems operate at high efficiencies with FFBs and ESPs removing 99% and 90% of particulate matter, respectively (Massoudi 1 992) . ESP systems can be designed to approach the efficiency of baghouses by adding additional units in series: two fields accomplish up to 97% efficiency, three fields 99%, four or more fields >99% (Massoudi 1 992). Assuming a biomass fuel with an ash content of 2.2 lb/MMBtu (1 .05 kg/kJ) and 7.5% fly ash removal in the heat exchangers, loading at the particulate controls will be approximately 2.0 lb/MMBtu (0.96 kg!kJ). Particulate emissions at the stack should, therefore, be roughly 0.02 lb/MMBtu (0.01 kg/kJ) for a baghouse and 0.20 lb/MMBtu (0. 1 0 kg/kJ) for an ESP. Due to similar ash contents, boilers firing treated wood waste should have similar particulate emissions to those firing untreated fuels.
As mentioned above, toxic metals and PAHs are found in the particulate and, therefore, may be transferred to the solid waste stream by the particulate control system. Metals will also be emitted to the atmosphere via fly ash escaping the particulate control system. Thus, metal emissions to the air are a function of particulate collection efficiency. PAH concentrations are relatively small for wood-fired systems (especially fluidized beds) . Measurements have historically been taken at the stack and reported as micro- or nanograms per dscf at 1 2% C02 (JA.g or ng/dscf @ 1 2% COJ. Toxic metal concentrations, however, have been measured as a portion of the particulate matter (on a weight basis) from wood-fired fluidized-bed boilers. Shown in Exhibit 3-9 is data taken from a wood-fired fluidized-bed combustor boiler by the TAC responding to California's Air Toxic 11Hot Spots .. Law. Emission factors are expressed as microgram per gram of particulate captured. Also shown are the detection limits for the FBC emission testing equipment and a range of emission factors for all of the wood-fired systems sampled (pile burners, dutch ovens, suspension burners, and stokers) . These levels will increase when firing certain treated wood fuels. In particular, boilers using CCA-treated fuels may violate emission limits for arsenic and chromium (NYSERDA 1 992) .
3-1 7

EXHIBIT 3-9 Concentrations of Metals in Particulates
Metals in Particulates from Wood-fired Boilers
FBC emissions Wood-fired boiler emissions Substance (f.tg/9 part. catch)a (f.tg/Q part. catch)
Arsenic
Beryllium
Cadmium
Chromium
Hex Chrome
Copper
Lead
Manganese
Nickel
Selenium
Zinc
(a)
Reactor Bottom Solids
0 (45) 4 - 565
0 (NA) 0 (NA)
29 1 - 1 90
1 73 1 4 - 51 8
0 (51 3) 0 - 29
550 70 - 1 756
260 24 - 1 270
7360 745 - 53900
470 5 - 1 520
430 0 - 430
3230 1 80 - 25900
Numbers in parentheses represent emission detection limits for the FBC emission testing equipment. No detection limit cited for beryllium.
In addition to heavier ash fractions which are recirculated to the bed, tramp material may be removed from the bottom of the FBC. Tramp material generally consists of nails, glass, rocks, and dirt which are present from the fuel's initial use (e.g. , nails and/or staples in demolition wood) or which have entered the fuel stream during harvesting, transportation, or other pre-combustion processes (e.g. , wood is contaminated with dirt when logs are dragged out of a forest). Total tramp material may comprise up to 1 0% (by weight) of the input material (Oswald 1 992). Much of this material can be eliminated through proper harvesting, transportation, and fuel processing practices.
Another material sometimes removed from the bottom of the reactor is agglomerated bed material . This material forms when the bed temperature rises above the ash and/or heat transfer media softening temperature. Once softened or molten, the ash and heat transfer media will adhere to other particles (bed material, fuel , and/or ash) to form clinkers. Initial deformation temperatures for biomass ash are lower than for coal ash and range from 1 450 °F - 2680°F (790-1 470 °C) while sil ica sand melts at approximately 21 00 °F (1 1 50 °C) (Schultz 1 992). Reduced biomass ash deformation temperatures can be
3-1 8

1 I attributed to elevated sodium and potassium concentrations in the-ash (see Appendix D) . These compounds combine with silicon in the ash to produce a eutectic with a relatively low deformation temperature. Agglomerated bed material can be reduced by maintaining bed temperatures below the initial deformation temperatures of the ash and bed media. Where deformation temperatures are excessively low, magnesium- and calcium-based sorbents (dolomite and lime, respectively) can be added to the reactor to absorb the sodium and potassium responsible for the reduced deformation temperatures. The result is ash with deformation limits higher than the silicon-sodium and sil icon-potassium compounds.
Nitrogen Oxides
NOx can be formed as either thermal NOx or fuel NOx. Thermal NOx formation, which originates from nitrogen in the combustion air, is highly temperature dependent and rapidly forms at temperatures exceeding 2700 °F (1 480 °C) (Massoudi 1 992). Fuel-bound NOx forms from nitrogen in the fuel and is a function of fuel nitrogen content, fuel-bound nitrogen volatility, and oxygen available to the nitrogen (Babcock & Wilcox 1 992). NOx primari ly takes two forms: nitric oxide (NO) and nitrogen dioxide. Traces of other species, such as nitrous oxide (N20), may also be present. Nitric oxide typically accounts for 90-95% of all NOx from combustion sources and contributes to ground-level ozone and urban smog as it is oxidized to N02 in the atmosphere. N20 is believed to contribute to ozone _ depletion in the upper atmosphere and is a potent greenhouse gas, but does not contribute to smog (ozone) formation.
Uncontrolled NOx emissions from existing biomass-fired fluidized beds are typically in the 0.08 - 0.1 0 lb/MMBtu (0.04-0.05 kg/kJ) (85-1 1 0 ppmv) range (Schultz 1 992) for both treated and untreated fuels. These emissions are significantly lower than NOx from a stoker fired unit (0. 1 1 -0. 1 8 lb/MMBtu (0.05-0.09 kg/kJ) (Tewksbury 1 987)) and ·
'can be attributed to the bed's lower firing temperature of 1 500 °F (81 5 °C) compared to 1 900 °F (1 040 °C) for stokers. At the bed's temperature, atmospheric nitrogen does not disassociate to form thermal NOx, and NOx emissions are attributed only to fuel-bound nitrogen. Operating conditions are so conducive to low NOx emissions, that the fluidized bed is designated BACT for NOx for biomass fuels in California (Schultz 1 992).
As shown in Exhibit 3-1 0 below, uncontrolled NOx emissions from biomass fluidized-bed boilers are substantially lower than uncontrolled NOx emissions from fossil-fueled boilers. This is due to the relatively low nitrogen content (0.03-0.1 5% as compared to 0.25-2.0% for coal - see Appendix D) and lower peak flame temperatures associated with biomass combustion. Combustion of biomass fines or off-design fuels (e.g., low moisture content, high fuel-bound nitrogen) in a fluidized bed, however, can contribute to increased NOx levels, depending on bed design and combustion temperature control scheme. Therefore, proper fuel management and processing is paramount. Furthermore, agricultural wastes (e.g., grape pomace, gin trash, etc.) and some energy crops (switch grass in particular) have nitrogen contents above the 1 % level. For these resources, fuel-bound NOx may be a problem and may require additional control .
3-1 9

EXHIBIT 3·1 0 Uncontrolled Boiler NOx
Uncontrolled NOx emissions from steam boilers
I Fuel I NOx emissions I Biomass - fluidized bed 0.08 - 0.1 0 lb/MMBtu
Biomass - stoker 0. 1 1 -0. 1 8 lb/MMBtu
Coal - tangentially fired 0.5 - 0. 75 lb/MMBtu 1
Coal - cyclone fired 1 .0 - 1 . 75 lb/MMBtu 1
Natural Gas 50 - 1 60 ppmvd2
Makansi, 1988
2 Cho, 1991
Sulfur Dioxide
Another pollutant of concern is created when sulfur in the fuel oxidizes to form sulfur dioxide (SO�. S02 emissions from wood-fired boilers are generally not considered to be a permitting or compliance issue due to the relatively low sulfur content of biomass fuels. Exhibit 3-1 1 lists sulfur contents, heating values, and estimated S02 emissions for various coals and biomass fuels (See Appendix D). Sulfur contents for treated biofuels are consistent with those for untreated fuels. Note that the S02 emissions were calculated with a conservative assumption that all of the sulfur in the fuel oxidizes to form S02• Experience dictates, however, that up to 90% of the sulfur is consistently retained in the ash (NYSERDA 1 992) .
For the biomass fuels burned in an FBC, the above emissions equate to 0-50 ppmv. If discharges at this level are a concern, as may be the case with certain agricultural wastes, S02 emissions can be reduced by adding granular limestone (calcium compound) or dolomite (magnesium compound) to the bed. These additives will react with the sulfur to form a solid sulfate which can be removed by the particulate removal equipment used to capture fly-ash and entrained bed material (i .e., baghouse or cyclone). Although these reagents can be used in the flue gas stream of other combustion systems, only the FBC allows their use in the combustor itself. This unique feature allows for sulfur capture without costly construction and operation of a flue-gas desulfurization Q .e . , FGD or .. scrubber .. ) system.
3-20

3.3.3 Regulated Waste Streams
Stack Emissions
Flue gas released to the atmosphere through the stack will contain criteria pollutants: CO, NOx, 502, PM-1 0, and HCs. These pollutants are generally well understood and can be controlled. However, this stream may also consist of compounds which are not as well understood or consistently regulated. Pollutants in this latter category include mercury and VOCs, including PAHs. C02 is also a stack gas component, but is offset by the uptake of C02 in the production of the biomass. Federal regulations of discharges from biomass-fired FBCs (see Exhibit 3-1 2, see Appendix E for emission unit conversion) are categorized as regulations for new facilities or those for existing units. Modifications to an existing unit which create an increase in discharges will subject the unit to regulations for new installations. The second major consideration in applicability of regulations is the location of the facili,ty with respect to NAAQS regions. Existing units will be subject to emission limits promulgated under litles I and IV of the CAAA. In addition to these regulations, emissions from greenfield installations will be controlled by NSPS found in 40 CFR, Part 60. Both new and existing FBCs must meet additional emission standards established by state and local authorities, which, in many cases, may be stricter than those required by Federal authorities.
EXHIBIT 3-1 1 SOx Emissions
Estimated 502 from various coals and biomass fuels
Sulfur 502 content HHV emissions
Fuel (weight %) (Btu/dry lb) (lb/MMBtu)
Hogged fuel 0.04 91 20 0.09
Pine bark 0. 1 0 9030 0.22
Oak bark 0.1 0 8370 0.24
Rice husks 0. 1 0 7252 0.28
Cotton gin trash 0.40 7474 1 .07
WY Subbit. coal 0.69 1 1 523 1 .20
WV Bit. coal 0.91 1 2505 1 .46
Pitt. Seam coal 2.36 1 3333 3.54
IL OIL. l.iOal 4.55 1 1 477 7.92
3-21

Stack emissions for existing biomass-fired FBC faci lities are summarized in Exhibit 3-1 2. Also shown are Federal regulatory limits and trends. All existing units in ozone nonattainment regions and ozone transport areas will be subject to RACT limits as detailed in SIPs. To date, EPA has issued and NESCAUM has proposed RACT guidelines for NOx emissions in ozone nonattainment regions and ozone transport areas. These guidelines are specific to fuel type and combustion technology. Although no guidelines exist for biomass-fired FBCs, l imits have been proposed for coal-fired stokers. As shown, these restrictions for coal-fired units are met by biomass-fired FBCs.
Similar RACT standards will be set for particulate emissions from existing units located in PM-1 0 nonattainment regions. Although FFBs and ESPs are typically used, the inherently high particulate emissions from FBCs could be a concern and may demand multiple control units (especially ESPs) to achieve RACT standards.
Beginning January 1 , 2000, S02 emissions from utilities and independent power producers (IPPs) may not exceed the number of S02 emission allowances held. Annual issued allowances wil l be equivalent to a nationwide average S02 emission rate of 1 .2 lb/MMBtu based on 1 985 operating data. Thus, although, compliance strategies will vary among power producers, and individual units may exceed the 1 .2 lb/MMBtu limit while other units .. over-comply, .. the 1 .2 lb/MMBtu figure is a common benchmark for characterizing facilities' ability to comply. Because of low sulfur content, S02 emissions_ from existing biomass-fueled power systems are not a concern. In fact, cofiring biomass and coal could potential ly play a role in utilities' compliance strategies.
Exhibit 3-1 3 displays stack emissions for biomass-fired FBCs with Federal regulatory limits and trends for new facilities. (See Appendix E for emission unit conversions.) Title I of the CAAA establishes emission standards for prevention of significant deterioration for new installations in attainment areas. If such a unit exceeds the established 250 ton/year threshold for any criteria pollutant (i .e, CO, HCs, NOx, S02, and particulates) , the unit is subject to a PSD review and BACT. Of all the PSD criteria pollutants, HCs are expected to have the least impact for biomass-fired FBCs. Although CO emissions could exceed PSD criteria, proper combustion practices should enable faci lity owners to avoid a PSD review.
In addition to PSD requirements, new facil ities must meet NSPS limits. For S02, the NSPS limit is 1 .2 lb/MMBtu (the same figure of merit used in Title IV of the CAAA). Although the NSPS limit wi ll not pose a concern, PSD requirements may. Despite the low sulfur content of the fuel, larger (e.g., 50 MW) units may exceed the 250 ton/year threshold. However, emissions can be easily controlled with conventional limestone or dolomite injection techniques. Such procedures will reduce emissions by up to 90% of uncontrolled discharges.
For NOx emissions, the NSPS limit is 0.6 1b/MMBtu. For biomass fuels with relatively high nitrogen content (e.g., agricultural wastes), the NSPS and PSD ceil ings will present an environmental obstacle. For systems operating on higher nitrogen fuels, SNCR techniques will be required. Typical woody fuels should not present a problem.
3-22

CN "' CN
(a) (b) (c) (d) (e) (Q (g) (h) (Q (j) (k)
(0 (m) (n)
--� �� ·-,'
EXHIBIT 3·12 FBC Stack Emissions Versus Regulatory Limits for Existing Facilities (Nominal 30 MW)
Uncontrolled Federal Limits/ Emission Controlled Criteria
Pollutant Rate Emission Rate (Regulation)
co 14-250 ppmv (a) 0.01-0.12 lb/MMBtu
HC <1 ppmv''1 (a) <0.0003 lb/MMBtu
NO. 0.08-0.1 0 lb/MMBtu 0.01 lb/MMBtu<dl 0.7 1b/MMBtu (CAM, Title 11•1; NSPS 1 971(1)) 0.6 1b/MMBtu (NSPS 1 978(g�
S0/1 0.1 -0.5 lb/MMBtu 0.01 -0.05 lbiMMBtuOl 2.5 lb/MMBtu (CAM, THie IV, Phase II�; NSPS 1 971 (I); NSPS 1 978(g�
Particulates 2 1b/MMBtu 0.02 lb/MMBtu<ml 0.1 lb!MMBtu (NSPS 1 971 � 0.03 1b/MMBtu (NSPS 1 978(g�
Metals1"1 As: 1 1 .4 fl/dscf Cr: 1 9.3 fl/dscf 1 0 ton/year any HAP, 25 TPY total HAPs Hg: 0.3 fl/dscf (CAM, Trtle II) Pb: 98.5 fl/dscf
Emission control equipment not required; emissions Inherently controlled with good combustion practices. Perm it emission standard Issued for biomass-fired FBC (Donovan 1 992). Lindner 1 990 8CR with 90% removal efficiency EPA's RACT guidelines for existing coal·flred stokers In nonattainment or ozone transport areas. Applies to coal and biomass coflred units constructed between 8/17/91 and 9/1 8/78. Applies to biomass units constructed after 9/18/78. NE8CAUM's proposed RACT for existing coal-fired stokers In nonattalnment or ozone transport areas.
Comments
Sample State Limits (Regulation/State)
0.1 4 lb/MMBtu (CA)()l
0.024 1b/MMBtu (CA)()l
0.30 lb/MMBtu (NESCAUM)(hl 0.080 lb/MMBtu (CA)()l
0.033 lb/MMBtu (CA)(bl
0.045 lb/MMBtu (CA)(bl
Assumes all sulfur In the fuel is converted to 802• Experience dictates approximately 90% of sulfur Is retained In the ash. Limestone Injection with 90% removal efficiency
Regulatory Trends
RACT IImits to be set
RACT IImits to be set
1 .2 lb/MMBtu (CAM, THie IV) (I)
RACT IImits to be set
802 emissions (ton/year) may not exceed the number of allowances held by the owner. Beginning 1/1/1995, utilities annually receive allowances based on a 2.5 lb/MMBtu emission rate using 1 985 fuel consumption quantities. 802 emissions (ton/year) may not exceed the number of allowances held by the owner. Beginning 1/1/2000, utilities annually receive allowances based on a 1 .2 lb/MMBtu emission rate using 1 985 fuel consumption quantities. Fabric fliter baghouse (FFB) with 99% removal efficiency. Ambient air metal emissions are controlled with particulate removal equipment (E8Ps, FFBs). Uncontrolled emissions data unavailable.
�� �

CN
�
Uncontrolled Emission
Pollutant Rate
co 1 4·250 ppmv 27·475 ton/year!dl
HC <1 ppmv!•l
' NOX 0.08·0.1 0 lb/MMBtu i 1 7 4·225 ton/year!dl
S0219> 0. 1 ·0.5 lb/MMBtu 21 5·1 075 ton/year!dl
Particulates 2.0 lb/MMBtu 4300 ton/year!dl
Metals(!<>
EXHIBIT 3·1 3 FBC Stack Emissions Versus Regulatory Limits for New Facilities (Nominal 50 MW)
Comments
Federal Umits and Corresponding Sample State Umits, Controlled Regulation/ Corresponding
Emission Rate Criteria Regulation/State
(a) 250 ton/year(CAAA, Title J)(bl 0.14 lb/MMBtu (CA)(l)
(a) 250 ton/year(CAAA, Title J)(bl 0.024 lb/MMBtu (CA)(l)
0.01 lb/MMBtul•l 0.6 lb/MMBtu (NSPS 1 978)(1); 0.080 lb/MMBtu (CA)(I) 1 1-23 ton/yr•l. (d) 250 ton/year(CAAA, Title l)(bl
0.01 ·0.05 lb/MMBtu(hl 1 .2 Jb/MMBtu (NSPS 1 978(1); CAAA Title IV�; 0.033 lb/MMBtu (CA)(I) 22·1 08 ton/year!dl. !hl 250 ton/year(CAAA, Title J)(bl
0.02 lb/MMBtuOl 0.03 lb/MMBtu (NSPS 1 978)(1); 0.045 lb/MMBtu (CA)(I) 43 ton/year!dJ, 10 250 ton/year (CAM, Title l)(bl
As: 1 1 .4 fl/dscf Cr: 1 9.3 fl/dscf 1 o ton/year any HAP, 25 TPY total HAPs Hg: 0.3 fl/dscf (CAM, Title II) Pb: 98.5 fl/dscf
(a) Emission control equipment not required; emissions Inherently controlled with good combustion practices.
Regulatory Trends
EPA study underway
(b) 250 ton/year is a threshold limit above which a new or modHied unit in an attainment or non-classified area is considered a major source, and therefore subject to a PSD review and BACT.
(c) Lindner 1 990 (d) Annual emissions for 50 MW FBC operating at 70% capacity factor and 14000 Btu/kWh (24% efficiency). (e) SCR with 90% removal efficiency (Q Applies to biomass units constructed after 9/1 8/78. (g) Assumes all sulfur in the fuel Is converted to S02• Experience dictates approximately 90% of sulfur is retained In the ash. (h) Limestone injection with 90% removal efficiency (0 S02 em issions (ton/year) may not exceed the number of allowances held by the owner. Beginning 1/1/2000, utilities annually receive allowances based on a
1 .2 lb/MMBtu emission rate using 1 985 fuel consumption quantities. (j) Fabric filter baghouse (FFB) control with 99% removal efficiency. (k) Ambient air metal emissions are controlled with particulate removal equipment (ESPs, FFBs). Uncontrolled emissions data unavailable. (0 Permit emission standard issued for biomass-fired FBC (Donovan 1992).
I

r I
- I I I
. .. 1
J
l j
l - '
Controlled particulate emissions will meet PSD requirements, but will approach the limits of NSPS standards. As with existing units in PM-1 0 nonattainment areas, new units may require more than one particulate control unit to satisfy NSPS l imits.
Ash and Other Solid Waste Streams
In addition to volatile and fixed organic material , solid fuels also contain inorganic mineral matter O .e., ash). This matter remains in its solid form during combustion, is collected as fly ash O .e., particulate catch) or bottom ash, and is appropriately disposed of. Because the ash is a solid waste from the power generation process, it poses an environmental concern regarding both the concentrations of regulated constituents and the sheer volume generated by the facility.
Transportation costs of the fuel l imit the size of biomass power facilities. Generally, they are not as large as coal-fired plants; the larger biomass facilities are in the 50 MW size range, while coal plants may have capacities approaching 1 000 MW. · Thus, more ash is produced from coal-fired facilities relative to biomass systems. Exhibit 3-1 4 provides estimates for ash quantities from typical baseload biomass- and coal-fired facilities.
To reduce ash disposal costs, coal and wood ash are often utilized in low-cost, environmentally acceptable applications. Uses for coal ash focus on areas where the ash can be substituted for sand and gravel : structural fills, road bed stabilizing material, a cement additive, etc. Wood ash is generally not applicable to these uses because of its high potassium , sodium, and carbon contents. Instead, applications harness the high alkaline content of the wood ash and often substitute for l iming to adjust pH levels of agricultural lands. In general , crops will grow better on neutral soils and the wood ash can be used to reduce the soils' acidity. One concern is that the pH of the wood ash wil l be higher than upper safety limits. Washington State, for example, classifies wood ash as a dangerous waste when its pH exceeds 1 2.5 (Campbell 1 990). This classification has produced difficulties for several ash generating facilities (including wood products industry faci lities).
The makeup of the ash is an environmental consideration even though components of ash resulting from combustion for power generation are currently not a Federal regulatory concern. Attention generally focuses on heavy metal , VOC, and PAH concentrations, and on the pH of the ash leachate. If leached from the ash (whether it is landfilled or applied to land) into surface water or groundwater, these components could have damaging health impacts. In landfills (dry disposal) and reservoirs (wet disposal), contamination is controlled with lining materials, and leachate and pile runoff collection/management systems. Concerns are therefore frequently amplified in land applications. These concerns involve heavy metal concentrations in the ash and solubility of these constituents. Exhibit 3-1 5 below presents wood ash heavy metal concentrations for untreated biomass, and concentration limits for land use applications in New Hampshire and Maine. Metal concentrations will be higher for treated residues, but in general ash from treated and untreated biofuels does not exceed toxicity or corrosivity standards. Also listed are soluble metal concentrations of wood ash, and extractable metal l imits of
3-25

EXHIBIT 3-1 4 Annual Ash Quantities
ANNUAL ASH QUANTITIES FROM TYPICAL BIOMASS- AND COAL-FIRED POWER PLANTS
Ash content Plant size Annual ash Tons/MW-yr Fuel (% wt. dry) in MW quantity
Type (tons/yr)
Hogged fuel- 0.8 80 IGCC 2230 28 Douglas Fir
Hogged fuel - 0.81 50 FBC 1 950(a) ' 39 Douglas fir
West Virginia 1 2.32
600 PC 191 ,75Q(b) 31 9 Bituminous Coal
(a) Assumes 70% capacity factor, 1 4000 Btu/kWh heat rate, 8800 Btu/lb dry biomass. (b) Assumes 70% capacity factor, 1 0000 Btu/kWh heat rate, 11 800 Btu/lb dry coal.
1 de Lorenzi, 1953
2EIIiott, 1 989
the EP Toxicity Test (now the TCLP) used to categorize hazardous waste. Although wood ash is not subject to the toxicity test, this information provides a measure of the environmental impact relative to the hazardous waste classification criteria. As the exhibit shows, the soluble metal concentrations are well within the limits.
Water Waste Streams
Contaminants in the steam cycle working fluid form deposits on the inside of boiler tubes and may impede the heat transfer from combustion. As a result, efficiency will decrease and tubes may overheat and subsequently rupture. Scale-forming compounds include silica, magnesium, sodium, and insoluble (i .e., suspended) solids. While safeguarding against deposits, it is also necessary to remove corrosive agents from the working fluid. These compounds include dissolved oxygen (DO}, C02, S02, and hydrogen sulfide (H2S) , and tend to accumulate in the steam drum/boiler tube water loop. Because the water is heated, chemical treatment is not practical for the fluid. Contaminant levels are therefore kept at acceptable levels by simply discharging a portion of water from the loop and replacing it with 11Ciean .. water. This practice is referred to as 11boiler blowdown... The removed water is termed 11blowdownn and may contain small amounts of metal oxides and phosphates at low concentrations (1 -2 mg/L) .
3-26
'f.:.
s :)
:i' l
.' ) d "-

]: I
l r ! ,
Canponents
Aluminum
Antimooy
Arsenic
Beryllium
Barium
Boroo
Cadmium
Chromium
Cobalt
Copper Iron
Lead
Magnesium
Manganese
Mercury
Molybdenum
Nickel
Selenium
Silver
Strontium
Thallium
lin
litanium
Zinc
Source: Canpbell, 1990
EXHIBIT 3-1 5 Ash Metal Concentrations
CONCENTRATION OF TOTAL AND EXTRACTABLE METALS OF A NORTHEAST WOOD ASH
Measured New Hampshire & Soluble EP Toxicity Test Total Metal Maine metal cone. Metal Cone. Maximum Metal
Cone. limits fa wood ash (mg/1..) Cone. (mg/1..) (ppm) (ppm)
1 1 000 <2
<300 <3
<20 <0.2 5.0
0.3 <0.01
1 1 00 0.7 100
1 1 0 2. 0 !.,-';•
7 1 0 0.04 1.0
14 1000 <0.1 5.0
5 <0.1
54 1000 <0.1
8500 3
28 700 <0.1 5.0
14000 1 1 0
3300 13
<0.2 10 <0.005 0.2
4 <0.1
14 200 <0.1
<50 <0.3 1 .0
<2 <0.1 5.0
470 <0.2
<200 <2
<10 <0.2
450 <0.2
570 2000 0.7
3-27

To maintain a constant water level within the steam drum, blowd0wn is replaced with 11make-up11 water. The source of make-up water is untreated or raw water which contains several contaminants. These impurities must be removed to prevent deposition and corrosion. Contaminants may also be found in the liquid leaving the condenser Q.e., condensate) , although they are present in smaller amounts. Primary sources of condensate impurities include corrosion products (metal oxides), condenser leakage, and air leakage from other equipment operating under a vacuum. Treatment of dissolved solids in both make-up and condensate can be accomplished through demineralization in which ion-exchange resins exchange hydrogen ions (H+) for undesirable cations (Ca+, Na+, or other m etallic cations) and hydroxyl ions (OH-) for chloride (Cr), sulfate (S), or other anions. The hydrogen and hydroxyl ions released to the fluid combine to form pure water. Through use, however, ion-resins will lose their exchange capacity and will therefore require periodic regeneration. Cation resins are usually regenerated with sulfuric acid; anion resins with caustic soda. Regeneration of demineralizers is thus a source of pollutants. Regeneration effluents for make-up demineralization and condensate demineralization Q .e., condensate polishing) are shown in the Exhibit 3-1 6 below.
Although the goals of cooling-water treatment are the same as boiler treatment (to l imit contaminants which cause corrosion of and scale formation on heat transfer elements), operating conditions (temperature and pressure) of the condenser/cooling tower loop are such that expensive demineralization is not justified. Instead, cooling water is treated with chemical additives. Chemicals Qike chlorine) are also used to control biological organisms which enter the cooling water from the atmosphere. Airborne particulates may be transferred to the water via the same mechanism and consequently settle with other suspended matter in the basin at the bottom of the cooling tower. This material , l ike the accumulated contaminants in the steam drum/boiler tube loop, is discharged as blowdown. Therefore, chemical additives used to control biofouling, corrosion, and deposition may themselves be water discharge pollutants.
Although chlorine and phosphates are common additives, the complete list of chemical additives is extensive and beyond the scope of this work. Beyond chemical additives, materials of cooling tower construction may be treated with preservatives which can leach into the cooling water and be discharged with blowdown. Exhibit 3-1 7 lists various chemicals associated with cooling tower blowdown and, where possible, probable discharge rates.
Several power plant designs and operating practices are available for reducing the volume of wastewater from blowdown and other plant procedures. Sidestream softening systems treat a portion of the circulating cooling water to remove corrosive agents and reduce blowdown volumes. Wastewater streams may also be directed to settling (or evaporation) ponds, where pure water is evaporated while suspended and dissolved solids accumulate at the bottom of the reservoir. Several power facilities combine these and other water quality and conservation measures to form zero-discharge water systems. This is especially true in the Southwest where salinity control regulations have all but mandated zero-discharge systems. Zero-discharge water systems have been
3-28

l J
EXHIBIT 3-1 6 Regeneration Effluents·
Demineralization Regeneration Effluents'
Make-up demineralization Condensate polishing Effluent mg/L
Iron (Fe) ,f 1 0-1 00 Aluminum (AI) ,f neg.
Copper (Cu) 5-50 Zinc (Zn) 2-10 Manganese (Mn) ,f neg.
Sodium (Na) ,f 2000-5000 Potassium (K) .; neg •
Calcium (Ca) .; 1 0-1 00 Magnesium (Mg) .; Sulfates ,f 5000-10000 Chlorides .; neg •
Nitrates .; neg.
Ammonia (NHJ 500-5000 NaOH .; neg.
H.so4 ,f neg.
v - Present In make-up demineralization regeneration effluent neg. - Negligible 1 - 81iott, 1 989
Comments
condensate pofishlng levels represent Ca & Mg together
"·
utilized at natural gas combined-cycle, nuclear, and coal- and wood-fired plants and are applicable to all power facilities. Conservation and continuous water (e.g., sidestream treatment) treatment is essential for successful operation of such systems. Once waste streams are minimized, reuse should be maximized, either by cascading reuse (e.g., boiler blowdown used as cooling tower make-up) or treatment and reapplication (e.g. , desalting cooling tower blowdown to upgrade water to a higher use). Water which no longer meets any process requirements can be discharged to isolated evaporation ponds instead of surface waters.
·
Water Supply Issues
While it has traditionally played a large role in the arid regions of the West and Southwest, water conservation is an issue receiving increased attention in the East as a result of environmental concerns, siting limitations, and the need to reserve quality water for a growing population. As the industry which withdraws the second largest quantity of water, power generation is commonly a sector where conservation measures are stressed. A typical steam cycle facil ity with cooling towers (and operating on any fuel : biomass, coal , natural gas, etc.) wil l consume approximately 1 0 gallons of raw water per minute for every MW of capacity (1 0 gal/min/MW or gpm/MW). Approximately 90% of this is cooling tower make-up: water which replaces cooling tower blowdown and drift
3-29

EXHIBIT 3-1 7 Cooling Tower Effluents
Discharges from Cooling Tower Slowdown
Material Comments
Chlorine Biofouling inhibitor.
Phosphates A common corrosion inhibitor.
Chromate Corrosion inhibitor. Umited use because it's a heavy metal.
Zinc Corrosion inhibitor. Limited use because it's a heavy metal.
Acid Copper Chromate Preservative found in cooling tower wood material.
Chromated copper arsenate Preservative found in cooling tower wood material.
Creosote Preservative found in cooling tower wood material.
Pentachlorophenol Preservative found in cooling tower wood material.
losses. Plants using once-through cooling water (instead of a cooling tower) will use larger volumes of water. Due to fully developed water sites and increasingly stringent regulations, this option is generally not acceptable. The remainder of plant water consumption is accounted for by boiler make-up water, demineralizer regeneration water, fire system water, and other miscellaneous plant uses.
Although there are no Federal standards l imiting water consumption, state and regional regulations may create an obstacle for construction of new power facilities and necessitate water conservation designs, equipment, and operating practices (especially west of the Mississippi River). Because cooling towers demand more water than any other system component, they are the focus for water conservation. Dry cooling offers a way to eliminate evaporation, drift, and blowdown losses at the cooling towers, and takes two forms: air-cooled steam condensers and dry cooling towers. In an air-cooled steam condenser, fans force ambient air over finned tubes containing steam from the steam turbine's low pressure exhaust. In a dry cooling tower, steam from the turbine's exhaust is cooled in a conventional surface condenser. The cooling water from the condenser is then cooled by heat exchangers similar to those used in the air-cooled steam condenser described above. Thus, both designs el iminate drift and evaporation
3-30

I r I
, , I I I '
losses while significantly reducing blowdown. Although these systems offer reduced water requirements, warm air temperatures during summer months can raise the turbine exhaust pressure (i .e., back-pressure) and may therefore reduce plant output and efficiency.
Other water conservation measures call for unique site conditions or require careful analysis of plant water streams and their chemical components. Treated wastewater from municipal treatment facilities, for example, has found acceptance for power plant cooling, although its application as boiler water make-up is l imited due to additional treatment demands. Recycling of plant wastewater streams, including cooling tower blowdown, offers reductions in both raw water consumption and plant wastewater. However, recycling nearly always requires chemical treatment, and calls for a detailed examination of wastewater streams and system water requirements.
3-31

3.4 GASIFICATION GAS TURBINE TECHNOLOGY
3.4.1 Technology Overview
The biomass gasification process produces a low- to medium-Btu fuel gas which can be used to fire boilers or combustion turbines for power generation. The gasification combined cycle (including variants such as the steam-injected gas turbine) is evaluated in this section as the basic configuration for an advanced, high-efficiency biomass conversion power station in the 80 to 1 50 MWe range. The data available characterizing environmental impacts of this conversion technology is very limited and the results presented in this chapter are used to suggest trends and possible concerns.
Process Description
Gasification combined cycles increase the efficiency of power generation by firing gas turbines at temperatures up to 2300 °F (1 260 °C) and capturing the gas turbine exhaust heat in a steam Rankine cycle for overall power cycle efficiencies near 50%. Combined cycles are now widely used in natural gas-fired stations for intermediate or base loads. The additional subsystem of the biomass power station is the gasification step for converting sol id biomass fuels to combustion turbine-quality fuel gases. By close coupling of the gasification and power cycle equipment, thermal energy of the hot fuel gas is put to work in the power cycle. The primary unit processes include:
gasification including fuel feed, metering and flow control , the gasifier reactor, booster air compressors and piping, blast steam piping and controls;
fuel gas cleaning including hot gas clean-up systems and .. quench and scrub .. designs;
gas turbine including combustors, power turbines and compressors, exhaust ducting, and power generator;
heat recovery steam generator (HRSG) ;
steam turbine including power turbines, generator;
cooling tower; and
exhaust stack.
Gasification is a two-step, endothermic process where a solid fuel (biomass or coal) is thermochemically converted into a low- or medium-Btu gas. In the first reaction, pyrolysis, the volatile components of the fuel are vaporized at temperatures below 1 1 00°F (600°C) by a set of complex reactions. Included in the volatile vapors are hydrocarbon gases, hydrogen, carbon monoxide, carbon dioxide, tar, and water vapor. Because biomass fuels tend to have more volatile components (70 percent to 86 percent on a dry
3-32

basis) than coal (30%), pyrolysis plays a larger role in biomass gasification than in coal gasification. Char (fixed carbon) and ash are the by-products of pyrolysis which are not vaporized. The second process, char conversion, involves the gasification and/or combustion of the carbon that remains after pyrolysis. In this reaction, a portion of the char is burned to provide the heat required for pyrolysis and for gasification of any remaining char.
Converting solid biomass into a gas suitable for gas turbine operation creates the potential to integrate biomass gasifiers with the simple cycle gas turbine and its variations (combined cycle, steam-injected gas turbine (STIG), etc.). Close coupling of gasification and the power system increases overall conversion efficiency by utilizing both the thermal and chemical energy of hot product gases to fuel the power cycle. Combined cycles with their high efficiency and low emissions characteristics are a prime choice for biomass gasification systems. Exhibit 3-1 8 shows the biomass gasification combined cycle. An alternative to hot gas clean-up that has been demonstrated is a quench and scrub process that removes particulates and metals prior to combustion. This approach results in an efficiency penalty caused by cooling the hot fuel gas. It also increases wastewater flows from the system. The impacts of scrubber wastewater on plant wastewater discharges have not been evaluated.
On a smaller scale (25 to 50 MWe), STIGs offer a variant of the combined steam and gas cycle configuration. This configuration reduces·· system complexity by using a single turbine through which both gas and steam are expanded for power. Unlike the combined cycle, steam expanded in the turbine is not captured, condensed and returned to the steam generator.
Environmental Impacts Summary
Combined gas and steam cycles, along with their variants (e.g., STIG and humid air turbine) , offer power cycle efficiencies approaching 50 percent1 (6800 Btu/kWh). The efficiency gains of the combined cycle directly reduce the levels of environmental discharges and other impacts per unit electrical output in all aspects of biomass power production, from harvesting through stack emissions.
The second environmental advantage for the IGCC configuration is also its most difficult technical development problem . To meet the fuel gas specifications of the gas turbine, the raw fuel gas must be cleaned of several contaminants. This cleaning process for the turbine coincidental ly removes many of the potential environmentally harmful emissions.
The primary environmental disadvantage of the biomass-fired IGCC is the additional NOx arising from fuel bound nitrogen in this high-temperature, efficient thermodynamic cycle. The total NOx emissions (thermal and fuel-bound) will always exceed the NOx produced
All gas turbine efficiencies in this chapter are based on operation with natural gas unless otherwise noted. This is a consistent standard of comparison for combustion turbines.
3-33

EXHIBIT 3-1 8 Integrated Gasification Combined Cycle
Stack
Prepared biomass
feedstock r·-··-t·-Fuef""! r-··l Clean · r �..J gas 0 1 fuel gas
Steam J 1 HGCU : f r-=--"'* ""'l_....._ I 1 : ...., , Gasifier ,_ ___ j__!arti�ate I : _ _ ��---=: _ - _ -6 ����-�-·-= m er
I 1 Burner ·
1 Com-l pressor
I . . . . . L . . . . . . . . . . . . . . . . . .
Steam
� - - . - ��==� I steam
; Hot exhaust ;gas
Pump
Legend - - -• Air - wm.er ·-··• Fuel · · · · · • Fiue gas - - steam -- -• Ash, PM
by natural gas firing of the same equipment at the same turbine inlet temperature and with comparable NOx controls. Current regulatory standards for combustion turbines are based on natural gas and oil firing.
A special concern for the STIG cycle is the relatively large amounts of demineralized water used in the open cycle. Water is primarily a conservation issue rather than an environmental issue, although disposal of water treatment sludges can be a concern.
3.4.2 Environmental Discharges and Controls
Exhibit 3-1 9 lists chemicals/materials generated in biomass IGCC systems which, if present in sufficient concentrations in certain waste streams, can trip regulatory limits for environmental protection. These materials either directly enter the power conversion system in the fuel and in other chemicals used in operations or are generated in the power generation process (primarily combustion) . They tend to be regulated in terms of their concentrations in the plant waste streams shown at the right of the diagram. In the paragraphs that follow, the materials of possible concern are discussed in terms of how
3-34

t t
1/ y'
they are generated, factors affecting their generation, and their relative impacts on the plant waste streams. The discussion of the waste streams follows, with an evaluation of the potential for waste stream constituents to trip restrictive regulatory limits.
Primary discharges of concern for the gasification combined cycle are air emissions (especially NOJ, and solid wastes, particularly gasifier-generated ash. For IGCC, water discharge concerns are comparable to those faced by modern coal-fired boilers including discharges from ash cooling and transport, boiler blowdown and water treatment processes. Other potential air pollutants such as particulates, alkali metals, and hazardous trace elements tend to be removed prior to the gas turbine to protect the hot sections of the turbine from erosion and corrosion. Thus, environmental controls for these pollutants serve a dual purpose. Turbine fuel specifications are generally sufficiently stringent concerning these pollutants to require controls that also meet current environmental criteria. This situation could change in the future, especially concerning air toxics.
Possible environmental control processes include the following:
cyclone or ceramic filter particulate control at the gasifier outlet;
EXHIBIT 3·1 9 Materials Evaluated for Environmental Impacts
POWER PRODUCTION Material/Chemical Agents
Generated by
Biomass Power Systems
PICs
CO, CxHx, PAHs
Particulates
Acid Gas Precursors
NOx, SOx
3-35
Environmental Media
Plant Waste Streams

gas stream cooling and removal of condensibles with particulates;
staged combustion at the combustor, or urea/ammonia injection in the exhaust stream with or without catalysts for NOx control ;
conventional ash treatment and disposal systems;
use of sorbents to remove contaminants in fluidized-bed gasifiers.
Gasification combined cycles for biomass are a developmental technology. Existing data on discharges are largely from experimental or process development equipment. In the case of recent biomass gasification tests at GE facilities, the process development unit (PDU) is one developed for coal gasification (Furman 1 992). Fuel gas was flared rather than used to fire the gas turbine simulator at the facility. Although the results of these tests provide better guidance than combustion models, they do not yet represent a data set for a full scale plant under typical operating conditions.
Nitrogen Oxides
The constituents of primary concern for the gasification combined cycle are the nitrogen oxides. Sources include both FBN, and nitrogen in the oxidant, which will be air unless oxygen-blown gasifiers are used. Based on the composition of the fuel gas produced by the GE fixed-bed gasifier, GE estimates of fuel-bound and thermal NOx generated in a conventional gas turbine combustor are shown in Exhibit 3-20.
These preliminary estimates indicate that FBN-generated NOx will be the predominant source of NOx emissions by a factor of ten or more. Compared to natural gas-fired combustion turbine emissions with no FBN sources, biomass will generate significant levels of NOx unless NOx controls are applied either pre- or post-combustion. Exhibit 3-20 also shows anticipated removal efficiencies for NOx controls in use with other combustion systems.
The higher the combustion temperature at which the fuel gas is burned, the more thermal NOx is produced. Therefore, thermal NOx production can be reduced by lowering the peak temperatures during combustion. The most common way of doing this is through steam injection (the technique also used for power augmentation in the STIG) . Steam (or water) injection is capable of reducing NOx from natural gas-fired turbines to below 25 ppmvd (parts per mil lion by volume, dry basis) computed at 1 5% exhaust gas oxygen. These 11Wef1 NOx control measures, however, impose efficiency penalties when NOx must be held below 42 ppmvd. As a result, so-called 11dry low N0x11 burner designs have emerged. These combustors and their associated controls aim to burn as much of the fuel as possible, over the load range of the turbine, in lean, premixed flames. Fuel-lean combustion lowers flame temperatures and so reduces thermal NOx. Future dry low NOx burners are expected to offer control to 1 0 ppmvd.
3-36

I I y
Unlike thermal NOx, FBNOx cannot be controlled by reducing flame temperature. Although the fuel-bound nitrogen in biomass fuels is less than in coal-derived gases, levels of FBNOx emitted from gas turbines operated with biomass gases may exceed emission regulations. One commercially available process which can help eliminate both thermal and fuel-bound NOx is selective catalytic reduction (SCR). In this process, ammonia, which is diluted with air or water, is injected into the flue gas stream as it enters the catalyst cel ls. As the combustion gas passes through the cells, the nitrogen oxides are converted into nitrogen and water vapor. This process has been proven to remove up to 90 percent of the nitrogen oxides from flue gas streams (Valenti 1 991 ) .
Particulates
Particulates in a gas turbine present erosion problems for the turbine blades. Although there are more particulates in product gases from the fluidized-bed gasifier than from the fixed-bed system, these particles tend to be larger, and therefore, easier to remove. For these larger particles, cyclones are an effective means of removal, as shown in Exhibit 3-21. . The cyclone removal process is less effective in capturing the lighter and smaller portions of the wood particulates. For these smaller particles, barrier filters offer more complete particulate removal , but have not been proven for integrated gasification
EXHIBIT 3-20 NOx Emissions for IGCC
Fuel Gas Gasified Millwaste Bagasse
Turbine 21 50 21 50 Inlet Temp. eF)
FBNOx* 200-300 ppmv 300-400 ppmv Thermal NOx* 25 ppmv 25 ppmv Total NOx* 225-325 ppmv 325-425 ppmv
Control Technology Selective Catalytic Selective Catalytic Reduction (SCR) Reduction (SCR)
Removal Efficiency 90% 90%
Exhaust Emissions 22-32 ppmv 32-42 ppmv
*Preliminary estimates based on fuel gas composition from gasifier tests.
Source: Furman, 1 992
3-37

EXHIBIT 3-21 Particulates in IGCC ·
I Fuel Gas I Gasified Bagasse Gasified Mill Waste
Raw Fuel Gas 3400 ppmw 2000 ppm� Particulate
Control Device Single Cyclone Single Cyclone
Removal Efficiency 99% 85%
Clean Fuel Gas 40 ppmw 290 ppmw
Post-Combustor Gas 7 ppmw (estimated) 50 ppmw {estimated)
Source: Furman, 1 992
gas turbine applications. Filtering systems being developed that show promise are silicon carbide candle and ceramic filters. The removal efficiency of these systems is well in excess of 99 percent; however, their success will ultimately depend on their survival in gas turbine systems.
Trace Metals
Trace metals in the fuel will be concentrated in particulates {as in the FBC) with similar concentrations for fluidized-bed gasifiers. Trace elements such as alkali metals found in the raw fuel gas pose a special problem. Potassium and sodium in the feedstock are of primary concern because they accelerate the hot corrosion and cementing of particulates on turbine blades. Preliminary calculations suggest that in the gasifier operating temperature ranges, alkali levels will be greater than is acceptable for gasifier/gas turbine systems. As shown in Exhibit 3-22, the single cyclone used in the GE gasifier tests is effective in removing the bulk of the alkalis that have condensed on the particulate by removing the particulates from the stream. At the gasifier exit temperatures maintained in the GE tests, alkali compounds tend to condense on particulates. The resultant levels that leave the combustor are still higher than the 20 parts per billion weight (ppbw) requirements of most gas turbines. The options are to supplement particulate removal by using an inorganic sorbent to col lect and remove the alkalis or to increase the effectiveness of particulate removal. Nearly all of the metals, with the exception of mercury, will be diverted to the solid waste stream.
3-38

t l i
EXHIBIT 3·22 Trace Metal Concentrations for IGCC
I Fuel Gas I Gasified Bagasse Gasified Mill Waste
Raw Fuel Gas 24 ppmw 3.4 ppmw Alkali Metals
Control Device Single Cyclone Single Cyclone
Removal Efficiency 99% 85%
Clean Fuel Gas 285 ppbw 51 6 ppbw
Post-Combustor Gas 50 ppbw (estimated) 90 ppbw (estimated)
Source: Furman, 1 992
Stack Emissions
The rules governing air emissions specifically for the biomass IGCC have yet to be written. Thus, the regulatory limits discussed in this section are those developed for conventional util ity plants and, with some exceptions, serve simply as guides to the possible requirements that will be imposed on the technology. As explained previously, there is no measured data for biomass IGCC emissions, only rough engineering estimates. This fact further complicates the process of analyzing the capability of the IGCC technology to meet regulatory requirements. The analysis presented here is intended only to indicate areas of possible concern for regulatory compliance.
As would be expected, the more stringent requirements are for new facilities. Exhibit 3-23 lists key components of the stack exhaust gases along with Federal and selected state requirements affecting each component. New Source Performance Standards as well as possible PSD reviews apply on the Federal level . Based on the preliminary data available and the interpretation of current regulations, the emission levels for uncontrolled NOx could exceed the NSPS, requiring the use of SCR or other NOx suppression controls. With SCR the estimated emissions are well within the NSPS limit. Use of SCR technology would be expected to limit NOx emissions for a nominal 80 MWe power station to well within the 250 tons per year Federal criterion that would trigger a PSD review.
As expected, S02 will be well within the CAAA benchmark criteria for emissions both now and in the year 2000. However, the estimated levels of S02 emissions are still above the PSD review trigger criterion. Thus, the PSD review might be required.
3-39

EXHIBIT 3·23 IGCC Stack Emissions for New Facilities
Pollutant Uncontrolled Controlled Federal Umits and Comments Emission Emission Corresponding
Rate Rate Regulation
co<d) <20 ppmv ···(e) RACT limits to be set 250 TPY fur PSD r�ew
Hc<c> 1 ·7 ppmv ···(e) RACT limits to be set 250 TPY for PSD review
No <a> 225-325 ppmv 22·32 ppmv NSPS limit for CTs 75 ppmv, NESCAUM • LAER controls X 730·1 000 TPY 72·1 05 TPY 250 TPY for PSD review m ay be required New Jersey
25 ppmv, California 9 ppmv
S 02 44 ppmv NSPS limit for CT 1 50 ppmv CAM criteria in year 2000 0. 1 1 lb/MMBtu -··(f) CAM limit 2.5 lb!MMBtu, 31 0 TPY 250 TPY for PSD review
Particulates(b> 3.2 lb/MMBtu 0.008 lb/MMBtu 250 TPY for PSD review 1 0,525 TPY 22 TPY
Metals Mn 22 TPY Total < 1 TPY Major source listing: 1 0 TPY Total 1 32 TPY any 1 metal or 25 TPY total
m etals
(a) Preliminary estimates for NOx emissions from GE gasifier tests with and without SCR controls. (b) Preliminary estimates for particulate emissions from GE gasifier tests with and without cyclone controls. (c) EPA, 1 991 (d) GTW, 1 992 (e) Controls other than maintaining good combustion conditions are not in use in utility combustion turbines.
(f) Stack scrubbers can be used if state regulations require lower limits. Removal efficiencies up to 90%.
As discussed previously, particulate controls are required to protect the gas turbine regardless of regulatory limits. For the single cyclone case, particulate emissions are expected to be well within the PSD review criterion. Coincidentally, the metals of concern are removed from the air stream with the particulate. The metals that do escape with small amounts of particulate are at very low levels, well under the criteria used for identifying major sources in the CAAA. Other criteria pollutants such as CO and unburned hydrocarbons are in such small quantities that they are not expected to present permitting problems.
Exhibit 3-24 compares the estimated IGCC emissions to regulatory requirements for existing facilities. Rules for existing facilities may possibly apply in the case of repowering an existing steam turbine power station by conversion to IGCC. In this case the uncontrolled emission rates for NOx are marginally within the current or proposed limits for NOx for boilers in nonattainment or ozone transport regions. It is conceivable that an IGCC conversion fueled by biomass would not require advanced NOx controls. In the repowering case, the other key components of the stack exhaust are all expected to be well within current regulatory requirements for existing facilities.
3-40

. '
' i! (
J
. -� (
EXHIBIT 3-24 IGCC Stack Emissions Versus Regulations for Existing Facilities
Pollutant Uncontrolled Controlled Federal Umits and Comments Emission Emission Corresponding
Rate Rate Regulation
co<eJ <20 ppmv ---(f) RACT limits to be set
HC<dJ 1 -7 ppmv ---(f) RACT limits to be set
NQ (a) 0.26-0.38 0.026-0.038 RACT limit for Coal NESCAUM limit for Coal Boilers X lb!MMBtu lb!MMBtu Boilers 0.45-0.70 0.32-1 .00 lb/MMBtu limits
lb!MMBtu (c) Headed toward 0.21 lb!MMBtu for Phase II NESCAUM
S02 0.1 1 lb/MMBtu ---(g) CAAA Phase I criteria 2.5 By 2000 CAAA Phase II criteria lb/MMBtu 1 .2 lb/MMBtu
Particulates(b> 3.2 lb/MMBtu 0.008 no limit set Not regulated for CTs because lb/MMBtu NG and oil-fired particulate
emissions are very low
Metals Mn 22 TPY Total < 1 TPY Major source listing: 1 0 Total 1 32 TPY TPY any one metal or 25
TPY total metals
{a) Preliminary estimates for NOx em issions from GE gasifier tests with and without SCR controls. {b) Preliminary estimates for particulate emissions from GE gasifier tests with and without cyclone controls. {c) For nonattainment or ozone transport regions. {d) EPA, 1 991 (e) GTW, 1 99 1
(� Controls other than maintaining good com bustion conditions are not in use in utility combustion turbines. {g) Stack scrubbers can be used if state regulations require lower limits. Removal efficiencies up to 90%.
Solid Waste Stream
Ash discharges and other solid wastes (tramp materials in the fuels and sludges from makeup water treatment and cooling towers) are expected to be about the same as the FBC boiler on a basis of volume of discharge per Btu of fuel input. However, on a unit output basis, the higher efficiency of the IGCC results in lower discharges per kWh
· produced. Combined with the very low ash levels present in woody biomass compared to coal , the quantities of ash produced will be about 2230 tons/yr (2025 tonne/yr) for an 80 MWe plant. Exhibit 3-25 compares IGCC ash production levels to FBC and pulverized coal. As in the FBC case, the primary concerns are for trace metal contaminants in the ash and ash pH. By capturing trace metals through particulate removal, the problem of trace metals is transferred to the solid discharges of the plant. As long as the concentrations of these metals in the combined bottom and fly ash discharges do not exceed regulatory limits for solid waste disposal, including proposed beneficial uses, plants will be able to safely dispose of these contaminants as either wastes or recyclable materials.
3-41
. , . . , .

EXHIBIT 3-25 Ash Production Levels
ANNUAL ASH QUANTITIES FROM TYPICAL BIOMASS- AND COAL-FIRED POWER PLANTS
Ash content Plant size Annual ash Tons/MW-yr Fuel (% wt. dry) in MW quantity
Type (tons/yr)
Hogged fuel- 0.8 80 IGCC 2230 28 Douglas Fir
Hogged fuel - 0.81 50 FBC 1 ,950(a) 39 Douglas fir
West Virginia 1 2.32
600 PC 1 91 ,750(b) 31 9 Bituminous Coal , _
(a) Assumes 70% capacity factor, 14000 Btu/kWh heat rate, 8800 Btu/lb dry biomass. (b) Assumes 70% capacity factor, 1 oooo Btu/kWh heat rate, 11800 Btu/lb dry coal.
1 de Lorenzi, 1953
2EIIiott, 1 989
Water Discharges
The levels of contaminants in water discharges for the IGCC plant are expected to be comparable to those of conventional boilers. The discussion presented in the previous section on FBC boilers is applicable to the IGCC where the major source of water discharges is the heat recovery steam generator and steam turbine loop.
Additional blast steam, which is consumed in the gasification process, ends up in the product fuel gas and is emitted with other exhaust gases from the stack. For the Institute of Gas Technology (IGT) gasifier, typical mass ratios of steam to dry biomass fuel are on the order of 0.7.
As is the case of FBC, the primary source of water discharge is cooling tower blowdown which includes concentrations of chlorine, phosphates, chromates, and zinc. For example, the expected maximum discharge rate for chlorine is in the range of 0.3 -o.s mg/L during the one hour per day treatment period. This is within the BAT limit for
·., /
i e •
l, ..
. ,
maximum discharges presented in Chapter 2. As long as other BAT guidelines are u followed, the discharges of other blowdown chemicals can be expected to be within current l imits.
3-42

' \.
J .. 1 l
. ' t ·· r (
I . . l
I t (
Water Supply Issues
Raw water requirements for a combined cycle unit are approximately 3-4 gpm/MW (1 1 .4-1 5.1 1/min/MW) (including steam injection for NOx control} , significantly less than the approximately 1 0 gpm/MW (37.9 1/min/MW) required for a traditional Rankine steam cycle . The difference is attributed to the power produced by the gas turbine; except for steam injection for NOx control (1 4-1 8 % of a combined cycle's requirement}, the gas turbine requires no significant water supply. Nearly all of the required supply is make-up water for the conventional cooling tower associated with the steam turbine bottoming cycle. For the combined cycle, remaining water requirements (fire system, demineralization regeneration water, etc.) and conservation methods (dry cooling, etc.) are identical to those for the steam cycle.
In addition to the 3-4 gpm/MW (1 1 .4-1 5. 1 1/min/MW) required to operate a combined cycle faci lity, a biomass gasifier consumes approximately 0.5-0.7 gpm/MW (1 .9-2.6 1/min/MW}. Steam at high pressure and temperature is injected into the gasifier to aid in the pyrolysis and char conversion reactions, and to maintain gasifier temperatures below ash deformation limits. However, because of the inherently higher moisture content and reactivity of biomass feedstocks_ compared to coal , external steam requirements are relatively low for biomass gasification. ·
The IGCC system is in an early developmental stage for biomass. There is no existing experimental system as there is for coal at Coolwater, California, from which early environmental monitoring results are available. Thus nearly all of the preliminary findings presented above for air emissions will need to be verified and NOx should receive priority. In the interim, laboratory simulations of gasifier operations feeding a typical combustion turbine (CT) combustor would provide important indicators of the potential problems and indicate the need for research on emissions controls.
3-43

3.5 BIOCRUDE GAS TURBINE TECHNOLOGY
3.5.1 Technology Overview
As discussed above, gasification of biomass involves a pyrolysis step where heat is added to the feedstock (in the absence of an oxidant) and the feedstock's volatile components are liberated from the solid. The primary vapors are converted to noncondensible gases which can be utilized in combustion turbine power systems. An adaptation of this process involves rapid quenching of the primary vapors prior to conversion to permanent, non-condensible gases. When quenched, the primary vapors condense to form biocrude oils similar in consistency, but not composition to number 6 oil . Biocrude oils also possess high energy densities relative to other forms of biomassderived fuel , and can be readily transported. Thus, biocrudes can fuel power generation systems outside the feedstock-producing region.
In addition to biocrude, biomass pyrolysis processes can produce many other valuable fuels and chemicals. Biocrudes can be upgraded to produce fuels applicable to diesel engines and by more severe processing, can yield gasoline-range liquids. Through an extraction process, lignin products can be separated from the biocrude and used for manufacturing adhesives. Other specific products of commercial interest include specialty and commodity chemicals, petrochemicals, and polymers.
There are several process and technology options for producing biocrudes from pyrolysis. Some technologies are on the verge of commercialization while other technologies have developed at a slower pace. Each design employs different parameters such as particle and vapor residence time, temperature, pressure, and carrier gas. Despite the differences in design conditions and various stages of development, the principles of production for each system are the same: pyrolysis of solid biomass in the absence of oxygen, followed by quenching of vapors to form biocrudes. Processes nearing commercialization include lnterchem's vortex reactor ablative process, Ensyn Engineering's Rapid Thermal Processing, and Scottech Ltd's Waterloo Pyrolysis Process. For simplicity, the vortex reactor system is discussed below, although the environmental impacts of all systems will be similar.
Process Descriptions
A schematic of the biocrude production process, coupled to a steam-injected gas turbine (STIG) , is shown in Exhibit 3-26. For convenience, the process is shown as directly coupled, but oil production can be split from power production. Properly sized feedstock is dried to a moisture content of 2-8% wet basis (% MCW), and injected into the pyrolysis reactor by a carrier gas (nitrogen, steam, or non-condensible process gases) . Upon entry, heat is transferred to the solid feedstock and primary vapors are released. As the reactor continues to receive heat, a portion of the primary vapors will be converted to permanent, non-condensible gases. At the outlet of the reactor, partially pyrolyzed feed particles (> 50 microns) are removed from the vapors and gases, and recirculated to the reactor's inlet. Vapors, gases, and fine char particles (< 50 microns) are also removed
3-44
,..--ii ' , \
i 6 "
., .. �

I 1
r ( r
l 1 ) y
J ( (
EXHIBIT 3-26' Biocrude-Fired Steam Injected Combustion Turbine
2 · 8% MCW I < 0.5" : I ..
Recirculated cbar
. Ambient air I
I
� - - -• PJr • · · · · • Rue gas - Wa1er - - Slaam ·-··• Fuel ---• Ash
.___-:-· _...f-j·O_(.:) ...... -. : Bloc:rucle Stcrage '-'1
'
! NoD"COadenSible jfuel-sas I
' .
• Hot I :Exhaust Gas : Steam to _..). _ ..!.:� . . . . . . : pro= HRSG . · ,
and the particles are subsequently separated from the stream with a cyclone. The removed char can either be sold as a fuel and/or adsorption material, or directed to the combustor which provides heat to the reactor (i .e., the reactor combustor) . The vapor/gas stream leaving the cyclone proceeds through a condenser and heat is transferred from the vapor/gas stream to air which can subsequently be used to dry the feedstock and/or to support combustion. At the outlet of the condenser, the primary vapors are condensed to biocrude oils and directed to storage. Non-condensible gases are separated and directed to the reactor combustor where, in combination with a supplementary fuel and (often) char, the fuels are burned to provide heat to the pyrolysis reactor. If the carrier gas {the medium used to transport the feedstock into the reactor) is steam, the flue gases resulting from combustion can be util ized in a heat recovery steam generator (HRSG).
Biocrudes from storage can be utilized in Rankine cycle boilers and in many combustion turbine-based power cycles (simple cycle, STIG, intercooled STIG, combined cycle, etc.) . Exhibit 3-26 shows the oils being used in a STIG cycle. Hot flue gases are used to drive a combustion turbine and provide heat to a HRSG. The resulting steam can be directed to the combustor of the combustion turbine to provide additional electrical output (and NOx suppression) or be used for other purposes (process heat, space heating, etc.). (In practice, one HRSG may be capable of providing steam for combustion turbine injection,
3-45

process heat, and a carrier gas) . The STIG cycle will be used as the basic power configuration for evaluation in this report. One unique and advantageous characteristic of the STIG cycle is that it can continuously produce steam in the HRSG, which can provide process heat when required (e.g., one or two eight-hour operation shifts per day), and otherwise produce additional power which is consumed on-site or can be sold to the I ocal utility.
3.5.2 Environmental Discharges and Controls
Exhibit 3-27 lists chemicals/materials generated in biomass integrated STIG systems which, if present in sufficient concentrations in certain waste streams, can trip regulatory limits for environmental protection. These materials either directly enter the power conversion system in the fuel and in other chemicals used in operations or are generated in the power generation process (primarily combustion) . They tend to be regulated in terms of their concentrations in the plant waste streams shown at the right of the diagram. In the paragraphs that follow, the materials of possible concern are discussed in terms of how they are generated, factors affecting their generation, and their relative impacts on the plant waste streams. The discussion of the waste streams follows with an evaluation of the potential for waste stream constituents to trip regulatory limits.
EXHIBIT 3-27 Materials Evaluated for Environmental Impacts POWER PRODUCTION
Material/Chemical Agents
Generated by Blocrude S11G Systems
PICs
CO, CxHx, PAHs
. NOx
VOCs From combustor, dry
feedstocks, & biocrude
Fugitive Dust & Particulates
From combustor & fuel processing
Steam Plume
3-46
Environmental Media
Plant Waste Streams
LAND Ash and other solid wastes

1 \ j 1
\ J
: r I )
\ r J \
_ _ J
-� ----�
Production and utilization of biocrudes involve two combustion processes: combustion to provide heat to the pyrolysis reactor, and combustion necessary for power generation. Although these processes have the potential , like all combustion systems, to emit NOx, particulates, and PICs, the production systems and the biocrude itself have inherent attributes which mitigate these discharges. However, biomass pyrolysis systems have unique conditions which may create other concerns. Due to the fine dimensions (largest dimension < 0.5 inch or 'half-inch minus') and low moisture content of the required feedstock, fugitive dust emissions are a concern. The feedstock characteristics may also cause VOCs to be driven from the feedstock and subsequently released to the atmosphere, prior to the feedstock entering the reactor. If oil production process and storage temperatures are sufficiently high, the oil itself may be a source of fugitive VOC emissions. The acidic nature of the biocrude may necessitate special handling and storage considerations. If the STIG is the chosen power conversion cycle, consideration should be given to the highly visible steam plumes from the turbine exhaust.
Steam Plume
In the STIG cycle, steam is injected into the combustor of the unit and, with the flue gases from biocrude combustion, passes through the power turbine and HRSG and is released to the atmosphere. Thus, the injected steam could be released as a condensed water plume and have visual and aesthetic impacts on the surrounding areas. In addition, the plumes could interfere with transportation by limiting visibility and creating ice-buildup on roads and other structures. Actual impact of the plume will be site-specific and a function of plant design parameters, siting geometry, and meteorological conditions (EPRI 1 989).
Fugitive Dust Emissions
To achieve maximum heat transfer to volatilize the solid, the feedstock entering the reactor should have a low moisture content and a high specific surface area (i .e., relatively fine particles are required) . Processing as-received feedstocks to these specifications requires extensive hardware including conveyors, hammer mills, and screens. Conveying and processing such material can lead to unintentional dispersion of the fines. Despite the health concerns which fugitive dust emissions generate, dispersion of the fines can be controlled with covered .or enclosed processing equipment and proper housekeeping practices. Thus, the fugitive dust issue is one that is not necessarily difficult to solve, but one that may be costly and require persistence.
Volatile Organic Compounds
There are three sources of VOC emissions for the feedstock-to-biocrude-to-power process: dry feedstocks, biocrude, and incomplete combustion in the combustion turbine's burner and/or the reactor combustor. VOCs from the combustion processes are addressed in the following discussion of PICs. VOC release from solid feedstock would occur if, during the drying process, nearly all the moisture was removed and there was a significant quantity of heat available to drive off the volatile organics.
3-47

By definition, the flash point of a fuel oil is the lowest temperature at which a volatile oil will give off explosive or ignitable vapors (Babcock & Wilcox 1 992). Thus, if the temperature of the biocrude exceeds its flash point, VOCs will be released in amounts sufficient to create a fire or explosion hazard. Biocrudes typically have flash points of 225°F (1 1 0 °C) (Kasper 1 992), well above room temperatures. However, the biocrudes will exit the condenser well above the ambient temperatures used to cool the primary vapors, and thus, some VOCs will be liberated. If not properly captured and directed, these compounds could be emitted to the atmosphere. Although well understood from experience with petroleum-derived fuels, the proper control and handling of the volatiles could prove to be a significant addition to the capital and operating cost of such an installation.
Additional concerns of biocrude oils are related to the fuel's acidity. Biocrude oils typically have a pH in the 2.5 - 3.5 range. At these levels, conventional metal storage tanks are unsuitable. There are therefore materials concerns for storing and transporting the biocrude.
Like all discharges resulting from combustion, there will be two sources of NOx emissions in a biocrude production/power generation system : the combustor supplying heat to the pyrolysis reactor (i .e., the reactor combustor), and the burner of the combustion turbine. An upper l imit of pyrolysis reactor temperature is set by the residence time of the primary vapors in the reactor; at relatively long residence times, primary vapors wil l be converted, or 11Cracked11, to undesirable permanent gases at lower temperatures (i .e., at longer residence times, lower temperatures are desirable). lnterchem's ablative pyrolysis process, for example, requires an optimum reactor temperature of approximately 1 1 50°F (620 °C) . In producing reactor combustor temperatures at this level, thermal NOX formation is insignificant, and NOx formation is limited to FBNOx. FBNOx, in turn, will be a function of the fuel's nitrogen content. Nitrogen in the solid feedstock appears to be transferred to the biocrude in its entirety. If this trend holds, FBNOx from the process' permanent gases and char should not be a concern. However, supplementary fuels with higher nitrogen contents could be used and subsequently contribute to FBNOx emissions.
As stated above, it appears from the available, although limited, data that the nitrogen in the solid feedstock is converted to biocrude oil . Thus FBNOx emissions from a biocrudefired combustion turbine can be expected to be on the same level as a (solid) biomassfired boiler (85-1 1 0 ppmv, see FBC discussion) . One of the inherent and most practical benefits of the STIG cycle is the relatively low levels of thermal NOx emissions, which result from suppression of high flame temperatures in the combustor by injected steam. As a result of steam injection, STIGs operating on natural gas appear to meet NOx emission regulations without other NOx stack treatment (Larson 1 987). The relatively low
3-48
• ,j

( l I I
l )
heating value of the biocrude (9000 Btu/lb (20,935 kJ/kg) versus- 1 8,400 Btu/lb (42,800 kJ/kg) for JP-4; 1 9,600 Btu/lb (45,590 kJ/kg) for No. 2 distillate) particularly as it may be partly the result of bound moisture, also suggests low thermal NOx formation.
Although not currently characterized, PIGs (CO, HCs including VOCs, etc.) from the combustor reactor will be a function of combustion techniques and practices, and are therefore difficult to predict. Char from the process, however, will be very fine as a result of feedstock processing and char particle recirculation in the reactor, and should therefore burn more efficiently than typical solid biomass feedstocks.
Combustion turbines, due to their continuous combustion with large quantities of excess air, do not typically emit significant quantities of CO and VOCs. Therefore, PIGs from the biocrude-fired STIG should not be a concern.
Particulates
Uncontrolled particulates from the combustor reactor will be a function ofthe fuels utilized. Particulate emissions will not be an issue for gaseous fuels, while some control will be required for reactor combustors operating with char. Therefore, to minimize environmental control expenditures, reactor combustors for market entry· biocrude production facilities may use reasonably priced natural gas and complementary process gases, while the char will most likely be sold as a fuel or chemical adsorbent.
.. . .
Quantity and inorganic make-up of the ash from the feedstock-to-biocrude-to-electricity cycle will be equivalent to that of the other biomass-based power cycles: 0.1 - 2.0 lb/MMBtu1eed (MMBtu from feedstock - not biocrude) (0.04-0.86 kg/kJ). However, due to the volatile organic release and recirculation of large (> 50 microns) char particles in the reactor, succeeded by char combustion, organic content may be lower than that of the direct combustion and gasification/gas turbine counterparts.
3.5.3 Regulated Waste Streams
Air emissions
Combustion emissions from a biomass pyrolysis/STIG cycle will include discharges from two combustion zones: the reactor combustor and the combustion turbine's burner. Emissions from the reactor combustor are not easily predicted as they will heavily depend on the fuels utilized and the combustion techniques. In general , however, NOx should not be a concern and, if only gaseous fuels are used, particulates should not be an issue. The turbine combustor will have reduced thermal NOx emissions due to steam injection and particulate emissions will again be minimal.
3-49

The pyrolysis conversion process will have additional air emiSSions despite the accompanying power system (or other process) . Fugitive dust emissions and VOC release from dry feedstocks and the biocrude itself will not necessarily be difficult to control but will require careful attention and additional capital equipment.
There is also an air discharge which is unique to the STIG cycle. Steam plumes, like those from cooling towers, may restrict siting the STIG but should not present a commercialization barrier.
Solid Wastes
As stated above, ash quantities from a biocrude production/power generation facility will be identical to those of a direct combustion or gasification/power cycle system on a heat input basis. Organic components in the ash will be minimized by char combustion in the combustor reactor.
Water Supply Issues
A steam-injected gas turbine (STIG) consumes approximately the same amount of water as a combined cycle unit: 3-4 gpm/MW (1 1 .4-1 5. 1 1/min/MW). However, a combined cycle consumes mostly raw, or untreated water for cooling tower make-up, while nearly all the water required for a STIG is demineralized water used for gas turbine injection. In an EPRI study, demineralized water was estimated to account for less than 20% of the water requirements for a 55 MW natural gas-fired combined cycle, and over 75% of the requirements for a 49 MW natural gas-fired STIG (EPRI 1 989) . Although the increased demand for demineralized water will add to the cost of a STIG facility, the difficulty of obtaining adequate water supplies should be similar to that for a combined cycle plant (with cooling towers) and less than for a steam facility. However, while there are alternatives to wet cooling towers for steam facilities and combined cycle plants, conservation measures are not as available for a STIG.
Although NREL has tested the ablative process with steam, it is an unlikely carrier gas for lnterchem 's commercial installations; nitrogen and non-condensible vapor are the likely transport media. All other processes (e.g., Ensyn Engineering's URF reactor) use either nitrogen, process product gas, or an inert solid as the carrier medium. Thus the thermochemical conversion process should not have water supply concerns. If steam was used, it is unclear at this time what water consumption rates would be encountered. Furthermore, with steam as the carrier gas, an aqueous phase would separate from the biocrude, resulting in a wastewater stream which would have to be characterized and accordingly managed.
3-50

4.0 THE BIOMASS POWER ENVIRONMENTAL PROGRAM
4.1 INTRODUCTION
The preceding chapters have described the regulatory context and the environmental impacts of biomass power combustion and conversion as they are known today. Given that understanding, this concluding chapter develops an environmental plan for the Biomass Power program. The program will , if implemented, help the biomass industry and DOE meet the goal for Biomass Power development to the year 2000 and beyond. To appreciate the context of these programs, Exhibit 4-1 presents the Solar 2000 Milestones for Biomass Power. The environmental program is a continuing and coincident activity. The program, written assuming that DOE will be the principal administrator, is composed of six major elements: 1 ) Program Integration and Outreach; 2) Rural Development and the Environment; 3) Clean Air Research; 4) Clean Wmer and Water Availability Research; 5) Residue and Byproduct Technical and Market Research; and 6) International Environmental Opportunities. These elements and their sub-elements support the Biomass Power Strategy and Solar 2000 as shown in Exhibit 4-2. These major program elements and their sub-elements are discussed next, but major issues are ··
summarized below:
Coordination among EPA and DOE environmental programs.
Full fuel cycle analysis and environmental baseline studies.
Joint EPNDOE verification and promulgation of the .. no net C0211 hypothesis.
Evaluation of biopower-produced HAPs - monitoring, development of reduction technology, technical guidance on controls.
Resolution of crop production issues - toxic uptake and relationship to HAPs, water use, production chemicals, habitat issues, soil losses.
Resolution of recycling and incineration issues - distinguishing productive use of wastes as fuel/feedstock.
4-1

ACTIVITY 1991 1992 1993 1994 1995 1996 ' 1997 1998 1999 2000
Research & Development
Technical suitability of biomass Combustion rests Turbine 01 I Optimization pyrolysis liquids as turbine fuels.
Techniques to prevent ash Gasifier Stre � Test I lltration Sys l:ms Characterize m
deposition and particulate removal. � Research Qaboratory scale) on
Fixed Bed 1m! Evaluaticf! ii
gasifiers and turbine rigs to obtain Indirect Sys =i key performance and gas quality (VermonQ data. ! Construction and checkout of 1 00 en ton/day gasifier and procurement 2. of long-lead items for 3 MW gas (Hawaii) D) turbine.
... 1\)
Systems Development 8 0
it Commercial feasibility analysis of 1 00 MWe gasifier technology. �
CD Complete biomass resource
irted-Dedcat jKI Energy PI (I)
assessments and prepare reports lntegr �tatlon and Conversion lant Evalua on S' on environmental assessments.
:::s Identify research needs. m Operate integrated gasifier/3 Construct Start-up Operation a' ... MWe turbine system. m Test and evaluate integrated 30
Test Operation o lntermedlat -Load Turbl e -·
0 ton/day pyrolysis or combustion 3 system.
D) (I) (I)
Cost and equipment tradeoffs between feedstock handling and
"'tt
storage in gasifier systems. � CD Joint Ventures
...
Biomass PGI Project Demonstr te Concept
240 MW Biomass Repowering Project
Biomass Power Plantation Plan Projec Implement )peratlon/Ag c. Residues Operat101 /Biomass PI �tatlon
'

EXHIBIT 4-2 Environmental Building Blocks for Biomass Power
PROGRAM RURAL CLEAN AIR INTEGRATION DEVELOPMENT RESEARCH
4-3
CLEAN WATER RESIDUES AND INTERNATIONAL RESEARCH BYPRODUCT$ PROGRAM

4.2 PROGRAM INTEGRATION AND OUTREACH ELEMENT
This effort will integrate other environmental sub-elements and activities, and coordinate requirements for further research, information dissemination and budgeting. It will oversee research studies which have the potential to develop cross-cutting benefits for an environmental R&D program. The program is composed of four sub-elements: 1 ) environmental assessment and full fuel cycle impacts evaluation; 2) regulatory and legislative monitoring; 3) technology transfer, communication and education; and 4) budgeting and oversight.
. 4.2. 1 Environmental Assessment Baseline and Full Fuel Cycle Program Sub-. Element
This effort will establish ranges of potential environmental impacts, costs and benefits associated with the biomass power and conversion option. Comparisons to other energy supply technologies must be made to assess relative advantages or disadvantages.
All new technology suffers from lack of definitive cost, engineering and environmental information. As discussed in the technical sections of this report, there are many technical research and information needs for the biomass program. Also, realizing that the environmental impacts of supplying energy extend beyond the power plant to the full fuel cycle, both established and emerging energy supply technology researchers are seeking information on issues not yet well characterized, such as developing damage functions, assigning cost and benefit values, and then designing optimal emission standards. Work is now underway by DOE to establish full fuel cycle impacts for eight fuel cycles Oncluding biomass) and four conservation option technologies.
Completion of the existing work is scheduled for the end of 1 993. But due both to changing technology and regulatory priorities which reflect changing social values, full fuel cycle analysis will be a continuing activity for the biomass program. It will serve as a framework for establishing 1 ) pollutant emission characteristics of new and existing systems and 2) integrating a conceptual design for quantifying costs and benefits based on a damage function approach.
Full fuel cycle analysis is a major undertaking which must be efficiently conducted to provide useful and timely information. Priorities will have to be set within budget constraints. Investing in a standardized approach utilizing known, ongoing full fuel cycle
· work and assembling and organizing previous biomass research would minimize the potential for wasted effort.
A successful fuel cycle modelling effort will require a demonstrated accounting method to estimate environmental emissions and effects. Impact pathways or the path from the originating activity (combustion) through intermediate stages (emissions) and ultimately to physical impacts (damage or improvement to habitat) must be characterized. Finally, economic values of damage or benefits must be assigned to physical impacts. The effort should establish a detailed set of tasks which can be sequenced depending on budget
4-4

J and researcher time constraints. Strong coordination is required to maintain a sense of consistency and direction to achieve the desired result. Coordination with the technical demonstration programs is needed to ensure that the right information is gathered and coordination with the regulatory monitoring activity is needed to monitor the achievement of research results versus environmental standards.
4.2.2 Regulatory and Legislative Monitoring Activity Sub-Element
This activity will keep the biomass power program updated on current regulatory or legislative developments which may impact the program and will suggest potential implications and responses. Results of this activity will provide key inputs into future R&D decisions, while results from the full fuel cycle activity described previously will assist in the proper setting of regulatory standards. The effort must focus on both Federal and state proceedings.
The biomass power program at DOE is in its infancy, yet it has the potential to provide significant capacity additions through the next decade. To ensure that small niche markets grow to become larger mainstream markets, existing regulatory barriers must be identified and removed. New barriers must be avoided, opportunities must be identified and exploited. Because the technology encompasses both feedstock issues and combustion and conversion issues, the task is significant and requires monitoring of Federal EPA, OSHA, DOl and USDA activity and state initiatives.
The 1 03rd Congress is ready to review RCRA, CWA and Endangered Species legislation . The Farm Bill is also up for reauthorization. The EPA has a full agenda promulgating CAAA regulations. Events are quickly overtaking the ability of the biomass program to influence them and thus this program element requires immediate attention. The program needs to establish links with other DOE regulatory monitoring activities to minimize cost and duplication.
As social values change and priorities for environmental regulations shift, DOE must be prepared to perform appropriate analyses of biomass energy technologies. The biomass power program will use its full fuel cycle analytical capabil ity in conjunction with the regulatory and legislative monitoring activity to detect these changes in social values and environmental priorities. This wil l ensure that the costs of pollution are properly valued and will avoid the double counting problem associated with, for example, S02 adders piggy-backed atop regulatory actions (Title IV allowance trades), which partially internalize the acid rain externality.
The regulatory monitoring effort would also establish routine communications to interested parties through, for example, monthly-mail message updates. Special bulletins would be generated as appropriate. This is an important area of interaction between the program and its industrial constituents. A regulatory and legal library would be maintained to monitor both administrative decisions and significant court decisions. Participation of industry and environmental groups in round-table discussions of key upcoming regulatory
4-5

rule-makings could be coordinated by this program. Because this sub-element would have an overview responsibility for all environmentally related issues, it is an ideal center for NEPA-related activities and coordination.
4.2.3 Technology Transfer, Communications, Education Sub-Element
This activity would accumulate and transfer environmental information and R&D progress from non-DOE sources to DOE and from DOE to non-DOE recipients. Lack of effective knowledge exchange is a typical institutional barrier faced by new technologies; this barrier must be overcome.
The effort would act as a monitor of industry, trade group, and non-DOE research activity in the biomass power and conversion area. It would also ensure that DOE-sponsored research in the biomass field was available and distributed to interested parties. The activity would not replace the legislated technology transfer function of the DOE national labs but would enhance it, especially with non-technical users such as publ ic service commissions, trade groups, legislative staff, insurance and banking professionals and non-DOE government agencies.
This activity would develop fact sheets, on-line databases, video tapes, briefing packages, etc., to assist in reporting DOE-sponsored research. It would be a focus for developing annual and five-year research plans. It would also stay apprised of progress outside the department which could bear on DOE R&D decision making.
USDA also has responsibilities in this area that could be used in the rural community. For example, in the 1 990 Farm Bill, under Title XII - State and Private Forestry, the Rural Forestry Assistance Section explicitly states that the Secretary of Agriculture may assist state foresters, officials, and extension directors to in turn assist forest landowners, managers, resource professionals and operators, public agencies and vendors in carrying out, •The management of resources of forest lands, including the conversion of wood to energy for domestic, industrial , municipal , and other uses . . . ..
While centralized within DOE, this activity must use national lab and contractor resources to reach out to the many individuals and groups conducting biomass research or involved with initial commercialization. These groups include, for example, the Forest Service and Agricultural Extension Service at USDA, the Park Service, the Fish and Wildlife Service, DOl, and college and university participants. The activity spans the full fuel cycle so that work conducted on improved biomass farming and harvesting methods also would be included.
4.2.4 Budgeting and Oversight Sub-Element
This sub-element will integrate the resource needs of the environmental program with the needs of the remainder of the Biomass Power Program. DOE headquarters will have the responsibility to call for budget estimates for annual and five-year program needs in environmental research activities, internally and at its national laboratories. This sub-
4-6

element responsibil ity will be to coordinate budget requests and ·eventual authority with the DOE Biomass Program Director and national laboratory points of contact. The Budget sub-element will also be responsible for monitoring expenditures versus budgets and will report to the Biomass Headquarters Program Director.
4-7

4.3 RURAL DEVELOPMENT AND THE ENVIRONMENT ELEMENT
There are many biomass power environmental concerns which are unique to or at least more concentrated in the rural setting. This occurs because biomass power facilities will locate near feedstock sources and in areas where relative economics, such as in those where competing fuels lack existing infrastructures, favor biomass power. Typically, these are rural areas. Often, the pristine nature of these less populated settings presents special considerations because of special habitat preservation or wilderness conservation programs. This environmental program element is thus composed of sub-elements focused on rural concerns. The sub-elements include the following: 1 ) rural areas assessment; 2) habitat assessment; and 3) DFSS environmental issues.
4.3.1 Rural Areas Assessment Sub-Element
This sub-element will ensure that rural areas, which could significantly benefit from a successful biomass program, are not harmed in the process of biomass power deveropment. This program will identify special concerns associated with locating biomass power in the rural community.
Concern is growing about the loss of economic activity and population in rural America as economic growth slows, and economic activity shifts to a service orientation. Revitalizing rural America with DFSSs and biomass power systems brings the appeal of more farm jobs, increased equipment sales, power plant employment and other indirect employment and income benefits. Many rural residents would welcome these positive economic developments. Even in predominantly rural , coal producing areas, the increased hiring demand to fill jobs generated from biomass feedstock development could bolster the wage base. But realizing that no energy producing technology is without environmental impact, the biomass program will seek to manage any adverse environmental impact and to preserve the positive economic impact. Also, to better identify where the biomass power option may be successful, the program will identify unique characteristics of rural areas which could inhibit or support biomass power development. These unique characteristics impact full fuel cycle analysis activities of the program because economic damages and benefits depend on local impacts and valuations of those impacts. Emissions discharges and valuation of damages vary from state to state. These rural/urban site selection criteria would be included in any full fuel cycle analysis.
To accomplish this mission, the effort will need to identify the restrictions of biomass power development in the rural setting. These include lack of available road carrying capacity, safety concerns associated with those roads, proximity to Class 1 park and recreational areas, visibil ity impacts and so-called amenity value impacts. Transmission line location and right of way issues will be examined. Special concerns also surround locations in coastal areas where environmental regulation is often very restrictive. Unique analytical tools such as Geographic Information Systems (GIS) may be used to organize data and facilitate analysis.
4-8

The DOE program would work with USDA extension units and the Forest Service, National Rural Electric Co-op Association representatives and other groups which represent rural development interests to ensure that biomass power and feedstock supply systems promote rural development with minimal adverse impacts.
4.3.2 Habitat Assessment Element
This activity will study the impacts of biomass production and removal on the loss or addition of wildlife habitat. Driving this program is the increased awareness regarding endangered species preservation and management of biological diversity both domestically and internationally.
Recovery of biomass residue or harvesting of feedstock from a DFSS will disturb indigenous wildlife. Biomass DFSS operations, while creating habitats for some species, may also remove it for others. The habitat assessment and management program will determine the extent of these impacts and develop optimal management plans suitable to multiple uses of the biomass resource, those multiple uses being feedstock for fuel , habitat for wildlife, and potentially creating enhanced recreational values for humans. This program could also provide important inputs to developing harvesting methods and equipment which would minimize adverse habitat impacts.
Building on a dialogue already occurring with the Audubon Society, the DOE Biomass Program will involve the environmental community, the U.S. Fish and Wildlife Service, and other groups to develop a scheme to perform biological assessments, and establish monitoring and management plans for optimal use of a multi-use resource. The expertise to construct such a plan is available, but resides among dispersed sources. For example, the lumber industry has confronted this issue in its use of forest land, and several electric utility companies (such as Georgia Power and Pacific Gas and Electric) also administer large land tracts inhabited by wildlife. These programs would be reviewed for potential use in the DOE assessment program.
4.3.3 DFSS Environmental Issues Program Element
This activity will focus special attention on the environmental issues concerning the feedstock system - a critical element in the full fuel cycle for the Biomass Power Program. Without a reliable and low-cost feedstock system, the biomass power program will not achieve projected market share. Both the DOE biofuels and biomass programs have vested interest in these programs.
The unique nature of the feedstock system, relative to the combustion and conversion system, warrants several special investigations to assure proper stewardship of the environment. This program element would be responsible for: establishing best management practices on farm and in forest; assuring worker health and safety, especially in harvesting of the resource; analyzing the implications of using Federal lands for feedstock, considering NEPA requirements; overseeing the creation of species
4-9

variants which would reduce environmental impact by lowering water, pesticide, herbicide and fertilizer requirements; developing a combustion and conversion test program to characterize the feedstock; and reporting results of elemental and ultimate analyses.
The biomass program can now begin to formulate an agenda to prepare for anticipated expansion of DFSS activity post-2000. Also, combustion and conversion analysis using varied species from different regions of the country can commence. The species available today are expected to be improved via genetic research, which will create new cultivars that use less water, fertilizer, pesticides, et cetera. Laboratory testing of feedstocks will help power system developers determine equipment requirements and specifications.
Many issues included in this program element will require the expertise of agriculturalists and foresters. College and university participation would be high, especially that of the land grant institutions. The program may want to contact schools within proximate location of potential power plants as those schools presumably would have established expertise in local climate, geology, soils, and other relevant subject matter. DOE must decide to take an active role in this agricultural domain. Because DOE is trying to develop a biomass energy resource, much like oil , coal, gas, or uranium production, it must take an active role in feedstock research. This is occurring to some extent at the national laboratories. Traditional energy resources have enjoyed the benefits of DOE R&D funding to improve exploration and extraction; the biomass power program will require similar support.
4-1 0

).
4.4 CLEAN AIR RESEARCH ELEMENT
This program element will ensure that the adverse impacts from conventional criteria pollutants (S02, NOJ, from C02 as a potential greenhouse gas, and from potentially toxic air pollutants are minimized.
4.4.1 Air Toxics Research Program
This effort will characterize the potential toxic emissions from power plants and pyrolysis plant operations to insure that CAAA Title I l l requirements are met. The role of conventional emissions control technologies like ESPs, baghouses and fabric filters, et cetera, in collecting air taxies and transferring them to the solid waste stream must be investigated and coordinated with the solid waste program. Mercury, a highly volatile and toxic metal , will probably escape existing control devices and could require a special research agenda. Title I l l , Section 301 of the CAAA calls for two separate studies on mercury emissions from electric utilities and their impact on human health.
Currently, toxic air pollutants from power plants are not regulated, but a pending study may recommend such regulation. Pyrolysis plants which could be classified as industrial facilities would then be regulated. Because toxic pollutant control is very costly, it would be wise to study the problem soon to develop least-cost control strategies. For example, it may be possible to reduce the uptake of toxic substances from the soil into the biomass feedstock by investing now in genetic alteration of the species. This would eliminate the need for costly post-combustion or conversion control .
DOE's Office of Fossil Energy is currently investigating air taxies issues through its Pittsburgh Energy Technology Center. One study is investigating organic and inorganic toxic emissions associated with different sizes of particles emitted from stacks. Another study is developing guidance of HAP monitoring to be incorporated in an Environmental Monitoring Plan for Clean Coal Demonstration Project. A collaborative effort is being conducted between DOE, the Utility Air Regulatory Group (UARG), EPRI, and EPA to expand the study of HAPs from power plants and EPRI has initiated studies under its Power Plant Integrated Systems: Chemical Emissions Studies (PISCES) program. The Biomass Program should leverage these studies.
The effort would also be responsible for monitoring human health assessments and residual risk studies to be carried out by EPA
4.4.2 The NOx Sub-Element
The purpose of this sub-element is to develop fuel management and processing techniques, and combustion, conversion, and control techniques to reduce NOx impacts in the most cost effective manner.
4-1 1

Nitrogen is contained in the biomass feedstock and released upon combustion in combination with oxygen. As a precursor to ozone formation, it is a regulated pollutant. To be competitive with other combustion technologies, the Biomass Program will have to adopt least-cost strategies for reducing the emissions of NOx. To do this, the program will develop a systems approach to evaluate nitrogen reduction. It may be that improved handling or choice of feedstock would reduce the need for expensive add-on postcombustion pollutant control equipment.
Low NOx burner technology and 5CR or 5NCR technology developed for fossi l fuels combustion may be appropriate for a biomass feedstock. The program wil l need to assess the potential application of these technologies. Thermal NOx production can be controlled through low-cost temperature reduction measures or other means, but fuelbound NOx control may require expensive add-on equipment. The program would also address repowering with IGCC, which may meet current regulations without expensive add-on controls if N5P5 do not apply.
The program needs to perform combustion testing on a variety of feedstocks to determine if there are significant differences in feedstock nitrogen conversion rates and if NOx emissions can be predicted. A potential feedstock purchaser requires a consistent product to ensure that environmental emissions will be within permitted levels.
The combustion assessment of this program should be carried out under strict laboratory conditions at a university or a national lab. A program assessing least-cost control technologies can be performed on an ongoing basis. The potential for genetic engineering of feedstocks to reduce nitrogen in the burnable component of the biomass will be examined to determine if a research program is worthwhile.
4.4.3 502 Reduction Sub-Element
The purpose of this sub-element is to examine the advantages of biomass' low sulfur content. These benefits include biomass as a sulfur reduction strategy when cofiring with coal and avoiding the purchase of 502 allowances for new power sources.
Cofiring biomass with coal has recently received attention as a method to reduce 502 emissions and comply with CAAA emission reductions. Many coal-fired units have the potential for cofired operation. TV A and EPRI are examining potential units in the TV A system for cofiring demonstration. Cofiring may also bridge an electric utility manager's reluctance to use unusual fuels. With cofiring, a known fuel , coal , is still used and can quickly be substituted without major risk. For some CAAA phase II units and, for new units, biomass is attractive because it eliminates the need to purchase sulfur emission allowances. But before cofiring becomes an accepted alternative, further technical research must be performed.
4-1 2

This activity would promote further research on the cofiring alternative, concentrating on feedstock handling, mixing, and combustion issues. Relative benefits compared to gas co-firing would be examined. Gathering of engineering information on retrofit or repowering experience from demonstrations such as TVA's and dissemination to power company managers is an important educational element.
The cofiring initiative is already proceeding at a low level of effort. This program would expand the effort and coordinate current research so that all within the industry may become aware of research results.
4.4.4 C02 Sequestration Program
This sub-element will seek to validate claims of no net C02 increases due to use of biomass feedstock for power or fuel and recommend improvements in the fuel cycle which could improve biomass power opportunities relative to C02 concerns.
C02 is a greenhouse gas which may influence the long-term warming of the Earth's atmosphere. If so, the United States, as the leading source of anthropogenic emissions of C02, will be under increasing pressure to limit C02 emissions. Fossil-fueled power stations will be targeted for control or offset measures. The CAAA require continuous C02 emissions monitoring which will provide the data upon which future regulation may be based. Tree planting programs have been instituted by some power companies to offset carbon emissions from new capacity, and biomass power proponents frequently cite the potential for no net C02, as biofuel growth offsets C02 combustion emissions.
The Clinton administration has indicated it will adopt the Rio Climate Change Treaty to reduce greenhouse gas emissions to 1 990 levels by 2000. Biomass power systems, including the fuel growing and supply systems, can be part of a C02 reduction strategy.
Currently, however, there is no economic value to the no net C02 argument because C02 emissions are not regulated beyond an occasional environmental adder found in some state government new capacity approval procedures. The regulatory trend for conventional pollutants is clearly moving toward market incentive approaches similar to so2 allowance programs or through carbon taxes. This program element would prepare the biomass program for opportunities which may arise through C02 regulation by determining the true carbon balances in the full fuel cycle. The full fuel cycle approach must be taken to validate the no net C02 claim which is itself based on feedstock growth offsetting combustion or conversion emissions. Critics point out that harvesting and transportation equipment using fossil fuels add to carbon emissions while others argue that feedstock root systems and soil management subtract from the carbon balance. The program needs to establish a definitive analysis of the issue to establish credibility of the claim of no net or at least low net emissions of C02, and investigate C02 valuation schemes to judge the impacts of its technology's market opportunities.
4-1 3

This activity would require cooperation between DOE, EPA headquarters and the national laboratories. Coordination might be accomplished through the Intergovernmental Panel on Climate Change (IPCC). DOE, EPA and USDA laboratories and the Forest Service may have the relevant information on feedstock sequestration of carbon. Power plant emissions and transportation emissions information is well characterized, but emissions from harvesting equipment are not. This becomes more complicated as new harvesting equipment may be developed for woody species. Developing new equipment or identifying foreign sources provides an opportunity to incorporate C02 emissions as a decision variable. The level of effort for this study element should not be significant but should commence soon. The issue may soon become much more visible after release of the EPA CAAA report on C02 emissions from power plants and the FERC CAAA total fuel cycle and externality report. The working group of the DOE Climate Change Executive Committee is an established DOE organization which may be consulted on this issue.
4-1 4

} \
4.5 CLEAN WATER AND WATER AVAILABILITY RESEARCH ELEMENT
Biomass fuels handling, storage and combustion and cooling water pollution impacts at the power plant or conversion facility are not significantly different from non-biomass feedstock water impacts, but are not always equivalent either. Leachate from biomass storage piles, for example, is different from coal pile runoff. The Biomass Program will leverage research performed for conventional power and fuels production when it is cost effective. The program will monitor developments in CWA legislation affecting power site water use and discharges. Significant differences do occur in pre-combustion and conversion aspects of the biomass power system. These issues revolve around the growth of the feedstock and include non-point discharge and water availability for irrigation of DFSS crops and forest land. The clean water research element is thus composed of two sub-elements: 1 ) water quantity and availability research; and 2) water quality research emphasizing non-point pollution control.
4.5.1 Water Quantity, Availability Sub-Element
This activity will ensure that water, as a productive input into the biomass power system, is available and not a limiting factor for commercialization of the technology.
Both for feedstock growth and in cooling and process requirements, water is a necessary, yet scarce, resource. Water availability is determined by both manmade and natural factors. Institutional factors which traditionally have allocated water through non-market mechanisms will be identified and examined as part of this program. The availability of water and the competition for water resources is an environmental concern. Large withdrawals of water can affect commercial , industrial and residential users downstream, and recreational users and habitat requirements in certain streams, rivers, or lakes. Lack of natural rainfall and unexpected droughts can adversely impact biomass feedstock supply reliability.
This activity must be coordinated with other agencies responsible for water resource allocation and monitoring such as the USGS, NOAA, and state and local water authorities. Expertise on irrigation and water conservation techniques must come from USDA, the Forest Service and others. Coordination must also occur with water quality programs, as states are now increasingly bundling water-related pollution permitting with water use permitting.
4.5.2 Water Quality Program Sub-Element
This activity will determine both point and non-point water pollution strategies applicable to the biomass system including potential discharge trading strategies and least-cost discharge elimination techniques.
4-1 5

Congress will soon begin hearings on CWA reauthorization. A radical restructuring of the CWA is expected to promote market-based pollutant trading similar to Title IV S02 allowance trading in the CAAA However, for water, the trading potential will possibly extend beyond point source-to-point source trading to point source-to-non-point trades. This is an ideal opportunity to lower the costs of water pollution control within a biomass power system as trades may occur between the biomass grower and the biomass user with minimal transaction cost. The activity will investigate this opportunity.
Water pollution restrictions are tight, with the zero discharge goal from point sources stated in the CWA. Because the CWA's goal is zero discharge, the program should provide technical guidance to industry on technologies which can approach zero discharge cost effectively for both power and feedstock processes. Non-point sources are increasingly being targeted and must develop best management strategies. DOE must encourage these strategies in the context of a developing DFSS program although primary responsibility lies with the growers and with other assistance agencies. The focus of the DOE program has traditionally been on point-source discharge from the combustion and conversion program, but a new monitoring effort must be made to promote non-point control progress, to encourage reliable feedstock supplies and to take advantage of potential trades of water pollutant allowances in any new trading system.
4-1 6

4.6 RESIDUE AND BYPRODUCT TECHNICAL AND MARKET RESEARCH ELEMENT
Combustion ash from coal-fired power plants is non-hazardous according to EPA, but it is often disposed of at high cost in scarce landfill sites. Urban wood waste is often disposed of in sanitary landfills because it is considered at best a waste and at worst a hazardous waste. Yet ash, including wood ash, has many potential uses with market value. Urban wood waste is a potential feedstock to a biomass power producer. Unfortunately, many Federal and state laws do not encourage use of ash or wood residues as marketable products. The purpose of this research element is to remove the stigma surrounding ash, char, and wood residues as waste and to identify and promote market opportunities. Similarly, pyrolysis oil , a potential product of biomass conversion, will require testing and pre-manufacturing reviews to enter commerce. This program will address all requirements of feedstock supply, byproduct or product pre-manufacturing needed to promote the commercial market for biomass systems byproduct or residue materials.
4.6.1 Byproduct Markets {Ash and Char) and Characterizations Study Sub-Element
This activity will identify environmentally benign and economically reasonable uses of biomass combustion and conversion byproduct material . Other solids issues such as handling of wood fines in the pyrolysis conversion technology to avoid fugitive dust could also be addressed in this program.
With the expansion of the biomass power industry will come the expanding generation of wood ash as a byproduct of the combustion or conversion process. Uke coal ash, wood ash is not considered a hazardous material and has, instead, numerous potential market opportunities which could be exploited. The revenue through sales of ash, although small, would be a credit against the cost of the biomass system. More important, however, would be the potential for land use conservation by obviating the need to develop storage areas for the ash. There is a concern, however, that future regulation of air taxies may transfer toxic metals from the air stream to the solid waste stream, making ash unsuitable for sale.
Ash use as a soil amendment can be beneficial to alter the pH in acidic soils and thereby increase nutrient uptake in plants. However, along with beneficial nutrients is the potential for increased taxies uptake and concentration. Evaluation of ash-amended soils is difficult because of the variable composition of ash and soils and diverse edaphic requirement of many flora. The mobility of both nutrients and toxins from ash must be studied to determine concentration of trace elements in plants. These studies are priorities as stricter air taxies laws are imposed which will transfer material from the air stream to the ash stream. Care must be taken to determine appropriate use of ash on soils on a case-by-case basis. In some instances, reclamation efforts such as revegetation may be a preferable use for ash rather than for growing crops.
4-1 7

This effort would establish standards for using and testing wood ash to ensure its environmental acceptability. TCLP toxicity testing would be investigated. Standards have been set for coal ash, and industry associations exist to promote coal ash use. The program would monitor new solid and hazardous waste regulatory developments to ensure that the use of wood ash is not impeded if it is found to be environmentally benign. Significant start-up savings could accrue for the biomass program by leveraging the work already done on behalf of the coal industry.
Similarly, char is a salable material and a byproduct of pyrolysis used in the gasification process. The program should investigate char value beyond on-site use and encourage its marketability.
The activity would also work with the outreach activity program element to help educate potential users and legislators who could encourage the use of byproducts through procurement incentives.
The effort expended on this activity would be minimal if the existing coal ash effort were replicated. Characterization and testing for alternative uses would require· funding soon so that the educational program could begin disseminating results and begin educating the public.
4.6.2 Wood Residue Characterization and Assessment Sub-Element
This sub-element would ensure the availability of wood residue from both urban and forest sources. Wood residue wil l be the primary biomass supply prior to established DFSSs. It is imperative to ensure the continued availability of an environmentally acceptable supply as demand for fuel expands to keep feedstock supply prices competitive. This program will monitor potential environmental and institutional barriers and ensure that acceptable wood supplies are available.
General ly, wood residue from milling operations and recovered from forests is considered clean fuel . Some urban wood resources, although abundant, can be adulterated with creosote or paints which can volatilize upon combustion and produce air toxics. The presence of nails or metal fasteners would adversely affect fuel handl ing. Because of these potential problems, state and municipal governments have often included all wood residue material in the category of municipal waste, subject to sanitary landfill or hazardous material regulation, and developed prohibitions regarding combustion. These requirements are valid for adulterated material, but restrict the supply of environmentally acceptable material. Regulatory uncertainty often encourages the under-reporting of the potential resource.
The uncertainty and variability among states and the differing jurisdictional authority among state agencies add to the risks biomass facil ity developers face in the market. The wood residue program would determine the extent of the problem and formulate
4-1 8

potential solutions. The effort would work with potential biomass developers and state officials, especially in urban resource areas, to develop a strategy to overcome barriers and ensure that an acceptable supply is forthcoming.
4.6.3 Pyrolysis Oil Testing Sub-Element
The purpose of this activity is to ensure the marketability of pyrolysis oil from the viewpoint of toxic substance control and hazardous material transport and storage.
Unlike biomass, which is non-hazardous and non-toxic and which, when burned, results in relatively benign emissions, pyrolysis oils potentially accumulate taxies which could subject this product to regulation very different from biomass.
The pre-manufacturing testing program for pyrolysis oil has already begun. This effort will continue to acquire data necessary for manufacturing permits. Storage and transportation testing need to commence to ensure that the product can be transported by road and rail and stored safely at point-of-use and at distribution centers. The low pH (acid) of biocrude is a potential occupational health and safety concern for which standards should be investigated.
4-1 9

4. 7 INTERNATIONAL ENVIRONMENTAL OPPORTUNITIES ·ELEMENT
This effort will determine how biomass power systems can provide environmental benefits to potential overseas customers and determine how international agreements and programs impact the U.S. biomass research programs for fuel and power.
Environmental concerns are international in scope as evidenced by the recent Earth Summit in Brazil . Recently, the Clinton administration has indicated its intention to sign the biodiversity pact and the global warming treaty. To successfully market any U.S. energy technology abroad, we must understand the environmental advantages and disadvantages of that technology from the potential buyer's point of view. It will also be necessary to use that information in the context of international protocols and programs.
For example, the United Nations Framework Convention on Climate Change has been ratified by the Senate and signed by the President. Action plans for developed and developing countries to implement the goals of a treaty need to be established. There may be opportunities for the Biomass Program to help the U.S. develop its plan and contribute to others. The recent foreign operations appropriations bill passed by the House contains $30 million for the Global Environment Facility, a fund run by the World Bank to help developing countries address climate change, stratospheric ozone depletion, and conservation of forests and biodiversity. A .. debt for nature .. bil l has passed the U.S. House of Representatives allowing nine Latin American and Caribbean countries to exchange part of their foreign debt to the United States for pledges to finance domestic environmental projects. These initiatives present potential opportunities for the DOE Biomass Program if the program chooses to investigate them further by establishing its own International Environmental Opportunities Program.
Program management responsibility would be vested with the Director of the Office of Solar Thermal and Biomass Power. Coordination of information and agreements would occur within EERE and among DOE's existing international organizations including the Office of International Affairs, Office of Congressional and Intergovernmental Affairs, and Office of Policy Planning and Analysis. External coordination would be established with EPA's Office of International Activities, the United Nations, the World Bank and USAID.
Information would be collected on the status of environmental protocols and programs. Analysis would be conducted on country need for biomass technology, viewed from the desire for environmental protection and the ability of biomass power systems to meet those desires. Monitoring of protocol activity could be combined with monitoring of domestic regulatory activities.
4-20

Babcock and Wilcox, 1 992
Bushnell, 1 989
Campbell, 1 990
Canova 1 992
CEQ, 1 992
Cho, 1991
de Lorenzi, 1 953
Donovan, 1 992
PUF, 1 993
Elliott, 1 989
EPA, 1 991
EPRI, 1 989
Furman, 1 992
GTW, 1 992
Kasper, 1 983
REFERENCES
Steam/Its Generation and Use. The Babcock and Wilcox Company, Barberton, Ohio, 40th edition, 1 992.
Bushnell, Dwight J., Charles Haluzok and Abbas Dadkhah-Nikoo, Biomass Fuel Characterization: Testing and Evaluating the Combustion Characteristics of Selected Biomass Fuels, Bonneville Power Administration, DOE Report No. BP/1 363, September 1 989.
Campbell, Alton G., "Recycling and Disposing of Wood Ash,u TAPPI Journal. Vol. 73, No. 9, September 1 990, p. 1 41 .
Canova, J.H. and D.J. Bushnell, Comparison of Emissions from Waste Wood. RDF and MSW Fuels, presented at Waste Wood Processing and Combustion for Energy, Boston, Massachusetts, October 1 992.
Council on Environmental Quality, Environmental Quality 22nd Annual Report, US GPO, Washington, DC, March 1 992.
Cho, S.M., A.H. Seltzer and Z. Tsutsui, Design and Operating Experience of Selective Catalytic Reduction Systems for NOx Control in Gas Turbine Systems, ASME paper 91 -GT-26, June 1991 .
de Lorenzi, Otto, Combustion Engineering, Combustion Engineering, Inc., New York, N.Y., 1 953.
Donovan, Christine T. and Eric S. Palola, "Key Federal and State Policies and Regulations Affecting Waste Wood for Energy," the 5th Annual National Biofuels Conference and Exhibition Proceedings, Newton, Massachusetts, October 1 9-22, 1 992.
uEPA Holds Allowance Auction, Board of Trade Plans Private Sale, a Public Utilities Fortnightly, Vol. 1 31 , No. 9, May 1 993, p. 38.
Elliott, Thomas C., ed., Standard Handbook of Powerplant Engineering, McGraw Hill, New York, N.Y., 1 989.
Environmental Valuation Sourcebook for State Regulatory Commission, U.S. EPA, 1 991 .
Electric Power Research Institute, A Comparison of Steam-Injected Gas Turbine and Combined-Cycle Power Plants: Technology Assessment, Report GS-641 5, June 1 989.
Furman, A.H., S.G. Kimura, R.E. Ayala and J.F. Joyce, Biomass Gasification Pilot Plant Study, General Electric, Schenectady, New York, July 1 992.
de Piolenc, Marc, "DOE firming plans for Advanced Turbine System development program," Gas Turbine World, Vol. 22, No. 4, July-August 1 992, p. 23.
Kasper, J.M., G. B. Jasas and R. L. Trauth, Use of Pyrolysis-Derived Fuel in a Gas Turbine Engine, ASME paper 83-GT-96.

Kitani, 1 989
Larson, 1 987
Lindner, 1 990
Makansi, 1 988
Massoudi, 1 992
NY SERDA, 1 992
OMNI, 1 988
Perlack, 1 992
Piscitello, 1 992
Oswald, 1 992
Sassenrath, 1 991
Schultz, 1 992
Tewksbury, 1 986
Valenti, 1 991
WSJ, 1 993a
WSJ, 1 993b
Kitani, Osamu and Carl W. Hall, ed., Biomass Handbook,. Gordon and Breach Science Publishers, New York, N.Y., 1 989.
Larson, E.D. and R.H. Williams, usteam-lnjected Gas Turbines,u Journal of Engineering for Gas Turbines and Power, Vol. 1 09, January 1 987, p. 55.
Lindner, Gloria and Alfred Jenkins, Emissions of Criteria Pollutants and NonCriteria Pollutants from Wood-fired Incinerators, California Air Resources Board, Air Taxies Conference, Sacramento, California, October 29, 1 990.
Makansi, Jason, "Reducing NOx Emissionsu, Power, (special report), September 1 988
Massoudi, M.S. and D. Tillman, 0The Control of Particulates and Oxides of Nitrogen from Biomass Combustion Systems," presented at the Biomass Combustion Conference, Reno, Nevada, January 1 992.
New York State Energy Research and Development Authority, Wood Products in the Waste Stream : Characterization and Combustion Emissions, Report 92-1 , Vol. 1 , Albany, New York, November 1 992.
Wood Ash Disposal and Recycling Sourcebook, OMNI Environmental Services, Inc., Beaverton, Oregon, April 1 988.
Perlack, R.D., J.W. Ranney and LL Wright, Environmental Emissions and Socioeconomic Considerations in the Production, Storage, and Transportation of Biomass Energy Feedstocks, Oak Ridge National Laboratory report number ORNL/TM-1 2030, Oak Ridge, Tennessee, July 1 992.
Piscitello, E. Scott and C.P. Demeter, Biomass Cofiring Analysis Summary, unpublished draft prepared by ANTARES GROUP INC., Landover, Maryland, for the National Renewable Energy Laboratory, June 5, 1 992.
Private communication with Mike Oswald, JWP Energy Products, Inc., September 1 992.
Sassenrath, Charles, Air Toxic Emission from Wood Fired Boilers, presented at the 1 991 TAPPI Environmental Conference, San Antonio, Texas, April 7-1 0, 1 991 .
Schultz, S., Burning Wood Waste in Fluidized Bed Combustion Systems, presented at the Biomass Combustion Conference, Reno, Nevada, January 1 992.
Tewksbury, Clayton, Design and Operation of a 50-MW Wood-Fueled Power Plant, presented at Energy from Biomass and Wastes X (IGl), Washington, DC, April 7-1 0, 1 986.
Valenti, M., "Combined-Cycle Plants: Burning Cleaner and Saving Fuel,• Mechanical Engineering; Vol. 1 1 3, No. 9, September 1 991 .
"New Schemes Are Tried to Assist Woodpecker,u Wall Street Journal, April 5, 1 993.
"Georgia Pacific Agrees to Provide Woodpecker Shield, a Wall Street Journal, April 1 6, 1 993.

Appendix A
Jan-91 Title I - Nonattainment
Title VI • CFC's
Clean Air Act Implementation Plan* (revised July 1992)
Initiate process to designate additional PM-10, SO?< and lead nonattainment areas
Prepare listing of ozone depleting substances
Feb-91 Title I - Nonattainment Ad on 5 percent dassilication adjustment requests
Mar-91
Apr-91 Title I - Nonattainment
Title V - Permits
May-91 Title I - Nonattainment
Title IV • Acid Rain
Jun-91
y
y
y
y
y
Propose list of high risk pollutants, 90195 percent early reductions Y guidance
Oec-90
Jan-91
Feb-91
*These dates are subject to change based on new risk assessments, court decisions, and changes in available resources.
Source: Implementation Strategy for the Clean Air Act Amendments of 1 990 (Update. 1 992), U.S. Environmental Protection Agency, Office of Air and Radiation, Report No. 400-K-92-004, Washington, DC, July 1 992.
A-1

Iii Jul-91
Sept-91
Oct-91
Nov-91
Dec-91
Jan-92
Feb-92
Mar-92
Clean Air Act Implementation Plan (revised July 1992)
liiilii!l.:illi;i!ll':\l! : .: .\:i� . .. . ? , : · · '. ·:··· · . ... ·: .. ······ ·:·;:\ ·: · : •. •: •.-.:· · ·:: .::•: : :: .. . . . ·: ::.:: :i:.:·�]J�:.: : : . · .· ::· : ·'·. i:·.·:· .: . · .. ·.·.· . . ...••. : .• ::•i•::: : •. :. .:•·:•i· .•.•..• , •• ·:····:·.:•:.·,:•:·········:·: ·�;•:;:;·l:�:��.: : .• :· : . :·.·· .: •.... :.·,.. . k . I Title I ,_, , ........ . .. . . �, ! Finalize ozone, CO, PM-10, and lead ,_,_._,, . ,� . . . �--. . --.. --
Title II Mobile Sources Propose lead .,.,..,.,., ...... l::f....v:i;,� �,.
Trtle VII - Enforcement Propose administrative penalties rules of practice
Title VI - CFC's Propose CFC .... ... --vut "" Propose mobile air conditions recycling regulations
I Title I · . -.-. . ......... . . . . .. . . . Publish VOC and CO "'""'""'"'' ......... "'� Trtle II - Mobile Sources Publish study on non-road engines
Title I - Nonattainment Publish ,.,.,;n,n,.. ... on control cost ""·-·-
States submit PM-10 SIPs
Publish air qual� and • trends_!!I)Ort
1 ......... w .. �· Grand Canyon •• �::;i:i·.f transport __ , , ,,� ... -. . Title Ill - Air Toxics Propose MACT for dry cl�aners (per court order)
I Trtle I I'OVIICULCIIIIIII<:" I I Propose outer '""_,_J shelf rule
Title N - Acid Rain I Finalize ; for auctions and sales
Propose all ....... , '"" trading system
Propose acid rain .P!rmit 1-''"1::1' ... Propose continuous "" ' """'"'' monitor "'"'' "'"
I Propose excess .. ""'""'"'"" rules
Propose conservation and renewable incentives
Trtle V Permits Publish ,.,,,ti .. .,,.. .. on State�.' .. "'" to assist small bu-.. ·-�--
Title VI - CFC's Propose ban on nonessentials products
· Trtle II Mobile Sources Finalize urban bus .,.,..,.,,tinne (1991 and 1992)
Title VII - Enforcement Finalize administrative penalties rules of practice
I Trtle . . . .. . . . Publish Title I General • �- • •wov
Title II - Mobile Sources Finalize onboard controls regulatory decision
A-2
Completed Statutory Deadline
y Jul-91
y y
y y
y y Nov-91
y Nov-91
Partial Nov-91
y y Nov-91
y
y y Nov-91
y y y y
y y
y y
y y Nov-91
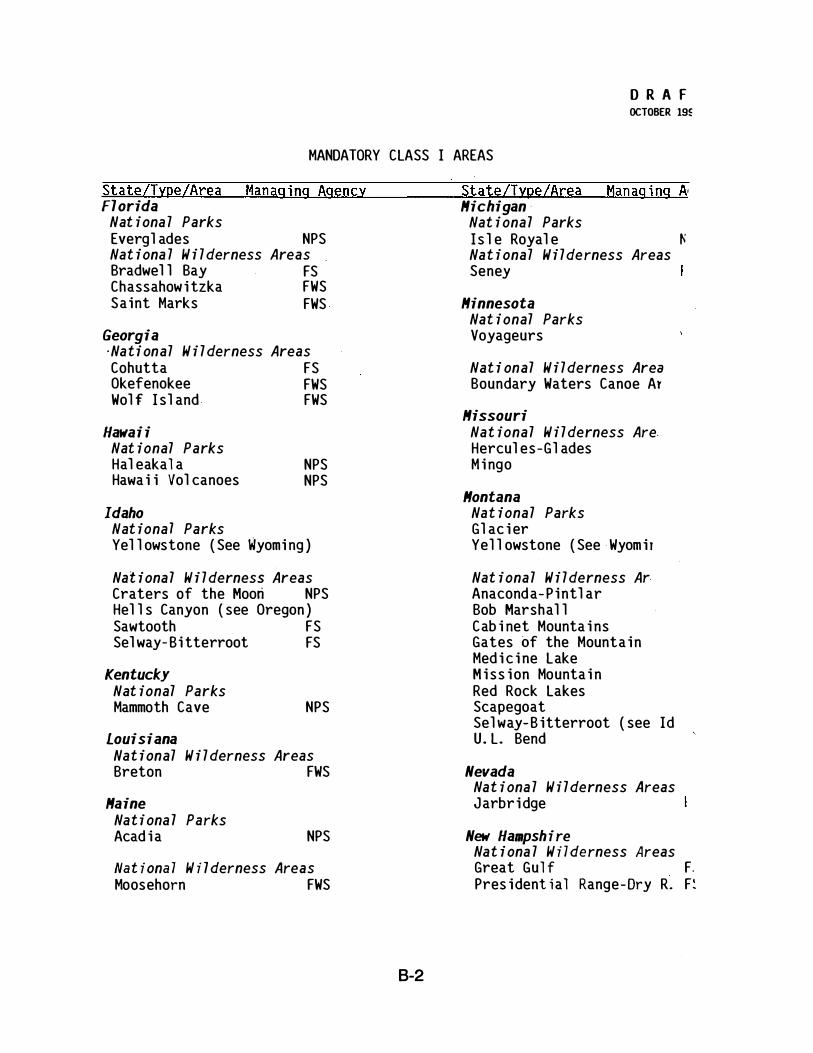
0 R A F OCTOBER 19�
MANDATORY CLASS I AREAS
State/Type/Area Man ag i ng Agency Fl orida
Nat iona l Parks Evergl ades NPS Nat iona l W i l derness Areas Bradwel l Bay FS Chassahow i tzka FWS S a i nt Marks FWS
Georgia ·Na t i onal W i l derness Areas Cohutta FS Okefenokee FWS Wol f I sl and FWS
Hawai i Nat ional Parks Hal eakal a Hawa i i Vol canoes
Idaho
NPS NPS
Nat ion a 1 Parks Yel l owstone ( See Wyomi ng )
Nat iona l W i l derness Areas Craters of the Moon NPS Hel l s Canyon ( see Oregon ) Sawtooth FS Sel way- B i tterroot FS
Kentucky Nat ional Parks Mammoth Cave
Louisiana
NPS
Na t ional W i l derness Areas Breton FWS
Maine Na t i ona l Parks Acad i a NPS
Na t i ona l W i l derness Areas Moosehorn FWS
B-2
State/Type/Area Manag i ng A' Michigan ·
Nat i ona l Parks I s l e Royal e � Na t i ona l W i l derness Areas Seney
Minnesota Nat i onal Parks Voyageurs
Nat i onal W i l derness Area Boundary Waters Canoe Ar
Missouri Na t iona l W i l derness Are. Hercul es-Gl ades M i ngo
llontana Na t iona l Parks Gl ac i er Yel l owstone ( See Wyom i r
Nat iona l W i l derness Ar Anacond a- P i ntl ar Bob Marshal l Cab i net Mounta i ns Gates of the Mounta i n Med i c i ne Lake M i s s i on Mounta i n Red Rock Lakes Scapegoat Sel way- B i tterroot ( see Id U. L. Bend
Nevada Na t i ona l W i l derness Areas J arbr i dge
New Hampsh i re Na t i ona l W i l derness Areas Great Gul f F. Pres i dent i al Range - Dry R. F�

D R A F T OCTOBER 1990
MANDATORY CLASS I AREAS
State/Type/Area Manag i ng Agency
New Jersey Na t iona l W i l derness Areas Br i g ant i ne FWS
New Mexico Na t i ona l Parks Carl sbad Caverns NPS
Nat i ona l W i l derness Areas Bandel i er NPS Bosque del Apache FWS G i l a FS Pecos FS Sal t Creek FWS San Pedro Parks FS Wheel er Peak FS Wh i te Mounta i n FS
North Carol ina Nat ional Parks Great Smoky Mounta i n s ( see Tennessee )
Na t ional W i l derness Areas Joyce K i l mer- Sl i ckrock FS L i nv i l l e Gorge FS S�i n i ng Rock FS Swanquarter FWS
North Dakot a Na t ional Parks Theodore Roosevel t NPS
Nat iona l W i l derness Areas Lostwood FWS
Okl ahotN Nat iona l W i l derness Areas W i ch i ta Mounta i ns FWS
Oregon Nat iona l Pa rks Crater L ake NPS
B-3
State/Type/Area Manag i ng Agency
Oregon - Cont inued Nat iona l W i l derness Areas D i amond Peak FS Eagl e Cap FS Gearh art Mounta i n FS Hel l s Canyon FS Kal m i ops i s FS Mount a i n Lakes FS Mount Hood FS Mount Jefferson FS Mount Wash i ngton FS Strawberry Mounta i n F S Three S i sters FS
South Carol ina Nat iona l W i l derness Areas Cape Roma i n FWS
South Dakota Na t ional Pa rks W i nd Cave
Nat ional W i l derness Area Badl ands
Tennessee Na t ional Parks Great Smoky Mounta i
Nat i onal W i l dernF Joyce K i l mer- Sl 4 _
( see North C?
Texas Na t iona l Pa r B i g Bend Guadal upe

0 R A F T OCTOBER 1990
MANDATORY CLASS I AREAS
State/Type/Area Manag i ng Agency
Utah Nat iona l Parks Arches Bryce Canyon Canyonl ands Cap i tol Reef
Vermont
NPS NPS NPS NPS
Nat ional W i l derness Areas Lye Brook FS
V i rgin Isl ands Nat ional Parks V i rg i n I s l ands
V i rginia Nat iona l Parks Shenandoah
NPS
NPS
Na t ional W i l derness Areas James R i ver Face FS
Washington Nat iona l Parks Mount Ra i n i er North Cascades Ol ypm i c
NPS NPS NPS
Na t ional W i l derness Areas Al p i ne Lakes FS Gl ac i er Peak FS Goat Rocks FS Mount Adams FS Pasayten FS
State/Type/Area Manag i ng Agency
West V irginia Nat ional W i l de rness Areas Dol l y Sods F S Otter Creek FS
Wisconsin Nat iona l Wi 7 derness Area Ra i nbow Lake FWS
Wyoming Nat iona l Pa rks Grand Teton Yel l owstone
Nat i onal W i l derness Areas
NPS N P S
Br idger F S F i tzpatr i ck F S North Ab saroka F S Teton F S Washak i e F S
Internat ional Parks Roosevel t- Campobel l o nja
* For reference , al l mandatory Federal Cl ass I areas except two { Ra i nbow Lake in W i scon s i n and Bradwel l Bay i n Fl or ida ) are l i sted at 40 CFR 81 , Subpart D -Mandatory Cl as s I Federal Areas Where V i s i b i l i ty i s an I mportant Val ue .
8-4

Appendix C
CAAA Titles & Section
TITLE Ill Section 301 Air Toxics/ Hazardous Air Pollutants
TITLE Ill Section 301 Air Toxics/ Hazardous Air Pollutants
TITLE Ill Section 301 Air Toxics/ Hazardous Air Pollutants
Subject
Residual risk matters.
Offsets
Urban strategy. Area Source program.
Relevant Mandated CAAA Studies
Performing Organization Deadlines
EPA 1 1/1 5/96
EPA 1 1/1 5/92
EPA 1 1/1 5/95
C-1
Comments/Details
The Administrator must consult with the Surgeon General and report to Congress on public health risks after application of MACT standards. Will set basis for further regulations after MACT.
Publish guidance on meeting offset requirements, including identification of the relative hazard to human health resulting from emissions of HAPs.
The Administrator must report to Congress on a strategy for dealing with HAPs emitted by sources in urban areas with populations more than 250,000. The strategy must identify at least 30 pollutants that present the greatest health threat and identify their source categories.
Potential DOE Action
Long term priority of DOE.
DOE could pursue own risk assessment study. EPA has only information now available. Monitor developments by EPA including meetings and hearings.
DOE could be involved in identifying the pollutant list and source categories. Risk assessment analysis with Office of Energy Research may be possible.

CAAA Titles & Section
nTLE III Section 301 Air Taxies/ Hazardous Air Pollutants
nTLE Ill Section 301 Air Taxies/ Hazardous Air Pollutants
nTLE Ill _ Section 301 Air Taxies/ Hazardous Air Pollutants
nTLE IV Section 41 1 Buffering and Neutralizing Agents
nTLE VI Section 61 8
Subject
Emissions of HAPs by electric utility steam generating units.
Emissions of mercury by electric steam generating units.
Carcino-genic risk associated with exposure to HAPs from source categories.
Study of Buffering and Neutral-izing Agents.
Natural Sources.
Performing Organization
EPA
EPA
NAS
Dept of Interior U.S. Fish and Wildlife Service
EPA
Deadlines
1 1/1 5/93
1 1/1 5/94
5/1 5/93
N/A
1 1/1 5/92 Report to Congress
C-2
Comments/Details
Regulation to follow study if appropriate after considering study results.
Study to consider utility power plants, municipal waste combustion units, other sources and area sources. Study to consider emission rates, health and environmental effects, control technologies, and their costs.
NAS to begin study 2/1 5/91 on HAP carcinogenic risk assessment methodologies and adverse health effects.
Study of the effectiveness of buffering and neutralizing agents used to restore lakes and streams damaged by acid deposition.
Methane emissions from biogenic sources such as tropical, temperate and subarctic forests, tundra, and freshwater and saltwater wetlands.
Potential DOE Action
DOE should be actively involved in study conduct and review.
Direct impact on R&D programs. DOE should be involved.
DOE should monitor.
DOE could monitor.
DOE should monitor.

CAAA Titles Performing Potential & Section Subject Organization Deadlines Comments/Details DOE Action
TITLE VI Methane EPA 1 1/1 5/92 Methane emissions from: Congress Section 61 8 studies - DOE Report to - Natural gas and coal charged DOE
Domestic Department Congress extraction, transportation, with Methane of distribution, storage, & use involvement. Source Agriculture - Management of solid waste Study has Inventory (USDA) storage, treatment, and global warming and disposal implications. Control, - Agricultural production Report to - Biomass burning - intentional Congress. burning of agricultural
wastes, wood, grasslands and forests
- Human activities
TITLE VIII Research Visibility 1 1/1 5/94 Establish visibility transport DOE could be Section 81 6 to identify Transport Report to regions. Assess data and represented on
and Commission EPA information pertaining to commission as evaluate established impacts on visibility. visibility issues source by 1 1/1 5/91 are becoming regions of EPA important for visibility National existing and impair- Park Service new power ment plant sites. Applies to Class I regions, such as the Grand Canyon National Park.
TITLE IX Conduct EPA 1 1/1 5/91 Conduct studies as necessary Participate via Section 901 research Secretary of Determine to identify and evaluate laboratories Clean Air program Health & priority exposure to and effects of air and task force. Research on the Human pollutants. Utilize Federal
short-term Services Annually - scientific laboratories and and long- publish no research facilities. Create an term less than Interagency Task Force to effects of 24 assess- coordinate the program. Also, air ments the National Institute of pollutants, Environmental Health Sciences including 1 1/1 5/91 (NIEHS) will perform similar wood Every 4 research coordinated with the smoke, on years program stressing human human thereafter health effects. health.
C-3

CAAA Titles Performing Potential & Section Subject Organization Deadlines Comments/Details DOE Action
TITLE IX Conduct EPA N/A Identify critical ecosystems. DOE should Section 901 research USDA Develop improved models. monitor. Clean Air to improve DOC Evaluate pollutant effects on Research under- Fish and water quality, forests, crops,
standing of Wildlife soils, and estimate economic short-term Oceans & costs of damage. and long- Atmosphere term causes, effects, and trends of eco-systems damage from air pollutants.
TITLE IX Clean EPA N/A To identify, characterize, and DOE CE Section 901 Alternative predict emissions related to biomass Clean Air Fuels production, storage, and use of electric may Research · Research. alternative fuels and determine wish to explore
risks and benefits to human joint efforts with health and environment, EPA DOE CE will consult with other agencies. biofuels
transportation systems in conjunction with DOE efforts under Alternative Motor Fuels Act.
C-4

Appendix D
Ultimate Analysis and Ash Composition Data for Sample Wood Fuels, Agricultural Wastes,
and Coals
This appendix presents ultimate analyses and ash compositions for a variety of biomass fuels. The data is presented with corresponding statistics for common coals. Coal is used to produce more electricity in the U.S. than any other fuel. Technologies for future power systems are common to both fuels, and thus, coal data is presented for comparison purposes.
Woody fuels presented in Exhibit C-1 include some of the more common biomass fuels: forest residues, forest product industry wood waste, and whole tree chips. Secondary (demolition waste) wood and cotton stalks are included in the biomass fuel mix at the Delano (California) fluidized bed unit. Rice straw is among the residues from agricultural processing facilities generating electricity. As the exhibit shows, relative to biomass, coal generally possesses higher carbon, sulfur, nitrogen, and ash contents, and less oxygen. Agricultural wastes often have higher nitrogen and ash contents than wood fuels due to intensive nutrient application.
Exhibit C-2 displays ash contents (% weight of dry fuel) and compositions (% weight of total ash) for several biomass fuels and coals. The sample feedstocks for ash composition, in some cases, differ than those presented in Exhibit C-1 because literature sources often present only data from one analysis. The ash components displayed are common major components in all types of biomass ash, and can be categorized as acids, bases, silicon dioxide (SiO�, and ferrous oxide (Fe203). Additionally, several components are present in smaller or trace concentrations. Relative to coal, biomass generally has higher alkaline ash components, especially sodium and potassium . These compounds form a eutectic with si lica, thereby lowering the ash softening point. As a result, biomassfired systems may be prone to increased slagging problems.

---- ---
EXHIBIT D-1 : ULTIMATE ANALYSIS FOR SAMPLE WOOD FUELS, AGRICULTURAL WASTES, AND COAL
Wood Fuel Agricultural Waste Coal
Forest Product Whole Tree West
Hogged Industry Chips - Secondary Cotton Virginia I llinois Wyoming Pitt.
Component Fuel1 Wood Waste2 White Fir Wood3 Rice Straw" Stalks3 Bituminous5 Bituminous5 Subbituminous5 Seam5
% C 53.9 % 54.0 % 47.8 % 49.0 % 41 .8 % 47.1 % 71 . 1 % 65.3 % 68.8 % 76.9 %
% H 5.7 % 7.0 % 5.7 % 5.8 % 4.6 % 5.4 % 4.5 % 4.2 % 4.9 % 5. 1 %
% 0 38.2 % 37.6 % 44.7 % 41 .1 % 36.6 % 37.7 % 5.0 % 6.6 % 15.6 % 6.9 %
% N 0.2 % 0.5 % 1 .3 % 0.8 % 0.7 % 1 .4 % 1 .3 % 1 .0 % 0.9 % 1 .5 %
% S 0.0 % 0.0 % 0. 1 % 0.2 % 0. 1 % 0.3 % 0.9 % 4.6 % 0.7 % 2.4 %
% CI 0.0 % 0.0 % 0.0 % 0.0 % 0.3 % 0.0 % 0.0 % 0. 1 % 0.0 % 0.0 %
% Ash 2.0 % 0.9 % 0.4 % 3. 1 % 15.9 % 8.0 % 1 7.2 % 1 8.2 % 9.2 %, 7.2 %
I Totals ll 1 oo.o % I 1 00.0 % I 1 00.0 % I 1 00.0 % II 1 00.0 % I 99.9 % II 1 00.0 % I 1 00.0 % I 1 00.0 % 1 1 00.0 % 1 1 - Miles, T.R. Jr and T.R. Miles, Sr. , Operating Experience with Ash Deposition in Biomass Combustion Systems, Presented at Biomass
Combustion Conference, Reno, Nevada, January 1 992. 2 - Shultz, Sheldon, Experience Burning Wood Waste in Fluidized Bed Boilers, Presented at Biomass Combustion Conference, Reno,
Nevada, January 1 992. 3 - Hanson, J.L., Fluidized Bed Combustion of Biomass, Presented at Biomass Combustion Conference, Reno, Nevada, January 1 992.
4 - Hollenbacker, R., Biomass Combustion Technologies in the United States, Presented at Biomass Combustion Conference, Reno,
Nevada, January 1 992. 5 - Elliott, T.C., (ed.) , Standard Handbook of Powerplant Engineering, McGraw Hill Publishing Company, 1 989. 6 - Total may not equal sum of components due to rounding.
.£r

Acids
Bases
I
Component
% Ash
Si02
Fe203
P20s
Al203
Ti02
CaO
MgO
Na20
�0
Other*
Total II
EXHIBIT D-2: ASH COMPOSITION FOR SAMPLE WOOD FUELS, AGRICULTURAL WASTES, AND COALS
Wood Fuel Agricultural Waste· Coal
West Hogged Urban Wood Virginia Illinois Wyoming
Fuel1 Waste2 Pine Bark3 Rice Stra� Bagasse1 Bituminous3 Bituminous3 Subit.3
0.5 % 0.9 % 2.9 % 1 8.0 % 3.5 % 12.3 % 1 7.4 % 6.6 %
35.2 % 37.6 % 39.0 % 76.7 % 54.0 % 60.0 % 47.5 % 24.0 %
4.4 % 1 .9 % 3.0 % 0.5 % 14.8 % 4.0 % 20.1 % 1 1 .0 %
NR 4. 1 % NR 0.4 % NR NR NR NR
2.3 % 6.6 % 14.0 % 1 .4 % 15.3 % 30.0 % 17.9 % 20.0 %
0.0 % 0.3 % 0.2 % 0. 1 % 3.5 % 1 .6 % 0.8 % 0.7 %
25.4 % 36.8 % 25.5 % 2.7 % 1 .9 % 0.6 % 5.8 % 26.0 %
7.6 % 1 .6 % 6.5 % 4.3 % 2.2 % 0.6 .% 1 .0 % 4.0 %
5.6 % 1 .8 % 1 .3 % 4. 1 % 0.9 % 0.5 % 0.4 % 0.2 %
9.3 % 8.7 % 6.0 % 8.9 % 3.5 % 1 .5 % 1 .8 % 0.5 %
1 0.2 % 0.6 % 4.5 % 0.9 % 3.9 % 1 .2 % 4.7 % 13.6 %
1 00.0 % I 1 00.0 % I 1 00.0 % II 1 00.0 % I 1 00.0 % II 1 00.0 % I 1 00;0 % I 1 00.0 % I * - Other ash components include sulfite (S03) , chlorides, and other microelements. For a complete listing see: Campbell,
A.G., .. Recycling and Disposing of Wood Ash, .. TAPPI Journal, September 1 990. NR - Not reported 1 - Miles, T.R. Jr and T.R. Miles, Sr., Operating Experience with Ash Deposition in Biomass Combustion Systems, Presented
at Biomass Combustion Conference, Reno, Nevada, January 1 992. 2 - Salour, D. , B.M. Jenkins, M. Vafaei, M. Kayhanian, Control of In-bed Agglomeration of Fuel Blending in a Pilot Scale
Straw and Wood Fueled AFBC, Presented at Biomass Combustion Conference, Reno, Nevada, January 1 992. 3 - Elliott, T.C., (ed.), Standard Handbook of Powerplant Engineering, McGraw Hill Publishing Company, 1 989.

Appendix E
Emission Rate Units for Regulatory Assessments
Regulations for power plant air discharges are most often cited on a pounds of pollutant per mill ion Btu input Ob/MMBtu) or tons of pollutant per year (tons/yr or TPY) basis. However, emissions are measured in a variety of units including parts per million - volume basis (ppmv), parts per million - weight basis (ppmw), and mill igrams per dry standard cubic foot (mg/dscf). Therefore, to compare measured emission rates to regulations, unit conversions are required. A common conversion, especially for CO and NOx emission rates, is from ppmv to lb/MMBtu. Although other conversions are often necessary, this calculation is the most common, and is therefore the focus of this appendix. Other unit conversions can be derived from the presented computations.
As shown below, the conversion from ppmv to lb/MMBtu requires the molecular weight of the pollutant and the number of moles of flue gas resulting from combustion of one MMBtu of fuel.
molepollutsnt ppmv --==;_ 1 06 mo/e6U8f/BS
lbpol/utBnt molepo/luiBnt lbpoDutant molefluegss molefuBI ----'-==x x x--....;.;;;.;;.;-MMBtufusl mole��uegss molepollutant molefuel MMBtufuBI
The number of moles of flue gas resulting from combustion of one MMBtu of fuel (molenue
gas!Moletue�)requires combustion calculations and assumptions on excess air percentages and completeness of combustion. In this document, combustion calculations were performed for fuels for which ultimate analyses were available (e.g., solid biomass feedstocks), and fuels for which fuel gas composition was available (e.g., biomass-derived fuel gas) . Exhibit E-1 displays combustion calculations for hogged fuel fired with 30% excess air, a reasonable assumption for biomass-fired boilers Qncluding FBCs). The calculations and spreadsheet are based on EPRI's RDFCOAL cofiring model . Using the moles of dry flue gas per 1 00 lb of fuel and the fuel's heat content, molesnue gasiMMBtuinput can be calculated. Emission rates in ppmv units can then be converted to lb!MMBtu. Exhibits E-2 and E-3 show combustion calculations for biomass-derived fuel gas fired at 1 00% excess air (an appropriate level in combustion turbines) and unit conversions for the resulting NOx and other pollutants.

Document Control 1 . NREL Report No. 2. NTIS Accession No. 3. Recipient's Accession No. Page
TP-420-5637 DE93010038
4. Title and Subtitle 5. Publication Date Electricity from Biomass: An Environmental Review and Strategy June 1993
- 6.
7. Author(s) 8. Performing Organization Rept. Antares Group Inc. No.
9. Performing Organization Name and Address 1 0. ProjectfTask/Work Unit No.
BP3 1 1010 Antares Group Inc. 8240 Professional Place, Suite 207 Landover, MD 20785 1 1 . Contract (C) or Grant (G) No.
(C)
(G)
1 2. Sponsoring Organization Name and Address 13. Type of Report & Period Covered
National Renewable Energy Laboratory Subcontract report
1617 Cole Boulevard Golden, CO 80401-3393 1 4.
1 5. Supplementary Notes
1 6. Abstract (Limit: 200 words) This report presents an environmental assessment and strategy for the U.S. Department of Energy Biomass Power Program. The regulatory context and the environmental impact of biomass power technologies are described, and an environmental plan for the program is suggested. The plan suggests a proactive, synergistic approach, involving multiple parties with a stake in the successful commercialization of a biomass power industry. These parties include feedstock growers, state regulators, Forest Service and agricultural agents, utilities and independent power producers, rural electric cooperatives, and environmental activists.
17. Document Analysis a. Descriptors
biomass power, electricity from biomass, environmental issues, alternative energy sources
b. Identifiers/Open-Ended Terms
c. UC Categories 247
1 8. Availability Statement 1 9. No. of Pages
National Technical Information Service 138
U.S. Department of Commerce 5285 Port Royal Road 20. Price Springfield, VA 22161
A07
Form No. 0069E (6-30.87)