an estimation of the potential resource of ungaran ... world geothermal congress 2010 bali,...
TRANSCRIPT

Proceedings World Geothermal Congress 2010 Bali, Indonesia, 25-29 April 2010
1
An Estimate of the Resources Potential of Ungaran Geothermal Prospect for Indonesia Power Generation
Agus Setyawan1, Sachio Ehara2, Yasuhiro Fujimitsu2 and Jun Nishijima2 1Dept. of Physics, Diponegoro University, INDONESIA and 2Dept. of Earth Resources Engineering, Kyushu University, JAPAN
Keywords: Ungaran volcano, Indonesia, geophysical observations, numerical analysis, geothermal resource assessment
ABSTRACT
Numerical analysis has been performed to assess the geothermal potential of Ungaran volcano located in Central Java Indonesia using a 3-D finite difference simulator. A conceptual model was constructed based on the results of geophysical studies such as gravity, spontaneous-potential, micro-earthquake, infrared imagery and shallow ground temperature. Geophysical studies found deep geothermal fluids which are supplied from below of the central volcano was changed into lateral flows. A part of the geothermal fluids reaches the ground surface and forms the Gedongsongo fumarole area. The background temperature distributions and mass flux patterns were calculated for 150,000 years to obtain the quasi-steady state. The meteoric water flow pattern demonstrates predominant downward flow, with mass flux varying between 10-8 g/cm2sec up to 10-7 g/cm2sec. The thermal evolution was calculated for up to 30,000 years. The deep geothermal fluids supplied from below of the central volcano have enthalpy of 1085 kJ/kg and mass flow rates of 230 kg/s to 250 kg/s. In order to estimate the geothermal potential for conventional electric power production, we employed the minimum reservoir temperature is 150oC and the performance of the reservoir was predicted for 30 years production. Depths of the reservoir are assumed from 0.5 km to 3 km beneath mean sea level. The result shows that the estimated geothermal potentials are 2.3 MWe up to 40.4 MWe depending on the difference of thicknesses of the reservoir.
1. INTRODUCTION
Ungaran volcano located in the Central Java province about 30 Km southwest of Semarang, Indonesia as shown in Figure 1, is still undeveloped geothermal prospect. There are some geothermal manifestations at the piedmont of Ungaran volcano. Gedongsongo is the main geothermal manifestation in Ungaran volcano, located in the southern part of the Ungaran volcano which several geothermal manifestations such as fumaroles, hot springs, hot acid pool and acid surface hydrothermal alteration rocks exist. A geochemical model developed by Phuong et al. (2005) shows the thermal water in the Ungaran volcanic area are divide into two types: sulphate water Ca-(Na)-Mg-SO4-HCO3 in Gedongsongo and bicarbonate waters Ca-Mg-HCO3 and Na-(Ca)-HCO3-Cl in the surrounding areas, e.g. Banaran, Kendalisodo, Diwak and Kaliulo. Moreover integrated geophysical studies were carried out by Setyawan et al, 2008. In this study, a hydrothermal model of Ungaran Volcano is presented using numerical simulation technique based on mass and energy balance equations, supported by the computer program HYDROTHERM 2.2. (Hayba and Ingebritsen, 1994). The objective of this study is to estimate the resources
geothermal potential of Ungaran volcano for conventional electric power production.
Figure 1: Location of the study area; the red triangle indicated of Ungaran volcano.
2. GEOLOGY
Geothermal areas in Central Java, including Ungaran volcano, are located in the Quaternary Volcanic Belt (Solo Zone). This belt is located between the North Serayu Mountains and the Kendeng Zone, and contains young Quaternary centers of eruption, including Dieng, Sindoro, Sumbing, Ungaran, Soropati, Telomoyo, Merapi, Muria, and Lawu (Bemmelen, 1970).
Ungaran volcanic area is composed of andesitic lava, perlitic lava, and volcanic breccia from the post Ungaran caldera stages (Thanden et al., 1996), as shown in Figure 2.
On the other hand, Ungaran is a complex volcano consisting of a younger body, which was formed by the most recent volcanic activity, and an older body formed by prior volcanic activity. The Young Ungaran body seems to have been constructed inside a caldera formed during the older Ungaran activity. According to Kohno et al. (2006), the Old Ungaran body formed prior to 500,000 years ago, and the Young Ungaran volcano did not form until 300,000 years ago. The volcanic rocks are rich in alkali elements and are classified as trachyandesite to trachybasaltic andesite.

Setyawan et al.
2
Figure 2: Geology map of Ungaran volcano (Modified from Thanden et al., 1996).
3. GEOPHYSICAL OBSERVATIONS
3.1 Gravity
According from Setyawan et al. (2007) the Bouguer density of Ungaran of 2,470 kg/m3 is given by Murata’s method (1993), which shows a positive Bouguer anomaly ranging from 20.5 mGals to 56 mGals. Moreover, a high Bouguer anomaly was found in the northern part of Ungaran. Considering the geology information, the high Bouguer anomaly correlates with the old Ungaran volcano with an average density of 2,600 ± 110 kg/m3 consist of Augite-olivine basalt flows (basaltic lava) from Kaligesik formation. On the other hand an average density of the Young Ungaran consisting of hornblende-augite-andesite (andesite lava) from Gajahmungkur volcanic is 2,350 ± 130 kg/m3. In this paper we employed horizontal gradient analysis to locate the possible fault structure. The result of horizontal gradient analysis is presented in Figure 3. The high gradient values were observed between highs and lows of Bouguer gravity. There are two possibilities of interpretation, one is correlated with the mountain body or intrusion of rock and the other one is correlated with the
fault structure. Generally, the study area may be dissected by major faults striking in the east to west and northwest to southeast directions. The most interesting result is that all geothermal manifestations in Ungaran Volcano including the Gedongsongo area is well correlated with maxima of horizontal gradient anomalies interpreted as belonging to a fault zone.
3.2 Spontaneous-Potential (SP)
The SP surveys were conducted along the walking trail in the Gedongsongo area in 2004. The positive SP anomaly appears at the northernmost higher altitude part of the survey area (around a collapsed wall) and the distribution indicates a background trend that the lower the elevation is, the lower the SP value is. However, some other positive anomalies appear near the fumarole and hot spring zones that indicated this area is high permeability zone and the southernmost lower altitude part that interpreted as down flow zone, which encourages water recharges from the ground surfaces as shown in Figure 4.
Setyawan et al.
3
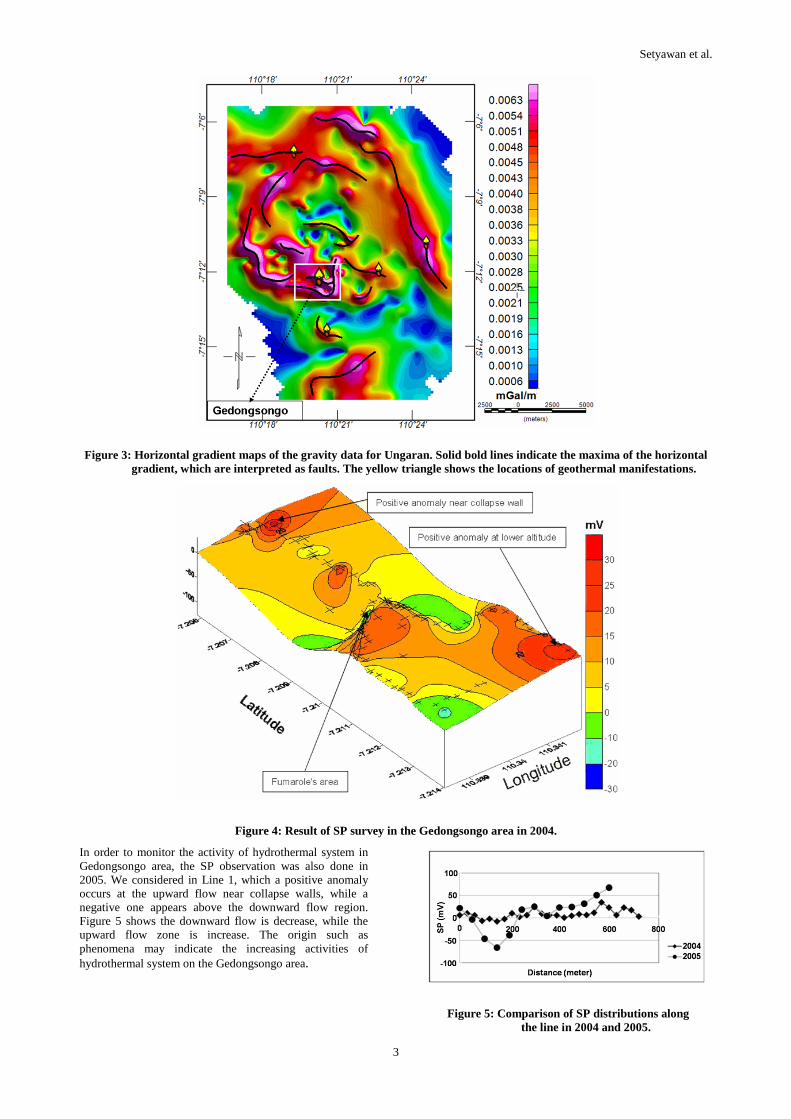
Figure 3: Horizontal gradient maps of the gravity data for Ungaran. Solid bold lines indicate the maxima of the horizontal gradient, which are interpreted as faults. The yellow triangle shows the locations of geothermal manifestations.
Figure 4: Result of SP survey in the Gedongsongo area in 2004.
In order to monitor the activity of hydrothermal system in Gedongsongo area, the SP observation was also done in 2005. We considered in Line 1, which a positive anomaly occurs at the upward flow near collapse walls, while a negative one appears above the downward flow region. Figure 5 shows the downward flow is decrease, while the upward flow zone is increase. The origin such as phenomena may indicate the increasing activities of hydrothermal system on the Gedongsongo area.
Figure 5: Comparison of SP distributions along the line in 2004 and 2005.

Setyawan et al.
4
3.3 Micro-Earthquake
The tripartite seismic observation was conducted near the collapse wall in 2005. There are 270 micro-earthquake events including 4 seismic swarms recorded during 5 days observations. The S-P times of the observed seismic data were no longer than 0.5 second. There are 54 hypocenters were successfully determined by the grid search method with 10 m grid as presented in Figure 6. We employed the uniform Vp wave of 3 km/s, Vs wave of 1.6 km/s and the uniform Vp/Vs of 1.87 (Ratmonopurbo and Poupinet, 2000). The hypocenters distribute in a shallow region (< 500 m) around the collapsed wall. The result indicated that this area was seismically very active. The origin of such anomalous micro-earthquake activity may be high temperature and high pore pressure due to the rising hot fluid.
3.4 Heat Discharge Rate
The infrared imagery observations were conducted at the largest fumarole and 5 high temperature anomaly zones in the Gedongsongo area by the infrared imagers (Thermo Tracer TH3102 by NEC San-ei in 2004 and TH7102WV in 2005). Heat discharge rates from the obtained infrared images were estimated by the heat balance technique (Sekioka and Yuhara, 1974).
The heat discharge rates in Gedongsongo area was presented in Table 1. The coefficients in this table were determined by visual observation of the micrometeorological conditions (Sekioka, 1983). The heat discharge rate from the steaming ground in 2004 was estimated as 0.26 MW and that in 2005 was 0.34 MW. Considering the accuracy of this technique, it concluded that the heat discharge rate did not change between 2004 and 2005.
Figure 6: The Hypocenters distribution in Gedongsongo area.
Table 1: Heat discharge rates from the Gedongsongo area in 2004 by using the heat balance technique
Setyawan et al.
5
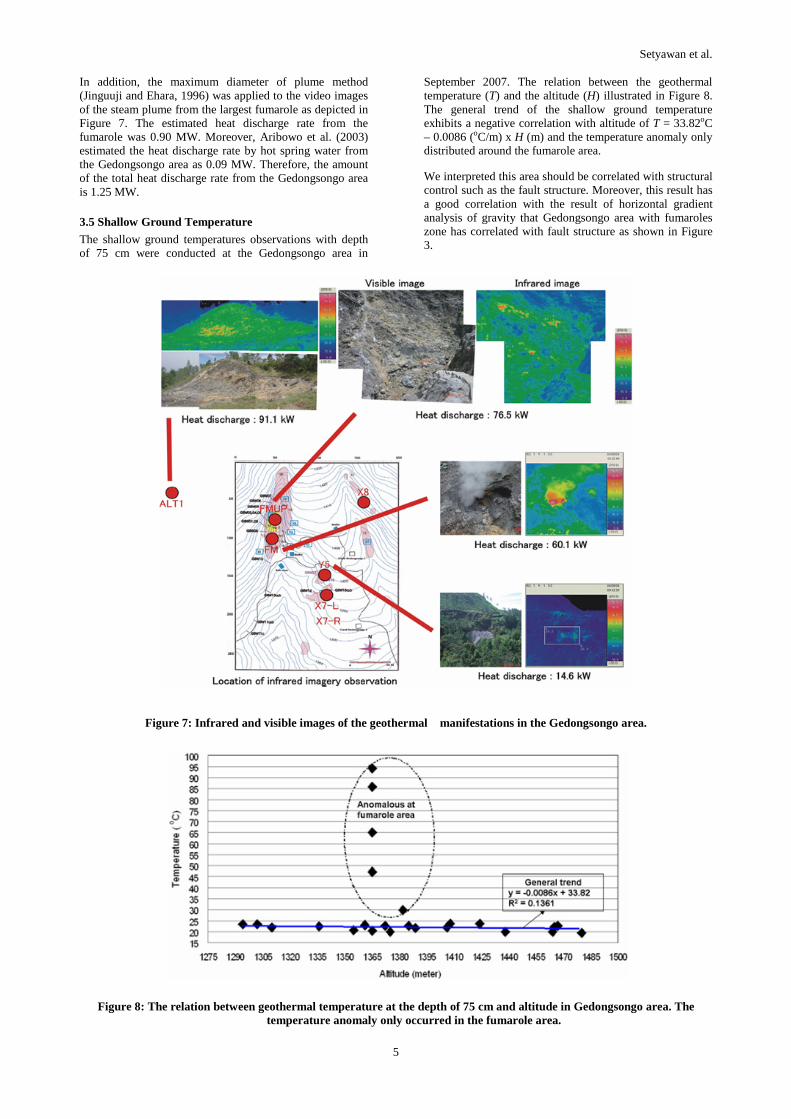
In addition, the maximum diameter of plume method (Jinguuji and Ehara, 1996) was applied to the video images of the steam plume from the largest fumarole as depicted in Figure 7. The estimated heat discharge rate from the fumarole was 0.90 MW. Moreover, Aribowo et al. (2003) estimated the heat discharge rate by hot spring water from the Gedongsongo area as 0.09 MW. Therefore, the amount of the total heat discharge rate from the Gedongsongo area is 1.25 MW.
3.5 Shallow Ground Temperature
The shallow ground temperatures observations with depth of 75 cm were conducted at the Gedongsongo area in
September 2007. The relation between the geothermal temperature (T) and the altitude (H) illustrated in Figure 8. The general trend of the shallow ground temperature exhibits a negative correlation with altitude of T = 33.82oC – 0.0086 (oC/m) x H (m) and the temperature anomaly only distributed around the fumarole area.
We interpreted this area should be correlated with structural control such as the fault structure. Moreover, this result has a good correlation with the result of horizontal gradient analysis of gravity that Gedongsongo area with fumaroles zone has correlated with fault structure as shown in Figure 3.
Figure 7: Infrared and visible images of the geothermal manifestations in the Gedongsongo area.
Figure 8: The relation between geothermal temperature at the depth of 75 cm and altitude in Gedongsongo area. The temperature anomaly only occurred in the fumarole area.

Setyawan et al.
6
4. NUMERICAL SIMULATION
4.1 Conceptual Model
A model of underground geothermal fluid flows was presented based on the several geophysical surveys (Setyawan et al., 2008). The geophysical surveys consist of spontaneous-potential (SP), micro-earthquake, infrared imagery, and shallow ground temperature observations. SP data showed that the main upflow zone of geothermal fluid is situated at the central part of the volcano around the collapse wall and the lateral flow of geothermal fluid causes the geothermal activities at Gedongsongo area. Two hundred seventy events including four earthquake swarms were recorded during 4-day seismic observation in 2005, and the hypocenters are distribute located in a shallower region than 500 m around the collapsed wall. The total heat discharge rate from Gedongsongo area was estimated as 1.25 MW by using the infrared imagery and the hot springs data. The shallow ground temperatures exhibit negative trend with altitude and it shows that geothermal anomalies are only distributed around Gedongsongo fumarole area. The following conceptual model of hydrothermal system beneath Ungaran volcano was presented based on the geophysical, geological and geochemical data (Figure 9). Deep geothermal fluids are supplied from below in the central part of the volcano, then changes into a lateral flow; part of the geothermal fluid reaches to the ground surface and forms the Gedongsongo fumarole area.
Figure 9: Conceptual model of hydrothermal system of Ungaran volcano.
4.2 Numerical Model
We adopted HYDROTHERM (Hayba & Ingebritsen, 1994) Ver. 2.2 for the numerical modelling. The modelling area covers an area of 21 km in a west-east direction, 11 km in a south-north direction as depicted in Figure 10. Moreover we divided into 28 (x-direction) x 28 (y-direction) x 28 (z-direction) blocks.
Figure 10: Horizontal extent of the study area which includes the buffer area whose width is 10 km at each lateral face and the total blocks are 28 in each direction.

Setyawan et al.
7
The rock properties of ungaran volcano are listed in Table 2. The vertical cross section of the center edifice in slice No 18 of west-east direction was presented in Figure 11. The vertical pressure distribution is given as hydrostatic and the ground surface boundary pressure value is fixed at 1.013 bars. The hydrological boundary condition at the surface is assumed to be permeable.
According to the results of 2D modeling of gravity, we set two layers in Ungaran volcano; the first layer is lower density and the second layer is higher density (setyawan, et.al, 2006), the detail setting of layer blocks: (-1) is constant blocks of 1st layer, (-2) constant block of 2nd layer, (1) is active blocks of 1st layer, (2) is active block of 2nd layer and (0) is inactive blocks, which also can be seen in Figure 11. The temperature (T) of the surface is according from the altitude point (H) following the empirical formula obtained by shallow ground temperature measurement of Ungaran on September 2007, which is followed by
T = 33.82oC – 0.0086 (oC/m) x H (m) (1)
The temperature of the subsurface increases with depth at the rate of 0.046oC/m, which is obtained by
Q = - K (dT/dz) (2)
where Q is the constant heat flux of 120 mW/m2 in this simulation (Nagao and Uyeda, 1995) and K is the thermal conductivity of 2.6 W/mK.
Table 2: Rock properties of the model
5. RESULT AND DISCUSSION
5.1 Quasi-Steady State
We simulated the development of the hydrothermal system up to 150,000 years when we expected that the system would be in a quasi-steady state. First, we calculated the model with no thermal source inside, and confirmed that no hydrothermal development was observed in both cases of the heat flow. Figure 12 shows the background temperature distribution and mass flux pattern calculated for 150,000 years. The meteoric water flow pattern demonstrates predominant downward flow, with a mass flux value varying between 10-8 g/cm2sec up to 10-7 g/cm2sec.
Figure 11: Vertical cross sections of transient state in the S-N slice No.11. The heat source was set beneath the collapsed wall deduced from the micro-seismic observation, which is represented in layer 3 and indicated the high porosity and high permeability.

Setyawan et al.
8
Figure 12: Background temperature distribution and mass flux patterns on the S-N slice No.11 calculated for past 150,000 years (steady state). The meteoric water flow patterns demonstrate the dominant downward flow.
Figure 13: The S-N slice No.11, temperature distribution and mass flux pattern in transient state calculated after 30,000 years. The heat source beneath collapse wall area has mass flux 250 kg/s and an enthalpy 1085 kJ/kg. An up-flow of hot water occurs beneath collapse wall area (in the circle area) and some portion of the water discharges as the surface thermal manifestations (in the square area).
5.2 Transient State
We employed the transient simulation, in which the supply of geothermal fluid (temperature is 250oC and enthalpy is 1085 kJ/kg) was assumed beneath the collapsed wall corresponding to the active seismic zone. Moreover, according to the result of the seismic observation, we set high permeability and high porosity to the layer 3 beneath
the collapsed wall area as shown also in Figure 11 and the physical properties are shown also in Table 2.
The thermal evolution was calculated for up to 300,000 years as shown in south-north direction (Figure 13). Up-flow of hot water occurs beneath the collapsed wall area, then the rising fluids move laterally and some portion of the fluid discharges at the surface in Gedongsongo area. This result has a good correlation with the SP observation.
Setyawan et al.
9
Heat discharge rate is a matching parameter in this numerical study. Total heat discharge rate was calculated by adding the heat discharge from hot springs and conduction as illustrated by
QTotal = Qhs + Qc (3)
where Qhs is the heat discharge rate from hot spring (W), Qc is the heat discharge rate from conduction (W).
The heat discharge from hot spring is expressed as
Qhs = H x q x A (4)
and the heat discharge from conduction is followed as
Qc = K x T∇ x A, (5)
where H is the enthalpy (kJ/kg), q is the mass flux (kg/m2 sec) and A is the area of Gedongsongo of 6250 m2, K is thermal conductivity of 2.6 W/mK, and T∇ is near surface temperature gradient at Gedongsongo area of 1.47 oC/m.
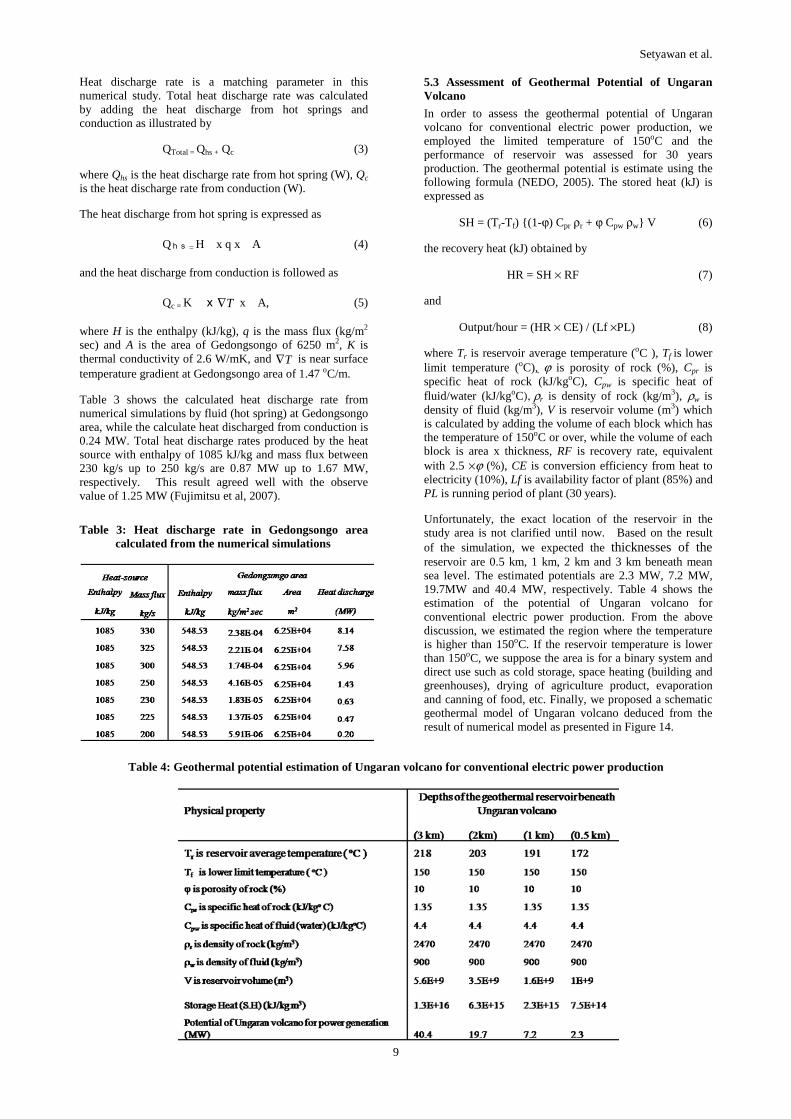
Table 3 shows the calculated heat discharge rate from numerical simulations by fluid (hot spring) at Gedongsongo area, while the calculate heat discharged from conduction is 0.24 MW. Total heat discharge rates produced by the heat source with enthalpy of 1085 kJ/kg and mass flux between 230 kg/s up to 250 kg/s are 0.87 MW up to 1.67 MW, respectively. This result agreed well with the observe value of 1.25 MW (Fujimitsu et al, 2007).
Table 3: Heat discharge rate in Gedongsongo area calculated from the numerical simulations
5.3 Assessment of Geothermal Potential of Ungaran Volcano
In order to assess the geothermal potential of Ungaran volcano for conventional electric power production, we employed the limited temperature of 150oC and the performance of reservoir was assessed for 30 years production. The geothermal potential is estimate using the following formula (NEDO, 2005). The stored heat (kJ) is expressed as
SH = (Tr-Tf) {(1-ϕ) Cpr ρr + ϕ Cpw ρw} V (6)
the recovery heat (kJ) obtained by
HR = SH × RF (7)
and
Output/hour = (HR × CE) / (Lf ×PL) (8)
where Tr is reservoir average temperature (oC ), Tf is lower limit temperature (oC), ϕ is porosity of rock (%), Cpr is specific heat of rock (kJ/kgoC), Cpw is specific heat of fluid/water (kJ/kgoC), ρr is density of rock (kg/m3), ρw is density of fluid (kg/m3), V is reservoir volume (m3) which is calculated by adding the volume of each block which has the temperature of 150oC or over, while the volume of each block is area x thickness, RF is recovery rate, equivalent with 2.5 ×ϕ (%), CE is conversion efficiency from heat to electricity (10%), Lf is availability factor of plant (85%) and PL is running period of plant (30 years).
Unfortunately, the exact location of the reservoir in the study area is not clarified until now. Based on the result of the simulation, we expected the thicknesses of the reservoir are 0.5 km, 1 km, 2 km and 3 km beneath mean sea level. The estimated potentials are 2.3 MW, 7.2 MW, 19.7MW and 40.4 MW, respectively. Table 4 shows the estimation of the potential of Ungaran volcano for conventional electric power production. From the above discussion, we estimated the region where the temperature is higher than 150oC. If the reservoir temperature is lower than 150oC, we suppose the area is for a binary system and direct use such as cold storage, space heating (building and greenhouses), drying of agriculture product, evaporation and canning of food, etc. Finally, we proposed a schematic geothermal model of Ungaran volcano deduced from the result of numerical model as presented in Figure 14.
Table 4: Geothermal potential estimation of Ungaran volcano for conventional electric power production

Setyawan et al.
10
Figure 14: Proposed schematic hydrothermal fluid flow model of Ungaran volcano deduced from the numerical model.
CONCLUSION
We presented a numerical model of Ungaran volcano based on geophysical observation and numerical simulation. The background temperature distributions and mass flux patterns were calculated for 150,000 years to attain the quasi-steady state. The meteoric water flow pattern demonstrates predominant downward flow, with a mass flux value of 10-8 g/cm2 sec to 10-7 g/cm2 sec. The thermal evolution was calculated for up to 300,000 years. Up-flow of hot water occurs beneath the collapsed wall area, after that the geothermal fluids move laterally and then some portion of the geothermal fluids discharges at the surface in Gedongsongo fumarolic area. Based on the numerical simulation model, the geothermal potential of Ungaran volcano is estimated at 2.3 MW to 40.4 MW depending on the assumed thickness of the reservoir.
ACKNOWLEDGMENTS
This study supported by a Grant-in aid for Scientific Research (B) No.17404024 from the Ministry of Education, Culture, Sports, Science and Technology of Japan, which acknowledged.
REFERENCES
Aribowo, Y., Pri Utami and Wahyudi: Karakter Kehilangan Panas Alamiah dan Alterasi Hidrotermal Permukaan di
Area Manifestasi Gedongsongo dan Sekitarnya Daerah Prospek Panasbumi Ungaran, Jawa tengah. Proceedings, Joint Convention Jakarta 2003, 32th IAGI and 28th HAGI Annual Convention and Exhibition, (2003) (in Indonesian)
Bemmelen, R. W. Van: The Geology of Indonesia, Vol. 1A. General Geology of Indonesia and Adjacent Archipelago, 2nd Edition, Martinus Nilhoff, The Haque, Netherlands, (1970).
Fujimitsu, Y., Setyawan, A., Fukuoka, K., Nishijima, J., Ehara, S. and Saibi, H., : Geophysical investigations of Ungaran volcano, Central Java, Indonesia, Proceedings, New Zealand Geothermal Workshop and New Zealand Geothermal Association Seminar,
(2007).
Hayba, D.O. and Ingebritsen, S. E.: The Computer Model HYDROTHERM, a Three-dimensional Finite-difference Model to Simulate Ground-water Flow and Heat Transport in the Temperature of 0 to 1,200oC, Water-Resources Investigations Report, USGS, (1994) 94-4045.
Jinguuji, M. and Ehara, S. Estimation of Steam and Heat Discharge Rates from Volcanoes Using Maximum Diameter of Volcanic Steam. Bull. Volcanol. Soc.

Setyawan et al.
11
Japan, Vol. 41(1), (1996), 23-29 (in Japanese with English abstract).
Kohno, Y., Taguchi, S., Agung, H., Pri. U., Imai, A., and Watanabe, K., Geological and Geochemical Study on The Ungaran Geothermal Field, Central Java, Indonesia: an Implication in Genesis and Nature of Geothermal Water and Heat Source. Proceedings, 4th International Workshop on Earth Science and Technology, Fukuoka, (2006), 19-28.
Murata, Y. (1993). Estimation of Optimum Average Surficial Density from Gravity Data: an Objective Bayesian Approach. Journal. Geophysics. Res., Vol. 98(B7), 12097-12109.
Nagao, T. and Uyeda, S., : Heat-flow Distribution in Southeast Asia with Consideration of Volcanic Heat, Tectonophysics, 251, (1995) 153-159.
NEDO, Report of Geothermal Development Promotion Surveys No.C-2-1 in Obama Area (1st), (2005), (in Japanese), 113-146.
Phuong, Ng, K, Hendrayana, H., Harijoko, A., Itoi, R., Unoki, R.: Hydrotermal System of The Ungaran Geothermal Area, Indonesia Inferred from Geochemical Study. Proceedings, 3rd International Workshop on Earth Science and Technology, Fukuoka, (2005), 19-28.
Ratdomopurbo, A. and Poupinet, G.: An Overview of the Seismicity of Merapi Volcano (Java, Indonesia), 1983-1994. J. Volcanol. Geotherm. Res., 100, (2000), 193-214.
Sekioka, M. and Yuhara, K.: Heat flux Estimation in Geothermal Areas Based on the Heat Balance of the Ground Surface. Jnl. Geophys. Res., Vol. 79(14), (1974), 2053-2058.
Sekioka, M.: Proposal of a Convenient Version of the Heat Balance Technique Estimating Heat Flux on Geothermal and Volcanic Fields by Means of Infrared Remote Sensing. Mem. National Defence Academy Japan, Vol. 23(2), (1983), 95-103.
Setyawan, A., Ehara, S, Fujimitsu, Y., Nishijima, J.: Fukuoka, K., and Saibi, H.: Integrated Geophysical Surveys of Ungaran Volcano: Understanding the Hydrothermal System, Proceedings, The 2nd International Workshop and Conference on Earth Resources Technology, Bangkok, Thailand, (2008), 9-14.
Setyawan, A., Ehara, S., Nishijima, J., Saibi, H., and Wahyudi: Gravity Study of Ungaran Volcano, Central Java, Indonesia, Proceedings, International Workshop on Earth Resources Technology, Fukuoka, Japan, (2007).
Setyawan, A., Nishijima, J., Fukuoka, K., Fujimitsu, Y., and Ehara, S.: Subsurface Structure Imaging of Ungaran Volcano, Indonesia Based on Geophysical Surveys, Annual Meeting Geothermal Research Society of Japan, Fukusima, Japan, (2006).
Thanden, R. E., Sumadirdja, H., Richards, P. W., Sutisna, K. and Amin, T. C.: Geological Map of the Magelang and Semarang Sheets, Java, scale 1: 100,000, Systematic Geological Map, Indonesia, Geological Research and Development Centre, Indonesia, (1996).