an evaluation of 3-d scene exploration using a ... evaluation of 3-d scene exploration using a...
TRANSCRIPT

The Visual Computer manuscript No.(will be inserted by the editor)
An Evaluation of 3-D Scene Exploration Using aMultiperspective Image Framework
Paul Rosen · Voicu Popescu
Received: date / Accepted: date
Abstract Multiperspective images (MPIs) show morethan what is visible from a single viewpoint and are a
promising approach for alleviating the problem of oc-
clusions. We present a comprehensive user study that
investigates the effectiveness of MPIs for 3-D scene ex-
ploration. A total of 47 subjects performed searching,counting, and spatial orientation tasks using both con-
ventional and multiperspective images. We use a flexi-
ble MPI framework that allows trading off disocclusion
power for image simplicity. The framework also allowsrendering MPI images at interactive rates, which en-
ables investigating interactive navigation and dynamic
3-D scenes. The results of our experiments show that
MPIs can greatly outperform conventional images. For
searching, subjects performed on average 28% faster us-ing an MPI. For counting, accuracy was on average 91%
using MPIs as compared to 42% for conventional im-
ages.
Keywords multiperspective images · occlusions ·
navigation · interactive 3-D scene exploration · visual
interfaces · user study
P. RosenScientific Computing and Imaging InstituteUniversity of Utah72 S Central Campus Drive, Room 3750Salt Lake City, UT 84112Tel.: +801-585-1867Fax: +801-585-6513 E-mail: [email protected]
V. PopescuComputer Science DepartmentPurdue University305 N. University StreetWest Lafayette, IN 47907Tel: +765-496-7347Fax: +765-494-0739 E-mail: [email protected]
1 Introduction
As dataset complexity continues to increase, the visual
interface between users and computers is called upon
to convey increasing amounts of information. However,
when a 3-D dataset is projected to screen, data sub-sets of potential interest are hidden due to occlusions.
Occlusions are a fundamental problem in 3-D data visu-
alization because they increase the complexity of tasks
such as finding and tracking data subsets, or identifyingconnections between data subsets that are not simulta-
neously visible.
One approach for alleviating occlusions is to offerthe user the ability to change the view interactively.
Such sequential exploration of a 3-D dataset can be in-
efficient. The user has to navigate the virtual camera
around occluders to explore the hidden data subsets;when the newly discovered data subset turns out to
be of no interest, the navigation path has to be re-
traced. The disadvantages of sequential exploration are
exacerbated in the case of dynamic datasets where the
phenomenon of interest could be transient and its vi-sual saliency could decay before the user reaches it.
Another challenge is identifying connections between
distant data subsets. Such subsets cannot be imaged
simultaneously and any potential connection betweenthem is likely to be missed during sequential naviga-
tion.
A second approach for alleviating occlusions is toprovide the user with multiple views arranged in a 2-D
matrix on the screen. The approach alleviates the chal-
lenges posed by sequential exploration: no navigation
is needed and more of the data is shown at any giventime. However, such a multiview interface suffers from
visualization discontinuity across the borders of indi-
vidual images. The user cannot easily monitor all the

2 Paul Rosen, Voicu Popescu
Fig. 1 The PPC (left) does not show the side corridor whilethe GC (right) reveals the hidden object.
images in parallel and has to examine each image in
turn, painstakingly adapting to each one of the multi-
tude of contexts. Dynamic objects move erratically on
screen jumping from one view to another. Moreover,
achieving comprehensive coverage can require an im-practical number of views and conforming to a limited
budget of views implies that some of the data is not
imaged.
A third approach for alleviating occlusions is to en-
hance the image such that it shows more than what is
visible from a single viewpoint. Such an image showsoccluded data subsets without resorting to navigation
or multiple views. One option is to render occluding
data subsets transparently or to cut away parts of the
occluding data subsets. An important advantage is that
spatial relationships are preserved: each data subset isimaged where it would be seen in the absence of the
occluding subsets. However, transparency and cutaway
techniques have difficulty scaling with an increasing
number of occluding layers, and many layers are onlyrepresented summarily. A second option is to perturb
spatial relationships either in the 3-D dataset (1) or
in the image (2) in order to break the alignment be-
tween occluding and occluded datasets. (1) Spatial dis-
tortion techniques take the approach of altering the 3-Ddataset such that when projected onto the image plane,
important data subsets map to disjoint image locations
and occlusions are avoided. (2) Multiperspective image
(MPI) techniques alter the camera model used to com-pute the image such that all subsets of interest are visi-
ble. Distortion techniques have the advantage of scaling
well with the number of occluding layers and of repre-
senting all layers equitably. This comes at the cost of
perturbing spatial relationships.
MPI techniques allow specifying the exact desired
disocclusion effect directly in the image. However sev-eral important challenges have so far prevented MPI
techniques from being incorporated into mainstream vi-
sual interfaces. Challenges include achieving sufficient
flexibility to disocclude complex and dynamic datasets,
achieving sufficient rendering performance for interac-
tive visualization, and minimizing distortions. The graph
camera [32] is a recently developed MPI framework that
addresses most technical challenges associated with MPI.The graph camera is literally a graph of conventional
planar pinhole camera (PPC) images. Construction starts
from an initial PPC whose frustum undergoes a series
of bending, splitting, and merging operations. The re-sult is a flexible camera model with piece-wise linear
rays that reach deep into the dataset, avoiding occlud-
ers and sampling multiple or all data subsets of interest.
Due to the availability of a fast projection operation,
graph camera images of complex 3-D datasets can berendered at interactive rates. The graph camera inte-
grates multiple conventional PPC images into a single
image which is free of local distortions.
In this paper we describe an extensive user studyconducted to investigate and quantify the potential ben-
efits of the graph camera MPI framework in the context
of 3-D scene exploration. Our study was conducted us-
ing 47 subjects whose accuracy and speed were tested
for a number of tasks related to 3-D scene exploration.In one type of task subjects were asked to explore a
maze to find stationary or moving objects by navigat-
ing a PPC or a graph camera (GC), see Figure 1. The
graph camera image aims to improve performance bypreviewing lateral corridors.
The second type of task asked subjects to count ob-
jects in a maze using a 4x4 matrix of PPC images or a
single graph camera image. In Figure 2 the GC image
samples the maze non-redundantly which simplifies thecounting task in the presence of identical objects. For
example, 4 PPC images show a purple-red-white object
(i.e. 1, 3, 9, and 15), while there are only 2 such objects
in the maze, which requires substantial cognitive effortto disambiguate objects through spatial reasoning. The
GC image shifts the cognitive effort to a simple visual
inventorying of the non-redundant image.
The third type of tasks tested how much the addi-
tional viewpoints integrated by graph camera imagessuch as that in Figure 1 affect subjects understanding
of orientation. The subjects first watched an animation
constructed from graph camera or PPC rendered along
a random path. Then, they were asked to identify the
corresponding path on a map. We also refer the readerto the video accompanying the paper.
The results of the user study indicate that the disoc-
clusion capability of graph camera images is beneficial
to users when performing basic tasks in the context of3-D scene exploration. By using a graph camera image,
subjects were able to locate objects on average 27.8%
faster compared to using a PPC. When counting ob-

An Evaluation of an MPI Framework 3
jects, using GC images resulted in an accuracy of 91.3%
compared to only 42.0% when using a matrix of PPC
images. For the orientation task, subjects performed
virtually identically with accuracy of 66.7% and 69.8%
for PPC and GC images, respectively.
To the best of our knowledge, this is the first userstudy investigating the potential benefits of multiper-
spective visual interfaces in scene exploration. The graph
camera framework has the advantage of allowing chang-
ing the amount of disocclusion achieved by stopping the
recursive construction after a desired number of lev-els. This enables investigating the benefits of MPI on
a continuum from a single perspective and intensive
navigation to a large number of perspectives sufficient
to capture the entire 3-D dataset in a single image by-passing navigation altogether. In Figure 1, the recursive
construction was stopped at the second level. This al-
lows the user to see beyond the first corners, but seeing
farther requires navigation. In Figure 2 the recursive
construction continued until the entire maze was cap-tured, eliminating the need for navigation altogether.
2 Prior Work
We review the state-of-the-art in navigation, multiper-
spective rendering, and visualization.
2.1 Navigation
Our study compares user performance using single per-
spective and multiperspective views given the same nav-
igation controls for each. Although our study does specif-
ically compare different navigation techniques, we re-view prior work in navigation for completeness.
Unconstrained 6 degree-of-freedom 3-D navigation
is difficult for users to master. Constraining navigation
[2,15,18] is the approach most frequently used to im-
prove a users navigation experience. In addition to re-
ducing the number of degrees of freedom that the usercan manipulate, this also includes keeping a safe dis-
tance from objects for the purpose of having the cam-
era at a natural height for architectural navigation [40],
avoiding collisions [16], or simply hovering [21] at a con-stant distance for object inspection. Simplified point-
and-click controls [17,23] or gesture-based controls [30,
38] are also effective at improving the users navigation
experience.
The speed of camera navigation is another concern.
A number of systems [28,41] have addressed the prob-lem of navigation in scenes with multiple scales. Here,
fast and smooth transitions between environments rang-
ing from the size of the Earth down to a single room
Fig. 2 A matrix of PPC images (top) and a graph cameraimage (bottom) both capturing the entire maze.
or even to a microscopic level are desired. Identifyinga path, or wayfinding, through unfamiliar 3-D envi-
ronment is a challenging task, facilitated by employing
tools such as maps and signs [10]. Providing additional
context through proxies and tethers that link maps withground level views can also improve subject navigation
performance [31]. Visit Wear [39] addresses the prob-
lem of revisitation (i.e. following a path already visited)
by adding a history mechanism to fisheye views using a
distortion-based technique. It showed that performancecan be improved by shifting cognitive tasks: the task of
remembering a path was changed to one of visual search
for path components. The lack of previewing capability
makes this technique less effective for other tasks likesearching and counting.
2.2 Multiperspective Rendering
There exist a number of systems for compositing PPC
images. Multiperspective collages [1] take images of ob-jects with different viewpoints and paste them into a
single multiperspective image. The images generated
have poor correlation to 3-D space making navigation
impossible. Video cubes [22] provide the potential forgenerating multiperspective images by allowing arbi-
trary slices through a stack of PPC images, but navi-
gation is limited to the prerecorded video path. Meth-

4 Paul Rosen, Voicu Popescu
ods also exist which produce multiperspective images
by distorting the view space [7] or allow for an artist
to design flexible camera models [4,8] which can com-
bine perspective, orthographic, and non-linear projec-
tion techniques.
The occlusion camera [29] is a PPC enhanced with
rays that reach around occluders to capture barely hid-
den samples. A barely hidden sample is not visible from
the reference viewpoint but visible from a nearby view-point. The general linear camera [43,44] is constructed
by interpolating three non-concurrent rays. Occlusion
and general linear cameras only provide a local disoc-
clusion effect and cannot produce comprehensive im-
ages of complex 3-D datasets.
Multiple center of projection (MCOP) images [34]
sample scenes with a pushbroom camera that slides
along a user selected path around a scene. The resulting
image provides a continuous transition between manyviewpoints. A similar approach has been used in creat-
ing multiperspective panoramas for cel animation [42].
Street panoramas [36,37] were created for photograph-
ing urban landscapes by sliding a vertical pushbroom or
crossed-slit camera down a street to capture the faades.All these techniques offer good disocclusion capabil-
ity. However, rendering the multiperspective image en-
tails rendering from each viewpoint along the underly-
ing camera path, which precludes interactive navigationand dynamic datasets.
Work flow visualization tools provide multiview in-
terfaces for 3-D data set exploration. Some systems pro-
vide mechanisms to review navigation and visualization
tasks in a serialized pattern through undo and redomechanisms [24]. Other systems allow branching of par-
allel tasks allowing multiple views with variable visu-
alization parameters simultaneously [3,35]. Like tradi-
tional spreadsheets, multiview spreadsheets [20,25] aretabular and can be treated like flipbooks, but they can
also be moved, rotated, or scaled. These interfaces can
provide a wide variety of views simultaneously, but suf-
fer from a poor integration of individual views.
Fig. 3 Graph Camera operations: bend (left), split (middle),and merge (right).
Fig. 4 The PPC (top) only samples along the magenta path(right). The portal-based MPI (bottom) samples along themagenta path plus the blue paths down the adjacent corri-dors.
2.3 Visualization
Several visualization techniques attempt to overcome
the occlusion limitation. For a comprehensive review ofthe state-of-the-art, we refer the reader to a taxonomy
of over 50 occlusion management techniques [14].
Transparency techniques have the advantage of re-vealing hidden data subsets while still showing a com-
plete model [12,19]. However, the approach scales poorly
with the number of occluding layers. Cutaway tech-
niques address this limitation by simply removing partsof the outer layers [6,13,27]. This comes at the cost of
representing outer layers only summarily, at the periph-
ery of the image.
An alternative is to distort the 3-D dataset such that
subsets of interest become visible to the user. Deforma-
tion techniques [11,33] preserve the original topology
of the dataset, whereas explosion techniques [5,26] do
not. Deformation techniques are suitable when there ex-ists adequate access to the occluded subset. Explosion
techniques are typically used when the subset of inter-
est is completely contained in the occluding subset (e.g.
an engine inside the hood of a car). Dataset distortiontechniques attempt to achieve the desired disocclusion
effect indirectly: the dataset is first distorted and the
disocclusion effects are then evaluated by rendering the
distorted dataset with a conventional camera.
Multiperspective imaging techniques have the ad-
vantage of allowing the design of disocclusion effects di-
An Evaluation of an MPI Framework 5
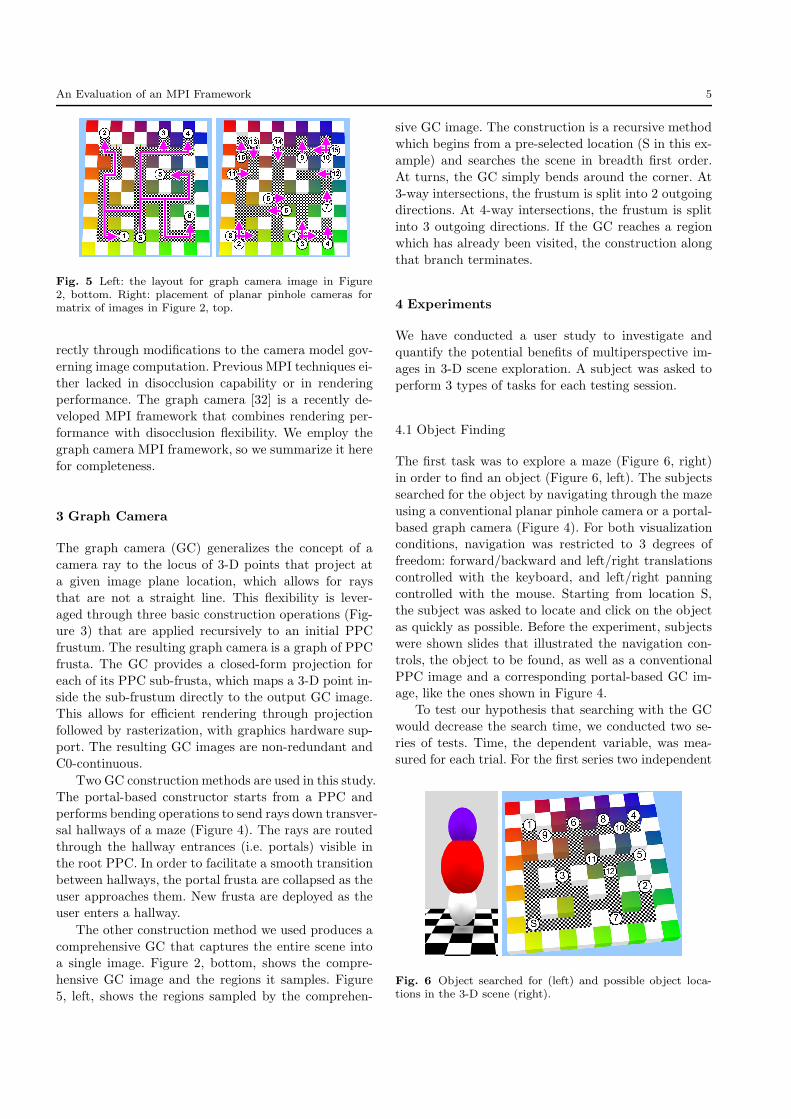
Fig. 5 Left: the layout for graph camera image in Figure2, bottom. Right: placement of planar pinhole cameras formatrix of images in Figure 2, top.
rectly through modifications to the camera model gov-
erning image computation. Previous MPI techniques ei-
ther lacked in disocclusion capability or in renderingperformance. The graph camera [32] is a recently de-
veloped MPI framework that combines rendering per-
formance with disocclusion flexibility. We employ the
graph camera MPI framework, so we summarize it here
for completeness.
3 Graph Camera
The graph camera (GC) generalizes the concept of a
camera ray to the locus of 3-D points that project at
a given image plane location, which allows for rays
that are not a straight line. This flexibility is lever-
aged through three basic construction operations (Fig-ure 3) that are applied recursively to an initial PPC
frustum. The resulting graph camera is a graph of PPC
frusta. The GC provides a closed-form projection for
each of its PPC sub-frusta, which maps a 3-D point in-side the sub-frustum directly to the output GC image.
This allows for efficient rendering through projection
followed by rasterization, with graphics hardware sup-
port. The resulting GC images are non-redundant and
C0-continuous.
Two GC construction methods are used in this study.
The portal-based constructor starts from a PPC and
performs bending operations to send rays down transver-sal hallways of a maze (Figure 4). The rays are routed
through the hallway entrances (i.e. portals) visible in
the root PPC. In order to facilitate a smooth transition
between hallways, the portal frusta are collapsed as the
user approaches them. New frusta are deployed as theuser enters a hallway.
The other construction method we used produces a
comprehensive GC that captures the entire scene intoa single image. Figure 2, bottom, shows the compre-
hensive GC image and the regions it samples. Figure
5, left, shows the regions sampled by the comprehen-
sive GC image. The construction is a recursive method
which begins from a pre-selected location (S in this ex-
ample) and searches the scene in breadth first order.
At turns, the GC simply bends around the corner. At
3-way intersections, the frustum is split into 2 outgoingdirections. At 4-way intersections, the frustum is split
into 3 outgoing directions. If the GC reaches a region
which has already been visited, the construction along
that branch terminates.
4 Experiments
We have conducted a user study to investigate and
quantify the potential benefits of multiperspective im-
ages in 3-D scene exploration. A subject was asked to
perform 3 types of tasks for each testing session.
4.1 Object Finding
The first task was to explore a maze (Figure 6, right)
in order to find an object (Figure 6, left). The subjects
searched for the object by navigating through the maze
using a conventional planar pinhole camera or a portal-
based graph camera (Figure 4). For both visualizationconditions, navigation was restricted to 3 degrees of
freedom: forward/backward and left/right translations
controlled with the keyboard, and left/right panning
controlled with the mouse. Starting from location S,the subject was asked to locate and click on the object
as quickly as possible. Before the experiment, subjects
were shown slides that illustrated the navigation con-
trols, the object to be found, as well as a conventional
PPC image and a corresponding portal-based GC im-age, like the ones shown in Figure 4.
To test our hypothesis that searching with the GC
would decrease the search time, we conducted two se-
ries of tests. Time, the dependent variable, was mea-sured for each trial. For the first series two independent
Fig. 6 Object searched for (left) and possible object loca-tions in the 3-D scene (right).

6 Paul Rosen, Voicu Popescu
variable were used. The first was the viewing condition
which alternated between PPC and GC between tests.
The second was the object location within the maze.
For each test, the object was placed at one of 12 loca-
tions that cover the entire maze (Figure 6). The orderfor object placement was preplanned and identical for
all tests. For the second series an additional indepen-
dent variable was added. Here, the position object was
dynamic. For each test, the object started at one ofthe first 8 locations shown in Figure 6 and then moved
through the maze, making random turns at intersec-
tions.
4.2 Object Counting
The second task was to count objects in a 3-D maze us-
ing two forms of comprehensive visualization: a 4x4 ma-
trix of conventional PPC images and a comprehensiveGC image (Figure 2). Since both visualizations show
the entire maze, no navigation is needed. The GC was
constructed automatically starting from S and covering
the maze recursively until the terminal locations 1-6
were reached. The viewing locations for the matrix ofPPCs were chosen by hand to cover the maze environ-
ment in its entirety while minimizing overlap (Figure 5).
The arrangement of the individual PPC images within
the matrix was chosen to keep the views with similarlocations as close together as possible, to minimize how
far a moving object jumps as it leaves one PPC frustum
and enters another. Before the experiment, the subjects
were shown a single slide with an example of a compre-
hensive GC image and matrix of PPC images, like thosein Figure 2.
To test our hypothesis that the GC would increasecounting accuracy, we once again conducted two se-
ries of tests. The first series of tests used four inde-
pendent variables. The first variable was the number
of objects which was randomly selected to be between
4 and 7. The position of the objects was also variable
Fig. 7 Selection interface of the path matching experiment.
and selected at random. The next variable was object
color: objects could either be completely unique in color
combinations or have duplicate combinations. The final
variable was the time alloted to count the objects. Sub-
jects were given 5, 10, or 20 seconds to complete theircount. The second series of tests had the same indepen-
dent variables as the first, with the addition of dynamic
object motion. For this series, objects were allowed to
move randomly throughout the maze.
4.3 Path Matching
The third task asked subjects to recall a path throughthe maze after watching an animation rendered with a
PPC or with a portal-based GC. Our hypothesis in this
case was that the distortions of the GC would not af-
fect a subject’s most basic spatial understanding – theability to identify left and right turns. We tested two
independent variables in these experiments. The first
was the viewing condition, the same as for the object
finding task (Figure 4), were alternated between the
PPC and GC. The second was the path which was gen-erated randomly to have 5 turns. After watching the
animation, the subjects were asked to identify the path
they had just seen among 3 paths: the correct path and
2 randomly generated incorrect ones. Subject selectionaccuracy was recorded. The paths were shown with 2-D
diagrams (Figure 7). To explain the task, the subjects
were shown a sample path played back and its corre-
sponding diagram before the experiment began.
4.4 Testing and Subject Pool
A testing session was designed to lasted up to 1 hour.The first series of tests subjects would perform were ob-
ject finding. Each subject was asked to perform total of
40 tests (24 stationary object, 16 moving objects; 50/50
split between PPC and GC). Next, the subjects would
perform 40 object counting tasks with equal distribu-tion between moving objects and stationary objects and
the two viewing condition. Finally, the subjects per-
formed 10 path matching tasks with even distribution
between PPC and GC viewing conditions.
We had a total of 47 subjects participate in test-
ing. Subjects had the option of participating in 1 or3 sessions. There was a minimum of 1 night between
two consecutive testing sessions of the same subject,
and a maximum of 3 days. The subjects were between
18 and 38 years of age; 10 were female and 37 weremale. Subjects were recruited from our research lab
and from computer science and computer technology
courses. The subjects self-reported their level of 3-D

An Evaluation of an MPI Framework 7
navigation experience ranging from none to very high,
though the majority, 33, reported their level as high or
very high. Of the 47 total subjects, single session results
are reported for 45 subjects. One subject suffers from a
visual impairment which would possibly affect the test-ing results. Another subject became motion sick about
10 minutes into the experiment. The motion sickness
was not due specifically to either the PPC or GC visu-
alization, but the motion of the visualization in general.Multiple session results are reported for the 25 subjects
who chose to participate in 3 sessions. Subjects were
not financially compensated for their time. Students re-
cruited from courses were offered extra credit. All test-
ing was performed in accordance with the policies ofour Institutional Review Board.
All of our experiments were performed on comput-
ers with minimum configurations of Intel Xeon 2.4 GHz
processors, 4 GB RAM, and nVidia GeForce 280 GTXgraphics cards. All experiments used 24” LCD moni-
tors with 1920 x 1200 resolution. The PPC and GC are
both capable of rendering the maze scene at hundreds
of frames per second, but we enabled vertical sync for
a refresh rate of 60 Hz.
5 Results and Discussion
5.1 Object Finding
5.1.1 First Testing Session
The first series of tests consisted of finding a stationary
object placed at one of 12 locations (Figure 6, right), forthe PPC and portal-based GC visualization conditions.
The average times for finding the object are shown in
Figure 8, top. The GC outperforms the PPC for al-
most all cases. On average, object finding times were
20.4s with the PPC and 13.3s with the GC, an im-provement of 34.8%. Among the 45 subjects counted,
42 performed better with the GC as opposed to the
PPC. 36 performed at least 20% faster.
Performance improved by as much as 90.7% for ob-ject location #3. This was a particularly easy case for
the GC. The extra perspective of the portal-based GC
made the object visible from the initial viewpoint and
view direction, so the object was found with almost no
navigation.Location #8 was the only case when the PPC out-
performed the GC. Figure 9, left, shows that the PPC
image reveals the object by chance as the user travels
North and approaches location #6. The GC reveals theentire lateral hallway, but not the object, which is not
one, but two intersections away from the current user
location. Such a case where the PPC reveals an object
0 10
20 30
40 50
60
1 2 3 4 5 6 7 8 9 10 11 12
Tim
e (s
)
Starting Object Locations
PPC QuartilesGC Quartiles
0 10
20 30
40 50
60
1 2 3 4 5 6 7 8
Tim
e (s
)Starting Object Locations
PPC QuartilesGC Quartiles
Fig. 8 Box plot of user performance finding stationary ob-jects (top) and dynamic objects (bottom). For objects at eachposition, the PPC result is the left plot and the GC is the rightplot. Outliers (trials lasting longer than 60 seconds) for eachobject position are marked at the top.
and the GC does not is rare. The GC disoccludes a
large area of the maze at the cost of occluding a small
region where the object is less likely to be located.
For each of the PPC and GC conditions there were
exactly 32 cases (6.3%) of time expiring. Many outliers
existed for object location #2 (7 PPC and 17 GC).
This is most likely due to the location being difficult
to reach from the starting location S since the naturaltendency is to first travel north the entire length of
the initial corridor. A large number of outliers (13 PPC
and 13 GC) were concentrated between only 2 subjects.
Outliers were removed from all results reported in thispaper.
For the second series of tests the objects started
at the first 8 object locations from Figure 6 and then
moved about the maze randomly. The results are shownin Figure 8, bottom. In all, subjects found the object
Fig. 9 Rare case when object is visible in PPC image (left)and not visible in portal-based GC image (right).

8 Paul Rosen, Voicu Popescu
Stationary Objects Moving ObjectsPPC GC PPC GC
Session #1 19.7 s 12.9 s 11.6 s 8.6 sSession #2 15.7 s 10.9 s 10.8 s 8.5 sSession #3 14.3 s 9.2 s 9.0 s 8.2 s
Table 1 Average time to find objects for subjects partici-pating in 3 testing sessions.
in an average of 12.6 seconds with the PPC and 9.1
seconds with the GC for a speedup of 27.8%. In total,
the PPC had 7 (1.90%) outliers (time expired) while
the GC only had 1 outlier (0.27%). We could identifyno correlation between the subjects or object locations
which produced these outliers.
5.1.2 Multiple Sessions
25 of the 47 subjects participated in 3 sessions. The av-
erage times per session are reported in Table 1, left. Forthe stationary objects series, subjects performance im-
proved virtually in stride for both GC and PPC. The
GC outperformed the PPC on average 34.8%, 30.6%,
and 35.4% for sessions 1, 2, and 3, respectively. For themoving objects series GC performance is superior to
PPC performance for all sessions. GC session to ses-
sion improvement does not outpace PPC improvement
for either series, which indicates that GC benefits are
not contingent upon user familiarity with the novel typeof image. The improved performance at object find-
ing brought by the GC over the PPC are due to the
GC being enhanced with additional viewpoints, which
makes the search more efficient. The preview of up-coming regions reduces the navigation required for an
exhaustive search by early elimination of empty dead-
end hallways. The GC allows the subject to see one
intersection ahead.
5.2 Object Counting
5.2.1 First Testing Session
Subjects counted stationary objects correctly 90.2% of
the time using the comprehensive GC image, and only
43.6% of the time using the matrix of PPC images.
For moving objects, the results showed an accuracy of
92.4% for the GC and only of 40.4% for the PPC. Us-ing the PPC performance as the null hypothesis showed
statically significance in the result (p-value < 0.001) for
both stationary and moving objects. Table 2, left, shows
that subjects counted stationary objects with good per-formance even when exposure time was 5 seconds; PPC
performance increases with exposure time but remains
much lower than GC performance. Table 2, right, shows
that counting accuracy is consistently higher for the
GC, regardless of the number of objects, and that per-
formance degrades faster for the PPC with the number
of objects.
5.2.2 Multiple Sessions
Table 3, right, shows performance over multiple ses-
sions. GC performance becomes nearly perfect in the
second session. PPC performance continues to improvefrom the second to the third session, but at a slower
pace, and remains substantially below GC performance.
Our results show that comprehensive GC visual-
ization outperforms PPC matrix visualization for the
counting task. We see 4 main features of the GC whichcontribute to this result. (1) The GC image is non-
redundant removing the need for any disambiguation.
(2) The GC image is continuous which simplifies vi-
sually tracking moving objects. (3) The layout of thecomprehensive GC image is natural for counting. The
layout allows the subject to simply read the image left
to right counting along the way. (4) The more efficient
usage of screen space (from the lack of redundancy) re-
sults in objects with large screen footprints. This mightmake objects easier to find and identify.
5.3 Path Matching
When shown a PPC animation subjects correctly iden-tified the path followed in the animation 66.7% of times,
compared to 69.8% of times when the animation was
rendered with a portal-based GC. Using the PPC per-
formance as our null hypothesis, the GC was shown
to perform identically (p-value 0.035). All paths hadfive 90 turns. Using only subjects who participated in
3 sessions, PPC performance was 60.8%, 72.0%, and
78.4% for sessions 1, 2, and 3, respectively; the perfor-
mance for GC was 64.0%, 73.6%, and 76.0% (p-values0.055, 0.073, and 0.071). The similar performance num-
bers indicate that the additional viewpoints integrated
into the GC image do not disturb the users ability to
detect and count turns and to a lesser extent, estimate
the distance traveled in a straight line.
5 s. 20 s. 4 obj. 5 obj. 7 obj.PPC 41.3% 56.5% 65.8% 49.0% 41.1%GC 84.7% 90.8% 98.9% 94.4% 82.5%
Table 2 Accuracy counting stationary objects for differentexposure times (left) and number of objects (right). All re-sults showed statistical significance (p-value < 0.001) withthe PPC performance as the null hypothesis.

An Evaluation of an MPI Framework 9
Stationary Objects Moving ObjectsPPC GC PPC GC
Session #1 38.8% 89.6% 39.6% 90.8%Session #2 50.4% 98.4% 46.0% 98.0%Session #3 58.4% 98.4% 47.6% 95.6%
Table 3 Accuracy in counting objects for subjects partici-pating in 3 testing sessions. All results showed statistical sig-nificance (p-value < 0.001) with the PPC performance as thenull hypothesis.
5.4 Subject Survey
At the conclusion of testing, subjects were surveyed for
their opinion on whether the PPC or GC was easier
to use for the tasks described. They were asked to re-spond on a scale of 1 to 5, with the PPC marked as 1,
the GC marked as 5, and 3 marked as about the same.
The results of the survey align well with the perfor-
mance numbers collected. For object finding, the aver-age response was 4.5, making GC the strongly preferred
method. For object counting, the average was 4.98 (1
subject selected 4, all others selected 5) making GC
the clear standout. The results for the path matching
were more balanced but slightly favoring the PPC at2.7 probably indicating a higher comfort level with the
familiar PPC images.
6 Conclusions and Future Work
Our study shows that a visualization which integrate
multiple viewpoints into continuous and non-redundant
images can bring substantial benefits in the context of
certain tasks. Even though multiperspective images aredifferent from the images acquired by the human vi-
sual system, benefits were recorded from the beginning,
without any training.
We have presented a first study of the effectivenessof MPI visualization that was conducted, as it should
have, at a fundamental level, in the context of basic user
tasks performed in an abstract maze. The maze serves
as a versatile test-bed where occlusion complexity can
be controlled and its effects can be investigated, and notas an exact replica of a real-world scenario. Whereas one
could easily count the objects in our maze from an over-
head view, the more important point is that the maze
allows investigating scenarios where such a view is notavailable or not known, or where disambiguation of ob-
jects of interest cannot be done from an overhead view
but rather requires viewing the objects transversally.
Future work will build upon these first results toinvestigate MPI benefits in the context of actual appli-
cations in domains such as security, situational aware-
ness, and scientific visualization (e.g. visualization of a
finite element analysis of building response under earth-
quake load in structural engineering where one has to
see multiple structural columns simultaneously). These
more complex 3-D datasets are supported by the MPI
framework as GC construction is not limited to rectan-gular shaped portals and straight corridors, but instead
it can support irregular shaped occluders and curved
corridors and spaces [9] in both virtual and real-world
environments.MPI techniques, including the GC, work by map-
ping occluded data subsets to disjoint image locations
and thus they scale well with occlusion complexity as
long as there is sufficient screen real estate to visualize
the visible and occluded data subsets simultaneously atadequate resolution. As the complexity of the dataset
and therefore of the GC image increase, another possi-
ble bottleneck that needs to be investigated and quan-
tified is the user’s limited ability to assimilate visualinformation in parallel. A comprehensive visualization
is only useful if the user can benefit of the entire image
at once. Another possibility is to use the MPI image as a
panorama examined sequentially, by navigating within
the image as opposed to within the 3-D dataset itself,akin to the panoramas used in cel rendering [42].
Combining MPI with other techniques, such as trans-
parency, presents another avenue of future study. Trans-
parency can be valuable for occlusions where no directaccess is available to occluded components, an engine
for example. Combining this power with the GC’s abil-
ity to address larger-scale occlusion would further im-
prove the comprehensiveness of images.
MPI overcomes occlusions by introducing distortions.The perceptual effect of such distortions is a significant
unknown that we have only begun to explore. For tasks
where a global spatial understanding of the 3-D dataset
is required, no MPI approach may ever be acceptable.For other tasks MPI visualization might be clearly pre-
ferred. One of the advantages of the graph camera MPI
framework employed in this study is its flexibility. We
do not advocate for a specific type of MPI visualization.
Instead, we advocate for camera model design, a visual-ization paradigm that abandons the traditional rigidity
of the camera model in favor of designing the camera
according to the application needs, and optimizing it
dynamically according to the dataset and current userlocation.
Acknowledgements We would like to thank Chris Hoff-mann and Jian Cui for their valuable insights and assistancein completing this project. Portions of this work were sup-ported by Purdue University’s PLM Center of Excellence.This work was also funded in part by the DoE VACET pro-gram and the NIH/NCRR Center for Integrative BiomedicalComputing, P41-RR12553-10.

10 Paul Rosen, Voicu Popescu
References
1. Agrawala, M., Zorin, D., Munzner, T.: Artistic multipro-jection rendering. In: Rendering Techniques 2000, pp.125–136 (2000)
2. Bares, W.H., Lester, J.C.: Intelligent multi-shot visual-ization interfaces for dynamic 3D worlds. In: IUI ’99, pp.119–126 (1999)
3. Bavoil, L., Callahan, S.P., Scheidegger, C.E., Vo, H.T.,Crossno, P.J., Silva, C.T., Freire, J.: Vistrails: Enablinginteractive multiple-view visualizations. VIS ’05 p. 18(2005)
4. Brosz, J., Samavati, F.F., Sheelagh, M.T.C., Sousa, M.C.:Single camera flexible projection. In: NPAR ’07, pp. 33–42 (2007)
5. Bruckner, S., Groller, M.E.: Exploded views for volumedata. IEEE TVCG 12(5), 1077–1084 (2006)
6. Burns, M., Finkelstein, A.: Adaptive cutaways for com-prehensible rendering of polygonal scenes. In: SIG-GRAPH Asia 2008 Papers, pp. 1–7 (2008)
7. Carpendale, M., Cowperthwaite, D., Fracchia, F.: Ex-tending distortion viewing from 2D to 3D. IEEE Com-puter Graphics and Applications 17(4), 42 –51 (1997)
8. Coleman, P., Singh, K.: Ryan: rendering your animationnonlinearly projected. In: NPAR ’04, pp. 129–156 (2004)
9. Cui, J., Rosen, P., Popescu, V., Hoffmann, C.: A curvedray camera for handling occlusions through continuousmultiperspective visualization. Visualization and Com-puter Graphics, IEEE Transactions on 16(6), 1235 –1242(2010)
10. Darken, R.P., Sibert, J.L.: Wayfinding strategies and be-haviors in large virtual worlds. In: CHI ’96, pp. 142–149(1996)
11. Degener, P., Schnabel, R., Schwartz, C., Klein, R.: Ef-fective visualization of short routes. IEEE TVCG 14,1452–1458 (2008)
12. Diepstraten, J., Weiskopf, D., Ertl, T.: Transparency ininteractive technical illustrations. Computer GraphicsForum 21 (2002)
13. Diepstraten, J., Weiskopf, D., Ertl, T.: Interactive cut-away illustrations. In: Proceedings of Eurographics 2003,Computer Graphics Forum, pp. 523–532 (2003)
14. Elmqvist, N., Tsigas, P.: A taxonomy of 3D occlusionmanagement for visualization. IEEE TVCG 14(5), 1095–1109 (2008)
15. Elmqvist, N., Tudoreanu, M.E., Tsigas, P.: Evaluatingmotion constraints for 3D wayfinding in immersive anddesktop virtual environments. In: CHI ’08, pp. 1769–1778(2008)
16. Fitzmaurice, G., Matejka, J., Mordatch, I., Khan, A.,Kurtenbach, G.: Safe 3D navigation. In: I3D ’08, pp.7–15 (2008)
17. Hachet, M., Decle, F., Knodel, S., Guitton, P.: Navidgetfor easy 3D camera positioning from 2D inputs. 3D UserInterfaces pp. 83–89 (2008)
18. Hanson, A.J., Wernert, E.A.: Constrained 3D navigationwith 2D controllers. In: VIS ’97, p. 175ff (1997)
19. Huang, J., Carter, M.B.: Interactive transparency render-ing for large CAD models. IEEE TVCG 11(5), 584–595(2005)
20. Jankun-Kelly, T., Ma, K.L.: Visualization explorationand encapsulation via a spreadsheet-like interface. IEEETVCG 7(3), 275–287 (2001)
21. Khan, A., Komalo, B., Stam, J., Fitzmaurice, G., Kurten-bach, G.: Hovercam: Interactive 3D navigation for prox-imal object inspection. In: I3D ’05, pp. 73–80 (2005)
22. Klein, A.W., Sloan, P.P.J., Finkelstein, A., Cohen, M.F.:Stylized video cubes. In: SCA ’02, pp. 15–22 (2002)
23. Knodel, S., Hachet, M., Guitton, P.: Navidget for im-mersive virtual environments. In: VRST ’08, pp. 47–50.ACM, New York, NY, USA (2008)
24. Kreuseler, M., Nocke, T., Schumann, H.: A history mech-anism for visual data mining. In: INFOVIS ’04, pp. 49–56(2004)
25. Levoy, M.: Spreadsheets for images. In: SIGGRAPH ’94,pp. 139–146 (1994)
26. Li, W., Agrawala, M., Curless, B., Salesin, D.: Auto-mated generation of interactive 3D exploded view dia-grams. ACM Transactions on Graphics 27(3), 1–7 (2008)
27. Li, W., Ritter, L., Agrawala, M., Curless, B., Salesin, D.:Interactive cutaway illustrations of complex 3D models.In: SIGGRAPH ’07, p. 31 (2007)
28. McCrae, J., Mordatch, I., Glueck, M., Khan, A.: Multi-scale 3D navigation. In: I3D ’09, pp. 7–14 (2009)
29. Mei, C., Popescu, V., Sacks, E.: The occlusion camera. In:Proceedings of Eurographics 2005, Computer GraphicsForum, vol. 24, pp. 139–143 (2005)
30. Mine, M.R., Brooks Jr., F.P., Sequin, C.H.: Movingobjects in space: Exploiting proprioception in virtual-environment interaction. In: SIGGRAPH ’97, pp. 19–26(1997)
31. Plumlee, M., Ware, C.: An evaluation of methods for link-ing 3D views. In: I3D ’03, pp. 193–201 (2003)
32. Popescu, V., Rosen, P., Adamo-Villani, N.: The graphcamera. ACM Trans. Graph. 28, 158:1–158:8 (2009)
33. Qu, H., Wang, H., Cui, W., Wu, Y., Chan, M.Y.: Fo-cus+context route zooming and information overlay in3D urban environments. IEEE TVCG 15, 1547–1554(2009)
34. Rademacher, P., Bishop, G.: Multiple-center-of-projection images. In: SIGGRAPH ’98, pp. 199–206(1998)
35. Roberts, J.C.: Multiple-view and multiform visualization.In: Proceedings of SPIE Visual Data Exploration andAnalysis VII, vol. 3960, pp. 176–185 (2000)
36. Roman, A., Garg, G., Levoy, M.: Interactive designof multi-perspective images for visualizing urban land-scapes. In: VIS ’04, pp. 537–544 (2004)
37. Roman, A., Lensch, H.P.A.: Automatic multiperspectiveimages. In: Rendering Techniques 2006: Proceedings ofthe Eurographics Symposium on Rendering, pp. 161–171(2006)
38. Shin, M.C., Tsap, L.V., Goldgof, D.B.: Towards percep-tual interface for visualization navigation of large datasets. In: CVPRW ’03, vol. 5, pp. 48–48 (2003)
39. Skopik, A., Gutwin, C.: Improving revisitation in fisheyeviews with visit wear. In: CHI ’05, pp. 771–780 (2005)
40. Steed, A.: Efficient navigation around complex virtualenvironments. In: VRST ’97, pp. 173–180 (1997)
41. Tan, D.S., Robertson, G.G., Czerwinski, M.: Exploring3D navigation: Combining speed-coupled flying with or-biting. In: CHI ’01, pp. 418–425 (2001)
42. Wood, D.N., Finkelstein, A., Hughes, J.F., Thayer, C.E.,Salesin, D.H.: Multiperspective panoramas for cel anima-tion. In: SIGGRAPH ’97, pp. 243–250 (1997)
43. Yu, J., McMillan, L.: A framework for multiperspectiverendering. In: Rendering Techniques 2004: Proceedingsof the 15th Eurographics Workshop on Rendering Tech-niques, pp. 61–68 (2004)
44. Yu, J., McMillan, L.: General linear cameras. In: ECCV’04: The 8th European Conference on Computer Vision,vol. 2, pp. 14–27 (2004)