an evaluation of california’s inferred birth statistics ... birth statistics for ... an evaluation...
TRANSCRIPT

I
I
An Evaluationof California’sinferred BirthStatistics forUnmarried WomenThe quality and reliability of birth statistics
for unmarried women based on inferential
data are evaluated in this methodological
study.
Data Evaluation and MethodsResearch
Series 2, No. 97
DHHS Publication No. (PHS) 85-1371
U.S. Department of Health and Human
Services
Public Health Service
National Center for Health Statistics
Hyattsville, Md.
April 1985

Copyright Information
All material appearing in this report is in the public domain and may bereproduced or copied without permission; citation as to source, however, isappreciated.
Slsggaatedstation
National Center for Health Statistics, B. Berkov: An evaluation of California’sirrferred birIh statistics for unmarried women. Vita/ and Haalth Statistics. Series2, No. 97. DHHS Pub. No. (PHS) 85-1371. Public Health Sewice. Washington.U.S. Government Printing Office, Apr. 19S5.
Libraryof Cwgraae Catd@ng in PubfiMion Data
Berkov, Beth.An evaluation of California’s inferred birth statistics for unmarried women.
(Vkal and health statistics, Series 2, Data evaluation and methods research;no. 97) (DHHS publication; no. (PHS) 85-1371)
Authoc Seth %t’kOV.
Bibliography: p.Supt. of Dote. no.: HE 20.6209:2/971. Childbirtt+Califomia-Statistics. 2. Fettilify, Human-California—
Statistics. 3. Birth certiites-Cetifornia. 4. lllegitim~alifornie-Statistics.L National Center for Health Statiiice (U. S.) Il. Title. Ill. Series, IV, Series:
DHHS publicafii; no. (PHS) S5-1371. [DNLM: 1. Birth Certificates. 2. BirthRata-statistics. 3. Date Cotlection+n ethods. 4. Iltegiimacy+atietica.W2 A N148vb no. 97]RA409.U45 no. 97 312.0723 S 84-600349[HB935.C2] [304.63]ISBN 0-S408-0308-1

National Center for Health Statistics
Manning FeinIeib, M. D., Dr.P.H., Director
Robert A. Israel, Deputy Director
Jacob J. Feldman, Ph.D., Associate Director for Analysis and
Epidemiology
Garrie J. Losee, Associate Director for Data Processing and
Services
Alvan O. Zarate, Ph. D., Assistant Director for International
Statistics
E. Earl Bryant, Associate Director for Interview and Examination
Statistics
Robert L. Quave, Acting Associate Director for Management
Gail F. Fisher, Ph. D., Associate Director for Program Planning,Evaluation, and Coordination
Monroe G. Sirken, Ph. D., Associate Director for Research and
Methodology
Peter L. Hurley, Associate Director for Vital and Health Care
Statistics
Alice Haywood, Information 0jj7cer
Viii and HealthCare StatisticsProgram
Peter L. Hurley, Associate Director
Gloria Kapantais, Assistant to the Director for Data Policy,
Planning, and Analysis
Iwsion of vi StatisticsJohn E. Patterson, Director
James A. Weed, Ph. D., Deputy Director
Robert L. Heuser, M. A., Chiej Natality Statistics Branch
Joseph D. Farrell, Chie$ Computer Applications Staff
Mabel G. Smith, Chiefj Statistical Resources Branch

Acknowledgments
This report is a summary of an evaluation study that wasconducted by the California Department of Health Servicesunder a contract with the U.S. Department of Health andHuman Services (Contract No. 233-79-2066). The project staffconsisted OE
Beth Berkov, Research Analyst and Project DirectorCaren Ginsburg, Graduate Student AssistantLorraine E. Helms, Graduate Student AssistantBertha Mo, Graduate Student Assistant
Consultants to the project were Kingsley Davis, SeniorResearch Fellow, Hoover Institution, Stanford University, andDistinguished Professor of Sociology, University of SouthernCalifornia, and Oliver K. Wan, Staff Scientist, LawrenceBerkeley Laboratory, University of California.
The study was made possible by the cooperation and assist-ance of hospitals and local health departments in California, ofState vital statistics offices in many parts of the country, and of
the National Center for Health Statistics. The following peoplemade particular contributions:
Santa Clara County Health DepartmentLouise B. Detwiler, Chief, Records and Statistics
California Department of Health ServicesFrank Norris, Chief, Health Status Research SectionCenter for Health Statistics
Irvin E. Rautenberg, AdministratorMaternal and Child Health Branch
Merle Shields, ChiefVital Statistics Branch
Roger Smith, Assistant ChiefVital Statistics Branch
MlchikoTashiro, Research AnalystCenter for Health Statistics

Contents
Acknowledgments . . . . . . . . . . . . . . . . . . . . . . . . . . . . . . . . . . . . . . . . . . . . . . . . . . ...m
Introductionandsummary . . . . . . . . . . . . . . . . . . . . . . . . . . . . . . . . . . . . . . . .. -....1Background . . . . . . . . . . . . . . . . . . . . . . . . . . . . . . . . ’. . . . . . . . . . . . ..-.--..1Purposeofthisstudy . . . . . . . . . . . . . . . . . . . . . . . . . . . . . . . . . . . . . . . . . . . . . . ...2Summaryofmethodsandfindings . . . . . . . . . . . . . . . . . . . . . . . . . . . . . . . . . . . . . . . . . 2
Comparisonofhospitrdandbirthcertificateinformation . . . . . . . . . . . . . . . . . . . . . . . . . . . . . . . . 3Methodsandsources . . . . . . . . . . . . . . . . . . . . . . . . . . . . . . . . . . . . . . . . . . . . ...-3Findingsofthecross-checkwithhospitaldata . . . . . . . . . . . . . . . . . . . . . . . . . . . . . . . . . . . 4Inferential criteria applied tomothers of Hkpanic origin . . . . . . . . . . . . . . . . . . . . . . . . . . . . . . 6
Comparison of California birth data forunmarried women with data forother States . . . . . . . . . . . . . . . . . . 7Methods and sources .’....... . . . . . . . . . . . . . . . . . . . . . . . . . . . . . . . . . . . . . . ..7Previous evaluations based on interstate comparisons . . . . . . . . . . . . . . . . . . . . . . . . . . . . . . . . 7Interstate comparisons updated through 1979 . . . . . . . . . . . . . . . . . . . . . . . . 8Nonmarital birth rates, 1970and 1979 ...;II:l;II;lI1........ . . . . . . . . . . . . . . . . 9
Review ofrepresentative samples of birth certificates . . . . . . . . . . . . . . . . . . . . . . . . . . . . . . . . . 10Methods and sources . . . . . . . . . . . . . . . . . . . . . . . . . . . . . . . . . . . . . . . . . . . . . . . . 10Findings ofreview of birth certificate samples . . . . . . . . . . . . . . . . . . . . . . . . . . . . . . . . . ..10Cross-check with marriage records. . . . . . . . . . . . . . . . . . . . . . . . . . . . . . . . . . . . . . . . . 10
Conclusion . . . . . . . . . . . . . . . . . . . . . . . . . . . . . . . . . . . . . . . . . . . . . . . . . . . . . .12
References . . . . . . . . . . . . . . . . . . . . . . . . . . . . . . . . . . . . . . . . . . . . . . . . . . ....13
Listofdetailed tables . . . . . . . . . . . . . . . . . . . . . . . . . . . . . . . . . . . . . . . . . . . . . ...15
Appendixes . . . . . . . . . . . . . . . . . . . . . . . . . . . . . . . . . . . . . . . . . . . . . . . . . . ...25
t-kit of text figures
1. Percent of births tounmarried women for study hospitals, bysource ofdataand method of estimation . . . . . . 52. Estimated birth rates for unmarried women: California and 5 selected reporting States in the West, selected years,
1965-79 . . . . . . . . . . . . . . . . . . . . . . . . . . . . . . . . . . . . . . . . . . . . . . . . . . . . . 8
List of text tables
A. Number and percent distribution of study births by hospital classification, according to inferential classification: 8hospitals in Santa Clara County, February-July, 1980 ..................... . . . . . . . . . 5
B, Estimated number, rate, and ratio of births to unmarried women in 1979 and percent change between 1975 and1979, by race of mother and State: California and 5 selected reporting States in the West . . . . . . . . . . . . . . 9
v

Symbols
--- Data not available
. . . Category not applicable
Quantity zero
0.0 Quantity more than zero but less than0.05
z Quantity more than zero but less than500 where numbers are rounded tothousands
* Figure does not meet standards ofreliability or precision
vi
—

by Beth Berkov, California Department of Health Services
Background
National estimates of births to unmarried women, or non- marital births, have been prepared since 1938 as part of the basic vital statistics program of the United States. The data have limi- tations and reflect problems in collecting information about a sensitive subject. Nevertheless, the information continues to be in strong demand and widely used. It sheds light on important social and demographic changes, some of which are unpre- cedented in the United States; it makes possible the study of cer- tain consequences of the changes, and it provides a measure of the need for social and health services. l-3 Experience has shown that statistics on nonmarital births can be compiled from birth certificates at the same time that safeguards effectively protect the privacy and interests of the children and parents involved.
The National Center for Health Statistics (NCHS) recently changed its method for making national estimates of nonmarital births. Beginning with 1980 data, the estimates incorporate in- ferentially derived data from nine States that do not ask a marital status question on the birth certificate (nonreporting States)P In 1980 these States were California, Connecticut, Maryland, Michigan, Montana, Nevada, New York, Ohio, and Texas. This approach is a major departure from the method used before 1980, which was based only on data from States with a marital status question on the birth certificate (reporting States), and which assumed that these States represented entire geographic divisions. That is, the nonreporting States were assumed to have the same proportion of births to unmarried women as the report- ing States in a geographic division.
Inferential methods are used to produce data on births to un- married women in nonreporting States. They are generally based on a comparison of the surname given to the child with the surnames reported for the parents, supplemented in some States with information from hospitals or with paternity state- ments when available. There is considerable variation among the nonreporting States in the specific inferential criteria used. This variation occurs because nonreporting States differ among themselves and from the reporting States in the extent to which there is restriction on unmarried mothers either naming a father on the birth certificate or giving his surname to the child.
NOTE: Stephanie Ventura, in the Division of Vital to the preparation of this report. Peer review was Harris, Office of Research and Methodology.
Statistics, contributed provided by Kenneth
The recent NCHS decision to use inferential data in making national estimates introduces certain problems of comparability due to the varying criteria employed. However, it has the advan- tage that it eliminates bias stemming from the assumption of similarity between reporting and nonreporting States ?y6 Since 1965, about one-third of the Nation’s births have occurred in nonreporting States. It was not feasible for NCHS to include in- ferred data from these States in national estimates prior to 1980. Had this been done, however, the result would have been higher estimates of nonmarital births to white women and somewhat different trends, particularly in the early 1970’s, when legal abortion was more readily accessible in nonreporting than in re- porting States ?*
Although the overall extent of nonreporting has remained about the same, there has been a recent shift in the reporting status of specific States. (See appendix I.) In 1978, NCHS changed the question on the U.S. Standard Certificate of Live Birth from “Legitimate (yes or no)” to “Is mother married? (yes or no).” It was hoped that the change in terminology would result in increased reporting. By 1980, five previously nonreporting States (Georgia, Idaho, Mas- sachusetts, New Mexico, and Vermont) did add a marital status question to the birth certificate. However, two large States (Michigan and Texas) dropped the legitimacy question and did not substitute a question on marital status. As a result, the proportion of all births occurring in nonreporting States remained at the relatively high level of about one-third.
California’s birth certificate has not included a legitmacy or marital status question since 19 18 l However, various county health departments developed inferential methods in the 1950’s, and an inferential method has been applied on a statewide basis since 1966. (See appendix II.) The classifica- tion of California births into marital and nonmarital categories has been the basis for important and widely used findings?
Because the inferential criteria developed in California are based on relatively liberal regulations for the child’s surname and for listing the father’s surname, there has been continuing concern that the data might overestimate nonrnarital births. This possibility was investigated in several earlier studies. These studies showed with reasonable certainty that the California data had remained valid through 1975 but that validity in subsequent years could not be assumed because of the possibility of changing practices in reporting information on birth certificates. lo
Purpose of this stu
With the decision to incorporate inferential data into official national estimates, it became particularly important to know what happened to the California data after 1975. Nonmarital birth rates are relatively high in California. The State total of 86,142 nonmarital births in 1980 was 13 percent of all nonrnarital births occurring nationally and 33 percent of the Nation’s nonmarital births identified by an inferential method.
Overestimation is suspected and continuing study of the California data is necessary because the State inferential method cannot avoid heavy dependence on the way the mother signed the birth certificate as informant for the record. Since 1945, a California Attorney General’s opinion has been in effect that an unmarried mother may give any surname she wishes to her child. In addition, unlike many States, California makes no effort to prevent an unmarried mother from naming the father of the child; consequently, name of father is withheld on relatively few birth certificates filed in the State. Most unmarried mothers identify a father on the birth record and give his surname to the child with the only indication that the birth may be out-of-wedlock being the surname signed by the mother. It is possible that married mothers’ use of their maiden surnames in signing birth certificates will increase substantially. If so, overestimation of nonmarital births will result. Although such overestimation had not occurred through 1975, the possibility of its subsequent development was the major consideration of this study. Because overestimation is more likely in California than elsewhere as a result of the nonrestrictive inferential method used, continued ruling out of overestimation for California gives reasonable assurance that the same is true for inferential data from other States.
Summary of methods and findings
Three main methods were used to test the- inferred data for California in this and in previous evaluation studies. They are as follows: (1) Comparison with data derived from hospital records; (2) comparison with data obtained from other States in the West in which a marital status question is included on the birth certificate; and (3) review of representa- tive samples of birth certificates consisting of detailed recoding and some followup of the information used to infer marital status. Overestimation was not detected through any of these methods.
In this study, the main source of false positives (births
erroneously inferred nonmarital) was the signing of maiden surnames by married mothers. However, all indications were that the net effect of false positives on incidence estimates was approximately zero, because they were balanced by an approximately equal number of false negatives (nonmarital births missed by the inferential criteria).
Three findings of the present study give particularly strong evidence of the continued accuracy of the data:
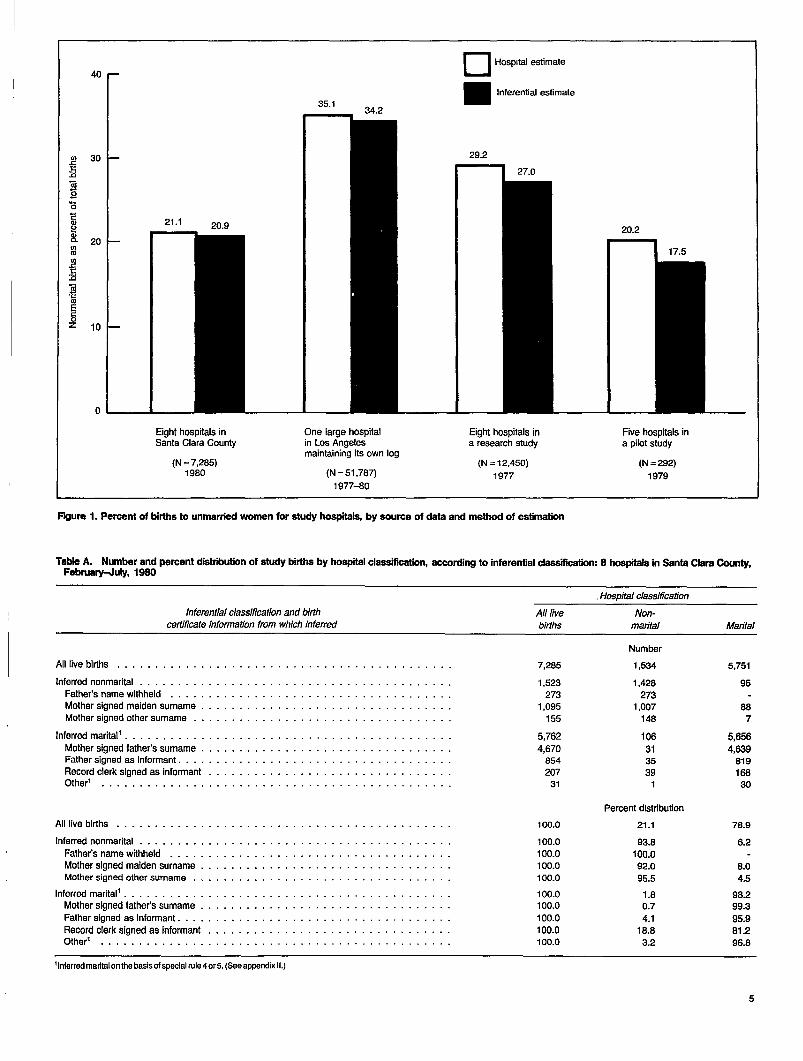
1. In one county of the State where detailed data were obtained permitting comparison of hospital and inferential classifica- tions, the inferential method classified as nonmarital 93.1 percent of the 1,534 births identified to be nonmarital by the hospital. False positives amounted to 95 births erroneously inferred nonmarital, but these were balanced by 106 false negatives.
2. Between 1975 and 1979, all measures of nonmarital births (numbers, ratios, and estimated rates) showed less increase in California, where the data were inferred, than in five States in the West where data came from explicit marital status questions (Arizona, Colorado, Hawaii, Oregon, and Washington). In other words, the concern that the inferential method would result in overestimation of nonmarital births in California was not sustained.
3. Marriage records in which the bride and groom matched the mother and father were not located for any of a sample of 57 births inferred nonmarital. In sharp contrast, such marriage records were located for half of a control sample of births inferred marital. (The marriage record search was made in a central file which did not include records of marriages occurring outside California or a relatively large group of “nonlicensed” marriages .)
Because of the nature of inferential methods, questions of validity will always arise. The inferred data for California have been evaluated to an unusual extent, more so than data collected by direct report. The evaluations have shown repeatedly that the data were accurate. Increases in the use of maiden surnames by married mothers or other changes in reporting practices may to some extent invalidate the data collected by the inferential method in the future. This should not, however, be assumed to be the case without careful analysis. What has been learned from the studies in California is that a priori doubts regarding the validity of the inferential method were not warranted.

Comparison of hospitaland birth certificateinformation
Methods and sources
One method of evaluation found practical in earlier studieswas the comparison of birth statistics for unmarried womencompiled from hospital sources with the same statistics com-piled from birth certificates by the inferential method. The ap-proach was practical because many hospitals preparechronological lists, or logs, of deliveries on a current routinebttsis. For various reasons, including the fact that special ser-vices may be required or that special precautions maybe takento avoid newspaper or other public announcement of the birth,an indication that the birth is nonmarital may be part of the infor-mation logged. If the log includes this information, nonmaritalbirths can be counted and hospital statistics compiled withoutthe costly abstracting of medical records. Compilation of datafrom hospital logs requires considerable time, which limits thenumber of hospitals that can be studied. The time is requiredmainIy to determine which hospitals maintain usable logs andto obtain necessary approvals for research access to the logswhen summary data are not regularly co~piled by the hospitalfor its own purposes. Using data from logs, cross-checks weremade for six hospitals in various parts of the State in previousevaluation studies.
In the present evaluation study, cross-check data were ob-tained for a larger number of hospitals. To minimize the extentto which individual hospital records would need to beexamined, an effort was made to locate research or heaIth de-partment projects for which the necessary information had al-ready been compiled for other purposes.
Using both information from logs and data from othersources, it was possible to obtain information from 23 hospitals.Nine hospitals constituted almost all the hospitrds doing de-liveries in Santa Clara County; the other 14hospitals were-scat-tered throughout the State. Data for various years from 1977through 1980 were obtained. Over 7,000 births within SantaClara County and over 50,000 births outside Santa ClaraCounty were included. The nearly complete coverage of the onecounty substantially improved the study results.
Data for the 23 hospitals were derived from differentsources, One problem arising from the use of variously derivedinformation regards the definition of nonmarital birth. The de-finition of nonmarital birth intended and approximated by theCalifornia inferential method is one for which the biologic par-ents of the child are not married to each other.
It frequently was not clear whether hospital information onmarital status, particularly data from admission records ratherthan logs, corresponded to that definition. Interviews conducted
with hospital staff indicated that information obtained from logsor personal interviews probably was closer to a definition basedon biologic parentage than information abstracted from medicalrecords was. Hospital staff reported that there was considerableopenness about childbearing outside marriage and that much ofthe information used in current logs had been volunteered by themothers. The admission form, which frequently is the onlysource of marital status information in the medical record, mayreflect legal marital status and not be consistent with the infor-mation on biologic parentage obtained by staff having closercontact with the mother on the delivery service. It should benoted, however, that legal marital status is the informationsought by the marital status question in reporting States. Noevaluation has been made of the accuracy of reporting of maritalstatus on any reporting form, either in this study of inferred mar-ital status data or in other studies of births by maritat status.
1
The sources of data for the 23 hospitals are as follows.
Nine hospitals in Santa Clara County. The Santa ClaraCounty Health Department enlisted the cooperation of localhospitals for the study period from February through July1980. The Department obtained information derived fromhospital logs (some specially kept for this study) for 9 of the11hospitals providing delivery services in the county.
The local health department compiled detailed statistics for8 of the 9 participating hospitals by coding both hospital andbirth certificate information. These 8 hospitals accounted for71 percent of all births and 83 percent of nonmarital birthsoccurring in the county in 1980. The data on race and Mexi-can origin in table 1 show the general similarity betweenbirths in these hospitals and all births in California.
The other participating hospital, which accounted for 3 per-cent of all births and 4 percent of nonmarital births in thecounty in 1980, compiled its own summary data. Detaileddata are not available for that hospital, and therefore it is notincluded in some of the analysis.
The two hospitals not included in the study had relatively lowproportions of nonmarital births (table 1). One of these hos-pitals chose not to participate in the study. The other hospitalchose to participate but, due Iygely to reorganization andstaff turnover, found it impossible to be accurate andconsistent in providing the necessary information.
It should be noted that all hospitals in Santa Clara Countywere given a full description of the purposes and scope of thestudy and understood how the information was to be used.It was understood that the data were to be compiled for only
3

a limited period in the first part of 1980, that identifiable in-formation for individuals would be used only to compilestatistics, and that individual information obtained for thestudy would be destroyed as soon as the study report wascompleted.
2. One large public hospital in Los Angeles. For many years,this hospital has maintained a delivery log from which thehospital compiles data on nonmarital births. This informa-tion was used in earlier evacuation studies and has provideda continuing check on the possibility of breakdown in theinferential method.
Data compiled by the hospital are not available by race orother characteristics. However, State-compiled data showthat about 90 percent of births in the hospital are to womenwho report themselves on the birth certificate to be ofMexican, Mexican-American, orotherHispanic origin.
3. Eight hospitals in a research study. A study of the effects ofabortion on the outcome of subsequent pregnancies was con-ducted by staff in the California Department of Health Ser-vices.]] Data were obtained both by interviewing women inthe hospital (76 percent of study subjects) and by abstractingmedical records when personal interviews were not possible(24 percent of study subjects). Marital status, one item of in-formation collected in the study, was specifically defined interms of whether the biologic parents were married to eachother.
Only women terminating first and second pregnancies byeither live birth or spontaneous fetal death were included inthe study. To obtain statistics comparable to State data infer-red from other items on the birth certificate, special tabula-tions were obtained for the 12,450 study subjects who deliv-ered a first or second live birth in one of eight hospitals in1977.
A total of 18,426 first and second live births occurred in theeight hospitals during the study period, but only 12,450 werestudied. This loss of eligible study subjects was due exclu-sively to workload limits. (Only one interviewer-abstracterwas employed in each hospital.) No other selective processesare known to have influenced the inclusion or exclusion ofstudy subjects in the eight hospitals.
Five hospitals in a pilot study. Medical records wereabstracted for small numbers of births occurring in eight hos-pitals in different parts of the State during 1979. Pilot studydata were used only for the five hospitals from which datahad not already been obtained through either the Santa ClaraCounty study or the study of the effects of abortion on sub-sequent pregnancy outcomes.
The pilot study was carried out by the Center for HealthStatistics, California Department of Health Services. It wasthe exploratory stage of a subsequent study to evaluate medi-cal information reported on California birth certificates.Study data were collected 1 year or more after the birth oc-curred and were derived entirely from medical records.
Findings of the cross-check with hospitsldats
The findings for the 23 hospitals supported the conclusionthat, from 1975 through 1980, the inferential method appliedin California remained valid and dld not result in overestimationof nonmaritrd births. Regardless of whether the data came fromthe relatively complete inclusion of hospitals in Santa ClaraCounty or from one of the hospitals in a different part of theState, there was close agreement between hospital estimates andinferentially derived estimates.
The findings for the hospitals grouped according to thesource from which the hospital data were obtained are sum-marized in figure 1, and the findings for each hospital are shownin tables 2 and 3. For 18 hospitals, the percent nonmarital fromthe hospital source was equal to or higher than the estimate in-ferred by county coding from birth certificates (or State codingin the case of hospital 9). For five hospitals the relationship wasreversed, with the hospital estimate being somewhat lower thanthe inferential estimate.
The close agrqement in overall estimates by hospital re-flected a high level of agreement in the classification of indi-vidual cases. Detailed data available for eight hospitals in SantaClara County showed that among the 7,285 study births, therewas agreement as to marital or nonmarital classification for7,084 births, or97.2 percent (table A).
The hospital classification showed 1,534 of the births in theSanta Clara County study to be nonmarital. The inferentialmethod classified 1,428 of these births, or 93.1 percent, as non-marital. On the assumption that the hospital classification wascorrect, 95 births were considered false positives (marital birthserroneously classified as nonmarital) by the inferential method.The false positives were balanced, however, by 106 false nega-tives (births shown by the hospital as nonmarital but classifiedmarital).
A particular concern in the present study was the extent towhich false positives occurred in the inferred data because ofmarried mothers’ use of maiden surnames in signing birth cer-tificates. In Santa Clara County most of the false positives (88of the 95 cases) were due to this cause. However, the study alsofound that these 88 cases represented only 8 percent of the birthcertificates in which the mother had signed her maiden surname(1,095 births); 92 percent of the birth certificates signed thisway actually were for nonmarital births.
Data in table A show the extent to which each inferentialcriterion correctly identified the mother’s marital status. Themissed nonmarital births (false negatives) came about equallyfrom birth certificates in which either the mother signed thefather’s surname or a record clerk or the father was the infor-mant. In general, the comparison with hospital data confirmedthe accuracy of most inferences about marital status made frombirth certificate information.
Differences were found in the characteristics of false posi-tives and false negatives. The false positive group was morelikely to include white and older mothers (table 4). However,because both error groups were small, the differences had
ulm
40 —
30
20
10
0
21.1 20.9
Eight hospitals inSanta Clara County
(N =7,285)1980
35.1
One large hospitalin Los Angelesmaintaining its own log
(N =51 ,787)1977-60
u Hospital estimate
Inferential estimate
29.2
[1 27.0
20.2
n 17.5
Eight hospitals ina research study
Five hospitals ina pilot study
(N= 12,450)
1977
(N =292)
19791Figure 1. Percent of births to unmarrfed women for study hoapitafq by souroe of date and method of estimation
Tsble A. Number and percent dwtributionof study births by hospital classilkation, eocording to inferentief cfaaaif&60m 8 hoe@afa in Santa Cfsra &runty,February4dy, 1980
IHospital classification
Inferential classification and birth All live Non-certifkate information from which inferred births marital ManYal
Alllive blrfhs . . . . . . . . . . . . . . . . . . . . . . . . . . . . . . . . . . . . . . . . . . . .
Inferred nonmarital . . . . . . . . . . . . . . . . . . . . . . . . . . . . . . . . . . . . . . . . .Falher’s namewithheld . . . . . . . . . . . . . . . . . . . . . . . . . . . . . . . . . . . . .Mother signed maiden surname . . . . . . . . . . . . . . . . . . . . . . . . . . . . . . . . .Mother signed other surname . . . . . . . . . . . . . . . . . . . . . . . . . . . . . . . . . .
Inferred maritali . . . . . . . . . . . . . . . . . . . . . . . . . . . . . . . . . . . . . . . . . . .Mother signed father’s surnam e,..... . . . . . . . . . . . . . . . . . . . . . . . . . . .Father a[gned as informant . . . . . . . . . . . . . . . . . . . . . . . . . . . . . . . . . . . .Record clerk signed asinformant . . . . . . . . . . . . . . . . . . . . . . . . . . . . . . . .Other. . . . . . . . . . . . . . . . . . . . . . . . . . . . . . . . . . . . . . . . . . . . . .
Alllivebidhs . . . . . . . . . . . . . . . . . . . . . . . . . . . . . . . . . . . . . . . . . . . .
Inferred nonmarital . . . . . . . . . . . . . . . . . . . . . . . . . . . . . . . . . . . . . . . . .Father’snamewithheld . . . . . . . . . . . . . . . . . . . . . . . . . . . . . . . . . . . . .Mothersignecfmaidensumame... . . . . . . . . . . . . . . . . . . . . . . . . . . . . . .Mothersignedotheraumame. . . . . . . . . . . . . . . . . . . . . . . . . . . . . . . . . .
Inferrad maritali . . . . . . . . . . . . . . . . . . . . . . . . . . . . . . . . . . . . . . . . . . .Motherslgnedfather’ssurname... . . . . . . . . . . . . . . . . . . . . . . . . . . . . . .Fathersigned asinformant . . . . . . . . . . . . . . . . . . . . . . . . . . . . . . . . . . . .Recordclerksignedasinformant... . . . . . . . . . . . . . . . . . . . . . . . . . . . . .Other. . . . . . . . . . . . . . . . . . . . . . . . . . . . . . . . . . . . . . . . . . . . . .
7,285
1,523273
1,095155
5,7624,670
854207
31
100.0
100.0
100.0100.0i 00.0
100.0100.0
100.0100.0100.0
1,534
1,428273
1,007148
106313539
1
Percent distribution
21.1
93.8100.092.095.5
1.80.74.1
16.83.2
5,751
95
887
5,6564,639
el 9168
30
7e.9
6.2
8.04.5
98.299.395.961.296.6
1Inferredmaritalon the baskof special iule40r5. (SeeappendixIl.)
5
relatively little influence on overall distributions by race andage. Knowledge of the differences will assist in making appro-priate uses and interpretations of the data.
Inferential criteria applied to mothers ofHispanic origin
An increasing proportion of births in California are tomothers of Hispanic origin. In 1980, mothers reporting them-selves as being of Hispanic origin on the birth certificate ac-counted for 29 percent of all births in the State and 36 percentof the nonmarital births. Of the Hispanic-origin mothers, 91percent reported themselves as Mexican or Mexican-American.
Because they account for such a large proportion of non-marital births, a particularly important question is whether theinferential criteria as applied to Hispanic-origin mothers accu-rately separates the married from the unmarried. The cross-check with hospital records provides evidence that the inferen-tial criteria do make a reasonably accurate separation and thatthere are no particular problems in applying the inferentialcriteria to births of Hispanic parentage. Hospital and inferentialestimates of nonmarital births in eight hospitals in Santa ClaraCounty showed close agreement when examined specificallyfor women who reported themselves as Mexican or Mexican-American (table 2). Similar close agreement also was found forthe large public hospital in Los Angeles (hospital A), where 90percent of the births were to women of Mexican, Mexican-American, or other Hispanic origin (table 3).
Additional evidence indicating that there are no majorproblems in applying the inferential criteria to Hispanic womenin California came from a recent interview study with mothersof Mexican origin in Los Angeles County.‘2The study was car-ried out under the direction of Professor David Heer of the Uni-versity of Southern California. Despite study limitations, infor-mation was provided about a number of important, previouslyunmeasured, and difficult-to-measure characteristics of Mexi-can-origin families with new babies. These included the specific
..
marital ties of the parents and the extent to which nonmaritalbirths were to couples living together in consensual unions (thatis, cases in which the mother indicated that she considered thefather to be her spouse, even though they were not legallymarried).
The sampling universe for this study consisted of birth cer-tificates filed in Los Angeles from August 1980 through March1981. Separate samples were taken for mothers born in and out-side the United States. Interviews were conducted in the homeabout 2 months after the birth, in Spanish if appropriate.
The study experienced almost a 50-percent loss from itsoriginal sample of birth certificates. This was due less to refus-als (9.5 percent of the weighted sample) than to various otherproblems, such as mother moved to unknown location, addressnot located, no contact after third attempt, or name never as-signed to interviewer due to time limits or other administrativedifficulties.’3 It does not seem likely that the families lost fromthe sample had more stable marital characteristics than thoseinterviewed.
Of births for which one or both parents were reported ofMexican or Mexican-American origin, it was found that 25 per-cent of the mothers were not legally married to the father. The25 percent comprised 8 percent living in consensual unions, 1percent living with a partner not considered to be a spouse, and16percent with no partner present.’2
The overall 25 percent not legally married in the interviewstudy was almost exactly the same as the inferential estimate ofthe percent nonmarital derived from birth certificates for allmothers in California who reported themselves of Mexican orMexican-American origin in 1980. Although there are differ-ences in definition and coverage between study and State esti-mates, these results do not suggest error in the inferred nonmari-tal birth data for Hispanic mothers. The interview stady illus-trates a type of information about marital ties that is muchneeded as a supplement to the general marital-nonmarital classi-fication of births.

Comparison of California birthdata for unmarried women withdata for other States
Methods and sources
California’s inferred birth data for unmarried women werecompared with data for five States in the West where informa-tion was derived from an explicit birth certificate question(Arizona, Colorado, Hawaii, Oregon, and Washington) andwith other selected States and groups of States. The comparisonwas made using data from an alternate, unofficial set of birthestimates by marital status for States. The data were developedoriginally to study the impact of legal abortion on fertility. Theyincorporate inferred data obtain@ directly from nonreportingStates and reported data compiled either by NCHS or by the re-porting States. Referred to in this report as the “interstate studyl’the data previously included information for the years 1965 and1970-75. They were updated for 1976-79 as part of this study.The purpose was to make the evaluation of California’s data ascurrent as possible and also to obtain national estimates of non-mwital births for the full decade of the 1970’s that would incor-porate inferred data and thus be comparable to the estimatesNCHS now is preparing for the 1980’s.
In this study, three measures of nonmarital childbearingwere used to make comparisons between California and otherStates. They are numbers, ratios (nonmarital births per 1,000total births), and estimated rates (nonmarital births per 1,000unmarried women in specific age groups). Rates were estimatedto avoid the confusion that would result if State trends werecompared using only numbers and ratios, which do not reflectdifferences in population. Denominators for rates were esti-miited using sources and methods that are described briefly inuppendix 111,
Unmarried women are defined in the interstate study aswomen who are single, divorced, widowed, and married butsepamted. This differs from the NCHS definition, in whichseparated women are considered to be married. Reasons for thedifferent definition of unmarried women and its effects on ratesare discussed in detail elsewhere .&sThe difference will not beimportant for comparisons made in this report but should be rec-ognized in any additional use of the data.
Further documentation of methods and sources used in the
interstate study, including discussion of race classification in thebirth data, is given elsewhere?
Previous evaluations based on interstatecomparisons
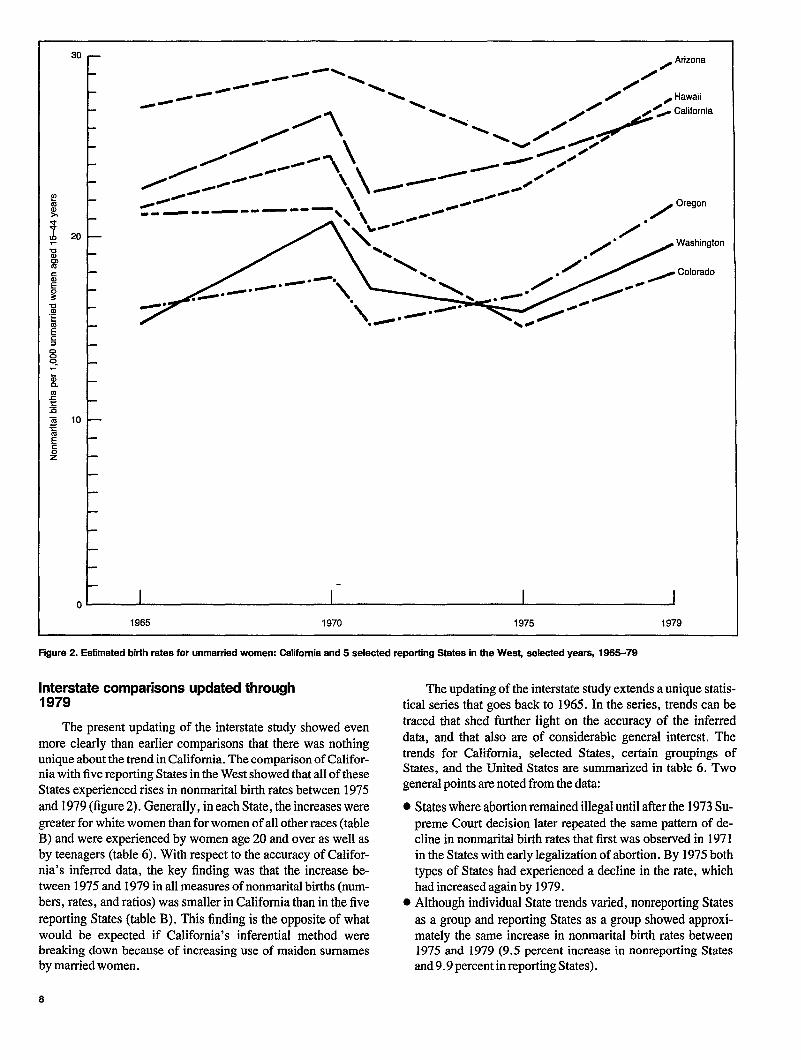
Ever since they first were compiled in the mid- 1960’s, evi-dence of the credibility of California’s inferred nonmarital birthdata has come from comparisons with findings for other Statesand the Nation, and particularly from comparisons with report-ing States in the West (figure 2). Comparisons made for 1970and earlier years demonstrated that a relatively high nonmaritalbirth rate, particularly for white women, was characteristic ofStates in the West, regardless of whether the State data were in-ferred or reported. (Data for 1970are shown in table 5.)
California is one of several States in the West where abor-tion services were legal and widely used by the end of 1970.In 1971, the inferred estimate of nonmarital births for Californiashowed a drop in response to the availability of legal abortionsimilar to that shown in the reported data from Hawaii,Washington, and Oregon (figure 2) and in the inferred data fromNew York, where early legalization of abortion also hadoccurred (table 6).14
California data for 1974 and 1975 were questioned whenthey indicated a rise in nonmarital birth rates for women in agegroups 20-24 and 25–34. The rise among older women in themid-1970’s shown by the California data was of particular con-cern because it, more than an earlier rise among teenagers,might have resulted from an increase in the use of maiden sur-names by married women. Thus it might have been spurious.It became clear that the increase was likely to be real when inter-state data used in an earlier evaluation study showed that a simi-lar pattern of rise had occurred in 1974 and 1975 in the reportingStates of Hawaii, Oregon, and Washington.]o Since 1977, therehas been a rise in the rate of nonmarital births for women aged20-34 years in the United States according to data compiled byNCHS.4>15
0 I I I I1965 1970 1975 1979
Fiiure 2. Estimated birth ratas for unmarried women: California and 5 selected reporting States in the Wes$ selected years, 1965-79
Interstate comparisons updated through1979
The present updating of the interstate study showed evenmore clearly than earlier comparisons that there was nothingunique about the trend in California. The comparison of Califor-nia with five reporting States in the West showed that all of theseStates experienced rises in nonmarital birth rates between 1975and 1979 (figure 2). Generally, in each State, the increases weregreater for white women than for women of all other races (tableB) and were experienced by women age 20 and over as well asby teenagers (table 6). With respect to the accuracy of Califor-nia’s inferred data, the key finding was that the increase be-tween 1975 and 1979 in all measures of nonmarital births (num-bers, rates, and ratios) was smaller in California than in the fivereporting States (table B). This finding is the opposite of whatwould be expected if California’s inferential method werebreaking down because of increasing use of maiden surnamesby married women.
The updating of the interstate study extends a unique statis-tical series that goes back to 1965. In the series, trends can betraced that shed further light on the accuracy of the inferreddata, and that also are of considerable general interest. Thetrends for California, selected States, certain groupings ofStates, and the United States are summarized in table 6. Twogeneral points are noted from the data
● States where abortion remained illegal until after the 1973SU-
preme Court decision later repeated the same pattern of de-cline in nonmarital birth rates that first was observed in 1971in the States with early legalization of abortion. By 1975bothtypes of States had experienced a decline in the rate, whichhad increased again by 1979.
● Although individual State trends varied, nonreporting States
as a group and reporting States as a group showed approxi-mately the same increase in nonmarital birth rates between1975 and 1979 (9.5 percent increase hz nonrepordng Statesand 9.9 percent in reporting States).
8

T8bfe B. Eetkneted nhr, rate, and retfoof Mhs to UIWMM women h 1979 end pWCSti change between 1975 end 1979, by race cd mother endState CsEfwr& and 5 sefected mporfhg Ststes in the West
[Rates par I,G130Unmarrkl women aged 15-44 year$ ratios per 1,(YJOtotal live births. Unmardedwoman are tt!aae who ara single, dworcad, widowed, and married but aeparatad]
Percent change1979 between 1975 and 1979
Raoe and State Number Rate Ratio Number Rate Ratio
Total
Californi a . . . . . . . . . . . . . . . . . . . . 74,500 27.1 196.5 40.9 11.5 17.9
Arizona . . . . . . . . . . . . . . . . . . . . . . 8,000 29.7 171.1 51.6 16.8 26.6
Colorado . . . . . . . . . . . . . . . . . . . . . 5,600 16.0 123.5 51.1 18.4 28.6
Hawaii . . . . . . . . . . . . . . . . . . . . . . . 2,900 27.5 163.7 46.1 23.9 32.7Oregon . . . . . . . . . . . . . . . . . . . . . . 5,600 21.8 134.7 65.6 29.6Washington . . . . . . . . . . . . . . . . . . . .
32.68,200 19.7 126.9 59.8 23.9 26.3
White
Californi a . . . . . . . . . . . . . . . . . . . . 53,000 23.8 165.4 45.0 17.2 23.5
Arizona . . . . . . . . . . . . . . . . . . . . . . 5,100 21.9 129.3 54.6 21.0 31.5Colorado . . . . . . . . . . . . . . . . . . . . . 4,800 16.0 110.1 52.2 20.3Hawaii . . . . . . . . . . . . . . . . . . . . . . .
31.1700 19.9 122.5 46.5 25.2 38.1
Oregon. . . . . . . . . . . . . . . . . . . . . . 4,900 20.4 125.5 69.6 34.2 37.2Washington . . . . . . . . . . . . . . . . . . . . 6,400 17.2 111.5 62.4 28.4 30.1
All other
California . . . . . . . . . . . . . . . . . . . . . 21,500 41.0 365.6 31.9 -6.8 -0.7
Arizona . . . . . . . . . . . . . . . . . . . . . . 2,900 77.8 395.0 46.9 13.1 23.1Colorado . . . . . . . . . . . . . . . . . . . . . 1,000 45.4 283.9 46.2 9.7Hawaii . . . . . . . . . . . . . . . . . . . . . . .
7.32,200 31.6 164.2 48.6 22.5
Oregon . . . . . . . . . . . . . . . . . . . . . .29.7
700 41.9 275.1 41.9 0.7Waehlngton . . . . . . . . . . . . . . . . . . . .
1.51,700 42.3 261.3 50.6 3.9 5.4
Nonmarital birthrate~ 1970and 1979
In interpreting therecent renewed rise innonmarital birthrates, it isimportant tonotethat forthe United States and formost States, nonreportingas well asreporting, the nonmaritalbirth rate in 1979 was either below or only slightly above whatitwasinthepeak yearof1970.This doesnotsuggest anyspuri-ous increase in theinferred data from nonreporting States. Itdoes suggest that the data reflect what actually happened, whichprobablywasabalancing offorces:Thedownward influenceofIegalabortioncompensating forsuchtrendsasincreased sexualintercourse among teenagers and an increased tendency forwomen aged 20 and over to choose to bear a child outside mar-riage.’0”4
California is one of the States that showed a small rise inthe rate of nonmarital births during the decade. The rate in 1979was 27.1, only slightly higher than the rate of 26.8 in 1970.
The findings for the reporting States in the West were morevariable and suggest that completeness and accuracy of reporteddata may have changed more than completeness and accuracyof the inferred data for California. The findings for Oregon andWashington support this interpretation. Oregon, which had the
lowest rate of any of the selected Western States in 1970 (17.9),showed the greatest increase in the decade, with a rate of 21.8in 1979. Washington, on the other hand, started the decade witha higher rate than Oregon had (21.0), but showed an overall de-cline and ended the decade below Oregon with a rate of 19.7in 1979. Nonreporting by certain hospitals was a problem inWashington in the late 1970’s. Thus it seems likely that at leastpart of Washington’s decline came from deterioration in report-ing. (It should be noted that reporting in Washington has im-proved since 1980, when the birth certificate question waschanged to ask about marital status rather than legitimacystatus.) Although there is no dh-ect evidence on the subject, italso seems possible that at least part of the increase in Oregonand other reporting States came from an improvement in report-ing. No reporting problems among Oregon hospitals are knownto have existed in the late 1970’s. In general, there probably wasa decrease during the decade in the tendency to conceal out-of-wedlock status in completing birth certificates. Although thistendency is difficult to study and is not well documented, mis-reporting in the mid- 1950’s was demonstrated for some adoptedchildren in Washington,16
9

Review of representativesamples of birth certificates
Methods and sources
One approach taken in earlier evaluation studies and re-peated in the present study was the selection and review of rep-resentative samples of birth certificates classified by the inferen-tial method. In earlier studies, samples for 1967, 1970, 1974,and 1975 were reviewed. For the current study, samples for1977and 1979were reviewed.
The review of representative samples of birth certificatesdoes not by itself add any information about the accuracy withwhich marital status was inferred, but several important pur-poses related to evaluation of the data are accomplished duringa review. The accuracy with which inferential criteria were ap-plied in the routine coding of birth certificates is checked, as isthe question of whether these criteria need change. In the re-view, a special coding is done to determine the frequency withwhich specific criteria and combinations of criteria have beenapplied and to show in detail the type of information that hasbeen reported. Groups of certificates that maybe misclassifiedand that possibly could be followed up by other means are iden-tified. One means of followup explored in this study wasacross-check with marriage records for a systematic subsampleof the general sample of birth certificates.
The concepts and methods applied in the current reviewwere generally similar to those used previously. Births to mar-ried as well as unmarried women were included, but the latterwere sampled at a heavier rate in order to obtain sufficient num-bers. For each sample case, a full copy of the birth certificatewas obtained and all information related to marital status wascoded in detail.
Because there has been virtually no change in either theidentifying items on the California birth certificate or the poli-cies that influence the identification of fathers and the namingof children, there has been relatively little basis for changing theinferential criteria that have been applied in the State since1966. Nevertheless, some revisions were made following eachprevious sample review. The revisions resulted in eithersimplified rules that were found to affect relatively few casesor new rules aimed at avoiding overestimation of nonmaritalbirths by classifying borderline categories as marital rather thannonmarital. The inferential criteria used in California in 1983are essentially the same as those used in the sample studyperiods, 1977and 1979.
Findings of review of birth certificatesamples
The review of samples for 1977 and 1979 showed a verylow level of error due to inaccurate application of inferentialcriteria in the routine coding of birth certificates, There was analmost exact balancing of false positives (births incorrectlycoded nonmarital) and false negatives (births incorrectly codedmarital). Neither of these error groups amounted to more than1 percent of the total births classified nonmarital, and theybalanced each other for a zero net effect (table 7).
The current review showed continuation of past trends inthe frequency with which various inferential criteria provide themain basis for classifying births as nonmarital (table 8). With-holding the father’s name on the birth certificate is particularlyfrequent in California for births in which adoption is planned.Reflecting a decline in adoptions, there has been a fairly steadydecline in the proportion of births classified nonmarital becausethe father’s name was withheld. This has been accompanied bya steady increase in the proportion classified nonmarital becausethe mother signed her maiden surname as the informant for thebirth record. As a proportion of all births classified nonmarital,those classified only on the basis of maiden surname signatureincreased horn 36.3 percent in 1967 to 65.5 percent in 1979.This proportion varied by race and ethnic origin; in 1979, it wasslightly under one-half for white mothers not having Spanishsurnames and approximately three-fourths for both whitemothers with Spanish surnames and black mothers.
Cross-check with marriage records
From these findings about the basis for nonmarital classifi-cation, questions arise about the data that cannot be answeredwithout obtaining additional information from sources inde-pendent of the birth certificate. The main sources of inde-pendent information for this study, discussed earlier, were thecross-check with hospital records and the comparison with datafrom reporting States in the West. Both gave strong evidencethat most of the births classified nonmarital on the basis of themother’s signature actually were births to women not marriedto the father of the child. Further support for this conclusion wasobtained from a cross-check with marriage records carried outin connection with the review of birth certificates.

A small but representative subsample of 48 marital birthsand57 nonmaritalbirths was obtained by systematically select-ing 1in 25 births from the general sample of 1979births. Searchfor a marriage record of the parents listed on the birth certificatewas made in the files of the Vital Statistics Branch, CaliforniaDepartment of Health Services.
This cross-check approach has the advantage that when amarriage record of the parents is located for a birth classifiednonmarital, it establishes clearly that the birth was misclas-sified, However, if a marriage record is not located, it does notrule out the possibility that the parents actually were married.The marriage may have occurred outside California or it mayhave been nonlicensed. Nonlicensed marriages were not in-cluded in the statewide file of marriage records until 1982.These marriages have become increasingly frequent in Califor-nia in recent years, amounting to approximately 20 percent ofall marriages occurring in the State in 1980. A description ofthese marriages is given in appendix IV.
Incompleteness of the marriage files was considered a seri-ous limitation, and until recently search for a marriage recordwas relatively difficult and expensive. Therefore, in the currentstudy, only the approach of matching birth and marriage records
was explored. It proved more productive than expected. A keyelement in making the findings definitive was the inclusion ofmarital births as a control group. This gave a basis forevaluating what was found for the nonmarital births.
The main finding of the cross-check was that marriagerecords in which the bride and groom matched the mother andfather were located for half of the marital births but none of thenonmarital births. Marriage records in which the bride matchedthe mother but the groom did not match the father were locatedfor one of the marital births and for five of the nonmarital births(table 9).
Conclusions about what percent of each group was not mar-ried cannot be drawn because of incomplete marriage files. Al-though marriage records were found for half of the mothersinferred to be married, it is notable that for mothers infen-ed notmarried to the father of the child (the definition of nonmaritalbirth used in California), the only marriage records found werethose in which the groom and father clearly were differentpeople. These findings do not suggest that a large proportion ofbirths to married couples have been misclassified as nonmaritalin the California data.
11

Conclusion
The classification of births by marital status of mother pro-duces information that has unique value as an indicator of socialchange and as a tool in the study of infant mortality and otherrisks to children. The history and use of this information forCalifornia is detailed elsewhere? Strong evidence of need forthe information is given by the fact that inferential methods forcompiling it were developed independently in almost all Stateswhere an explicit marital status question was not asked.
It is likely that States will continue for sometime to compilebirth data classified by marital status. Whether data collectionis done by direct means, as in reporting States, or by inferentialmethods, as in nonreporting States, the data must be evaluatedto be used appropriately.
Evaluations of the inferred data for Crdifomia have shownrepeatedly that a priori doubts about the method were not war-ranted and that the data remained of high quality at least through1980. However, it does not follow that this necessarily will con-tinue to be true in the future. In general, inferred data are notto be preferred to reported data. Inferred data are,more costlyto compile. In addition, as demonstrated in this study, evalua-tion of inferred data @pends heavily on the availability of re-ported data with which to make comparisons. Therefore, basedon these evaluations, the author recommends that efforts shouldbe made to retain and expand usage of the marital status itemon birth certificates and to consider inferential methods only asan alternative.
12

References
[J. BIa~c: Stmctural Differentiation and the Family, a Quiet Revolu-
tion, in A. Hawley, ed., Societal Growth, Processes and Implications.New York. The Free Press, 1979.
‘B. Bwlmv and J. Sklac Does illegitimacy make a difference?A study of the life chances of illegitimate children in California.Popul. Dev. Rev. 2(2): 201-207, 1976.
3Ccrrtcr for Disease Control, Family Planning Evaluation Division:Teenage Fertility in the United States. Atlanta, 1978.
‘National Center for Health Statistics: Advance report, final natalitystatistics, 1980. Monthly Vital Statistics Report. Vol. 31, No. 8Supp. DHHS Pub. No. (PHS) 83-1120. Public Health Service.Hytittsville, Md., Nov. 30, 1982.
‘R. F. Chamblcc, W. B. Clifford, and R. D. Mustian: Validationof an inferential approach for the measurement of illegitimacy. De-m(/Sr,/phy 16(I): 49-54, 1979.
“B. Bcrkov and J. Skla~ Methodological options in measuring illegiti-tmtcy and the difference they make. WC. Biol. 22(4): 356-371,Winter 1975.
7S. J. Vmrturw Comment on “Methodological options in measuringillegitimacy and the difference they make,” by B. Berkov and J.Sklar. Sot. Biol. 23(4): 349-353, Spring 1977.
‘National Center for Health Statistics, S. J. Ventura Trends anddifferentials in births to unmamied women, United States, 1970-76.Vitu/ and Health Statistics. Series 21, -No. 36. DHHS Pub. No.(PHS) 80-I 914. Public Health Service. Washington. U.S. Govern-ment Printing Office, May 1980.
‘B, Bcrkov: Inferring Marital Status From Birth Certificate Informa-tion, Evaluation of the CaltJornia Data After 1975. Contract No.233-79-206 &HHS. California Department of Health Services, Sept.19X2. Copy on file with the Natality Statistics Branch, Divisionof Vital Smtistics, National Center for Health Statistics.
“lB. Bcrkov: Can We Believe California Illegitimate Birth Statistics?Prcliminury Paper No. 11. International Population and Urban Re-wurch, University of California at Berkeley, 1977.
1‘C. Madore, W. E. Hawes, F. Many, and A. C. Hextec A studyof the effects of induced abortion on subsequent pregnancy outcome.Atn. J. Obstet. Gynecol. 139(5): 516-521, 1981.
12D M Heer and D. Falasc.o: The sOCiOeCOtrOrnk status of Recent. .Mothers of Mexican Origin in Los Angeles County, A Comparisonof Undocumented Migrants, Legal Migrants, and Native Citizens.Paper presented at the Meeting of the Pacific Sociological Associa-tion. San Diego, Apr. 1982.
lJD Heer professor, IJniversity of Southern CalifOmia: personal,communication.htJ Sklar and B. Berkov: Abortion, illegitimacy and the American
bi;h rate. Science 185: 909–9 15, Sept. 13, 1974.
IsNational Center for Health Statistics. Advance rePOtI of finalnatality statistics, 1981. Monthly Vital Statistics Report. Vol. 32,No. 9 Supp. DHHS Pub. No. (PHS) 841120. Public Health Service.Hyattsville, Md., Dec. 29, 1983.
16Washington State Department of Health: Adoptions Among Chil-dren Born in the State of Washington in 1956. Unpublished study.Copy on file with the Natality Statistics Branch, Division of VitalStatistics, National Center for Health Statistics.
17u.s. Bureau of the Census: Unpublished estimates of State popula-tions in age groups 15–19, 20-24, 25-29, 30-34, and 35-44,consistent with data in Current Population Reports, Series P-25,Nos. 614and617.
1‘U S Bureau of the Census: Preliminary estimates of the population. .of the United States by age, sex, and race, 1970 to 1981. CurrentPopulation Reports. Series P–25, No. 917. Washington. U.S. Gov-ernment Printing Office, July 1982.19U s Bureau of the Census: I980 Census of Population. General. .Population characteristics, PC80-1-B, table 20. Washington. U.S.Government Printing OffIce, 1982.
‘°California Center for Health Statistics, State of California Depart-ment of Health Services: California nonlicensed marriages, a firstlook at their characteristics. Data Matters. Report No. 81–10037.Sacramento, Calif., 1981.
“California Center for Health Statistics, State of California Depart-ment of Health Services: Advance report, California Vital Statistics,1981. Data Matters. Report No. 82-08039. Sacramento, Calif.,1982.
13

List of detailed tables
1. Number of live births, and percent distribution of allbirths and percent of all births inferred nonmarital, byrace and Mexican origin of mothe~ California and SantaClara County hospitals, 1980 . . . . . . . . , . . .
2. Number of live births, and number and percent nonmarital,by hospital and inferential classification, race and Mexicanorigin of mother, and hospital: 9 hospitals in Santa ClaraCounty, February-July, 1980 . . . . . . . . . . . . .
3. Number of live births, and number and percent nonmarital,by hospital and inferential classification, source of data,and hospital: 14 hospitals in California, selected years,1977-80 . . . . . . . . . . . . . . . . . . . . . . . .
4. Number of nonmarkd live births and percent distributionsby race and Mexican origin of mother and by age ofmother, according to source of nonmarital classification:Xhospitals in Santa Clara County, Februar-July 1980. .
5. Estimated nonmarital birth rates and rankings, by raceof mother and source of data United States and selectedStates imdregions, 1970..... . . . . . . . . . .
6. Estimated nonmarital birth rates and percent changes overtime, by age of mothe~ United States, selected States,and groups of States, selected years, 1965–79 . . . 20
16 7. Inferential classification of births by marital status ofmother and estimated erro~ Sample of California births,1977 and 1979 . . . . . . . . . . . . . . . . . ...22
8. Number of nonmarital live births in sample and percent17 distribution by principal inferential criterion applied, ac-
cording to race and Spanish surname of mothe~ California,selected years, 1967–79 . . . . . . . . . . . . . . . 23
9. Findings of search for marriage records for subsarnples18 of births classified nonmarital and marital: California,
1979 . . . . . . . . . . . . . . . . . . . . . . ...23
18
19
15

Tebkl. Number of Eve birtiwand-t~ “ ofdbhthaandperoentof~ birthainfe rrednomnaritcl byreceand Mexkanofigh of fnothanCdfofnii and Santa Clara County hmpita@ 1980
[Catiiomia date by place of residencw Sante Clara Camty data by phee of oocurrancel
Santa Clara County
8 2 non-Marita/ status, race, and All study participatingMexican origin of mother’ California hospital~ hospitals hospitals
Total Number
Live births . . . . . . . . . . . . . . . . . . . . . . . . . 402,720 22,7S2 16,262 5,6S9
Percent distribution
All races . . . . . . . . . . . . . . . . . . . . . . . . . . 100.0 100.0
White, not Mexican . . . . . . . . . . . . . . . . . . . . 56.S 60.sWhite, Mexican . . . . . . . . . . . . . . . . . . . . . . 25.8 24.2Black . . . . . . . . . . . . . . . . . . . . . . . . . . . 6.6 5.1Other . . . . . . . . . . . . . . . . . . . . . . . . . . . 6.6 9.6Unknown . . . . . . . . . . . . . . . . . . . . . . . . . 2.0 0.3
Nonmarital births3
Live births . . . . . . . . . . . . . . . . . . . . . . . . . 83,373 4,075
Nonmarital births as percent of total births
All races . . . . . .
White, not MexicanWhite, Mexican . .,
Black . . . . . . .
Other . . . . . . .
Unknown . . . . .
. . . . . . . . . . . . . . . . . . . . 20.7 17.9
. . . . . . . . . . . . . . . . . . . . 14.5 12.3
. . . . . . . . . . . . . . . . . . . . 25.2 29.S
. . . . . . . . . . . . . . . . . . . . 56.5 46.S
. . . . . . . . . . . . . . . . . . . . 9.4 6.9
. . . . . . . . . . . . . . . . . . . . 22.5 21.3
100.0
60.024.45.59.90.2
3,362
Percent
20.7
14.1
34.355.7
7.7
22.5
100.0
65.7
19.84.79.50.4
526
9.3
7.314.6
24.9
3.9
15.0
1IncludesMexiean-Ameriaen.2F@res include599 total births end 144nonmaritalbirthsaurring in oneother study hospital that compiledits own summsrydata. Fwureealso include 195total Mrlheand 35 nonmeritalbirths oczurringoutakieof fwspffalsand57total birthsand8 nonmaritalbirthsocam’ing in hoepitelanot uaualiypmvklingdeliveryservics.Thesedata arenot shownseparately.‘Infarenfial codingby Stateagancy.
16

-. .-....” . . . . . . . . . . . . . . . . . . . . . . . . . . . . . . . . . . .
lame z. rwmoar or affe omnq ana nunmar amopercam nonmarwIloqifal: 9 tlospttate in !smta Ctua county, Wmmy—wy 1s80
w~-~~ rece ana Mexican ongm 01 roomer, ana
[Slata-cedad dafe include all bltfhs ocsurdng in afudv fmapifaleduring Sheparbd Fsbnwy thrwgh Jufy 19S0. Hc@tal and wuntv inferenfkl dafa are moafk for fhese monfts, twf sama hospifalsstarled parficlpatkmin mid-.famraryor mid-Fabruaryend ended participation in mkklune or mkkluly Hospital 4 endad panicipafion in mid-May]
Race and Mexican originofmother’ andhoapital
Inferential
Hospital classificatkm County codin# State coding
All Nofrmarital All Nomnsrifal All Nonmaritallive
Numberlive live
birthsPemant
birthsNumber Percent
birthsNumber Percent
All races:
Total, 9hospilals . . . . . . . . . . . . .
Total, 8hospltals . . . . . . . . . . . . .
Hospital I . . . . . . . . . . . . . . . . .Hospital . . . . . . . . . . . . . . . . .Hosplta13 . . . . . . . . . . . . . . . . .
Hosplta14 . . . . . . . . . . . . . . . . .Hoapita15 . . . . . . . . . . . . . . . . .
Hosplta16 . . . . . . . . . . . . . . . . .Hosplla17 . . . . . . . . . . . . . . . . .Hoaplta18 . . . . . . . . . . . . . . . . .
Hospital . . . . . . . . . . . . . . . . .
White, not Mexican:
Total,6hospltals . . . . . . . . . . . . .
Hospital I . . . . . . . . . . . . . . . . .
Hoapita12 . . . . . . . . . . . . . . . . .Hoepita13 . . . . . . . . . . . . . . . . .Hosplta14 . . . . . . . . . . . . . . . . .
Hospital . . . . . . . . . . . . . . . . .
Hospital, . . . . . . . . . . . . . . . .
Hospita17 . . . . . . . . . . . . . . . . .
Hospital . . . . . . . . . . . . . . . . .
White, Mexican:
Tolal,8hosp[tals . . . . . . . . . . . . .
Hospital l . . . . . . . . . . . . . . . . .Hospita12 . . . . . . . . . . . . . . . . .
Hospital . . . . . . . . . . . . . . . . .Hospita14 . . . . . . . . . . . . . . . . .
Hosplta15 . . . . . . . . . . . . . . . . .
Hospital . . . . . . . . . . . . . . . . .Hoapita17 . . . . . . . . . . . . . . . . .
Hospita18 . . . . . . . . . . . . . . . . .
Black:
Total, 6hoepitals . . . . . . . . . . . . .
Hospital l, . . . . . . . . . . . . . . . .Hosplta12 . . . . . . . . . . . . . . . . .
Hospital . . . . . . . . . . . . . . . . .Hospital . . . . . . . . . . . . . . . . .Hospita15 . . . . . . . . . . . . . . . . .
Hospital . . . . . . . . . . . . . . . . .Hospltai 7 . . . . . . . . . . . . . . . . .
Hospita16 . . . . . . . . . . . . . . . . .
Other
Total,8hospitals . . . . . . . . . . . . .
Hospital l . . . . . . . . . . . . . . . . .Hospital . . . . . . . . . . . . . . . . .
Hospital . . . . . . . . . . . . . . . . .Hospital . . . . . . . . . . . . . . . . .Hospila15 . . . . . . . . . . . . . . . . .
Hospital . . . . . . . . . . . . . . . . .Hospital . . . . . . . . . . . . . . . . .Hoepita18 . . . . . . . . . . . . . . . . .
7,615
7,285
4881,4941,520
169897
9261,167
624
330
4,466
145
1,0661,331
147450
408
721218
1,644
223154
8513
372
350164263
419
4840
20
315
69166
56
736
70
23464
660
101114
67
1,616
1,634
2051718114
254
263231
315
82
612
50112
6410
116
8674
100
579
10232
-103
121
13027
154
256
3319
3
7
36114
42
87
21
74
110
91619
21.2
21.1
42.211.45.3
6.328.3
28.319.850.5
24.6
13.6
34.510.5
4.86.8
25.6
21.110.345.9
35.2
45.720.61~.823.1
32.5
37.116.5
54.4
61.1
66.847.5
15.0
46.7
55.167.9
75.0
11.8
30.03.04.8
16.716.7
6.914.028.4
..-7,285
4861,4941,520
169
897
9281,167
824.-.
4,466
145
1,0661,331
147450
408721
218
1,644
223154
8513
372
350164263
419
4840
203
15
69166
56
736
70234
64
660
10111467
-..1,523
2031668016
247
267235309. . .
614
46110
6311
111
8663
10+J
581
10133
93
121
13230
152
245
3417
316
37106
39
83
20
651
9101418
.-.20.9
41.611.1
5.3
9.527.5
28.620.149.5. . .
13.7
33.110.34.77.5
24.7
21.611.5
45.9
35.3
45.321.4
10.623.1
32.5
37.716.3
53.7
56.5
70.642.5
15.0
33.040.0
53.664.3
69.6
11.3
26.62.66.0
16.715.0
9.912.326.9
6,2197,911
6401,4791,572
377950
1,0111,215
667
306
4,840
2021,0561,356
323492
425
743241
1,695
316159
10137
364401160
317
440
6239
205
15
70172
57
736
60223
9512
59
11512052
1,7081,639
2561626241
261
260249306
69
670
64111
6229
124
9088
102
654
14130
99
123
14639
157
252
4216
2
15
36111
39
63
11
5929
811
8
20.8
20.7
40.311.05.2
10.927.5
27.720.545.9
22.4
13.6
31.710.54.69.0
25.2
21.2
11.842.3
34.5
44.618.9
8.924.3
32.0
36.421.749.5
57.3
67.741.0
10.020.033.3
51.464.5
68.4
8.6
18.32.2
9.516.7
15.3
7.09.2
15.4
Ilncludes Mexican-American.7Counfy-compileddata by race and Mexican origii available for oniy 8 of tha 9 hospitals.
17

Table 3. Number of live births, and number and percant nonmarifd by hospital and inferential clasab%tion,Caiifomi4 seleoted year% 1977-80
source of da@ and hospitak 14 hoapifela in
Hospita/ Inferential 3
AllNonmarital
AllNonmarital
Source of hospital data, live live
year,’ and hospital 2 births Number Percent births Number Percent
Hospital log? 1977-SO . . . . . . . . . . . . . . . . . 51,787 18,199 35.1 51,622 17,634 34.2
A,1980 . . . . . . . . . . . . . . . . . . . . . . . . . 12,762 5,246 41.1 12,708 4,918 38.7A,1979 . . . . . . . . . . . . . . . . . . . . . . . . . 13,210 4,704 35.6 12,969 4,514 34.6A,1978 . . . . . . . . . . . . . . . . . . . . . . . . . 12,389 4,210 34.0 12,572 4,072 32.4A,1977 . . . . . . . . . . . . . . . . . . . . . . . . . 13,426 4,039 30.1 13,373 4,130 30.9
Research study,51977 . . . . . . . . . . . . . . . . . 12,450 3,833 29.2 18,426 4,693 27.0
B,1977 . . . . . . . . . . . . . . . . . . . . . . . . . 1,366 260 20.5 1,672 316 18.9C,1977 . . . . . . . . . . . . . . . . . . . . . . . . . 1,289 541 42.0 2,128 840 39.5D, 1977 . . . . . . . . . . . . . . . . . . . . . . . . . 1,715 248 14.5 1,966 310 15.6E,1977 . . . . . . . . . . . . . . . . . . . . . . . . . 2,192 736 33.6 2,483 609 32.6
F,1977 . . . . . . . . . . . . . . . . . . . . . . . . . 1,671 833 44.5 2,301 1,051 45.7
G,1977 . . . . . . . . . . . . . . . . . . . . . . . . . 1,785 376 21.1 4,023 632 15.7H,1977 . . . . . . . . . . . . . . . . . . . . . . . . . 533 175 32.8 833 272 32.71,1977 . . . . . . . . . . . . . . . . . . . . . . . . . 1,699 444 26.1 3,020 753 24.9
Pilotstudy,e1979 . . . . . . . . . . . . . . . . . . . . 292 59 20.2 292 51 17.5
J,1979 . . . . . . . . . . . . . . . . . . . . . . . . . 51 19 37.3 51 18 35.3K,1979 . . . . . . . . . . . . . . . . . . . . . . . . . 83 6 7.2 83 6 7.2L,1979 . . . . . . . . . . . . . . . . . . . . . . . . . 51 18 35.3 51 18 35.3M,1979 . . . . . . . . . . . . . . . . . . . . . . . . . 56 2 3.6 56 1 1.6N,1979 . . . . . . . . . . . . . . . . . . . . . . . . . 51 14 27.5 51 8 15.7
‘For hospital A,dataareforffscsl year eting Jtme300f year siwwn; forhaspilals B, C, and 1,data are for Me~lendar yeWforoMer hospfials, daaarefor seledtislWy~ti within calendaryear.2HospitslsAar!d D, E, F, G,arein LmAngelsa tiunWH-L, inthe Sacramento or Cenkal ValleKB, C, M,ati N,inthe Sm FranciacaSay Arew HospitalsA, E, F, H,J, L,and Nare county-orState-ownedhospital%the remainderare private nonproft hospitals.3inferentialdata mmpilad by California Departmentof Health Services. For hospitals B-1,data refer onfy to first and sacomdh’e births.4Datscompiledby hoapifalforall live fMha.‘Inte!viawssnd racordabstracts forsamples of first and second ltie births.‘Record abstracts forsamples of fiie births.
NOTEThedifferenca batweenhospitalsnd inferentialcountsof totalfiie birthsisdkussad inthetext.
Tabla4. Numberofnonmaritellivebirthsand percentdiatfibutions byraceandMexican origin ofmotherand byageofrnother, accordingtosourceofnonmaW4claaaification: 8hospitalainSanta ClaraCounty, February-July 1980
Nonmarital by Nonmarital by eacheither or both sources source independently
Hospital Hospital Inferentialand only only
Race and Mexican origin inferential (false (falseof mother’ andage agree nagative) positive) Hospital Inferential
Number
Allnonmarital baths. . . . . . . . . . . . . . . . . . . . . . . 1,428 108 95 1,534 1,523
Percent distribution
All races . . . . . . . . . . . . . . . . . . . . . . . . . . . . .
White, not Mexican . . . . . . . . . . . . . . . . . . . . . . .White, Mexican . . . . . . . . . . . . . . . . . . . . . . . . .Black . . . . . . . . . . . . . . . . . . . . . . . . . . . . . .Other . . . . . . . . . . . . . . . . . . . . . . . . . . . . . .
Alleges . . . . . . . . . . . . . . . . . . . . . . . . . . . . .
Under15years . . . . . . . . . . . . . . . . . . . . . . . . .15-17years . . . . . . . . . . . . . . . . . . . . . . . . . .lS-19years . . . . . . . . . . . . . . . . . . . . . . . . . .20-24years . . . . . . . . . . . . . . . . . . . . . . . . . .25-29yaars . . . . . . . . . . . . . . . . . . . . . . . . . .30-34years . . . . . . . . . . . . . . . . . . . . . . . . . .35yearsandover . . . . . . . . . . . . . . . . . . . . . . .
100.0
39.43s.316.7
5.7
100.0
1.015.020.037.216.67.52.5
100.0
47.230.217.0
5.7
100.0
1.012.315.134.924.5
9.42.8
100.0
54.735.8
7.42.1
100.0
3.213.725.327.424.2
6.3
100.0
39.937.716.7
5.7
100.0
1.014.819.737.017.3
7.82.5
100.0
40.338.116.15.4
100.01.0
14.219.836.417.58.42.9
‘Includes Mexican-Amerioan.
18

Tabb5. ~ti@dmmti MRh~-ati mnM~bym of-rati murm&ti Unti*SMes and-d SMeaati~n& 1970
[Rataa p l,CKIO unmarriedwoman aged 16-44 years]
All races White
Interstate study NCHS /nterstate study NCHS
I Rank Rank Rankamong all
Rankamong among all among
States reportingArwa
States reportingRate or ragions Rate States Rate or regions Rate States
California . . . . . . . . . . . . . . . . . . . . . 26.6 17 . . . --- 21.5 2 ---
I Arizona . . . . . . . . . . . . . . . . . . . . . .
. . .
29.3 14 27.6 14 21.1 3 19.4 1
Colorado . . . . . . . . . . . . . . . . . . . . .Hawaii . . . . . . . . . . . . . . . . . . . . . . .Oregon . . . . . . . . . . . . . . . . . . . . . .Washington . . . . . . . . . . . . . . . . . . . .
west, . . . . . . . . . . . . . . . . . . . . . .South . . . . . . . . . . . . . . . . . . . . . . .
North Central . . . . . . . . . . . . . . . . . . .Northeast . . . . . . . . . . . . . . .1. . . . . .
United States . . . . . . . . . . . . . . . . . . .
21.724.617.921.0
25.0
30.723.922.0
25.7
28223830
2
1
34
19.623.116.920.3
. . .
..-
. . .
. . .
26.4
26193324
. . .
. . .
. . .-..
19.521.916.318.5
20.2
12.814.212.5
14.5
51
13
9
1
324
17.318.715.317.2
. . .
. . .-..---
13.9
536
6.5
---.-.. . .-..
NOTE For interstate sludy ratae, unmarried women are those Mo ara aingla, dworcad, widowed, and married but aaparated for NCHS rates, they are single, dworeed, and widewsd women oniy.(See texi and refererwes 6-a for diacusskm of inclusion or exclus!cm of separated women among those exposed to the risk of nonmaritsl birth.)
19
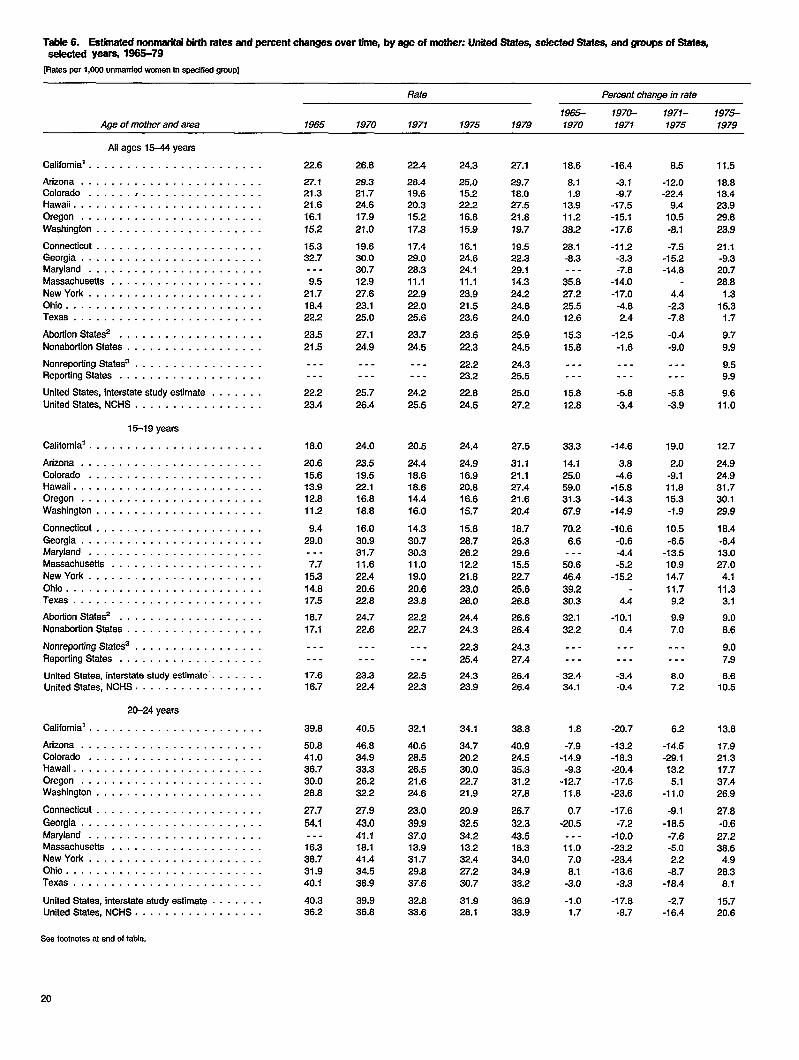
Tsble6. Estimatednonmaritalbirthratesandpercentchangesover tirnq by ageof mother:UnitedStste~ selectedstates andgroupsof SW=selectedyear%1966-79
[Rates per 1,000 unmarried women in specffied group]
Rate Percent change in rate
1965- 1970- 1971- 1975-Age of rrrother and area 1865 1970 1971 1975 1979 1970 1971 1975 1979
All ages 1544 yeara
California’ . . . . . . . . . . . . . . . . . . . . . .
Arizona . . . . . . . . . . . . . . . . . . . . . . . .Colorado . . . . . . . . . . . . . . . . . . . . . . .Hawaii . . . . . . . . . . . . . . . . . . . . . . . . .
Oregon . . . . . . . . . . . . . . . . . . . . . . . .
Washington . . . . . . . . . . . . . . . . . . . . . .
Connecticut . . . . . . . . . . . . . . . . . . . . . .Georgia . . . . . . . . . . . . . . . . . . . . . . . .Maryland . . . . . . . . . . . . . . . . . . . . . . .
Massachusetts . . . . . . . . . . . . . . . . . . . .
NewYork . . . . . . . . . . . . . . . . . . . . . . .Ohio . . . . . . . . . . . . . . . . . . . . . . . . . .Texas . . . . . . . . . . . . . . . . . . . . . . . . .
AbortionStates2 . . . . . . . . . . . . . . . . . . .
NonabortionStates . . . . . . . . . . . . . . . . . .
NonreportingStatess . . . . . . . . . . . . . . . . .Repotting States . . . . . . . . . . . . . . . . . . .
lJnited States, interstate etudy estimate . . . . . . .
UnitedStates, NCHS . . . . . . . . . . . . . . . . .
15-19yeare
California’ . . . . . . . . . . . . . . . . . . . . . . .
Arizona . . . . . . . . . . . . . . . . . . . . . . . .
Colorado . . . . . . . . . . . . . . . . . . . . . . .Hawaii . . . . . . . . . . . . . . . . . . . . . . . . .Oregon . . . . . . . . . . . . . . . . . . . . . . . .
Washington . . . . . . . . . . . . . . . . . . . . . .
Connecticut . . . . . . . . . . . . . . . . . . . . . .Georgia . . . . . . . . . . . . . . . . . . . . . . . .Maryland . . . . . . . . . . . . . . . . . . . . . . .Massachusetts . . . . . . . . . . . . . . . . . . . .
New York . . . . . . . . . . . . . . . . . . . . . . .
Ohio . . . . . . . . . . . . . . . . . . . . . . . . . .Texas . . . . . . . . . . . . . . . . . . . . . . . . .
AbortionStates2 . . . . . . . . . . . . . . . . . . .
NonaborfionStates . . . . . . . . . . . . . . . . . .
NonreportingStatess . . . . . . . . . . . . . . . . .
Reporting States . . . . . . . . . . . . . . . . . . .
United States, interstate study estimate”. . . . . . .UnitedStates, NCHS . . . . . . . . . . . . . . . . .
20-24years
California ’ . . . . . . . . . . . . . . . . . . . . . .
Arizona . . . . . . . . . . . . . . . . . . . . . . . .Colorado . . . . . . . . . . . . . . . . . . . . . . .Hawaii . . . . . . . . . . . . . . . . . . . . . . . . .
Oregon . . . . . . . . . . . . . . . . . . . . . . . .Washington . . . . . . . . . . . . . . . . . . . . . .
Connecticut . . . . . . . . . . . . . . . . . . . . . .
Georgia . . . . . . . . . . . . . . . . . . . . . . . .
Maryland . . . . . . . . . . . . . . . . . . . . . . .Massachusetts . . . . . . . . . . . . . . . . . . . .New York . . . . . . . . . . . . . . . . . . . . . . .
Ohio . . . . . . . . . . . . . . . . . . . . . . . . . .Texan . . . . . . . . . . . . . . . . . . . . . . . . .
UnitedStates, interstatestudyestimate . . . . . . .UnitedStates, NCHS . . . . . . . . . . . . . . . . .
See fcmtnotes at end of table.
22.6
27.121.321.616.1
15.2
15.332.7---
9.5
21.718.422.2
23.5
21.6
------
22.2
23.4
18.0
20.6
15.813.912.8
11.2
9.4
29.0.-.
7.7
15.3
14.617.5
16.7
17.1
..-
---
17.616.7
39.6
50.8
41.0
36.730.026.6
27.7
54.1---
16.3
38.731.940.1
40.336.2
26.6
29.321.724.617.9
21.0
19.630.030.712.927.823.125.0
27.1
24.9
------
25.726.4
24.0
23.519.522.116.618.8
16.0
30.931.711.6
22.4
20.622.8
24.7
22.6
.-.
.-.
23.322.4
40.5
46.834.933.326.232.2
27.9
43.0
41.118.141.434.538.9
39.936.8
22.4
28.419.620.315.2
17.3
17.429.028.3
11.1
22.922.025.6
23.7
24.5
------
24.2
25.5
20.5
24.4
18.618.614.4
16.0
14.3
30.730.311.0
19.0
20.623.8
22.2
22.7
..-
---
22.522.3
32.1
40.628.526.521.624.6
23.0
39.9
37.013.9
31.729.6
37.6
32.833.6
24.3
25.015.222.216.8
15.9
16,124.624.1
11.1
23.9
21.523.6
23.6
22.3
22.223.2
22.6
24.5
24.4
24.9
16.920.6
16.6
15.7
15.6
28.726.212.2
21.6
23.026.0
24.4
24.3
22.3
25.4
24.323.9
34.1
34.720.2
30.022.721.9
20.9
32.5
34.213.232.427.2
30.7
31.928.1
27.1
29.716.027.5
21.6
19.7
19.522.329.114.3
24.2
24.624.0
25.9
24.5
24.325.5
25.0
27.2
27.5
31.1
21.127.421.8
20.4
18.7
26.329.615.5
22.7
25.626.8
26.6
26.4
24.3
27.4
26.426.4
36.6
40.924.535.3
31.227.8
26.7
32.3
43.518.334.0
34.9
33.2
36.933.9
18.6
8.11.9
13.9
11.2
38.2
28.1-8.3---
35.627.2
25.512.6
15.3
15.6
. . .---
15.6
12.6
33.3
14.1
25.059.031.3
67.9
70.2
6.6---
50.6
46.4
39.230.3
32.1
32.2
---
.-.
32.434.1
1.8
-7.9-14.9
-9.3-12.711.6
0.7
-20.5---
11.07.0
8.1-3.0
-1.01.7
-16.4
-3.1-9.7
-17.5-15.1
-17.6
-11.2-3.3-7.6
-14.0
-17.0
-4.62.4
-12.5
-1.6
------
-5.6
-3.4
-14.6
3.8
-4.6-15.8-14.3
-14.9
-10.6
-0.6-4.4-5.2
-15.2
4.4
-10.1
0.4
---
. . .
-3.4-0.4
-20.7
-13.2-18.3-20.4
-17.6-23.6
-17.6
-7.2
-10.0-23.2-23.4-13.6
-3.3
-17.6-8.7
8.5
-12.0-22.4
9.410.5
-8.1
-7.5-15.2-14.6
4.4
-2.3-7.6
-0.4
-9.0
. . ...-
-5.6
-3.9
19.0
2.0
-9.111.815.3
-1.9
10.5
-6.5-13.510.9
14.7
11.79.2
9.9
7.0
.-.
. . .
8.07.2
6.2
-14.5-29.113.2
5.1-11.0
-9.1
-16.5
-7.6-5.02.2
-8.7-16.4
-2.7-16.4
11.5
18.818.423.929.6
23.9
21.1-9.320.728.8
1.3
15.31.7
9.7
9.9
9.59.9
9.611.0
12.7
24.9
24.931.730.1
29.9
16.4
-6.413.027.0
4.1
11.3
3,1
9.0
8.6
9.0
7.9
8.610,5
13.8
17.921.317.7
37.426.9
27.6
-0.6
27.238.6
4.926.3
8.1
15.720.6
20

TAie 6. Eathnated nonrnaritd birth rates and pwoent changea over tirw by age of mother: United states+ aekcted stat- and groups of -aefecwf year$ 1965-79-con.
[Ratesper1,000 unmardad women in speoifiad group]
Rate Percent change in rate
1965- 1970- 1971–Age of mother and area
1975-1965 1970 1971 1975 1979 1970 1971 1975 1979
Nonreporting States3 . . . . . . . . . . . . . . . . .Reporting States . . . . . . . . . . . . . . . . . . .
United States, interstate study estimate . . . . . . .United States, NCHS . . . . . . . . . . . . . . . . .
25-34 years
California’ . . . . . . . . . . . . . . . . . . . . . . .
Arizona . . . . . . . . . . . . . . . . . . . . . . . .Colorado . . . . . . . . . . . . . . . . . . . . . . .Hawaii . . . . . . . . . . . . . . . . . . . . . . . . .Oregon . . . . . . . . . . . . . . . . . . . . . . . .Washington . . . . . . . . . . . . . . . . . . . . . .
Connecticut . . . . . . . . . . . . . . . . . . . . . .Georgia . . . . . . . . . . . . . . . . . . . . . . . .Maryland . . . . . . . . . . . . . . . . . . . . . . .Massachusetts . . . . . . . . . . . . . . . . . . . .New York . . . . . . . . . . . . . . . . . . . . . . .Ohio . . . . . . . . . . . . . . . . . . . . . . . . . .Texas . . . . . . . . . . . . . . . . . . . . . . . . .
AboriionStates2 . . . . . . . . . . . . . . . . . . .NonaborfionStatas . . . . . . . . . . . . . . . . . .
NonreportingStates3 . . . . . . . . . . . . . . . . .Reporting States . . . . . . . . . . . . . . . . . . .
UnitedStates, interstateatudyastimate . . . . . . .UnitedStates, NCHS . . . . . . . . . . . . . . . . .
35-44 years
California’ . . . . . . . . . . . . . . . . . . . . . . .
Arizon a . . . . . . . . . . . . . . . . . . . . . . .Colorado . . . . . . . . . . . . . . . . . . . . . . .Hawaii . . . . . . . . . . . . . . . . . . . . . . . . .Oregon . . . . . . . . . . . . . . . . . . . . . . . .Washington . . . . . . . . . . . . . . . . . . . . . .
Connecticut . . . . . . . . . . . . . . . . . . . . . .Georgia . . . . . . . . . . . . . . . . . . . . . . . .Maryland . . . . . . . . . . . . . . . . . . . . . . .Massachusetts . . . . . . . . . . . . . . . . . . . .New York . . . . . . . . . . . . . . . . . . . . . . .Ohio . . . . . . . . . . . . . . . . . . . . . . . . . .Texas . . . . . . . . . . . . . . . . . . . . . . . . .
AbortionStatesZ . . . . . . . . . . . . . . . . . . .NonaborfionStates . . . . . . . . . . . . . . . . . .
NonreportingStates3 . . . . . . . . . . . . . . . . .Reporting States . . . . . . . . . . . . . . . . . . .
UnitedStates, interstatestudyestimate . . . . . . .UnitedS(ates, NCHS . . . . . . . . . . . . . . . . .
------
37.639.6
30.4
31.927.740.122.023.0
28.642.1---
11.632.826.326.6
32.030.4
---..-
31.044.4
7.5
13.97.76.74.84.7
5.511.9---
2.66.6
5.98.1
7.77.7
---
..-
7.710.2
------
37.938.4
29.6
39.016.631.716.020.4
25.624.727.614.336.225.122.6
30.026.2
.-.---
27.733.1
7.2
10.24.45.73.64.6
6.56.66.83.27.76.17.3
6.96.8
---.-.
6.98.0
-... . .
33.435.5
24.6
34.716.825.614.616.5
24.023.123.711.430.424.023.6
25.926.2
----..
26.130.8
6.1
9.14.34.02.64.2
6.26.46.12.87.54.97.2
6.36.7
------
6.57.9
29.929.2
29.531.2
23.3
23.710.526.916.114.4
15.715.716.49.6
26.717.517.2
21.917.9
21.418.1
19.423.9
5.4
5.32.84.63.03.0
4.14.13.72.77.03.54.8
5.34.4
5.24.4
4.75.9
34.235.4
35.037.7
25.6
27.213.132.821.616.8
19.416.327.212.225.520.917.2
23.719.9
23.120.4
21.425.1
6.5
5.92.95.93.44.4
4.33.14.13.27.03.64.5
5.64.2
5.54.2
4.75.6
---. . .
0.8-3.0
-2.6
22.3-32.1-20.9-18.2-11.3
-9.8-41.3
---
23.310.4-4.6
-21.0
-8.3-13.8
------
-10.6-25.4
-4.0
-26.6-42.9-34.5-25.0
-2.1
18.2-44.5
---
23.116.73.4
-9.9
-10.4-11.7
------
-10.4-21.6
------
-11.9-7.6
-16.9
-11.0-10.6-18.6-17.6-19.1
-7.0-8.5
-14.7-20.3-16.0-4.44.4
-13.7
------
-5.8-8.9
-15.3
-10.8-2.3
-29.6-27.8-6.7
-4.6-3.0
-10.3-12.5-2.6
-19.7-1.4
-8.7-1.5
------
-5.6-1.3
------
-11.7-2.1
-5.3
-31.7-37.5
4.36.8
-12.7
-34.6-32.0-22.4-15.8-12.2-27.1-27.1
-15.4-31.7
------
-25.7-22.4
-11.5
-41.8-34.915.015.4
-28.6
-33.9-35.9-39.3-3.6-8.7
-28.6-33.3
-15.9-34.3
------
-27.7-25.3
14.421.2
18.620.6
9.9
14.824.821.934.216.7
23.63.8
47.827.1-4.519.4
8.211.2
7.912.7
10.35.0
20.4
11.33.6
26.313.346.7
4.9-24.410.616.5
2.9-6.3
5.74.5
5.6-4.5
-5.1
lThe mteforl W5wasassum@ to bequaIto tierate forl W6bmuse Cafibmia Mti data bymarital statuaare notavailablepdcmto 1666.215 Stales wheraatmrtion was. legalized bythe end of 1970. Alaska, Arkansas, Caliiomia, Colorado, Oelawsm, Hawaii. Kansas, Maryland, New Mexim, New Yodc North Carolina, Oragon, SouthCamlins, Virginie, and Washington.312 Stales notraportlrsg forrnost years fmm19S3through 1977Caliiomia, Connecticut, Georgia, Idaho, Maryland, Massaahusette, Montana, Nevada, New Mexico, New YoKOhio, and Verrrw@.
NOTEUnmardsdwomenaredefinedaathosewhoaresingle,divoroed,widowad,andmantadbutseparated.Theexceptionis for NCHSratesfor theUnitedStates,forwhichunmarriedwomenIncludesingle,divoroad, and widowed women only. (Sac text and raferancaa 6-S for discuaskm of inclusion or exclusion of separated women arnemg these exposed to the risk of rmnmarifsl birth.)
21

Tabfe7. lnferentil ck=Wtin of Mtihaby matialatatus ofmther andeatimtd em~%m~of &Komhtitihq 1977and 1979
Item 1979 1977
Nonmarital births
Number in annual statistics . . . . . . . . . . . . . . . . . . . . . . . . . . . . . . . . . . . . . . . . . . . . . . . . .Sampling rate . . . . . . . . . . . . . . . . . . . . . . . . . . . . . . . . . . . . . . . . . . . . . . . . . . . . . . . .Numberinsample . . . . . . . . . . . . . . . . . . . . . . . . . . . . . . . . . . . . . . . . . . . . . . . . . . . . .
False positives:’Numberinsample . . . . . . . . . . . . . . . . . . . . . . . . . . . . . . . . . . . . . . . . . . . . . . . . . . . .
Estimated numberinannualstatistics . . . . . . . . . . . . . . . . . . . . . . . . . . . . . . . . . . . . . . . . . .Estimated percentofnonmarital births inannualstatistica . . . . . . . . . . . . . . . . . . . . . . . . . . . . . . .
False negatives:zEstimated numberinannualstatistice . . . . . . . . . . . . . . . . . . . . . . . . . . . . . . . . . . . . . . . . . .Estimatedpercentofnonmaritalbirfhs in annual statistics . . . . . . . . . . . . . . . . . . . . . . . . . . . . . . .
Marital births
Numberin annualstatistica . . . . . . . . . . . . . . . . . . . . . . . . . . . . . . . . . . . . . . . . . . . . . . . . .Sampling rate . . . . . . . . . . . . . . . . . . . . . . . . . . . . . . . . . . . . . . . . . . . . . . . . . . . . . . . .Numberinsample . . . . . . . . . . . . . . . . . . . . . . . . . . . . . . . . . . . . . . . . . . . . . . . . . . . . .
False positives:zNumberinsample . . . . . . . . . . . . . . . . . . . . . . . . . . . . . . . . . . . . . . . . . . . . . . . . . . . .Estimatednumberinannualstatistics . . . . . . . . . . . . . . . . . . . . . . . . . . . . . . . . . . . . . . . . . .Estimatedpercentofmaritalbirihs inannualatatislice . . . . . . . . . . . . . . . . . . . . . . . . . . . . . . . . .
False negatives:’
Estimated numberinannualstatistisa . . . . . . . . . . . . . . . . . . . . . . . . . . . . . . . . . . . . . . . . . .Estimated percentofmarital births inannual statistica . . . . . . . . . . . . . . . . . . . . . . . . . . . . . . . . .
74,4941/53
1,418
147421.0
7471.0
304,693112491,223
37470.2
7420.2
64,2271/52
1,246
94680.7
5020.8
283,3491/2511,127
25020.2
4660.2
lBirtkemonaouslyclassifiednonmarital(akuldhave beanclasfied matitalbytheinferentialcriteria).Wtie 14 falae@tivesinthe1979aample, 11 ware overnightseboutaumame(3involvlngSpanishdoublesurnameusageby marriedwomen),and3 were oversightsof Asianbirthplaceof mother.Of the 9 falaepoaiWeain the 1977 sample,4 were oversightsaboutsumsmes(noneSpanish),and5 wereovsrsighta of Asian birthplace of mother.‘Births erroneouslyclaaaitiedmsritsl (should havs been clsssifisd nonmarital by the infsrsntial critsria). All false negatives in both ssmpls yeara were oversights about aumamss.
22
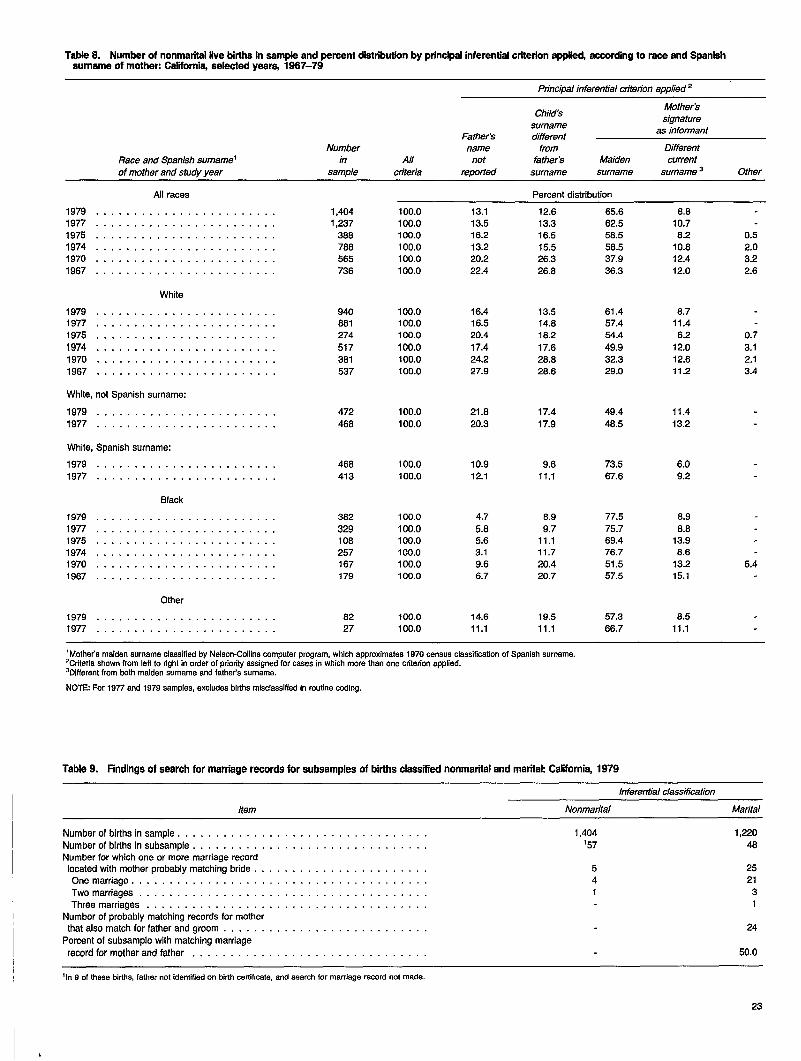
Tabfe & Numb of nonmarital five birthe in sample and percent distribution by principal inferential criterion appli~ according to race snd Spanishsurname of mother: Celiimi~ selected yearq 1967-79
Principal inferential criterion applied 2
ChildsMothef’s
surnamesignature
Father’s differentas informant
Number name from Different
Race and Spanish surname’ in All not father’s Maiden current
of mother and study year sample cnleria reported surname surname surname 3 Other
All races Percent distribution
1979 . . . . . . . . . . . . . . . . . . . . . . . . 1,404 100.0 13.1 12.6 65.6 8.61977 . . . . . . . . . . . . . . . . . . . . . . . . 1,237 100.0 13.5 13.3 62.5 10.7
1975 . . . . . . . . . . . . . . . . . . . . . . . . 388 100.0 16.2 16.5 58.5 8.2 0.51974 . . . . . . . . . . . . . . . . . . . . . . . . 786 100.0 13.2 15.5 56.5 10.8 2.01970 . . . . . . . . . . . . . . . . . . . . . . . . 565 100.0 20.2 26.3 37.9 12.4 3.21967 . . . . . . . . . . . . . . . . . . . . . . . . 738 100.0 22.4 26.8 36.3 12.0 2.8
White
1979 . . . . . . . . . . . . . . . . . . . . . . . .1977 . . . . . . . . . . . . . . . . . . . . . . . .
1975 . . . . . . . . . . . . . . . . . . . . . . . .
1974 . .,, . . . . . . . . . . . . . . . . . . . .1970 . . . . . . . . . . . . . . . . . . . . . . . .1967 . . . . . . . . . . . . . . . . . . . . . . . .
940 100.0100.0100.0
100.0100.0100.0
16.416.520.4
17.4
24.227.9
13.514.816.2
17.628.828.6
61.457.454.4
49.9
32.329.0
8.711.4
6.2
12.0
12.611.2
6610.7274
517381537
3.12.13.4
White, not Spanish surname:
1979 . . . . . . . . . . . . . . . . . . . . . . . .7977. .,, . . . . . . . . . . . . . . . . . . . .
472 100.0100.0
21.6
20.3
17.4
17.9
49.4
48.511.4
13.2466
White, Spanish surname:
1979 . . . . . . . . . . . . . . . . . . . . . . . .1977 . . . . . . . . . . . . . . . . . . . . . . . .
466413
100.0
100.010.912.1
9.611.1
73.567.6
6.09.2
Black
1979 . . . . . . . . . . . . . . . . . . . . . . . .
1977 . . . . . . . . . . . . . . . . . . . . . . . .1975 . . . . . . . . . . . . . . . . . . . . . . . .
1974 . . . . . . . . . . . . . . . . . . . . . . . .1970 . . . . . . . . . . . . . . . . . . . . . . . .1987 . . . . . . . . . . . . . . . . . . . . . . . .
382 100.0
100.0100.0100.0
100.0100.0
4.75.65.63.19.66.7
8.99.7
11.111.720.420.7
77.575.769.476.751.557.5
8.98.8
13.98.6
13.215.1
108257167179
5.4
Other
1979 . . . . . . . . . . . . . . . . . . . . . . . . 82 100.0 14.6 19.5 57.3 6.5
1977 . . . . . . . . . . . . . . . . . . . . . . . . 27 100.0 11.1 11.1 66.7 11.1
lMother’s malden=urname claaaifiadby Nelaon-CcIllinscomputer program, which approximate=1970 census claas”ficafionOfSpanish surname.7Criterlashown from left to right in order of priority aasignedfor ceeea in which more than one criterion applied.3Dlfferentfrom both maiden surname and father’s surname.
NOTEFor1977and 1979aamples,excludes birthamisclassifiadin routinecmling.
Table9. Findingsofsesrch formsrriage records forsubeemples ofbirthsclassikfno nmarital andmarftak Cslifom@ 1979
Inferential classification
Item Nonmarital Marital
Numberofbkthsins ample. . . . . . . . . . . . . . . . . . . . . . . . . . . . . . . . .Numberofbkthelnsubaample . . . . . . . . . . . . . . . . . . . . . . . . . . . . . . .Number for which one or more marriage recordIocatedwith motherprobablymatching bride. . . . . . . . . . . . . . . . . . .Onemarriage . . . . . . . . . . . . . . . . . . . . . . . . . . . . . . . . . . . . . . .Twomarriag8s . . . . . . . . . . . . . . . . . . . . . . . . . . . . . . . . . . . . . .Threemarriagee . . . . . . . . . . . . . . . . . . . . . . . . . . . . . . . . . . . . .
Number of probably matching records for motherthatalso matchforfatherandgroom . . . . . . . . . . . . . . . . . . . . . . . . . . .
Percent of eubsample with matching marriagerecordformotherandfather.. . . . . . . . . . . . . . . . . . . . . . . . . . . . . .
1,404
’57
1,22046
252131
541
24
50.0
~lneof these bkths,faf hernot Identified on birth cetifcate, andsaarch for marriage record not made.
23
I

Appendixes
Contents
I. Reporting status of States, 1965and 1970-80 . . . . . . . . . . . . . . . . . . . . . . . . . . . . . . . . . . 25
11. Inferential criteria . . . . . . . . . . . . . . . . . . . . . . . . . . . . . . . . . . . . . . . . . . . . . . . .26
III. Intercensal population estimates . . . . . . . . . . . . . . . . . . . . . . . . . . . . . . . . . . . . . . . . . 27
Iv. Nonlicensed marriages in California. . . . . . . . . . . . . . . . . . . . “.” . ” . ” ” ” . . . . . . . . . . 28
24

Appendix IReporting status of States,1965 and 1970-80
Reporting States are those in which the birth certificateincludes a question about the legitimacy of the child or themarital status of the mother.
Reporting 1965 and 1970-80 (30 States and the District ofColumbia)
AlabamaAlaskaDelawareDistrict of ColumbiaFloridaHawaiiIllinoisIndianaIowaKansasKentuckyLouisianaMaineMinnesotaMississippiMissouri
New JerseyNorth CarolinaNorth DakotaOregonPennsylvaniaRhode IslandSouth CarolinaSouth DakotaTennesseeUtahVirginiaWashingtonWest VirginiaWisconsinWyoming
Nonreporting 1965 and 1970-80
California MontanaConnecticut New Mexico’Georgia’ New YorkMaryland
‘Started reporting in 1980.
Reporting 1965, nonreporting 1970-80
NevadabOhio
Nonreporting 1965, reporting 1970-80
Arizona NebraskaArkansas New HampshireColorado Oklahoma
Reporting 1965 and 1970-77, nonreporting 1978–80
MichiganTexasc
Nonreporting 1965 and 1970-1977, reporting 1978–80
IdahoMassachusettsVermont
bNonreporting 1971-80.‘Reporting 1965 and 1970-76.
25
1
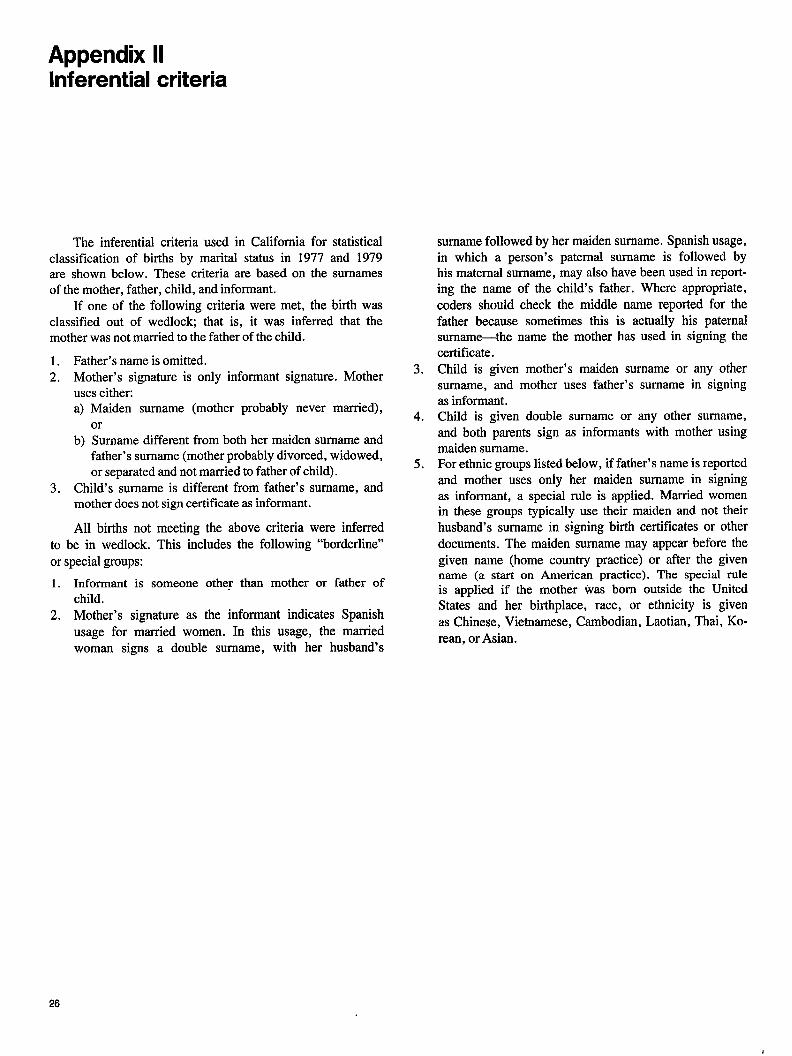
Appendix IIInferential criteria
The inferential criteria used in California for statisticalclassification of births by marital status in 1977 and 1979are shown below. These criteria are based on the surnamesof the mother, father, child, and informant.
If one of the following criteria were met, the birth wasclassified out of wedlock; that is, it was inferred that themother was not married to the father of the child.
1. Father’s name is omitted.2. Mother’s signature is only informant signature. Mother
uses eitheca)
b)
Maiden surname (mother probably never married),orSurname different from both her maiden surname andfather’s surname (mother probably divorced, widowed,or separated and not married to father of child).
3. Child’s surname is different from father’s surname, andmother does not sign certificate as informant.
All births not meeting the above criteria were inferredto be in wedlock. This includes the following “borderline”or special groups:
1. Informant is someone other than mother or father ofchild.
2, Mother’s signature as the informant indicates Spanishusage for married women. In this usage, the marriedwoman signs a double surname, with her husband’s
3.
4.
5.
surname followed by her maiden surname. Spanish usage,in which a person’s paternal surname is followed byhis maternal surname, may also have been used in report-ing the name of the child’s father. Where appropriate,coders should check the middle name reported for thefather because sometimes this is actually his paternalsurname-the name the mother has used in signing thecertificate.Child is given mother’s maiden surname or any othersurname, and mother uses father’s surname in signingas informant.Child is given double surname or any other surname,and both parents sign as informants with mother usingmaiden surname.For ethnic groups listed below, if father’s name is reportedand mother uses only her maiden surname in signingas informant, a special rule is applied. Married womenin these groups typically use their maiden and not theirhusband’s surname in signing birth certificates or otherdocuments. The maiden surname may appear before thegiven name (home country practice) or after the givenname (a start on American practice). The special ruleis applied if the mother was born outside the UnitedStates and her birthplace, race, or ethnicity is givenas Chinese, Vietnamese, Cambodian, Laotian, Thai, Ko-rean, or Asian.
26

Appendix IllIntercensal population estimates
The populations used as denominators to compute birthrates for unmarried women by State are based on unpublishedpopulation estimates by age prepared by the U.S. Bureauof the Census using a component method. 17 The percentfemale, percent white, and percent unmarried were appliedto the population estimate for each age group. These percentswere derived from the 1970 census, U.S. Bureau of theCensus administrative records studies, and the Current Popula-tion Survey,
The assumption behind the intercensal estimates is thatthe proportions unmarried among women in different ageand race groups in each State have changed since 1970 inthe same direction and by the same relative amounts as indi-cated for the country as a whole by the Current PopulationSurvey. For California, this assumption was tested by compari-son of study proportions with data from the 1980 State CensusSummary Tape File 2. This showed close agreement between1980 State Census proportions unmarried and the study propor-tions projected to April 1, 1980. (There was less than 2-percentdifference for each age group of women except ages 35-44,for which the difference was 3 percent.) Thus, for California,only a small error results from using this assumption aboutmarital status,
Rates for 1975 and 1979 were revised to take into accountthe results of the 1980 census. Rates for 1971, another intercen-sal year examined in this report, were not adjusted becausethe adjustment would have had little effect on the estimatedrates and would have required considerable resources thatwere not available. The 1980 census data used to revisethe 1975 and 1979 rates by age were obtained from a 1980
census publication. ]9 The 1980 data by race were unpublishedestimates consistent with the OffIce of Management and Budgetcategories and the 1970 race classification.
The method used for adjusting the 1975 and 1979 popula-tion estimates used in this report is identicaf with that usedby the U.S. Bureau of the Census to prepare national intercensalpopulation estimates for the United States.’8 Denominatorsfor the adjusted rates are based on the original study estimatesof female populations by age because they incorporate thebest estimates presently available of net migration in eachState in each intercensal year. The method of adjustmenttakes into account both the length of time since the 1970census and the discrepancy between the 1980 census countand the study estimates projected to April 1, 1980. Algebrai-cally, the procedure is as follows:
(lo– t) fi,m,j + t-E”,10,JFiti= fti *
10”fi,{~,j
where
i = each selected State and group of States.t = 5.25 or 9,25 (number of years from April 1, 1970,
to July 1, 1975, and April 1, 1970, to July 1, 1979).j = age groups 15-44, 15–19, 20-24, 25–34, 35-44; also,
1544 white, 1544 all other races.~ti = revised estimate for State i at time t of number of
females in age-race groupj; E, 10,J= 1980 census count.& = original study estimate prepared before availability of
1980 census findings; f, 10,j = study estimate projected toApril 1, 1980.
NOTE A list of references follows the text.

Appendix IVNonlicensed marriages inCalifornia
The following discussion of nonlicensed marriages wasabstracted from a detailed report on this topic prepared bythe California Center for Health Statistics. 20Nonlicensed mar-riages are those in which couples who have been living togetherare allowed to be married confidentially without obtaininga license or health certificate. The legislation permitting thesemarriages was adopted in 1878 (Section 4213 of the CaliforniaCivil Code). Its purpose was to legitimize longstandingrelationships of couples and to secure inheritance rights oftheir children without the embarrassment of a publicly an-nounced wedding. Records were kept only by clergymen per-forming the marriage, so the number performed each yearwas unknown.
In the 1960’s an increase in unlicensed marriages wasindicated from fragmentary data. In 1972, Section 4213 wasamended to require reporting to county clerks, who in turnwere required to keep sealed records and to report total numbersto the California Department of Health Services. Thisdocumented the rapid increase and large volume of nonlicensedmarriages between 1972 and 1981 (1,290 to 54, 121).20’21Although no surveys have been conducted to explain thetrend, it seems likely that both convenience and commercialpromotion were involved. Legislation effective January 1,1982, established new requirements for California nonlicensedmarriages, including maintenance of a statewide alphabeticindex.
NOTE A list of references follows the text.
28
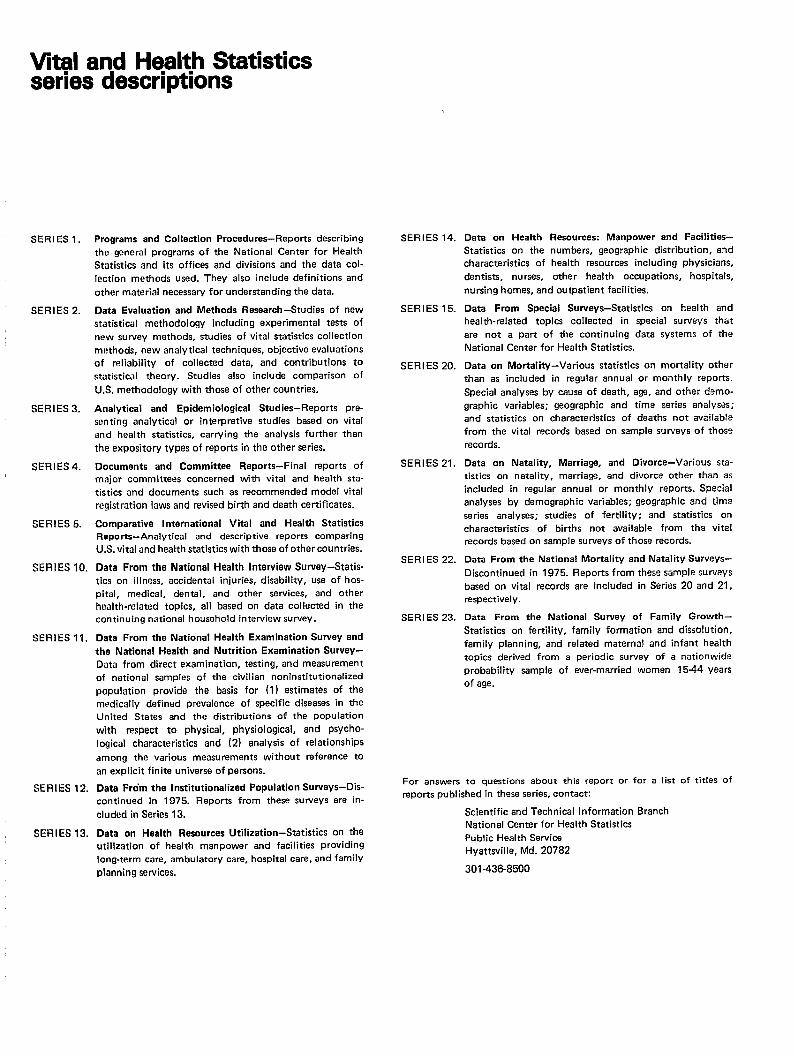
Vital and Health Statisticsseries descriptions
SERIES 1.
SERIES 2.
SERIES 3.
SERIES4.
SERIES 5.
Programs and Collection Procedures–Repons describing
the general programs of the National Center for Health
Statistics and its offices and divisions and the data col-
lection methods used. They also include definitions and
other material necessary for understanding the data.
Data Evaluation and Methods Research –Studies of new
statistical methodology including experimental tests of
new survey methods, studies of vital statistics collection
methods, new analytical techniques, objective evaluations
of reliability of collected data, and contributions to
statistical theory. Studies also include comparison of
U.S. methodology with those of other countries.
Analytical and Epidemiological Studies–Reports pre-
senting analytical or interpretive studies based on vital
and health statistics, carrying the analysis further than
the expository types of reports in the other series.
Documents and Committee Reports-Final reports of
major committees concerned with vital and health sta-
tistics and documents such as recommended model vital
registration laws and revised birth and death certificates.
Comparative International Vital and Health Statistics
Reports-Analytical and descriptive reports comparing
U.S. vital and health statistics with those of other countries.
SERIES 10. Data From the National Health Interview Survey-Statis-
tics on illness, accidental injuries, disability, use of hos-
pital, medical, dental, and othar services, and othar
health-related topics, all based on data collected in the
continuing national household interview survey.
SERIES 11. Data From the National Health Examination Survey and
the National Health and Nutrition Examination Survey–
Data from direct examination, testing, and measurement
of national samples of the civilian noninstitutional ized
population provide the basis for (1) estimates of the
medically defined prevalence of specific diseases in the
United States and the distributions of the population
with respect to physical, physiological, and psycho-
logical characteristics and (2) analysis of relationships
among the various measurements without reference to
an explicit finite universe of persons.
SERIES 12. Data From the Institutionalized Population Surveys-Dis-
continued in 1975. Reports from these surveys are in-
cluded in Series 13.
SERIES 13. Data on Health Resourcas Utilization-Statistics on theutilization of health manpower and facilities providing
Iongterm care, ambulatory care, hospital care, and family
planning services.
SERIES 14. Data on Health Resources: Menpower and Facilities–
Statistics on the numbers, geographic distribution, and
characteristics of health resources including physicians,
dentists, nurses, other health occupations, hospitals,
nursing homes, and outpatient facilities.
SERIES 15. Data From Special Surveys-Statistics on health andhealth-related topics collected in special surveys that
are not a part of the continuing data systems of the
National Center for Health Statistics.
SERIES 20. Data on Mortality-Various statistics on mortality other
than as included in regular annual or monthly reports.
Special analyses by cause of death, age, and other demo-
graphic variables; geographic and time series analyses;
and statistics on characteristics of deaths not available
from the vital records based on sample surveys of those
records.
SERIES 21. Data on Natality, Marriage, and Divorce–Various sta-
tistics on natality, marriage, end divorce other than as
included in regular annual or monthly reports. Special
analyses by demographic variables; geographic end tima
series analyses; studies of fertility; and statistics on
characteristics of births not available from the vital
records based on sample surveys of those records.
SERIES 22. Data From the National Mortality and Natality Surveys–
Discontinued in 1975. Reports from these sample surveys
based on vital records are included in Series 20 and 21,
respective y.
SERIES 23. Data From the National Survey of Family Growth–
Statistics on fertility, family formation and dissolution,
family planning, and related maternal and infant health
topics derived from a periodic survey of a nationwide
probability sample of ever-married women 15-44 years
of age,
For answers to questions about this report or for a list of titles of
reports published in these series, contact:
Scientific and Technical Information Branch
National Center for Health Statistics
Public Health Service
Hyattsville, Md. 20782
301-436-8500

U.S. DEPARTMENT OF HEALTH AND HUMAN SERVICESPublic Health ServiceNationel Center for Health Statiatica37OOEast-West HighwayHyattsville, Maryland 20782
OFFICIAL BUSINESSPENALTY FOR PRIVATE USE, $300
THIRD CLASS MAIL
POSTAGE& FEES PAIDPHS/NCHS
PERMIT No. G-281
DHHS Publication No. (PHS) 85-1371, Series 2, No. 97