an evaluation of deterrent methods utilized to prevent
TRANSCRIPT

Western Kentucky UniversityTopSCHOLAR®
Masters Theses & Specialist Projects Graduate School
Summer 2018
An Evaluation of Deterrent Methods Utilized toPrevent Crop Raiding by African Elephants(Loxodonta Africana) in the Kasigau WildlifeCorridor, KenyaRebecca Lynn Von HagenWestern Kentucky University, [email protected]
Follow this and additional works at: https://digitalcommons.wku.edu/theses
Part of the Behavior and Ethology Commons, Natural Resources and Conservation Commons,and the Zoology Commons
This Thesis is brought to you for free and open access by TopSCHOLAR®. It has been accepted for inclusion in Masters Theses & Specialist Projects byan authorized administrator of TopSCHOLAR®. For more information, please contact [email protected].
Recommended CitationVon Hagen, Rebecca Lynn, "An Evaluation of Deterrent Methods Utilized to Prevent Crop Raiding by African Elephants (LoxodontaAfricana) in the Kasigau Wildlife Corridor, Kenya" (2018). Masters Theses & Specialist Projects. Paper 3068.https://digitalcommons.wku.edu/theses/3068

AN EVALUATION OF DETERRENTS TO PREVENT CROP RAIDING BY AFRICAN ELEPHANTS (LOXODONTA AFRICANA)
IN THE KASIGAU WILDLIFE CORRIDOR, KENYA
A Thesis Presented to
The Faculty of the Department of Biology Western Kentucky University
Bowling Green, Kentucky
In Partial Fulfillment Of the Requirements for the Degree
Master of Science
By Rebecca Lynn Von Hagen
August 2018

AN EVALUATION OF DETERRENTS TO PREVENT CROP RAIDING BY AFRICAN ELEPHANTS (LOXODONTA AFRICANA)
IN THE KASIGAU WILDLIFE CORRIDOR, KENYA

ACKNOWLEDGEMENTS
The chance to return to academics after such a long absence has truly been the
dream of my life, and I have so many people to thank. First and foremost is my husband,
without whom none of this would be possible. When he found out it was my desire to
return to school and finish my education, he simply made it happen. He has been my
rock, enduring long months without me, keeping our home going while I was in Africa
chasing elephants and dreams. My friends and family have been more than supportive
of me, especially when the way was tough. Dr. Schulte took a chance accepting a non-
traditional student into his lab, and his enduring support, patience and genius have
caused me to thrive in this academic environment, and I hope we continue to
collaborate. My committee of Dr. Nancy Rice and Dr. Michael Stokes have also been a
source of inspiration and knowledge, and I have appreciated their input. The graduate
school and administrative staff at WKU (ahem, Jessica Dunnegan!) were always there to
help with logistics and paperwork, and with over a year spent in Africa, that was no
small task. Samantha Thomas also helped keep me sane while navigating the statistical
analyses.
With such an expansive project, there are several partners to express my
undying gratitude toward. I feel the need to point out the irony and pride of being an
Earthwatch team member, after spending my teenage years wistfully dreaming while
flipping through their catalogs. Stan, Caroline, Kim, & Mary of Earthwatch were helpful
beyond measure. In addition, funding from the International Elephant Foundation made
this project possible, and I hope our research contributes to the amazing work they
continue to support on behalf of the elephants. I also appreciate the support of the
iii

iv
WKU Graduate School Research Grant committee, the WKU Center for Biodiversity
Studies, and the WKU Sisterhood for their financial support.
A special thanks to my colleagues in Kenya at Wildlife Works, Dr. Mwangi Githiru,
Simon Kasaine, and Bernard Amakobe who constantly taught me about their homeland
and culture. Simon allowed me to invade his home for two months when I first arrived
and kept a watchful eye to make sure I was safe, while constantly challenging my
scientific preconceptions and becoming my dear friend. Jamie, Keith, and Cara, also of
Wildlife Works, were the perfect hosts, making sure our team had everything they
needed to be successful, including some fun. The rangers of Rukinga Ranch always made
sure I felt safe and welcome, especially Joseph, my constant companion during
fieldwork. A huge thanks to all my big brothers at Kivuli Camp that kept watch over me
and made sure I had everything I needed from such an amazing place, including
companionship and snake removal. Thanks also to Dr. Lucy King and her team from Save
the Elephants for their collaboration and assistance with our beehive fence project.
The Kenyan people, including our participating farmers, made me feel the most
welcome and safe of any place I have ever been. I learned from them every day, even if I
did not speak the same language. Their resilience and kindness will never be forgotten.
Despite the challenges involved in a project like this, the one thing that always grounded
me were the times that I was privileged to have close encounters with the elephants. As
someone who got a second chance, I will make sure that my work in the future makes a
positive contribution towards elephant conservation, while aiding the people that live
amongst them.

v
CONTENTS
Introduction ..........................................................................................................................1
Methods .............................................................................................................................10
Results ................................................................................................................................26
Discussion ...........................................................................................................................30
Literature Cited ...................................................................................................................58
Appendix I: Surveys of Tree Damage as an Indicator of Crop Raiding Fluctuations ......... 69
Appendix II: Elephant Identification and Wildlife Presence Surveys .................................84
Appendix III: Degradation Rates of Capsaicin in Chili Pepper Fences ................................96

vi
LIST OF FIGURES
Figure 1. Characteristic of effective deterrent measures ................................................ 40
Figure 2. A chili pepper fence .......................................................................................... 40
Figure 3. A metal strip fence ............................................................................................ 41
Figure 4. A bee hive fence ............................................................................................... 41
Figure 5. A map of the study area .................................................................................... 42
Figure 6. Field arrangement of experimental blocks at Sasenyi ..................................... 43
Figure 7. Example of an experimental block layout ........................................................ 43
Figure 8. Satellite images of experimental blocks .......................................................... 44
Figure 9. Panel section numbers for experimental fields ............................................... 46
Figure 10. Acacia fence ................................................................................................... 47
Figure 11. Chili fence materials ....................................................................................... 47
Figure 12. Metal control fence ........................................................................................ 48
Figure 13. Examples of crop condition scores ................................................................ 48
Figure 14. Block four reconfiguration ............................................................................. 49
Figure 15. Elephant approaches to deterrents ............................................................... 49
Figure 16. Boxplot of elephant approaches to deterrents in all blocks ........................... 50
Figure 17. Damage to fields by deterrent measure ........................................................ 50
Figure A1.1 Elephant tree damage .................................................................................. 74
Figure A1.2 Tree and wildlife transects established in Rukinga Ranch ........................... 75
Figure A2.1 Example of elephant identification data ...................................................... 90
Figure A3.1 Chili fence lab experiment ........................................................................... 104

vii
LIST OF TABLES
Table 1. Condition scores for crops ................................................................................. 51
Table 2. All elephant approaches and successful raids ................................................... 52
Table 3. Deterrents and their controls Fisher’s exact results ......................................... 52
Table 4. ANOVA table of elephant approaches .............................................................. 53
Table 5. Tukey test for approaches in relation to blocks ................................................ 53
Table 6. Composition of elephant raiding groups ........................................................... 53
Table 7. Crop damage by crop species, type of damage, and deterrent ........................ 54
Table 8. ANOVA table for crops consumed ..................................................................... 55
Table 9. Tukey test for crops consumed by crop types .................................................. 55
Table 10. ANOVA table for crops trampled .................................................................... 55
Table 11: Tukey test for crops trampled by deterrent types .......................................... 56
Table 12. ANOVA table for total crop damage ............................................................... 56
Table 13. Tukey test for overall damage by crop type ................................................... 57
Table 14. Summary of crop destruction by crop ............................................................. 57
Table 15. Species present in field at experimental area ................................................. 57
Table A1.1 Descriptive data of tree and wildlife transects in Rukinga Ranch ................. 79
Table A1.2 Tree sampling locations ................................................................................. 80
Table A1.3 Impact scores for elephant damage .............................................................. 81
Table A1.4 African tree species surveyed ........................................................................ 82
Table A1.5 Occurrence of damage types in African trees ............................................... 83
Table A1.6 Amounts of bark stripping and branch breaking in African trees ................. 83

viii
Table A2.1 Age classes of elephant males and females .................................................. 91
Table A2.2 Elephant numbers by age class ...................................................................... 92
Table A2.3 Wildlife transect species and quantities ........................................................ 93
Table A2.4 Wildlife sex and age quantities ...................................................................... 95
Table A3.1 Final pump settings for LCMS ...................................................................... 105
Table A3.2 Chili cloth experimental results ................................................................... 105
Table A3.3 LCMS results for capsaicin ........................................................................... 106
Table A3.4 LCMS results for dihydrocapsaicin ................................................................ 107

ix
AN EVALUATION OF DETERRENTS TO PREVENT CROP RAIDING BY AFRICAN ELEPHANTS (LOXODONTA AFRICANA) IN THE KASIGAU
WILDLIFE CORRIDOR, KENYA
R. Lynn Von Hagen August 2018 107 pages
Directed by: Bruce A. Schulte, Nancy A. Rice and Michael Stokes
Department of Biology Western Kentucky University
Escalating human elephant conflict (HEC) continues to be a contributing factor
towards elephant decline, and crop raiding is the most common form of negative
human-elephant interactions. For communities that cannot reverse or prevent crop
raiding, it is necessary to contain HEC events through deterrent measures. Few
deterrent measures exist that combine practicality and affordability while also
preventing habituation by elephants. This project focused on comparing the efficacy of
deterrent methods to assess which was the most successful at preventing elephants
from entering crops in the farming community of Sasenyi, Kenya. In this paired-control
study, four deterrent methods were evaluated: acacia fences, chili-pepper fences, a
new metal strip fence, and a combination of a chili and metal strip fence. Of the over
400 visits by elephants to individual fields containing crops recorded during two field
seasons, elephants entered farmer fields in the experimental area on 33 occasions
(<10%). Analysis of incidents when elephants approached at less than 50 m revealed
that the chili + metal fence and the metal fence were significantly more effective than
no deterrent. Following further verification of its effectiveness, this new deterrent
method could be a powerful new tool to alleviate elephant crop raiding and reduce HEC.

1
INTRODUCTION
Human wildlife conflict (HWC) occurs across the globe whenever wildlife and
people have negative interactions, often in competition over resources (Decker & Chase,
1997; Madden, 2004; Songhurst, 2017; Treves et al., 2006). As anthropogenic activities
and human dispersal continue to increase, so do negative encounters with elephants
(Bel et al., 2010; Hoffmeier-Karimi & Schulte, 2015). These interactions may result in
conflicts that lead to injury or death, biodiversity loss, destruction of property or
holdings, and the creation of management concerns for government agencies; thus,
they can be detrimental to conservation efforts (Barua et al., 2013; Bond, 2015; Moss,
1988; Sitati et al., 2003; Treves et al., 2009). Additional consequences to local people
from HWC include compromises to physical or mental health, loss of employment or
livelihood, and exposure to social inequities (Barua et al., 2013; Bond, 2015; Treves et
al., 2006).
Schulte (2016) identifies three factors that continue to escalate HWC: (1) species
are being driven out of their native habitats for anthropogenic usage, (2) modern
agricultural developments have selected for nutrient-dense plants whose natural
defenses have been lost, and (3) livestock or domestic pets now occupy spaces where
wildlife once freely ranged. Other factors such as habitat loss, fragmentation, and
climate change exacerbate the situation (Desai & Riddle, 2015; Karidozo & Osborn,
2015; Nelson et al., 2003). The same factors that contribute to HWC also have serious
implications toward elephant conservation. African savannah, Loxodonta africana,
African forest, Loxodonta cyclotis, and Asian elephants, Elephas maximus are showing

2
an overall decline primarily from human elephant conflict (HEC) and poaching for their
ivory (Chase et al., 2016; Graham et al., 2009; Hoare & Toit, 1999; Vollrath & Douglas-
Hamilton, 2002; Wittemyer et al., 2014). The need for conservation of these species
provides further incentive towards mitigating the factors that contribute to HEC.
HEC occurs most commonly in the form of crop raiding, in which groups or
individual elephants feed on crop fields, primarily at night when their movements are
cloaked by darkness (Graham et al., 2009; Le Bel et al., 2007; Smith & Kasiki, 2000). This
results in partial or complete loss of crops due to consumption, trampling, and/or dung
deposition (Kagwa, 2011; Sitati & Walpole 2003). A typical six-ton African elephant
(5443 kg) can consume up to 7% of its body weight each day and expends up to 17
hours per day in search of food and water (Ruggiero 1992). Instead of foraging in their
natural habitats, elephants, often males, can maximize their nutrient and mineral intake
by raiding crops, which is especially beneficial to reproductive success (Chiyo, et al.,
2012). The principles of optimal foraging theory demonstrate that animals will minimize
energy spent traveling to forage by seeking out areas containing the greatest nutritional
benefits (Sinervo, 2013). With the advent of agriculture, humans have introduced
elements that have interrupted the natural foraging patterns and migration routes of
elephants. Instead of moving from one natural area to another, elephants turn to
agricultural fields and commonly return to areas where they have previously
successfully raided (Chiyo & Cochrane, 2005; Sitati et al., 2003), creating an ongoing
conservation issue.

3
Rural farmers in Africa have difficulty predicting and managing crop raiding
incidents, and they can suffer loss of livelihood because of crop destruction by elephants
(Chiyo et al., 2005; O’Connell-Rodwell et al., 2000). Prevention is one of the most
important ways to alleviate crop raiding (Chiyo & Cochrane, 2005; R. Hoare, 2012; Swan
et al., 2017), and studies have shown that the most frequently raided farms are located
near the boundaries of national parks or community ranches (Chiyo et al., 2005;
Naughton-Treves & Treves, 2005; Sitati et al., 2003). However, moving established
homesteads or fields further from these boundaries is rarely practical, which makes
these areas prone to high incidents of HEC.
Farmers and conservationists may attempt to contain crop raiding incidents,
sometimes resorting to risky and often dangerous attempts to scare away elephants
(Desai & Riddle, 2015; Graham et al., 2012; Kagwa, 2011). Crop raiding incidents
involving elephants usually result in anger and resentment from the community and can
leave negative impressions of conservation efforts (Lee, 2010; Naughton-Treves &
Treves, 2005; Smith & Kasiki, 2000). In addition, rural farmers are often left with the
monumental task of defending their crops without assistance from government wildlife
agencies or Non-Governmental Organizations (NGOs) (Graham & Ochieng, 2008).
Since the 1990s, efforts have been made to reduce instances of HEC through
non-lethal mitigation techniques, and research is on-going to determine which
techniques are the most successful. Effective deterrents will increase the risks (or costs)
of crop raiding to elephants to a level greater than the nutritional benefit (Hoare, 1999
& 2012). These deterrents should satisfy three criteria: affordability, practicality

4
(including safety), and most importantly resistance to habituation (Figure 1). With
limited resources, rural farmers are often challenged to meet these criteria; poverty
makes many deterrent measures unattainable and lack of basic conveniences such as
water and/or electricity make erecting and maintaining some deterrents impractical.
Other key components to crop raiding deterrent solutions are proper implementation
and cooperation from farmers and the community (Graham & Ochieng, 2008; O'Connell-
Rodwell et al., 2000).
Deterrent measures utilize signal theory, in which humans are attempting to
honestly convey a message to elephants that entering the crop would be detrimental,
and thus the elephant should modify their behavior and move away (Searcy & Nowicki,
2005). Sometimes the most difficult challenge is elephants’ intelligence, as they can
devise ways to overcome deterrent measures. Unless punishment is sometimes
received that will create a negative association when an elephant encounters a
deterrent method, elephants can habituate and become unafraid or accustomed to the
method(s). Even if elephants do circumvent a deterrent, a method can still be successful
if it provides some type of residual discomfort or intermittent defense that causes the
elephant to leave quickly. Minimal amounts of crop damage could be a sign that
elephants were too uncomfortable to remain long enough to do substantial damage,
which is a type of deferred success.
Fences are sometimes used as a basic line of defense against crop raiding
animals. Farmers that erect traditional wire or metal fences may find them to be
ineffective as elephants can easily break through unless they are made of barbed wire,

5
which inflicts pain (Sitati et al., 2005). Once inside a fence, if there is no residual
deterrence, elephants can do large amounts of damage. Electric fences can be effective
deterrents, but they can be financially unobtainable or suffer from unreliable electricity
sources (Connell-Rodwell et al., 2000; Kioko etal.,2008). Solar fences, which negate the
necessity for electricity obtained from a power plant, are an alternative (Davies et al.,
2011) but can be very costly. Elephants can sometimes overcome electric fences by
laying logs across them, removing electric components, or using their tusks to snap the
wires (Kioko et al., 2008; Mutinda et al., 2014). For fencing projects to be successful,
regular maintenance and freedom from theft and vandalism are also necessary.
Traditionally, rural farmers have used low-technology methods such as banging
drums, spotlights, digging ditches, burning fires, guarding or patrolling, and owning dogs
to deter elephants. For example, acacia thorn fences have been used as livestock bomas
or spread around crops to prevent goats and cows from entering fields (Chang’a et al.,
2015; McKnight, 2004), but their efficacy as an elephant deterrent has not been
explored [African acacias have been reclassified in the genus Vachellia or Senegalia but
will be colloquially referred to as acacia throughout this document (Dyer, 2014)].
Elephants may find acacia painful because of sharp thorns and choose to enter
unprotected farms. Some deterrent efforts can be dangerous and/or result in loss of
sleep or absence from school or work for farmers and their families due to increased
vigilance at night (Barua et al., 2013; Hill, 2004; Le Bel et al., 2007). Many traditional
techniques are affordable or practical and initially show promise but lose their

6
effectiveness as elephants habituate to them over time, or adjust their raiding habits to
avoid them (Goodyear & Schulte, 2015; O'Connell-Rodwell et al., 2000).
Some modern deterrent techniques incorporate aspects of multi-modal, often
unpleasant stimuli that alert elephants of their presence. Bee hive fences have emerged
as a promising deterrent method (Figure 4), and experiments have shown them to be up
to 80% effective (King et al., 2017). Habituation is low, as every time the beehives are
disturbed, bees emerge and attempt to sting, creating a recurring negative association.
Success using bee hive fences reinforces the concept of multi-modal signals coupled
with positive punishment as an effective elephant deterrent, since elephants are less
likely to habituate to or overcome these techniques, and the punishment strives to
reduce the undesired behavior. In 2017, the Sasenyi area experienced a severe drought
and bee colonies could not be established. Thus, beehive fences were deemed the least
practical for immediate evaluation, but their incorporation in the future is anticipated.
Another such negative element that elephants encounter is capsaicin (the active
component of chili peppers), which stimulates the trigeminal nerve, causing irritation to
the mucus membranes as well as other sensitive areas (Le Bel et al., 2010; Osborn &
Rasmussen, 1995). Capsaicin is only fully soluble in an oil, and researchers have
discovered that it has deterrent properties when mixed with used engine oil. Farmers
use ground chili peppers mixed with the oil and applied to rope to form a crop raiding
deterrent fence (Figure 2) (Chang ’a et al., 2016; Karidozo & Osborn, 2015). In addition
to the noxious odor, potential crop raiders must deal with moving cloths and ropes
coated in irritating motor oil that must be broken through or avoided to gain entry. It is

7
unknown at what distance elephants can detect this mixture, and it may have residual
deterrent effects if an elephant breaks through a chili fence and gets the mixture on its
skin. While these fences have been found to be effective in many areas, the mixture
requires regular reapplication, and farmers often abandon the method unless it is part
of a managed program (Davies et al., 2011; Graham & Ochieng, 2008; Hoare, 2012). The
use of a visual and/or a moving barrier plus the irritating nature of chili peppers coupled
with the noxious odor of motor oil is an example of a (sometimes) successful way to
construct a multi-modal deterrent fence.
Novel and successful deterrent methods are rare but advancing the science
behind crop raiding deterrence is a crucial component of elephant conservation. Mr.
Simon Kasaine, a project collaborator from Wildlife Works in Kenya, invented a new
technique made from locally available materials composed of lightweight metal strips
cut from mabati metal strung on binding wire (Figure 3). When the wind blows, or the
fence is contacted, the strips clatter together and sound like a rudimentary wind chime.
In addition to being slightly sharp, the strips are also highly reflective in the sun, and on
bright moonlit nights. This provides a physical, auditory, and visual signal to elephants of
the fence’s presence. Any sound or reflection could prevent elephants from approaching
closely, and the metal pieces strung on a wire could make entry difficult. The
intermittent and multi-modal signals signifying the presence of the fence and the
negative consequences of trying to break through the fence may make this technique
resistant to habituation. For example, a startling sound when the wind blows or when
an elephant contacts the wire may prevent elephants from entering, but if they initially

8
break through the fence, the intermittent nature of the startling noise and the potential
annoyance of the sharp metal may cause them to spend less time in the field, therefore
minimizing damage. The materials for the metal strip fence are relatively inexpensive,
the fence requires little maintenance, and it can easily be repaired if broken. The metal
fence has been deployed as a simple boundary fence and observers have noted that
elephants go out of their way to detour around, yet no experiments have quantified the
effectiveness of this technique. Because the metal fence is practical and affordable,
evaluation may reveal if metal strip fences complete the requirements of an ideal
deterrent method by being resistant to habituation.
The main purpose of the present study was to investigate the efficacy of four
deterrent methods utilized to alleviate crop raiding in the Kasigau Wildlife Corridor of
Southern Kenya, Africa: a chili pepper fence, an acacia fence, a new metal strip fence,
and a combination of chili + metal fence. These deterrents were selected due to the lack
of experimental evaluation (acacia or metal fence) and the opportunity to test three
modern multi-modal deterrents (chili, metal, and chili + metal). I hypothesized that
deterrent methods that combine techniques such as the chili + metal fence and those
that have multi-modal alerting features and defenses, that is the chili or metal fences,
would be the most effective, while the acacia fence with only the visual signal and
physical deterrence of the thorns would be the least effective. More specifically, fields
protected by the chili + metal (C+M) fence will have lower incidents of crop raiding than
all other deterrent types. The metal strip fence compared to the chili fence will have
insignificantly different efficacies but be more effective than the chili control (C Co),

9
metal control (M Co), acacia (A), and acacia control (A Co). The A and A Co would be the
least effective of all deterrents. The null hypothesis, H(0) is that there will be no
significant differences between the success of deterrent methods at preventing
elephants from entering protected crops.

10
METHODS
Study Area
The study area is located in southern Kenya, Africa in Taita Taveta county in the
Kasigau Wildlife Corridor at approximate latitude -3.70585S longitude 38.77668E (Figure
5) within Rukinga Ranch Wildlife Sanctuary. The area is a vital wildlife corridor between
Tsavo East and Tsavo West National Parks, which contains Kenya’s largest population of
more than 12,000 elephants (Chase et al., 2016; McKnight, 2004). The Kasigau area is
home to several community or privately-owned ranches within a mixed acacia and
commiphora forest, interspersed with agricultural developments and villages. Research
partners at the site were from Wildlife Works (WW), the world’s leading Reducing
Emissions from Deforestation and Degradation (REDD+) developer, dedicated to
stopping the destruction of the world’s forests through conservation, community, and
carbon offset programs (Wildlife Works, 2018). WW was recruited as a research partner
through the association of former WKU student Simon Kasaine, and the group maintains
a research camp and a tourist lodge (Kivuli Camp) on the ranch. Housing was at the
research camp during 2016 and at Kivuli Camp for the remainder of the project. The
Sasenyi farming community was chosen as the location of the crop raiding experiments
because of high incidents of HEC (Kagwa, 2011; King et al., 2017; Omondi et al., 2008;
Smith & Kasiki, 2000), and the shared boundary with Rukinga Ranch, which serves as an
area of refuge for wildlife.
Initial logistics, preliminary observations, and an initial experimental design were
started from May to July of 2016. Design implementation and collection of thesis data

11
was conducted from May 2017 to mid-January 2018. Earthwatch, a non-profit travel and
citizen scientist organization, provided advice, partial funding, and volunteers to assist
with the project.
Study Design
Four different deterrent methods were tested to deter elephants from crops.
The experimental design was based on a modified randomized block design with
replication in four areas of Sasenyi. The four methods being tested were acacia fences,
chili pepper fences, metal strip fences, and a combination of the metal + chili fences,
each with a paired control. The design of the blocks were contrived to incorporate
beehive fences in future trials and was intended to cover as much length of the
boundary between Rukinga Ranch and Sasenyi as possible to maximize elephant
encounters. This equated to 8 fields per block measuring 16 X 32 m each, with gaps
(alleys) of 6 m in between (Figure 6). These alleys were established to separate the
deterrent methods and provide an avenue for people and wildlife to pass. To ensure
that each block design was balanced, a buffer was added on each end. This made the
total size of each block 16 X 310 m. The placement of the deterrents in each block was
randomized, but the controls were always placed next to their respective deterrent and
the order of whether the control or active deterrent came first was maintained after the
first deterrent or control was randomly selected. The first field was a control in blocks 2
and 4 and was experimental in blocks 1 and 3 to balance the design.
Experiment construction

12
During 2016, scouting occurred for block sites at the Sasenyi border that would
accommodate 310 consecutive meters without being interrupted by roads, homes, or
non-arable land. Four such plots were located, each having already been used for
agriculture. The owners of each block agreed to participate, and construction was
initiated in the 2017 field season. Homes were in close proximity to some of the fields,
but each family reported elephants approaching closely, so this proximity did not appear
to be a confounding factor.
Earthwatch volunteers, the research team, and two fence attendants who were
employed by WW assisted with the layout and construction of each block. Field
dimensions were determined using tape measures with stakes set in the ground as
markers to indicate where each fence pole would be erected, leaving 8 m between each
pole, except for alleys, which had a distance of 6 m. The alleys were also assigned as
places that could vary in size, in order to make sure the block was following the contour
of the boundary. Alleys thus became areas where the block could be adjusted or
“turned” slightly if needed. Center poles were also used at the ends of each field to
attach deterrents and demarcate where one field terminated and another began (Figure
7). Corners were squared across each section to assure the measurements were
accurate and GPS locations of each pole location were taken with a Garmin GPSmap
60CSx and Garmin GPSmap 62 so that coordinates could be input to Google Earth
(Figure 8) to construct a satellite map of each block. Holes for poles were dug to a depth
of 0.46 m, and poles were locally sourced, each approximately 2 m tall, with a mean
circumference of 26 cm (N=5, SD 4.7). Since termite infestation is a problem in this area,

13
the bottom of each wooden pole was soaked in the environmentally friendly pesticide
Undertaker 480EC (Greenlife Crop Protection, Africa) for 30 minutes. Poles were then
placed in the ground, plumbed and tamped in with soil and the marker stakes removed.
After individual deterrents were erected (see below) each pole received an
identification number with the block number, field number, and individual pole number
marked with a Sharpie (Newell Brands, Sanford L.P.). Once crops sprouted, camera
traps were deployed on fence poles to monitor for wildlife and a short layer of acacia
branches were placed across the front of each block to prevent intrusions by livestock.
To report exactly how animals crossed through the deterrents, a section number system
was created (Figure 9) that allowed enumerators, when finding prints or damage, to
report accurately the location of the incursion. The section number was consistent for
each field. For example: 3 eles at S4 near B4, F3, 89, translates as three elephants
crossed through section four in block four, field three next to pole number 89.
Acacia fence construction
Acacia fences were constructed using trees sourced from the nearby community
that were cut down with machetes. Cut branches were placed by gloved hand in 1-2
layers around a field (Figure 10). The matching control for this deterrent was no fence,
but only the poles erected in the fields. The acacia controls also served as master
controls for the experiment.
Chili fence construction
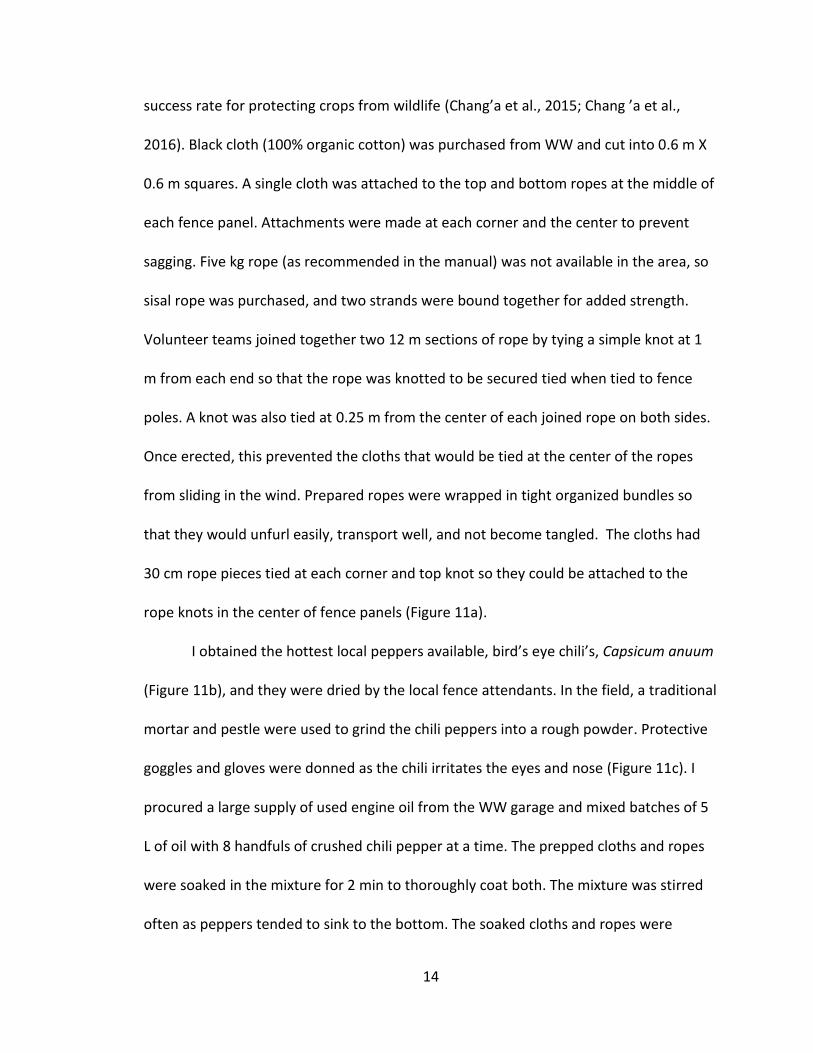
Materials for the chili pepper fence were obtained and prepared ahead of fence
construction following guidelines from a published study in Tanzania with up to a 100%
14
success rate for protecting crops from wildlife (Chang’a et al., 2015; Chang ’a et al.,
2016). Black cloth (100% organic cotton) was purchased from WW and cut into 0.6 m X
0.6 m squares. A single cloth was attached to the top and bottom ropes at the middle of
each fence panel. Attachments were made at each corner and the center to prevent
sagging. Five kg rope (as recommended in the manual) was not available in the area, so
sisal rope was purchased, and two strands were bound together for added strength.
Volunteer teams joined together two 12 m sections of rope by tying a simple knot at 1
m from each end so that the rope was knotted to be secured tied when tied to fence
poles. A knot was also tied at 0.25 m from the center of each joined rope on both sides.
Once erected, this prevented the cloths that would be tied at the center of the ropes
from sliding in the wind. Prepared ropes were wrapped in tight organized bundles so
that they would unfurl easily, transport well, and not become tangled. The cloths had
30 cm rope pieces tied at each corner and top knot so they could be attached to the
rope knots in the center of fence panels (Figure 11a).
I obtained the hottest local peppers available, bird’s eye chili’s, Capsicum anuum
(Figure 11b), and they were dried by the local fence attendants. In the field, a traditional
mortar and pestle were used to grind the chili peppers into a rough powder. Protective
goggles and gloves were donned as the chili irritates the eyes and nose (Figure 11c). I
procured a large supply of used engine oil from the WW garage and mixed batches of 5
L of oil with 8 handfuls of crushed chili pepper at a time. The prepped cloths and ropes
were soaked in the mixture for 2 min to thoroughly coat both. The mixture was stirred
often as peppers tended to sink to the bottom. The soaked cloths and ropes were

15
transported to the assigned fields in buckets. Erected poles were marked at
approximately 1.5 and 2 m, and the soaked ropes were placed at these heights and
pulled taught. Chang’a’s guidelines recommended a second layer of rope near the
bottom if intrusions by young elephants were common, but we elected not to add them
as these instances were reported as rare. The soaked cloths were secured by attaching
the short ropes to the knots in the center of each panel to the already erected long
ropes (Figure 11c). Some poles were naturally shorter than others and had to have their
ropes lowered. The control measure for this deterrent had the same application and
construction, except the oil was not combined with any chili, making the chili control
fence a motor oil only fence. That would also assist with determining whether the chili
peppers cause the adverse reaction or if the motor oil has deterrence capability as well.
I took samples of the mixture and snippets of cloth from several panels of the deployed
fences for LCMS analysis to detect the levels of capsaicinoid concentration, or Scoville
Heat Units (SHU) back in the USA (See Appendix III). In accordance with
recommendations from Chang a’ (2015), the mixture was reapplied every 20 days or
after rainfall. If time had lapsed between the reapplication process and 20 days or a rain
event, I considered the deterrent to be inactive during that period, and it was excluded
from analysis. This only occurred on five occasions throughout the study. Cloths and
ropes were checked for damage or loosening and adjusted or replaced accordingly.
Metal fence construction
Mr. Kasaine was present to supervise construction of his invention, and some
metal strip fences were already being used at Sasenyi. The remaining panels were

16
constructed at camp and then transported to the field. Binding wire is a locally used
flexible wire that rust after exposure to the elements (though the rust does not appear
to compromise the integrity of the metal) and was the material upon which the metal
pieces were strung. Mibati metal rolls were also readily available and this metal is
commonly used as a building material for roofing and construction of roadside stands.
Tin snips were used to cut approximately 0.50 - 0.80 m long X 0.10 - 0.12 m wide strips
of the metal. The varying sizes seemed to assist by causing more noise than having sizes
the same length when the metal pieces clattered against each other. A nail and hammer
were used to pierce a hole in the top center for stringing the pieces onto the wire. A 12-
m piece of binding wire was cut, and pliers were used to make a twist at about 1 m, 3-4
pieces of cut strips strung, and then another crimp 0.15 - 0.20 m from the original. This
pattern was repeated until ca. 1 m from the end where a final crimp was made (Figure
3). Panels were stored until ready to be deployed at Sasenyi and then transported to the
field. Marks were made on fence poles at a height of 1.5 m, and volunteers stood at
each end using the binding wire to elevate the panel and pull it taught. There was some
variation in the height of the center of each panel from the ground (�̅�=127.42 cm,
SD=5.26 cm, N=12) because the center bowed from the weight of the fence material.
Fences were checked daily for damage, and when broken, binding wire was twisted to
make a patch. Occasionally metal strips would move so much that they wore down the
hole and fell off, but overall maintenance was very low. The shininess of the metal also
dulled with time but was still substantially reflective. The control for the metal strip

17
fence was only the binding wire with twists (Figure 12), which were also hung at a height
of 1.5 m.
Metal + chili fence construction
The fourth and final deterrent method was a combination of the chili pepper
plus metal strip fence. The technique for each stayed the same, only the metal strip
fence was hung at 1.4 m and the chili fence at 1.5 m heights, so that the two deterrents
did not tangle. The control for this technique was a chili fence with only motor oil, and
the metal wire with crimps only and no metal strips.
Data Collection & Experiment Monitoring
Twenty-seven Moultrie Spy A-5 Gen2 & A30i series infra-red camera traps
(EBSCO Industries) with security cages were mounted on posts or trees to monitor
species presence in the area. One was deployed 750 m from the cross roads of the
Sasenyi boundary on a road used by both wildlife and people to detect when wildlife
was present in the area. The remainder were deployed using a locked Master Lock
python cable on the front and (sometimes) back lines of each block that contained
crops. During the experimental period, one camera was damaged and seven were
stolen, limiting monitoring capabilities towards the end of the experimental trials.
Cameras were deployed after deterrents were activated and removed once a crop
raiding season ended and no elephants were present for 10 days. Camera cages were
affixed with nails at strategic positions on the fence poles, so the cameras could be
removed to change batteries and storage cards easily. Cameras were numbered and
mounted (Figure 7) at approximately two meters high and were set to take three

18
consecutive images after being triggered by motion. There was an approximate 30 sec
lag time in between firings. Cameras at the fields with chili cloths had to be positioned
so the flapping of the cloths did not set off the cameras. Storage cards were changed
every 5-10 days, depending on how many images individual units took, and images
observed on a MacBook Air (2015) with the iPhoto program. Distances of wildlife from
the deterrent measures were estimated by using the poles from fencing (which were six
or eight meters apart) as landmarks to approximate how close animals were
approaching. Any images with wildlife were retained and organized according to which
block and deterrent techniques were being monitored. The images were used to
estimate the distance from deterrents, type of species present, and the number of
elephants in a group, all of which was corroborated through footprints.
Data were collected on approaches and entry to fields from a combination of
camera images, field measurements, and visual observations. Camera traps were
changed and analyzed every 7-10 days. Fence attendants monitored the fields daily to
check for wildlife incursions and fields were checked by team members at least 3 times
per week. Details were taken from fields that were approached or entered and input
into a crop raiding database and were commonly verified by camera images. Visual
surveys were also periodically performed in front of blocks to look for footprints of
potential crop raiding animals which might not have entered the area of cameras. To
establish a method for these visual surveys, it was necessary to determine how far away
footprints could be detected with the naked eye, and it was concluded that 15 m on
each side of a surveyor was the maximum reliable distance. Three participants spaced

19
themselves at 30 m intervals with a fourth as a record taker. The first positioned
themselves at 15 m perpendicular to pole number one of a block on the west end, with
the other two participants at 45 m, and 75 m perpendicular. This gave each participant
an area with 15 m to either side (except the person at 15 m, closest to the fence) to
detect footprints. All three slowly walked parallel to the frontline of the block trying to
keep distances equal between them while surveying to both sides of them. Experienced
rangers or team members identified the species and notes were taken on the path of
wildlife and the closest distance from specific deterrent methods were recorded.
When wildlife entered fields, it was necessary to assess the amount and type of
damage, and to determine at what growth stage crops were at when damaged. A
growth phase condition score (CS) was modified for each type of crop based off a
system developed by Hoffman-Karimi & Schulte (2015) to rank the level of growth and
to determine wildlife or elephant approaches varied predictably with crop growth (Table
1). Despite requesting that only maize be planted by farmers, some fields had up to
three species of crops. Once a week, crops were assessed by each field and assigned a
CS which was noted with any raiding data (Figure 13). Crop yield was estimated by the
research team and volunteers once plants had grown above stage two, so that overall
loss of crops could be calculated. The fence posts were used to visually divide the field
into sections, moving from front to back, and counting the number of plants in each row
or area. Once each section was counted, the numbers were tallied by field, buffer, or
alley and then entered into the database. If fields were entered by wildlife or livestock,
the number and type of plants that were damaged, and the species responsible (if

20
discernable) were recorded, as well as whether the damage was from consumption, or
trampling. Any plants lost due to pests or drought were also recorded.
Experiment timeline
Two trials occurred during the experimental period. The first (T1), shortly after
the long rains, was initiated on 6/2/17 with the planting of each block with a mixture of
predominantly maize, with some cow peas and lentils. Farmers were compensated for
their time and efforts in both trials. There was an ongoing drought in this area and
crops in blocks one and two did not survive, so deterrents were deployed only in blocks
3 and 4. In these two blocks, fields only had partial crop survival. The first wildlife
appearance was on 6/28/17, with the last on 9/28/17. The second trial (T2) began with
the farmers planting after the short rains by 10/23/17. One of the farmers from block
four decided not to participate, and it was necessary to adjust the design accordingly by
moving the first four fields to the end of the block, which also rearranged the field order
(Figure 14). Farmers followed our request and planted only maize in blocks 1, 2, and 3,
but all three crops were planted in block 4. There was adequate rain for this trial and at
least some crops in all blocks survived to harvest. Data collection was initiated at wildlife
appearance on 10/29/17 and ended on 2/16/18.
Data Analysis
All data were input and analyzed with Microsoft Excel v. 16.10 and/or R Studio v.
1.1.442. To rank the efficacy of the deterrent methods, it was necessary to quantify all
the instances elephants approached and/or entered fields protected by individual

21
deterrents. Data were combined from T1 and T2 and any alley data or instances when
crops were not present were excluded from the analysis. Only blocks 3 and 4 had crops
during trial one but were included in approach data, and specific fields without crops
were excluded. Entry into a field was denoted by a distance of 0 m. A block that was
confirmed by observation of footprints or cameras to have an elephant approach to an
individual field(s) also had the remainder of the fields in that block extrapolated as
approaches. Each was given an estimated distance from the known approached field
rounded to the nearest meter, since elephants could have easily raided adjoining fields.
For example, if an elephant was confirmed at field one (F1) 5 m away from the fence,
then fields 2-7 were also added to the data set, with the distance from the confirmed
field increasing at 38 m per field (the length of an entire field + alley). In trial 2, block 4
was reconfigured and the addition of spacing for a driveway was necessary, and this was
considered in the estimate of elephant distances for this block only. Extrapolated
distances were conservatively figured at the maximum, when it is possible that
elephants were much closer. Observations of elephants near fields were noted from a
combination of belt transects, observation of footprints, and camera trap images, and
were grouped in categories of 50 m distances. To continue the conservative approach,
all statistical analyses involved elephant presence at 50 m or less. The percentage of
times elephants entered a field was determined by dividing the number of successful
incursions at 0 m (Table 2, R1) by the approaches at 50 m or less, including 0 m (Table 2,
R3) for individual treatments.

22
Deterrent methods were considered successful if they showed statistical
significance when compared to no deterrent method, the acacia control. A 2 X 2
contingency table was compiled of each deterrent method with its respective matching
control comparing the approaches (Table 2, R2) and successful raids (Table 2, R1). If
results between a deterrent and its control are too similar, it could indicate that the key
ingredient or factor attributed to the success of the deterrent is not responsible. For
example, if the control for a chili fence (only motor oil) was as successful as the active
fence, then the chili peppers may not play as big of a role as anticipated in the deterrent
power of the technique. Fisher exact test was used because sample sizes were small,
and this statistic gives an unbiased and more accurate probability than a chi square
analysis with small sample sizes (Suissa & Shuster, 1985). Each deterrent method was
also compared to the acacia control, which was equivalent to no deterrent measure.
The p-value was considered significant at the 0.05 alpha level.
To validate the block design for this experiment and ensure it had not introduced
any variability in approaches based on landscape features or other unknown variables, it
was necessary to ascertain if elephants approached all fields and blocks equally. Data
from both trials with all approaches at 50 m or less (including 0) were combined by
deterrent measure with the different blocks as a variable, but only approaches to fields
that had viable maize crops and active deterrents were used. Data were checked for
normality with a Shaprio-Wilks, and then non-normal data were analyzed with non-
parametric ANOVAs, using the aov function in R. If significant differences were noted
from ANOVAs, a Tukey pairwise comparison of means with a 95% confidence level was

23
performed to elucidate the specific differences. This procedure was repeated for all
ANOVAs used in the experiment with non-normal data. For the approaches to specific
deterrents, a box and whisker plot was created with Excel.
Significant differences between successful entries into fields compared to
controls should demonstrate the efficacy level of each deterrent. However, this does
not reveal a complete picture of all the factors involved that are contributing to the
success of deterrent measures. Elephant group size can be compared to successful entry
into a crop field to determine if there is a relationship between success and the number
of individuals in a raiding group. To achieve this, the number of elephants present and
group type (family or bull(s)), were part of data collected from all observations. The
number of elephants were obtained from combined observations of footprints and
camera trap evidence.
To quantify overall and specific types of damage by elephants, it was necessary
to count viable crops, so that any damage noted could be deducted from the potential
harvest. This was performed by the research team and volunteers before the raiding
season began of each species planted (maize, cow peas, and lentils), and commenced
after crops reached a CS score of two. Inter-observer reliability tests were performed to
assure proper methodology was occurring, and when teams reached over a 90% success
rate, they were allowed to assess without supervision. It has not been explored whether
the amount of crop loss quantified by damage type (dung deposition, trampling, or
consumption) may reveal important deterrent characteristics of specific methods. For
example, low consumption rates versus high trampling, could mean that elephants left

24
quickly because of discomfort. High consumption and dung deposition and low
trampling could be an indicator of more time spent in a field in which an elephant was
comfortable enough to forage extensively after breaking through the fence, thus making
a specific deterrent less effective as there is no residual deterrence.
Damage was noted after each crop raid by number of plants damaged as well as
the type of damage (trampling, dung deposition, or consumption). Only trial two data
were used in any crop damage analysis, as reporting on trial one was limited, and the
majority of crops succumbed to the drought. Percentages of crop destroyed by type of
damage or total damage were calculated by taking the amount destroyed and dividing
by the total amount viable + damaged. Separate two-way ANOVAs were used to
examine the total, trampling, and consumption damage to determine if there was
variation amongst the different deterrents by crop species (lentils, cow peas, and
maize).
As elephants are known to raid more frequently as crops ripen (King et al., 2017;
Naughton-Treves, 1990), monitoring of the growth level of crops in relation to elephant
presence can indicate if there is a need for increased vigilance during those times and
some deterrent measures may also see their efficacy wane at these times. Quantifying
the overall damage to different types of crops can also reveal elephant preferences for
particular crops, and farmers can plant or prepare accordingly. To assess the
relationship between elephant presence and crop maturity, whenever an approach or
entry occurred the condition score was noted. The condition scores were used from all
elephant occurrences during trial two when crops were still present and compared by

25
deterrent method with a two-way ANOVA. The percentage of crop loss for maize, cow
peas, and lentils was achieved by dividing the total number of plants lost by the total
number of plants viable for each species.
The overall percent of damage reported can illustrate how much damage
elephants are responsible for in comparison to other species, drought, or invertebrate
pests. It is also important to understand what other animals may be contributing to crop
damages, as often farmers blame the majority of damage on elephants (Hoffmeier-
Karimi & Schulte, 2015). To determine the presence of other species in the experimental
area, the raw non-extrapolated data were used from both trials, excluding elephants, to
compile a list of other species that could be potential crop raiders. Dates of sightings
were from times when fields were monitored before and after crop raiding events and
after crops had been harvested: 6/28/17-2/16/18 at 50 m or less. Cameras were not
present at all times, though monitoring on foot was still being done by fence attendants,
so observations are conservative.

26
RESULTS
Both experimental trials had elephant approaches to deterrent methods (Figure
15), and on at least one occasion fields with each of the deterrent types were entered,
so no deterrent was 100% effective. The acacia control had the greatest individual
number (8) of and percentage (31%) of overall breaches, with the chili + metal having
the least (1 and 5%, respectively) (Table 2). Across all deterrent measures, only 16% of
approaches resulted in elephants entering deterrent measures. The combined chili +
metal deterrent had the lowest percentage of raids, followed by the metal strip fence,
with the acacia control the greatest (Table 2, R4). This supports the hypothesis that
deterrents that convey a signal of their presence and that provide a negatively
reinforced association are more effective than traditional techniques. There were no
significant differences when comparing the approaches versus successful raids of each
deterrent method compared to its matched control but when comparing the acacia
control (no deterrent) to each method, the chili + metal (Fisher Exact Test, p=0.023) and
metal fence (Fisher Exact Test, p=0.040) showed a significant deterrent effect with an
alpha of 0.05 (Table 3).
The randomized block design was successful in maintaining non-biased
approaches by elephants to different treatment types (Tables 4), but there was a
significant difference between approaches to block 4 and the other blocks (Table 5). To
determine what the cause of this difference may have been, the data for trial 2 were
analyzed without trial one, which also resulted in a significant difference between blocks
but not deterrents. Of these two block assessments there were only non-significant

27
approaches between blocks one and three. The combined approaches from all blocks to
each deterrent method (Figure 16) showed approaches to the metal, metal control, and
acacia were the most common, with the chili + metal the least (SD 5.90 df=7).
Camera trap images were successful at providing approach data, as well as
assisting with determining how many elephants were involved in raiding parties (Table
6). However, it did not provide sufficient clarity to determine how many elephants
actually entered fields when there were multiple elephants within a raiding party, thus
no correlations between group sizes and successful raids were assessed. Of the 10
elephants identified as crop raiders, some of which were lone raiders and others as part
of partially identified groups, two were seen twice in the community area. Thus, it is
possible that some of the elephants in these results are the same elephants. Over half of
all successful raids were by lone elephants, all of which were bulls, and the vast majority
of raids had one, two, or three members in the raiding party. No family groups were
observed crop raiding in fields, but a few were noted after crops had been harvested.
The largest group number noted during the crop raiding season was eight bulls, and
raids with eight members only occurred twice. It was unable to be determined how
many elephants within these larger groups attempted to break through deterrents, as
the photographs did not reveal how elephants interacted with the deterrents when
entering. Elephants were commonly noted using open passageways to reach other areas
deeper in the community. After the experimental crops were harvested, elephants
continued to visit the area in search of forage, as some farmers in the community
maintained a later harvest, or possibly because elephants could be headed to local

28
water sources. After all crops were harvested in trial one, elephant presence was noted
for up to 80 days afterwards, and natural forage was very limited due to drought. After
trial 2, elephants still visited up to 84 days after harvest of the experimental fields. There
was no evidence found that plant material such as discarded maize husks were being
consumed by elephants, but farmers did allow livestock to eat what remained.
In trial two, all three species of crops had trampling and/or consumption
damage from elephant crop raiding, yet no dung deposition was responsible for
plant death. For all crop species, consumption was responsible for more destruction
than trampling (Table 7). The majority of plantings were maize, and all forms of
damage to this crop were more extensive than damage to cow peas or lentils. Crops
from each deterrent type except for those protected by the acacia fence
experienced some form of damage, and the crops surrounded by the metal control
and acacia control deterrents had the most damage (Figure 17). However, elephants
would often enter fields with viable crops without doing any damage.
When examining consumption damage to all species of the crops protected by
the different deterrent types, there was a significant difference detected between the
types of crops (p=0.031), but not between treatment types (Table 8). The significance
between crop types was between maize and lentils (Table 9). When trampling damage
was analyzed in relation to the type of crop (Table 10), there were significant differences
between the percent of crops trampled under protection of different types of deterrent
methods (p=0.021); the metal control exhibited significant differences of incursion in
pairwise comparisons against all other deterrent types (Table 11) (A Co p=0.007. Acacia

29
p=0.002, C Co p=0.038, C + M p=0.004, C + M Co p=0.006, Metal p=0.003). Analysis of
combined damage showed significance between the type of crop (p=0.029, Table 12),
and maize and lentils (p=0.0121, Table 13) were damaged at different rates, which is
likely due to the much greater amount of maize planted.
Surprisingly, there was no evidence for significant differences in the
approaches by elephants to fields that had different crop condition score categories
(Kruskall-Wallace x2 = 6.25, df=6, p= 0.040). Thus, elephants approached all fields
with no regard to the stage of growth of maize. However, when examining the
percentage of crops destroyed, elephants preferred cow peas (27%), over lentils
(7%) and maize (4%). Overall, farmers lost 4% of their maize crops due to elephant
incursions and 5% for all crop types during trial 2 (Table 14).
Elephants were not the only animals responsible for crop raiding or visits to the
experimental area (Table 15). Across both trials, both before and after harvest and
camera monitoring, nine different species were noted at 50 m or less from experimental
plots. Damage by any of these species were not included in the analyses. Giraffe (Giraffa
camelopardalis) visited to feed on a specific favored tree, and spotted hyena (Crocuta
crocuta) often visited the area in search of chickens or goats. Common duiker
(Sylvicapra grimmia) were also noted 46 times but did no discernable damage. Of
particular interest, eland (Tragelaphus oryx) was sighted 85 times at specific fields in
trial one but only twice in trial 2.

30
DISCUSSION
Adding a new tool to the arsenal of deterrent methods used to mitigate HEC is a
rare and exciting event for the conservation community. As expected, the multi-modal
alerting and defense deterrent method of the chili + metal fence was the most effective
at preventing elephants from entering crop fields. While this deterrent method had the
most significant difference from the acacia control, or no deterrent, the stand-alone
metal strip fence was also effective.
All deterrent methods performed better than no deterrent in preventing
elephants from entering a crop field, suggesting that any mitigation efforts could have
some positive effect. Despite a hypothesis of similar efficacy to the metal fence, the chili
fence was bested by its control, and did not perform well compared to other successful
studies (Chang a’ et al., 2016; Davies et al., 2011; Karidozo & Osborn et al., 2015). This
could be due to a difference in the strength of heat of the chili peppers, a difference in
experiment implementation, the windy environment in this area, or other unknown
factors. However, the strength of the mixture was potent, as when it contacted human
skin or eyes it caused severe discomfort. Several incursions to areas protected by both
the chili and chili control method, resulted from adult elephants ducking and going
under the chili flags, thus flipping the cloths over the ropes, and sometimes snapping
the ropes or pulling down the poles. It was not uncommon to see elephants on camera
images that had several black streaks of oil across their heads. Installation of a second
lower chili rope could help prevent this behavior but was not deemed necessary since
we had no young elephants that were crop raiding and the expectation was the chili

31
would deter them from approaching too closely. Because the chili + metal strip fence
performed better than any technique at keeping elephants out, it could be that the
effectiveness of the metal was enhanced by having another physical barrier on top, and
not the actual chili pepper mixture as the metal + chili control was the 3rd most
effective. To test this hypothesis, other trials should be conducted without oil and chili
solutions to see if it is the presence or movement of the ropes and cloths that are
contributing to any deterrent properties.
As anticipated, the acacia and acacia control did not perform well, but the acacia
was surprisingly more effective than the active chili at preventing entry. However,
acacia fields had no crop damage across the trials, though they were only entered by
elephants four times. It was not uncommon for elephants to enter other fields and not
damage crops as well. This could be due to elephants only passing through, being
scared away after entering, or other unknown factors. Therefore, using the amount of
crops destroyed may not be the only or best way to assess how well a deterrent
performs if damage is sometimes random. Nevertheless, this is the key factor for
farmers as they would not mind if elephants or other animals entered their fields if they
caused no damage. Thus, these findings also suggest that higher sample sizes are
necessary to better determine the relationship between entry and consumption.
Elephants were noted picking up and tossing acacia branches that blocked their way on
several occasions, but this method still had half as many breaches as the acacia control.
It was important to have acacia present to prevent livestock incursions and established

32
successful measures could see increases in efficacy by adding acacia as an outer
boundary.
Several factors other than overall success at deterring elephants can be
indicative of the quality of a deterrent, such as the distance from which a deterrent
repels elephants, whether there is residual deterrence provided, and if farmers are
alerted to elephant presence. One incident of note demonstrates how important
residual deterrence is when evaluating the success of deterrent methods. A group of
elephants broke through the metal strip fence, ate only two cobs of maize, and then
abruptly left. They were not chased by farmers, and this could be evidence that this
deterrent can be affected by intermittent winds that commonly occur in Sasenyi, which
increase the noise and make elephants uncomfortable. Since the noise from the metal
strip fence is typically louder when being contacted than just blowing in the breeze, it
could also alert farmers that something is amiss, allowing them to scare away elephants.
Further tests for determining the differences in decibel levels of winds verses contact
could reveal the metal fence could be an alert system for farmers. The metal strip fence
is both practical and affordable and ongoing studies should work towards increasing
sample sizes to clarify this effect. Other iterations of the metal strip fence, such as a
second lighter strand of metal above the first, could be tested to see if the efficacy rate
could go higher. In addition to the success of the metal fence, the combination of
techniques proving to be effective opens the door for more research to see if various
traditional and/or modern techniques can be combined to increase the efficacy of
existing measures.

33
One unexpected result from the study was the observation that the metal
fence’s control had some deterrence power. Tying for 5th in its rank of effectiveness
amongst the eight deterrent types, camera traps and footprints repeatedly showed 11
incidents (with and without viable crops present) of elephants approaching, contacting
the metal wire, and then retreating. Our team had difficulty seeing the wire even during
daylight hours, so it is possible that it is nearly invisible to elephants at night, which
could startle them while they are already undertaking a known dangerous behavior. It is
also possible that elephants with prior exposure to electric fences may erroneously
believe this fence could be electrified. One camera observation also showed an elephant
lifting the wire with his tusks, grabbing a corn from underneath, and then replacing the
wire and retreating, a behavior sometimes seen in fence-breaking elephants (Mutinda
et al., 2014). Kioko et al. (2008) also showed that some elephants will be deterred by
electric fences even without any current. However, if elephants are aware of the
presence of the wire and do not fear it, they can easily break through it. These
observations also bring up the issue of biological relevance versus statistical significance.
While the metal control did not show significant deterrence power, it still performed
better than other or no deterrent measures. With a higher sample size, future trials may
reveal that it is indeed a viable method. It also suggests that startling elephants through
invisible deterrents may sometimes prevent them from entering. This method is
extremely inexpensive and thus may be obtainable for extremely impoverished farmers
who appreciate having any type of deterrent, even if it is not effective all the time.

34
Crop raiding studies in the field are usually opportunistic and take advantage of
already established farmlands and crops, which makes it difficult to control for other
confounding variables. Control plots are rarely used, or are simply empty fields, making
statistical comparisons difficult. The blocked matching control design of this study was
validated by having equal approaches by elephants across all the types of deterrent
methods, though there were significant difference in the number of approaches to
overall blocks. This could be due to the absence of blocks one and two in trial one due
to drought, a preference seen for entry into the area from certain wildlife trails, or an
imbalance of blocks sampled with walking transects to check for footprints. Higher
sample sizes in future trials may isolate if there are unforeseen variables affecting which
blocks elephants approach the most often. The metal and metal control also had the
highest number of approaches for individual deterrents. These two results are likely
skewed due to the metal and metal control fence having some of the few viable crops in
trial one, which were located in block 4. This experimental model could be adapted for
use in various parts of the world to assess a variety of questions related to crop raiding.
As our team conducts future experiments in Rukinga Ranch, we could introduce
different techniques within this same design, such as beehive fences. Because elephants
were more easily quantified the closer they came to experimental fields, additional
camera traps could also be added to cover areas further away from the farms to
determine if elephants are present, but not detectable, and how they use they use the
landscape.

35
Elephants have been known to damage crops though consumption, trampling,
and dung deposition (Hill, 1997; Kagwa, 2011; Karimi, 2009), although for the entire
experiment, dung was only noted within one field on one occasion, yet the approaches
to the farms were often covered in dung. This presents an interesting behavioral
question: do elephants purposefully restrain their defecation while crop raiding in this
area? Because consumption was responsible for more damage than trampling across all
treatments and all types of crops, once elephants obtained access to fields they may
have been more likely to calmly feed. It was difficult to measure the potential level of
overall deterrent success and levels of residual deterrence in relation to damage,
because all deterrents had entries, but not all had damage, such as the acacia-protected
plots. Elephants approached all deterrents equally when examining trampling damage
except for the metal controls, this was likely skewed due to one specific crop raiding
incident. One evening of crop raiding late in trial two involved 8 elephants destroying
150 plants (approx. 75 consumed/75 trampled) in the metal control. They were also
scared away by farmers, which could have created more trampling than usual. This
illustrates how rare but devastating large crop raids can be, but also how results can be
skewed by large raiding incidents. The significantly different results when examining
damage to crop types between maize and lentils is likely due to the exponentially
greater amounts of maize planted than lentils.
While not a direct measurement of deterrent success, additional data collected
on elephant groups can assist farmers with preparations to defend their fields, which is
important for reducing HEC. Knowing the demographics of elephant groups (type of

36
group, and quantity) can allow farmers to customize deterrent methods, as larger
elephant groups or bulls could signify the need for sturdier deterrents, and younger
elephants might gain access to certain deterrents more easily (e.g., they could get
beneath fences if they are set too high). Females are often more aggressive due to
having young calves in their herd (Bond, 2015; Nelson et al., 2003), and alerting farmers
if there are female groups that are active crop raiders could be an important safety
measure. In the current study area, family groups were not active raiders, and lone bulls
were responsible for most of the raids. Thus, mitigation efforts can be customized from
this knowledge, as males are much taller and larger than members of family groups
(Kangwana, 1996; Shannon, et al., 2008). Males also uprooted or broke fence poles on
several occasions for no apparent reason, but it could be a type of dominance display;
this behavior should factor into the expenses for farmers in maintaining deterrent
methods in this area.
Maize has commonly been referred to as an elephant-favored crop (Chiyo et al.,
2005; Hill, 1997; Kagwa, 2011), but this experiment revealed that even though plantings
of cow peas and lentils were minimal, elephants preferred these above corn. While one
consistent crop (maize) was planned for a simpler analysis, this unintended information
could inspire future studies to examine specific crops at a larger scale to determine if
elephants are more attracted or aversive to particular types of crops in this region
(Osborn, 2004). Farmers could then avoid planting these crops or increase vigilance or
deterrent measures in those planted areas. One might also expect elephants to be
drawn to crops that are ripened and ready for consumption, but no difference in the

37
approaches to experimental fields was seen based on the growth condition scores of the
maize. In this experiment, elephants approached all stages of growth equally and could
have been checking to see if crops were ready for consumption or just passing through
while embarking on raids elsewhere.
Since eland were a major participant in crop raiding events in trial one, it is
necessary to assess their impact in future studies. While farmers are aware that eland in
this area are partially responsible for crop raiding, they often blame elephants for the
majority of damages (Kasaine & Githiru, 2016). Eland did not appear to be affected by
deterrent methods such as the metal strip fence. Of note however, eland presence was
rare in trial two. This could be due to the abundant amount of forage available during
this period, or the increased presence of humans while guarding and burning fires.
Reducing the factors that contribute to crop raiding is difficult as human
expansion, population growth, and climate change impacts are all projected to increase
(Hanski, 2005; Le Bel et al., 2007; Williams et al., 2018). Restoration of natural forests or
grassland can mitigate habitat loss and fragmentation (Harvey et al., 2014), but this
practice is usually costly and fraught with political controversies. Establishing safe
corridors for wildlife in between wild areas can rejoin fragmented landscape, but the
creation of corridors is fiscally difficult for developing nations (Adams et al., 2016; van
der Grift & Pouwels, 2006). A defined spatial level of vulnerability developed by Graham
et al. (2010) can be used to identify areas at higher risk for these encounters, and if
done before building new developments or settlements, community members can
select areas that are the least vulnerable to conflicts. Conservation managers familiar

38
with seasonal patterns can alert farmers to times when more diligence is needed to
protect their crops. Despite all these potential solutions, local farmers usually resort to
addressing crop raiding by traditional solutions such as deterrent measures.
Elephants with recurring crop-raiding behaviors, or those that have become
habituated to mitigation techniques are sometimes culled by wildlife authorities to
reduce HEC and to placate farmers (Rodwell et al., 2000). Besides being controversial
(Aarde et al., 1999), culling can be ineffective, as another elephant will commonly
replace the removed individual and culling can negatively impact sociological family
structures (Shannon et al., 2013; Swan et al., 2017). Farmers will sometimes seek
revenge against any elephant they encounter instead of the individual actually
responsible for a crop raiding incident (Karidozo & Osborn, 2016). Reducing the causal
factors attributed to HEC is difficult and crop raiding creates negative consequences for
elephant conservation. Thus, it is crucial to develop practical and affordable deterrent
methods for rural people that also prevent habituation by wildlife.
Involving the local community is vital in attempts to ascertain which HEC
mitigation technique will be most successful in their area. Their input is important
towards developing new deterrent methods and making steps towards resolving HEC.
Regardless of the mitigation technique used, goals of programs to reduce HEC can
include reducing elephant and human injury or death, easing the financial and
emotional stress to farmers or villagers, improving attitudes towards conservation of
elephants and bio-diversity, and engaging the community to secure interest in their
livelihoods. While farmers lost 5% of their harvest to elephant raids in the experimental

39
area, several surrounding community farms where elephants were left unobstructed to
forage were mostly destroyed within one evening. Thus, the importance of developing
and evaluating new techniques such as the metal strip fence and disseminating that
information to rural people is crucial for elephant conservation as well as securing food
resource for those that live amongst them.

40
FIGURES
Figure 1. The author’s representation of three characteristics that make up an ideal deterrent method in rural communities.
Figure 2. An example of a chili pepper fence utilized to deter elephants (Chang a’ 2015).
AffordablePractical
Resistance to Habituation

41
Figure 3. A metal strip fence constructed from locally available materials deployed in the farming community of Sasenyi, Kenya.
Figure 4. An example of a bee-hive fence erected by Dr. Lucy King and her team at Save the Elephants.

42
Figure 5: Map of the study area including Rukinga Ranch and Kivuli Camp with surrounding ranches, roads, and villages. Inset shows the region in relation to Kenya and the capital city Nairobi.

43
Figure 6. A visual representation of the organization and randomization of the four deterrent blocks located in Sasenyi Kenya.
Figure 7. An example of the configuration of an experimental block (shortened for clarity). Blue dots represent poles, while orange triangles are camera trap placements

44
a. Block 1 used in trial 2
b. Block 2 used in trial 2

45
c. Block 3 used in trials 1 & 2
d. Block 4 used in trial 1

46
e. Block 4 new configuration after relocation in trial 2 Figure 8 (a-e). Satellite images from Google Earth with experimental blocks overlaying the topography, along with the trials they were used in. Yellow lines are alleys and buffers and white lines are experimental fields.
Figure 9: An example of how panels in a field are divided into section numbers which are located between numbered poles

47
Figure 10. An acacia fence circling an agricultural plot
a. b. c.
Figure 11. Materials used in the construction of a chili pepper fence utilized to deter elephants. (a). A deployed chili pepper fence showing panels at the corner of a field. (b). Bird’s eye chili (Capsicum anuum) used in the experiment (c). Fence attendant Chimanga uses a traditional Kenyan mortar and pestle to crush up chili peppers.

48
a. Maize-CS 2 b. Lentils-CS 3 c. Maize-CS 3 Figure 13. a-c. Examples of crop condition scores (CS).
Figure 12. The control for the metal strip fence, attached to a pole at 1.5 m.

49
Figure 15. The 419 approaches by elephants to the Sasenyi farms experimental area. Each is categorized by the type of deterrent approached with a conservative estimated distance.
0
5
10
15
20
25
30
35
40
0-50 51-100 101-150 151-200 201-250 251-300
Nu
mb
er o
f O
ccu
rren
ces
Distance (m)
Approaches by Elephants to Sasenyi Farms
Acacia Cntl Acacia Chili Cntl Chili+Metal C+M Cntl Chili Metal Metal Cntl
Figure 14. Reconfiguration of block four during trial two when a farmer withdrew from the project, with new field assignments.

50
Figure 16. Elephant approaches to deterrents combined across all blocks. Median values are represented by black lines, error bars are 1 standard deviation.
Figure 17. Histogram of the amount of damage occurring from combined trampling and consumption to experimental fields, grouped by type of deterrent measures. Damage number is by individual plant destroyed.
0
50
100
150
200
250
300
350
400
450
Acacia A Co Chili Chili Co C + M C + M Co Metal Metal Co
Dam
age
amo
un
t b
y p
lan
t
Deterrent Measure

51
Tables
Table 1. Three crop species planted at experimental plots with respective scores describing maturity level
Species CS No. Description Cow Pea, Vigna unguiculata 1 Seedling-Height < .2m 2 Leafy but no pods 3 Immature pods 4 Mature pods, ready for harvest 5 Varying-2 stages or more Lentil Lens culinaris 1 Seedling-Height <.10 m 2 Leafy but no pods 3 Immature pods 4 Mature pods, ready for harvest 5 Varying-2 stages or more Maize (corn), Zea mays 1 Seedling < .3m 2 Location of ears visible, but not present
3 Immature ears present 4 Mature ears present on <50% of stalks 5 Mature ears present on >50% of stalks 6 Varying-2 stages or more 7 Dead due to pestilence (insect infestation) 8 Dead due to lack of water

52
Table 2. All approaches to individual deterrent types by elephants grouped in 50 m increments.
Distance in meters
Acacia A Co
Chili C Co C + M C + M Co
Metal M Co
Total
(R1) 0* 4 8 5 4 1 2 3 6 33
(R2) 1-50 17 18 15 18 22 20 34 25 202
(R3) Subtotal (0-50)
21 26 20 22 23 22 37 31 235
>50-100 9 10 10 4 12 8 3 9 65
101-150 8 7 4 9 4 9 4 5 50
151-200 11 7 9 7 13 11 9 5 72
201-250 4 3 0 2 0 3 5 3 20
251-300 2 4 0 0 1 0 1 2 10
Total 55 57 43 44 53 53 59 55 419
(R4) % of times field entered
19 31 25 19 5 10 9 19 16
(R5) Rank of effectiveness
5 7 6 4 1 3 2 5
*Successful breaches of deterrent Table 3. Comparison of deterrent methods with their respective control and deterrent method vs. the acacia control in a Fisher’s Exact test result. 𝑎=0.05
Deterrent Methods P-Value
Acacia vs. Acacia Control 0.505
Chili vs. Chili Control 0.714
Metal vs. Metal Control 0.282
C + M vs. C + M Control 0.608
Acacia Co vs. Chili 0.750
Acacia Co vs. Chili Control 0.505
Acacia Co vs. Metal 0.040**
Acacia Co vs. Metal Co 0.367
Acacia Co vs C + M 0.023**
Acacia Co vs. C + M Co 0.085*
**significant with the p-value at 0.05 * significant with the p-value at 0.10

53
Table 4. Non-parametric ANOVA table results of approaches by elephants examining the effect of block, and treatment (deterrent method). Column abbreviations1: Df=Degrees of Freedom, SS=Sum of Squares, MS=Mean Square, Rsq= R squared value.
Df SS MS Rsq F value Pr(>F)
Treatment 7 66.37 9.482 17.344 1.936 0.798
Block 3 329.62 109.875 0.661 22.429 0.001***
Residuals 21 102.88 4.900
Total 31 498.88 16.093
*** significant at 0.001 or less 1 Applies to all ANOVA tables in results Table 5: Tukey test for multiple comparison of means with 95% confidence intervals, examining the approaches in relation to blocks for combined trials one (T1) and two (T2) and for trial two only.
Block P-value T1 & T2 P-value T2 Only
B2-B1 0.114 0.005**
B3-B1 0.858 0.894
B4-B1 <0.001*** <0.001***
B3-B2 0.410 0.022**
B4-B2 <0.001*** 0.784
B4-B3 <0.001*** 0.003**
*** significant at 0.001 or less ** significant at 0.05 or less
Table 6. The composition of elephant groups that were approaching at 50 m or less and/or successfully raiding farms at the Sasenyi experimental area.
Number of Elephants In Group
Total approaches at
50 m or less
Successful Raids (0 meters)
Unsuccessful Approaches
(Elephant(s) Deterred)
1 106 14 92
2 27 11 16
3 27 4 23
4 3 0 3
5 1 0 1
7 3 2 1
8 2 2 0 Total of All Elephant
Groups 202 33 169

54
Table 7. Damages to crops in trial two by crop species with all four blocks combined. Numbers represent individual plants.
C=Consumption damage, T=Trampling damage, Comb=Combined Consumption + Trampling Damage
Deterrent Maize
C Maize
T Maize Comb
Lentils C
Lentils T
Lentils Comb
Cow Peas C
Cow Peas
T
Cow Peas Comb
Overall Damage
A Co 177 25 202 5 0 5 0 0 0 207
Acacia 0 0 0 0 0 0 0 0 0 0
C Co 62 48 110 0 0 0 13 7 20 130
C+M 14 15 29 0 0 0 0 0 0 29
C+M Co 31 22 53 0 0 0 0 0 0 53
Chili 28 23 51 0 0 0 20 5 25 76
Metal 0 0 0 2 5 7 0 1 1 8
Metal Co 112 80 192 20 20 40 78 75 153 385
Total 424 213 637 27 25 52 111 88 199 888

55
Table 8. Non-parametric ANOVA table results of crops consumed compared to the type of crop and the deterrent method.
Df SS MS Rsq F value Pr (>F)
Type of Crop 2 10943 5471.5 0.252 4.499 0.032*
Deterrent Method
7 15611 2230.2 0.358 1.834 0.264
Residuals 14 17026 1216.1
Total 23 43580 1894.8
*Significant at 0.05 Table 9: Tukey comparison of means with 95% confidence intervals for crops eaten by crop types
Crop Pairs P-Value
Lentil Damage/CP Damage 0.821
Maize Damage/CP Damage 0.098
Maize Damage/ Lentil Damage 0.032*
*Significant at 0.05 Table 10. Non-parametric ANOVA table results of crops trampled compared to the type of crop and the deterrent method.
Df SS MS Rsq F value Pr (>F)
Type of Crop 2 2289.1 1144.54 0.187 6.492 0.104
Deterrent Method 7 7506.5 1072.36 0.612 6.082 0.026*
Residuals 14 2468.2 176.3
Total 23 12263.8 533.21
*Significant at 0.05

56
Table 11: Tukey comparison of means with 95% confidence intervals for crops trampled by deterrent types
Deterrent 1 Deterrent 2 P-value
Acacia A Co 0.992
C Co A Co 0.978
C + M A Co 1.000
C+ M Co A Co 1.000
Chili A Co 1.000
Metal A Co 1.000
Metal Co A Co 0.007*
C Co Acacia 0.693
C+ M Acacia 1.000
C + M Co Acacia 0.996
Chili Acacia 0.985
Metal Acacia 1.000
Metal Co Acacia 0.002*
C + M C Co 0.910
C + M Co C Co 0.964
Chili C Co 0.988
Metal C Co 0.792
Metal Co C Co 0.038*
C + M Co C + M 1.000
Chili C + M 1.000
Metal C + M 1.000
Metal Co C + M 0.004*
Chili C + M Co 1.000
Metal C + M Co 1.000
Metal Co C + M co 0.006*
Metal Chili 0.996
Metal Co Chili 0.008*
Metal Co Metal 0.003*
*Significant at 0.05 Table 12. ANOVA table results of total crop damage compared to the type of crop and the deterrent method.
Df SS MS Rsq F value Pr (>F)
Type of Crop 2 23153 11576.6 0.259 6.129 0.029*
Deterrent Method
7 39632 5661.7 0.444 2.993 0.140
Residuals 14 26487 1891.9
Total 23 89272 3881.4
*Significant at 0.05

57
Table 13: Tukey comparison of means with 95% confidence intervals for overall damage by crop types
Crop Pairs P-Value
Lentil Damage/CP Damage 0.682
Maize Damage/CP Damage 0.060
Maize Damage/ Lentil Damage 0.012*
*Significant at 0.05 Table 14. A summary of total destruction by elephants of the three crops planted in trial two, and the percentage of crops that were destroyed across all fields and blocks.
Maize Lentils Cow Peas
Total planted 14,724 718 748
Total destruction 637 52 199
Percentage destroyed by type of plant
4% 7% 27%
Total Plants (combined) 16,190 16,190 16,190
Total plants destroyed 888 52 199
Total destruction 5% <1% 1%
Table 15. A list of species, excluding elephants noted in the experimental area during both trials at 50 m or less from deterrents.
Common Name Species Name Times noted at Sasenyi
Cow Bos taurus indicus 11
Duiker Sylvicapra grimmia 46
Eland Tragelaphus oryx 87
Giraffe Giraffa camelopardalis 10
Goat Capra hircus 13
Kirk’s Dik Dik Madoqua kirkii 9
Lesser Kudu Tragelaphus imberbis 17
Slender Mongoose Herpestes sanguineus 3
Spotted Hyena Crocuta crocuta 3

58
LITERATURE CITED
Aarde, R., Whyte, I., & Pimm, S. (1999). Culling and the dynamics of the Kruger National
Park African elephant population. Animal Conservation, 2, 287–294.
Adams, T. S., Chase, M. J., Rogers, T. L., & Leggett, K. E. (2016). Taking the elephant out
of the room and into the corridor: can urban corridors work? Oryx, (51)2, 1–7.
Barua, M., Bhagwat, S. a, & Jadhav, S. (2013). The hidden dimensions of human –
wildlife conflict : Health impacts, opportunity, and transaction costs. Biological
Conservation, 157, 309–316.
Blumstein, D. T. (2016). Habituation and sensitization: new thoughts about old ideas.
Animal Behaviour, 120, 255–262.
Bond, J. (2015). Making sense of human-elephant conflict in Laikipia County, Kenya.
Society and Natural Resources, 28(3), 312–327.
Chang’a, A., Omondi, R., Konuche, J., Olson, D., & DeSouza, N. (2015). Chilli fences keep
elephants out of crops! How to make and support chili fences. Tanzania Wildlife
Division, Tanzania Wildlife Research Institute, Tanzania National Parks, World
Animal Protection, RESOLVE, Biodiversity & Wildlife Solutions, Mikumi & Tarangire
Tembo Pilipili Teams, & the Honeyguide Foundation.
Chang ’a, A., De Souza, N., Muya, J., Keyyu, J., Mwakatobe, A., Malugu, L., Ndossi, P.,
Konuche, J., Omondi, R., Mpinge, A., Hahn, N., et al. (2016). Scaling-up the use of
chili fences for reducing human-elephant conflict across landscapes in Tanzania.
Tropical Conservation Science, 9(2), 921–930.

59
Chase, M. J., Schlossberg, S., Griffin, C. R., Bouché, P. J. C., Djene, S. W., Elkan, P. W.,
Ferreira, S., Grossman, F., Kohi, E.M., Landen, K. et al.(2016). Continent-wide
survey reveals massive decline in African savannah elephants. PeerJ, 4, e2354.
http://doi.org/10.7717/peerj.2354.
Chelliah, K., Kannan, G., Kundu, S., Abilash, N., Madhusudan, A., Baskaran, N., &
Sukumar, R. (2010). Testing the efficacy of a chilli-tobacco rope fence as a
deterrent against crop-raiding elephants. Current Science, 99(9), 1239–1243.
Chiyo, P. I., & Cochrane, E. P. (2005). Population structure and behaviour of crop-raiding
elephants in Kibale National Park, Uganda. African Journal of Ecology, 43(3), 233–
241.
Chiyo, P. I., Cochrane, E. P., Naughton, L., & Basuta, G. I. (2005). Temporal patterns of
crop raiding by elephants: A response to changes in forage quality or crop
availability? African Journal of Ecology, 43(1), 48–55.
Chiyo, P. I., Moss, C. J., & Alberts, S. C. (2012). The influence of life history milestones
and association networks on crop-raiding behavior in male african elephants. PLoS
ONE, 7(2).
Davies, T. E., Wilson, S., Hazarika, N., Chakrabarty, J., Das, D., Hodgson, D. J., &
Zimmermann, A. (2011). Effectiveness of intervention methods against crop-raiding
elephants. Conservation Letters, 4(5), 346–354.
Decker, D. J., & Chase, L. C. (1997). Human dimensions of living with wildlife: A
management challenge for the 21st century. Wildlife Society Bulletin, 25(4), 788–
795.

60
Derham, K. (2014). Wire netting reduces African elephant (Loxodonta africana) impact
to selected large trees in South Africa. Masters Thesis & Special Projects. Paper
1358. Western Kentucky University.
Derham, K., Henley, M.D., Schulte, B.A. (2016) Wire netting reduces African elephant
(Loxodonata africana) impact to selected trees in South Africa. Koedoe 58(1),
a1327. http://dx.doi. org/10.4102/koedoe. v58i1.1327
Desai, A. A., & Riddle, H. S. (2015). Human-Elephant Conflict in Asia. US Fish and Wildlife
Service, Asian Elephant Support.
Dyer, C. (2014) New names for the African acacia species in Vachellia and Senegalia.
Southern Forests: a Journal of Forest Science, 76(4), DOI:
10.2989/20702620.2014.980090
Goodyear, S. E., & Schulte, B. A. (2015). Habituation to auditory stimuli by captive
african elephants (Loxodonta africana). Animal Behaviour and Cognition, 2(4), 292–
312.
Govind, S. K., & Jayson, E. A. (2013). Efficiency of chilli powder (capsicum sp.) to deter
wild elephants from the crop fields in a tropical area. Millenium Zoology, 14(1), 21–
24.
Graham, M. D., Adams, W. M., & Kahiro, G. N. (2012). Mobile phone communication in
effective human elephant–conflict management in Laikipia County, Kenya. Oryx,
46(1), 137–144.

61
Graham, M. D., Douglas-Hamilton, I., Adams, W. M., & Lee, P. C. (2009). The movement
of African elephants in a human-dominated land-use mosaic. Animal Conservation,
12(5), 445–455.
Graham, M. D., Notter, B., Adams, W. M., Lee, P. C., & Ochieng, T. N. (2010). Patterns of
crop-raiding elephants, Loxodonta africana, in Laikipia, Kenya, and the
management of human–elephant conflict. Systematics and Biodiversity, 8(4), 435–
445.
Graham, M. D., & Ochieng, T. (2008). Uptake and performance of farm-based measures
for reducing crop raiding by elephants Loxodonta africana among smallholder
farms in Laikipia District, Kenya. Oryx, 42(1), 76–82.
Hanski, I. (2005). Landscape fragmentation, biodiversity loss and the societal response.
The long term consequences of our use of natural resources may be surprising
and unpleasant. EMBO Reports, 6(5), 388–392.
Harvey, C. A., Chacon, M., Donatti, C. I., Garen, E., Hannah, L., Andrade, A., (2014).
Climate-smart landscapes: opportunities and challenges for integrating adaptation
and mitigation in tropical agriculture. Conservation Letters, 7(2), 77–90.
Henley, M. (2012a). Aging elephants-a practical guide. Save the Elephants.
Henley, M. (2012b). Getting to know individual elephants, ID Kit. Save the Elephants.
Hill, C.M. (1997). Crop-raiding by wild vertebrates: the farmer’s perspective in an
agricultural community in western Uganda. International Journal of Pest
Management, 43(1), 77-84.
Hill, C. M. (2004). Farmers’ perspectives of conflict at the wildlife – agriculture

62
boundary: Some lessons learned from African subsistence farmers. Human
Dimensions of Wildlife, 9, 279–286.
Hoare, R. (2012). Lessons from 15 years of human elephant conflict mitigation:
Management considerations involving biological, physical and governance issues in
Africa. Pachyderm, 51(1), 60–74.
Hoare, R. E. (1999). Determinants of human-elephant conflict in a land-use mosaic.
Journal of Applied Ecology, 36(5), 689–700.
Hoare, R. E., & Du Toit, J. T. (1999). Coexistence between people and elephants in
African savannas. Conservation Biology, 13(3), 633–639.
Hoffmeier-Karimi, R. R., & Schulte, B. A. (2015). Assessing perceived and documented
crop damage in a Tanzanian village impacted by human-elephant conflict (HEC).
Pachyderm, (56), 51–60.
Kagwa, S. (2011). Spatial Distribution of human elephant conflict (HEC) and
characterization of crop-raiding elephants in Kasigau region, Kenya. Masters Thesis
& Specialist Projects. Paper 1083. Western Kentucky University.
Kangwana, K. (1996). Studying Elephants. African Wildlife Foundation, Nairobi, Kenya.
Karidozo, M., & Osborn, F. (2015). Community based conflict mitigation trials: Results of
field tests of chili as an elephant deterrent. Journal of Biodiversity & Endangered
Species, 3(1), 1–6.
Karimi, R.R. (2009). An assessment of perceived crop damage in a Tanzanian village
impacted by human-elephant conflict and an investigatin of deterrent properties of
African elephant (Loxodonta Africana) exudates using bioassays. Electronic Theses

63
& dissertations. Paper 740. Georgia Southern University.
Kasaine, S., & Githiru, M. (2016). Sasenyi Valley Baseline Household Survey: Earthwatch
Institute. Wildlife Works, Voi, Kenya.
King, L. E., Lala, F., Nzumu, H., Mwambingu, E., & Douglas-Hamilton, I. (2017a). Beehive
fences as a multidimensional conflict-mitigation tool for farmers coexisting with
elephants. Conservation Biology, 31(4), 743-752.
Kioko, J., Muruthi, P., Omondi, P., & Chiyo, P. I. (2008). The performance of electric
fences as elephant barriers in Amboseli, Kenya. South African Journal of Wildlife
Research, 38(1), 52–58.
Le Bel, S., Murwira, A., Mukamuri, B., Czudek, R., Taylor, R., & La Grange, M. (2007).
Human wildlife conflicts in southern Africa. Riding the whirl wind in Mozambique
and in Zimbabwe, in: The Importance of Biological Interactions in the Study of
Biodiversity. (ed. Jordi Lopez-Pujol) pp. 283–322. Shanghai, China. Intech.
Le Bel, S, & Taylor, R., Lagrange, M., Ndoro, O., Barra, M., Madzikanda, H.(2010). An
easy-to-use capsicum delivery system for crop-raiding elephants in Zimbabwe :
Preliminary results of a field test in Hwange National Park. Pachyderm, (47)1, 80–
89.
Lee, P. C. (2010). Problem animals or problem people? in: Centralizing Fieldworks:
Critical Perspectives from Primatology, Biological and Social Anthropology. (eds.
MacClancy, J. & Fuentes), pp. 69–83. New York/Oxford, Bergham Books.

64
Madden, F. (2004). Creating coexistence between humans and wildlife: Global
perspectives on local efforts to address human–wildlife conflict. Human
Dimensions of Wildlife, 9(4), 247–257.
McKnight, B. L. (2004). Elephant numbers, group structure and movements on privately
owned land adjacent to Tsavo East National Park, Kenya. Pachyderm, 36(36), 44–
51.
Morrison, T. A., Holdo, R. M., & Anderson, T. M. (2016). Elephant damage, not fire or
rainfall, explains mortality of overstorey trees in Serengeti. Journal of Ecology, 3,
409–418.
Moss, C. J. (1988). Elephant Memories. Chicago, University of Chicago Press.
Mutinda, M., Chenge, G., Gakuya, F., Otiende, M., Omondi, P., Kasiki, S.,Soriguer, R.C.,
Alasaad, S. (2014). Detusking fence-breaker elephants as an approach in human-
elephant conflict mitigation. PLoS ONE, 9(3), 1-7.
Naughton-Treves, L. (1990). Predicting Patterns of Crop Damage by Wildlife around
Kibale National Park. Conservation Biology, 12(1), 156–168.
Naughton-Treves, L., & Treves, A. (2005). Socio-ecological factors shaping local support
for wildlife : crop-raiding by elephants and other wildlife in Africa, in: People and
Wildlife: Conflict or Coexistence? (eds. Woodroffe, R., Thirgood, S., & Rabinowitz,
A.) pp. 252–277. Cambridge University Press, Zoological Society of London.
Nelson, A., Bidwell, P., & Sillero-Zubiri, C. (2003). A review of human-elephant conflict
management strategies. People and Wildlife, A Wildlife Conservation Research Unit
of the Born Free Foundation partnership.

65
O’Connell-Rodwell, Rodwell T., Rice M., & Hart L.A. (2000). Living with the modern
conservation paradigm; can agricultural communities co-exist with elephants? A 5
year case study in east Caprivi, Namibia. Biological Conservation, 93, 381–391.
Omondi, P., Bitok, E. K., Mukeka, J., M, M. R., & Litoroh, M. (2008). Total aerial count of
elephants and other large mammal species of Tsavo/Mkomazi ecosystem. Kenya
Wildlife Service Biodiversity , Research & Monitoring Division.
Osborn, F.V. (2004). Seasonal variation of feeding patterns and food selection by crop-
raiding elephants in Zimbabwe. African Journal of Ecology, 42(4), 322-327.
Osborn, F. V., & Rasmussen, L. E. L. (1995). Evidence for the effectiveness of an oleo-
resin capsicum aerosol, as a repellent against wild elephants in zimbabwe.
Pachyderm, 20, 55–64.
Peña-Alvarez, A., Ramírez-Maya, E., & Alvarado-Suárez, L.A. (2009). Analysis of capsaicin
and dihydrocapsaicin in peppers and pepper sauces by solid phase
microextraction–gas chromatography–mass spectrometry. Journal of
Chromatography, 1216, 2843–2847.
Salako, K., Azihou, A. F., Assogbadjo, A. E., Hou, D., Kassa, D., &.Kakai, R.L. (2015).
Elephant-induced damage drives spatial isolation of the dioecious palm Borassus
aethiopum Mart.(Arecaceae) in the Pendjari National Park , Benin. African Journal
of Ecology, 54, 9–19.
Searcy, W. A., & Nowicki, S. (2005) Introduction, in: The Evolution of Animal
Communication Reliability and Deception in Signaling Systems. (eds. Krebs, J.R. &
Clutton-Brock, T.) pp. 1–24. Princeton University Press, Princeton, NJ.

66
Shannon, G., Page, B.R., Mackey, R.K., Duffy, K.J., Slotow, R. (2008). Activity budgets and
sexual segregations in African elephants (Loxodonta africana). Journal of
Mammology, 89(2), 467-476
Shannon, G., Slotow, R., Durant, S. M., Sayialel, K. N., Poole, J., Moss, C., & McComb, K.
(2013). Effects of social disruption in elephants persist decades after culling.
Frontiers in Zoology, 10(62), 1–10.
Sinervo, B. (2013). Optimal foraging theory: Constraints and cognitive processes in:
Behavioral Ecology. pp. 105-130. University of California, Santa Cruz CA.
http://bio.research.ucsc.edu/~barrylab/classes/CHAPTER_PDFS/Chap_6_Optimal.
pdf.
Sitati, N. W., Walpole, M. J., & Leader-Williams, N. (2005). Factors affecting susceptibility
of farms to crop raiding by African elephants: Using a predictive model to mitigate
conflict. Journal of Applied Ecology, 42(6), 1175–1182.
Sitati, N. W., Walpole, M. J., Smith, R. J., & Leader-Williams, N. (2003). Predicting spatial
aspects of human and elephant conflict. Journal of Applied Ecology, 4(40), 667–677.
Smith, R. J., & Kasiki, S. M. (2000). A spatial analysis of human-elehant conflict in the
Tsavo ecosystem, Kenya. Gland, Switzerland. African Elephant Specialist Group,
Human-Elephant Conflict Task Force, IUCN.
Songhurst, A. (2017). Measuring human–wildlife conflicts: Comparing insights from
different monitoring approaches. Wildlife Society Bulletin, 41(2), 351–361.
Suissa, S., & Shuster, J.J. (1985). Exact unconditional sample sizes for the 2 X 2 binomial
trial. Journal of the Royal Statistical Society, 148(4), 317-327.

67
Swan, G. J. F., Redpath, S. M., Bearhop, S., & McDonald, R. A. (2017). Ecology of problem
individuals and the efficacy of selective wildlife management. Trends in Ecology and
Evolution, 32(7), 518–530.
Treves, A., Wallace, R. B., Naughton-Treves, L., & Morales, A. (2006). Co-managing
human–wildlife conflicts: A review. Human Dimensions of Wildlife, 11(6), 383–396.
Treves, A., Wallace, R. B., & White, S. (2009). Participatory planning of interventions to
mitigate human-wildlife conflicts. Conservation Biology, 23(6), 1577–1587.
van der Grift, E., & Pouwels, R. (2006). Restoring habitat connectivity across transport
corridors: identifying high-priority locations for de-fragmentation with the use of
an expert-based model, in: The Ecology of Transportation: Managing Mobility for
the Environment. (eds. Davenport, J. & Davenport, J.L.) pp. 205–231. Alterra, The
Netherlands. Wageningen University and Research Center.
Vollrath, F., & Douglas-Hamilton, I. (2002). African bees to control African elephants.
Naturwissenschaften, 89(11), 508–511.
Von Gerhardt, K., Van Niekerk, A., Kidd, M., Samways, M., & Hanks, J. (2014). The role of
elephant Loxodonta africana pathways as a spatial variable in crop-raiding location.
Oryx, 48(3), 1–9.
Williams, H. F., Bartholomew, D. C., Amakobe, B., & Githiru, M. (2018). Environmental
factors affecting the distribution of African elephants in the Kasigau wildlife
corridor, SE Kenya. African Journal of Ecology, 56(2), 244-253.
Wittemyer, G., Northrup, J. M., Blanc, J., Douglas-Hamilton, I., Omondi, P., & Burnham,
K. P. (2014). Illegal killing for ivory drives global decline in African elephants.

68
Proceedings of the National Academy of Sciences of the United States of America,
111(36), 13117–21.

69
APPENDIX I: SURVEYS OF TREE DAMAGE AS AN INDICATOR TOWARDS CROP RAIDING
FLUCTUATIONS
Introduction
Because elephants are generalist herbivores, they can also do extensive damage
to trees. Uprooting, breaking branches, or stripping trees of bark is common (Figure
A1.1), and elephant damage is a major cause of over story tree mortality in savannah
areas (Morrison et al., 2016; Salako et al., 2015). Damage to local trees can become
especially high in the transition from dry to wet season when elephants are browsing
extensively and grasses are limited (Vollrath & Douglas-Hamilton, 2002). Property
owners or National Parks incurring extensive tree damages may resort to wrapping
them with wire netting to reduce their losses (Derham, 2014). Elephant activity such as
this can present difficulties for deforested areas in which the ecosystem is still
recovering. When resources are scarce, elephants commonly supplement their diets
with bark (browsing), but little is known how this may relate to the occurrences of crop
raiding in nearby areas. It is important to understand patterns of tree damage and how
this may relate to temporal or seasonal patterns of crop raiding, as well as developing
methods that will prevent excessive elephant damage in recovering ecosystems. As a
supplementary experiment to the crop raiding study, 240 elephant-favored trees spread
across six transects in Rukinga Ranch were selected and catalogued to survey changes in
damage in relation to crop raiding rates. I hypothesized that tree damage would
significantly increase during time periods of drought or when crops were not present in
the Sasenyi farming community.

70
Methods
To establish transects for wildlife (Appendix II) and tree surveys, six areas across
Rukinga Ranch were selected that contained major water points with easy road access.
A Garmin GPSmap 60CSx or Garmin GPSmap 62GPS were used to mark locations of
water points, roads, tanks, or other topographical objects of interest. These transects
were put into Google Earth (Figure A1.2), as ArcGIS was not available at our study site,
which provided a map for team members. The six transects covered a linear total of
84.43 km with a mean transect length of 14.07 km (Table A1.1) and covered most of the
major regions of the ranch.
Within each transect, four locations were selected near water points to sample
ten trees in each area (Table A1.2) near the beginning, middle and end of each transect.
At each location a GPS waypoint was taken, and a number for each tree was assigned. A
metal tag was stamped with the tree number as well as a number written in sharpie and
was hung from a lower branch with the location noted in the database. Local tree
expert Joshua Kitiro assisted with identification of all tree species. To determine the
approximate height of each tree, a Simmons 801405 Rangefinder was used to estimate
the distance from the observer’s eye to the tree, and the distance to the top of the tree.
Pythagorean’s theorem (a2 +b2 =c2) was used to extrapolate the height of the missing
length and when added to the height of the observer resulted in the approximate height
of the tree, rounded to the nearest meter. Later in the project, a collapsible ruler was
obtained and utilized, giving a more accurate measurement. To determine canopy size,
two team members visually inspected the tree and stood on the side with the widest

71
spread of the canopy and took a measurement from the two furthest tips of the
branches, and then moved perpendicular to obtain another. The final canopy size
resulted from the mean of these two measurements in meters. The lowest canopy point
from the ground was also noted.
African trees commonly have multiple trunks and estimating the diameter at
breast height (DBH) can be complicated. The procedure used by the carbon monitoring
team of Wildlife Works (WW) was adopted, and measurements were taken with a
DCT120 Perfect Pi DBH Tape by encircling the tape around the trunk and reading the
corresponding measurement. Trees with a single trunk were measured at 1.4 m from
the ground. If there was a bulge or branch right at 1.4 m, the measurement was taken
just above this area. Trees that had multiple forks that were less than 0.4 m above the
ground had each measurement taken at 1.4 m. For trees that had forks above 0.4 m
those forks were measured 1 m above the point where the fork occurred. For trunks
that had multiple forks per trunk, if the second fork fell below 1 m after the first, it was
measured below the second fork. If a tree was considered in a shrub class, the largest
stem had the DBH taken and the remainder of stems counted.
Each tree was evaluated for the types and severity of elephant damage based on
a classification system from Derham et al. (2016). Damage types were bark stripping
(BS), branch breaking (BB), main stem breaking (MS), Uprooting-tree pushed over (UR),
and main stem breaking combine with uprooting (Fell). Bark stripping and branch
breaking had impact scores assigned based on the amount of damage (Table A1.3). The
damage level of branch breaking was estimated by taking the percentage of branches

72
that were disturbed in relation to the remainder of the tree and dividing by 100. Bark
stripping was estimated in the same manner, but the largest stripping (if reachable) had
its length, width and distance from the ground measured in cm. Each tree had overall
and specific damage photographs taken and all metrics for each were entered into a
tree database. Because of the increase in elephant numbers on the property from the
end of November to the end of the year, follow-up checks on tree damage were not
performed in 2017.
Results
All 240 trees were successfully located and cataloged by the end of 2017.
Twenty-eight different species were catalogued (Table A1.4). All damage types were
found, and only 33 selected trees had no type of damage (Table A1.5). Bark stripping
and branch breaking were the most common types of damage with a variety of impact
scores (Table A1.6) and the majority of trees had multiple damage types.
Discussion
Follow up tree surveys were not able to be performed in the first field season, so
no conclusions about the relationship between crop raiding and tree damage (foraging)
by elephants could be drawn. However, the foundation for this multi-season survey was
successfully established with the location, measurements, tagging, and cataloging of all
the trees necessary to conduct this study. The assortment of elephant-favored trees
selected within various locations throughout Rukinga Ranch displayed a variety of
damage types and the extent of damage ranged from none to over 50%. These

73
conditions should be ideal for ascertaining how damage to trees changes over time, and
if there is a correlation between damage to trees and rates of crop raiding.

74
Appendix I Figures
Figure A1.1 Example of elephant tree damage in Rukinga Ranch, Kenya

75
(a). Transect 1
(b). Transect 2

76
(c). Transect 3
(d). Transect 4

77
(e). Transect 5
(f). Transect 6

78
(g). Combined map of all 6 transects
Figure A1.2 The six wildlife and tree transects established at Rukinga Ranch (a-f) with major land features, roads, and water points indicated, and a combined map (g) showing all transects.

79
Appendix I Tables Table A1.1 The six wildlife and tree transects with route and length information.
Transect No.
Start Route End Length in km
T1 Cross roads near Ekuru (Catherine)
North via Pombe, Twiga, & Simba
dams
Chui Dam 11
T2 Savanna before Rukin 4 dam
(seasonal)
Juliana dam, Loki-Dori hill to Impala
hill
Mwakaramba Tank 12
T3 Cross roads near Ekuru (Catherine)
Kongoni Dam Salama road 11.46
T4 Mwakaramba tank
Loki-Dori to Patricia Savanna before Rukin 4 (start of T2)
16.98
T5 Split towards Salama and
Savanna
Salama via Nyoka, and Mpia
Mbuganijuu dam 17.69
T6 Kivuli Camp Mwakaramba tank Road before WW office
15.3

80
Table A1.2: Sampling locations from the six transects established on Rukinga Ranch.
Transect Number Sampling Location
1 Chui Dam
1 Twiga Dam
1 Pombe Dam
1 Simba Dam
2 Marungu Tank
2 Lokidorri Dam
2 Juliana Dam
2 The Savannah near start of transect 2
3 Ekuru Dam
3 Rukin 4 Seasonal Waterpoint
3 Kongoni Dam
3 Near intersection of Salama Rd.
4 Mwakaramba Tank
4 Patricia Dam
4 Mbuganijuu Dam
4 Mbuyuni Dam
5 Salama Dam
5 Nyoka Dam
5 Mpya Dam
5 Bandera Dam
6 Jojoba Dam
6 Garawa Tank
6 Mwakaramba Dam
6 TDC Dam

81
Table A1.3. Impact scores for elephant damage to trees for bark stripping and branch breaking.
Score Number Percentage of Damage
1 0%
2 <1%
3 1%-5%
4 6%-10%
5 11%-25%
6 26%-50%
7 51%-75%
8 76%-90%
9 91%-99%
10 100%

82
Tree Species Number Catalogued
Vachellia bussei 11
Vachellia etbaica 2
Vachellia hockii 7
Vachellia nilotica 25
Vachellia robustica 1
Vachellia tortillis 27
Vachellia zanzibarica 5
Albizia anthelmintica 2
Balanites aegyptiaca 1
Boscia coriacea 1
Boswellia neglecta 18
Carissa edulis 1
Cassia abbreviata 16
Combretum apiculatum 1
Combretum exalatum 1
Commifora africana 1
Commifora campestris 2
Commifora confusa 17
Commifora edulis 5
Cordia monoica 1
Cordia sinensis 26
Delonix elata 1
Diospyros mespiliformis 1
Grewia bicolor 5
Grewia mollis 9
Grewia similis 1
Lannea alata 16
Lannea rivae 15
Lannea schweimfurthii 11
Manilkana mochisia 2
Platycelyphium voense 2
Sterculia africana 6
Table A1.4. The 28 types of African tree species identified, tagged, and measured with the quantity of each species sampled totaling 240.

83
Table A1.5. The types and occurrences of damage found on elephant-favored trees that were catalogued in Rukinga Ranch. BS-bark stripping, BB-branch breaking, MS-main stem breaking, UR-Uprooting, Fell-Uprooting and main stem breakage.
Damage Type Number of
Occurrences
1-BS 119
2-BB 192
3-MS 36
4-UR 2
5-Fell 1
6-None 33
Total 383
Table A1.6. The percentage of damage to trees with BS & BB in Rukinga Ranch. The majority of trees had multiple damage types.
Impact Scores Bark Stripping (BS)
Damage Type 1
Branch Breaking (BB)
BB- Damage Type 2
0 None 33 33
2 (<1%) 8 15
3 (1-5%) 38 30
4 (6-10%) 32 33
5 (11-25%) 30 65
6 (26-50%) 10 44
7 (51-75%) 1 3
8 (76-90%) 0 1
9 (91-99%) 0 0
10 (100%) 0 0

84
APPENDIX II: ELEPHANT IDENTIFICATION AND WILDLIFE PRESENCE
Introduction
Elephants are visually identified by size, sex, group composition, and unique ear
markings such as vein patterns and rips or tears to the edges of their ears, as well as
tusk condition (Kangwana, 1996). These unique characteristics can be photographed or
drawn and used to identify specific elephants to which an identification number or
name can be applied. Researchers must use caution and update their records often, as
these characteristics can change. Using an identification system, a database can be
made which catalogs presence or activities of individual elephants or groups. This
database can be used to identify individuals from camera traps as crop raiders or
sightings while looking for elephants. While most HEC incidents are attributed to males
(Graham et al., 2010; Hoare, 1999; Mutinda et al., 2014; Von Gerhardt et al., 2014),
some HEC incidents involve female groups as found in the Tsavo ecosystem (Sitati et al.,
2003; Smith & Kasiki, 2000; personal observation). Since no current elephant
identification was occurring on Rukinga Ranch, it was important to compile a catalog of
elephants to identify crop raiders, as well as provide an overall picture of the
demographics of the elephant population and their movements.
Elephants are just one component of the biodiversity found in the Kasigau
Wildlife Corridor. WW conducts bi-monthly wildlife surveys and monitors species of
concern such as Grevy’s zebra (Equus grevyi) and African vultures (all species), which are
endangered. However, it was important to get a more complete picture of the
biodiversity found on Rukinga Ranch so that connections between crop raiding and

85
wildlife density could be explored in future years of the project. Driving or walking
transects are an important conservation tool used to monitor biodiversity commonly
utilized in this area (Williams et al., 2018). To quantify the local biodiversity and catalog
elephants in the area, a driving transect system was enacted to create databases that
cataloged bull and family groups of elephants recorded the presence of mammals and
large birds on Rukinga Ranch (Figure A1.2).
Methods
Elephant sightings were often opportunistic while in transit to other areas of the
ranch or the Sasenyi farming community, and a method for quantifying these
encounters was established. Specific ventures onto the ranch were also taken
periodically to search for elephants, and since elephants commonly came to the
waterhole just outside of Kivuli Camp, trumpeting could be heard as a sign of elephant
presence. Whenever elephants were sighted, a GPS point was taken along with notes on
all members in the group. Each encounter had the time of day, location, number in the
group, and sex (if possible) noted, as well as any other identifying markings. Females
were also noted as pregnant or nursing if ascertainable. If possible, individual photos
were taken of the left and right ear, the full front with ears flared, the left and right
sides, the rear including tail, tusks, and any noticeable features such as scars (Figure
A2.1) in accordance with guidelines established by Save the Elephants (Henley 2012b).
Elephant groups were identified as families-consisting of a matriarchal herd with
females and juvenile males, lone bulls, bull groups, or mixed-family groups with
temporary attending bulls. Each individual also received an age classification (Table

86
A2.1), which commonly took place after assessing photographs. Since the composition
of bull groups changed frequently, the associates at each sighting were noted. All
information was entered into a database and catalogs were maintained for family
groups and individual bulls. Family groups were originally listed by date, and only after
the group was seen twice were they given individual names to assure that all family
members were included and there were adequate physical observations. The first group
seen twice had all members with names that began with A, the second group with B and
so on. Bull elephants were given a name if sufficient identifying information was present
such as at least one ear with markings and tusks, or both ears. Bulls in this area usually
travel alone or in small groups, are easier to approach, and tend to remain for longer
periods of time. Thus, males were more reliably identified than family groups.
Wildlife survey transects coincided with those established for tree monitoring
(Figure A1.2), and six transects were conducted over a two-week period, most often at
three times per week. Transects were randomly selected but were not repeated within a
two-week period. Each transect began between 16:45 and 17:15 and usually concluded
just before dusk. Each transect used a minimum of three people. At the beginning and
end of each transect, a waypoint was taken on a Garmin GPSmap 60CSx or Garmin
GPSmap 62. Important abiotic data were noted such as temperature, cloud cover, and
wind conditions. The driver was responsible for monitoring in front of the vehicle and to
the right when possible, while one scribe, who also sat in front, monitored the left side
and recorded data on the data sheet, while a third person behind the driver monitored
the right side. The vehicle moved at 15 kph or less and when an animal was spotted the

87
vehicle would pull perpendicular to the original position of the animal that was sighted
regardless if it had moved. A Simmons 801405 Rangefinder was used to estimate the
distance from the vehicle to the animal’s original position in meters and recorded. The
time, GPS waypoint, species, and number of animals in the group were all noted by the
scribe, based off of observations from the team which often necessitated binoculars
(Nikon, Monarch M511, 8 X 42, 6.3). As sex and age are sometimes difficult to
determine in the field, the age categories of juvenile, adult, and unknown were applied
and the sex was identified as male, female, or unknown. Any special observations were
also noted such as pregnancy or injuries. The time and waypoint of the completion of
each transect was also recorded and all data were input into an Excel wildlife transect
database. Whenever elephants were noted they were also added to the elephant ID
information and catalogs, though on transects elephant observations were limited to
just enough time to gather the essential data.
Results
At the beginning of the study period (May 2017), elephant observations were
limited due to low presence because of drought, though during the harvest of trial one,
they were commonly seen on camera traps. However, elephant presence increased
steadily after rains commenced in October during trial two. Family groups were very
difficult to assess as they were quite skittish, and commonly ran whenever seeing a
vehicle. In contrast, males were quite subdued and would allow closer approaches,
making age, identification notes, and group composition much simpler. A total of 1375
individual elephant sightings were listed in the database, with 691 sex unknown, 514

88
males, and 170 females within a range of age categories (Table A2.2), though most ages
were indeterminate. This did include repeat elephants and some bulls were seen up to
21 times. Eighty-three separate elephants were added to the bull catalog with the
majority being seen on more than one occasion. The family groups provided quite a
challenge with identification, and 20 groups were added to the catalog that were
partially observed or only seen once, though two full groups (A & B) were catalogued.
Images from crop raiding elephants were periodically compared to the catalogs, and
eight different bulls were identified as crop raiders with two being repeat offenders. All
elephants at Sasenyi while crops were present and that were responsible for active
raiding were bulls. Several bulls were also caught on camera that have not been added
to the catalog as of yet. Females were seen at Sasenyi before and after harvest, but not
while active crop raiding was occurring. During T1 a family group came 750 meters from
the experimental area on 7/3/17 but did not enter the farms. After harvest, family
groups were noted in the fields on 8/8/, 8/9, 8/23, 8/24, 9/11, & 9/23. In T2, no families
were noted before planting, and cameras were removed shortly after harvest due to
theft, so none were noted as in the previous trial.
The first wildlife transect commenced on 6/17/17 and the last was recorded on
1/10/18 for a total of 91 completed transects. A total of 3367 individuals were counted
of 63 species, with three additional groups that were sometimes only identified by the
family but not species: vultures, eagles, and bustards (Table A2.4). The most commonly
identified age category was unknown, and males and females were identifiable at about
the same rate (Table A2.5).

89
Discussion
Understanding the demographic populations of wildlife in a conservation area
such as Rukinga Ranch is vital for management planning, especially for threatened
African elephants. Since elephant family groups were more difficult to identify than bull
groups, it may be necessary in this area to devote more time to waiting at areas such as
waterholes. Overall, elephant sightings were high, suggesting elephants are taking
advantage of this area of refuge, which could make bordering communities more
susceptible to crop raiding. Further observations will continue to grow the identification
catalog and identifying eight bulls as crop raiders at Sasenyi provides insight into which
males are repeat offenders and could lead to developing a “typical” crop raiding
elephant profile.
The method for wildlife transects proved to be successful and a wide variety of
species were recorded. Certain species could serve as indicators of impending crop
raiding if their population numbers shift during fluctuations in the rates of crop raiding.
Future years of this ongoing project will compare wildlife densities to temporal
fluctuations in elephant crop raiding to determine if there are any correlates. Methods
for performing elephant identification and wildlife transects proved efficient and will
continue to be used to assess the faunal biodiversity of this area.

90
Appendix II Figures
Figure A2.1 Example of the photos that were attempted for each elephant which were entered into a catalog of elephants observed on Rukinga Ranch.

91
Appendix II Tables
Table A2.1. Age classifications for family groups and bulls in years (Henley, 2012b).
Family Groups:
< 4 Calf
5-9 Juvenile
10-19 Sub-adult
20+ Adult
55 + Senescing adult
Bulls:
< 4 Calf
5-9 Juvenile
10-14 Sub-adult
15-19 Young adult
20-35 Adult
35-55 Prime adult
55 + Senescing adult

92
Table A2.2. The number of elephants observed during the study period categorized by sex and age class.
Sex & Class Number Observed
FEMALES
Calf 5
Juvenile 11
Sub-adult 22
Adult 131
Senescing 1
MALES
Calf 25
Juvenile 24
Sub-adult 24
Young adult 30
Adult 279
Prime adult 90
Senescing adult 4
Unknown 40
UNKNOWN
Adult 59
Calf 95
Juvenile 58
Sub adult 41
Unknown 435
Total 1375

93
Table A2.3. List and quantity of the species totaling 3367 individuals identified on Rukinga Ranch transects.
Common Name Scientific Name Count
Aardwolf Proteles cristatus 4
African elephant Loxodonta africana 238
African hawk eagle Hieraaetus spilogaster 1
African white-backed vulture Gyps africanus 106
Amur falcoln Falco amurensis 1
Banded mongoose Mungos mungo 5
Bateleur eagle Terathopius ecaudatus 11
Black backed jackal Canis mesomelas 5
Black bellied bustard Eupodotis melanogaster 17
Black chested snake eagle Ciraetus pectoralis 2
Black faced vervet monkey Cercopithecus aethiopis 15
Black headed heron Ardea melanocephala 3
Black shouldered kite Elanus caeruleus 1
Brown snake eagle Circaetus cinereus 10
Buff-crested bustard Eupodotis gindiana 26
Bustard, unknown 16
Cape buffalo Syncerus caffer 405
Cape hare Lepus capensis 7
Cheetah Acinonyx jubatus 2
Common zebra Equus quagga
390
Dwarf mongoose Helogale undulata 6
Eagle, unknown 5
Eastern chanting goshawk Melierax metabates 70
Egyptian goose Alopochen aegyptiacus 11
Eland Tragelaphus oryx 92
Gerenuk Litocranius walleri 30
Grant's gazelle Gazella granti 96
Grasshopper buzzard Butastur rufipennis 3
Grevy's zebra Equus grevyi 3
Grey heron Ardea cinerea 1

94
Hartebeest Alcelaphus buselaphus 40
Hartlaub's bustard Eupodotis hartlaubii 20
Helmeted guinea fowl Numia meleagris 5
Impala Aepyceros melampus 128
Kirk’s dik dik Madoqua kirkii 255
Klipspringer Oreotragus oreotragus 2
Lappet-faced vulture Torgos tracheliotus 5
Lesser Kestral Falco naumanni 3
Lesser Kudu Tragelaphus imberbis 103
Lion Panthera leo 4
Marabou stork Leptoptilus crumeniferus 1
Martial eagle Polemaetus bellicosus 5
Masai giraffe Giraffa camelopardalis 211
Oryx Oryx gazella beisa 187
Ostrich Struthio molybdophanes 56
Pygmy falcon Polihierax semtorquatus 2
Raptor, unknown 9
Rock hyrax Heterohyrax brucei 19
Secretary bird Sagittarius serpentarius 29
Serval Felis serval 2
Slender mongoose Herpestes sanguineus 1
Spotted hyena Crocuta crocuta 2
Striped hyena Hyaena hyaena 1
Tawny eagle Aquila rapax 9
Unstriped ground squirrel Xerus rutilus 11
Verraux's eagle owl Bubo lacteus 5
Vulture, unknown 47
Warthog Phacochoerus aethiopicus 77
Waterbuck Kobus ellipsibprymnus 1
White bellied bustard Eupodotis senegalensis 18
Woolly necked stork Ciconia episcopus 2
Yellow baboon Papio cynocephalus 529
Yellow necked spurfowl Francolinus leuoscepus 1

95
AM AF AU JM JF JU UM UF UU Total
492 478 1550 25 19 186 0 0 617 3367
Table A2.4. The age categories and quantities for all species found for Rukinga Ranch transects. AM=Adult Male, AF=Adult Female, AU=Adult Unknown, JM=Juvenile Male, JF=Juvenile Female, JU=Juvenile Unknown, UM=Unknown Male, UF=Unknown Female, UU=Unknown Unknown

96
APPENDIX III: DEGRADATION RATES OF CAPSAICIN IN CHILI PEPPER FENCES
Introduction
No studies have analyzed how capsacinoids, the suite of active compounds in
chili peppers that produce the “heat” degrade over time when applied to the cloths
used in chili pepper fences as utilized in this study. A typical recommendation is to
reapply the chili and oil mixture after approximately three weeks or rainfall (Chang a’ et
al., 2015). Experiments show that chili fences used in areas of high rainfall or rainy
seasons are less effective (Chelliah et al., 2010; Govind & Jayson, 2013), yet no analyses
have provided information on how capsaicin levels are affected by overall exposure to
the elements (i.e. wind, rain, evaporation from the sun), which could affect the
performance of fences used as an elephant deterrent method. This type of knowledge
could provide concrete evidence as to the duration of the active ingredients, which
could be the key to the success of the fence.
The goal of this experiment was to simulate conditions of chili pepper and oil
cloths exposed to the environment in a laboratory, while analyzing the mixture to
determine at what rate the capsaicinoids degraded using a Liquid Chromatrgraphy and
Mass Spectrometry (LCMS) machine. It is unknown the strength of the capsaicinoids
used in these fences and if any potency of the peppers is lost once mixed with the
engine oil and over time. I hypothesized that the capsaicinoids in the mixture could be
isolated and would have a discernable degradation rate.

97
Methods
To isolate the capsaicinoid levels of the chilis used in pepper fences once mixed
with used engine oil, after being placed on cloths, and over time, it was necessary to
create a method for passing such a mixture through a LCMS machine. There is no
methodology available for using motor oil mixed with peppers with this type of process,
suggesting it has not been attempted before. First, 50 mg of the analytical standard for
capsaicin (cap)(Cayman Chemical, Item # 92350), and 5 mg of dihydrocapsaicin (dicap)
(Sigma Aldrich, Item # 03813) were acquired as these two compounds represent over
90% of the capsaicinoids in chili peppers (Pena-Alvarez et al., 2009). To make stock
standards of these two compounds, dilutions of 450 and 580 (respectively) ppm were
obtained after mixing 0.0045 grams of dicap with 10 ml of acetonitrile (ace) and 0.0058
of cap with 10 ml of ace. All glassware used in the experiment were amber colored and
were rinsed three times with ace whenever used to eliminate the chance of cross
contamination.
To ensure the proper settings for the LCMS machine, test runs were conducted
with a 2.1 X 150 mm, C120A OD-5-100/152 column from Standard Method and a guard
column which were used throughout the experiment. LCMS sampler vials for the
experiment were 2 ml, amber, and were also used throughout the entire experiment. 50
l each from the cap and dicap stock standards were added into the auto sampler vials
along with 450 l of ace and 450 l of distilled water to make a 50/50 mixture. This
resulted in a 22.5 ppm concentration of dicap, and 27.5 ppm for cap. The pumps for the
machine were set at 0.1% formic acid in water for A pump, and LCMS methanol was

98
used as the organic mobile phase for the HPLC in B Pump. Flow rates, times and pump
percentages as noted in Table A3.1 were used throughout the experiment. The LCMS
was set to full scan, in MSMS mode which only looked for the peaks of interest: the
molecular weights of cap (306) and dicap (308). Calibration curves were also performed
between different runs at 1:100, 1:200, 1:400, and 1:1,000 dilutions.
To determine if there is a loss in the potency of cap and dicap once mixed with
engine oil, it was necessary to get a baseline reading of the strength of the peppers or
Scoville Heat Units (SHU). A common formula used by WW on chili pepper fences in
Kenya is 2 kg of pepper boiled with 5 L of water and then strained to be mixed with 5 L
of engine oil. This 2/5/5 ratio was scaled down and 20.06 g of commercial (Frontier Co-
op), birdseye chili peppers (Capsicum annum), with a SHU of 130,000 were crushed into
a fine powder with a commercial bullet blender. It was then combined with 50 ml of tap
water and heated on a Thermo Scientific Cimarec hot plate at 230 C and allowed to boil
for 2 min After cooling, the mixture was strained to remove large pieces. A system was
devised to remove all of the small particulates so that the mixture could pass through
the LCMS machine by utilizing an Eppendorf 50 ml syringe which had the tip removed
and by placing a Whatman grade 43 filter paper inside to push the mixture through and
exclude all particles. Once thoroughly strained, 1 ml of chili/water mix was extracted
with a Restek 0.22 um PTFE Luer lock inlet 13 mm syringe filter and placed into an LCMS
tube and a run was performed with the previously mentioned settings. After verifying
the detectability of the cap and dicap, it was necessary to determine if peaks were also
discernible once mixed with motor oil. 100 ml of used engine oil mixed with chili

99
peppers was combined with 20 ml of ace and shaken vigorously to homogenize the
mixture. It was then added to a 250 ml centrifuge tube, with a counter-balance blank of
the same weight. An Allegra 6 centrifuge was set with speed-2.5, timer-15 minutes, and
brake-off. To get as much of the cap and dicap out of the mixture as possible, three
sequential extractions occurred. After the initial spin, the mixture was separated, and all
visible ace was extracted and retained. Next, 20 ml of ace was added again, and the
process repeated until three samples were extracted and were processed with visible
peaks.
To develop a method for detecting the amount of cap and dicap that remained
after being applied to cloths, the aforementioned procedure was performed for mixing
the chili with water and then straining. 50 ml of the chili + water was retained and then
mixed with 100 ml of used engine oil (obtained from Valvoline Oil Change). Two 100%
cotton muslin cloths were cut into 0.18 X 0.18 m squares, and soaked in the mixture and
then hung to drip dry for 20 min. The cloths soaked up approximately 25 ml each of the
mixture, and after drying were rolled and placed in a 50 ml clear glass centrifuge vial.
Ace was added to fill the tubes to the top and then sonicated for 30 min in a Leco UC-
100 ultrasonic cleaner to separate the mixture for extraction. Samples were centrifuged
using the same settings and after separation, 1 ml was withdrawn from each sample and
ran through the LCMS with the same settings showing discernible peaks.
Once all methods were verified as detectible on the LCMS, it was necessary to
make a large quantity of chili + oil for the main experiment. 500 ml of tap water was
mixed with 200.25 of chili peppers and boiled at 230°C. Boiling was prolonged, so the

100
temperature was increased to 300°C, and a thermometer assured the temperature of
the mixture achieved 100°C, which was then allowed to boil for 3 min and then removed
to cool. Using the aforementioned procedures, 170 ml of chili infused water was
retained and 1 ml of this was extracted for testing. A large sealable plastic tub had 500
ml of engine oil placed inside with the 170 ml of chili water added and shaken
vigorously. A laboratory with a fume hood was used and an apparatus consisting of
wooden poles with eyelets was constructed to hold two strands of 63” long jute ropes,
which would have the soaked cloths attached. Heavy weights were placed on top of the
wood pedestals to ensure the weight of the cloths would not cause the jute lines to sag,
and the two strands were attached to the eyelets. The position of the eyelets assured
that the cloths would not overlap and drip on each other. A plastic shelf liner was placed
on the floor of the hood, so the mixture would not cause damage, and aluminum metal
pans were placed underneath the jute lines to catch the dripping mixture. Eighteen
cloths were trimmed to approximately 0.18 X 0.18 m with a weight of 3.5 g each. All
cloths were placed inside the tub and mixed with a wooden spoon to assure they were
coated equally and the tub was capped and shaken. The mixture and cloths were
dumped into a pan and each cloth was hung in a progressive manner with the lower row
first from left to right for a total of 9 cloths, and then the second row from left to right
for the remaining 9 cloths (Figure A3.1). Each cloth was given a sample number based
on the day of the experiment which it would be removed and which of the three
replicates it was. Black office binder clips were used to secure the cloths, and each was
spaced in a manner in which it did not overlap with the adjacent cloth, touch the dowel

101
rods, or drip on the cloths underneath. This assisted with each cloth retaining a similar
amount of liquid mixture.
The hood vent was placed on to accelerate the initial dripping of the cloths and
this was the only time it was used. After the first set of cloths were no longer dripping,
each was removed in sequence and weighed using a 30 g Pesola scale. To ensure
consistency, each day the cloths were removed at 4:30 PM and weighed and placed in a
clear glass 50 ml capped centrifuge tube. Weights were recorded with ace added to the
top the tube on the day after removal. The first cloths (day 0) were removed on the
initial day of the experiment and the bottom row was rearranged so that spacing was
more efficient. Cloth #10 from the second row was moved down to prevent crowding,
leaving C-4 thru C-10 on the bottom row and C-11 thru C-18 on the top row. The
remainder of the oil/pepper mix was retained for further testing. Since no access to the
lab was available on the weekends, days 4 and 5 were not be able to be tested.
For processing of the cloth samples, ace was added to equal the weight of the
centrifuge blank, and each sample was sonicated, centrifuged, and extracted using the
aforementioned procedures and processed in the LCMS machine. The remaining chili +
oil mixture was also sampled (without cloths) to determine if any of the cap and dicap
were lost when the mixture was placed on the cloths. To perform accurate calculations
since the amount of oil on the cloths varied, we took a weight of one ml of the chili + oil
mixture which was 0.74 g to be used in calculations.
To determine the most effective recipe for creating chili pepper fences, the
recipe from Chang a’ ‘s successful project in Tanzania (2016) was also tested. This recipe

102
excludes the boiling of chilis in water and consists of approximately 2.5 kg of crushed
peppers mixed with 10 L of used engine oil. The recipe was scaled appropriately for
testing in the lab, all procedures remained the same, and three samples were extracted.
Results
The initial test of the two cloths for cap and dicap extraction resulted in
retention times of 5.565 and 7.962 ppm of cap and 0.0861 and 1.639 ppm of dicap,
demonstrating that the second cloth had retained more of the mixture which would
need to be accounted for in all future calculations. Obtaining viable results from all
LCMS runs demonstrated that the method applied for the experiment was appropriate
to be able to detect cap and dicap concentrations.
The mock chili fence cloths showed a general increase in the difference in grams
from the weight of the cloth from the onset of the experiment to the end, suggesting
that the mixture on the cloths either continued to drip or evaporate more over time
(Table A3.2). All samples processed in the experiment for cap and dicap had LCMS
results as shown in Tables A3.3 and A3.4, and each phase of the tests of this portion of
the project produced results.
Discussion
A successful method for extracting quantifiable cap and dicap levels from motor
oil mixtures commonly used on chili pepper fences was established for the first time
with this project and has laid the foundation for future LCMS studies to determine the
potency of chili fences as an elephant deterrent. However, complex calculations in the
laboratory will be necessary to interpret the results from the different components of

103
this experiment and will be a part of future analysis once the field portion of the overall
project is completed.

104
Appendix III Figures
Figure A3.1. Laboratory experiment simulating a chili pepper fence used to deter elephants to detect capsaicinoid levels.

105
Appendix III Tables
Table A3.1 Final pump setting for the chili and oil testing in LCMS experiment.
Time (min:sec) % Pump A % Pump B Flow (l/min)
0:00 80 20 200
2:00 80 20 200
2:30 30 60 200
12:30 30 60 200
13:00 80 20 200
16:00 80 20 200
Table A3.2. Experimental cloths infused with chili pepper and oil mixture with the day of the experiment (D0, D1, etc.), cloth number, and measured weights.
Cloth ID Number
Starting weight in
grams
Initial post-drip weight in
grams
Weight when removed in
grams
Difference in grams
D0-C1 3.5 12 12 0
D0-C2 3.5 12.5 12.5 0
D0-C3 3.5 12.5 12.5 0
D1-C4 3.5 13.5 10.25 3.25
D1-C5 3.5 13.5 10 3.5
D1-C6 3.5 13.2 10.5 2.7
D2-C7 3.5 12.8 9.5 3.3
D2-C8 3.5 13 9.5 3.5
D2-C9 3.5 12.5 9.3 3.2
D3-C10 3.5 12 8.75 3.25
D3-C11 3.5 12.5 9 3.5
D3-C12 3.5 12.5 9.25 3.25
D4-C13 3.5 13.2 9.5 3.7
D4-C14 3.5 13.4 9.5 3.9
D4-C15 3.5 13 9.4 3.6
D7-C16 3.5 14 9.6 4.4
D7-C17 3.5 13.2 9.5 3.7
D7-C18 3.5 13 8.75 4.25

106
Table A3.3. LCMS results from capsaicin.
Capsaicin Sample
Amount µg/ml
Volume of ace
µg of component
Grams of oil loaded onto the
cloth
µg of component/ gram of oil
Chili + Water 0.351 N/A N/A N/A N/A
Chili +Oil R1 15.88 34 539.92 N/A N/A
Chili + Oil R2 15.57 34 529.38 N/A N/A
Chili + Oil R3 13.66 34 464.44 N/A N/A
Chang 1 32.25 36 1161.00 N/A N/A
Chang 2 31.63 36.25 1146.59 N/A N/A
Chang 3 29.75 36.1 1073.98 N/A N/A
D0-C1 12.02 35 420.70 8.5 49.49
D0-C2 8.952 33.8 302.58 9 33.62
D0-C3 11.01 34.2 376.54 9 41.84
D1-C4 10.88 39 424.32 10 42.43
D1-C5 11.87 38 451.06 10 45.11
D1-C6 10.53 37 389.61 9.7 40.17
D2-C7 12.09 40 483.60 9.3 52.00
D2-C8 10.23 38 388.74 9.5 40.92
D2-C9 11.62 38 441.56 9 49.06
D3-C10 9.423 40 376.92 8.5 44.34
D3-C11 11.05 38.5 425.43 9 47.27
D3-C12 11.03 38.5 424.66 9 47.18
D4-C13 14.15 38.5 544.78 9.7 56.16
D4-C14 13.78 38 523.64 9.9 52.89
D4-C15 14.28 38.5 549.78 9.5 57.87
D7-C16 12.63 38.5 486.26 10.5 46.31
D7-C17 12.00 39 468.00 9.7 48.25
D7-C18 11.62 39.5 458.99 9.5 48.31

107
Table A3.4. LCMS results from dihydrocapsaicin.
Dihydrocapsaicin Sample
Amount
g/ml
Volume of Ace
µg of component
grams of oil loaded onto the
cloth
µg of component/ gram of oil
Chili + Water 0.27 N/A N/A N/A N/A
Chili +Oil R1 5.84 34 198.56 N/A N/A
Chili + Oil R2 5.99 34 203.56 N/A N/A
Chili + Oil R3 5.28 34 179.45 N/A N/A
Chang 1 8.39 36 301.93 N/A N/A
Chang 2 8.69 36.25 315.09 N/A N/A
Chang 3 12.92 36.1 466.41 N/A N/A
D0-C1 4.63 35 162.12 8.5 19.07
D0-C2 2.87 33.8 96.90 9 10.77
D0-C3 3.85 34.2 131.67 9 14.63
D1-C4 4.21 39 164.31 10 16.43
D1-C5 4.85 38 184.19 10 18.42
D1-C6 4.39 37 162.50 9.7 16.75
D2-C7 5.05 40 202.00 9.3 9.30
D2-C8 4.07 38 154.47 9.5 16.26
D2-C9 4.35 38 165.19 9 18.35
D3-C10 3.24 40 129.56 8.5 15.24
D3-C11 3.73 38.5 143.64 9 15.96
D3-C12 4.20 38.5 161.78 9 17.98
D4-C13 4.28 38.5 164.90 9.7 17.00
D4-C14 5.03 38 191.14 9.9 19.31
D4-C15 4.62 38.5 177.99 9.5 18.74
D7-C16 3.78 38.5 145.45 10.5 13.85
D7-C17 3.59 39 140.17 9.7 14.45
D7-C18 3.33 39.5 131.69 9.5 13.86