an evaluation of existing tire pressure monitoring systems
TRANSCRIPT
US Department
of Transportation
National Highway Traffic Safety Administration
DOT HS 809 297 July 2001
An Evaluation of Existing Tire Pressure Monitoring Systems
This publication is distributed by the U.S. Department of Transportation, National Highway Traffic
Safety Administration, in the interest of information exchange. The opinions, findings, and
conclusions expressed in this publication are those of the author(s) and not necessarily those of the
Department of Transportation or the National Highway Traffic Safety Administration. The United
States Government assumes no liability for its contents or use thereof. If trade or manufacturers=
names or products are mentioned, it is because they are considered essential to the object of the
publication and should not be construed as an endorsement. The United States Government does not
endorse products or manufacturers.
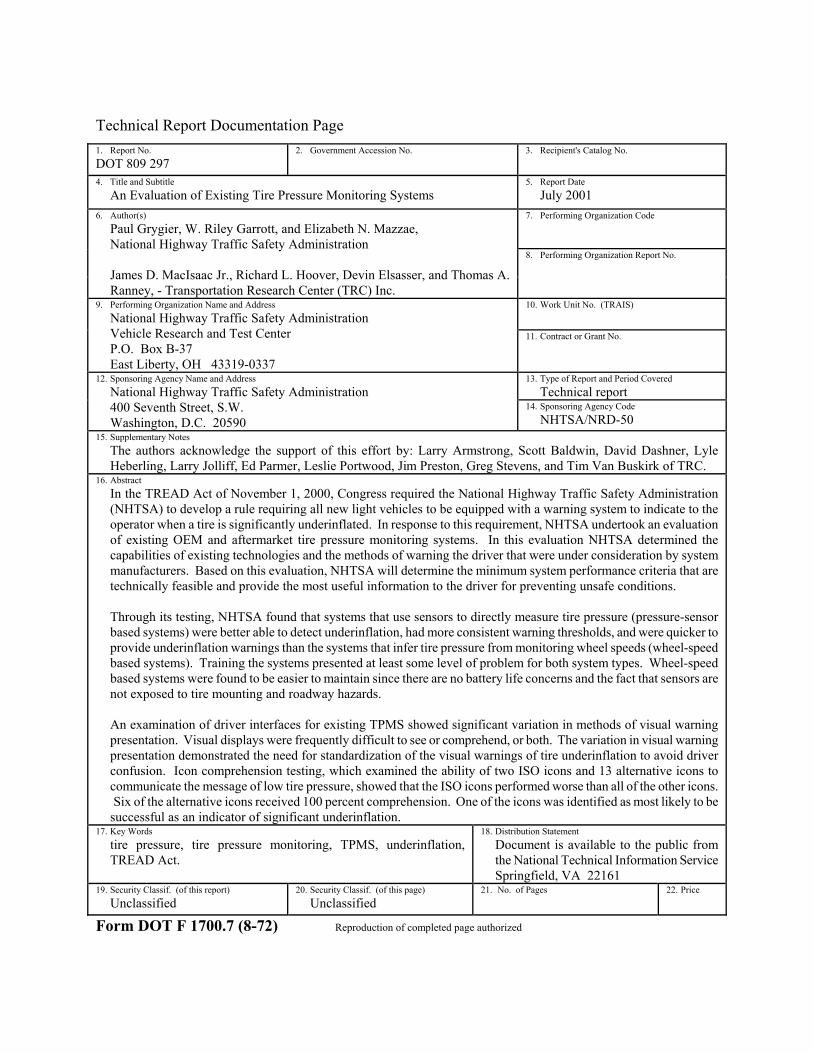
Technical Report Documentation Page 1. Report No. DOT 809 297
2. Government Accession No. 3. Recipient's Catalog No.
4. Title and Subtitle An Evaluation of Existing Tire Pressure Monitoring Systems
5. Report Date July 2001
6. Author(s) Paul Grygier, W. Riley Garrott, and Elizabeth N. Mazzae, National Highway Traffic Safety Administration
James D. MacIsaac Jr., Richard L. Hoover, Devin Elsasser, and Thomas A. Ranney, - Transportation Research Center (TRC) Inc.
7. Performing Organization Code
8. Performing Organization Report No.
9. Performing Organization Name and Address National Highway Traffic Safety Administration Vehicle Research and Test Center P.O. Box B-37 East Liberty, OH 43319-0337
10. Work Unit No. (TRAIS)
11. Contract or Grant No.
12. Sponsoring Agency Name and Address National Highway Traffic Safety Administration 400 Seventh Street, S.W. Washington, D.C. 20590
13. Type of Report and Period Covered Technical report
14. Sponsoring Agency Code NHTSA/NRD-50
15. Supplementary Notes The authors acknowledge the support of this effort by: Larry Armstrong, Scott Baldwin, David Dashner, Lyle Heberling, Larry Jolliff, Ed Parmer, Leslie Portwood, Jim Preston, Greg Stevens, and Tim Van Buskirk of TRC.
16. Abstract In the TREAD Act of November 1, 2000, Congress required the National Highway Traffic Safety Administration (NHTSA) to develop a rule requiring all new light vehicles to be equipped with a warning system to indicate to the operator when a tire is significantly underinflated. In response to this requirement, NHTSA undertook an evaluation of existing OEM and aftermarket tire pressure monitoring systems. In this evaluation NHTSA determined the capabilities of existing technologies and the methods of warning the driver that were under consideration by system manufacturers. Based on this evaluation, NHTSA will determine the minimum system performance criteria that are technically feasible and provide the most useful information to the driver for preventing unsafe conditions.
Through its testing, NHTSA found that systems that use sensors to directly measure tire pressure (pressure-sensor based systems) were better able to detect underinflation, had more consistent warning thresholds, and were quicker to provide underinflation warnings than the systems that infer tire pressure from monitoring wheel speeds (wheel-speed based systems). Training the systems presented at least some level of problem for both system types. Wheel-speed based systems were found to be easier to maintain since there are no battery life concerns and the fact that sensors are not exposed to tire mounting and roadway hazards.
An examination of driver interfaces for existing TPMS showed significant variation in methods of visual warning presentation. Visual displays were frequently difficult to see or comprehend, or both. The variation in visual warning presentation demonstrated the need for standardization of the visual warnings of tire underinflation to avoid driver confusion. Icon comprehension testing, which examined the ability of two ISO icons and 13 alternative icons to communicate the message of low tire pressure, showed that the ISO icons performed worse than all of the other icons. Six of the alternative icons received 100 percent comprehension. One of the icons was identified as most likely to be
successful as an indicator of significant underinflation. 17. Key Words
tire pressure, tire pressure monitoring, TPMS, underinflation, TREAD Act.
18. Distribution Statement Document is available to the public from the National Technical Information Service Springfield, VA 22161
19. Security Classif. (of this report) Unclassified
20. Security Classif. (of this page) Unclassified
21. No. of Pages 22. Price
Form DOT F 1700.7 (8-72) Reproduction of completed page authorized
iv
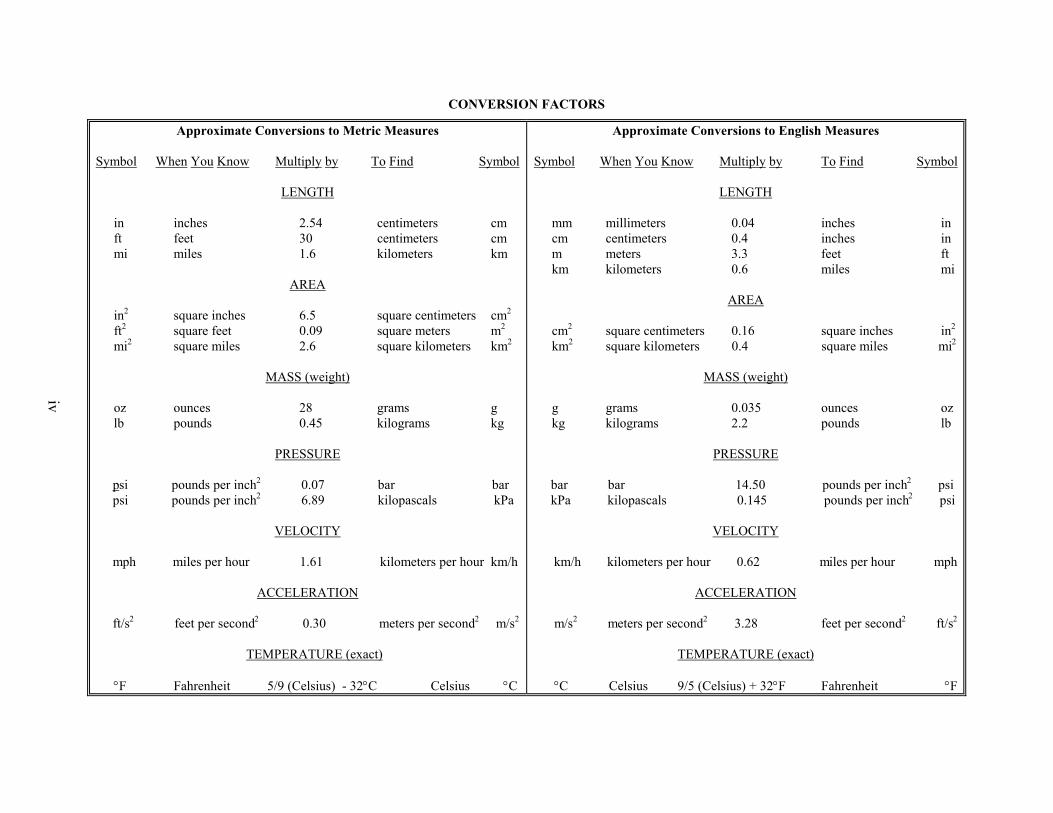
CONVERSION FACTORS
Approximate Conversions to Metric Measures
Symbol When You Know Multiply by To Find Symbol
LENGTH
in 2.54 centimeters cm ft 30 centimeters cm mi miles 1.6 kilometers km
AREA
in2 square inches 6.5 square centimeters cm2
ft2 square feet 0.09 square meters m2
mi2 square miles 2.6 square kilometers km2
MASS (weight)
oz ounces 28 grams g lb 0.45 kilograms kg
PRESSURE
psi 2 0.07 psi 2 6.89
VELOCITY
mph iles per hour eters per hour /h
ACCELERATION
ft/s2 feet per second2 0.30 eters per second2 m/s2
TEMPERATURE (exact)
°F Fahrenheit °C °C
Approximate Conversions to English Measures
Symbol When You Know Multiply by To Find Symbol
LENGTH
mm millimeters 0.04 inches in cm centimeters 0.4 inches in m meters 3.3 feet ft km kilometers 0.6 miles mi
AREA
cm2 square centimeters 0.16 square inches in2
km2 square kilometers 0.4 square miles i2
MASS (weight)
g s 0.035 ounces oz kg s 2.2 pounds lb
PRESSURE
bar 2 psi kPa 2 psi
VELOCITY
km/h eters per hour miles per hour mph
ACCELERATION
m/s2 meters per second2 3.28 2 ft/s2
TEMPERATURE (exact)
°C Celsius 9/5 (Celsius) + 32°F Fahrenheit °F
inches feet
pounds
pounds per inch bar bar pounds per inch kPa kilopascals
m kilom1.61 km
m
- 325/9 (Celsius) Celsius
m
gramkilogram
pounds per inch14.50 bar pounds per inch0.145 kilopascals
kilom 0.62
feet per second

TABLE OF CONTENTS
TABLE OF CONTENTS ...........................................................................................................V
LIST OF APPENDICES .......................................................................................................... XI
LIST OF FIGURES .................................................................................................................XII
LIST OF TABLES ................................................................................................................. XIV
EXECUTIVE SUMMARY ................................................................................................... XVI
1.0 INTRODUCTION............................................................................................................1
2.0 OBJECTIVES ..................................................................................................................2
3.0 SYSTEMS TESTED ........................................................................................................5
3.1 SUMMARY OF TPMS/VEHICLES TESTED.........................................................................5
3.1.1 Description of the Wheel-Speed Based TPMS Evaluated......................................6
3.1.1.1 System A............................................................................................................7
3.1.1.2 System B ............................................................................................................8
3.1.1.3 System C ..........................................................................................................10
3.1.1.4 System D..........................................................................................................12
3.1.2 Description of the Pressure-Sensor Based TPMS Evaluated ..............................13
3.1.2.1 System E ..........................................................................................................14
3.1.2.2 System F...........................................................................................................16
3.1.2.3 System G..........................................................................................................17
3.1.2.4 System H..........................................................................................................18
3.1.2.5 System I ...........................................................................................................20
3.1.2.6 System J ...........................................................................................................22
3.2 WHEEL-SPEED BASED TIRE PRESSURE MONITORING SYSTEM SPECIFICATIONS ...........24
3.3 PRESSURE-SENSOR BASED TIRE PRESSURE MONITORING SYSTEM SPECIFICATIONS ....24
v
3.3.1 Cost ......................................................................................................................24
3.3.2 Cold Inflation Pressure Ranges...........................................................................26
3.3.3 Mini-spare Tires ..................................................................................................26
3.3.4 Warning Thresholds.............................................................................................26
3.3.5 Temperature Ranges ............................................................................................28
3.3.6 Specified Pressure Accuracies.............................................................................29
4.0 INSTRUMENTATION .................................................................................................30
5.0 METHOD .......................................................................................................................34
5.1 TEST NOMENCLATURE..................................................................................................35
5.2 WHEEL-SPEED BASED TPMS .......................................................................................36
5.2.1 WSB TPMS Calibration .......................................................................................36
5.2.2 WSB TPMS Test Matrix .......................................................................................37
5.2.3 WSB Test Procedures...........................................................................................38
5.2.3.1 Sensing Capabilities Test.................................................................................38
5.2.3.2 First Accuracy Test − LLVW ..........................................................................39
5.2.3.3 Second Accuracy Test – LLVW......................................................................39
5.2.3.4 First and Second Accuracy Tests – GVWR.....................................................39
5.2.3.5 Loose Surface Dynamic Test – LLVW ...........................................................39
5.2.3.6 Loose Surface Dynamic Test – GVWR...........................................................40
5.2.3.7 Human Factors Evaluation...............................................................................40
5.3 PRESSURE-SENSOR BASED TPMS.................................................................................40
5.3.1 PSB TPMS Sensor Training Methods..................................................................40
5.3.2 PSB Pressure TPMS Test Matrix.........................................................................41
5.3.3 PSB Test Procedures ...........................................................................................41
5.3.3.1 First Warm Static Accuracy Test.....................................................................41
5.3.3.2 Cold Static Accuracy Test ...............................................................................42
5.3.3.3 Second Warm Static Accuracy Test ................................................................42
5.3.3.4 Dynamic Warning Thresholds Test – GVWR .................................................42
5.3.3.5 Loaded Dynamic High Speed Test – GVWR ..................................................43
vi
5.3.3.6 Human Factors Evaluation...............................................................................43
5.3.3.7 System Failure Effects Test .............................................................................43
6.0 RESULTS .......................................................................................................................44
6.1 WHEEL-SPEED BASED TPMS .......................................................................................44
6.1.1 WSB Sensing Capabilities Test ............................................................................44
6.1.1.1 One Tire Significantly Underinflated ..............................................................45
6.1.1.2 Two Tires on the Same Side of the Vehicle Significantly Underinflated .......45
6.1.1.3 Two Tires on the Same Axle Significantly Underinflated ..............................46
6.1.1.4 Two Tires at Diagonal Positions Significantly Underinflated.........................46
6.1.1.5 Three Tires Significantly Underinflated ..........................................................46
6.1.1.6 Four Tires Significantly Underinflated............................................................46
6.1.2 WSB Dynamic Warning Threshold & Accuracy Tests.........................................46
6.1.2.1 System A Accuracy Test Results.....................................................................52
6.1.2.2 System B Accuracy Test Results .....................................................................52
6.1.2.3 System C Accuracy Test Results .....................................................................53
6.1.2.4 System D Accuracy Test Results.....................................................................54
6.1.2.5 WSB System Warning Status Preservation .....................................................55
6.1.3 WSB Dynamic Tests on Loose Surface ................................................................55
6.2 PRESSURE-SENSOR BASED TPMS.................................................................................57
6.2.1 PSB Static Tests for System Accuracy – Pressure Dropped in 2 psi Increments 57
6.2.2 PSB Static Tests for Response Time – Pressure Dropped Rapidly......................61
6.2.3 PSB Display Accuracy .........................................................................................64
6.2.4 PSB Dynamic Test for Activation Levels .............................................................64
6.2.5 PSB Accuracy Tests .............................................................................................65
6.2.5.1 System E Accuracy Test Results .....................................................................67
6.2.5.2 System F Accuracy Test Results .....................................................................67
6.2.5.3 System G Accuracy Test Results.....................................................................67
6.2.5.4 System H Accuracy Test Results.....................................................................68
6.2.5.5 System I Accuracy Test Results ......................................................................68
vii
6.2.5.6 System J Accuracy Test Results ......................................................................69
6.2.6 PSB System Warning Preservation......................................................................69
6.2.6.1 System E Warning Preservation Test Results..................................................70
6.2.6.2 System F Warning Preservation Test Results..................................................70
6.2.6.3 System G Warning Preservation Test Results .................................................70
6.2.6.4 System H Warning Preservation Test Results .................................................71
6.2.6.5 System I Warning Preservation Test Results...................................................71
6.2.6.6 System J Warning Preservation Test Results ..................................................71
6.2.7 PSB System Failure Effects..................................................................................71
6.2.7.1 System E Failure Effects Test Results .............................................................71
6.2.7.2 System F Failure Effects Test Results .............................................................72
6.2.7.3 System G Failure Effects Test Results ............................................................72
6.2.7.4 System H Failure Effects Test Results ............................................................72
6.2.7.5 System I Failure Effects Test Results ..............................................................72
6.2.7.6 System J Failure Effects Test Results..............................................................73
7.0 HUMAN FACTORS ASSESSMENT OF EXISTING TPMS DRIVER
INTERFACES............................................................................................................................74
7.1 METHOD FOR EXAMINATION OF TPMS DRIVER INTERFACES ......................................74
7.2 OVERVIEW OF EXISTING SYSTEMS................................................................................74
7.3 DETAILS AND CRITIQUE OF INDIVIDUAL SYSTEMS........................................................76
7.3.1 System A...............................................................................................................76
7.3.2 System B...............................................................................................................77
7.3.3 System C...............................................................................................................77
7.3.4 System D...............................................................................................................78
7.3.5 System E...............................................................................................................79
7.3.6 System F...............................................................................................................80
7.3.7 System G...............................................................................................................80
7.3.8 System H...............................................................................................................81
7.3.9 System I ................................................................................................................82
viii

7.3.10 System J................................................................................................................83
7.4 DISCUSSION OF TIRE PRESSURE INFORMATION PRESENTATION ISSUES.........................84
7.4.1 Type of Information Displayed ............................................................................84
7.4.2 Level of Detail of Tire Pressure Information Presented .....................................84
7.4.2.1 Presentation of Actual Pressure or Relative Pressure Information..................84
7.4.3 Levels of Warnings...............................................................................................85
7.4.4 Method of Tire Pressure Information Display.....................................................85
7.4.4.1 Icon for Communication of Tire Underinflation .............................................86
7.4.4.2 Vehicle Display Orientation ............................................................................86
7.4.4.3 Auditory Warnings for Tire Underinflation.....................................................86
7.5 DISCUSSION OF ISSUES REGARDING OTHER TYPES OF TPMS INFORMATION AND
INTERFACE ISSUES ....................................................................................................................87
7.5.1 Tire Temperature Information .............................................................................87
7.5.2 System Status Information ...................................................................................87
7.5.3 Manual Controls ..................................................................................................87
7.6 DISCUSSION OF TPMS OPERATION ISSUES THAT RELATE TO THE DRIVER...................88
7.6.1 Is Static Pressure Measurement Needed? ...........................................................88
7.6.2 Need for Automatic Sensor Location and Automatic Setup.................................88
7.7 DRIVER INTERFACE SUMMARY .....................................................................................88
8.0 INVESTIGATION OF TPMS ICONS.........................................................................90
8.1 DESCRIPTION OF EXISTING ISO TIRE PRESSURE SYMBOLS...........................................90
8.2 METHODS FOR DEVELOPMENT AND TESTING ALTERNATIVE TIRE PRESSURE ICONS ....91
8.3 IDENTIFICATION OF ALTERNATIVE TIRE PRESSURE WARNING ICONS ...........................91
8.4 COMPREHENSION TEST .................................................................................................93
8.5 RESULTS OF COMPREHENSION TEST .............................................................................94
8.6 CONCLUSIONS REGARDING TIRE PRESSURE ICONS .......................................................97
8.7 ALTERNATIVE TIRE PRESSURE DISPLAY OPTION..........................................................98
8.8 RECOMMENDATIONS FOR PRESENTATION OF LOW TIRE PRESSURE WARNINGS ...........99
9.0 DISCUSSION ...............................................................................................................101
ix
9.1 WSB SYSTEMS ...........................................................................................................101
9.2 TEMPERATURE COMPENSATION..................................................................................104
9.3 RESETTING THE TPMS AFTER TIRE ROTATION OR REPLACEMENT ............................111
10.0 SUMMARY ..................................................................................................................115
10.1 HARDWARE PERFORMANCE RESULTS .........................................................................115
10.2 HUMAN FACTORS EXAMINATION OF WARNING DISPLAYS..........................................116
10.3 LOW TIRE PRESSURE ICON COMPREHENSION TESTING ...............................................117
11.0 REFERENCES.............................................................................................................119
12.0 APPENDICES..............................................................................................................121
x
LIST OF APPENDICES
Appendix 1. Revised System D Calibration Procedures (VRTC)........................................... 122
Appendix 2. Cycloid AutoPump Example Tire Inflation Curve ............................................. 123
Appendix 3. Tire Pressure Monitoring System Test Procedures............................................. 124
Appendix 4. TPMS Reset Procedures for WSB Systems........................................................ 130
Appendix 5. Test Courses........................................................................................................ 132
Appendix 6. Vehicle Weights at Testing................................................................................. 134
Appendix 7. TPMS Adapter Plate Assembly .......................................................................... 135
Appendix 8. Estimated Frequency of Tire Rotations and Replacements ................................ 136
xi
LIST OF FIGURES
Figure 3.1 – System A Test Vehicle / Significant Underinflation Warning Light (Rightmost)..... 8
Figure 3.2 – System B Test Vehicle / TPMS Warning Message.................................................... 9
Figure 3.3 – System C Test Vehicle / TPMS Warning Message.................................................. 11
Figure 3.4 − System C Reset Button............................................................................................. 11
Figure 3.5 – System D Test Vehicle / Warning Light (Middle) / TPMS Reset Button................ 12
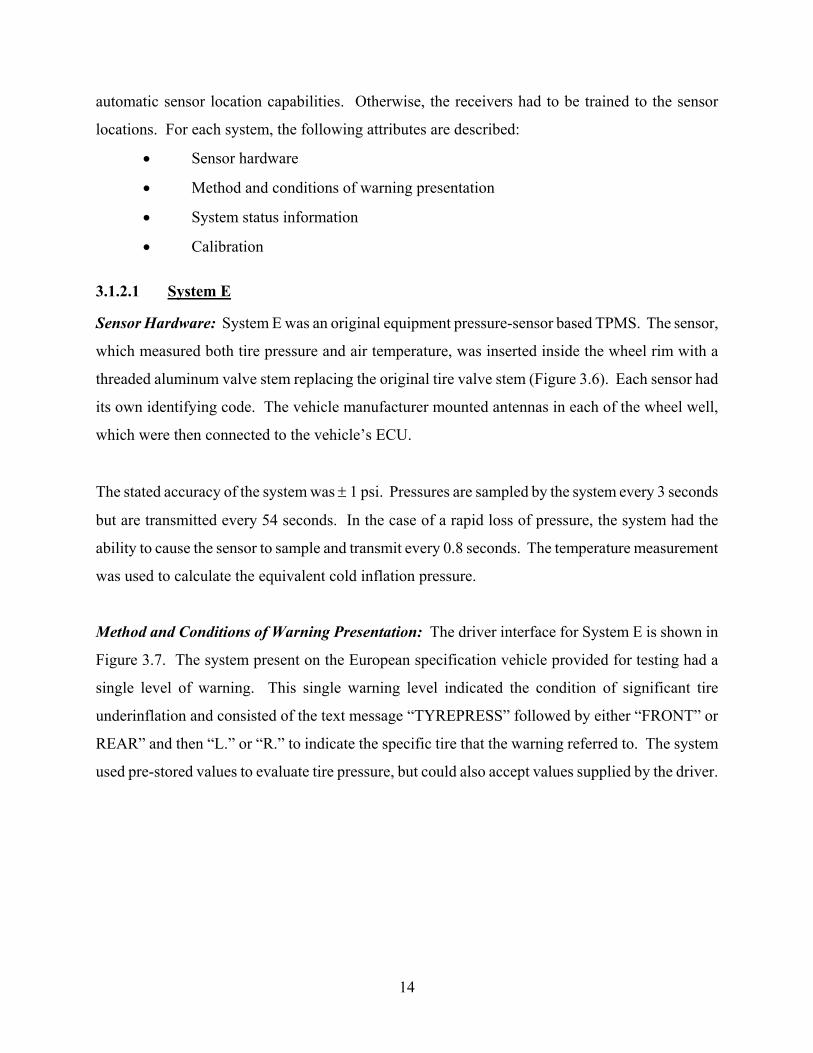
Figure 3.6 – System E Test Vehicle / Tire Sensor - Transmitter.................................................. 15
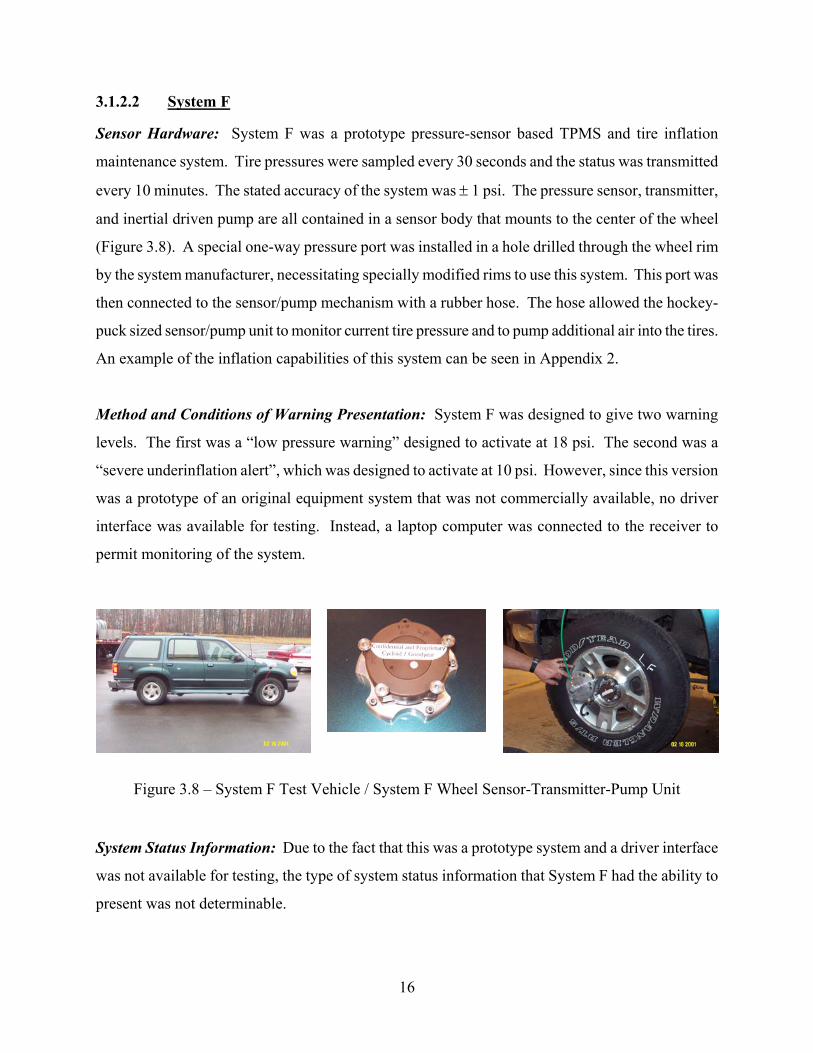
Figure 3.7 – System E TPMS Warning Message With Wheel Location...................................... 15
Figure 3.8 – System F Test Vehicle / System F Wheel Sensor-Transmitter-Pump Unit.............. 16
Figure 3.9 – System G Tire Sensor-Transmitter........................................................................... 18
Figure 3.10 – System G Display ................................................................................................... 18
Figure 3.11 – System H Sensor-Transmitter / Rearview Mirror Display..................................... 19
Figure 3.12 – System I Test Vehicle / System I Display and Tire Sensor-Transmitter................ 21
Figure 3.13 – System I TPMS Display ......................................................................................... 21
Figure 3.14 – System J / In-tire Sensor-Transmitter..................................................................... 23
Figure 3.15 – System J “Full Function” Display .......................................................................... 23
Figure 4.1 – Data Acquisition Computer...................................................................................... 30
Figure 4.2 – Metering Valve and Control Manifold / Adapter Plate and Rotary Union .............. 31
Figure 4.3 – Warning Light Detector............................................................................................ 32
Figure 4.4 − Intercomp Digital Pressure Gauge / VRTC Calibration Standard Device............... 33
Figure 7.1 – Visual Warning of System A (top right corner) ....................................................... 76
Figure 7.2 – Visual Warning of System B.................................................................................... 77
Figure 7.3 – Visual Warning of System C.................................................................................... 78
Figure 7.4 – Reset Button Label for System C ............................................................................. 78
Figure 7.5 – Visual Warning of System D (Center Icon) ............................................................. 79
Figure 7.6 – Visual Warning of System E .................................................................................... 79
Figure 7.7 – Driver Interface of System G - Un-powered ............................................................ 80
Figure 7.8 – Visual Warning of System G.................................................................................... 81
xii
Figure 7.9 – Driver Interface of System H ................................................................................... 81
Figure 7.10 – Driver Interface of System I ................................................................................... 82
Figure 7.11 – Driver Interface of System J................................................................................... 83
Figure 8.1 – Icon Most Recognizable As an Indicator of Tire Underinflation (Wheel 2-Flat 1). 98
Figure 8.2 – Vehicle Display for Provision of Warnings for Individual Tires. ............................ 99
Figure 9.1 – Rolling Radius verses Tire Pressure (graph supplied by BMW AG, 2001)........... 103
Figure 9.2 − Rise in Tire Pressure and Temperature During Different Ambient Conditions..... 105
Figure 9.3 − Left Front Tire of Minivan during Brake Snubs with Underinflation ................... 106
Figure 9.4 – Underinflation Scenarios........................................................................................ 107
Figure 9.5 – Increase in Advisory Range for Scenario #2 with Temperature Compensation .... 108
Figure 10.1 – Suggested icon for indication of significant tire underinflation and alternative vehicle-
based display....................................................................................................................... 118
xiii
LIST OF TABLES
Table 3.1 – Tire Pressure Monitoring Systems and Vehicles Tested ............................................. 6
Table 3.2 – Estimated Original Equipment and Aftermarket System Costs for PSB Systems .... 25
Table 3.3 – Cold Inflation Pressure Ranges for PSB Pressure Monitoring Systems.................... 26
Table 3.4 – Manufacturer Specified Warning Thresholds............................................................ 27
Table 3.5 – Manufacturer Specified Temperature Ranges for PSB Pressure Monitoring Sensors28
Table 3.6 – Manufacturer Specified Pressure Accuracies for PSB Pressure Monitoring Systems29
Table 4.1 – Test Instrumentation .................................................................................................. 30
Table 5.1 – Acronyms Used in Test Matrices and Subsequent Report Sections.......................... 35
Table 5.2 – Wheel-speed Based TPMS Test Matrix .................................................................... 38
Table 5.3 – PSB Pressure TPMS Test Matrix .............................................................................. 41
Table 6.1 – Results of Sensing Capabilities Test for WSB TPMS on the Winding Road Course45
Table 6.2 – Observed Vent Flow Rates for WSB TPMS-Equipped Vehicles.............................. 47
Table 6.3 − Complete WSB System Test Results......................................................................... 48
Table 6.4 − Calculated Pressures to Trigger WSB Warnings....................................................... 49
Table 6.5 – Percentage Drop in Pressure to Trigger WSB ........................................................... 50
Table 6.6 – Range of Tire WSB Systems’ Pressure Warning Levels........................................... 51
Table 6.7 − Range of Warning Thresholds and Repeatability of the Warning Level .................. 51
Table 6.8 – Results of Loose Surface Tests.................................................................................. 56
Table 6.9 – Warning Activation Pressure Thresholds .................................................................. 58
Table 6.10 – Change in Underinflation Advisory Between Warm and Cold Static Tests ........... 59
Table 6.11 – Change in Underinflation Warning Between Warm and Cold Static Tests ............ 61
Table 6.12 – Warning Activation Pressure Thresholds from Rapid Deflation Testing................ 62
Table 6.13 – Response Time of Low Pressure Warnings to Rapid Deflation .............................. 63
Table 6.14 – Deviation of Pressure Displayed During Warnings vs. Calibrated Pressure Gauge 64
Table 6.15 – Complete List of PSB Systems Test Results ........................................................... 66
Table 7.1 – Driver Interface Characteristics for Tire Pressure Monitoring Systems ................... 75
Table 8.1 – ISO Tire Pressure Icons Tested ................................................................................. 90
xiv
Table 8.2 – Alternative Tire Pressure Icons Tested...................................................................... 92
Table 8.3 – ISO Engine Icon Used as a Baseline ......................................................................... 93
Table 8.4 – Comprehension Test Results by Icon, Results for Wheel-based Icons ..................... 95
Table 8.5 – Comprehension Test Results - Baseline, ISO icons, and Vehicle Top-view............. 95
Table 8.6 – Summary of Percent Response Phrases by Wheel Type (rounded)........................... 96
Table 8.7 – Summary of Percent Response Phrases by Icon Version, Including ISO Tire Icons 97
Table 9.1 – WSB Capability Table – Based on Equation 9.1..................................................... 102
Table 9.2 – Influence of Operational Factors on Tire Rolling Circumference........................... 104
Table 9.3 − Tire Rotation and Tire Inflation Check Recommendations .................................... 111
Table 9.4 − Estimates for the Frequency of TPMS Reset / Retrain........................................... 112
Table 9.5 − Reset / Retrain Procedures for the TPMS Evaluated............................................... 113
Table 10.1 – Summary of Findings by System Type.................................................................. 116
Table 10.2 – Summary of Low Tire Pressure Warning Display Findings.................................. 117
xv
EXECUTIVE SUMMARY
In support of a TREAD Act mandated rulemaking effort, NHTSA studied ten existing, light vehicle,
Tire Pressure Monitoring Systems (TPMS). The TPMS were classified as two types, Wheel-Speed
Based - WSB (often referred to as “indirect”) and Pressure-Sensor Based - PSB (often referred to as
“direct”). Wheel-Speed Based TPMS infer tire pressures using the vehicle’s ABS hardware,
specifically the wheel speed sensors, to measure tire-to-tire differences in rotational velocities.
Pressure-Sensor Based TPMS directly measure tire pressures with pressure sensors mounted either
in each tire or on each wheel.
TPMS EVALUATION METHOD
Four vehicles equipped with Wheel-Speed Based TPMS were studied. For all of these vehicles, the
vehicle manufacturer installed the TPMS as original equipment. For each vehicle equipped with a
WSB TPMS, the goals of the testing were to determine:
1. The accuracy of the TPMS
2. The repeatability of the TPMS
3. When the TPMS issues a warning to the driver
4. How the TPMS issues a warning to the driver
5. How to reset/train the TPMS when tires are replaced or rotated
WSB TPMS cannot treat the tires independently. Therefore, to determine the sensing capabilities of
each system, each vehicle was tested with multiple combinations of tires being deflated.
Six Pressure-Sensor Based TPMS were studied. One was manufacturer-installed as original
equipment, while the other five were installed on test vehicles by the VRTC. In addition to the goals
listed above (for WSB systems), PSB TPMS were also examined with the following additional goals
in mind:
xvi
1. How the TPMS handles temperature effects
2. What the TPMS does when the system fails
This study also examined the recognizability of underinflated tire warnings that were given to
drivers, i.e., the human factors of the warnings. The visual and auditory displays used to present tire
pressure warning information were examined. Comprehension Tests were conducted to determine
the recognizability of two ISO tire pressure icons and 13 alternative tire pressure icons.
RESULTS
Wheel-Speed Based System Results
Four WSB systems installed as original equipment on 2000 or2001 vehicles were evaluated. Testing
showed that all of the WSB systems would warn of a single tire being significantly underinflated (50
percent low) on a winding road course. However, on the 7.5 mile oval test track, which requires
little turning input, only three of the four systems could detect tire pressure as low as 14 psi. The
WSB systems also did not warn of two tires equally underinflated on the same side of the vehicle or
on the same axle. Three of four systems warned of two underinflated tires in diagonal positions. All
of the systems warned of three tires equally underinflated. None of the four WSB systems were able
to warn of all four tires equally underinflated. The observed warning capabilities of these systems
corresponded to the theoretical limitations of the sensing algorithm documented in this report.
The warning thresholds of the WSB systems were experimentally determined by slowly leaking out
air, to a minimum of 14 psi, while driving at 60 mph on the 7 ½ mile oval test track. The percent
drop in pressure was calculated per axle and displayed in the following table. Overall, the warning
thresholds ranged from 8 percent low to 46 percent low, with one system giving no warning at all on
the oval track test course. The corresponding tire pressures at the warning levels varied from 17.0
psi to 42.4 psi. The results are displayed by axle because some of the vehicles specified different air
pressures front to rear. Also, the vehicle’s loading influenced the pressure loss threshold for these
systems to sense underinflation. In all cases but one, more loading led to larger tire deflections that
xvii
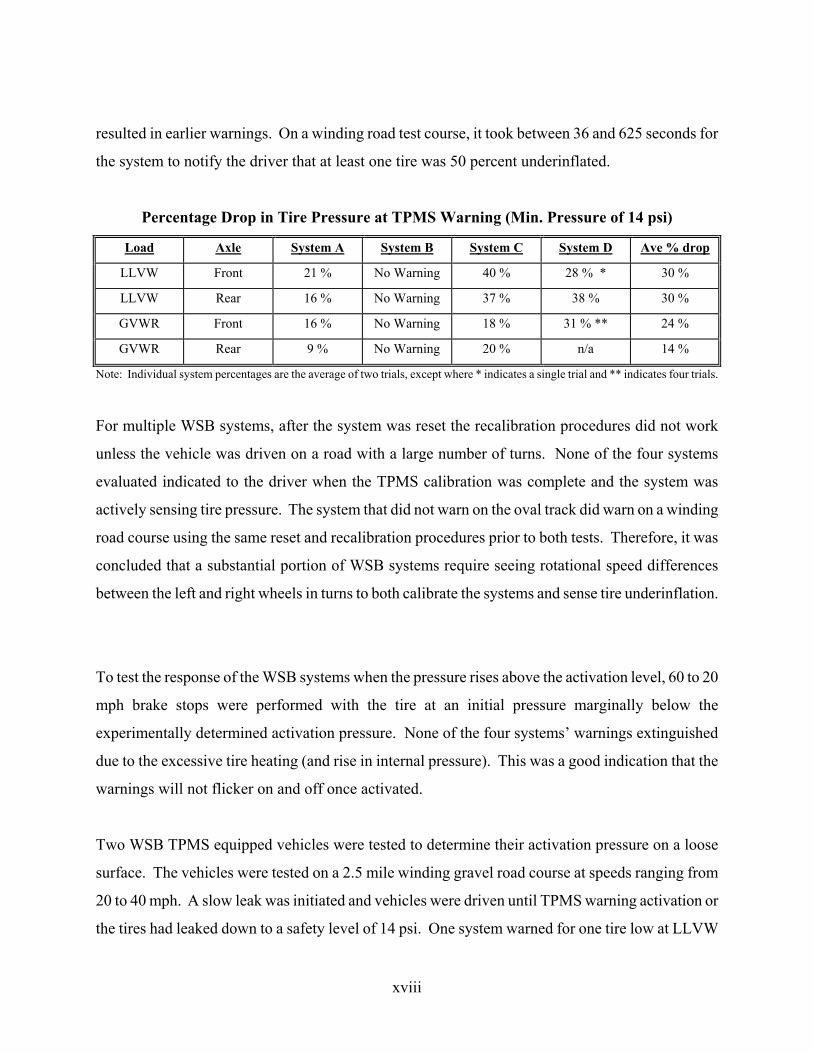
resulted in earlier warnings. On a winding road test course, it took between 36 and 625 seconds for
the system to notify the driver that at least one tire was 50 percent underinflated.
Percentage Drop in Tire Pressure at TPMS Warning (Min. Pressure of 14 psi)
Load Axle System A System B System C System D Ave % drop
LLVW Front 21 % No Warning 40 % 28 % 30 %
LLVW Rear 16 % No Warning 37 % 38 % 30 %
GVWR Front 16 % No Warning 18 % 31 % ** 24 %
GVWR Rear 9 % No Warning 20 % n/a 14 %
*
Note: Individual system percentages are the average of two trials, except where * indicates a single trial and ** indicates four trials.
For multiple WSB systems, after the system was reset the recalibration procedures did not work
unless the vehicle was driven on a road with a large number of turns. None of the four systems
evaluated indicated to the driver when the TPMS calibration was complete and the system was
actively sensing tire pressure. The system that did not warn on the oval track did warn on a winding
road course using the same reset and recalibration procedures prior to both tests. Therefore, it was
concluded that a substantial portion of WSB systems require seeing rotational speed differences
between the left and right wheels in turns to both calibrate the systems and sense tire underinflation.
To test the response of the WSB systems when the pressure rises above the activation level, 60 to 20
mph brake stops were performed with the tire at an initial pressure marginally below the
experimentally determined activation pressure. None of the four systems’ warnings extinguished
due to the excessive tire heating (and rise in internal pressure). This was a good indication that the
warnings will not flicker on and off once activated.
Two WSB TPMS equipped vehicles were tested to determine their activation pressure on a loose
surface. The vehicles were tested on a 2.5 mile winding gravel road course at speeds ranging from
20 to 40 mph. A slow leak was initiated and vehicles were driven until TPMS warning activation or
the tires had leaked down to a safety level of 14 psi. One system warned for one tire low at LLVW
xviii
and at GVWR. It also warned for two diagonal tires low (RF/LR). The other system failed to warn
for one tire low at both loading conditions. The system that did warn activated the warning much
more quickly at LLVW than at GVWR. This was contrary to the findings on the paved surface for
which increased loading generally helped the vehicle recognize underinflation.
The wheel-speed based systems must be reset if the inflation pressure in one or more tires is
changed, if one or more tires is replaced or repaired, or if the tires are rotated. The reset procedure
allows the WSB TPMS to “relearn” the rotational signature of each tire when it has changed due to
one of the previously mentioned actions. If the systems are reset as recommended, the WSB TPMS
may need to be reset up to 100 times during the life of a vehicle. Resetting the four WSB systems
that were evaluated consisted of pushing a button on the dash or following a menu on a driver
information console and then driving for a period of time to let the relearning (calibration) take
place. Though none of the systems could be reset while the vehicle was in motion (to prevent
defeating a warning), all four systems could be reset at rest without remedying the tire inflation
problem. This would significantly impair or disable the ability of the system to provide an
underinflation warning. Users should be cautioned to remedy the tire underinflation problem before
resetting the system.
In general, the WSB systems have trouble detecting more than one tire low. Their underinflation
warning threshold varies by axle and with load. Since changes in tire circumference with pressure
are very slight in the 15 to 40 psi range, WSB systems generally require a 10 to 40 percent drop in
pressure before they are able to detect underinflation. These warning thresholds cannot easily be
changed by the manufacturer and are highly dependent on tire and loading factors. The time
required to recognize a low tire pressure condition varied from one to ten minutes, depending on the
system and the type of driving. The calibration procedures are prone to user error and the systems
do not indicate when the system has calibrated and is functioning. From a longevity standpoint,
these systems should last as long as the vehicle and are maintenance free. The ABS wheel speed
sensors are well shielded and there exists little chance of damage from road hazards or tire changes.
xix
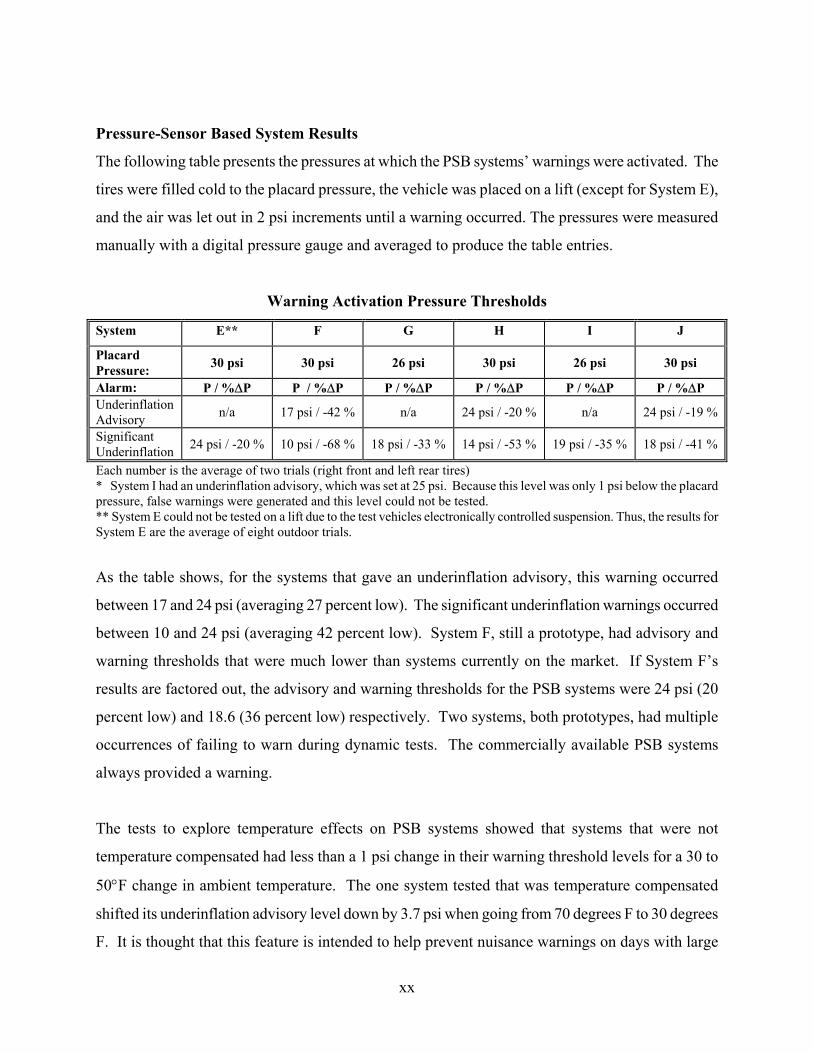
Pressure-Sensor Based System Results
The following table presents the pressures at which the PSB systems’ warnings were activated. The
tires were filled cold to the placard pressure, the vehicle was placed on a lift (except for System E),
and the air was let out in 2 psi increments until a warning occurred. The pressures were measured
manually with a digital pressure gauge and averaged to produce the table entries.
Warning Activation Pressure Thresholds
System F G H I J
Placard Pressure: 30 psi 30 psi 26 psi 30 psi 26 psi 30 psi
Alarm: P / %∆P P ∆P P / %∆P P / %∆P P / %∆P P / %∆P Underinflation Advisory n/a 17 psi / -42 % n/a 24 psi / -20 % n/a 24 psi / -19 %
Significant Underinflation 24 psi / -20 % 10 psi / -68 % 18 psi / -33 % 14 psi / -53 % 19 psi / -35 % 18 psi / -41 %
E**
/ %
Each number is the average of two trials (right front and left rear tires) * System I had an underinflation advisory, which was set at 25 psi. Because this level was only 1 psi below the placard pressure, false warnings were generated and this level could not be tested. ** System E could not be tested on a lift due to the test vehicles electronically controlled suspension. Thus, the results for System E are the average of eight outdoor trials.
As the table shows, for the systems that gave an underinflation advisory, this warning occurred
between 17 and 24 psi (averaging 27 percent low). The significant underinflation warnings occurred
between 10 and 24 psi (averaging 42 percent low). System F, still a prototype, had advisory and
warning thresholds that were much lower than systems currently on the market. If System F’s
results are factored out, the advisory and warning thresholds for the PSB systems were 24 psi (20
percent low) and 18.6 (36 percent low) respectively. Two systems, both prototypes, had multiple
occurrences of failing to warn during dynamic tests. The commercially available PSB systems
always provided a warning.
The tests to explore temperature effects on PSB systems showed that systems that were not
temperature compensated had less than a 1 psi change in their warning threshold levels for a 30 to
50°F change in ambient temperature. The one system tested that was temperature compensated
shifted its underinflation advisory level down by 3.7 psi when going from 70 degrees F to 30 degrees
F. It is thought that this feature is intended to help prevent nuisance warnings on days with large
xx
temperature fluctuations. The significant underinflation warning level for the systems tested was, by
design, fixed and remained unaffected by the temperature changes.
The accuracy tests showed that those systems that displayed tire pressure readings were accurate to
within 1 to 2 psi. System J also displayed a temperature compensated pressure intended to help the
operator, especially when filling the tires, by calculating a cold tire pressure (as placard pressures are
specified) from the current warm tire pressure. The deviation of the calculated cold pressure from
placard (also displayed) would inform the consumer of how much air to add to the warm tires.
Some of the systems turned off their warnings after a series of brake stops or high-speed driving
(used to heat the tires and raise the tire pressures). One system cleared its warning during the brake
stop run and the high-speed run while another cleared its advisory only during the high-speed run.
The system that had temperature compensation changed from a significant underinflation warning to
an underinflation advisory. The remaining systems held their warnings despite rising internal tire
temperature and pressure.
One of the static tests performed determined how quickly the systems would react to a sudden
decrease in pressure. The test vehicle’s rotating wheels were stopped (sensors active), the valves
were opened, and the time to the first driver notification of underinflation, either an advisory or
warning, was recorded. There was large variability in the time between a low-pressure event and the
driver notification. The average response occurred in just over a minute. The fastest average
response time for a system was 8 seconds while the longest response time for a significant
underinflation warning was 136 seconds. These variations in response time reflect the differences in
update times among systems. More specifically, some systems have the capability to sense an
abrupt change in pressure and trigger a rapid transmission mode, alerting the driver more quickly.
To test the effects of a sensor failure, the left front sensor was removed for each of six PSB systems.
The system was activated and the results recorded. Two systems warned of a sensor problem at
startup. One system indicated zero pressure at startup but switched to a sensor error after fourteen
minutes of driving. One system displayed a sensor failure warning message when the status button
xxi
was pushed, but did not activate automatically. The remaining two systems warned of zero pressure
but did not indicate that the problem was with the sensor.
The original equipment pressure-sensor based system had automatic sensor location recognition, a
feature that eliminates retraining the receiver to new sensor locations after tire rotation. This system
could be reset by pushing a button and then driving until the new locations were recognized. After
tire rotation or replacement, one PSB system, whose sensor screwed on to the valve stems, needed to
have the sensors screwed back on at the designated locations and the receiver reset. Another system
required the new sensor locations to be retrained by a qualified technician. One system required
manually retraining the sensor locations to the receiver by systematically lowering the tire pressure
one tire at a time until the sensor activated. The final system evaluated had a “Tire Rotation Mode”
that allowed the user to reassign sensors to tire locations on the receiver without activating a sensor
by lowering tire pressure.
In general, the PSB systems were able to detect any combination of one or more underinflated tires.
The warning thresholds were consistent from tire to tire and can be easily changed by the system
manufacturer (or by the consumer on aftermarket systems). For systems that require the training of
tire positions upon setup, the training process was tedious and difficult to accomplish. The results of
the evaluation demonstrated that systems that automatically recognize the wheel locations of the
sensors may be of benefit to consumers (though this feature usually requires the addition of antennas
in each wheel well). Sensor batteries have a limited life span of five to ten years. The location of
the tire sensors’ metal valve stems or of the entire sensor (two of six) outside the tire makes them
susceptible to road hazards, especially curb damage. As observed at the VRTC, PSB sensors can be
damaged while mounting or un-mounting the tire to the rim. There is concern over emergency
roadside tire inflation products (Fix-A-Flat®, etc.) possibly clogging up the in-tire sensors.
xxii
Human Factors Examination of Warning Displays
An examination of driver interfaces for existing TPMS showed significant variation in methods of
visual warning presentation for both original equipment and aftermarket systems. Most of the visual
displays were either difficult to see or hard to comprehend, or both. Auditory warnings were overall
fairly similar amongst systems. The variation in visual warning presentation demonstrated the need
for standardization of the visual warnings of tire underinflation to avoid driver confusion.
Low Tire Pressure Icon Comprehension Testing
In response to negative comments regarding the recognizability of the ISO tire pressure icons and
the lack of data regarding their ability to be comprehended by drivers (an investigation of the origin
of the ISO tire pressure icons revealed they were not tested for comprehension prior to being added
to ISO 2575), icon comprehension tests were conducted. The purpose of these tests was to assess
the ability of two existing ISO icons and 13 alternative icons to alert drivers to the condition of low
tire pressure. These 13 icons included 3 different wheel types (two 5 spoke wheels designs, one 7
spoke) applied to each of 4 icon versions (including whole wheel/tire profile, flat tire with an arrow
pointing to it, and 2 different flat tire images). A total of 120 people were asked to look at a picture
of one of the 15 icons and write a response to the question, “This image has just appeared on your
vehicle’s dashboard. It is a warning for _______________________________.” The ISO engine
icon was included on the sheet with each of the 15 icons to acquire data on its comprehension for use
as a baseline. In all, 8 responses were received for each tire pressure icon and 120 responses for the
engine icon.
Results of the initial comprehension test of the 16 icons showed that recognition percentages for the
ISO tire pressure and tire failure icons were the lowest of the 16 icons tested, 38 percent and 25
percent, respectively. All of the 13 proposed alternative tire pressure icons had better
comprehension percentages. Percent correct values observed for the alternative icons ranged from
approximately 62 percent to 100 percent (6 of the 12 had 100 percent comprehension. Respondents
showed near perfect (95 percent) comprehension results for the existing engine icon.
xxiii

Selected Results from Icon Comprehension Test
Icon Version N (out of 8) % Correct
ISO Engine 114 95
ISO Tire Pressure (K.11) 3 38
ISO Tire Failure (K.10) 2 25
Wheel 2 - Flat 1 8 100
Vehicle (showed one tire highlighted to indicate low pressure in that tire) 6.5 81
Results of the comprehension tests showed that recognition was poor for the ISO tire pressure icons
(K.10 and K.11). All of the icons proposed as alternatives to the ISO tire pressure icon were found
to communicate at least some degree of tire inflation condition much better than the ISO icons.
Based on these results, it is suggested that an alternative to the existing ISO icons be considered for
use in warning drivers of low tire pressure. Considering the best recognized “wheel type” and best
recognized “icon version”, a single icon was identified as that which is most likely to be recognized
by the general population. This icon is suggested for consideration as a visual indicator of
significant tire underinflation and is pictured in the following figure.
Suggested icon for indication of significant tire underinflation.
Pictured in the following figure is a type of top-view vehicle display that could be implemented in
vehicles for the presentation of low tire information. Use of this display would allow the
presentation of tire specific information to the driver, i.e., tell which tire is underinflated. This type
of display could be permitted as an alternative to, or in lieu of, a telltale. Of course a WSB system
cannot detect which tire is low, only that one or more tires are low. Therefore, WSB systems would
be limited to the use of a telltale.
xxiv
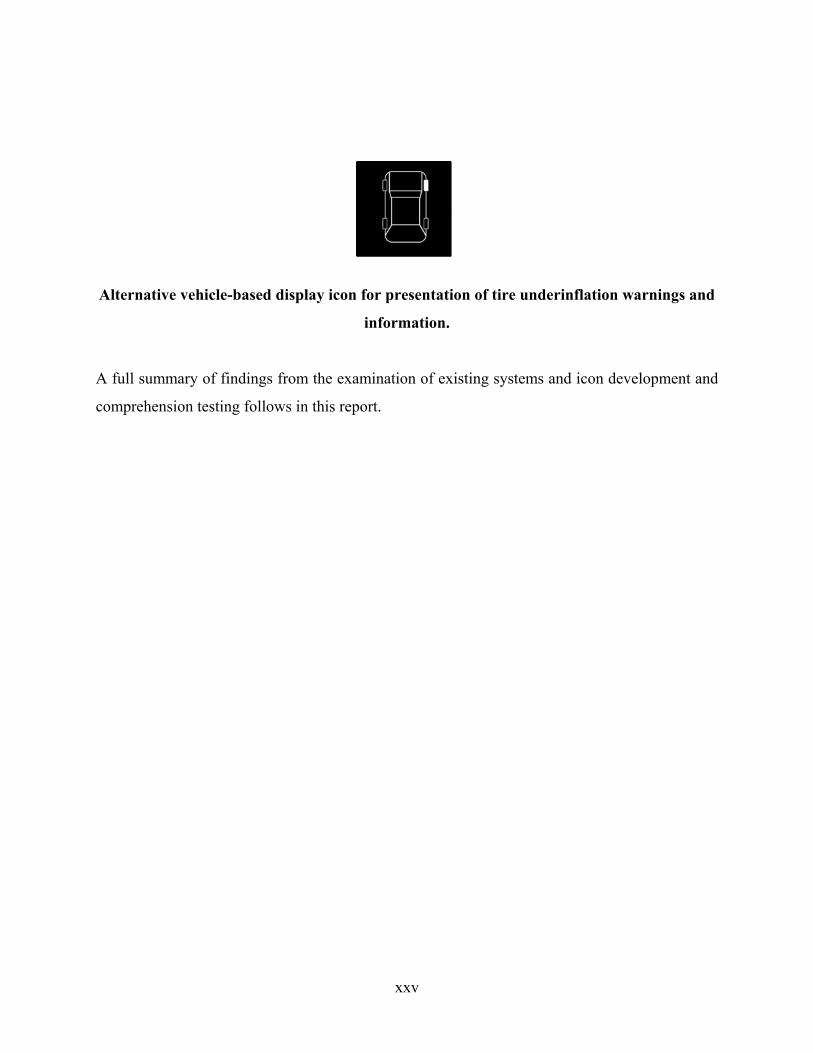
Alternative vehicle-based display icon for presentation of tire underinflation warnings and
information.
A full summary of findings from the examination of existing systems and icon development and
comprehension testing follows in this report.
xxv
1.0 INTRODUCTION
Vehicles being operated with underinflated tires pose a significant safety problem. According to the
Rubber Manufacturers Association, there were 647 fatalities in 1999 that involved “tire related
factors” [1]. They further state that the “leading cause of tire failure is underinflation (which reduces
tread life and generates excessive heat due to increased flexing)” [1]. According to Donald Shea,
Rubber Manufacturers Association president and CEO, “The single most important factor in tire care
is inflation pressure” [2]. Similarly, an article in ATZ Worldwide [3] estimates that 85 percent of
tire failures are due to underinflation that results from gradual pressure loss.
A major contributing factor to this high rate of tire failures due to underinflation and gradual
pressure loss is that many people do not know whether or not their vehicle’s tires are properly
inflated. As a result, many vehicles continue to be operated with underinflated tires. A recent
survey conducted by Tire Business [4] of 766 vehicles found that:
A...72.3 percent of vehicles were operating with at least one tire underinflated with an average underinflation of about 6 psi. 51.0 percent of the vehicles had at least one tire underinflated by 5 psi or more. 40.1 percent had all four tires low by an average of 7 psi….”.
On November 1, 2000, the Transportation Recall, Enhancement, Accountability, and Documentation
(TREAD) Act became law. One section of this Act deals with the above-mentioned problem
through the following requirement:
SEC. 13. Tire Pressure Warning: No later than one year after enactment the [National Highway Traffic Safety Administration] must complete a rulemaking to require a warning system in new motor vehicles to indicate to the operator when a tire is significantly underinflated. The rule must be effective within two years after completing the rulemaking.
This report documents research performed by the National Highway Traffic Safety Administration’s
(NHTSA) Vehicle Research and Test Center (VRTC) to assist in the above mandated rulemaking for
light vehicles.
1
2.0 OBJECTIVES
The objective of this research was to assist the NHTSA with the TREAD mandated rulemaking by
studying existing, light vehicle, Tire Pressure Monitoring Systems (TPMS). For as many models of
TPMS as could be obtained, NHTSA’s VRTC examined and tested each system to determine and
document how it works, how accurate it is, when it warns of tire underinflation, and how it warns
drivers of the condition of underinflation. It should be noted that though tire over-inflation leads to
accelerated tire wear (in the center of the tread pattern), it is not known to be a significant safety
issue.
The systems can be divided into two main categories, Wheel-Speed Based (WSB) and Pressure-
Sensor Based (PSB) TPMS. WSB TPMS infer tire pressures by using the vehicle’s ABS hardware,
specifically the wheel speed sensors, to measure tire-to-tire differences in tire rotational velocities.
PSB TPMS use pressure sensors mounted either in each tire or on each wheel to directly measure
tire pressures.
Four vehicles equipped with Wheel-Speed Based TPMS were studied. For all of these vehicles, the
vehicle manufacturer installed the WSB systems as original equipment. For each vehicle equipped
with a WSB TPMS, the goals of the testing were to determine:
1. The accuracy of the TPMS.
2. The repeatability of the TPMS.
3. When the TPMS issues a warning to the driver.
4. How the TPMS issues a warning to the driver.
5. How to reset/train the TPMS when tires are replaced or rotated.
2
For vehicles with WSB TPMS, the TPMS cannot treat the tires independently. Therefore, for the
appropriate tests, each vehicle was tested with multiple combinations of tires equally deflated. The
combinations tested were:
1. Right front tire being deflated.
2. Left rear tire being deflated.
3. Right front plus left front tires being deflated (only two of the four vehicles).
4. Right front plus right rear tires being deflated.
5. Left front plus right rear tires being deflated.
6. Right front plus left rear tires being deflated.
7. Right front plus left front plus left rear tires being deflated.
8. All four tires being deflated.
Six Pressure-Sensor Based TPMS were studied. One of these PSB systems was original equipment
on a vehicle, while the other five were installed on vehicles by VRTC. For each vehicle equipped
with a PSB TPMS, the goals of the testing were to determine:
1. The accuracy of the TPMS.
2. The repeatability of the TPMS.
3. When the TPMS issues a warning to the driver.
4. How the TPMS issues a warning to the driver.
5. How to reset the TPMS when tires are replaced or rotated.
6. How the TPMS handles temperature effects.
7. What the TPMS does when the system fails.
For vehicles with PSB TPMS, the assumption was made that the TPMS for each tire functions
independently. This was confirmed during pre-testing familiarization trials with various PSB
systems. Therefore, for these tests, each vehicle/TPMS was tested twice dynamically, once with a
front tire being deflated and once with a rear tire being deflated. Static tests on a vehicle lift or on
jack stands were done indoors and outdoors to evaluate temperature effects on the PSB systems.
3

This study also examined the recognizability of underinflated tire warnings that were given to
drivers, i.e., the human factors of the warnings. The visual and auditory displays used to present tire
pressure warning information were examined. Comprehension Tests were conducted to determine
the recognizability of two ISO tire pressure icons and 13 alternative tire pressure icons.
Methods used to reach these objectives are described in the following sections of this report.
4
3.0 SYSTEMS TESTED
Tire pressure monitoring technology is decades old. However, only recently has technology made
these systems affordable and reliable for passenger vehicles. As a result, most of the systems
available for evaluation were first generation systems or prototypes. NHTSA selected ten systems of
varying configurations from manufacturers in Europe, Japan, and the USA.
As was mentioned in the preceding section, TPMS can be divided into two main categories, Wheel-
Speed Based - WSB (Indirect) and Pressure-Sensor Based - PSB (Direct). WSB systems infer tire
pressures by using the vehicle’s ABS hardware, specifically the wheel speed sensors, to measure
tire-to-tire differences in tire rotational velocities that indicate that a tire is at a different pressure
from the others. PSB systems measure tire pressures directly with pressure sensors mounted either
inside the tire or on the valve stem. The pressure reading is transmitted via radio signal to the
control unit, which then indicates to the driver that the pressure is low.
3.1 Summary of TPMS/Vehicles Tested
The test systems and accompanying vehicles tested are listed in Table 3.1. A number of the systems
tested were not yet on the market at the time this report was prepared or were still prototypes.
Detailed descriptions of the driver interfaces are provided in Section 7.0, HUMAN FACTORS
ASSESSMENT OF EXISTING TPMS DRIVER INTERFACES. The 10 systems tested are
described in Table 3.1.
5
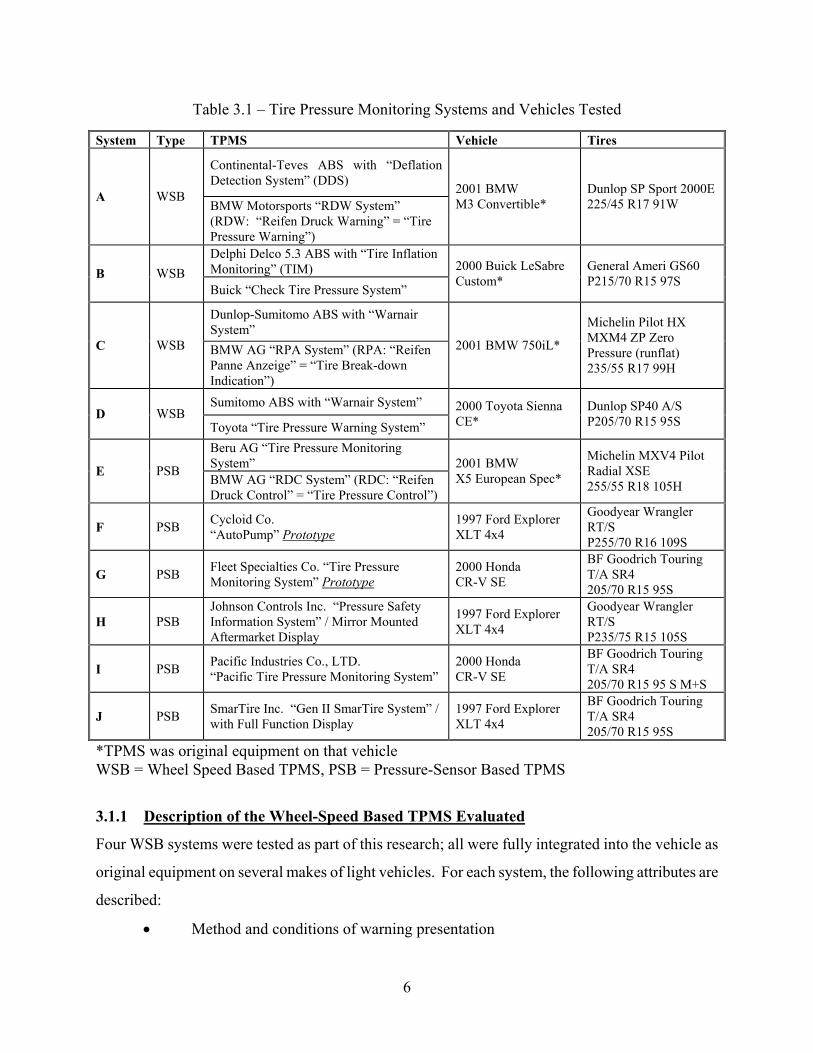
Table 3.1 – Tire Pressure Monitoring Systems and Vehicles Tested
System TPMS Vehicle Tires
Continental-Teves ABS with “Deflation Detection System” (DDS)
A WSB BMW Motorsports “RDW System” (RDW: arning” = “Tire Pressure Warning”)
2001 BMW M3 Convertible*
Dunlop SP Sport 2000E 225/45 R17 91W
Delphi Delco 5.3 ABS with “Tire Inflation Monitoring” (TIM)B WSB Buick “Check Tire Pressure System”
2000 Buick LeSabre Custom*
General Ameri GS60 P215/70 R15 97S
Dunlop-Sumitomo ABS with “Warnair System”
C WSB BMW AG “RPA System” (RPA: “Reifen Panne Anzeige” = “Tire Break-down Indication”)
2001 BMW 750iL*
Michelin Pilot HX MXM4 ZP Zero Pressure (runflat) 235/55 R17 99H
Sumitomo ABS with “Warnair System” D WSB
Toyota “Tire Pressure Warning System” 2000 Toyota Sienna CE*
Dunlop SP40 A/S P205/70 R15 95S
Beru AG “Tire Pressure Monitoring System” E PSB BMW AG “RDC System” (RDC: “Reifen Druck Control” = “Tire Pressure Control”)
2001 BMW X5 European Spec*
Michelin MXV4 Pilot Radial XSE 255/55 R18 105H
F PSB Cycloid Co. “AutoPump” Prototype
1997 Ford Explorer XLT 4x4
Goodyear Wrangler RT/S P255/70 R16 109S
G PSB Fleet Specialties Co. “Tire Pressure Monitoring System” Prototype
2000 Honda CR-V SE
BF Goodrich Touring T/A SR4 205/70 R15 95S
H PSB Johnson Controls Inc. Information System” / Mirror Mounted Aftermarket Display
1997 Ford Explorer XLT 4x4
Goodyear Wrangler RT/S P235/75 R15 105S
I PSB Pacific Industries Co., LTD. “Pacific Tire Pressure Monitoring System”
2000 Honda CR-V SE
BF Goodrich Touring T/A SR4 205/70 R15 95 S M+S
J PSB SmarTire Inc. Gen II SmarTire System” / with Full Function Display
1997 Ford Explorer XLT 4x4
BF Goodrich Touring T/A SR4 205/70 R15 95S
Type
“Reifen Druck W
“Pressure Safety
“
*TPMS was original equipment on that vehicle WSB = Wheel Speed Based TPMS, PSB = Pressure-Sensor Based TPMS
3.1.1 Description of the Wheel-Speed Based TPMS Evaluated
Four WSB systems were tested as part of this research; all were fully integrated into the vehicle as
original equipment on several makes of light vehicles. For each system, the following attributes are
described:
• Method and conditions of warning presentation
6
• System Status Information
• Calibration
3.1.1.1 System A
Method and Conditions of Warning Presentation: System A had a single stage underinflation
warning to inform the driver when the inflation pressure in one of the tires dropped significantly [5]
(amount of pressure loss until activation was not given in owner’s manual). This warning only
occurred while the vehicle was being driven. The system warned the driver by illuminating the ISO
K.11 icon on the instrument cluster (the right-most icon Figure 3.1) and sounding an auditory
warning tone. The icon (the right-most icon in Figure 3.1) illuminated with the color red to show
underinflation and the color yellow to show a system malfunction condition. System A allowed the
driver to deactivate the system for driving with snow chains by pushing the system button on the
dashboard, which then illuminated yellow.
The owner’s manual warned:
The (system) cannot alert you to severe and sudden tire damage caused by external factors
The (system) will not identify the natural, even loss of pressure in all four tires
Under certain circumstances, there may be false warnings or a delayed detection of losses
in pressure when driving on snow-covered or slippery road surfaces
A sporty driving style (slip at the wheels receiving the torque, high lateral acceleration) can
lead to delayed (system) warnings [5]
7
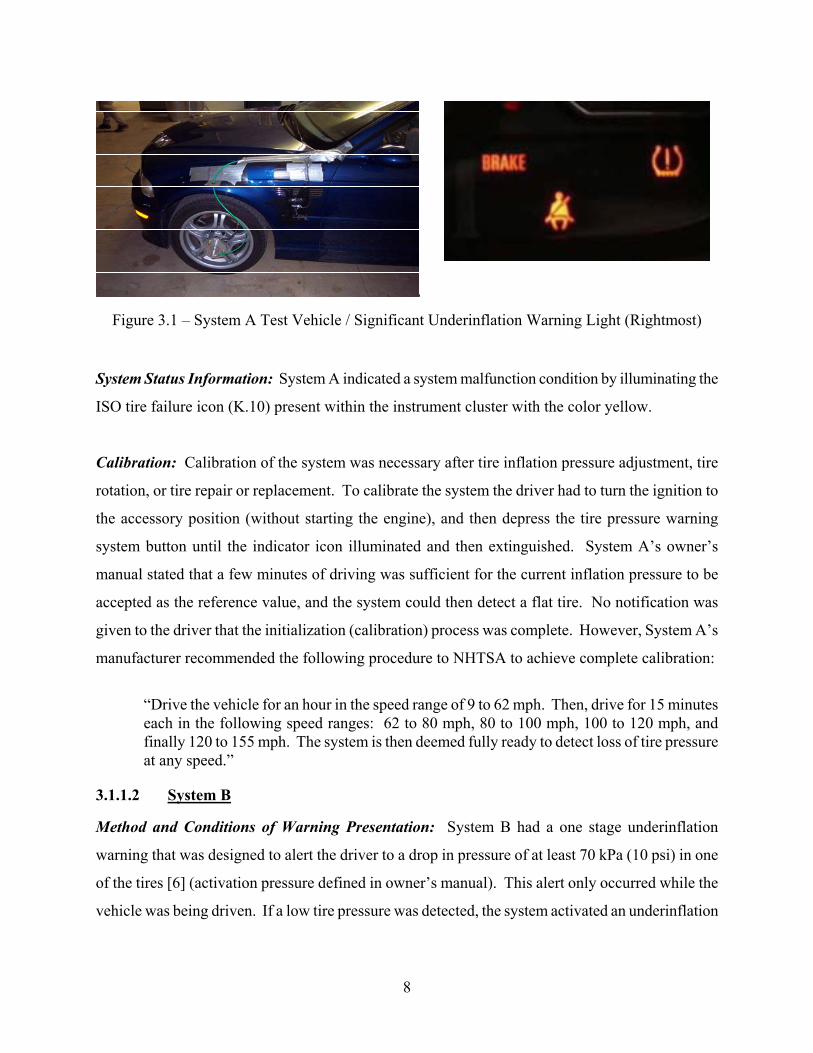
Figure 3.1 – System A Test Vehicle / Significant Underinflation Warning Light (Rightmost)
System Status Information: System A indicated a system malfunction condition by illuminating the
ISO tire failure icon (K.10) present within the instrument cluster with the color yellow.
Calibration: Calibration of the system was necessary after tire inflation pressure adjustment, tire
rotation, or tire repair or replacement. To calibrate the system the driver had to turn the ignition to
the accessory position (without starting the engine), and then depress the tire pressure warning
system button until the indicator icon illuminated and then extinguished. System A’s owner’s
manual stated that a few minutes of driving was sufficient for the current inflation pressure to be
accepted as the reference value, and the system could then detect a flat tire. No notification was
given to the driver that the initialization (calibration) process was complete. However, System A’s
manufacturer recommended the following procedure to NHTSA to achieve complete calibration:
“Drive the vehicle for an hour in the speed range of 9 to 62 mph. Then, drive for 15 minutes each in the following speed ranges: 62 to 80 mph, 80 to 100 mph, 100 to 120 mph, and finally 120 to 155 mph. The system is then deemed fully ready to detect loss of tire pressure at any speed.”
3.1.1.2 System B
Method and Conditions of Warning Presentation: System B had a one stage underinflation
warning that was designed to alert the driver to a drop in pressure of at least 70 kPa (10 psi) in one
of the tires [6] (activation pressure defined in owner’s manual). This alert only occurred while the
vehicle was being driven. If a low tire pressure was detected, the system activated an underinflation
8
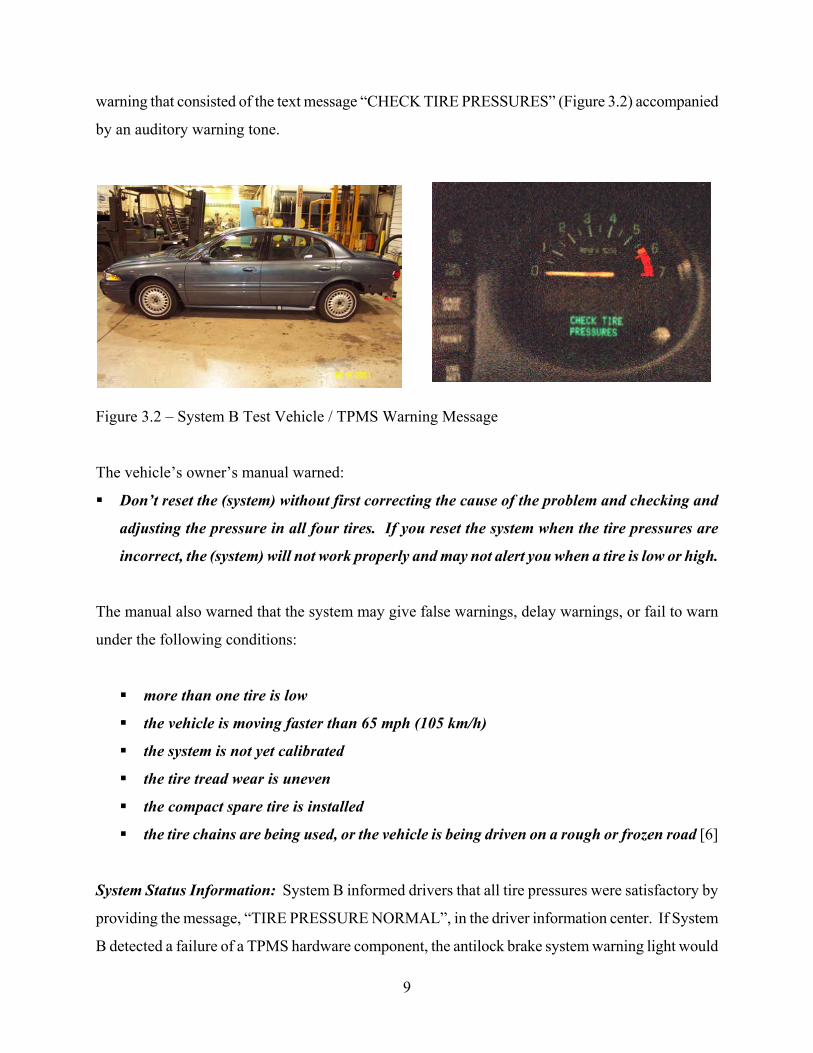
warning that consisted of the text message “CHECK TIRE PRESSURES” (Figure 3.2) accompanied
by an auditory warning tone.
Figure 3.2 – System B Test Vehicle / TPMS Warning Message
The vehicle’s owner’s manual warned:
Don’t reset the (system) without first correcting the cause of the problem and checking and
adjusting the pressure in all four tires. If you reset the system when the tire pressures are
incorrect, the (system) will not work properly and may not alert you when a tire is low or high.
The manual also warned that the system may give false warnings, delay warnings, or fail to warn
under the following conditions:
more than one tire is low
the vehicle is moving faster than 65 mph (105 km/h)
the system is not yet calibrated
the tire tread wear is uneven
the compact spare tire is installed
the tire chains are being used, or the vehicle is being driven on a rough or frozen road [6]
System Status Information: System B informed drivers that all tire pressures were satisfactory by
providing the message, “TIRE PRESSURE NORMAL”, in the driver information center. If System
B detected a failure of a TPMS hardware component, the antilock brake system warning light would
9

illuminate. However, the ABS warning light would not activate if the TPMS system failed to warn
due to one of the eight causes listed in the owner’s manual. These causes represent limitations in the
sensing algorithm (software) that cannot be detected or accounted for.
Calibration: Calibration of the system was necessary after adjustment of the tire pressure, tire
rotation, tire repair or replacement, and after the disconnection of the battery. System B’s
calibration was initiated by the driver resetting the system through a menu on the Driver Information
Center. After the TPMS was reset, the car needed to be driven for 45 to 90 minutes. The system had
two monitoring modes. The first was a partial monitoring mode with reduced sensing capabilities.
Once full calibration was achieved, the system entered the second, “fully active” monitoring mode.
To achieve full calibration, the vehicle had to be driven in three different speed ranges, 15 to 40
mph, 40 to 70 mph, and 70 to 90 mph. After completing this driving, the system was completely
calibrated, according to the owner’s manual, and ready to detect a loss of tire pressure. However,
this system did not notify the driver when the state of full calibration had been achieved.
3.1.1.3 System C
Method and Conditions of Warning Presentation: System C had a one stage underinflation
warning that alerted the driver of significant tire pressure loss by displaying the following message
on the driver display: “TIRE DEFECT” (Figure 3.3) with an audible signal. The word “DEFECT”
in the “TIRE DEFECT” message was a translation discrepancy that the vehicle manufacturer was
reportedly addressing. The system could inform the driver of tire failure only while the vehicle was
in motion.
10
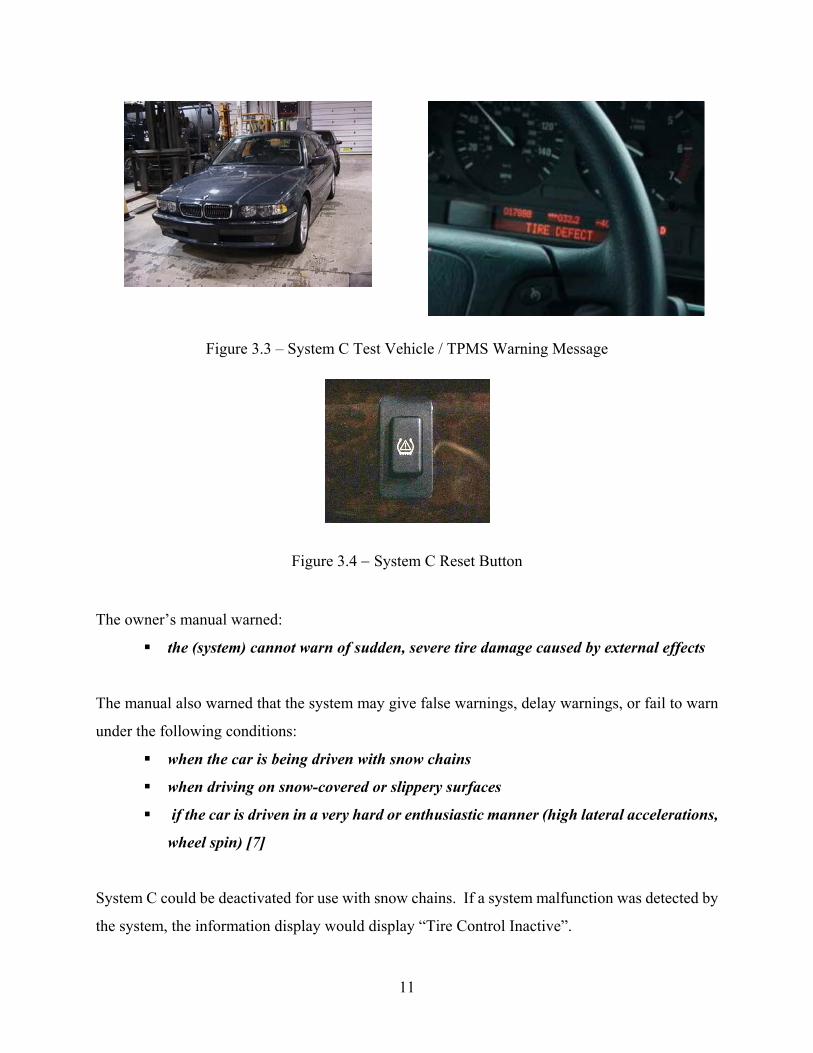
Figure 3.3 – System C Test Vehicle / TPMS Warning Message
Figure 3.4 − System C Reset Button
The owner’s manual warned:
the (system) cannot warn of sudden, severe tire damage caused by external effects
The manual also warned that the system may give false warnings, delay warnings, or fail to warn
under the following conditions:
when the car is being driven with snow chains
when driving on snow-covered or slippery surfaces
if the car is driven in a very hard or enthusiastic manner (high lateral accelerations,
wheel spin) [7]
System C could be deactivated for use with snow chains. If a system malfunction was detected by
the system, the information display would display “Tire Control Inactive”.
11

System Status Information: System C warned of a malfunction condition by either illuminating the
ISO tire pressure icon (K.10), which was present within the instrument cluster, or by not
illuminating the icon at all.
Calibration: Calibration of System C was required after tire pressure adjustments, tire rotation, or
tire repair or replacement. System calibration was achieved by pressing and holding the reset switch
found on the lower right instrument panel (Figure 3.4) and then driving the car for ten minutes.
After this procedure was complete the system was stated to be ready to detect a significant loss of
tire pressure.
3.1.1.4 System D
Method and Conditions of Warning Presentation: System D had a one stage underinflation
warning that provided the driver with a warning when tire pressure in one of the tires was “critically
reduced”. This alert only occurred while the vehicle was in motion. The system alerted the driver by
illuminating the ISO icon K.11 on the instrument cluster (the middle icon in Figure 3.5).
Figure 3.5 – System D Test Vehicle / Warning Light (Middle) / TPMS Reset Button
The manufacturer warned that the system may give false warnings, delay warnings, or fail to warn
under the following conditions:
if the tread wear is uneven among the installed tires
if a compact spare tire, snow tires, or tire chains are used
12

if the tire pressure is excessively higher than specified, or if the tire pressure is suddenly
reduced due to bursts or other causes
if the vehicle is driven on a slippery road surface such as a rough road and frozen road
if the vehicle speed is less than 30 km/h (19 mph) or more than 100 km/h (62 mph), and if the
driving duration is less than 5 minutes [8]
System Status Information: When the ignition was switched on, the TPMS light would illuminate
for three seconds to indicate that the TPMS circuits were functioning. Since the operation of the
TPMS was wheel speed information provided by the antilock brake system, a problem with the ABS
hardware, more specifically the wheel speed sensors, would affect TPMS function. Thus, indication
of ABS malfunction as indicated by illumination of the ABS warning light would also indicate a
malfunction of the TPMS. There was no other indication of TPMS malfunction in addition to the
illumination of the ABS warning light.
Calibration: Calibration of the system was required after tire rotation or tire replacement. This
calibration was accomplished by pressing and holding the reset switch that was located on the lower
left instrument panel (rightmost picture in Figure 3.5). Then, the car had to be driven at speeds
above 19 mph for 8 hours before it was considered ready to detect loss of tire pressure. Though the
8hours of driving to calibrate the system was cumulative, allowing multiple driving sessions to
achieve full calibration, no indication was given to the driver once the system was fully calibrated
and in sensing mode.
3.1.2 Description of the Pressure-Sensor Based TPMS Evaluated
Six PSB systems were evaluated. One manufacturer installed a PSB TPMS on a vehicle as original
equipment, while the other five systems were installed on test vehicles by VRTC. The PSB systems
tested had a pressure sensor mounted either in each tire or on the valve stem or wheel. The sensors
communicated with the receiver through radio waves. Each sensor had a unique digital
identification code so that the particular tire with low pressure could be identified on the driver’s
display. The digital identification code also prevented signals from other vehicles’ sensors from
being analyzed by the TPMS. Most of these systems had an antenna built into the receiver;
however, some had antennas mounted near the tires in the wheel wells. External antennas allowed
13
automatic sensor location capabilities. Otherwise, the receivers had to be trained to the sensor
locations. For each system, the following attributes are described:
• Sensor hardware
• Method and conditions of warning presentation
• System status information
• Calibration
3.1.2.1 System E
Sensor Hardware: System E was an original equipment pressure-sensor based TPMS. The sensor,
which measured both tire pressure and air temperature, was inserted inside the wheel rim with a
threaded aluminum valve stem replacing the original tire valve stem (Figure 3.6). Each sensor had
its own identifying code. The vehicle manufacturer mounted antennas in each of the wheel well,
which were then connected to the vehicle’s ECU.
The stated accuracy of the system was ± 1 psi. Pressures are sampled by the system every 3 seconds
but are transmitted every 54 seconds. In the case of a rapid loss of pressure, the system had the
ability to cause the sensor to sample and transmit every 0.8 seconds. The temperature measurement
was used to calculate the equivalent cold inflation pressure.
Method and Conditions of Warning Presentation: The driver interface for System E is shown in
Figure 3.7. The system present on the European specification vehicle provided for testing had a
single level of warning. This single warning level indicated the condition of significant tire
underinflation and consisted of the text message “TYREPRESS” followed by either “FRONT” or
REAR” and then “L.” or “R.” to indicate the specific tire that the warning referred to. The system
used pre-stored values to evaluate tire pressure, but could also accept values supplied by the driver.
14
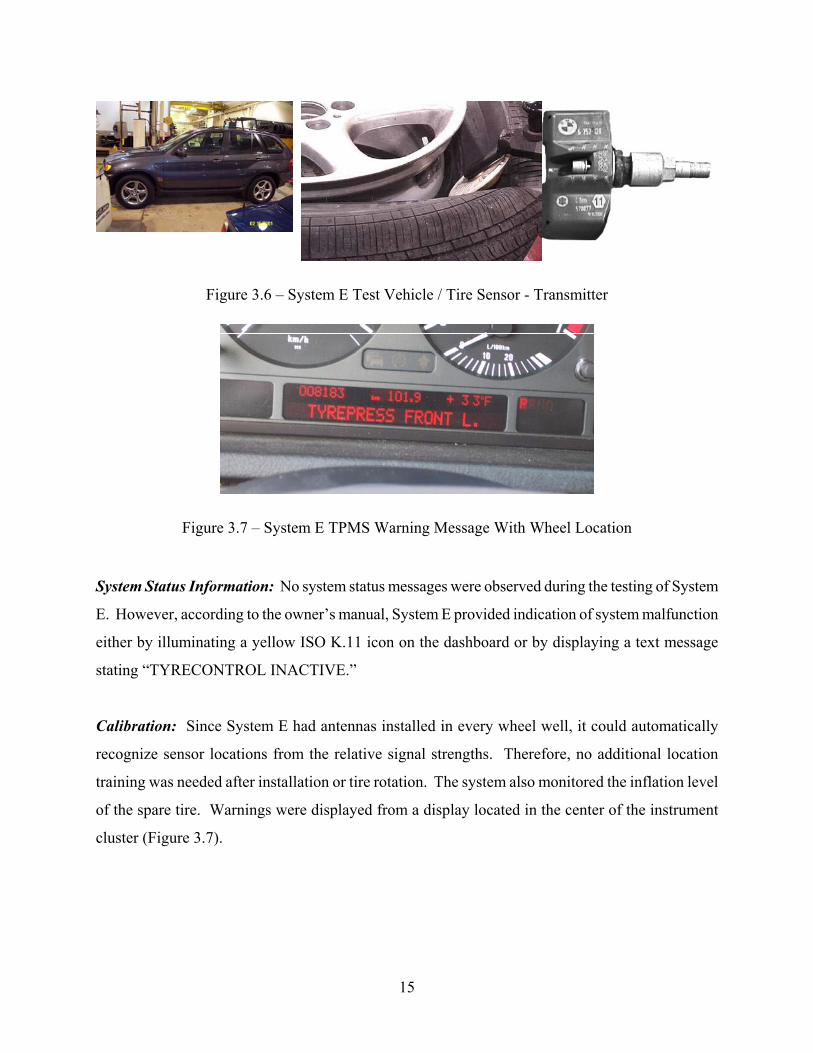
Figure 3.6 – System E Test Vehicle / Tire Sensor - Transmitter
Figure 3.7 – System E TPMS Warning Message With Wheel Location
System Status Information: No system status messages were observed during the testing of System
E. However, according to the owner’s manual, System E provided indication of system malfunction
either by illuminating a yellow ISO K.11 icon on the dashboard or by displaying a text message
stating “TYRECONTROL INACTIVE.”
Calibration: Since System E had antennas installed in every wheel well, it could automatically
recognize sensor locations from the relative signal strengths. Therefore, no additional location
training was needed after installation or tire rotation. The system also monitored the inflation level
of the spare tire. Warnings were displayed from a display located in the center of the instrument
cluster (Figure 3.7).
15
3.1.2.2 System F
Sensor Hardware: System F was a prototype pressure-sensor based TPMS and tire inflation
maintenance system. Tire pressures were sampled every 30 seconds and the status was transmitted
every 10 minutes. The stated accuracy of the system was ± 1 psi. The pressure sensor, transmitter,
and inertial driven pump are all contained in a sensor body that mounts to the center of the wheel
(Figure 3.8). A special one-way pressure port was installed in a hole drilled through the wheel rim
by the system manufacturer, necessitating specially modified rims to use this system. This port was
then connected to the sensor/pump mechanism with a rubber hose. The hose allowed the hockey-
puck sized sensor/pump unit to monitor current tire pressure and to pump additional air into the tires.
An example of the inflation capabilities of this system can be seen in Appendix 2.
Method and Conditions of Warning Presentation: System F was designed to give two warning
levels. The first was a “low pressure warning” designed to activate at 18 psi. The second was a
“severe underinflation alert”, which was designed to activate at 10 psi. However, since this version
was a prototype of an original equipment system that was not commercially available, no driver
interface was available for testing. Instead, a laptop computer was connected to the receiver to
permit monitoring of the system.
Figure 3.8 – System F Test Vehicle / System F Wheel Sensor-Transmitter-Pump Unit
System Status Information: Due to the fact that this was a prototype system and a driver interface
was not available for testing, the type of system status information that System F had the ability to
present was not determinable.
16
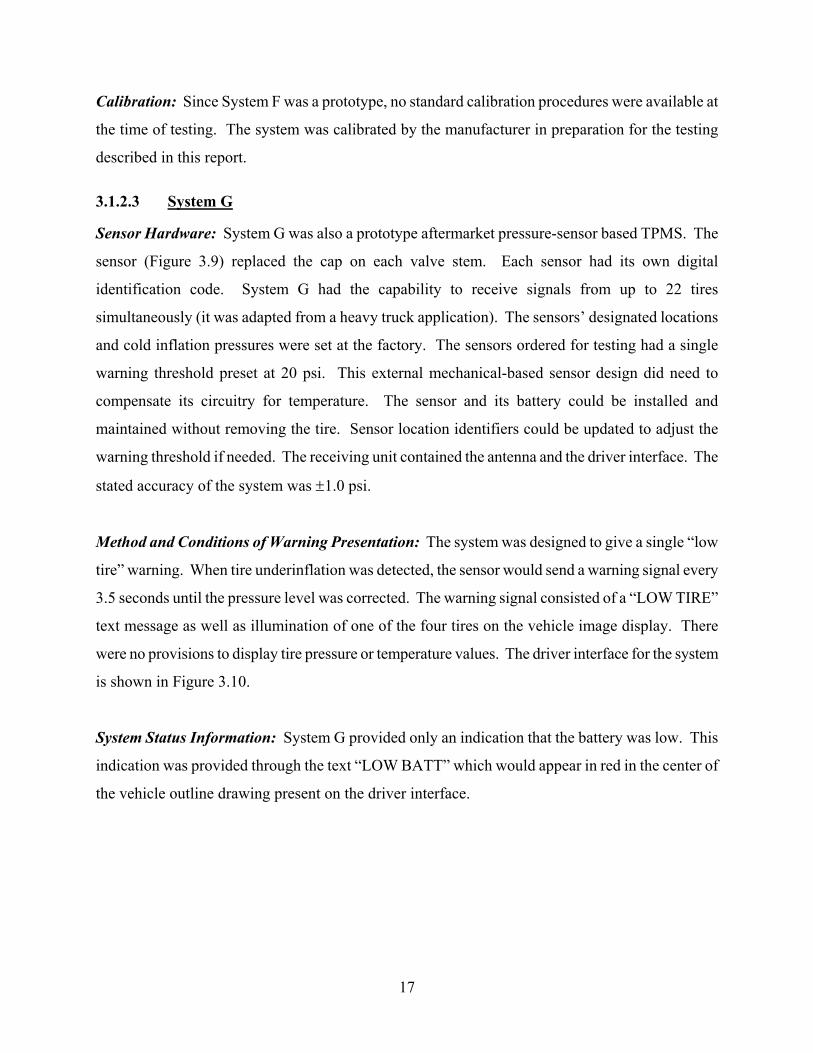
Calibration: Since System F was a prototype, no standard calibration procedures were available at
the time of testing. The system was calibrated by the manufacturer in preparation for the testing
described in this report.
3.1.2.3 System G
Sensor Hardware: System G was also a prototype aftermarket pressure-sensor based TPMS. The
sensor (Figure 3.9) replaced the cap on each valve stem. Each sensor had its own digital
identification code. System G had the capability to receive signals from up to 22 tires
simultaneously (it was adapted from a heavy truck application). The sensors’ designated locations
and cold inflation pressures were set at the factory. The sensors ordered for testing had a single
warning threshold preset at 20 psi. This external mechanical-based sensor design did need to
compensate its circuitry for temperature. The sensor and its battery could be installed and
maintained without removing the tire. Sensor location identifiers could be updated to adjust the
warning threshold if needed. The receiving unit contained the antenna and the driver interface. The
stated accuracy of the system was ±1.0 psi.
Method and Conditions of Warning Presentation: The system was designed to give a single “low
tire” warning. When tire underinflation was detected, the sensor would send a warning signal every
3.5 seconds until the pressure level was corrected. The warning signal consisted of a “LOW TIRE”
text message as well as illumination of one of the four tires on the vehicle image display. There
were no provisions to display tire pressure or temperature values. The driver interface for the system
is shown in Figure 3.10.
System Status Information: System G provided only an indication that the battery was low. This
indication was provided through the text “LOW BATT” which would appear in red in the center of
the vehicle outline drawing present on the driver interface.
17

Figure 3.9 – System G Tire Sensor-Transmitter
Figure 3.10 – System G Display
Calibration: System G’s sensors screwed onto the valve stem and were labeled for each wheel
position. Thus, the position of the sensors was intended to be fixed even in the event of tire rotation.
Once the sensors are screwed back on or the inflation pressure problem is rectified (or low battery is
rectified), A "RESET" button was present on the receiver and was used to clear any low battery
(sensor) or underinflation warnings and to reset the system after removal of the sensors or
adjustment of tire pressure.
3.1.2.4 System H
Sensor Hardware: System H was an aftermarket pressure-sensor based TPMS. The pressure
sensor/transmitter is displayed in Figure 3.11. The sensor was inserted inside each wheel rim, with
the aluminum valve stem replacing the tire valve stem. Each sensor had its own digital identification
18
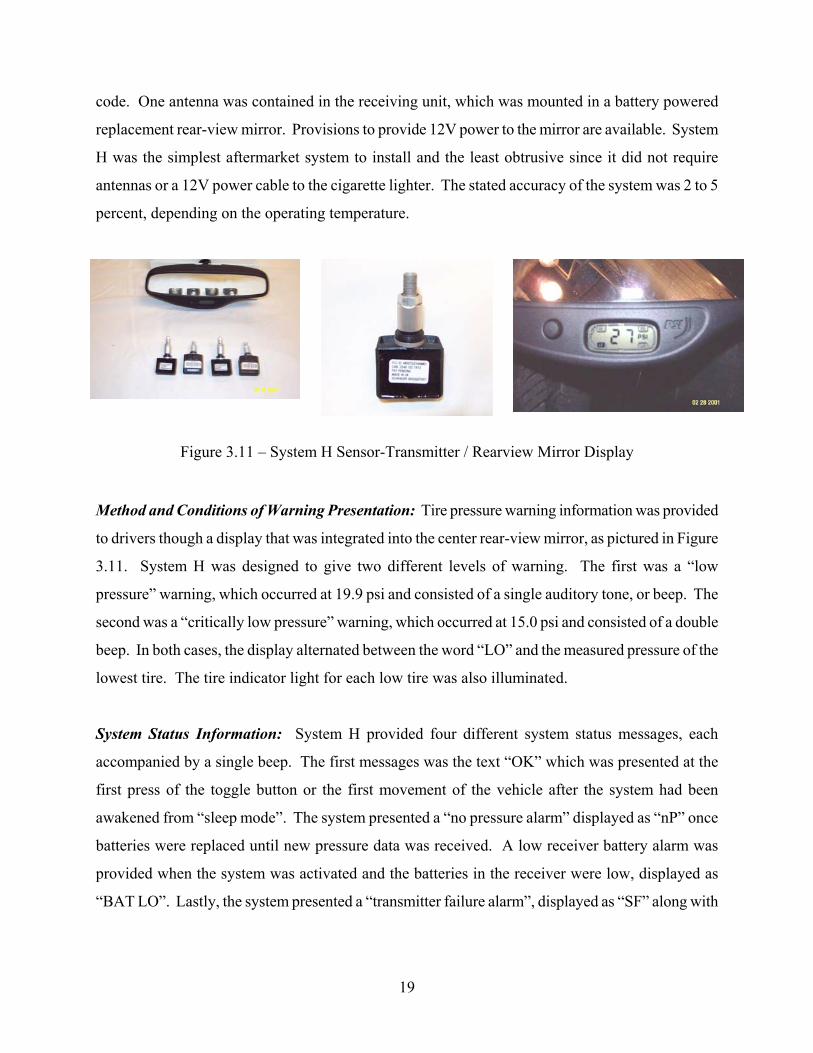
code. One antenna was contained in the receiving unit, which was mounted in a battery powered
replacement rear-view mirror. Provisions to provide 12V power to the mirror are available. System
H was the simplest aftermarket system to install and the least obtrusive since it did not require
antennas or a 12V power cable to the cigarette lighter. The stated accuracy of the system was 2 to 5
percent, depending on the operating temperature.
Figure 3.11 – System H Sensor-Transmitter / Rearview Mirror Display
Method and Conditions of Warning Presentation: Tire pressure warning information was provided
to drivers though a display that was integrated into the center rear-view mirror, as pictured in Figure
3.11. System H was designed to give two different levels of warning. The first was a “low
pressure” warning, which occurred at 19.9 psi and consisted of a single auditory tone, or beep. The
second was a “critically low pressure” warning, which occurred at 15.0 psi and consisted of a double
beep. In both cases, the display alternated between the word “LO” and the measured pressure of the
lowest tire. The tire indicator light for each low tire was also illuminated.
System Status Information: System H provided four different system status messages, each
accompanied by a single beep. The first messages was the text “OK” which was presented at the
first press of the toggle button or the first movement of the vehicle after the system had been
awakened from “sleep mode”. The system presented a “no pressure alarm” displayed as “nP” once
batteries were replaced until new pressure data was received. A low receiver battery alarm was
provided when the system was activated and the batteries in the receiver were low, displayed as
“BAT LO”. Lastly, the system presented a “transmitter failure alarm”, displayed as “SF” along with
19

the appropriate tire illuminated on the vehicle figure to indicate that no pressure information had
been received from one or more sensors for more than 15 minutes.
Calibration: When first installed on a vehicle, the system had to be trained to recognize the
identification code from each tire. This training was accomplished by first putting the display into
the training mode. Then a magnet was held near the sensor on the left front wheel. The display
would produce an auditory warning tone indicating that the wheel has been recognized and
programmed into the system. The magnet was then moved to the right front, right rear, and left rear
wheels, in that order. If the magnet training method failed, which could happen with large steel
wheels, the sensors could be trained by a different method that involved deflating one tire at a time
to train the receiver to sensor locations.
3.1.2.5 System I
Sensor Hardware: System I was an aftermarket pressure-sensor based TPMS. The sensor was
inserted inside each wheel rim, with the aluminum valve stem replacing the original tire valve stem
(Figure 3.12). Each sensor had its own digital identification code. One antenna was mounted in
each wheel well, though one per axle may be sufficient depending on the size of the vehicle. The
stated accuracy of the system was 1.8 psi.
Method and Conditions of Warning Presentation: The driver interface for System I is shown in
Figure 3.13. System I monitored both pressure and temperature and could provide warnings for
these conditions for each of the four tires individually. The system was designed to give four
different levels of warnings. The first was a “below user target pressure” warning and auditory tone,
which occurred when the pressure dropped below the level set by the user. The pressure was
sampled every 15 seconds. Normally, data was transmitted every 10 minutes; but, in the case of a
warning condition, it was transmitted every 15 seconds. The second warning was a “below warning
pressure” alert and audible signal, which occurred at 20.3 psi. The third warning was a “decreasing
tire pressure” warning that occurred when there was a loss of 2.9 psi in 15 seconds or a loss of 23.5
psi in 45 seconds. The fourth warning was the “temperature alarm” which activated when one of the
tires’ contained air reached 230 degrees F. The temperature or pressure could be checked at any
time by the driver.
20

Figure 3.12 – System I Test Vehicle / System I Display and Tire Sensor-Transmitter
Figure 3.13 – System I TPMS Display
System Status Information: Upon vehicle ignition, System I would display tire pressure
information. If tire pressures were in the normal range, pressure values are displayed for 10 seconds
and then the visual display turns off. “System alarms” were provided to indicate data not received
(no data received for at least one hour from a transmitter), alarm transmitter voltage drop, alarm
transmitter status (four consecutive signals indicating alarm reception status were received), alarm
data (four consecutive signals indicating out-of-range pressure, temperature, and voltage were
received), receiver alarm (no data received for at least 20 minutes from all transmitters), and receiver
voltage drop.
Calibration: When first installed on a vehicle, the wheels had to be registered for the system to
recognize the identification code from each tire. This registration was accomplished by first putting
the display into the registration mode. The position of the wheel was then entered (such as right
front). Then air was let out of the right front wheel. The driver interface would emit an auditory
warning tone indicating that the wheel has been recognized and programmed into the system. The
display was then advanced and air was removed from the right rear, left rear, and left front wheels,
in that order to complete the registration. Confirmation of registration was recommended and was
21
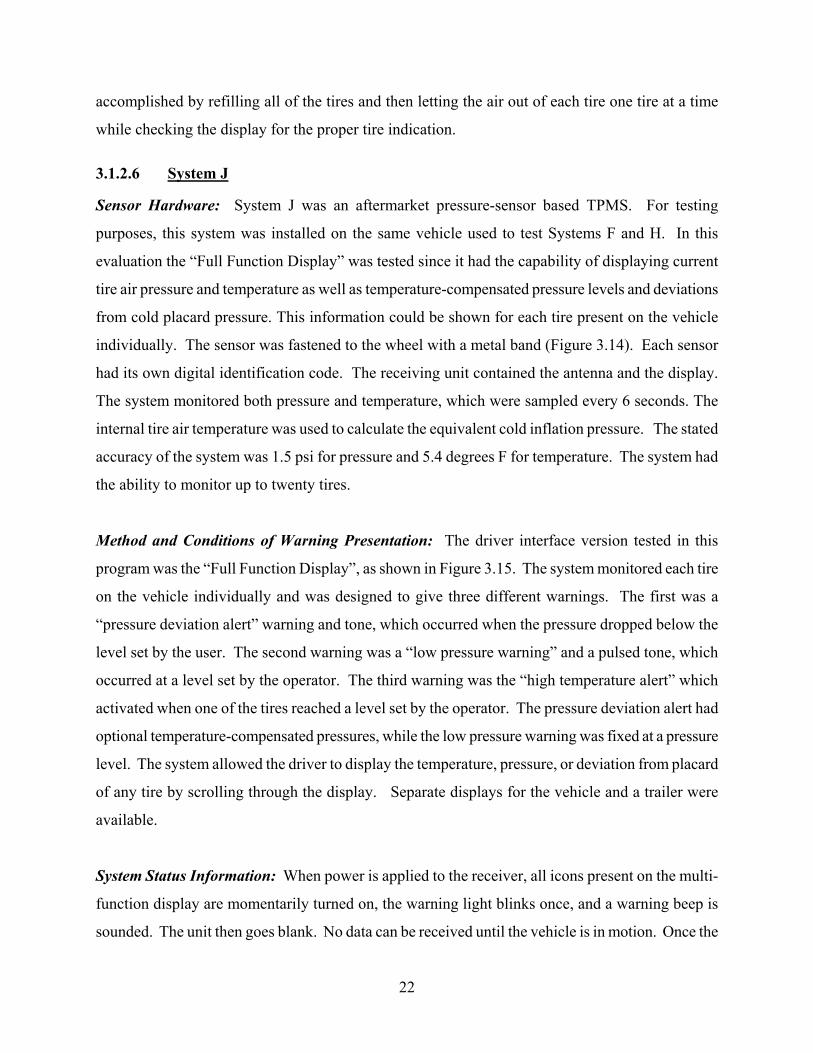
accomplished by refilling all of the tires and then letting the air out of each tire one tire at a time
while checking the display for the proper tire indication.
3.1.2.6 System J
Sensor Hardware: System J was an aftermarket pressure-sensor based TPMS. For testing
purposes, this system was installed on the same vehicle used to test Systems F and H. In this
evaluation the “Full Function Display” was tested since it had the capability of displaying current
tire air pressure and temperature as well as temperature-compensated pressure levels and deviations
from cold placard pressure. This information could be shown for each tire present on the vehicle
individually. The sensor was fastened to the wheel with a metal band (Figure 3.14). Each sensor
had its own digital identification code. The receiving unit contained the antenna and the display.
The system monitored both pressure and temperature, which were sampled every 6 seconds. The
internal tire air temperature was used to calculate the equivalent cold inflation pressure. The stated
accuracy of the system was 1.5 psi for pressure and 5.4 degrees F for temperature. The system had
the ability to monitor up to twenty tires.
Method and Conditions of Warning Presentation: The driver interface version tested in this
program was the “Full Function Display”, as shown in Figure 3.15. The system monitored each tire
on the vehicle individually and was designed to give three different warnings. The first was a
“pressure deviation alert” warning and tone, which occurred when the pressure dropped below the
level set by the user. The second warning was a “low pressure warning” and a pulsed tone, which
occurred at a level set by the operator. The third warning was the “high temperature alert” which
activated when one of the tires reached a level set by the operator. The pressure deviation alert had
optional temperature-compensated pressures, while the low pressure warning was fixed at a pressure
level. The system allowed the driver to display the temperature, pressure, or deviation from placard
of any tire by scrolling through the display. Separate displays for the vehicle and a trailer were
available.
System Status Information: When power is applied to the receiver, all icons present on the multi-
function display are momentarily turned on, the warning light blinks once, and a warning beep is
sounded. The unit then goes blank. No data can be received until the vehicle is in motion. Once the
22
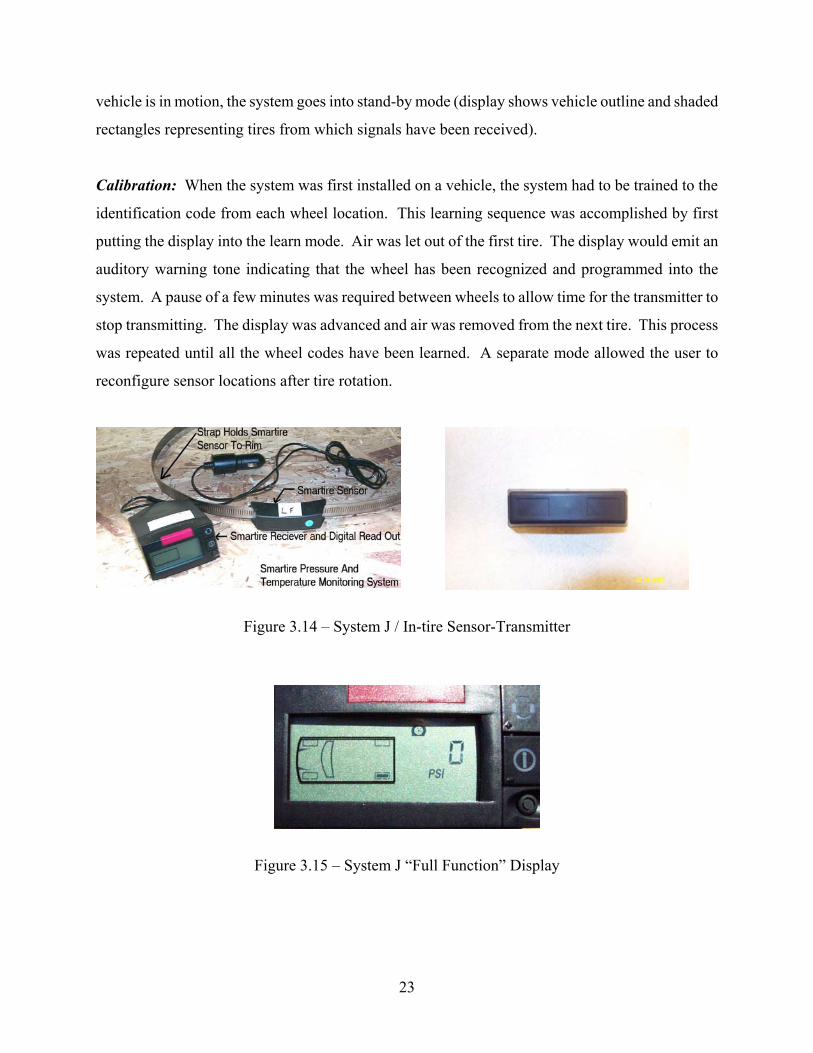
vehicle is in motion, the system goes into stand-by mode (display shows vehicle outline and shaded
rectangles representing tires from which signals have been received).
Calibration: When the system was first installed on a vehicle, the system had to be trained to the
identification code from each wheel location. This learning sequence was accomplished by first
putting the display into the learn mode. Air was let out of the first tire. The display would emit an
auditory warning tone indicating that the wheel has been recognized and programmed into the
system. A pause of a few minutes was required between wheels to allow time for the transmitter to
stop transmitting. The display was advanced and air was removed from the next tire. This process
was repeated until all the wheel codes have been learned. A separate mode allowed the user to
reconfigure sensor locations after tire rotation.
Figure 3.14 – System J / In-tire Sensor-Transmitter
Figure 3.15 – System J “Full Function” Display
23
3.2 Wheel-Speed Based Tire Pressure Monitoring System Specifications
Wheel-speed based system specifications are limited since these systems consist of little more than
an addition of software code to the ABS ECU and a warning light. As original equipment systems,
their descriptions in the vehicle’s owners and service manuals were user oriented and non-technical.
Though the WSB systems use the ABS wheel-speed sensors to sense tire circumference, no
specifications on ABS sensors’ accuracies or update rates were available. Complicating this is the
tendency of ABS manufacturers to closely guard the sensing algorithms of the ABS and the WSB
TPMS. Though detailed information on activation threshold of the underinflation warning is not
readily available, most systems claimed to warn when one tire dropped 20 to 30 percent below the
other tires.
The vehicles’ owner’s manuals described how to operate the systems and warned of their limitations.
For instance, all four owner’s manuals cautioned that the WSB systems may give false warnings,
delay warnings, or fail to warn under certain operating conditions or when used in conjunction with
certain equipment such as tire chains or mini-spare tires. Owners were also cautioned against using
tires not approved for their particular vehicle.
Currently, 1.6 million vehicles in the USA are equipped with wheel-speed based TPMS1. The cost
of the WSB systems either to the manufacturer or the consumer was not available to VRTC at the
time of this report. More than likely, the WSB systems were integrated to vehicles that were already
equipped with ABS. Again, aside from research and development costs, the WSB TPMS costs
consist mostly of adding software (and possibly minor electronics) to the ABS system and the
addition of a warning light on the dash. Since the systems use the ABS wheel-speed sensors, which
are simple and well protected, maintenance costs should be low.
3.3 Pressure-Sensor Based Tire Pressure Monitoring System Specifications
3.3.1 Cost
All six of the manufacturers of the PSB systems evaluated reported to have plans to produce their
systems as original equipment on model year 2004 and later vehicles. Four of the six systems were
1 Standard equipment on 11 GM models and an option on 1 Ford model
24

tested in aftermarket system configurations due to a lack of original equipment systems on the 2001
vehicles. Systems G, H, and I were intended as add-on displays until vehicle manufacturers adopt
the tire monitoring systems as original equipment. System E is a good example of a pressure-sensor
based system integrated into a vehicle as original equipment. This version was, however, the basic
economy system and did not demonstrate the full functionality offered on other higher end models of
this system. System F was a very early prototype and used a laptop computer to simulate the
display. This system was primarily intended to be an integrated original equipment system.
Within the next few years, the PSB systems are expected to retain essentially the same tire pressure
sensors but eliminate the add-on displays. The aftermarket receiver/display unit will be integrated
into existing vehicle systems, lessening costs. The receiver portion of the display can be integrated
into the vehicle’s electronic control unit and perhaps interface though an existing key-less entry
system. The display portion may be a simple telltale light on the instrument cluster or status
messages on the driver information display.
Some manufacturers were able to estimate their original equipment cost per system (O.E. price) for
large-scale production volumes. The aftermarket configurations have higher per unit costs due to the
additional cost of an application specific receiver/display unit and the low production volumes.
Table 3.2 – Estimated Original Equipment and Aftermarket System Costs for PSB Systems
System: F G H I J
O.E.M. Price per System: $50 No estimate No estimate $50 No estimate $60
Aftermarket Price per System:
n/a n/a $249 $245 to 295 $200 Basic $150 Full $250
E
Most manufacturers estimated the cost of integrated PSB TPMS to be under $75 per vehicle for
large supply volumes. The battery life of the current PSB sensors is about 7 to 10 years.
Replacement costs for the tire sensors should be around $10 to $20.
25
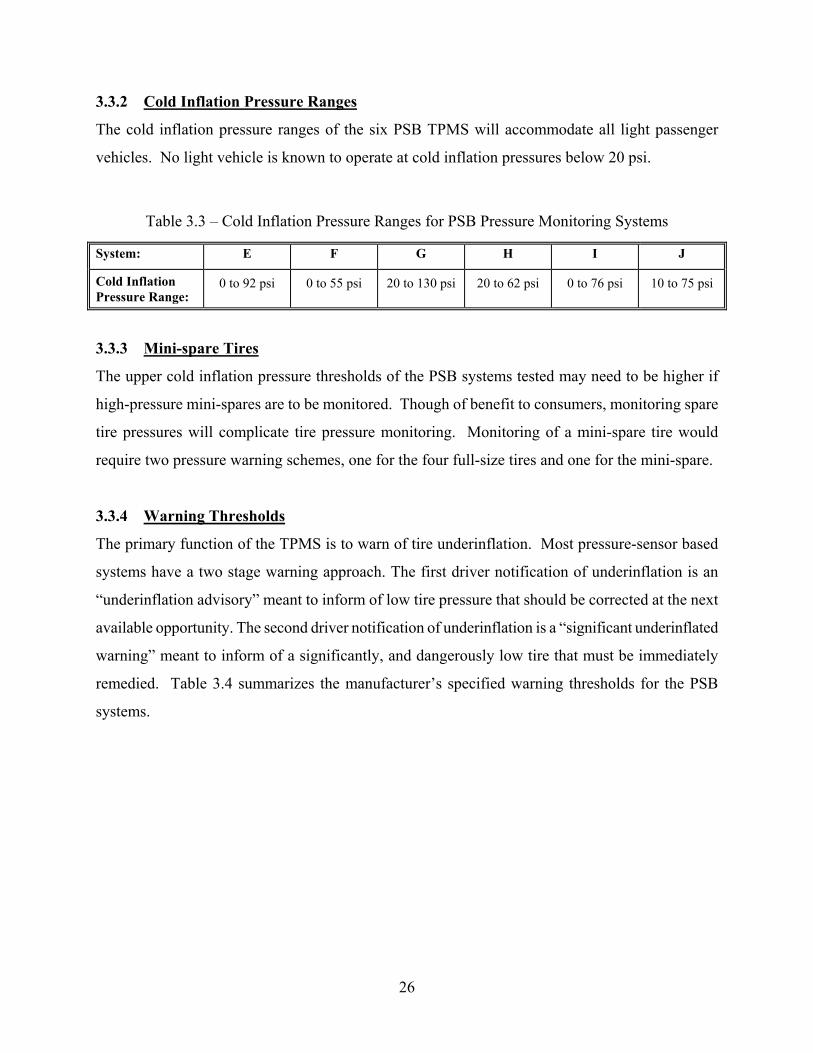
3.3.2 Cold Inflation Pressure Ranges
The cold inflation pressure ranges of the six PSB TPMS will accommodate all light passenger
vehicles. No light vehicle is known to operate at cold inflation pressures below 20 psi.
Table 3.3 – Cold Inflation Pressure Ranges for PSB Pressure Monitoring Systems
System: F G H I J
Cold Inflation Pressure Range:
0 to 92 psi 0 to 55 psi 20 to 130 psi 20 to 62 psi 0 to 76 psi 10 to 75 psi
E
3.3.3 Mini-spare Tires
The upper cold inflation pressure thresholds of the PSB systems tested may need to be higher if
high-pressure mini-spares are to be monitored. Though of benefit to consumers, monitoring spare
tire pressures will complicate tire pressure monitoring. Monitoring of a mini-spare tire would
require two pressure warning schemes, one for the four full-size tires and one for the mini-spare.
3.3.4 Warning Thresholds
The primary function of the TPMS is to warn of tire underinflation. Most pressure-sensor based
systems have a two stage warning approach. The first driver notification of underinflation is an
“underinflation advisory” meant to inform of low tire pressure that should be corrected at the next
available opportunity. The second driver notification of underinflation is a “significant underinflated
warning” meant to inform of a significantly, and dangerously low tire that must be immediately
remedied. Table 3.4 summarizes the manufacturer’s specified warning thresholds for the PSB
systems.
26
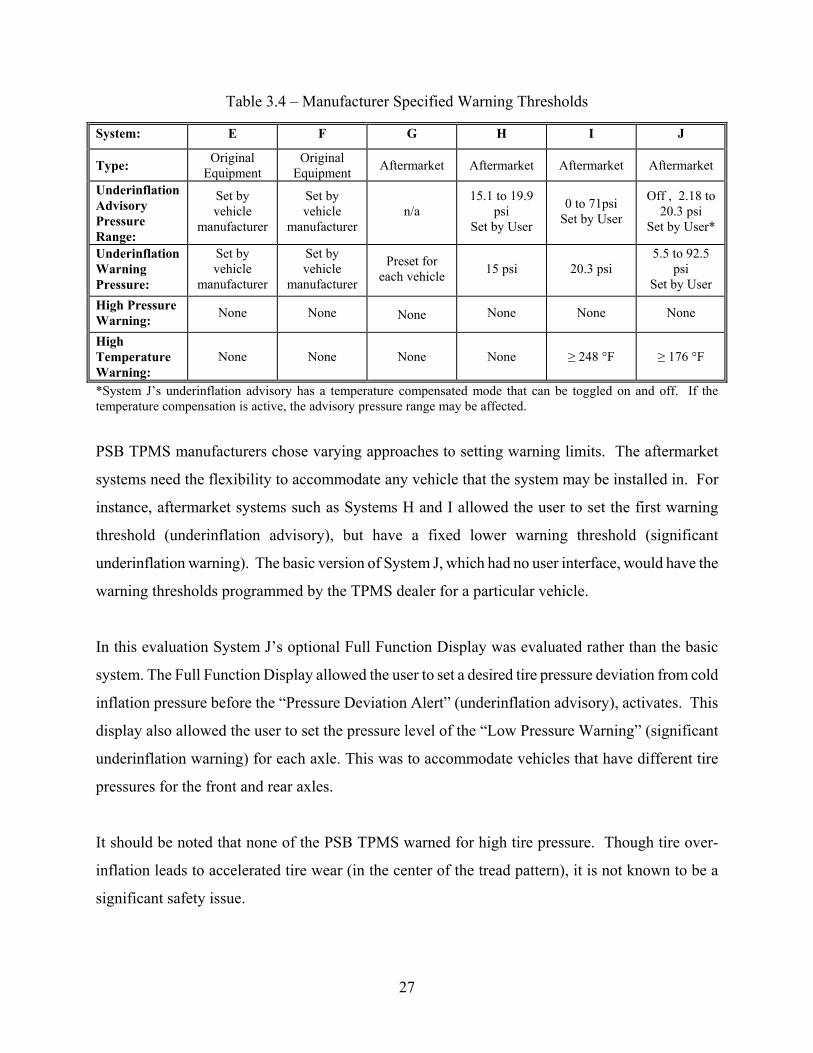
Table 3.4 – Manufacturer Specified Warning Thresholds
System: F G H I J
Type: Original Equipment
Original Equipment Aftermarket arket arket Aftermarket
Underinflation Advisory Pressure Range:
Set by vehicle
manufacturer
Set by vehicle
manufacturer n/a
15.1 to 19.9 psi
Set by User
0 to 71psi Set by User
Off , 20.3 psi
Set by User*
Underinflation Warning Pressure:
Set by vehicle
manufacturer
Set by vehicle
manufacturer
Preset for each vehicle 15 psi 20.3 psi
5.5 to 92.5 psi
Set by User High Pressure Warning: None None None None
High Temperature Warning:
None None ≥ 248 °F ≥ 176 °F
E
Afterm Afterm
2.18 to
None None
None None
*System J’s underinflation advisory has a temperature compensated mode that can be toggled on and off. If the temperature compensation is active, the advisory pressure range may be affected.
PSB TPMS manufacturers chose varying approaches to setting warning limits. The aftermarket
systems need the flexibility to accommodate any vehicle that the system may be installed in. For
instance, aftermarket systems such as Systems H and I allowed the user to set the first warning
threshold (underinflation advisory), but have a fixed lower warning threshold (significant
underinflation warning). The basic version of System J, which had no user interface, would have the
warning thresholds programmed by the TPMS dealer for a particular vehicle.
In this evaluation System J’s optional Full Function Display was evaluated rather than the basic
system. The Full Function Display allowed the user to set a desired tire pressure deviation from cold
inflation pressure before the “Pressure Deviation Alert” (underinflation advisory), activates. This
display also allowed the user to set the pressure level of the “Low Pressure Warning” (significant
underinflation warning) for each axle. This was to accommodate vehicles that have different tire
pressures for the front and rear axles.
It should be noted that none of the PSB TPMS warned for high tire pressure. Though tire over-
inflation leads to accelerated tire wear (in the center of the tread pattern), it is not known to be a
significant safety issue.
27
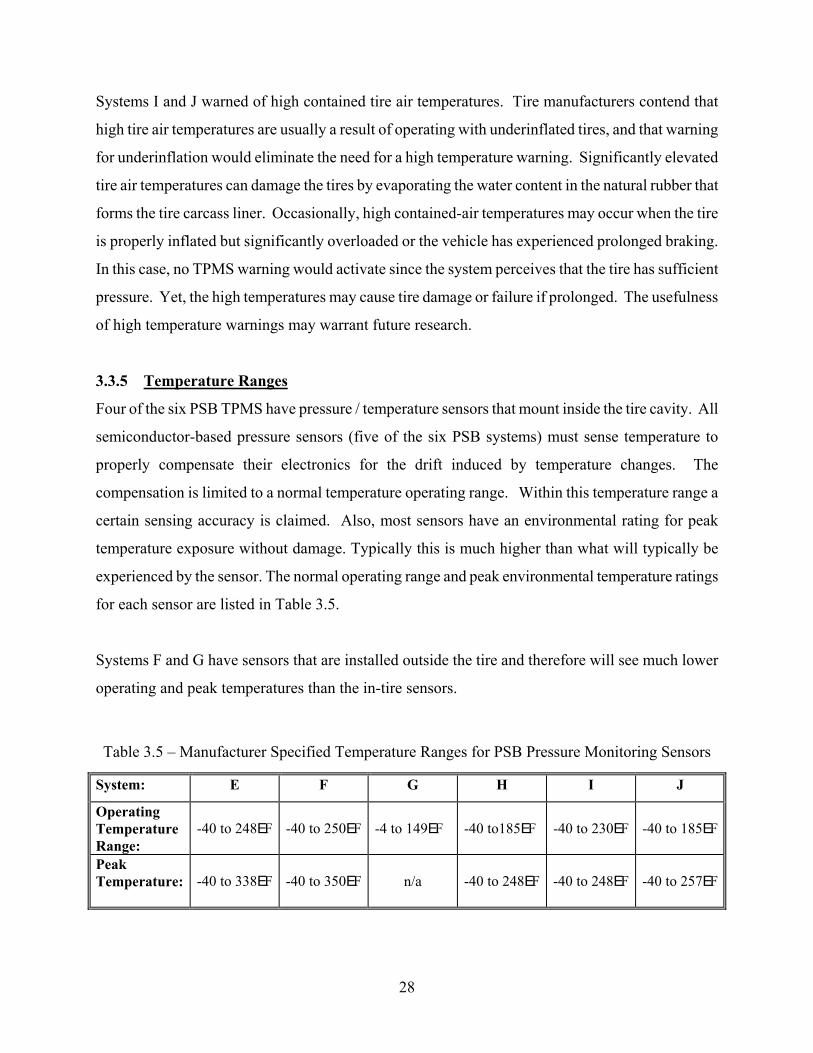
Systems I and J warned of high contained tire air temperatures. Tire manufacturers contend that
high tire air temperatures are usually a result of operating with underinflated tires, and that warning
for underinflation would eliminate the need for a high temperature warning. Significantly elevated
tire air temperatures can damage the tires by evaporating the water content in the natural rubber that
forms the tire carcass liner. Occasionally, high contained-air temperatures may occur when the tire
is properly inflated but significantly overloaded or the vehicle has experienced prolonged braking.
In this case, no TPMS warning would activate since the system perceives that the tire has sufficient
pressure. Yet, the high temperatures may cause tire damage or failure if prolonged. The usefulness
of high temperature warnings may warrant future research.
3.3.5 Temperature Ranges
Four of the six PSB TPMS have pressure / temperature sensors that mount inside the tire cavity. All
semiconductor-based pressure sensors (five of the six PSB systems) must sense temperature to
properly compensate their electronics for the drift induced by temperature changes. The
compensation is limited to a normal temperature operating range. Within this temperature range a
certain sensing accuracy is claimed. Also, most sensors have an environmental rating for peak
temperature exposure without damage. Typically this is much higher than what will typically be
experienced by the sensor. The normal operating range and peak environmental temperature ratings
for each sensor are listed in Table 3.5.
Systems F and G have sensors that are installed outside the tire and therefore will see much lower
operating and peak temperatures than the in-tire sensors.
Table 3.5 – Manufacturer Specified Temperature Ranges for PSB Pressure Monitoring Sensors
System: F G H I J
Operating Temperature Range:
-40 to 248EF -40 to 250EF -4 to 149EF to185EF -40 to 230EF -40 to 185EF
Peak Temperature: -40 to 338EF -40 to 350EF n/a -40 to 248EF -40 to 248EF -40 to 257EF
E
-40
28
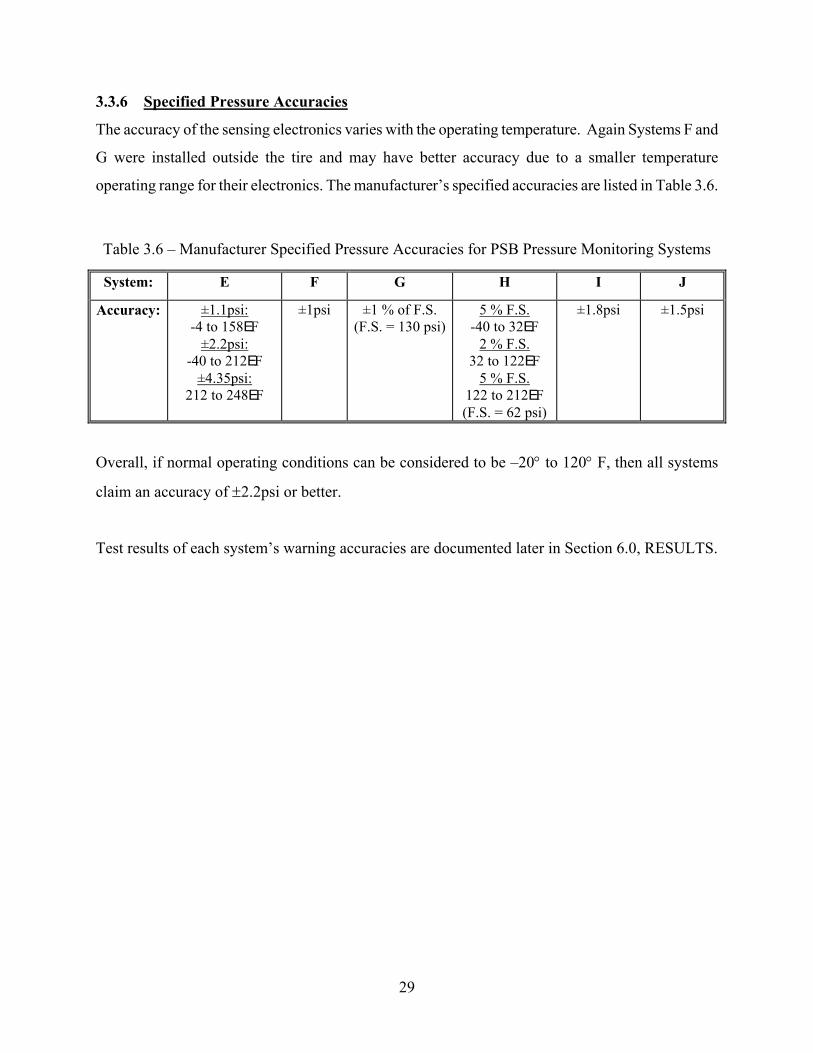
3.3.6 Specified Pressure Accuracies
The accuracy of the sensing electronics varies with the operating temperature. Again Systems F and
G were installed outside the tire and may have better accuracy due to a smaller temperature
operating range for their electronics. The manufacturer’s specified accuracies are listed in Table 3.6.
Table 3.6 – Manufacturer Specified Pressure Accuracies for PSB Pressure Monitoring Systems
System: E F G H I J
Accuracy: ±1.1psi: -4 to 158EF
±2.2psi: -40 to 212EF
±4.35psi: 212 to 248EF
±1psi ±1 % of F.S. (F.S. = 130 psi)
5 % F.S. -40 to 32EF
2 % F.S. 32 to 122EF
5 % F.S. 122 to 212EF (F.S. = 62 psi)
±1.8psi ±1.5psi
Overall, if normal operating conditions can be considered to be –20° to 120° F, then all systems
claim an accuracy of ±2.2psi or better.
Test results of each system’s warning accuracies are documented later in Section 6.0, RESULTS.
29
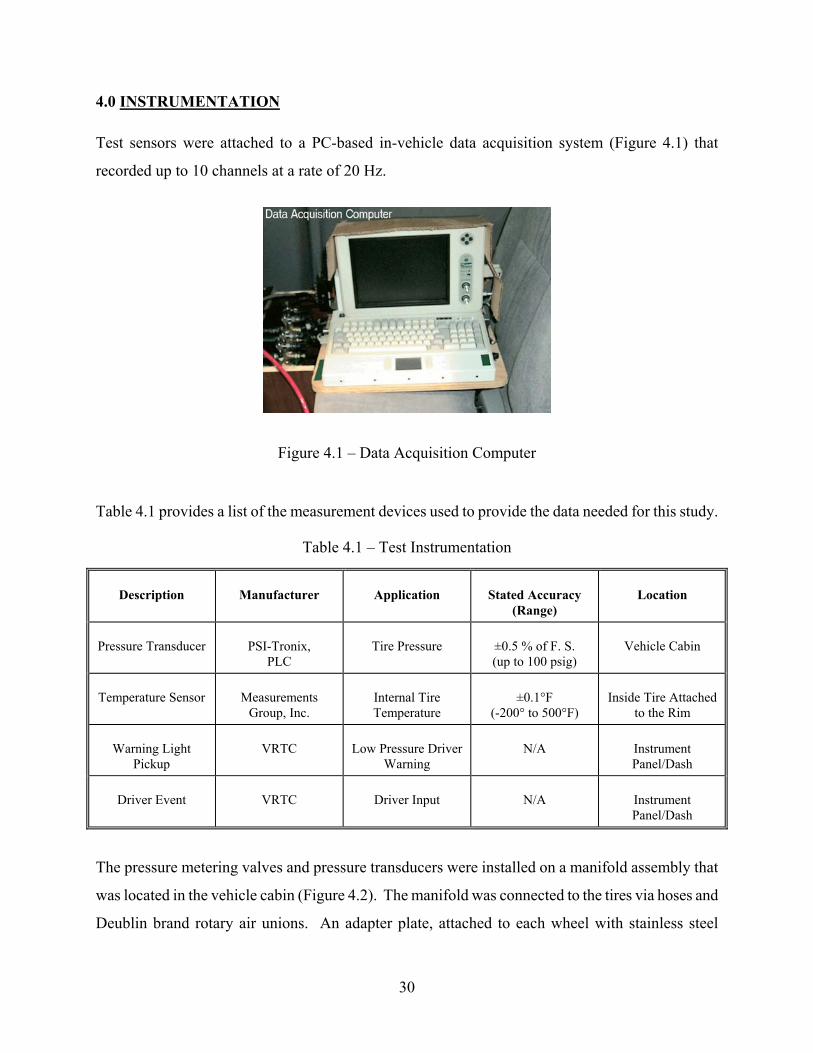
4.0 INSTRUMENTATION
Test sensors were attached to a PC-based in-vehicle data acquisition system (Figure 4.1) that
recorded up to 10 channels at a rate of 20 Hz.
Figure 4.1 – Data Acquisition Computer
Table 4.1 provides a list of the measurement devices used to provide the data needed for this study.
Table 4.1 – Test Instrumentation
Description Manufacturer Application Stated Accuracy (Range)
Location
Pressure Transducer PSI-Tronix, PLC
Tire Pressure ±0.5 % of F. S. (up to 100 psig)
Vehicle Cabin
Temperature Sensor Measurements Group, Inc.
Internal Tire Temperature
±0.1°F (-200° to 500°F)
Inside Tire Attached to the Rim
Warning Light Pickup
VRTC Low Pressure Driver Warning
N/A Instrument Panel/Dash
Driver Event VRTC Driver Input N/A Instrument Panel/Dash
The pressure metering valves and pressure transducers were installed on a manifold assembly that
was located in the vehicle cabin (Figure 4.2). The manifold was connected to the tires via hoses and
Deublin brand rotary air unions. An adapter plate, attached to each wheel with stainless steel
30
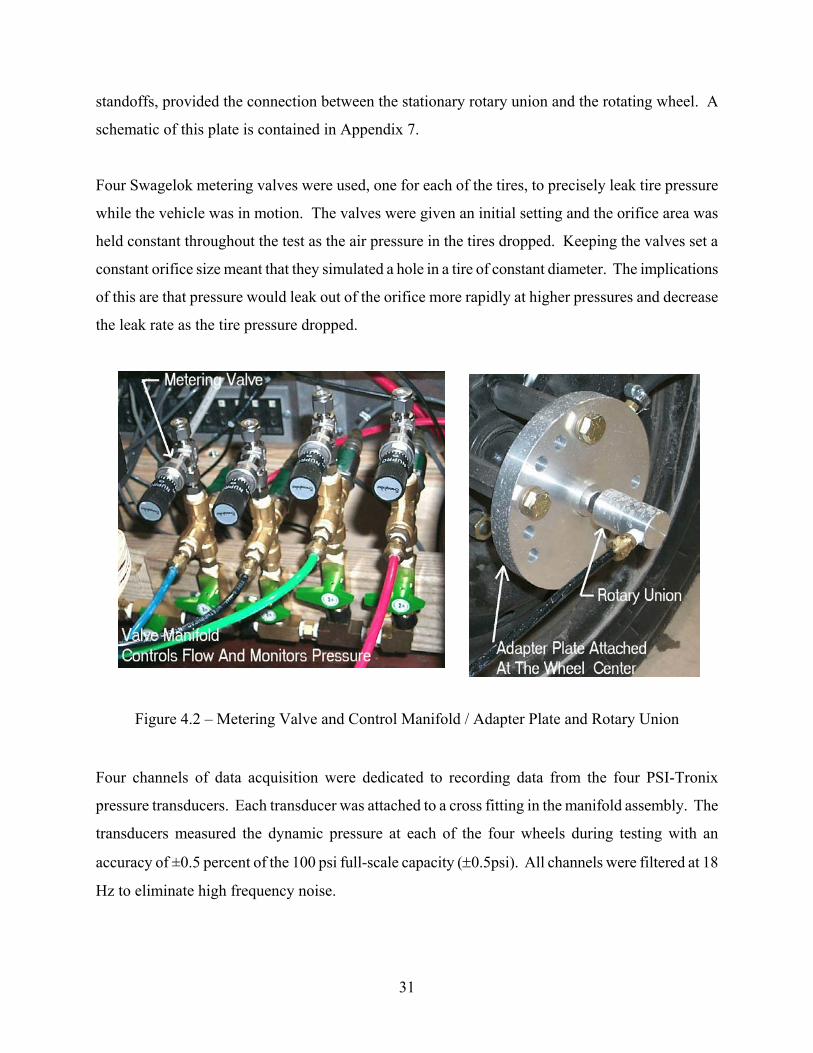
standoffs, provided the connection between the stationary rotary union and the rotating wheel. A
schematic of this plate is contained in Appendix 7.
Four Swagelok metering valves were used, one for each of the tires, to precisely leak tire pressure
while the vehicle was in motion. The valves were given an initial setting and the orifice area was
held constant throughout the test as the air pressure in the tires dropped. Keeping the valves set a
constant orifice size meant that they simulated a hole in a tire of constant diameter. The implications
of this are that pressure would leak out of the orifice more rapidly at higher pressures and decrease
the leak rate as the tire pressure dropped.
Figure 4.2 – Metering Valve and Control Manifold / Adapter Plate and Rotary Union
Four channels of data acquisition were dedicated to recording data from the four PSI-Tronix
pressure transducers. Each transducer was attached to a cross fitting in the manifold assembly. The
transducers measured the dynamic pressure at each of the four wheels during testing with an
accuracy of ±0.5 percent of the 100 psi full-scale capacity (±0.5psi). All channels were filtered at 18
Hz to eliminate high frequency noise.
31
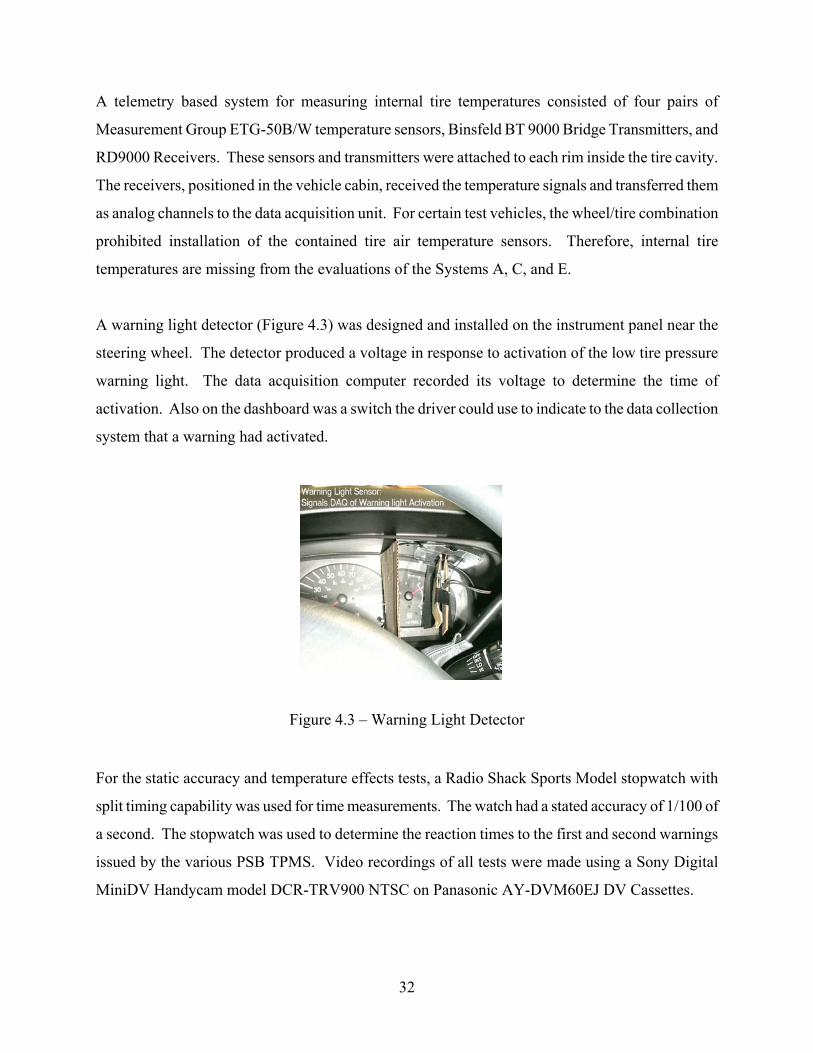
A telemetry based system for measuring internal tire temperatures consisted of four pairs of
Measurement Group ETG-50B/W temperature sensors, Binsfeld BT 9000 Bridge Transmitters, and
RD9000 Receivers. These sensors and transmitters were attached to each rim inside the tire cavity.
The receivers, positioned in the vehicle cabin, received the temperature signals and transferred them
as analog channels to the data acquisition unit. For certain test vehicles, the wheel/tire combination
prohibited installation of the contained tire air temperature sensors. Therefore, internal tire
temperatures are missing from the evaluations of the Systems A, C, and E.
A warning light detector (Figure 4.3) was designed and installed on the instrument panel near the
steering wheel. The detector produced a voltage in response to activation of the low tire pressure
warning light. The data acquisition computer recorded its voltage to determine the time of
activation. Also on the dashboard was a switch the driver could use to indicate to the data collection
system that a warning had activated.
Figure 4.3 – Warning Light Detector
For the static accuracy and temperature effects tests, a Radio Shack Sports Model stopwatch with
split timing capability was used for time measurements. The watch had a stated accuracy of 1/100 of
a second. The stopwatch was used to determine the reaction times to the first and second warnings
issued by the various PSB TPMS. Video recordings of all tests were made using a Sony Digital
MiniDV Handycam model DCR-TRV900 NTSC on Panasonic AY-DVM60EJ DV Cassettes.
32
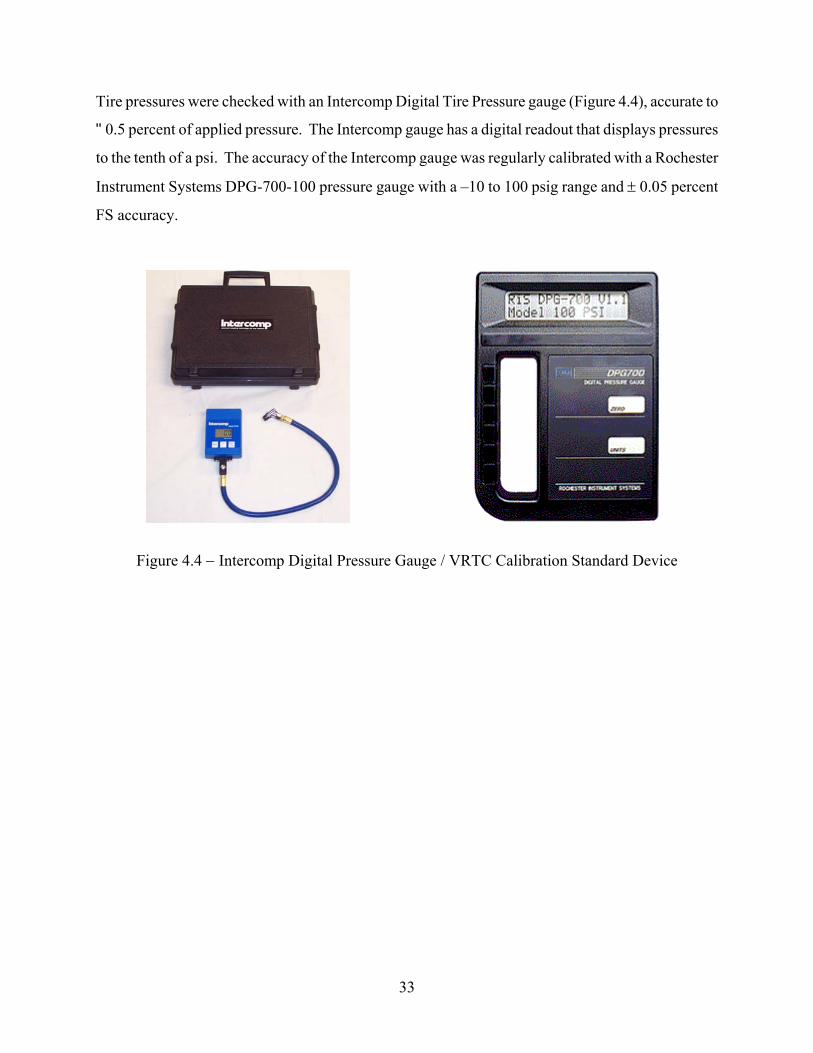
Tire pressures were checked with an Intercomp Digital Tire Pressure gauge (Figure 4.4), accurate to
"0.5 percent of applied pressure. The Intercomp gauge has a digital readout that displays pressures
to the tenth of a psi. The accuracy of the Intercomp gauge was regularly calibrated with a Rochester
Instrument Systems DPG-700-100 pressure gauge with a –10 to 100 psig range and ± 0.05 percent
FS accuracy.
Figure 4.4 − Intercomp Digital Pressure Gauge / VRTC Calibration Standard Device
33
5.0 METHOD
Since the wheel-speed based and pressure-sensor based systems differed significantly in function,
purpose, and capabilities, they required different types of evaluation procedures. The WSB systems
use the antilock brake system’s (ABS) wheel speed sensors to monitor individual wheel speeds
while the vehicle is in motion. If the ABS ECU (Electronic Control Unit) detects a tire rotating
faster relative to the other tires, that tire is thought to have a smaller rolling radius and therefore less
inflation pressure. This means that the system relies on the calculated rolling radii (or
circumference) of the tires to serve as a measure of inflation pressure. Evaluations of the WSB
systems must therefore be performed with the tire rolling freely across a surface.
Another testing concern with WSB systems is that they may not function if the tires are rolling on
loose, slippery, or uneven surfaces. Nor will they function properly if driven aggressively (inducing
wheel slip). Therefore, the WSB systems were evaluated on smooth dry surfaces and driven at
moderate speeds on the winding courses. (Limited WSB system testing was performed on loose,
uneven, surfaces.) These concerns do not apply to PSB systems.
The PSB systems directly sense the tire air pressure and temperature at each tire. In theory, the PSB
systems can function continuously, whether the vehicle is in motion or at rest. Though surface
conditions do not impair sensing capabilities, the update rate of the PSB sensors is limited by FCC
regulations and battery life concerns. Since the usual battery life conservation algorithms use wheel
motion to activate and maintain sensors transmissions, evaluations of the PSB systems needed to
take place with the tires in motion or being recently in motion. Therefore, the systems could be
tested on a lift or jack stands as long as the tires were kept in motion (except for System E, which
could not be tested off the ground due to activation of the electronic suspension’s fault codes). For
safety reasons, wheels speeds never exceeded 35 mph (56 km/h) when the wheels were off the
34
ground.2 As an additional safety precaution, any tire used in a low pressure TPMS test was rendered
unusable when testing was completed.
The following test procedures were developed to verify the operation and accuracy of the available
TPMS. These procedures were designed to determine at what point the systems alerted the driver to
low pressure and if there were any conditions that prevented the systems from recognizing a low-
pressure situation. These tests are not meant to represent a head-to-head comparison between
different brands of the systems.
The following sections present a summary of the procedures used for both WSB and PSB TPMS.
The detailed procedures can be found in Appendix 3.
5.1 Test Nomenclature
Table 5.1 shows the acronyms that are used in the following test matrices and in subsequent sections
of this report. All driving courses used for testing were on the grounds of the Transportation
Research Center (TRC) Inc. Appendix 5 contains maps of the High Speed Test Track and Winding
Road Course.
Table 5.1 – Acronyms Used in Test Matrices and Subsequent Report Sections
Abbreviation Explanation Description
GAWR Gross Axle Weight Rating Door placard, GAWR
GVWR Gross Vehicle Weight Rating Door placard, GVWR
HSTT High Speed Test Track 7.5 mile oval test track
LLVW Lightly Loaded Vehicle Weight Curb weight + 500lb
WGDC Winding Gravel Durability Course 2.5 mile gravel road
WRC Winding Road Course 1.5 miles of turns and straightaways
2 This is based on a Dunlop Tire Safety Warning: The centrifugal forces generated by a free spinning tire/wheel assembly may cause sudden tire explosion resulting in vehicle damage and/or serious personal injury to you or a bystander. Never exceed 35 mph indicated on your speedometer. Never stand near or behind a tire spinning at high speed, as for example, while attempting to push a vehicle that is stuck or when an on-the-car spin balance machine is in use. Obtained from: http://www.dunloptire.com/tiretech/tirecare.html
35

5.2 Wheel-Speed Based TPMS
Since the WSB systems use wheel speeds to calculate the rolling radius of the tire, it was crucial that
the tires had uniform tread wear, that the vehicle was properly loaded, and the tire pressures were set
at the recommended placard cold inflation pressure while cold. Before testing, each WSB TPMS
was reset and calibrated for each vehicle according to the manufacturer’s recommended method (see
the end of Appendix 4 – Calibration). The calibration procedure allowed the TPMS to learn the
rotation properties of each tire and form a baseline expectation of the tires’ rolling radii under
different conditions. Since the dynamic rolling radius of a tire changes significantly with speed, the
systems must be calibrated in multiple speed ranges. If a vehicle manufacturer recommends an
increase in inflation pressure to accommodate a higher load, WSB systems require recalibration. For
example, if a vehicle was to be tested at the gross vehicle weight rating at a specific tire pressure, it
was also calibrated in that state.
System A, which was original equipment on a vehicle with an advanced variable differential, needed
to be calibrated in multiple speed and engine torque ranges due to the differential’s effect on driven
wheel speeds. Therefore, multiple engine torque ranges were used during the hour of driving on the
Winding Road Course.
5.2.1 WSB TPMS Calibration
During the calibration process, the WSB systems have little or no tire pressure sensing capabilities.
To avoid extended periods without warnings when the TPMS is reset, the systems can be fully
calibrated for discrete speed ranges. For example, the TPMS calibration of System B requires
“about 10 minutes of straight line driving” in each of the following three speed ranges: 15 to 40
mph, 40 to 70 mph, and 70 to 90 mph [6]. Again, none of the four systems tested inform the driver
of the status of the TPMS calibration. The driver is essentially unaware of the transition from a state
without tire pressure monitoring during the calibration period to a partial or fully monitored state.
Since proper system calibration was so critical to the performance of each WSB system, the advised
calibration times and speeds were met or exceeded for each of the test vehicles. A complete
recalibration of the system was completed between test procedures that tested system accuracy or for
tests at different vehicle loading.
36
Occasionally, instructions for the calibration of the TPMS in the owner’s manuals were vague
regarding the time necessary for calibration to be completed. For instance, the System D’s owner’s
manual stated: “The initial adjustment (TPMS calibration) is completed after driving at the speeds of
30km/h (19mph) or over for about total 8 hours (sic), when the tire pressure warning system detects
the normal tire pressures.” [8]
An initial attempt to calibrate System D failed. In the first calibration attempt the vehicle was driven
on the 7.5 mile High Speed Test Track (HSTT) for over 8 hours at three different speeds (30, 55, 75
mph equally). On the first day of testing, the system did not warn of the front right tire being
severely underinflated (< 14 psi) and was deemed as not fully calibrated. Consultations with ABS
and vehicle manufacturers led to the discovery that the two gradual right-hand turns on the high
speed oval may not be sufficient to let the TPMS see differential wheel speeds when cornering. A
new calibration course consisting of a winding course and high-speed figure eights was designed.
When the new calibration course was run in multiple speed ranges, System D did achieve
calibration. Details of the new calibration procedure can be seen in Appendix 1: Revised System D
Calibration Procedures.
5.2.2 WSB TPMS Test Matrix
The following test matrix was used to evaluate the performance of the wheel-speed based systems.
37
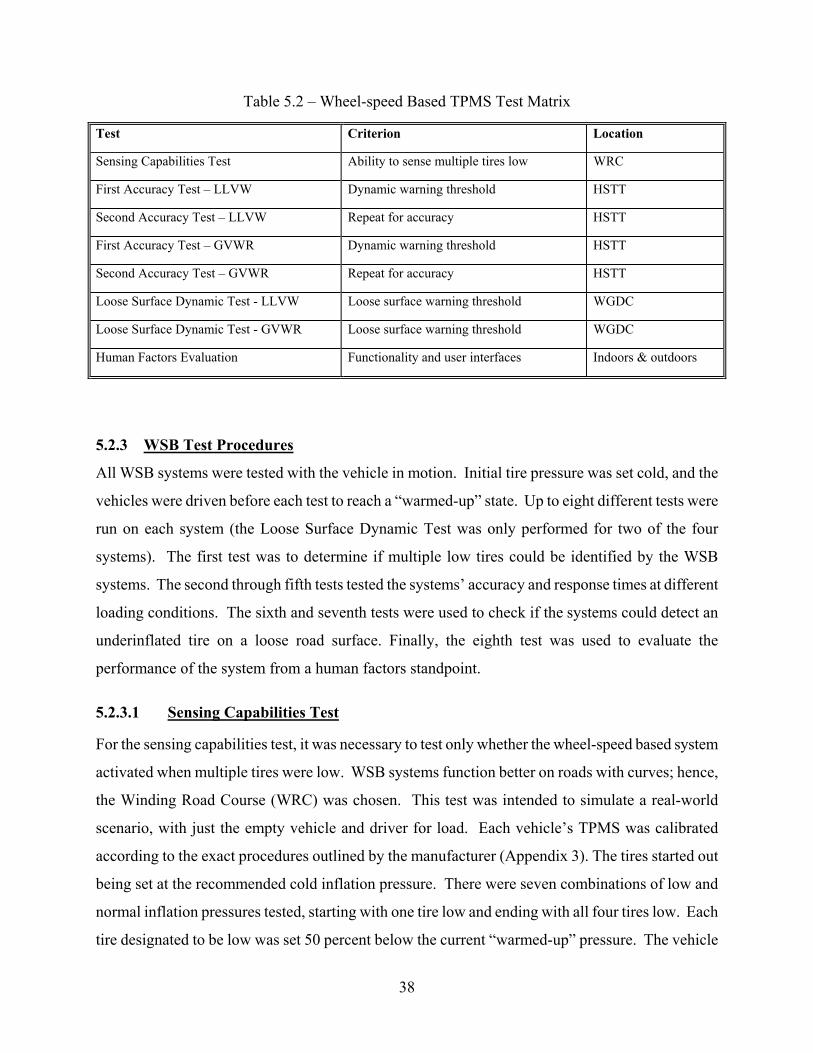
Table 5.2 – Wheel-speed Based TPMS Test Matrix
Test Location
Sensing Capabilities Test Ability to sense multiple tires low WRC
First Accuracy Test – LLVW Dynamic warning threshold HSTT
Second Accuracy Test – LLVW Repeat for accuracy HSTT
First Accuracy Test – GVWR Dynamic warning threshold HSTT
Second Accuracy Test – GVWR Repeat for accuracy HSTT
Loose Surface Dynamic Test - LLVW Loose surface warning threshold WGDC
Loose Surface Dynamic Test - GVWR Loose surface warning threshold WGDC
Human Factors Evaluation Functionality and user interfaces Indoors & outdoors
Criterion
5.2.3 WSB Test Procedures
All WSB systems were tested with the vehicle in motion. Initial tire pressure was set cold, and the
vehicles were driven before each test to reach a “warmed-up” state. Up to eight different tests were
run on each system (the Loose Surface Dynamic Test was only performed for two of the four
systems). The first test was to determine if multiple low tires could be identified by the WSB
systems. The second through fifth tests tested the systems’ accuracy and response times at different
loading conditions. The sixth and seventh tests were used to check if the systems could detect an
underinflated tire on a loose road surface. Finally, the eighth test was used to evaluate the
performance of the system from a human factors standpoint.
5.2.3.1 Sensing Capabilities Test
For the sensing capabilities test, it was necessary to test only whether the wheel-speed based system
activated when multiple tires were low. WSB systems function better on roads with curves; hence,
the Winding Road Course (WRC) was chosen. This test was intended to simulate a real-world
scenario, with just the empty vehicle and driver for load. Each vehicle’s TPMS was calibrated
according to the exact procedures outlined by the manufacturer (Appendix 3). The tires started out
being set at the recommended cold inflation pressure. There were seven combinations of low and
normal inflation pressures tested, starting with one tire low and ending with all four tires low. Each
tire designated to be low was set 50 percent below the current “warmed-up” pressure. The vehicle
38
was driven more than 10 miles on the WRC to allow the system sufficient time to alert of the
underinflated tire or tires. At the end of the test, each vehicle had different procedures to follow to
reset the system after the tire was refilled to proper inflation pressure (Appendix 3).
5.2.3.2 First Accuracy Test − LLVW
The first accuracy test was used to determine at exactly what pressure the system activated (a good
indicator of WSB system resolution). The vehicle was run in a lightly loaded condition (LLVW),
which was vehicle curb weight plus up to five hundred pounds. While driving, air was slowly
leaked out of the right front tire. The pressure at which the system warned of a low-pressure
condition was noted. The tire was then refilled, the system reset, and the vehicle driven to determine
when the system recognized that a normal condition had returned. After the tires were allowed to
cool, the test was repeated using the left rear tire.
5.2.3.3 Second Accuracy Test – LLVW
The second accuracy test was a repeat of the first. The test was used to check the consistency of the
threshold for the low tire pressure warning. A complete recalibration of the TPMS was done prior to
conducting this test.
5.2.3.4 First and Second Accuracy Tests – GVWR
Additional accuracy tests were conducted using the same procedures described above, but with the
vehicle loaded up to its gross vehicle weight rating (GVWR). Care was taken not to exceed the
gross axle weight rating (GAWR) of either axle. A complete recalibration of the TPMS was done
between the first and second tests.
5.2.3.5 Loose Surface Dynamic Test – LLVW
Wheel-speed based systems have trouble detecting low tire pressure on loose surfaces since they rely
on wheel speed measurements. On loose surfaces, the wheels constantly change rotational speed
due to varying levels of slip and non-uniform contact with the surface. To test the loose surface
capabilities of the system, the vehicle was loaded to LLVW and the first and second accuracy tests
were run on TRC’s gravel road.
39

5.2.3.6 Loose Surface Dynamic Test – GVWR
As a continuation of the above test, the vehicle’s load was changed from LLVW to GVWR and one
accuracy test was performed on TRC’s gravel road.
5.2.3.7 Human Factors Evaluation
A comprehensive human factors evaluation of each user interface was completed. The warning
method was noted as an audible or visual signal, or both. For those systems that displayed a
message, the context of the message was evaluated and message timing was noted. System failure
messages were examined. The method of resetting the system was also assessed.
5.3 Pressure-Sensor Based TPMS
The PSB systems tested consisted of two original equipment (OE) and four aftermarket systems.
The OE systems were configured at the factory and are fully functional upon delivery. These
systems only require a change in settings if the tires, tire locations, or cold inflation pressures are
changed. The aftermarket systems require about 1 to 3 hours of installation and configuration
depending on the system. The installation of the aftermarket systems is generally straightforward.
It consisted of installing a sensor in each rim, installing a receiver/display in the vehicle cabin, and if
needed, installing antennas in the wheel well. The configuration consists of training the receiver to
sensor locations and placard cold tire inflation pressures. Training the sensors to each tire location
on the receiver was a critical part of the system setup, but as was discovered, very prone to user
error.
5.3.1 PSB TPMS Sensor Training Methods
All of the aftermarket systems tested needed to have the specific tire sensor identification signal
associated with a tire location at installation and after tire rotation. The OE systems that do not have
antennas at each wheel well also need to be trained to the new location if the tires are rotated. To do
this, the receiver is set to the learn mode and the sensor listed on the display is activated individually
of the other sensors. Once a sensor location is learned, the person training the receiver moves on to
do the other three sensor locations in an order dictated by the receiver display. This training process
can be prone to user error, though the user will be alerted by the display that signals from a sensor(s)
are not being received or if two are trained to the same location.
40
5.3.2 PSB Pressure TPMS Test Matrix
Table 5.3 contains the test matrix used to evaluate pressure-sensor based systems.
Table 5.3 – PSB Pressure TPMS Test Matrix
Test Criterion Location
First Warm Static Accuracy Test Isothermal accuracy Indoors on lift
Cold Static Accuracy Test Temperature deviation effects VRTC Parking Lot – Winter
Second Warm Static Accuracy Test Repeat of isothermal accuracy Indoors on lift
Dynamic Warning Thresholds Test - GVWR Dynamic warning thresholds HSTT
Loaded Dynamic High Speed Test - GVWR High speed effects HSTT
Human Factors Evaluation Functionality and user interfaces Indoors & outdoors
System Failure Effects Test Sensor failure notification HSTT
5.3.3 PSB Test Procedures
Each tire on a PSB pressure monitoring system has a pressure sensor located in it that is switched on
by the rotational motion of that tire. Therefore, it is possible to test these systems as long as the
wheels are in motion. Since multi-season testing was not possible, the PSB systems were tested in a
heated laboratory, with the vehicle on a lift, and outside in winter weather, with the vehicle on jack
stands. The systems’ accuracy, temperature effects, and human factors tests were done with the
vehicle elevated and the transmission in drive (except for System E). However, the dynamic
warning thresholds were determined with the vehicles being driven on the test track (all systems).
The effect of high-speed driving on the systems was also examined.
5.3.3.1 First Warm Static Accuracy Test
This procedure tested the accuracy and response time of the PSB pressure measurement system. The
vehicle was tested indoors at 65 to 70°F. All the tires were filled cold to the placard pressure. The
tires were spun at a speed equivalent to 20 mph for a minimum of 20 minutes to “wakeup” the
sensors and give them two sensing cycles prior to the accuracy test. The wheels were then spun for
10 minutes at each pressure level to allow the system to update current tire status at least once. The
right front tire pressure was reduced in steps of 2 psi until a warning was produced or the tire was
flat. If the system has two levels of warning, the pressure continued to be decreased until the second
41
warning was given (or the tire was flat). The right front tire was refilled and the procedure repeated
for the left rear tire.
After completion of the above procedures, a rapid tire deflation test was performed. This test
measured the response time of the first and second warnings to a tire puncture. This test was first
performed on the left front tire and then repeated using the right rear.
5.3.3.2 Cold Static Accuracy Test
This test evaluated the effects of temperature changes on PSB system performance. It simulated the
changes in temperature as the seasons of the year change. A main concern was the influence of
temperature compensation on warning thresholds levels.
Tire pressures were set according to the placard inside the laboratory (around 72°F). Then the
vehicle was moved outside in the cold for overnight storage. The next day, the tire pressures were
recorded, but not adjusted. The tests described in the First Static Accuracy Test Section were then
performed.
5.3.3.3 Second Warm Static Accuracy Test
This test was a repeat of the first static test and was used to evaluate the repeatability of the warning
thresholds. This test was performed indoors, with the vehicle on a lift and the tires rotating.
5.3.3.4 Dynamic Warning Thresholds Test – GVWR
Dynamic Warning Thresholds tests evaluated the on-road response of the PSB systems to a slow
leak and also a medium-sized tire puncture. The vehicle was initially loaded to its GVWR, being
careful not to exceed the GAWR of either axle. The vehicle was driven at 60 mph and air was slowly
released from the right front tire. The release of air stopped when the TPMS warning activated (first
warning level) or the tire pressure reached 14 psi. The right front and left rear tires were tested at
both leak rates.
In addition, while tire was at the warning threshold pressure, brake snubs were completed to heat the
tires and raised pressure back above the threshold. If the warning shut off at a tire pressure
marginally above the threshold, it was an indication that warnings would flicker on and off.
42
5.3.3.5 Loaded Dynamic High Speed Test – GVWR
Loaded dynamic high-speed tests were conducted at gross vehicle weight ratings to explore the
effects of high vehicle speeds on the TPMS threshold. High speed heats the tires, raises the pressure
inside, and may extinguish the low tire pressure warning. This test was similar to the previous test
except that high speed was substituted for the brake snubs to heat the tires.
The loading condition was maintained from the previous test. The left rear tire was deflated to a
pressure 2 psi below the average pressure that caused a warning in the indoor static tests. The
vehicle was driven at 20 mph until the system detected low tire pressure. If low tire pressure was
not detected, the pressure was lowered by 2 psi until a warning was given or the pressure reached 14
psi. The vehicle was then driven at 75 mph for 22.5 miles (3 laps) and the state of the warning
system was noted.
5.3.3.6 Human Factors Evaluation
A comprehensive human factors evaluation of each user interface was completed. The warning
method was noted as an audible or visual signal, or both. For those systems that displayed a
message, the context of the message was evaluated and the message timing was noted. System
failure messages were also examined.
5.3.3.7 System Failure Effects Test
Since consumers may tend to rely on this monitoring system as a warning system, the driver must be
alerted to a system failure. Of particular importance for PSB systems is a warning of individual tire
sensor failure(s). Therefore, one sensor was either disabled or removed and the vehicle was driven
until a system failure warning was detected or 30 minutes had elapsed. The response of the system
was recorded.
43

6.0 RESULTS
6.1 Wheel-Speed Based TPMS
Four wheel-speed based tire pressure monitoring systems were evaluated. The tests performed
focused on sensing capabilities, warning thresholds, accuracy, and driver interfaces. The results
from the evaluation should be considered on a per vehicle basis rather than for a specific
ABS/TPMS manufacturer. This is due to the fact that the vehicle manufacturer will often co
develop the TPMS sensing algorithms with the ABS manufacturer and has control over the final
installation of the system. A TPMS from a given ABS manufacturer may be integrated quite
differently from vehicle to vehicle.
6.1.1 WSB Sensing Capabilities Test
The purpose of this test was to determine if the systems could sense multiple low tires
simultaneously. Attempts were made to test the WSB systems under real world conditions. The
vehicles were tested lightly loaded, simulating the normal operating mode of most light vehicles.
Test tires were deflated by 50 percent to significantly exceed the approximate 30 percent low
warning threshold of WSB systems. Testing was conducted in dry conditions on the Winding Road
Course (Appendix 5) so that the WSB systems could see differential side-to-side wheel speeds. This
course selection was motivated by earlier testing where it was discovered that vehicles with WSB
systems may not warn during straight-line driving (but will on roads with turns).
Tires were deflated to 50 percent below the warmed-up placard tire pressure in combinations
ranging from one to all four tires simultaneously low. The warmed-up placard tire pressure is
defined as follows: Test vehicles were moved outside and allowed to sit for a minimum of one hour
prior to testing. Before driving a test vehicle, each tire was set outdoors to cold placard inflation
pressure. The vehicle was then driven out to the Winding Road Course and driven for two laps to
warm up the tires. The inflation pressure obtained in this manner is defined as the warmed-up
placard tire pressure. The respective test tires were then deflated to 50 percent below the warmed-up
placard tire pressure. With the tire(s) low, the vehicles were driven for more than 10 miles at
approximately 30 mph to allow the WSB systems a reasonable amount of time to sense and warn of
44
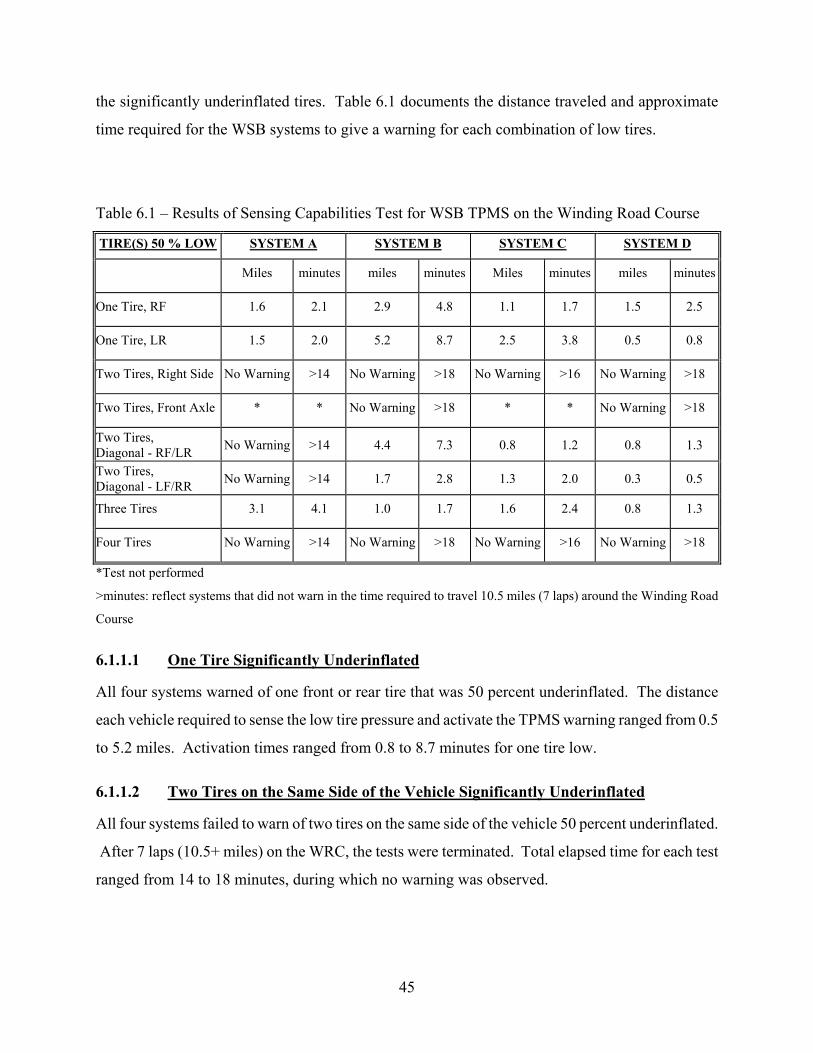
the significantly underinflated tires. Table 6.1 documents the distance traveled and approximate
time required for the WSB systems to give a warning for each combination of low tires.
Table 6.1 – Results of Sensing Capabilities Test for WSB TPMS on the Winding Road Course
TIRE(S) 50 % LOW SYSTEM A SYSTEM B SYSTEM C SYSTEM D
Miles minutes miles minutes Miles minutes miles minutes
One Tire, RF 1.6 2.1 2.9 4.8 1.1 1.7 1.5 2.5
One Tire, LR 1.5 2.0 5.2 8.7 3.8 0.8
Two Tires, Right Side No Warning >14 No Warning >18 No Warning >16 No Warning >18
Two Tires, Front Axle * * No Warning >18 * * No Warning >18
Two Tires, Diagonal - RF/LR No Warning >14 4.4 7.3 1.2 1.3
Two Tires, Diagonal - LF/RR No Warning >14 1.7 2.8 2.0 0.5
Three Tires 3.1 4.1 1.0 1.7 2.4 1.3
Four Tires No Warning >14 No Warning >18 No Warning >16 No Warning >18
2.5 0.5
0.8 0.8
1.3 0.3
1.6 0.8
*Test not performed
>minutes: reflect systems that did not warn in the time required to travel 10.5 miles (7 laps) around the Winding Road
Course
6.1.1.1 One Tire Significantly Underinflated
All four systems warned of one front or rear tire that was 50 percent underinflated. The distance
each vehicle required to sense the low tire pressure and activate the TPMS warning ranged from 0.5
to 5.2 miles. Activation times ranged from 0.8 to 8.7 minutes for one tire low.
6.1.1.2 Two Tires on the Same Side of the Vehicle Significantly Underinflated
All four systems failed to warn of two tires on the same side of the vehicle 50 percent underinflated.
After 7 laps (10.5+ miles) on the WRC, the tests were terminated. Total elapsed time for each test
ranged from 14 to 18 minutes, during which no warning was observed.
45
6.1.1.3 Two Tires on the Same Axle Significantly Underinflated
Due time and weather constraints, only two of the four WSB systems were tested for two tires on the
front axle underinflated. After more than 18 minutes of driving, both systems had failed to warn of
50 percent underinflation in two tires on the same axle (front).
6.1.1.4 Two Tires at Diagonal Positions Significantly Underinflated
Three of the four WSB systems warned of underinflation at both diagonals (RF/LR and LF/RR).
The distance to warning ranged from 0.3 to 4.4 miles. The time to warning ranged from 0.5 to 7.3
minutes. The one vehicle that did not warn had an advanced drive train may have hampered TPMS
sensing at diagonal locations. This will be discussed in greater detail in the discussion in Section
9.1, WSB Systems.
6.1.1.5 Three Tires Significantly Underinflated
All four systems warned of three tires low. The distance to warning ranged from 0.8 to 3.1 miles.
The time to warning ranged from 1.3 to 4.1 minutes. Sensing three tires low is essentially the same
as sensing a single tire that is overinflated or underinflated.
6.1.1.6 Four Tires Significantly Underinflated
All four systems failed to warn of four tires equally underinflated by 50 percent. The seven test laps
on the WRC lasted 14 to 18 minutes, during which no warning was observed.
An explanation for the failure of the WSB systems to warn in three scenarios of the Sensing
Capabilities Test is contained in the discussion in Section 9.1, WSB Systems.
6.1.2 WSB Dynamic Warning Threshold & Accuracy Tests
The vehicles equipped with WSB systems were instrumented to record both tire air pressure and
contained air temperature, in real time. A series of slow leak-down tests at lightly laden and fully
laden vehicle weights were performed on the High Speed Test Track (Appendix 5) to determine
TPMS activation levels. Since the initial tire temperature and pressure were critical for the WSB
systems, tires were allowed to cool outside for an hour between each test run. This was not done for
the PSB systems since initial tire conditions were not as critical.
46
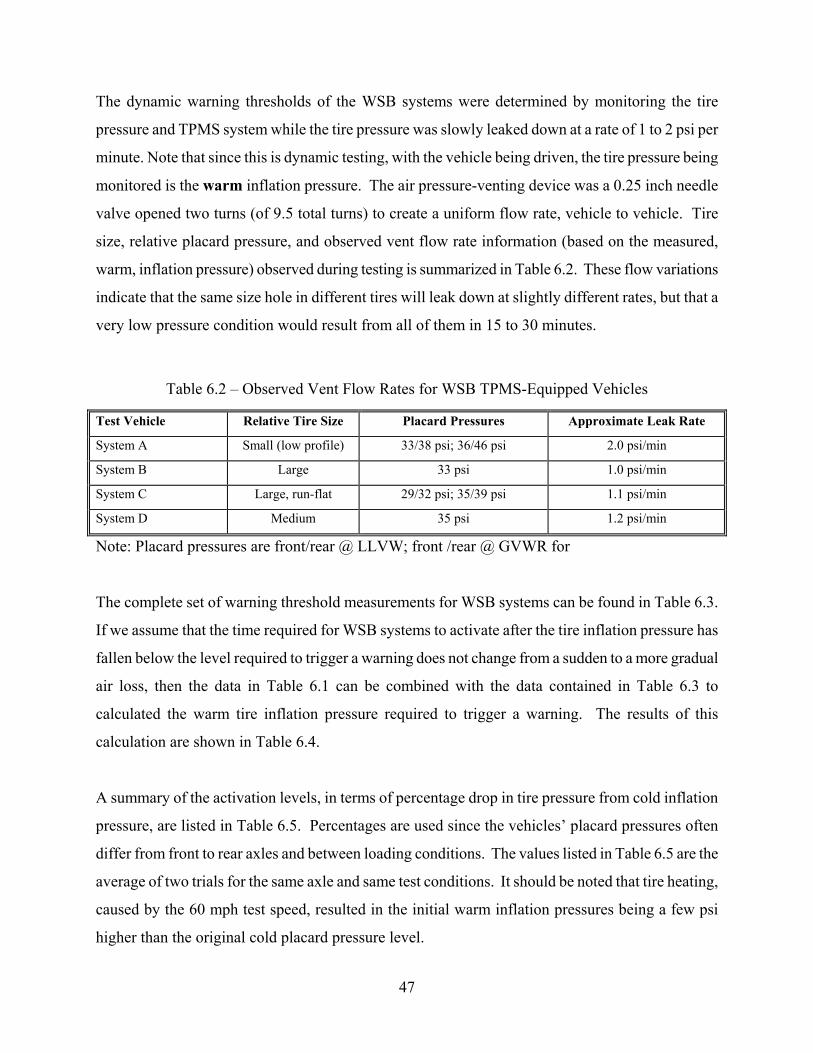
The dynamic warning thresholds of the WSB systems were determined by monitoring the tire
pressure and TPMS system while the tire pressure was slowly leaked down at a rate of 1 to 2 psi per
minute. Note that since this is dynamic testing, with the vehicle being driven, the tire pressure being
monitored is the warm inflation pressure. The air pressure-venting device was a 0.25 inch needle
valve opened two turns (of 9.5 total turns) to create a uniform flow rate, vehicle to vehicle. Tire
size, relative placard pressure, and observed vent flow rate information (based on the measured,
warm, inflation pressure) observed during testing is summarized in Table 6.2. These flow variations
indicate that the same size hole in different tires will leak down at slightly different rates, but that a
very low pressure condition would result from all of them in 15 to 30 minutes.
Table 6.2 – Observed Vent Flow Rates for WSB TPMS-Equipped Vehicles
Test Vehicle Relative Tire Size Placard Pressures Approximate Leak Rate
System A Small (low profile) 33/38 psi; 36/46 psi 2.0 psi/min
System B Large 33 psi 1.0 psi/min
System C Large, run-flat 29/32 psi; 35/39 psi 1.1 psi/min
System D Medium 35 psi 1.2 psi/min
Note: Placard pressures are front/rear @ LLVW; front /rear @ GVWR for
The complete set of warning threshold measurements for WSB systems can be found in Table 6.3.
If we assume that the time required for WSB systems to activate after the tire inflation pressure has
fallen below the level required to trigger a warning does not change from a sudden to a more gradual
air loss, then the data in Table 6.1 can be combined with the data contained in Table 6.3 to
calculated the warm tire inflation pressure required to trigger a warning. The results of this
calculation are shown in Table 6.4.
A summary of the activation levels, in terms of percentage drop in tire pressure from cold inflation
pressure, are listed in Table 6.5. Percentages are used since the vehicles’ placard pressures often
differ from front to rear axles and between loading conditions. The values listed in Table 6.5 are the
average of two trials for the same axle and same test conditions. It should be noted that tire heating,
caused by the 60 mph test speed, resulted in the initial warm inflation pressures being a few psi
higher than the original cold placard pressure level.
47
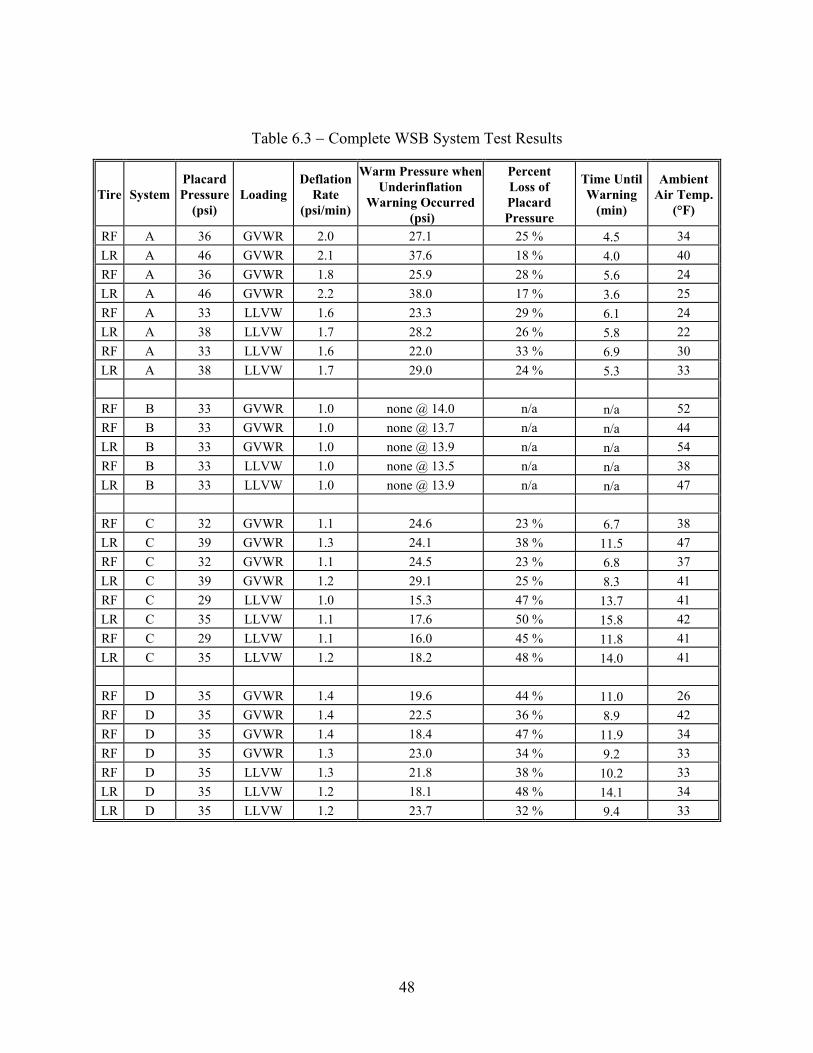
48
Table 6.3 − Complete WSB System Test Results
Tire System Placard Pressure
(psi) Loading
DeflationRate
(psi/min)
Warm Pressure when Underinflation
Warning Occurred (psi)
Percent Loss of Placard Pressure
Time Until Warning
(min)
Ambient Air Temp.
(°F)
RF 36 GVWR 2.0 27.1 25 % 4.5 34 LR 46 GVWR 2.1 37.6 18 % 4.0 40 RF 36 GVWR 1.8 25.9 28 % 5.6 24 LR 46 GVWR 2.2 38.0 17 % 3.6 25 RF 33 LLVW 1.6 23.3 29 % 6.1 24 LR 38 LLVW 1.7 28.2 26 % 5.8 22 RF 33 LLVW 1.6 22.0 33 % 6.9 30 LR 38 LLVW 1.7 29.0 24 % 5.3 33
RF B 33 GVWR 1.0 none @ 14.0 n/a n/a 52 RF B 33 GVWR 1.0 none @ 13.7 n/a n/a 44 LR B 33 GVWR 1.0 none @ 13.9 n/a n/a 54 RF B 33 LLVW 1.0 none @ 13.5 n/a n/a 38 LR B 33 LLVW 1.0 none @ 13.9 n/a n/a 47
RF 32 GVWR 1.1 24.6 23 % 6.7 38 LR 39 GVWR 1.3 24.1 38 % 11.5 47 RF 32 GVWR 1.1 24.5 23 % 6.8 37 LR 39 GVWR 1.2 29.1 25 % 8.3 41 RF 29 LLVW 1.0 15.3 47 % 13.7 41 LR 35 LLVW 1.1 17.6 50 % 15.8 42 RF 29 LLVW 1.1 16.0 45 % 11.8 41 LR 35 LLVW 1.2 18.2 48 % 14.0 41
RF 35 GVWR 1.4 19.6 44 % 11.0 26 RF 35 GVWR 1.4 22.5 36 % 8.9 42 RF 35 GVWR 1.4 18.4 47 % 11.9 34 RF 35 GVWR 1.3 23.0 34 % 9.2 33 RF 35 LLVW 1.3 21.8 38 % 10.2 33 LR 35 LLVW 1.2 18.1 48 % 14.1 34 LR 35 LLVW 1.2 23.7 32 % 9.4 33
A A A A A A A A
C C C C C C C C
D D D D D D D

49
Table 6.4 − Calculated Pressures to Trigger WSB Warnings
Tire System Placard Pressure
(psi) Loading
DeflationRate
(psi/min)
Warm Pressure when Underinflation
Warning Occurred (psi)
Time to TriggerWarning (from
Table 6.1) (min)
Calculated Pressure to
Trigger Warning
(psi)
Percent Loss of Placard Pressure
to Trigger Warning
RF A 36 R 27.1 2.1 31.3 13 % LR A 46 R 37.6 2.0 41.8 9 % RF A 36 R 25.9 2.1 29.7 18 % LR A 46 R 38.0 2.0 42.4 8 % RF 33 LLVW 1.6 23.3 2.1 26.7 19 % LR 38 LLVW 1.7 28.2 2.0 31.6 17 % RF 33 LLVW 1.6 22.0 2.1 25.4 23 % LR 38 LLVW 1.7 29.0 2.0 32.4 15 %
RF B 33 R None @ 14.0 n/a n/a n/a RF B 33 R None @ 13.7 n/a n/a n/a LR B 33 R None @ 13.9 n/a n/a n/a RF B 33 LLVW 1.0 None @ 13.5 n/a n/a n/a LR B 33 LLVW 1.0 None @ 13.9 n/a n/a n/a
RF C 32 R 24.6 1.7 26.5 17 % LR C 39 R 24.1 3.8 29.0 26 % RF C 32 R 24.5 1.7 26.4 18 % LR C 39 R 29.1 3.8 33.7 14 % RF 29 LLVW 1.0 15.3 1.7 17.0 41 % LR 35 LLVW 1.1 17.6 3.8 21.8 38 % RF 29 LLVW 1.1 16.0 1.7 17.9 38 % LR 35 LLVW 1.2 18.2 3.8 22.8 35 %
RF D 35 R 19.6 2.5 23.1 34 % RF D 35 R 22.5 2.5 26.0 26 % RF D 35 R 18.4 2.5 21.9 37 % RF D 35 R 23.0 2.5 26.3 25 % RF 35 LLVW 1.3 21.8 2.5 25.1 28 % LR 35 LLVW 1.2 18.1 0.8 19.1 46 % LR 35 LLVW 1.2 23.7 0.8 24.7 30 %
GVW 2.0 GVW 2.1 GVW 1.8 GVW 2.2
A A A A
GVW 1.0 GVW 1.0 GVW 1.0
GVW 1.1 GVW 1.3 GVW 1.1 GVW 1.2
C C C C
GVW 1.4 GVW 1.4 GVW 1.4 GVW 1.3
D D D
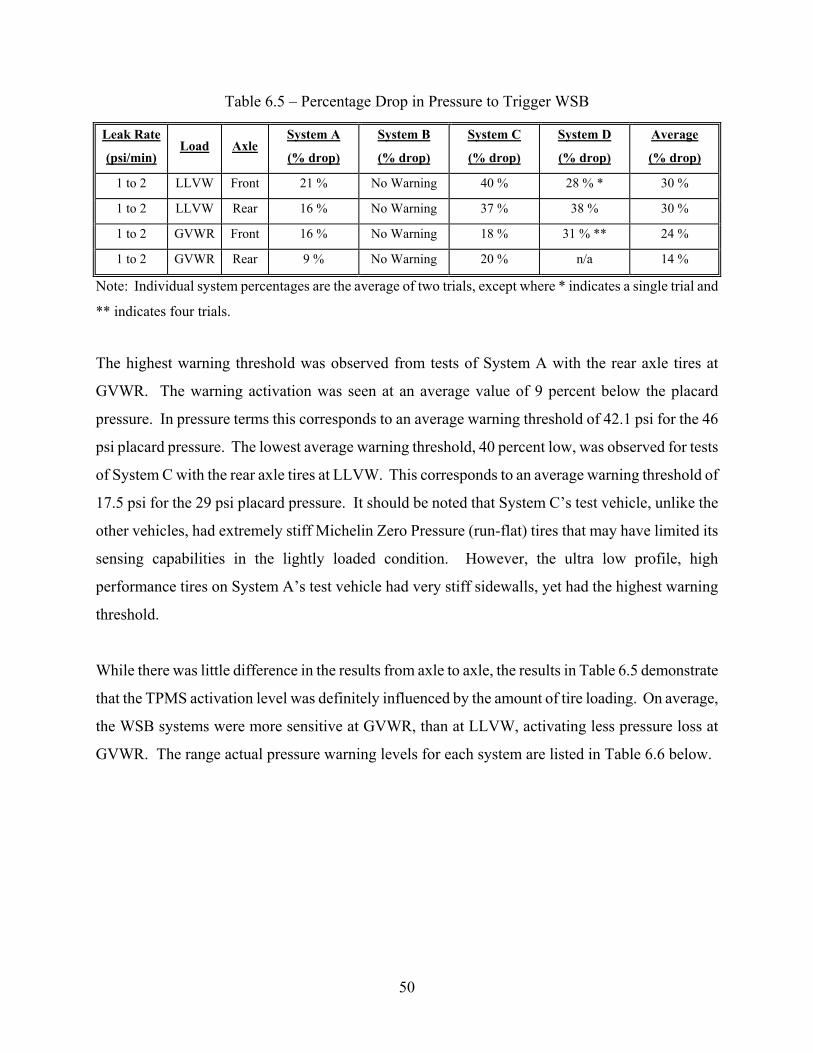
Table 6.5 – Percentage Drop in Pressure to Trigger WSB
Leak Rate
(psi/min) Load Axle
System A
(% drop)
System B
(% drop)
System C
(% drop)
System D
(% drop)
Average
(% drop)
1 to 2 LLVW Front 21 % No Warning 40 % 28 % * 30 %
1 to 2 LLVW Rear 16 % No Warning 37 % 38 % 30 %
1 to 2 GVWR Front 16 % No Warning 18 % 31 % ** 24 %
1 to 2 GVWR Rear 9 % No Warning 20 % n/a 14 %
Note: Individual system percentages are the average of two trials, except where * indicates a single trial and
** indicates four trials.
The highest warning threshold was observed from tests of System A with the rear axle tires at
GVWR. The warning activation was seen at an average value of 9 percent below the placard
pressure. In pressure terms this corresponds to an average warning threshold of 42.1 psi for the 46
psi placard pressure. The lowest average warning threshold, 40 percent low, was observed for tests
of System C with the rear axle tires at LLVW. This corresponds to an average warning threshold of
17.5 psi for the 29 psi placard pressure. It should be noted that System C’s test vehicle, unlike the
other vehicles, had extremely stiff Michelin Zero Pressure (run-flat) tires that may have limited its
sensing capabilities in the lightly loaded condition. However, the ultra low profile, high
performance tires on System A’s test vehicle had very stiff sidewalls, yet had the highest warning
threshold.
While there was little difference in the results from axle to axle, the results in Table 6.5 demonstrate
that the TPMS activation level was definitely influenced by the amount of tire loading. On average,
the WSB systems were more sensitive at GVWR, than at LLVW, activating less pressure loss at
GVWR. The range actual pressure warning levels for each system are listed in Table 6.6 below.
50
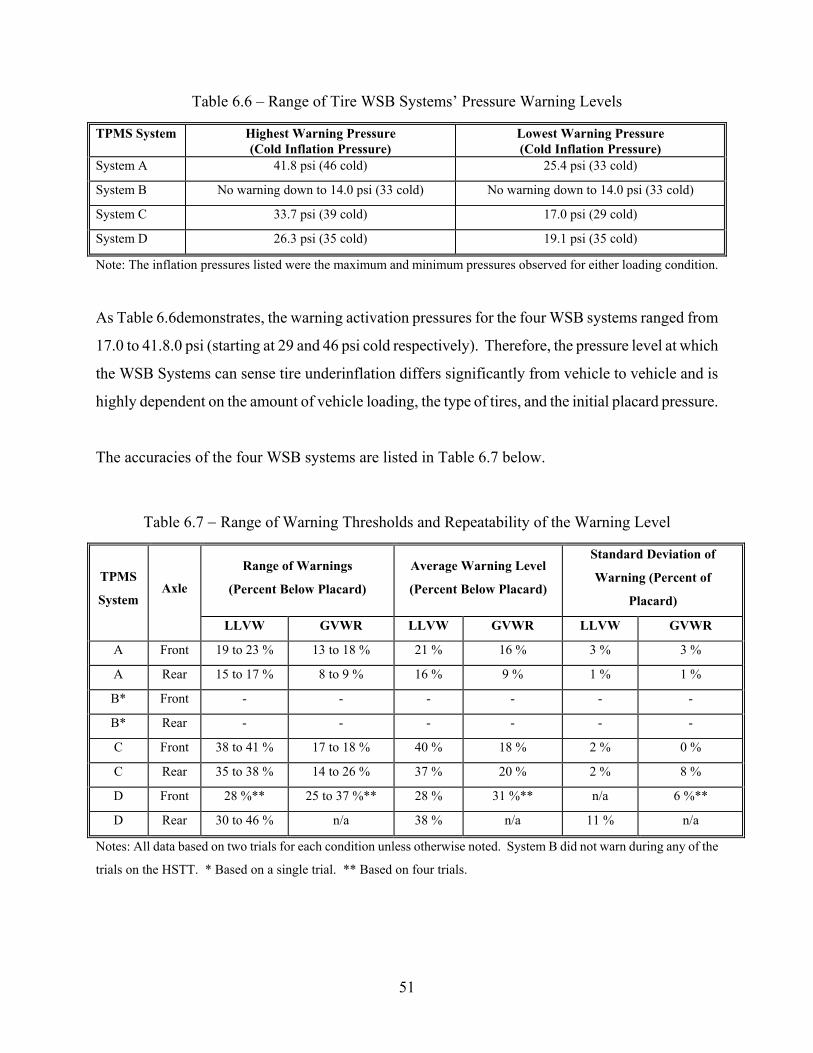
Table 6.6 – Range of Tire WSB Systems’ Pressure Warning Levels
TPMS System Highest Warning Pressure (Cold Inflation Pressure)
Lowest Warning Pressure (Cold Inflation Pressure)
System A 41.8 psi (46 cold) 25.4 psi (33 cold)
System B No warning down to 14.0 psi (33 cold) No warning down to 14.0 psi (33 cold)
System C 33.7 psi (39 cold) 17.0 psi (29 cold)
System D 26.3 psi (35 cold) 19.1 psi (35 cold)
Note: The inflation pressures listed were the maximum and minimum pressures observed for either loading condition.
As Table 6.6demonstrates, the warning activation pressures for the four WSB systems ranged from
17.0 to 41.8.0 psi (starting at 29 and 46 psi cold respectively). Therefore, the pressure level at which
the WSB Systems can sense tire underinflation differs significantly from vehicle to vehicle and is
highly dependent on the amount of vehicle loading, the type of tires, and the initial placard pressure.
The accuracies of the four WSB systems are listed in Table 6.7 below.
Table 6.7 − Range of Warning Thresholds and Repeatability of the Warning Level
Range of Warnings
(Percent Below Placard)
Average Warning Level
(Percent Below Placard)
Standard Deviation of
Warning (Percent of
Placard)
TPMS
System Axle
LLVW LLVW GVWR LLVW GVWR
A Front 19 to 23 % 13 to 18 % 21 % 16 % 3 % 3 %
A Rear 15 to 17 % 8 to 9 % 16 % 9 % 1 % 1 %
B* Front - - - -
B* Rear - - - -
C Front 38 to 41 % 17 to 18 % 40 % 18 % 2 % 0 %
C Rear 35 to 38 % 14 to 26 % 37 % 20 % 2 % 8 %
D Front 28 %** 25 to 37 %** 28 % 31 %** n/a 6 %**
D Rear 30 to 46 % n/a 38 % n/a 11 % n/a
GVWR
- -
- -
Notes: All data based on two trials for each condition unless otherwise noted. System B did not warn during any of the
trials on the HSTT. * Based on a single trial. ** Based on four trials.
51
6.1.2.1 System A Accuracy Test Results
System A’s underinflation warning activated for pressure losses ranging from 8 to 23 percent. The
system warned, on the average, with 7 percent less pressure loss for GVWR than for LLVW.
Repeats tests of a single tire, for a given condition, were within a 3 percent standard deviation
overall. In general the system warned sooner and more accurately (2 trials at each condition) for a
low tire on the rear axle than for one on the front.
During testing, once the warning lamp illuminated (red light on dash), testing was stopped and the
vehicle brought back to VRTC. The tires were allowed one hour to cool before setting the pressures
for the next test. Then, by pushing in and holding the reset button for 5 to 6 seconds, the warning
lamp cleared. To ensure that the system was re-initialized, the vehicle was driven for 10 minutes at
30 mph and 10 minutes at 60 mph before running the next leak-down sequence (Procedure for
System A only). For this system, an audible warning sounded once, each time the TPMS first
detected a low tire pressure condition. The tone was sufficiently loud to be heard over the hissing
sound of the venting tire pressure.
6.1.2.2 System B Accuracy Test Results
For this dynamic test sequence, System B failed to warn in 5 trials on the High Speed Test Track (an
illustration of the HSTT is contained in Appendix 5). Pressure was leaked down at an average rate
of 1.0 psi/min from 33 psi to the minimum test pressure of 14.0 psi (58 % low). Based on these
rates, the average trial lasted 18.9 minutes and the vehicle traveled 18.9 miles during the test. The
TPMS calibration procedures used for these tests, which are listed at the end of this document, were
specified by the service manual and did produce warnings on the Winding Road Course at pressures
above 16.5 psi.
Consequently, under the definition of the test procedures (slow leak-down during constant speed,
straight-line driving), System B failed to warn of significant underinflation (down to 14 psi).
However, after one failed test, the vehicle was driven from the test track to another test course while
a tire was still low. On the drive down the connecting road, which had a number of turns, the TPMS
warning activated. After successive failed tests on the HSTT, if the vehicle was driven up and down
the winding access road with the tire still low, the System B activated a warning. Therefore, the
52
dynamic performance of this WSB system was dependent on both vehicle loading (Table 6.5) and
the amount of turns encountered while driving.
The System B TPMS required that the user calibrate the system after every low tire pressure warning
indication. This was accomplished by adjusting the cold inflation pressures to the placard
requirements, resetting the TPMS system, then driving on the HSTT. Since no tests were performed
above 60 mph, the TPMS was calibrated in two ranges, 10 minutes at 30 mph and 10 minutes at 60
mph (a one time calibration using ten minutes at each of 20, 45, and 70 mph produced the same
results on the WRC as just the 30 and 60 mph speeds). It was noted that pushing the reset button
toggled the driver’s information display (on the dash) to indicated “TIRE PRESSURE NORMAL,”
which could be done with the tires still low.
When a warning did activate during testing, a triple gong audible warning sounded to alert the
driver. This was sufficiently loud to be heard over the hissing of the venting tire pressure (similar to
a door ajar warning tone).
6.1.2.3 System C Accuracy Test Results
System C’s test vehicle was equipped with Michelin Pilot Zero Pressure (run-flat) tires. The Zero
Pressure sidewalls are extremely stiff, and do not deform much, even under considerable pressure
loss. Subsequently, the pressure warning levels observed for System C were quite low. The
warning activation levels ranged from 14 to 41 percent below placard pressure. The system warned
with, on the average, 19 percent less pressure loss for GVWR than for LLVW. System C’s warning
level indications had the tightest tolerance in the LLVW condition, with a standard deviation of 2
percent for both axles. In the fully laden condition, the standard deviation for the front axle was
negligible (less than 1 %), but the rear axle standard deviation was 8 percent. In general the system
warned sooner and more accurately (2 trials at each condition) for a low tire on the front axle than
for one on the rear.
During testing, a single “gong” tone alerted the driver when the TPMS identified a low tire pressure.
The gong sound was accompanied by the text “TIRE DEFECT” being displayed on the driver’s
information panel on the dash. The tone was sufficiently loud to be heard over the hissing of the
53

venting air pressure. Once the warning lamp illuminated the text, “TIRE DEFECT,” the vehicle was
stopped, its engine turned off, and the low tire refilled. The tires were allowed one hour to cool
before setting the pressures for the next test. If the tires were refilled to the original calibration
pressure, the system did not require a re-calibration. Without pushing in the reset button, the engine
was restarted, and the warning lamp cleared. However, changes in inflation pressure to
accommodate higher loads (GVWR) required complete re-calibration of the system.
6.1.2.4 System D Accuracy Test Results
System D’s warning activation levels ranged from 25 to 46 percent low. Time and weather
constraints prevented repeats of the lightly laden test in which the right front tire was deflated and
resulted in the fully laden test in which the left rear tire was deflated not being performed. Though
on average, the system activated the underinflation warning with 4 percent more pressure loss at
GVWR than when at LLVW. In the fully laden condition, front axle, the standard deviation was 6
percent (based on four trials at that condition). In the fully laden condition, the standard deviation
for the rear axle was 11 percent (based on 2 trials).
One difference between System D and the other systems tested was that it had no audible warning
with which to alert the driver that the warning had activated, just a warning lamp. On one test in
bright sunlight, the driver was not aware that the factory dash-mounted warning lamp was
illuminated until after a period of over 20 seconds (the warning lamp was also monitored by video
camera).
Once the warning lamp illuminated, several hypotheses were explored to identify what was required
to clear the warning. By stopping the vehicle and turning off the ignition, the warning lamp cleared
on engine restart. If the tire was still low, the warning lamp re-illuminated after driving for about a
minute at 30 mph. If the low tire was filled to match the other properly inflated tire pressures
(during engine shutdown) the lamp toggled off at startup and stayed off for future driving. If the
ignition was not turned off during tire refilling (such as refilling at a service station without turning
off the ignition), the warning lamp eventually extinguished after ten minutes of driving on curving
roads.
54

System D’s reset procedure consisted of turning the ignition off and then on again, in essence
erasing any short-term memory of a flat tire. This was suitable as long as the tires were brought
back to the same cold inflation pressure the system was calibrated at and the loading was the same.
System D had a reset button to push, but this caused the long-term memory to blank, erasing all tire
baseline information and necessitating a lengthy calibration. This system provided no way to
identify when the calibration was complete (which required 8 hours – see the calibration procedure
in Appendix 3). Despite a full eight hours of calibration driving, a few trial tests were performed
where no low tire pressure warnings were experienced for one tire. The lack of turns did on the
HSTT did not allow the system to calibrate sufficiently. However, the system did function normally
once the revised calibration procedure was implemented (Appendix 1).
6.1.2.5 WSB System Warning Status Preservation
For all four of the WSB systems, brake snubs were performed with one tire 2 psi below the system’s
activation pressure. After the system had warned of low pressure, brake snubs consisting of partial
stops run from 60 to 20 mph were completed using the vehicle’s service brakes (and the
transmission in high gear). A uniform deceleration of 10 feet per second per second (0.3G) was
maintained for the duration. Snubs were repeated every mile for three laps of the HSTT (or 22
miles). The snubs were meant to heat the tires and brakes enough to raise the pressure above the
activation level. For all four of the WSB TPMS configurations, none of the underinflated tires
acquired enough heat buildup to cause the TPMS warning to clear at the higher pressure. This
indicates that the system will maintain its underinflation warning and not flicker on and off during
stop-and-go driving.
6.1.3 WSB Dynamic Tests on Loose Surface
Additional tests were performed on two of the WSB TPMS equipped vehicles to determine their
sensitivity to operation on a loose composition surface. The System B and System D were both
tested on a 2.5 mile, winding gravel road course at speeds of 20 to 40 mph. The vehicles equipped
with Systems A and C were not government-owned and could not be subjected to these tests due to
concerns over damage to their paint finishes. Results for this testing are summarized in Table 6.8.
55

Table 6.8 – Results of Loose Surface Tests
TPMS System Tire Loading Warning (psi) Warning (% low)
System B RF GVWR No warning No warning
System B LF LLVW No warning No warning
System D RF GVWR 22 37
System D RF LLVW 31 11
System D RF/LR LLVW 31 / 31 9 / 9
For this test, no snubs were performed to heat the brakes and tires, as the loose surface limited the
coefficient of friction to less than the 0.3 g deceleration required. The same calibration procedures
that produced warnings on the WRC for System B were used to calibrate the system for tests on the
winding gravel road. The right front (RF) tire was tested with the vehicle fully laden (to the
GVWR), and the left front (LF) tire was tested with the vehicle in the “light” condition (LLVW).
Neither condition caused the warning lamp to illuminate by the time the respective tire was deflated
to 14 psi (58 % low).
The right front tire of System D was tested twice on the gravel road: once at GVWR, and again at
LLVW. In the GVWR loading condition, the TPMS warned of low tire pressure at 22 psi (37 %
low). In the LLVW loading condition, it warned at 31 psi (11 % low). For the gravel road tests, the
TPMS was more responsive to low tire pressure in the lightly loaded condition than in the fully
laden condition. This was contrary to the results on paved surfaces.
In a third test, the two tires forming the RF/LR diagonal were subjected to the slow leak-down
procedure. Again the System C TPMS produced a significant underinflation warning for the two
tires at 31.6 and 31.7 psi respectively (9 / 9 % low).
More testing would be needed to adequately determine the effects of the loose surface on the WSB
systems sensing capabilities.
56

6.2 Pressure-Sensor Based TPMS
This section details the results of the PSB TPMS evaluations. Testing of the pressure-sensor based
systems was conducted both statically and dynamically. The static tests had three objectives: 1) to
determine the threshold warning threshold by lowering the pressure in increments, 2) to investigate
the effects of temperature change on PSB systems, and 3) to determine the response time of the
systems to a rapid tire deflation.
6.2.1 PSB Static Tests for System Accuracy – Pressure Dropped in 2 psi Increments
The first and third static tests were performed indoors (warm) with the vehicle raised on a lift
(wheels in motion). The second static test was performed outdoors (cold) on jack stands to test the
effects of temperature changes. The results of the three static tests can be seen in the following
tables. Table 6.9 documents the underinflation advisory and significant underinflation warning
thresholds for the six PSB systems. The thresholds are also given as a percentage of the change in
pressure from the placard cold inflation pressure. For example a ∆P of 53 percent means that the
advisory/warning activated 53 percent below the placard pressure.
Table 6.9 has a number of entries listed as not applicable, or “n/a”. Systems E and G had only a
one-stage warning that was considered to be the significant underinflation warning. Unfortunately,
the electronically controlled suspension on the System E’s test vehicle activated a fault code when
put on a lift and placed in gear. This precluded performing the normal static tests for System E.
Instead, eight outdoor tests were performed using the same 2 psi drops in tire pressure until
activation occurred.
57
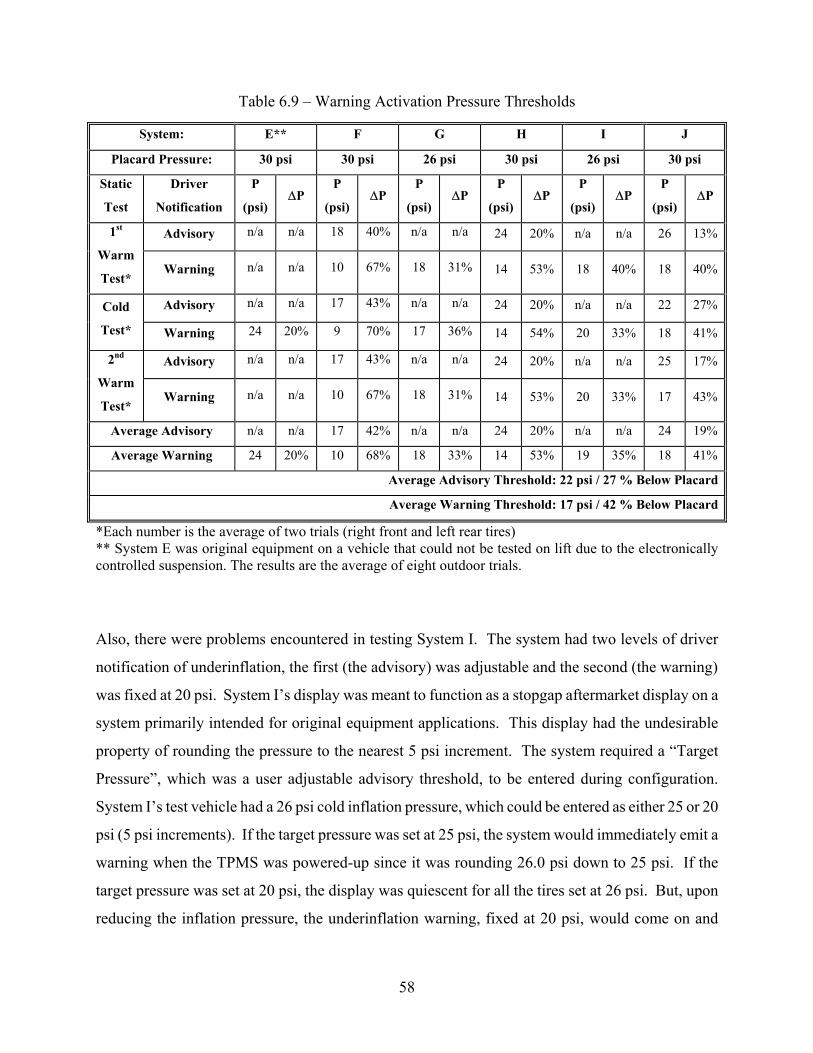
Table 6.9 – Warning Activation Pressure Thresholds
System: F G H I J
Placard Pressure: 30 psi 30 psi 26 psi 30 psi 26 psi 30 psi
Static
Test
Driver
Notification
P
(psi) ∆P
P
(psi) ∆P
P
(psi) ∆P
P
(psi) ∆P
P
(psi) ∆P
P
(psi) ∆P
Advisory n/a 18 40% n/a 24 n/a n/a 26 13%1st
Warm
Test* Warning n/a n/a 10 18 14 18 40% 40%
Advisory n/a 17 43% n/a 24 n/a n/a 22 27%Cold
Test* Warning 24 9 70% 17 36% 14 20 33% 41%
Advisory n/a 17 43% n/a 24 n/a n/a 25 17%2nd
Warm
Test* Warning n/a n/a 10 18 14 20 33% 43%
Average Advisory n/a 17 42% n/a 24 20% n/a n/a 24 19%
Average Warning 24 68% 18 33% 53% 19 18 41%
Average Advisory Threshold: 22 psi / 27 % Below Placard
Average Warning Threshold: 17 psi / 42 % Below Placard
E**
n/a n/a 20%
67% 31% 53% 18
n/a n/a 20%
20% 54% 18
n/a n/a 20%
67% 31% 53% 17
n/a n/a
10 20% 14 35%
*Each number is the average of two trials (right front and left rear tires) ** System E was original equipment on a vehicle that could not be tested on lift due to the electronically controlled suspension. The results are the average of eight outdoor trials.
Also, there were problems encountered in testing System I. The system had two levels of driver
notification of underinflation, the first (the advisory) was adjustable and the second (the warning)
was fixed at 20 psi. System I’s display was meant to function as a stopgap aftermarket display on a
system primarily intended for original equipment applications. This display had the undesirable
property of rounding the pressure to the nearest 5 psi increment. The system required a “Target
Pressure”, which was a user adjustable advisory threshold, to be entered during configuration.
System I’s test vehicle had a 26 psi cold inflation pressure, which could be entered as either 25 or 20
psi (5 psi increments). If the target pressure was set at 25 psi, the system would immediately emit a
warning when the TPMS was powered-up since it was rounding 26.0 psi down to 25 psi. If the
target pressure was set at 20 psi, the display was quiescent for all the tires set at 26 psi. But, upon
reducing the inflation pressure, the underinflation warning, fixed at 20 psi, would come on and
58
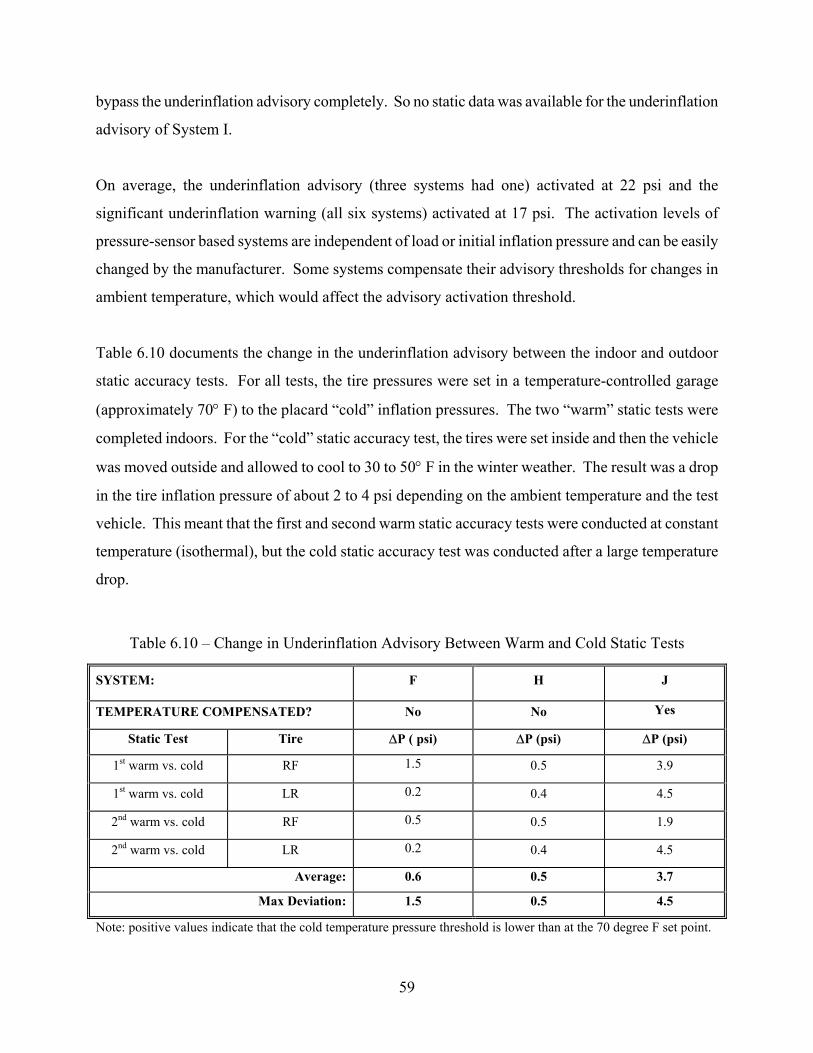
bypass the underinflation advisory completely. So no static data was available for the underinflation
advisory of System I.
On average, the underinflation advisory (three systems had one) activated at 22 psi and the
significant underinflation warning (all six systems) activated at 17 psi. The activation levels of
pressure-sensor based systems are independent of load or initial inflation pressure and can be easily
changed by the manufacturer. Some systems compensate their advisory thresholds for changes in
ambient temperature, which would affect the advisory activation threshold.
Table 6.10 documents the change in the underinflation advisory between the indoor and outdoor
static accuracy tests. For all tests, the tire pressures were set in a temperature-controlled garage
(approximately 70° F) to the placard “cold” inflation pressures. The two “warm” static tests were
completed indoors. For the “cold” static accuracy test, the tires were set inside and then the vehicle
was moved outside and allowed to cool to 30 to 50° F in the winter weather. The result was a drop
in the tire inflation pressure of about 2 to 4 psi depending on the ambient temperature and the test
vehicle. This meant that the first and second warm static accuracy tests were conducted at constant
temperature (isothermal), but the cold static accuracy test was conducted after a large temperature
drop.
Table 6.10 – Change in Underinflation Advisory Between Warm and Cold Static Tests
SYSTEM: H J
TEMPERATURE COMPENSATED? No No Yes
Static Test Tire ∆P ( psi) ∆P (psi) ∆P (psi)
1st warm vs. cold RF 1.5 0.5
1st warm vs. cold LR 0.2 0.4
2nd warm vs. cold RF 0.5 0.5
2nd warm vs. cold LR 0.2 0.4
Average: 0.5 3.7
Max Deviation: 1.5 0.5 4.5
F
3.9
4.5
1.9
4.5
0.6
Note: positive values indicate that the cold temperature pressure threshold is lower than at the 70 degree F set point.
59
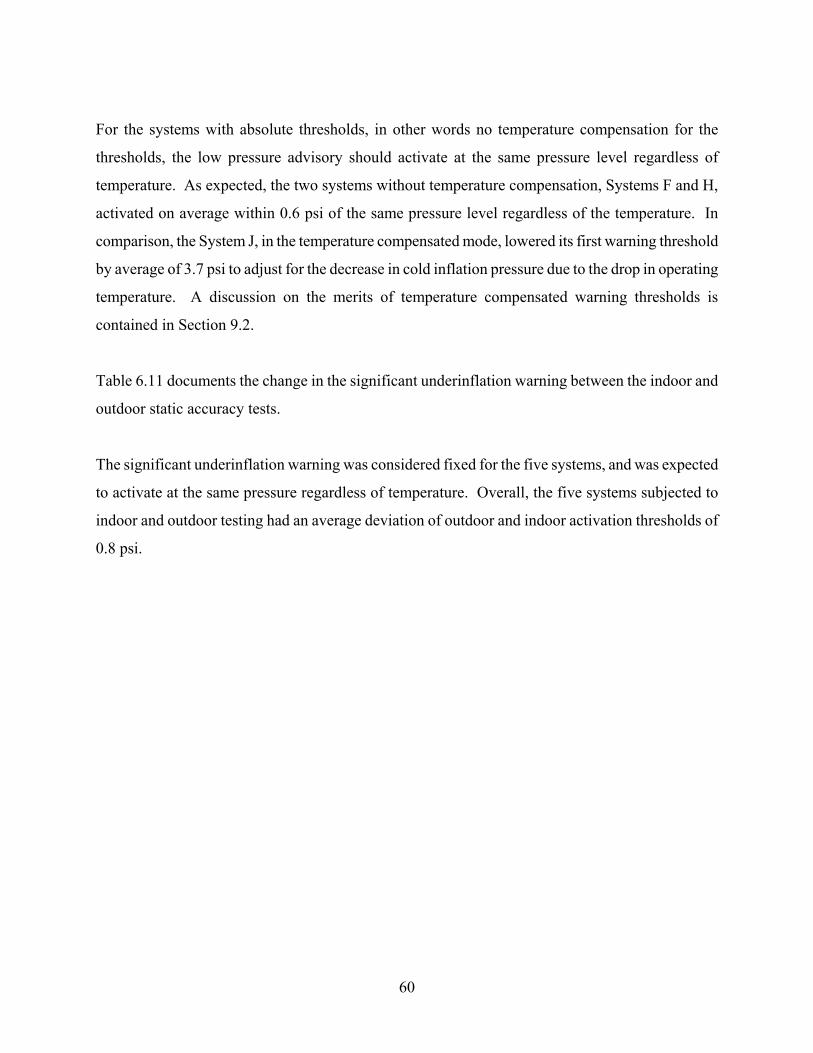
For the systems with absolute thresholds, in other words no temperature compensation for the
thresholds, the low pressure advisory should activate at the same pressure level regardless of
temperature. As expected, the two systems without temperature compensation, Systems F and H,
activated on average within 0.6 psi of the same pressure level regardless of the temperature. In
comparison, the System J, in the temperature compensated mode, lowered its first warning threshold
by average of 3.7 psi to adjust for the decrease in cold inflation pressure due to the drop in operating
temperature. A discussion on the merits of temperature compensated warning thresholds is
contained in Section 9.2.
Table 6.11 documents the change in the significant underinflation warning between the indoor and
outdoor static accuracy tests.
The significant underinflation warning was considered fixed for the five systems, and was expected
to activate at the same pressure regardless of temperature. Overall, the five systems subjected to
indoor and outdoor testing had an average deviation of outdoor and indoor activation thresholds of
0.8 psi.
60
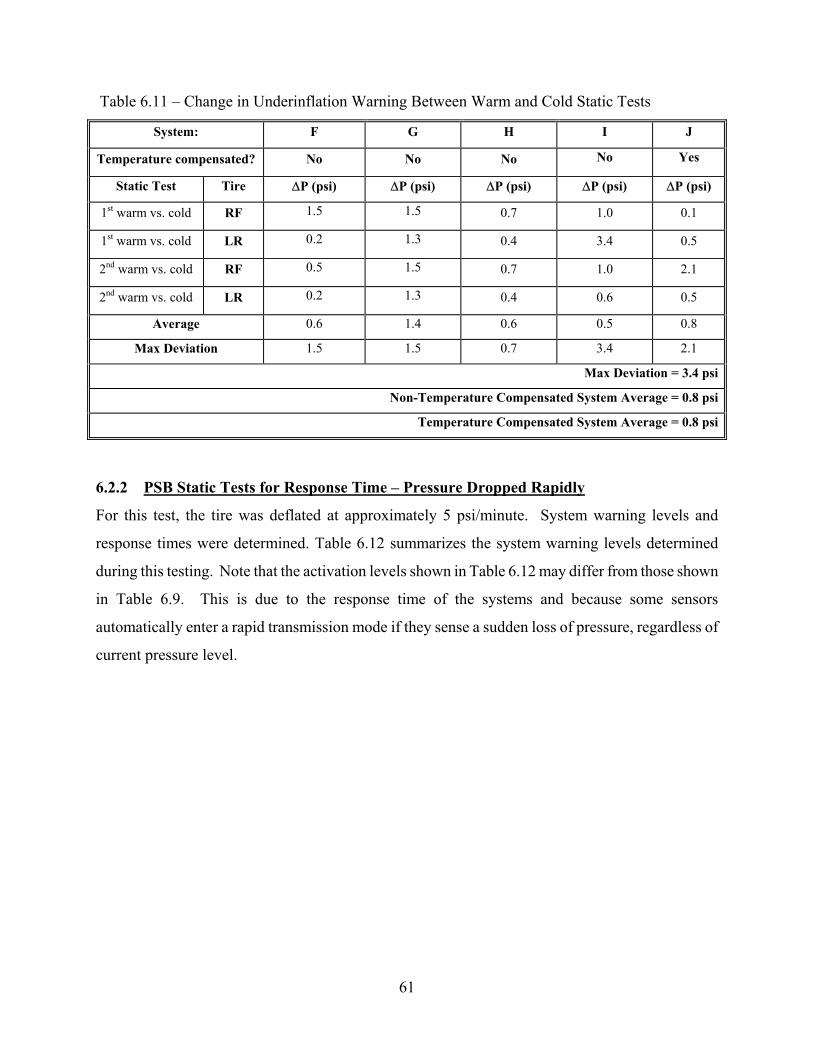
Table 6.11 – Change in Underinflation Warning Between Warm and Cold Static Tests
System: G H I J
Temperature compensated? No No No No
Static Test Tire ∆P (psi) ∆P (psi) ∆P (psi) ∆P (psi) ∆P (psi)
1st warm vs. cold RF 1.5 0.7 0.1
1st warm vs. cold LR 0.2 0.4 0.5
2nd warm vs. cold RF 0.5 0.7 2.1
2nd warm vs. cold LR 0.2 0.4 0.5
Average 0.6 0.6 0.5 0.8
Max Deviation 1.5 0.7 3.4 2.1
Max Deviation = 3.4 psi
Non-Temperature Compensated System Average = 0.8 psi
Temperature Compensated System Average = 0.8 psi
F
Yes
1.5 1.0
1.3 3.4
1.5 1.0
1.3 0.6
1.4
1.5
6.2.2 PSB Static Tests for Response Time – Pressure Dropped Rapidly
For this test, the tire was deflated at approximately 5 psi/minute. System warning levels and
response times were determined. Table 6.12 summarizes the system warning levels determined
during this testing. Note that the activation levels shown in Table 6.12 may differ from those shown
in Table 6.9. This is due to the response time of the systems and because some sensors
automatically enter a rapid transmission mode if they sense a sudden loss of pressure, regardless of
current pressure level.
61
Table 6.12 – Warning Activation Pressure Thresholds from Rapid Deflation Testing
(percent drop from cold inflation pressure)
System: G H I J
Advisory AdvisoryStatic
Test: Warning Warning
47 % n/a 33 % n/a No advisory1st Warm
Test* 83 % 9 % 59 % 50 % 52 %
44 % n/a ** No advisoryCold
Test* 70 % 9 % ** 75 % 47 %
40 % n/a 27 % n/a No advisory2nd Warm
Test* 70 % 9 % 63 % 42 % 55 %
44 % n/a 30 % n/a No advisoryAverage
Warning 74 % 9 % 61 % 56 % 51 %
Average Advisory Threshold:
Average Warning Threshold:
F
Advisory Advisory Advisory
Warning Warning Warning
n/a
37 %
50 %
* Average of four trials (right front and left rear tires, twice). ** Screen displayed “Lo” with RF icon indicator illuminated.
System E was omitted from Table 6.12 since the vehicle could not be tested on a lift. The display
from System H never produced an audible warning during the rapid deflation outdoor test (Cold
Static Accuracy Test), though System H’s tire icon was continually flashing and a “Lo” message
was displayed if the button was pushed. It is assumed that the display was still in the warning mode
from previous tests and had not sufficiently reset before the rapid deflation segment of the Cold
Static Accuracy Test.
During a rapid pressure loss, the underinflation advisory, on the average, activated at 37 percent
below cold inflation pressure. The significant underinflation warning activated at an average of 50
percent below the placard pressure. While not meant to simulate a tire failure (blowout), it is
promising to note that these systems will warn of a large tire puncture with more than 50 percent of
the air pressure remaining. The response times necessary to produce a warning are documented in
Table 6.13.
62
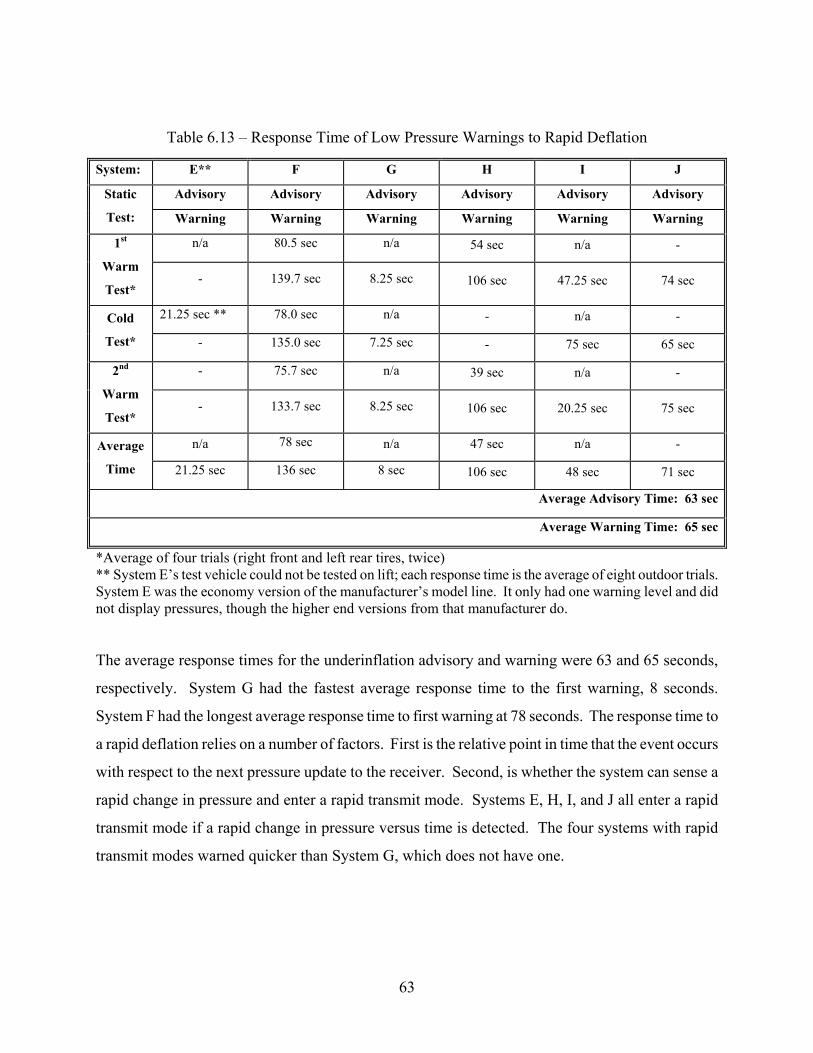
Table 6.13 – Response Time of Low Pressure Warnings to Rapid Deflation
System: F G H I J
Advisory Advisory Advisory AdvisoryStatic
Test: Warning Warning Warning Warning
n/a sec 54 sec n/a -1st
Warm
Test* - 139.7 sec 8.25 sec 106 sec 47.25 sec 74 sec
21.25 sec ** 78.0 sec n/a - -Cold
Test* - 135.0 sec 7.25 sec - 75 sec 65 sec
- sec n/a 39 sec n/a -2nd
Warm
Test* - 133.7 sec 8.25 sec 106 sec 20.25 sec 75 sec
n/a 78 sec n/a sec n/a -Average
Time 21.25 sec 136 sec 8 sec 106 sec 48 sec 71 sec
Average Advisory Time:
Average Warning Time:
E**
Advisory Advisory
Warning Warning
80.5 n/a
n/a
75.7
47
63 sec
65 sec
*Average of four trials (right front and left rear tires, twice) ** System E’s test vehicle could not be tested on lift; each response time is the average of eight outdoor trials. System E was the economy version of the manufacturer’s model line. It only had one warning level and did not display pressures, though the higher end versions from that manufacturer do.
The average response times for the underinflation advisory and warning were 63 and 65 seconds,
respectively. System G had the fastest average response time to the first warning, 8 seconds.
System F had the longest average response time to first warning at 78 seconds. The response time to
a rapid deflation relies on a number of factors. First is the relative point in time that the event occurs
with respect to the next pressure update to the receiver. Second, is whether the system can sense a
rapid change in pressure and enter a rapid transmit mode. Systems E, H, I, and J all enter a rapid
transmit mode if a rapid change in pressure versus time is detected. The four systems with rapid
transmit modes warned quicker than System G, which does not have one.
63

6.2.3 PSB Display Accuracy
The accuracies of the pressures displayed by the four PSB systems that displayed pressures during
an advisory or warning were checked against a calibrated digital pressure gauge. The results are in
Table 6.14.
The four PSB systems were as a whole very accurate. All displays were within 1 psi of the actual
pressure reading.
Table 6.14 – Deviation of Pressure Displayed During Warnings vs. Calibrated Pressure Gauge
System: H J F
Warning:
Static Test
Tire Advisory
(psi) Warning
(psi) Advisory
(psi) Warning
(psi) Advisory
(psi) Warning
(psi) Advisory
(psi) Warning
(psi)
RF n/a 0 -1 -1 0 1st
Warm LR n/a -1 -1 0 0 0
RF n/a -1 0 0 0 Cold
LR n/a 0 0 0 0
RF n/a -1 0 0 0 -1 2nd
Warm LR n/a 0 0 -1 0
Individual Max Deviation:
n/a -1 -1 -1 -1
I
-1 -1 -
-1 0
0 0 0
0 0 0
0 -
0 0 -1
-1 -1 -1
Systems E and G had only one warning level and did not display pressures.
6.2.4 PSB Dynamic Test for Activation Levels
Three test vehicles were used to test the six PSB systems. Tests were conducted on a closed circuit
test track at normal highway speeds (60 mph). Each vehicle was instrumented to record both tire air
pressure and contained air temperature, in real time. A series of both fast and slow leak-down tests
were performed on the six PSB TPMS to determine their activation levels. All systems were tested
while the vehicles were ballasted to GVWR (the fully laden condition) to facilitate tire heating.
Three things were determined during this testing: 1) Accuracy of advisory or warning thresholds; 2)
Preservation of warning status; and 3) System failure effects.
64

6.2.5 PSB Accuracy Tests
The dynamic warning thresholds of the PSB tire pressure measurement systems were determined by
leaking the tire pressure down at a controlled rate through a 0.25 inch needle valve. The valves were
coupled, through heavy truck grade air lines, to rotary air couplings attached to the wheels. Two
different flow rates were used during testing. To simulate a slow leak in the tire the RF and LR tires
were deflated (vented) at a flow rate of 1 to 2 psi per minute (valve opened 2 turns). To simulate a
mediums-sized puncture in the tire the RR and LF tires were deflated at 6 psi per minute (valve fully
opened 9+ turns). The activation levels, in terms of percentage drop in tire pressure from cold
inflation pressure are listed in Table 6.15. The values listed are individual test readings, as only one
tire was deflated at a time for this test procedure. No simultaneous multiple tire deflation tests were
performed for the PSB systems. The “Percent Loss of Placard Pressure” column reflects the relative
amount of air pressure vented from the tire.
As documented in Table 6.15, Systems F, G and I occasionally failed to warn during the leak down
process. For System F, a prototype, there were difficulties with signal reception. Even during static
testing, the receiver would pick up some tire locations better than others. Another prototype system,
System G, failed to warn in two instances. The reason for this failure is unknown. Though System I
warned erratically during both the fast and slow leak down tests, through ten trials it always gave at
least an advisory or a warning. The low placard pressure on the test vehicle may have caused some
problems with the System I’s warning algorithm.
65
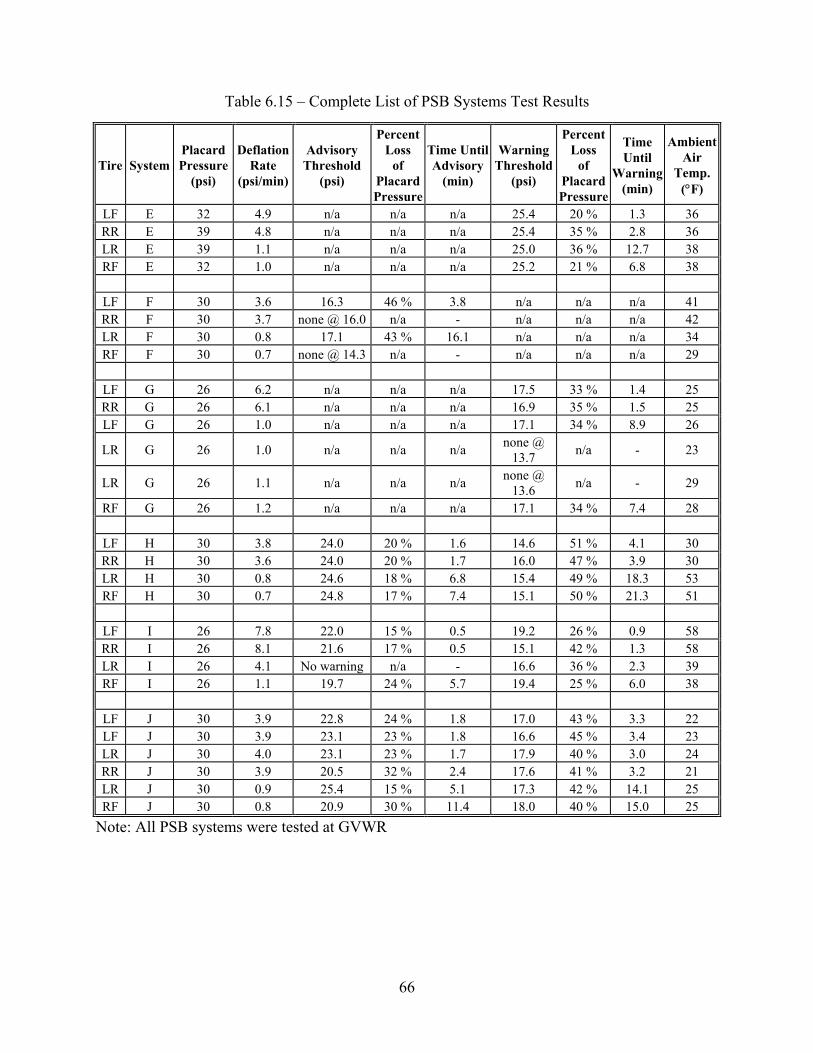
66
Table 6.15 – Complete List of PSB Systems Test Results
Tire System Placard Pressure
(psi)
Deflation Rate
(psi/min)
Advisory Threshold
(psi)
Percent Loss
of PlacardPressure
Time Until Advisory
(min)
Warning Threshold
(psi)
Percent Loss
of Placard Pressure
Time Until
Warning (min)
AmbientAir
Temp. (°F)
LF 32 4.9 n/a n/a n/a 25.4 20 % 1.3 36 RR 39 4.8 n/a n/a n/a 25.4 35 % 2.8 36 LR 39 1.1 n/a n/a n/a 25.0 36 % 12.7 38 RF 32 1.0 n/a n/a n/a 25.2 21 % 6.8 38
LF 30 3.6 16.3 46 % 3.8 n/a n/a n/a 41 RR 30 3.7 @ 16.0 n/a - n/a n/a n/a 42 LR 30 0.8 17.1 43 % 16.1 n/a n/a n/a 34 RF F 30 0.7 none @ 14.3 n/a - n/a n/a n/a 29
LF 26 6.2 n/a n/a n/a 17.5 33 % 1.4 25 RR 26 6.1 n/a n/a n/a 16.9 35 % 1.5 25 LF 26 1.0 n/a n/a n/a 17.1 34 % 8.9 26
LR 26 1.0 n/a n/a n/a none @ 13.7 n/a 23
LR 26 1.1 n/a n/a n/a none @ 13.6 n/a 29
RF 26 1.2 n/a n/a n/a 17.1 34 % 7.4 28
LF H 30 3.8 24.0 20 % 1.6 14.6 51 % 4.1 30 RR H 30 3.6 24.0 20 % 1.7 16.0 47 % 3.9 30 LR H 30 0.8 24.6 18 % 6.8 15.4 49 % 18.3 53 RF H 30 0.7 24.8 17 % 7.4 15.1 50 % 21.3 51
LF I 26 7.8 22.0 15 % 0.5 19.2 26 % 0.9 58 RR I 26 8.1 21.6 17 % 0.5 15.1 42 % 1.3 58 LR I 26 4.1 No warning n/a - 16.6 36 % 2.3 39 RF I 26 1.1 19.7 24 % 5.7 19.4 25 % 6.0 38
LF J 30 3.9 22.8 24 % 1.8 17.0 43 % 3.3 22 LF J 30 3.9 23.1 23 % 1.8 16.6 45 % 3.4 23 LR J 30 4.0 23.1 23 % 1.7 17.9 40 % 3.0 24 RR J 30 3.9 20.5 32 % 2.4 17.6 41 % 3.2 21 LR J 30 0.9 25.4 15 % 5.1 17.3 42 % 14.1 25 RF J 30 0.8 20.9 30 % 11.4 18.0 40 % 15.0 25
Note: All PSB systems were tested at GVWR
E E E E
F F none F
G G G
G -
G -
G
6.2.5.1 System E Accuracy Test Results
Since System E was an original equipment system, the activation threshold of the underinflation
warning (single warning) was determined by the vehicle manufacturer. Empirically, the warning
threshold appeared to be fixed at 25.2 psi. Placard pressure for the test vehicle was 32 psi for the
front and 39 psi rear. Both the fast and the slow leak-down tests produced similar results for the
front and the rear tires. The activation pressures all ranged from 25.0 to 25.4 psi. This was a
tolerance of only ±0.2 psi. Since the axles required different cold inflation pressures, the
corresponding 21 percent front and 36 percent rear pressure loss values do not directly correlate to
the indicators from the other systems tested. The audible warning tone was sufficiently loud to be
heard above the venting tire air. The dash-mounted visual display indicated the text warning
“TYREPRES FRONT L,” which indicated the left front tire was causing the warning. The warning
was spelled with “TYRE” since this vehicle was built for the European market. Once the tire
pressure was restored, pushing the reset button cleared the warning.
6.2.5.2 System F Accuracy Test Results
System F, a prototype original equipment system, was attached to a laptop computer to substitute for
the lack of an integrated vehicle display. This system only updated every ten minutes, which made it
slow to respond to the changing tire pressures. As Table 6.15 indicates, System F had reception
problems for wheels on the right side of the vehicle. However, the system did provide
underinflation advisories for the two left side wheels. The underinflation advisories activated 0.9
and 1.7 psi below the nominal 18 psi threshold. The underinflation warning could not be tested
dynamically since its nominal 10 psi threshold was deemed too low to test safely at 60 mph,
especially in a fully loaded SUV.
The ability of System F to maintain inflation pressure during driving was not evaluated, but an
example of system’s capabilities is documented in Appendix 2.
6.2.5.3 System G Accuracy Test Results
For System G, a prototype aftermarket system, special airline tees were installed adjacent to the
valve stem to allow for simultaneous tire pressure monitoring by the system’s externally mounted
sensor and the pressure transducer feed lines. The test vehicle had a 26 psi placard pressure front
67
and rear. The single TPMS underinflation warning was factory set at 20 psi. During dynamic (on-
road) testing, the system failed to warn in two of the six trials. Both failures involved the left rear
tire, which was deflated down to 14 psi with no warning. Identical procedures did produce warnings
for other tires. The average warning activation pressure was 17.2 ±0.3 psi (or 33 to 35 % pressure
loss).
Once the low tire pressure warning activated, it continued until the driver pushed the reset button.
Then the visual warning lamp continued to blink until the tire pressure situation was corrected.
Twice during the test sequence, the receiver displayed a low battery light for a tire sensor and the
driver thought that this was a low tire warning. The centrally mounted warning indicators were
visible on the display through the adjacent tire indicator openings, giving the driver (looking from
the left side) the impression that the left front tire was causing a notification of underinflation to be
presented, when it may really have been a right tire with the low pressure condition.
6.2.5.4 System H Accuracy Test Results
System H was installed on a vehicle that had a 30 psi placard pressure front and rear. The system’s
underinflation advisory is set by the manufacturer to activate in the 20 to 15 psi range and the
underinflation warning to activate below 15 psi. System H warned of underinflation in every
dynamic test. The underinflation advisories ranged from 24.0 to 24.8 psi (17 to 20 % pressure loss).
The underinflation warnings ranged from 14.6 to 16.0 psi (or 47 to 51 % pressure loss). Although
the advisory thresholds were at a pressure higher than expected, the tolerance on the range was tight
at <±0.5 psi. The warning thresholds were within a ±1 psi band around the targeted 15 psi lower
limit. The underinflation advisory was comprised of a single beep accompanied by the display
flashing every other second. At the onset of the underinflation warning, the single beep changed to a
distinctive double beep pattern.
6.2.5.5 System I Accuracy Test Results
System I required the “Target Pressure” to be set at installation. The underinflation advisory
threshold (Target Pressure) was user defined. Since system I rounded units to the nearest 5 psi, the
test vehicle’s placard pressure of 26 psi left two choices for the underinflation advisory pressure, 25
and 20 psi. When the advisory was set at 25 psi, the system produced a warning immediately since
68
26 psi was rounded to 25 psi. The first round of dynamic test at a 25 psi Target Pressure was erratic
and therefore thrown out. A second round of dynamic tests was completed with the Target Pressure
set at 20 psi. Since the underinflation warning was fixed at 20 psi, it was not clear of the system
would still give two notifications of underinflation or one. The results were that the system was
initially quiescent, but missed an underinflation advisory during the leak-down tests. The
underinflation advisory usually alerted from 22.0 to 19.7 psi (15 to 24 % low). The underinflation
warnings ranged from 19.4 to 15.1 psi (25 to 42 % low). System I had an additional warning to
indicate when the tire pressure was changing rapidly. This was beneficial during the leak-down
process, for it warned of a degrading situation even before the underinflation advisory activated. It
also warned again when the tire was being refilled. The audible warning was not very loud, and was
not audible over the hissing of the venting air pressure.
6.2.5.6 System J Accuracy Test Results
A cold placard pressure of 30 psi was entered for System J at the time of installation. The user can
set the underinflation advisory in 1 psi increments. This advisory has an optional temperature
compensation mode (on by default) that compensates the underinflation advisory activation
threshold for changes in temperature. The significant underinflation warning is fixed at 18 psi by the
manufacturer and is not temperature compensated. System J provided both warning levels during all
four tests. The default underinflation advisory threshold activated for pressures in the 20.0 to 25.0
psi (15 to 32 % loss) range. The underinflation warning activated for pressures in the 16.6 to 18.0
psi (40 to 45 % loss) range. The underinflation advisory consists of one long beep accompanied by a
flashing red lamp. The display designates the tire that is low and displays the current pressure. The
system alerted for the lowest tire if multiple tires were low. The underinflation warning consists of
the warning light, additional warning icons, and audible tone continually turning on and off. Again,
the lowest pressure and corresponding tire location were displayed on the screen.
6.2.6 PSB System Warning Preservation
Two methods were used to test the preservation of the underinflation notification status by the
pressure-sensor based systems. The Loaded High-Speed Test was performed to determine the effect
of tire heating (which raises internal pressure) on the systems preservation of the underinflation
advisory. The test consisted of continuous high-speed driving with one tire deflated to 2 psi below
69
the advisory activation level. The vehicles were loaded to gross vehicle weight and then driven for
22.5 miles (3 laps) around the HSTT at 75 mph.
In addition, at the end of the Loaded Dynamic Test, while the systems had the underinflation
warning active, a series of brake snubs were performed (the same as for the WSB systems). The
goal of this test was to see if the underinflation warning could be extinguished with a marginal
increase in tire pressure resulting from heavy stop-and-go driving. Had time permitted, the
preservation of both the advisory and the warning would have been evaluated using both the stop-
and go and high-speed methods.
6.2.6.1 System E Warning Preservation Test Results
System E maintained the advisory status during the Loaded Dynamic High-Speed Test. The system
also maintained the underinflation warning status during the brake snub heating segment of the
Loaded Dynamic Test. The system did clear both warnings itself after the low tire was manually
filled to its proper inflation level.
6.2.6.2 System F Warning Preservation Test Results
An initial pressure of 18 psi in the left rear tire was chosen for the High-Speed Test. Initially,
System F’s underinflation advisory was active and the receiver displayed 18 psi for the LR tire. The
vehicle was then driven on the HSTT at 75 mph (with the LR tire low) for about 10 minutes, when
the display updated the left rear pressure to 20 psi and cancelled the advisory. The vehicle was
driven for an additional 10 minutes to see if the display changed again, but it stayed the same.
System F did however maintain the underinflation warning during the brake snub sequence.
6.2.6.3 System G Warning Preservation Test Results
System G maintained the advisory status during the duration of the Loaded Dynamic High-Speed
Test. The system also maintained the underinflation warning status during the brake snub heating
segment of the Loaded Dynamic Test. The system did not clear either warning and required a
manual reset after the low tire was manually filled to its proper inflation level.
70

6.2.6.4 System H Warning Preservation Test Results
System H maintained the advisory status during the duration of the Loaded Dynamic High-Speed
Test. The system also maintained the underinflation warning status during the brake snub heating
segment of the Loaded Dynamic Test.
6.2.6.5 System I Warning Preservation Test Results
System I cleared the advisory during the high-speed run and cleared the warning during the brake
snub sequence. Enough heat was generated during the high speed driving and the brake snubs to
raise the pressure to the point that the warning cleared.
6.2.6.6 System J Warning Preservation Test Results
The test pressure for the Loaded Dynamic High Speed Test was 2 psi below the activation pressure
of the underinflation advisory. This pressure initially activated the underinflation warning. During
the high speed driving, System J changed from the underinflation warning to the underinflation
advisory. The system maintained the advisory for the duration of the test. The system also indicated
a high pressure advisory (∆ +5 psi) on a tire other than the one underinflated. For this test, the tires
that were properly inflated heated from around 30 to around 60°F. The underinflated tire rose from
around 30 to 78° F. System J maintained the underinflation warning during the brake snub tests.
6.2.7 PSB System Failure Effects
The System Failure Test was done after static and dynamic testing had been completed to insure that
the systems were properly installed and were functioning. Typically, the left front sensor was
removed from the wheel to see how the TPMS responded.
6.2.7.1 System E Failure Effects Test Results
On the test vehicle, the transmitter was removed from the LF wheel, then the pressure restored.
Upon moving the ignition key to the second position, the driver’s information panel displayed the
following warning, “TYREPRESS FRONT L.” and sounded a single “gong.” It had already
identified a problem with the pressure in the LF tire, but it made no indication as to the nature of the
problem. The test vehicle was driven on the HSTT for approximately nine minutes when the
warning cleared, again making a “gong” sound. It was driven for an additional 18 miles (at 60 mph)
with no new warnings. After returning to the preparation garage, the engine was turned off and the
71
key removed from the ignition switch. After a few minutes, the engine was restarted, but the
warning did not recur.
6.2.7.2 System F Failure Effects Test Results
A true evaluation of the System F’s response was not possible since it was a prototype system
connected to a laptop computer. The demonstration software on the computer displayed “N/S” to
show that no sensor transmissions were being received for that wheel. Since System F displays
“N/S” for all tires upon power-up, the ones failing to “check-in” remain in the “N/S’ mode. This
may not be indicative of system response in its original equipment application.
6.2.7.3 System G Failure Effects Test Results
System G unit did not identify a sensor that lost its battery completely, or that was somewhat
unscrewed so the battery became disconnected.
6.2.7.4 System H Failure Effects Test Results
The left front tire sensor was removed from the wheel. The tire was remounted, filled, and the
vehicle not moved for about 30 minutes. Then the vehicle was driven for over fifty miles at 60 mph
on the HSTT. It did not give any TPMS warnings (a sensor failure message “SF” was expected). It
did not identify that the sensor was missing from the vehicle. On a second test, the vehicle was
parked and a sensor was removed from a wheel. The tire was re-mounted and refilled to placard
pressure. When the vehicle was started, the display produced both audible and visual warning
second level alerts (LF & LO 00). This continued for 10 minutes before the screen blanked. No
more display activity was recorded for the next 30 minutes of driving (a single beep and a “SF”
message were expected). However, at the end of driving, the system status button was pressed and
the display read the expected “SF” and the LF icon remained illuminated.
6.2.7.5 System I Failure Effects Test Results
For System I, the sensor was removed late in the day, and the tire refilled for testing. The test was
run the following morning. When the display was powered up (and the vehicle moved to activate
the remaining three transmitters) the display gave correct tire pressures for the three, and indicated,
“FL 00 psi” for the missing sensor tire (but no warning audible warning sounded). The display
blanked after 10 seconds. The test vehicle was driven on the HSTT at 62 mph. The driver manually
72
prompted the display (pushed the “tire” button) every 4 to 6 minutes to see if the display had
changed. The display values followed the gradual changes of pressures of the three “transmitting”
tire, but still showed, “FL_00_” for the “missing sensor” tire. After driving approximately 40
minutes, a double beeping alert sounded, once a second, for 10 seconds. The loss of sensor data
warning “FL_Ser” flashed (once a second) on the display and continued while the vehicle was
refueled and driven back to the preparation garage. It was noted that although the audible warning
was audible over the sound of a low volume radio station, it was still hard to hear.
6.2.7.6 System J Failure Effects Test Results
On System J, when the LF sensor was removed from the wheel, the screen powered up blank (no
messages), but did indicate that it remembered that four tires should be out there (displayed four tires
on car picture). The steady red light was illuminated, indicating that the receiver had detected a
possible problem. As soon as the vehicle was moved, the display began to flash the flat tire symbol
and pressure of 0 psi. The vehicle was driven on for 14 minutes when the screen updated to a
“delta” & “E1” warning on the LF tire, indicating the sensor problem. Once the sensor was
reinstalled, System J automatically recognized the return of sensor signal and reset the system to
normal status.
73
7.0 HUMAN FACTORS ASSESSMENT OF EXISTING TPMS DRIVER INTERFACES
7.1 Method For Examination of TPMS Driver Interfaces
Driver interfaces for existing tire pressure monitoring systems were examined. Visual and audible
information displays were characterized in terms of the following:
• Type of information displayed (status, tire pressure, advisory, warning, and system failure)
• Level of detail of information presented (“a tire is low” vs. “left front tire is low” vs. “left
front tire is low by 6 psi”)
• Method of information display (display type, characteristics)
• Conditions of information display (message threshold, information presentation interval,
message timing)
• Purpose and type of manual controls (if any)
Information presentation methods were observed through static and dynamic tests in which low tire
pressure messages were triggered for each system. Digital still photos and video were recorded to
document interface features and to capture warning presentation methods. System documentation
provided by the tire pressure monitoring system manufacturer or by the vehicle manufacturer (for
OEM systems) was reviewed to better understand their function, operation, and system features.
7.2 Overview of Existing Systems
Table 7.1 summarizes the characteristics of commercial and prototype TPMS driver interfaces
examined. Details are provided regarding number of warning levels, type of information presented,
method of information presentation, and system features.
74
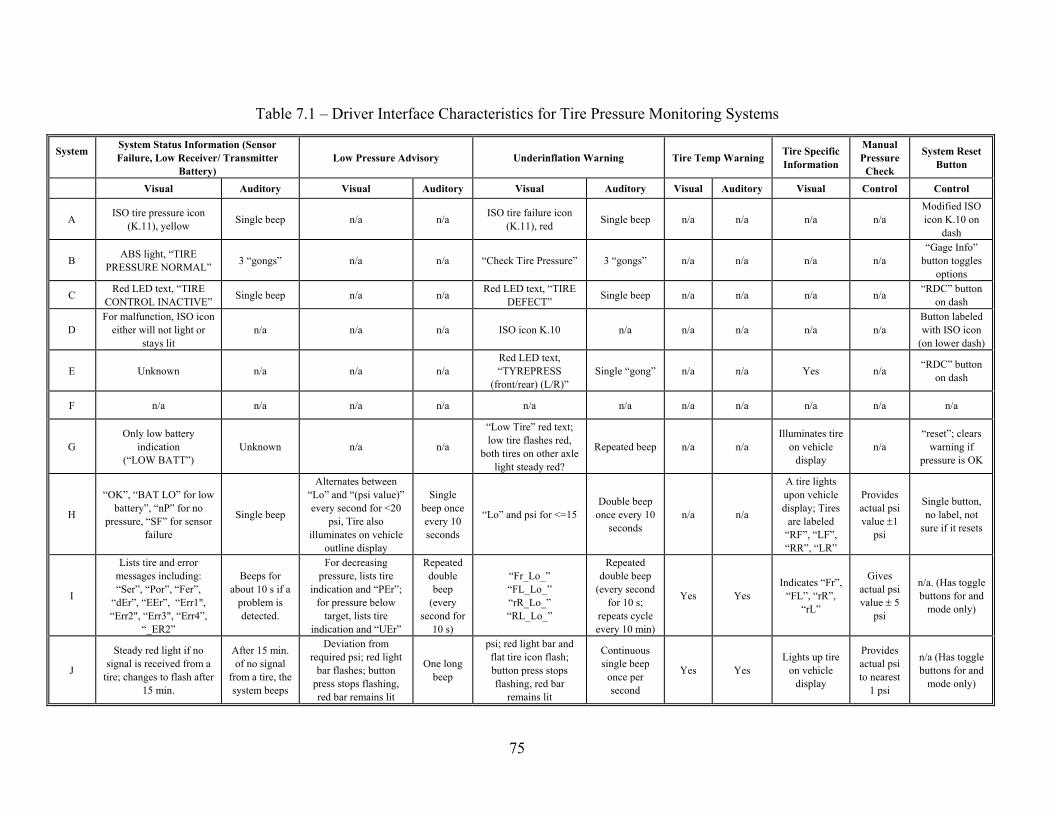
Table 7.1 – Driver Interface Characteristics for Tire Pressure Monitoring Systems
System System Status Information (Sensor Failure, Low Receiver/ Transmitter
Battery) Low Pressure Advisory Underinflation Warning Tire Temp Warning Tire Specific
Information
Manual Pressure
Check
System Reset Button
Visual Auditory Visual Auditory Visual Auditory Visual Control
A ISO tire pressure icon (K.11), yellow Single beep n/a n/a ISO tire failure icon
(K.11), red Single beep n/a n/a n/a n/a Modified ISO icon K.10 on
dash
B ABS light, “TIRE PRESSURE NORMAL” 3 “gongs” n/a n/a “Check Tire Pressure” 3 “gongs” n/a n/a n/a n/a
“Gage Info” button toggles
options
C Red LED text, “TIRE CONTROL INACTIVE” Single beep n/a n/a Red LED text, “TIRE
DEFECT” Single beep n/a n/a n/a n/a “RDC” button on dash
D For malfunction, ISO icon
either will not light or stays lit
n/a n/a n/a ISO icon K.10 n/a n/a n/a n/a n/a Button labeled with ISO icon
(on lower dash)
E Unknown n/a n/a Red LED text, “TYREPRESS
(front/rear) (L/R)” Single “gong” n/a n/a Yes n/a “RDC” button
on dash
F n/a n/a n/a n/a n/a n/a n/a n/a n/a
G Only low battery
indication (“LOW BATT”)
Unknown n/a
“Low Tire” red text; low tire flashes red,
both tires on other axle light steady red?
Repeated beep n/a n/a Illuminates tire
on vehicle display
n/a “reset”; clears
warning if pressure is OK
H
“OK”, “BAT LO” for low battery”, “nP” for no
pressure, “SF” for sensor failure
Single beep
Alternates between “Lo” and “(psi value)” every second for <20
psi, Tire also illuminates on vehicle
outline display
Single beep once every 10 seconds
“Lo” and psi for <=15 Double beep
once every 10 seconds
n/a n/a
A tire lights upon vehicle display; Tires
are labeled “RF”, “LF”, “RR”, “LR”
Provides actual psi value ±1
psi
Single button, no label, not
sure if it resets
I
Lists tire and error messages including: “Ser”, “Por”, “Fer”,
“dEr”, “EEr”, Err1", “Err2", “Err3", “Err4”,
“_ER2”
Beeps for about 10 s if a
problem is detected.
For decreasing pressure, lists tire
indication and “PEr”; for pressure below
target, lists tire indication and “UEr”
Repeated double beep
(every second for
10 s)
“Fr_Lo_” “FL_Lo_” “rR_Lo_” “RL_Lo_”
Repeated double beep
(every second for 10 s;
repeats cycle every 10 min)
Yes Yes Indicates “Fr”,
“FL”, “rR”, “rL”
Gives actual psi value ± 5
psi
n/a. (Has toggle buttons for and
mode only)
J
Steady red light if no signal is received from a
tire; changes to flash after 15 min.
After 15 min. of no signal
from a tire, the system beeps
Deviation from required psi; red light
bar flashes; button press stops flashing, red bar remains lit
One long beep
psi; red light bar and flat tire icon flash; button press stops flashing, red bar
remains lit
Continuous single beep
once per second
Yes Yes Lights up tire
on vehicle display
Provides actual psi to nearest
1 psi
n/a (Has toggle buttons for and
mode only)
Visual Auditory Control
n/a
n/a n/a
n/a
“
75
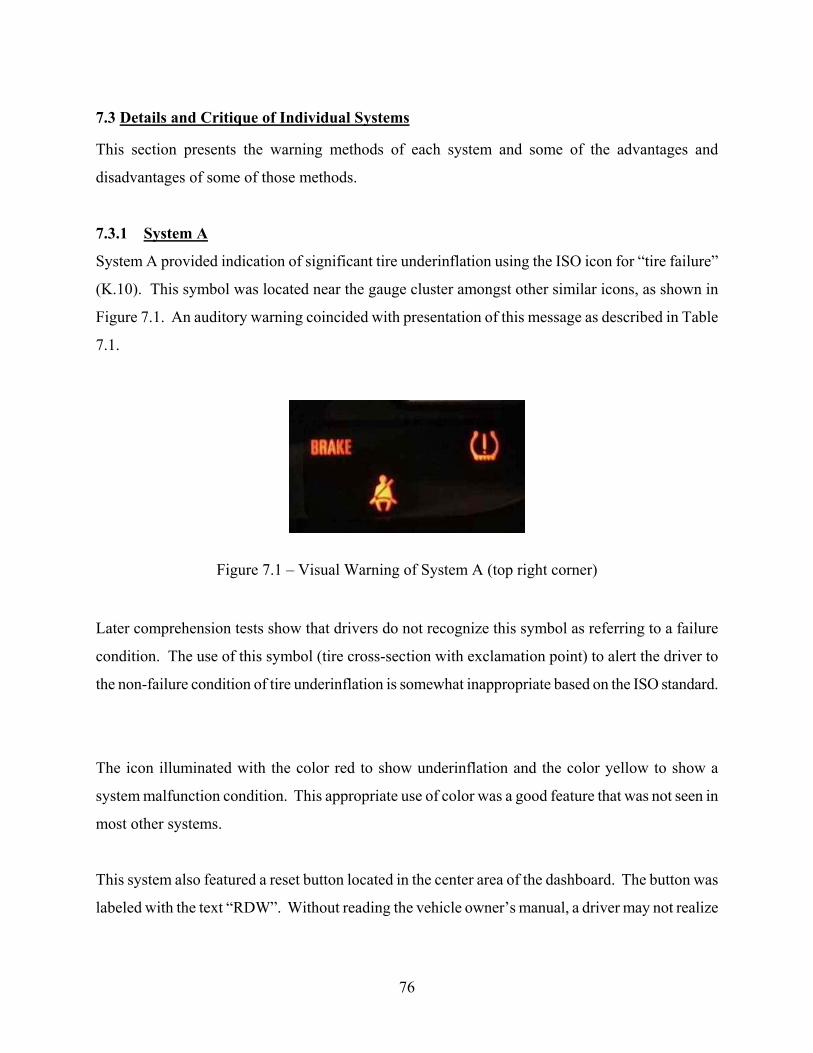
7.3 Details and Critique of Individual Systems
This section presents the warning methods of each system and some of the advantages and
disadvantages of some of those methods.
7.3.1 System A
System A provided indication of significant tire underinflation using the ISO icon for “tire failure”
(K.10). This symbol was located near the gauge cluster amongst other similar icons, as shown in
Figure 7.1. An auditory warning coincided with presentation of this message as described in Table
7.1.
Figure 7.1 – Visual Warning of System A (top right corner)
Later comprehension tests show that drivers do not recognize this symbol as referring to a failure
condition. The use of this symbol (tire cross-section with exclamation point) to alert the driver to
the non-failure condition of tire underinflation is somewhat inappropriate based on the ISO standard.
The icon illuminated with the color red to show underinflation and the color yellow to show a
system malfunction condition. This appropriate use of color was a good feature that was not seen in
most other systems.
This system also featured a reset button located in the center area of the dashboard. The button was
labeled with the text “RDW”. Without reading the vehicle owner’s manual, a driver may not realize
76
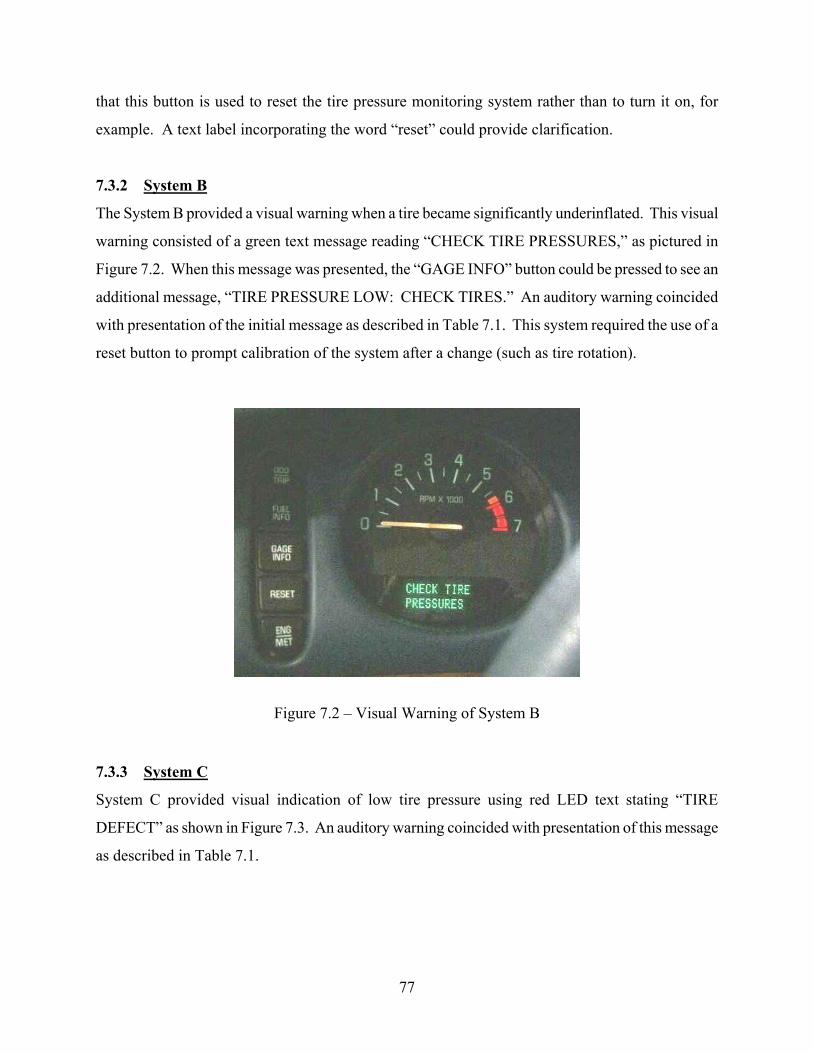
that this button is used to reset the tire pressure monitoring system rather than to turn it on, for
example. A text label incorporating the word “reset” could provide clarification.
7.3.2 System B
The System B provided a visual warning when a tire became significantly underinflated. This visual
warning consisted of a green text message reading “CHECK TIRE PRESSURES,” as pictured in
Figure 7.2. When this message was presented, the “GAGE INFO” button could be pressed to see an
additional message, “TIRE PRESSURE LOW: CHECK TIRES.” An auditory warning coincided
with presentation of the initial message as described in Table 7.1. This system required the use of a
reset button to prompt calibration of the system after a change (such as tire rotation).
Figure 7.2 – Visual Warning of System B
7.3.3 System C
System C provided visual indication of low tire pressure using red LED text stating “TIRE
DEFECT” as shown in Figure 7.3. An auditory warning coincided with presentation of this message
as described in Table 7.1.
77
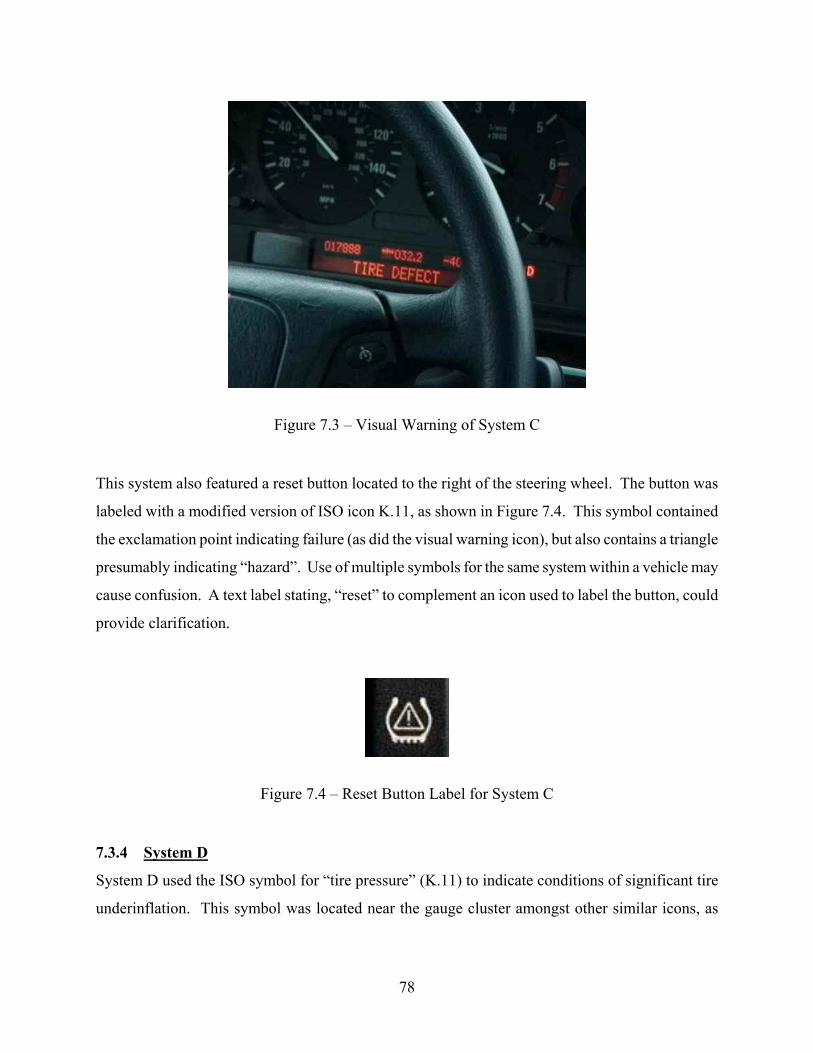
Figure 7.3 – Visual Warning of System C
This system also featured a reset button located to the right of the steering wheel. The button was
labeled with a modified version of ISO icon K.11, as shown in Figure 7.4. This symbol contained
the exclamation point indicating failure (as did the visual warning icon), but also contains a triangle
presumably indicating “hazard”. Use of multiple symbols for the same system within a vehicle may
cause confusion. A text label stating, “reset” to complement an icon used to label the button, could
provide clarification.
Figure 7.4 – Reset Button Label for System C
7.3.4 System D
System D used the ISO symbol for “tire pressure” (K.11) to indicate conditions of significant tire
underinflation. This symbol was located near the gauge cluster amongst other similar icons, as
78
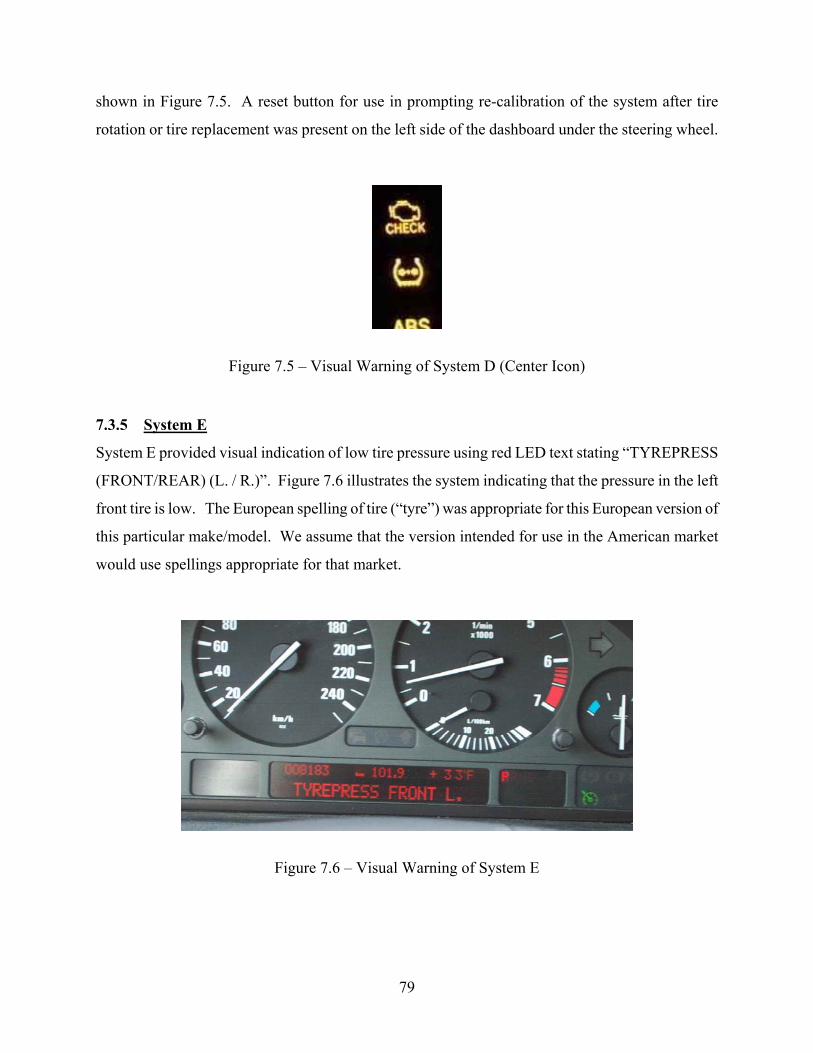
shown in Figure 7.5. A reset button for use in prompting re-calibration of the system after tire
rotation or tire replacement was present on the left side of the dashboard under the steering wheel.
Figure 7.5 – Visual Warning of System D (Center Icon)
7.3.5 System E
System E provided visual indication of low tire pressure using red LED text stating “TYREPRESS
(FRONT/REAR) (L. / R.)”. Figure 7.6 illustrates the system indicating that the pressure in the left
front tire is low. The European spelling of tire (“tyre”) was appropriate for this European version of
this particular make/model. We assume that the version intended for use in the American market
would use spellings appropriate for that market.
Figure 7.6 – Visual Warning of System E
79
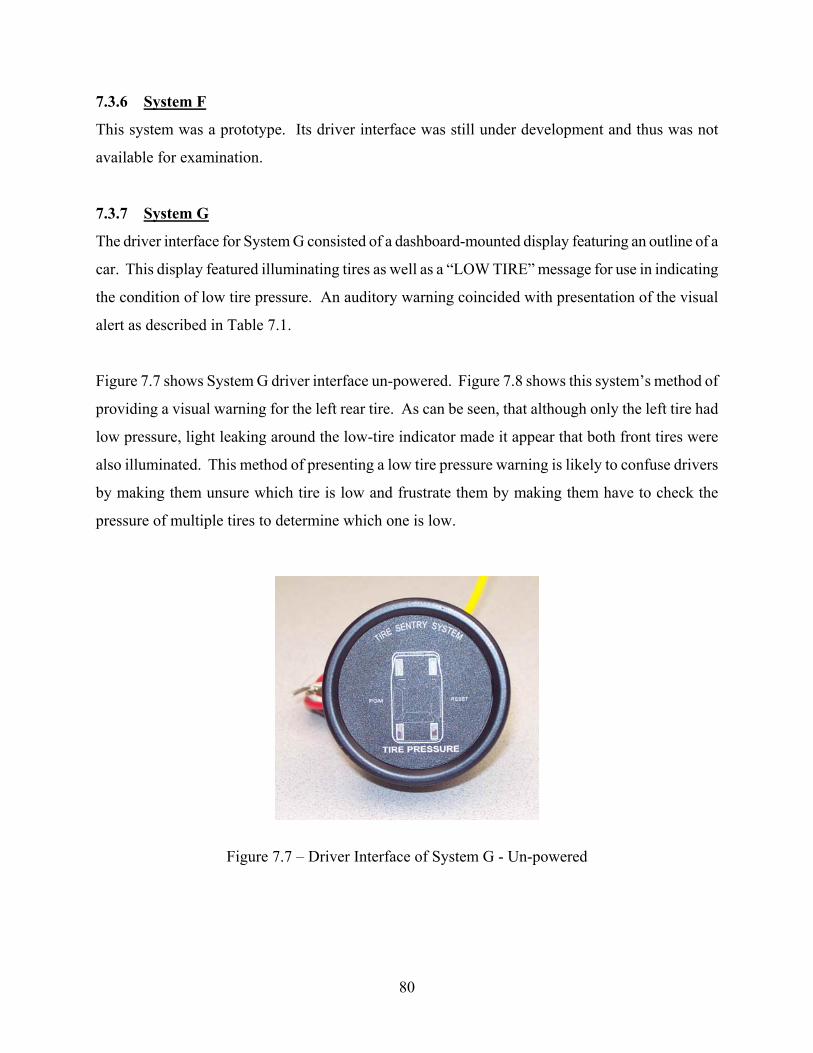
7.3.6 System F
This system was a prototype. Its driver interface was still under development and thus was not
available for examination.
7.3.7 System G
The driver interface for System G consisted of a dashboard-mounted display featuring an outline of a
car. This display featured illuminating tires as well as a “LOW TIRE” message for use in indicating
the condition of low tire pressure. An auditory warning coincided with presentation of the visual
alert as described in Table 7.1.
Figure 7.7 shows System G driver interface un-powered. Figure 7.8 shows this system’s method of
providing a visual warning for the left rear tire. As can be seen, that although only the left tire had
low pressure, light leaking around the low-tire indicator made it appear that both front tires were
also illuminated. This method of presenting a low tire pressure warning is likely to confuse drivers
by making them unsure which tire is low and frustrate them by making them have to check the
pressure of multiple tires to determine which one is low.
Figure 7.7 – Driver Interface of System G - Un-powered
80
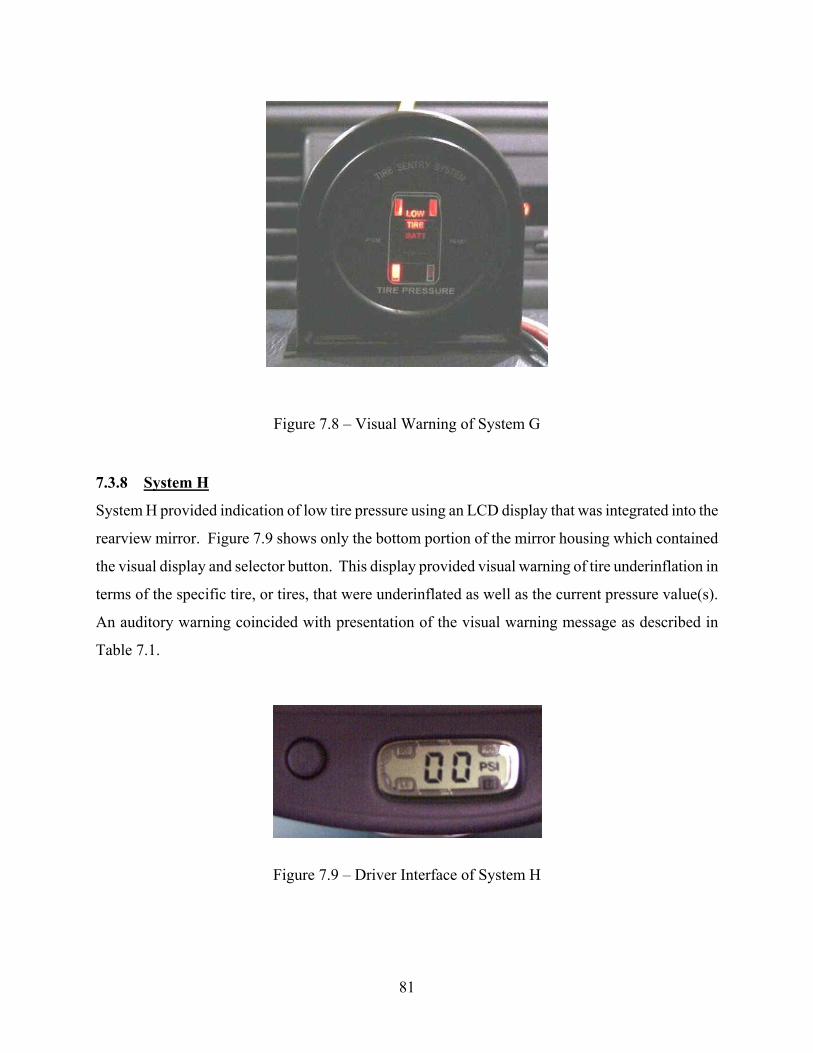
Figure 7.8 – Visual Warning of System G
7.3.8 System H
System H provided indication of low tire pressure using an LCD display that was integrated into the
rearview mirror. Figure 7.9 shows only the bottom portion of the mirror housing which contained
the visual display and selector button. This display provided visual warning of tire underinflation in
terms of the specific tire, or tires, that were underinflated as well as the current pressure value(s).
An auditory warning coincided with presentation of the visual warning message as described in
Table 7.1.
Figure 7.9 – Driver Interface of System H
81
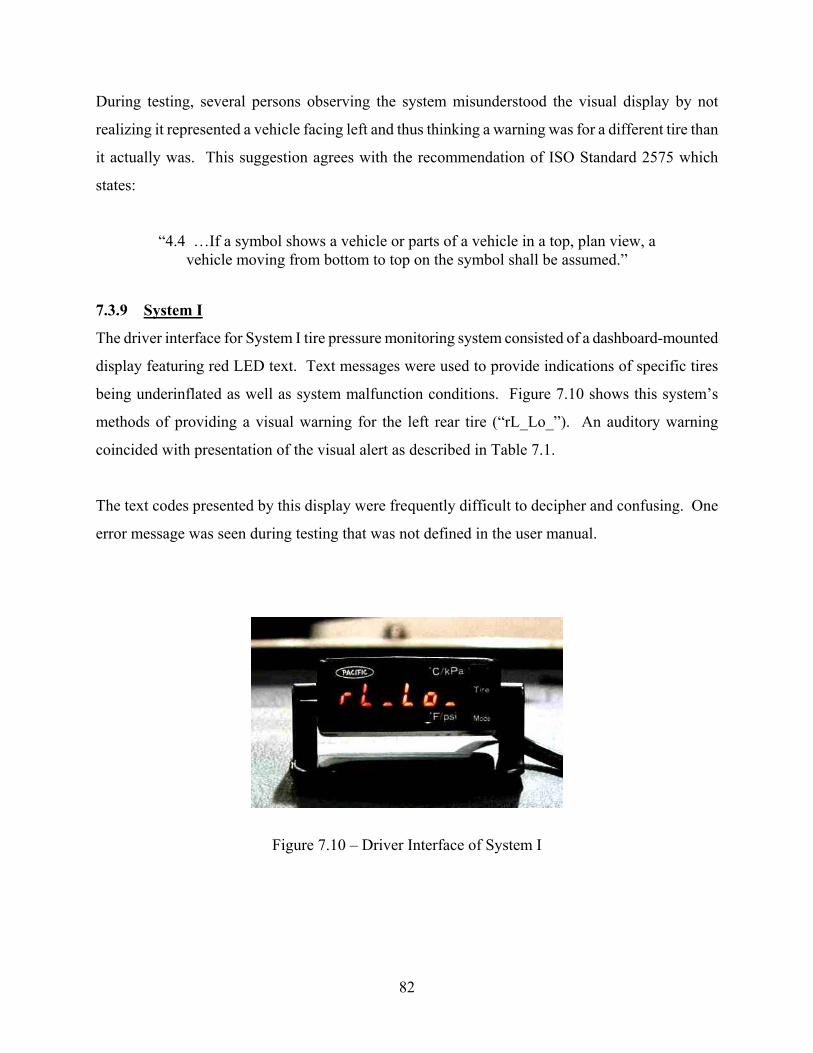
During testing, several persons observing the system misunderstood the visual display by not
realizing it represented a vehicle facing left and thus thinking a warning was for a different tire than
it actually was. This suggestion agrees with the recommendation of ISO Standard 2575 which
states:
“4.4 …If a symbol shows a vehicle or parts of a vehicle in a top, plan view, a vehicle moving from bottom to top on the symbol shall be assumed.”
7.3.9 System I
The driver interface for System I tire pressure monitoring system consisted of a dashboard-mounted
display featuring red LED text. Text messages were used to provide indications of specific tires
being underinflated as well as system malfunction conditions. Figure 7.10 shows this system’s
methods of providing a visual warning for the left rear tire (“rL_Lo_”). An auditory warning
coincided with presentation of the visual alert as described in Table 7.1.
The text codes presented by this display were frequently difficult to decipher and confusing. One
error message was seen during testing that was not defined in the user manual.
Figure 7.10 – Driver Interface of System I
82

7.3.10 System J
In this evaluation the optional Full Function System J Display was evaluated rather than the basic
system. The driver interface for System J consisted of a dashboard-mounted display featuring a
green backlit LCD panel. This display contained an outline of a vehicle as well as a numeric value
used to present tire pressure and temperature information. Low tire pressure warnings were
presenting by illuminating a flat tire symbol on the LCD panel as well as illuminating (on the vehicle
outline display) the tire that was low. A red LED “alarm light” bar above the LCD display also
illuminated to emphasize the presence of a warning. A numeric display presented tire pressure and
temperature values in either English or metric units. A triangular “alert indicator” illuminated any
time the actual pressure of the tire deviated from the required pressure by more than the preset
(driver selectable) level. This alert indicator also illuminated when the temperature from a
transmitter exceeded the programmed setting. Figure 7.11 shows this display indicating a 0 psi
value for the left rear tire (left image) and a significant underinflation warning for the right front tire
(right image). An auditory warning coincided with presentation of the visual warning information as
described in Table 7.1. This system could accommodate up to 20 sensors for monitoring of up to 20
tires at once. However, the driver display could only present warnings for 10 sensors on the screen.
For a vehicle with more than 10 tires, the driver would have to press a button to switch the display
between the first 10 tires and the remaining tires.
Figure 7.11 – Driver Interface of System J
As stated previously, ISO recommends that in using a top-view vehicle symbol, as in this system, the
front of the vehicle should be pointed upward, as this may increase the likelihood that the driver will
83
recognize the correct wheel that the warning is associated with. In addition, this display was found
to be difficult to read outdoors due to glare.
7.4 Discussion of Tire Pressure Information Presentation Issues
7.4.1 Type of Information Displayed
All systems provided visual indication of significant underinflation of one or more tires. All but one
system provided an audible signal to accompany the visual indication of significant tire
underinflation. Some systems also provided an underinflation advisory for less severe conditions of
underinflation (as defined by the manufacturer).
7.4.2 Level of Detail of Tire Pressure Information Presented
Various levels of detail of tire condition (e.g., “a tire is low” vs. “left front tire is low” vs. “left front
tire is low by 6 psi”) information were seen in the systems examined. All six of the PSB systems
had the capability to inform the driver of low inflation for one or more specific tires. This
information was provided either graphically, through illumination of a tire on a vehicle illustration,
or textually using codes to refer to a specific tire (e.g., LR for left rear). Tire-specific inflation
information may be useful since the driver would be able to identify the underinflated tire(s) without
having to check all four tires.
7.4.2.1 Presentation of Actual Pressure or Relative Pressure Information
If a TPMS has the ability to compensate tire pressure readings according to ambient temperature,
relative pressure information can be provided to the driver. Drivers could be presented with the
exact value of psi offset from the recommended pressure at any point in time. Many vehicles
currently on the market provide the driver with an indication of the ambient temperature outside the
vehicle. This information could be fed into the TPMS allowing pressure readings to be adjusted
according to outside temperature, which should result in more accurate inflation levels.
Temperature compensation in a TPMS is a feature that may be most helpful in preventing driver
confusion relating to the operation of the system. For example, it is possible that a driver could
leave their home with their vehicle’s tire pressure at a somewhat underinflated level (say 4 psi low),
but after driving for some time, the tire is heated therefore increasing the pressure within the tire to
the recommended pressure. However, with the tire heated, the value of the recommended pressure,
84
given the tire heating, is now actually insufficient. If the vehicle were equipped a TPMS that
compensated for temperature, the system would initially tell the driver that the tire was 4 psi low and
would continue to report that the tire was 4 psi low even after driving for some time and heating the
tire. Thus, providing temperature compensation as a feature of the TPMS will provide more
accurate information to the driver and may prevent confusion caused by changes in tire pressure
readings with tire heating.
Additional information regarding temperature compensation is provided in Section 9.2.
7.4.3 Levels of Warnings
In addition to providing an underinflation warning, systems can provide an additional service to the
driver by alerting them when the tire pressure is low (but not significantly underinflated). This
would give the driver more opportunity to address the situation and prevent excessive wear on the
tire. These low-pressure advisories, however, should not be annoying to the driver (e.g., possibly by
minimizing the use of auditory signals). The alerts should be easily distinguishable from the
underinflation warnings. An automobile manufacturer that has experience with TPMS
recommended a 6 psi margin between placard pressure and the underinflation advisory to limit false
warnings.
Alerting a driver to the condition of overinflation may also be beneficial. Overinflation causes
excessive wear to the center of the tread pattern and shorter tire life. This condition is not known to
be dangerous; however, avoiding overinflation and ensuring expected tire life would increase
consumer satisfaction. Since overinflation is not known to present the same danger that
underinflation does, a different visual display should be used to indicate overinflation.
7.4.4 Method of Tire Pressure Information Display
The system should communicate the condition of tire underinflation clearly. The system should
continue to provide alerts to the driver at intervals to ensure that the situation is remedied within a
reasonable time frame. A visual alert may remain constant until a condition of underinflation is
remedied; however, auditory signals should not be continuous in order to not become a nuisance.
85
Presentation of the visual warning may take various forms. Two specific methods of warning
communication are described below.
7.4.4.1 Icon for Communication of Tire Underinflation
ISO recommends the use of an exclamation point to indicate failure as evidenced by a number of
icons contained in ISO Standard 2575 (2000). Since tire pressure monitoring systems do not
indicate failure of a tire, only low pressure, it seems inappropriate to use a failure symbol as a
method of visual warning of tire underinflation. Consistency of the presentation of visual warnings
for a new system, such as TPMS, is important to assist in drivers’ familiarization with the system
and the type of information they present. Section 8.3 discusses use of different icons to present
visual warnings for tire underinflation and presents some recommendations.
7.4.4.2 Vehicle Display Orientation
Although communicating that a tire is low may not be critical information that requires a quick
response from the driver, providing information in a format that is not confusing to the driver is still
important. This leads to the suggestion that if the system has a visual display consisting of a vehicle
outline with indications of tire locations for provision or low pressure warnings, this vehicle should
be oriented “hood up” so as to prevent confusion as to which tire has a problem. This suggestion
agrees with ISO Standard 2575 (2000) which states, “…If a symbol shows a vehicle or parts of a
vehicle in a top, plan view, a vehicle moving from bottom to top on the symbol shall be assumed.”
7.4.4.3 Auditory Warnings for Tire Underinflation
Overall, 3 of the 10 systems examined provided auditory low-pressure advisories and 8 provided
auditory warnings of underinflation. These auditory signals were generally useful and helped ensure
that the driver would notice the advisory or warning when it was presented (in some cases, visual
only signals were not noticed by the driver during testing). The use of short tones rather than
continuous signals was considered to be a favorable attribute of most systems examined.
Auditory signals, although important to the communication of warnings, were not investigated
further to develop a specific recommendation (as was done with icons) due to time constraints. As a
result, recommendations for specific characteristics of preferred auditory warnings for TPMS are not
86
provided here. Auditory warnings, if implemented, should be used for conditions requiring
immediate attention from the driver in an effort to avoid them being perceived as a nuisance.
7.5 Discussion of Issues Regarding Other Types of TPMS Information and Interface Issues
7.5.1 Tire Temperature Information
Two of the six PSB systems also provided an indication of when a tire exceeded its acceptable
operating temperature. Tires can reach higher temperatures when they are underinflated, thus in
some cases, warning of high temperature is redundant information. However, temperature
information can be important in cases where the tire is properly inflated but the vehicle is loaded
more heavily than the tire is designed to accommodate. The excessive tire heat that may be
generated from overloading can contribute to tread separation. Thus providing tire temperature
alerts can be a useful safety feature.
7.5.2 System Status Information
All systems provided some indication of when the system was not functioning properly due to a
malfunction or other problem. Some systems that used a dashboard icon as a sole visual warning
display presented both warnings and system malfunctions in the same manner. To prevent
confusion, it is best to present these two conditions (malfunction and warning) by distinctly different
methods (e.g., different display color). Additional features that would be helpful to the driver would
include providing visual indication that the system is functioning properly as well as visual
indication of fault conditions.
7.5.3 Manual Controls
Some TPMS examined contained controls for programming and resetting the system (e.g., after tire
rotation). Reset controls should be clearly labeled with a recognizable symbol or text and do not
need to be positioned prominently on the dashboard since they will be infrequently needed or used.
Similarly, programming controls should only be needed when setting up the system or making a
configuration change. However, some systems provide the driver with the ability to check the status
of each tire in turn by pressing a button repeatedly to switch between the tires. The ability to check
a tire’s status on command may be useful to drivers and provide them with extra comfort and
87
assurance in the event that a change in the feel of the vehicle makes them curious as to the condition
of the tires.
7.6 Discussion of TPMS Operation Issues That Relate to the Driver
7.6.1 Is Static Pressure Measurement Needed?
Some TPMS do not have the ability to provide tire pressure readings while the vehicle has been
started but is still stationary. If all tire sensors in a TPMS have the ability to statically determine tire
pressure and warn of low pressure before the vehicle is moving (i.e., ignition triggered instead of
rotation triggered), the situation of someone driving more than a mile down the road on an almost
flat tire before a system starts transmitting can be avoided.
7.6.2 Need for Automatic Sensor Location and Automatic Setup
In order to provide tire-specific information (e.g., the left front tire is low), the TPMS needs to be
able to distinguish between the different tire locations. This means that when the tires are rotated,
the TPMS will either have to detect the new locations of the pressure sensors or be told of those
locations. Relying on drivers to correctly program their TPMS each time the tires are rotated may be
asking too much. Systems that automatically recognize the new locations of sensors and require
only minimal, if any, driver interaction to set up the system would be most convenient for the
consumer and could promote proper system operation.
7.7 Driver Interface Summary
This section examined the driver interfaces of several TPMS. The following recommendations are a
summary of the findings discussed earlier:
The telltale icon must be one that the driver will recognize
If a vehicle icon is used, the vehicle’s front end should point upward
There should be a system malfunction indicator
The system's reset button should be labeled as “reset”
If text messages are used, they must not be abbreviated to the point at which they cannot be
understood by the driver
Auditory signals are useful in presenting urgent information, but must not become nuisances
The following suggestions are features that would be useful to the driver:
88
Tire-specific information that would let the driver know which tire is low
A way to individually display the pressure at each tire
An alert when the tire is running hot
Most of the variation seen between interfaces examined in this effort was confined to aftermarket
systems. Original equipment systems mainly consisted of icon or text displays for presentation of
visual warnings. Since the focus of this work is to provide recommendations for original equipment
systems, the following section focuses on the selection of an appropriate visual warning for use by
an OEM TPMS to alert drivers to the condition of significant underinflation. Despite the fact that
these recommendations are intended for original equipment TPMS, aftermarket systems could also
benefit from this information.
89

8.0 INVESTIGATION OF TPMS ICONS
To support development of a minimum performance standard for TPMS, which would include
specification of an icon to warn drivers of significant tire underinflation, existing ISO icons and
alternative icons were examined for their ability to communicate this message.
8.1 Description of Existing ISO Tire Pressure Symbols
ISO Icons K.10 and K.11 (shown in Table 8.1) are currently used in some vehicles to alert the driver
that one or more tires on the vehicle are significantly underinflated. The symbols include a tire
profile (cutaway view of a tire) and a message relating to tires, e.g. tire pressure, tire failure, etc.
Table 8.1 – ISO Tire Pressure Icons Tested
ISO Icon
Tire Pressure (K.11)
Tire Failure (K.10)
Investigation of the history of the ISO tire icons did not produce any indications that the icon had
been tested for comprehension. It is possible that the tire symbol was borrowed from the German
DIN standard. Informal reactions of numerous persons to these icons suggest that they are not well
understood. The perspective of a tire image as portrayed in the icons is not likely to be readily
visualized and thus understood by the average driver. Therefore, a study was performed to assess
the comprehensibility of the two ISO tire icons.
90
8.2 Methods for Development and Testing Alternative Tire Pressure Icons
In an effort to develop recommendations for methods of presenting tire pressure warning
information, NHTSA examined existing ISO icons and investigated several alternative icons for “tire
pressure”. This research focused on testing icons for alerting drivers to the condition of significant
tire underinflation, which requires immediate attention, but assumed that this icon would also be
used as part of the lower-level advisory warning as well. The possibility of providing tire-specific
underinflation information was not ruled out. The remainder of this section documents these efforts
to assess methods of providing tire underinflation information to drivers through use of a visual
symbol. Auditory signals, although important to the communication of warnings, are not discussed
in this paper.
8.3 Identification of Alternative Tire Pressure Warning Icons
An examination of the driver interfaces for existing tire pressure monitoring systems found a number
of different methods in use for providing information to drivers regarding tire underinflation. Visual
indications of significant tire underinflation were provided using in some cases K.10 and K.11 (both
to indicate low tire pressure, not tire failure), red LED text (e.g., “tire defect”, “Lo”, “Fr_Lo_”), and
a few different types of vehicle images with the ability to indicate that a specific tire, or tires, was
underinflated. Some systems provided two levels of warning, an indication of low tire pressure and
an indication of significant underinflation.
Candidate icons for use in presenting tire pressure warning information were developed through
informal production tests in which research staff produced drawings to represent tire underinflation,
examination of existing systems, and review of relevant literature. Four icon versions were
developed which all made use of the side image of a tire mounted on a wheel, as shown in Table 8.2.
Icon versions “Flat 1” and “Flat 2” were variations of an icon presented in Green (1979), which
differed only in the way that the flat part of the tire and ground were depicted. [12] Each of the four
versions was drawn with three different wheel designs to permit assessment of which would be most
recognizable as a wheel. Another icon was developed which consisted of a top view line drawing of
a vehicle with one tire shaded (indicating a warning associated with that tire). These alternative
icons were tested along with the ISO icon K.11 (version with filled in arrows) (ISO 2575)
representing “tire pressure”. [13] ISO icon K.10, representing “tire failure” was also tested to
91
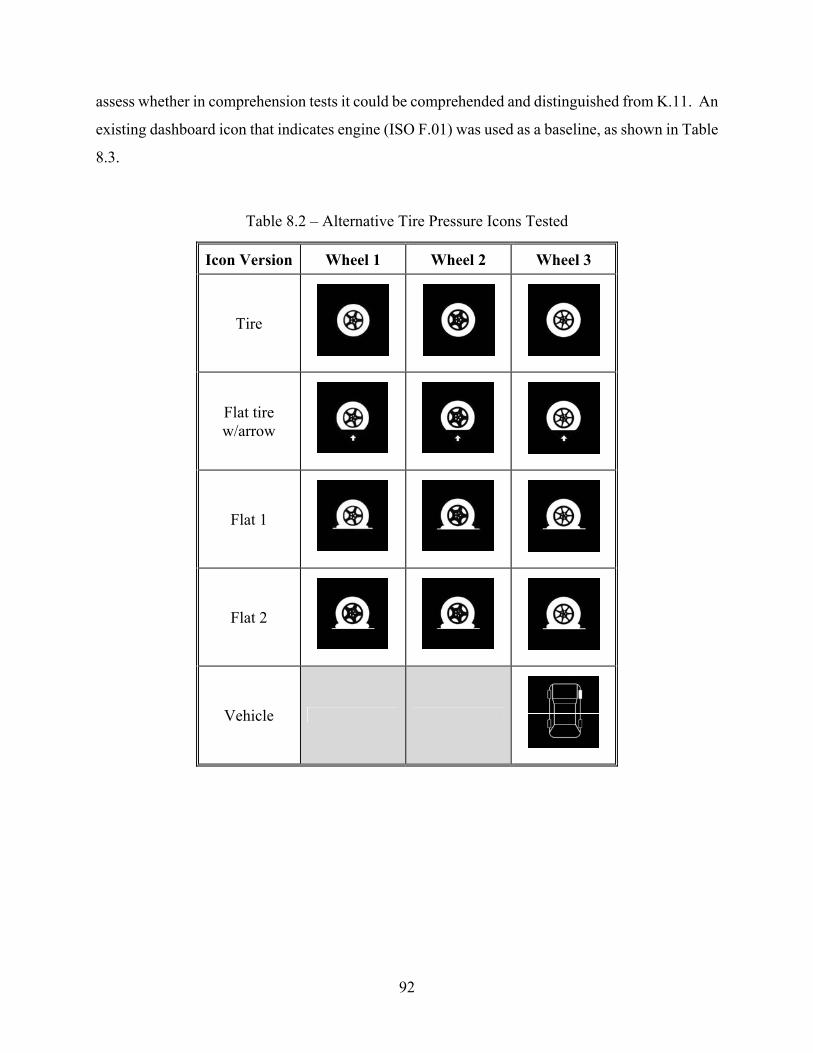
assess whether in comprehension tests it could be comprehended and distinguished from K.11. An
existing dashboard icon that indicates engine (ISO F.01) was used as a baseline, as shown in Table
8.3.
Table 8.2 – Alternative Tire Pressure Icons Tested
Icon Version Wheel 1 Wheel 2 Wheel 3
Tire
Flat tire w/arrow
Flat 1
Flat 2
Vehicle
92
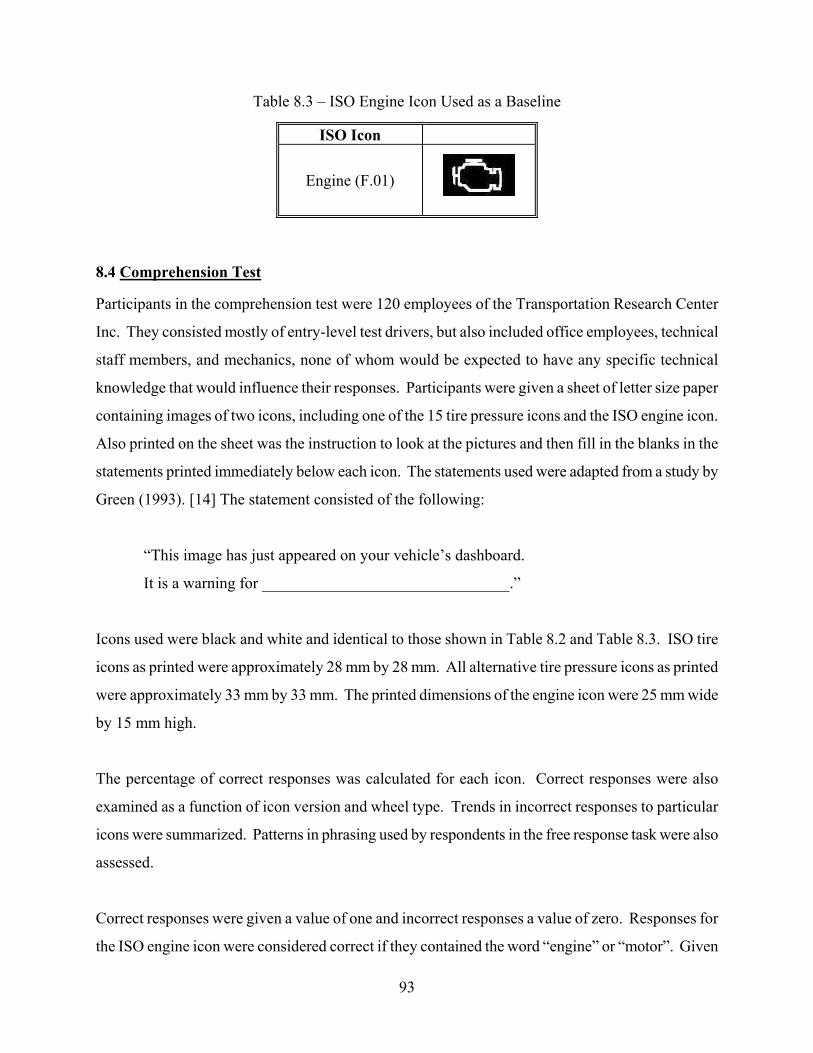
Table 8.3 – ISO Engine Icon Used as a Baseline
ISO Icon
Engine (F.01)
8.4 Comprehension Test
Participants in the comprehension test were 120 employees of the Transportation Research Center
Inc. They consisted mostly of entry-level test drivers, but also included office employees, technical
staff members, and mechanics, none of whom would be expected to have any specific technical
knowledge that would influence their responses. Participants were given a sheet of letter size paper
containing images of two icons, including one of the 15 tire pressure icons and the ISO engine icon.
Also printed on the sheet was the instruction to look at the pictures and then fill in the blanks in the
statements printed immediately below each icon. The statements used were adapted from a study by
Green (1993). [14] The statement consisted of the following:
“This image has just appeared on your vehicle’s dashboard.
It is a warning for _______________________________.”
Icons used were black and white and identical to those shown in Table 8.2 and Table 8.3. ISO tire
icons as printed were approximately 28 mm by 28 mm. All alternative tire pressure icons as printed
were approximately 33 mm by 33 mm. The printed dimensions of the engine icon were 25 mm wide
by 15 mm high.
The percentage of correct responses was calculated for each icon. Correct responses were also
examined as a function of icon version and wheel type. Trends in incorrect responses to particular
icons were summarized. Patterns in phrasing used by respondents in the free response task were also
assessed.
Correct responses were given a value of one and incorrect responses a value of zero. Responses for
the ISO engine icon were considered correct if they contained the word “engine” or “motor”. Given
93
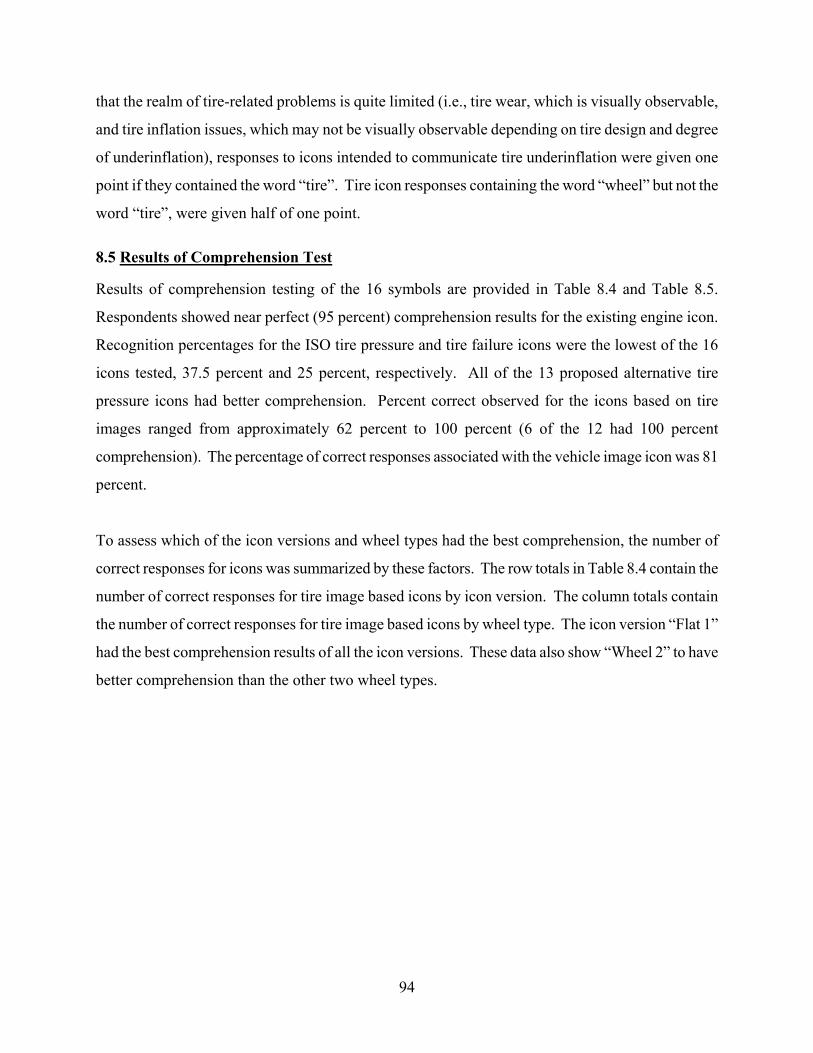
that the realm of tire-related problems is quite limited (i.e., tire wear, which is visually observable,
and tire inflation issues, which may not be visually observable depending on tire design and degree
of underinflation), responses to icons intended to communicate tire underinflation were given one
point if they contained the word “tire”. Tire icon responses containing the word “wheel” but not the
word “tire”, were given half of one point.
8.5 Results of Comprehension Test
Results of comprehension testing of the 16 symbols are provided in Table 8.4 and Table 8.5.
Respondents showed near perfect (95 percent) comprehension results for the existing engine icon.
Recognition percentages for the ISO tire pressure and tire failure icons were the lowest of the 16
icons tested, 37.5 percent and 25 percent, respectively. All of the 13 proposed alternative tire
pressure icons had better comprehension. Percent correct observed for the icons based on tire
images ranged from approximately 62 percent to 100 percent (6 of the 12 had 100 percent
comprehension). The percentage of correct responses associated with the vehicle image icon was 81
percent.
To assess which of the icon versions and wheel types had the best comprehension, the number of
correct responses for icons was summarized by these factors. The row totals in Table 8.4 contain the
number of correct responses for tire image based icons by icon version. The column totals contain
the number of correct responses for tire image based icons by wheel type. The icon version “Flat 1”
had the best comprehension results of all the icon versions. These data also show “Wheel 2” to have
better comprehension than the other two wheel types.
94

Table 8.4 – Comprehension Test Results by Icon, Results for Wheel-based Icons
Wheel 1 Wheel 2 Wheel 3 Total
Icon
Version Points
Percent
Correct Points
Percent
Correct Points
Percent
Correct Points
Percent
Correct
Tire 5.5/8 69 % 8/8 100 % 5/8 63 % 18.5/24 77 %
Flat tire
w/arrow 7/8 88 % 8/8 100 % 6/8 75 % 21/24 88 %
Flat 1 8/8 100 % 8/8 100 % 7/8 88 % 23/24 96 %
Flat 2 8/8 100 % 8/8 100 % 5/8 63 % 21/24 88 %
Total 28.5/32 89 % 32/32 100 % 23/32 72 % 83.5/96 87 %
Table 8.5 – Comprehension Test Results - Baseline, ISO icons, and Vehicle Top-view
Icon Points
Percent
Correct
Engine 95 %
ISO K.10 2/8 25 %
ISO K.11 3/8 38 %
Vehicle Top-view 6.5/8 81 %
114/120
A variety of incorrect responses were observed for the icons tested. Examples of incorrect responses
in the interpretation of the ISO icon for tire pressure included “airbag”, “light out”, “disengaged
gearshift”, and “connection check (fuses)”. Similar problems were found with the interpretation of
the ISO tire failure icon, including responses such as “traction control”, “check engine”, “low oil”,
and “don’t know”. Incorrect responses for Wheel 1 included “brake problems”, “electrical”, and
“wheel”. Wheel 3 was predominantly mistaken to represent something steering related (such as
“power steering” or “steering problem”); however, it was also mistaken to indicated “brakes”,
“wheel problem”, “lights”, and “turbo”.
95

Table 8.6 and Table 8.7 summarize response phrases obtained by wheel type and icon version,
respectively. Overall, “flat tire” was the phrase given most frequently (35 %) in response to tire
pressure icons tested. However, when examining responses to the two ISO icons, most of the
responses fell into the “other” category (i.e., terms not relating to tire, wheel, etc.). “Flat tire” was
the predominant response given for the “Flat Tire with Arrow” icon (54 %), the “Flat 1” icon (75
%), and the “Flat 2” icon (35 %). For the vehicle icon, the most commons responses were both “flat
tire” and “low tire pressure” which received 25 percent. “Flat tire” was also the most frequent
response for each of the three wheel types. In all, the alternative icons appear to do a better job of
communicating the idea that a condition relating to tire inflation warrants the driver’s attention than
does either of the ISO icons.
Table 8.6 – Summary of Percent Response Phrases by Wheel Type (rounded)
Response Phrase Wheel 1 Wheel 2 Wheel 3 Flat tire 39 % 45 % 42 %
Low tire pressure 8 % 20 % 3 %
Other 6 % 0 % 22 %
Low tire 3 % 9 % 9 %
Tire(s) 9 % 13 % 0 %
Wheel 9 % 0 % 13 %
Tire problem 3 % 3 % 5 %
Tire pressure 9 % 3 % 3 %
Low air 9 % 0 % 0 %
Check tires 0 % 3 % 3 %
Tire inflation pressure 3 % 0 % 0 %
Underinflated tire 0 % 3 % 0 %
Total 100 % 100 % 100 %
96
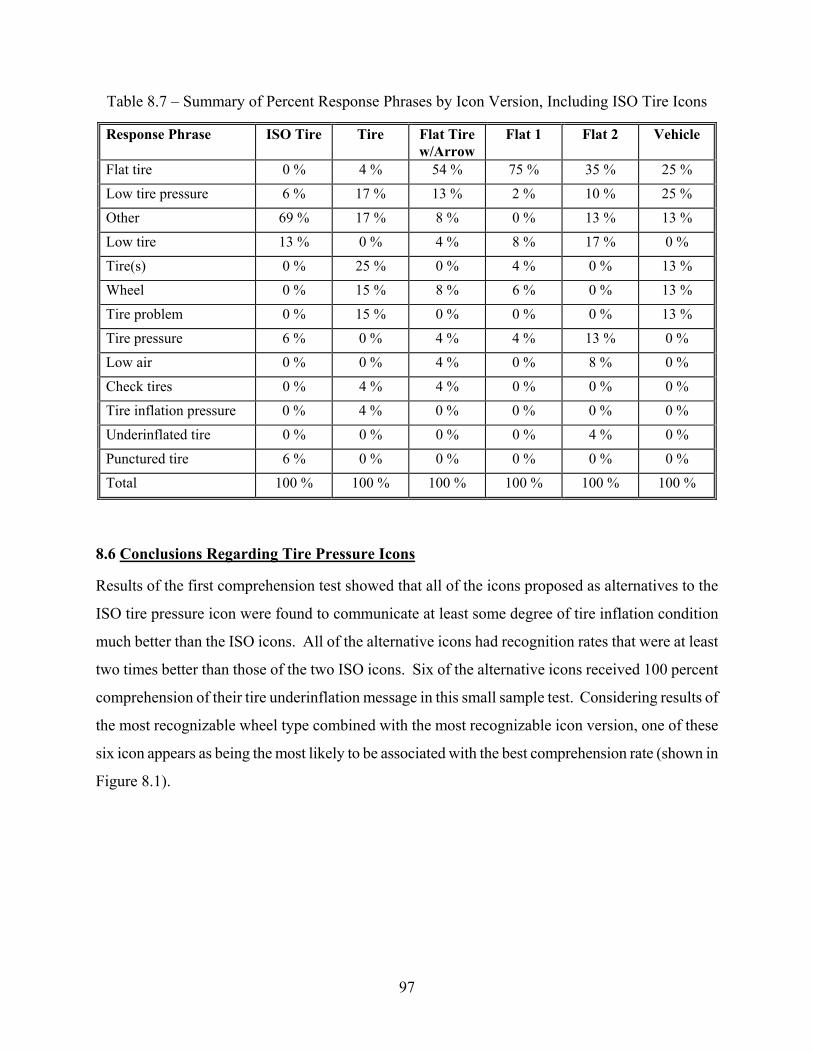
Table 8.7 – Summary of Percent Response Phrases by Icon Version, Including ISO Tire Icons
Response Phrase ISO Tire Tire Flat Tire w/Arrow
Flat 1 Flat 2 Vehicle
Flat tire 0 % 4 % 54 % 75 % 35 % 25 %
Low tire pressure 6 % 17 % 13 % 2 % 10 % 25 %
Other 69 % 17 % 8 % 0 % 13 % 13 %
Low tire 13 % 0 % 4 % 8 % 17 % 0 %
Tire(s) 0 % 25 % 0 % 4 % 0 % 13 %
Wheel 0 % 15 % 8 % 6 % 0 % 13 %
Tire problem 0 % 15 % 0 % 0 % 0 % 13 %
Tire pressure 6 % 0 % 4 % 4 % 13 % 0 %
Low air 0 % 0 % 4 % 0 % 8 % 0 %
Check tires 0 % 4 % 4 % 0 % 0 % 0 %
Tire inflation pressure 0 % 4 % 0 % 0 % 0 % 0 %
Underinflated tire 0 % 0 % 0 % 0 % 4 % 0 %
Punctured tire 6 % 0 % 0 % 0 % 0 % 0 %
Total 100 % 100 % 100 % 100 % 100 % 100 %
8.6 Conclusions Regarding Tire Pressure Icons
Results of the first comprehension test showed that all of the icons proposed as alternatives to the
ISO tire pressure icon were found to communicate at least some degree of tire inflation condition
much better than the ISO icons. All of the alternative icons had recognition rates that were at least
two times better than those of the two ISO icons. Six of the alternative icons received 100 percent
comprehension of their tire underinflation message in this small sample test. Considering results of
the most recognizable wheel type combined with the most recognizable icon version, one of these
six icon appears as being the most likely to be associated with the best comprehension rate (shown in
Figure 8.1).
97
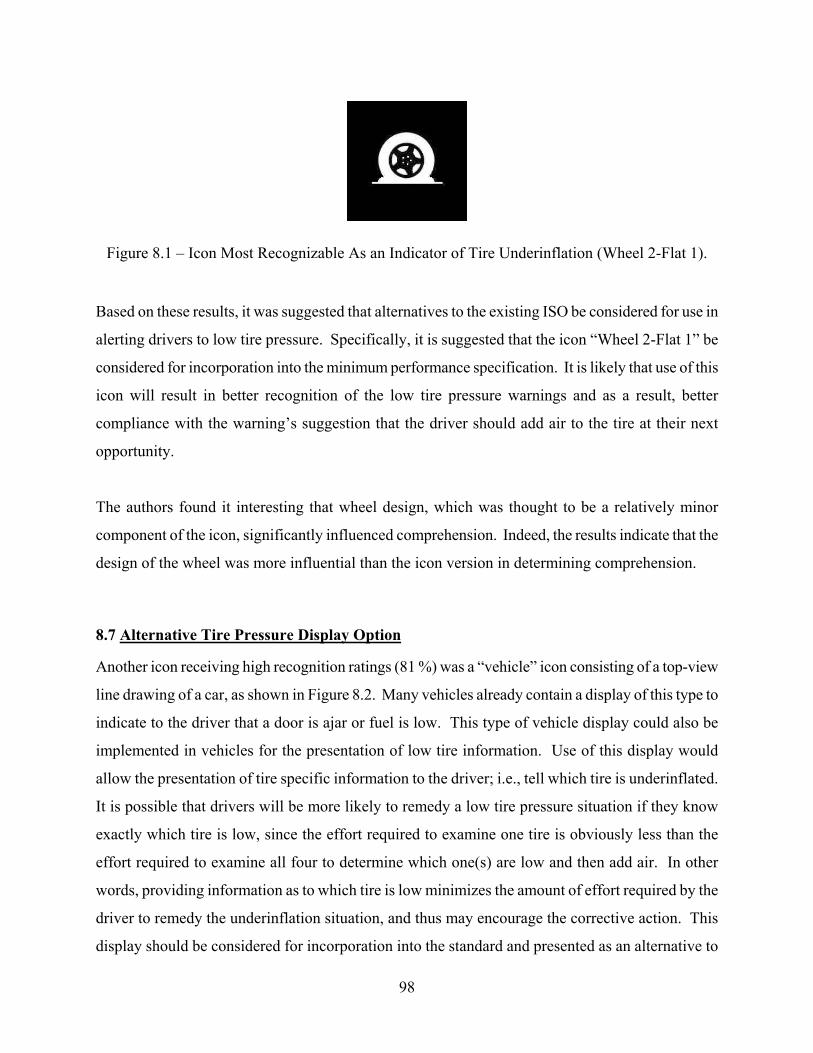
Figure 8.1 – Icon Most Recognizable As an Indicator of Tire Underinflation (Wheel 2-Flat 1).
Based on these results, it was suggested that alternatives to the existing ISO be considered for use in
alerting drivers to low tire pressure. Specifically, it is suggested that the icon “Wheel 2-Flat 1” be
considered for incorporation into the minimum performance specification. It is likely that use of this
icon will result in better recognition of the low tire pressure warnings and as a result, better
compliance with the warning’s suggestion that the driver should add air to the tire at their next
opportunity.
The authors found it interesting that wheel design, which was thought to be a relatively minor
component of the icon, significantly influenced comprehension. Indeed, the results indicate that the
design of the wheel was more influential than the icon version in determining comprehension.
8.7 Alternative Tire Pressure Display Option
Another icon receiving high recognition ratings (81 %) was a “vehicle” icon consisting of a top-view
line drawing of a car, as shown in Figure 8.2. Many vehicles already contain a display of this type to
indicate to the driver that a door is ajar or fuel is low. This type of vehicle display could also be
implemented in vehicles for the presentation of low tire information. Use of this display would
allow the presentation of tire specific information to the driver; i.e., tell which tire is underinflated.
It is possible that drivers will be more likely to remedy a low tire pressure situation if they know
exactly which tire is low, since the effort required to examine one tire is obviously less than the
effort required to examine all four to determine which one(s) are low and then add air. In other
words, providing information as to which tire is low minimizes the amount of effort required by the
driver to remedy the underinflation situation, and thus may encourage the corrective action. This
display should be considered for incorporation into the standard and presented as an alternative to
98

the use of a telltale (icon) for communicating the condition of tire underinflation. This type of
display could be permitted as an alternative to, or in lieu of, a telltale. Of course, a WSB system
cannot detect which tire is low, only that one or more tires are low. Therefore, indirect systems
would be limited to the use of a telltale.
Figure 8.2 – Vehicle Display for Provision of Warnings for Individual Tires.
If use of a top-view vehicle line drawing display is permitted, some caveats should be set forth.
Recognition of the image as a vehicle can vary greatly depending on the features of the drawing.
The particular representation tested received 81 percent comprehension. However, other vehicle
displays were encountered in the existing systems examination that were found to be difficult to
recognize and difficult to determine which way the vehicle was facing (as illustrated in Figure 7.9).
It is suggested that consideration of using the exact vehicle line drawing given in Figure 8.2 be
considered and comments requested.
In addition, it is suggested that that displays containing a vehicle top-view drawing follow the ISO
standard (ISO 2575, 2000) for implementation of this type of display, i.e.:
“4.4 …If a symbol shows a vehicle or parts of a vehicle in a top, plan view, a
vehicle moving from bottom to top on the symbol shall be assumed.”
8.8 Recommendations for Presentation of Low Tire Pressure Warnings
There is sufficient data to suggest that the VRTC-developed “Wheel 2-Flat 1" icon should be
considered. Comments should be requested on the VRTC-developed “Wheel 2-Flat 1” icon in
addition to ISO icon K.11, despite the experimentally determined, extremely low comprehension
99

rate of ISO icon K.11. Comments should also be requested on the alternative vehicle display to
assess receptiveness towards offering this type of display as an alternative to use of a telltale for
warning of low tire pressure. Based on these comments, a preferred method of providing drivers
with low tire pressure warnings can be selected.
100
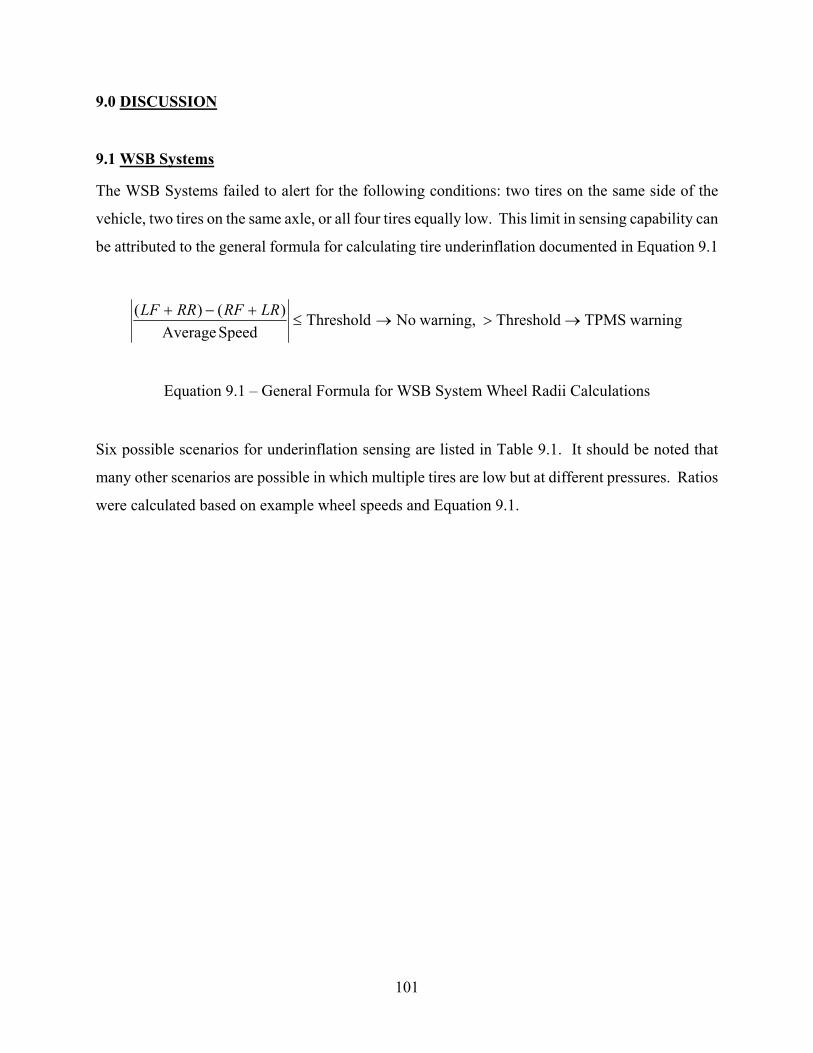
9.0 DISCUSSION
9.1 WSB Systems
The WSB Systems failed to alert for the following conditions: two tires on the same side of the
vehicle, two tires on the same axle, or all four tires equally low. This limit in sensing capability can
be attributed to the general formula for calculating tire underinflation documented in Equation 9.1
(LF + RR) − (RF + LR) ≤ Threshold → No warning, > Threshold → TPMS warning
Average Speed
Equation 9.1 – General Formula for WSB System Wheel Radii Calculations
Six possible scenarios for underinflation sensing are listed in Table 9.1. It should be noted that
many other scenarios are possible in which multiple tires are low but at different pressures. Ratios
were calculated based on example wheel speeds and Equation 9.1.
101
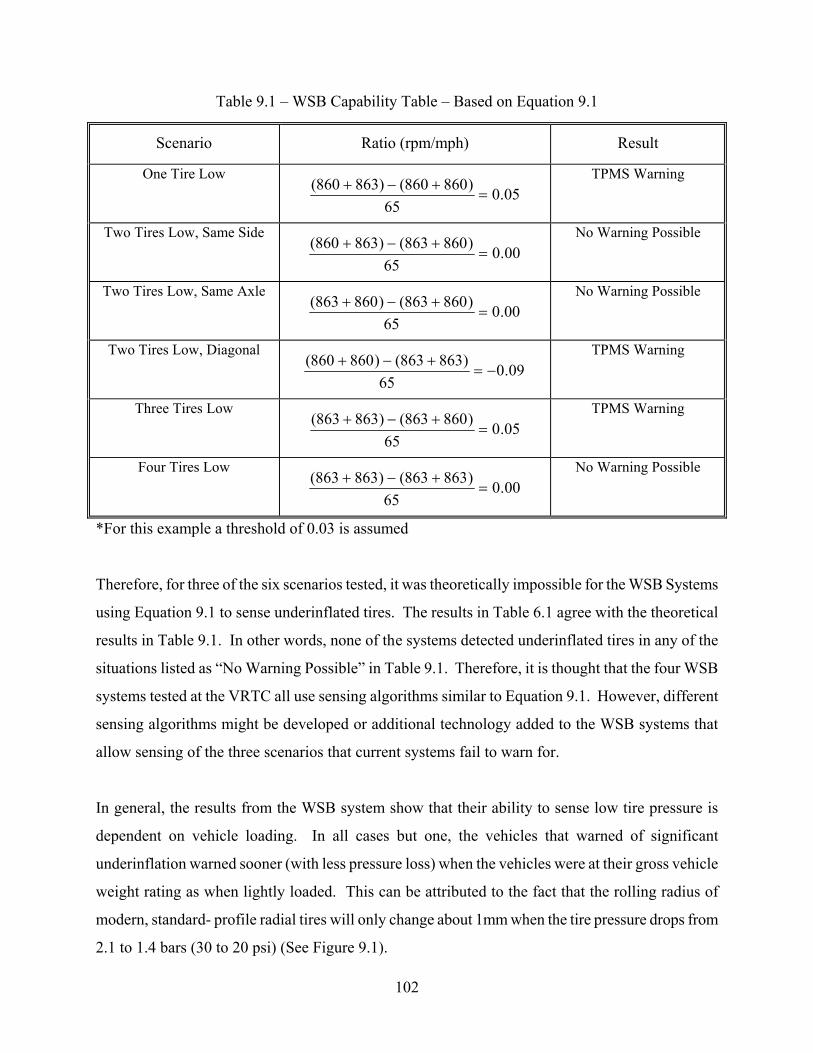
Table 9.1 – WSB Capability Table – Based on Equation 9.1
Scenario (rpm/mph) Result
One Tire Low TPMS Warning
Two Tires Low, Same Side No Warning Possible
Two Tires Low, Same Axle No Warning Possible
Two Tires Low, Diagonal TPMS Warning
Three Tires Low TPMS Warning
Four Tires Low No Warning Possible
00.0 65
)860863()863860( =
+−+
00.0 65
)860863()860863( =
+−+
09.0 65
)863863()860860( −=
+−+
05.0 65
)860863()863863( =
+−+
00.0 65
)863863()863863( =
+−+
05.0 65
)860860()863860( =
+−+
Ratio
*For this example a threshold of 0.03 is assumed
Therefore, for three of the six scenarios tested, it was theoretically impossible for the WSB Systems
using Equation 9.1 to sense underinflated tires. The results in Table 6.1 agree with the theoretical
results in Table 9.1. In other words, none of the systems detected underinflated tires in any of the
situations listed as “No Warning Possible” in Table 9.1. Therefore, it is thought that the four WSB
systems tested at the VRTC all use sensing algorithms similar to Equation 9.1. However, different
sensing algorithms might be developed or additional technology added to the WSB systems that
allow sensing of the three scenarios that current systems fail to warn for.
In general, the results from the WSB system show that their ability to sense low tire pressure is
dependent on vehicle loading. In all cases but one, the vehicles that warned of significant
underinflation warned sooner (with less pressure loss) when the vehicles were at their gross vehicle
weight rating as when lightly loaded. This can be attributed to the fact that the rolling radius of
modern, standard- profile radial tires will only change about 1mm when the tire pressure drops from
2.1 to 1.4 bars (30 to 20 psi) (See Figure 9.1).
102

Rolling Radius (mm) 277.5
277.0
276.5
276.0
275.5
275.0
274.5 0 0.5 1.0 1.5 2.0 2.5 3.0
Tire Pressure (bar) Tire Load 353 kg
Low-section tire 45%
Standard tire 82%
Rolling Radius vs Tire Pressure
Rolling Radius (mm) 277.5
277.0
276.5
276.0
275.5
275.0
274.5 0 0.5 1.0 1.5 2.0 2.5 3.0
Tire Pressure (bar) Tire Load 353 kg
Low-section tire 45%
Standard tire 82%
Rolling Radius vs Tire Pressure
Figure 9.1 – Rolling Radius verses Tire Pressure (graph supplied by BMW AG, 2001)
For the “standard” tires referred to in Figure 9.1, a 33 percent drop in tire pressure from 2.1 to 1.4
bars (30 psi to 20 psi) represents less than the 1 mm (0.4 %) change in rolling radius overall. The
wheel-speed based systems must be sensitive enough to detect a millimeter (0.040 inch) or less
change in the rolling radius of the tire to warn within 30 percent of placard pressure. The sensitivity
of operational factors on tire circumference, which is directly related to tire radius, is detailed in
Table 9.2.
While tire pressure changes tire rolling circumference at about 0.03 percent per 1 psi, tire load
changes the rolling circumference by 0.08 percent per 100 lb of tire load.3 In a typical vehicle, if the
tire pressure changes 10 psi, the tire circumference changes 0.26 percent. If a typical vehicle’s load
changes 700 lb (175 lb per tire) between LLVW and GVWR, the tire circumference changes 0.14
3 Represents general trends on the influence of operating factors on tire rolling circumference observed by BMW AG.
Data was presented in an information session between BWM AG and NHTSA.
103
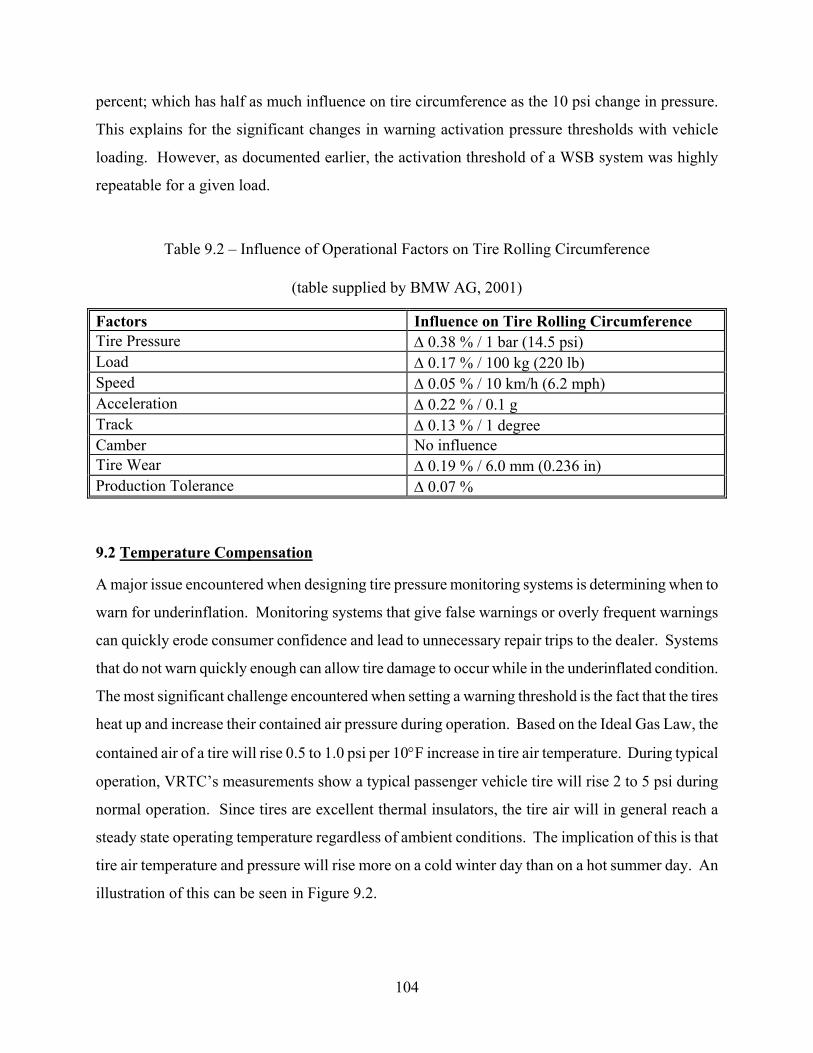
percent; which has half as much influence on tire circumference as the 10 psi change in pressure.
This explains for the significant changes in warning activation pressure thresholds with vehicle
loading. However, as documented earlier, the activation threshold of a WSB system was highly
repeatable for a given load.
Table 9.2 – Influence of Operational Factors on Tire Rolling Circumference
(table supplied by BMW AG, 2001)
Factors Influence on Tire Rolling Circumference Tire Pressure ∆ 0.38 % / 1 bar (14.5 psi) Load ∆ 0.17 % / 100 kg (220 lb) Speed ∆ 0.05 % / 10 km/h (6.2 mph) Acceleration ∆ 0.22 % / 0.1 g Track ∆ 0.13 % / 1 degree Camber influence Tire Wear ∆ 0.19 % / 6.0 mm (0.236 in) Production Tolerance ∆ 0.07 %
No
9.2 Temperature Compensation
A major issue encountered when designing tire pressure monitoring systems is determining when to
warn for underinflation. Monitoring systems that give false warnings or overly frequent warnings
can quickly erode consumer confidence and lead to unnecessary repair trips to the dealer. Systems
that do not warn quickly enough can allow tire damage to occur while in the underinflated condition.
The most significant challenge encountered when setting a warning threshold is the fact that the tires
heat up and increase their contained air pressure during operation. Based on the Ideal Gas Law, the
contained air of a tire will rise 0.5 to 1.0 psi per 10°F increase in tire air temperature. During typical
operation, VRTC’s measurements show a typical passenger vehicle tire will rise 2 to 5 psi during
normal operation. Since tires are excellent thermal insulators, the tire air will in general reach a
steady state operating temperature regardless of ambient conditions. The implication of this is that
tire air temperature and pressure will rise more on a cold winter day than on a hot summer day. An
illustration of this can be seen in Figure 9.2.
104
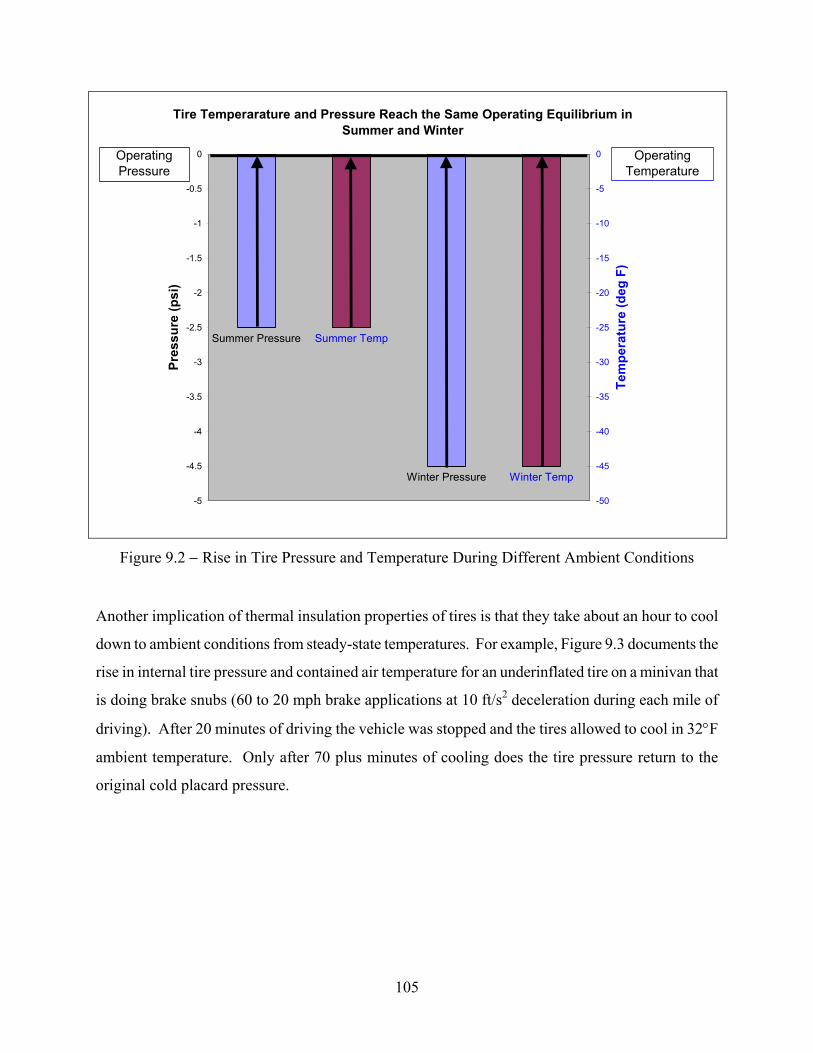
Tire Temperarature and Pressure Reach the Same Operating Equilibrium in Summer and Winter
Summer Pressure
Winter Pressure
Summer Temp
Winter Temp
-5
-4.5
-4
-3.5
-3
-2.5
-2
-1.5
-1
-0.5
0
Pres
sure
(psi
)
-50
-45
-40
-35
-30
-25
-20
-15
-10
-5
0
Tem
pera
ture
(deg
F)
Operating Pressure
Operating Temperature
Figure 9.2 − Rise in Tire Pressure and Temperature During Different Ambient Conditions
Another implication of thermal insulation properties of tires is that they take about an hour to cool
down to ambient conditions from steady-state temperatures. For example, Figure 9.3 documents the
rise in internal tire pressure and contained air temperature for an underinflated tire on a minivan that
is doing brake snubs (60 to 20 mph brake applications at 10 ft/s2 deceleration during each mile of
driving). After 20 minutes of driving the vehicle was stopped and the tires allowed to cool in 32°F
ambient temperature. Only after 70 plus minutes of cooling does the tire pressure return to the
original cold placard pressure.
105
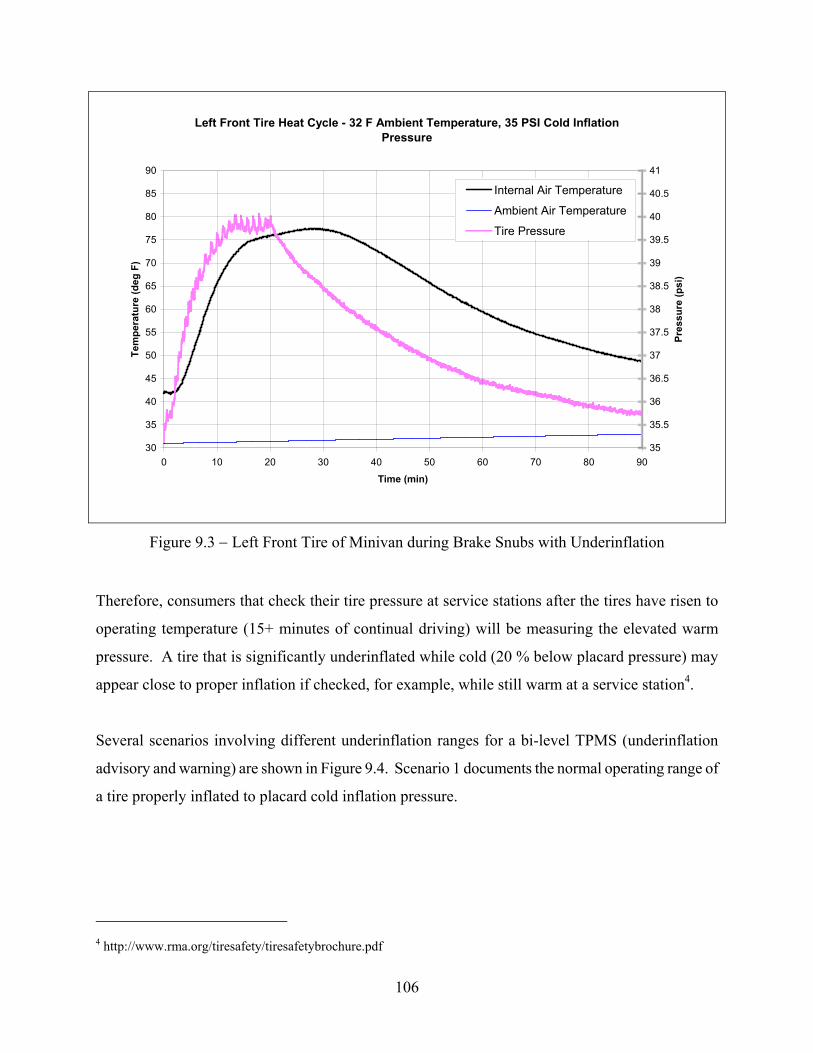
106
Figure 9.3 − Left Front Tire of Minivan during Brake Snubs with Underinflation
Therefore, consumers that check their tire pressure at service stations after the tires have risen to
operating temperature (15+ minutes of continual driving) will be measuring the elevated warm
pressure. ted while cold (20 % below placard pressure) may
appear close to proper inflation if checked, for example, while still warm at a service station4.
Several scenarios involving different underinflation ranges for a bi-level TPMS (underinflation
advisory and warning) are shown in Figure 9.4. Scenario 1 documents the normal operating range of
a tire properly inflated to placard cold inflation pressure.
4 http://www.rma.org/tiresafety/tiresafetybrochure.pdf
Left Front Tire Heat Cycle - 32 F Ambient Temperature, 35 PSI Cold Inflation Pressure
30
35
40
45
50
55
60
65
70
75
80
85
90
0 10 0 0 40 0 0 0 0 0
Time (min)
Tem
pera
ture
(deg
F)
35
35.5
36
36.5
37
37.5
38
38.5
39
39.5
40
40.5
41
Pres
sure
(psi
)
Internal Air Temperature
Ambient Air Temperature
Tire Pressure
A tire that is significantly underinfla
2 3 5 6 7 8 9
Figure 9.4 – Underinflation Scenarios
For Scenario 1, the tires are set to the placard cold inflation pressure of 30 psi in daylight hours.
Though the tire manufacturers state that tire pressure should be set during the coldest part of the day,
setting the pressure during daylight hours is probably more typical. The increase in tire pressure
from operation and the decrease in tire pressure when the ambient temperature drops can produce
significant tire pressure fluctuations. Since Scenario 1 represents proper inflation of the tires, there
should be a sufficient margin between the lowest pressure of the day and the first threshold
(underinflation advisory) to prevent false alarms. This margin should also accommodate the error of
the tire pressure monitoring system and the consumer’s tire gauge.
In Scenario 2, the cold inflation pressure is below placard but initially above the underinflation
advisory level. Temperature fluctuations can cause the cold inflation pressure to occasionally drop
below the underinflation advisory threshold. Once the low pressure is detected, the system should
advise and continue to advise regardless of tire heating. The reason for this is that tires specified for
a 30 psi cold inflation pressure should be operating in the 30 to 35 psi range, not the 25 to 30 psi
range. Either the tire has lost enough air, or the ambient temperatures have dropped enough that an
underinflation advisory is warranted. If the underinflation advisory threshold is fixed at 20 % low,
the vehicle may operate for a period of time with tire pressures down to 24 psi before the advisory
activates.
To expedite detection of a tire underinflation, some systems have adopted temperature compensated
advisory thresholds. These systems calculate what the placard cold inflation pressure should be at
107
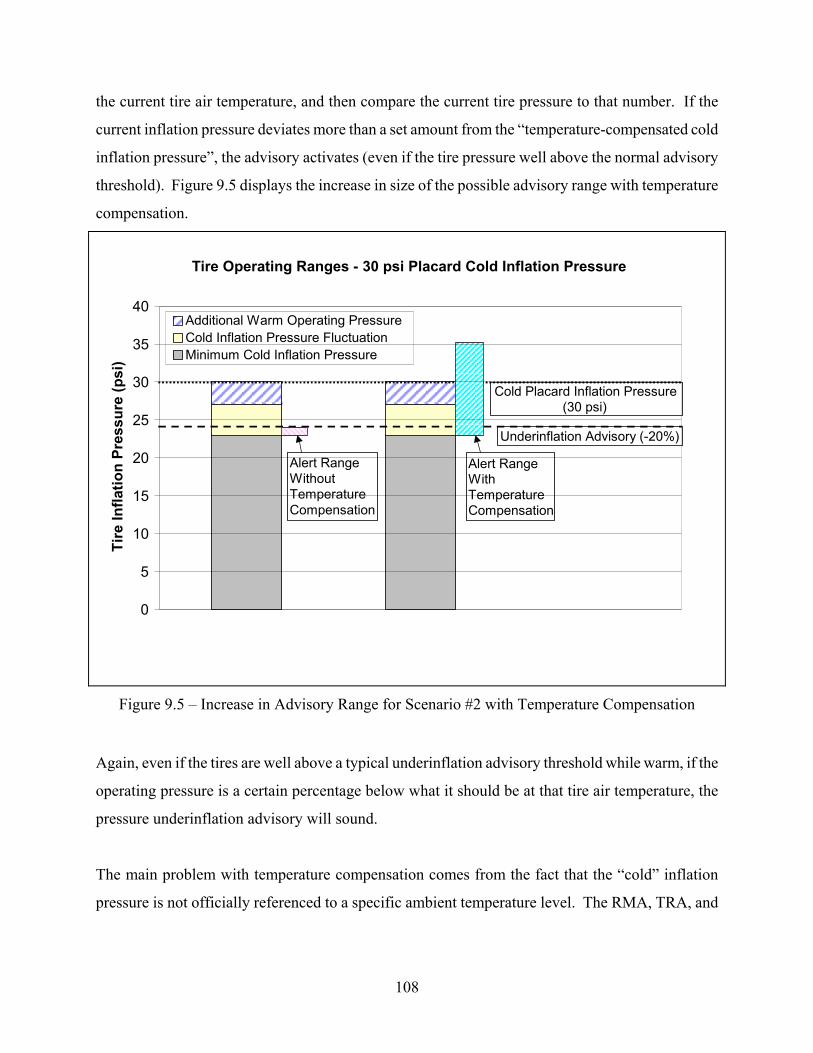
the current tire air temperature, and then compare the current tire pressure to that number. If the
current inflation pressure deviates more than a set amount from the “temperature-compensated cold
inflation pressure”, the advisory activates (even if the tire pressure well above the normal advisory
threshold). Figure 9.5 displays the increase in size of the possible advisory range with temperature
compensation.
Tire Operating Ranges - 30 psi Placard Cold Inflation Pressure
0
5
10
15
20
25
30
35
40
Tire
Infla
tion
Pres
sure
(psi
)
Additional Warm Operating Pressure Cold Inflation Pressure Fluctuation Minimum Cold Inflation Pressure
Underinflation Advisory (-20%)
Cold Placard Inflation Pressure (30 psi)
Alert Range Without Temperature Compensation
Alert Range With Temperature Compensation
Figure 9.5 – Increase in Advisory Range for Scenario #2 with Temperature Compensation
Again, even if the tires are well above a typical underinflation advisory threshold while warm, if the
operating pressure is a certain percentage below what it should be at that tire air temperature, the
pressure underinflation advisory will sound.
The main problem with temperature compensation comes from the fact that the “cold” inflation
pressure is not officially referenced to a specific ambient temperature level. The RMA, TRA, and
108
ETRTO define “cold” as the prevailing ambient temperature5. What exactly is the prevailing
ambient temperature and the time of day at which it occurs is not specified. Unless the system
registers the current ambient temperature at startup, it is difficult to have a reference temperature for
the cold inflation pressure. The two systems with temperature compensation, System E and J, have
taken different approaches to this problem.
According to System J’s owner’s manual, the system references the cold inflation pressure to room
temperature (18°C, 64.4°F). System J’s receiver displays not only current tire pressure and
temperature, but also the deviation of current pressure from the temperature adjusted cold inflation
pressure value. The first warning was a “Pressure Deviation Alert” that activated when the deviation
of the current pressure from the adjusted cold inflation pressure exceeds a set amount. The user can
set this deviation tolerance between 2 and 20 psi. If the contained tire air temperature is more than
10°F above 65°F, and the pressure is at or below the calculated temperature-compensated cold
inflation pressure, the receiver displays “-x psi” (inferring that the tire pressure is low by x psi for
that temperature). For approximately each 10°F increment in tire air temperature above 65°F, the
display will list add 1 psi to the “-x psi” amount. The same process happens for 10°F increments
below 65°F, with the display instead showing “+x psi” deviations (inferring that the tire is
overinflated at this temperature).6
Fixing the cold inflation pressure at a set temperature is problematic. The National Climatic Data
Center lists the average annual ambient temperature for the United States from 1990 to 2000 as
53.57° F (12°C) [11]. This is 10.83° F (6°) lower than System J’s 64.4°F (18°C) reference point
(though most vehicles are operated during daytime when it is warmer). For people who operate in
very warm or cold climates year around, the system might always show a deviation from cold
5 TRA defines the cold inflation pressures used in their load rating tables as: “The inflation pressures are those taken
with the tires at the prevailing atmospheric temperatures and do not include any inflation pressure build-up due to vehicle
operation.” 6 Information based on SmarTire Systems Inc., Multi Function Display User’s Manual PN 700.0001 GEN II Draft.
Results from the evaluation of the system were consistent with the user manual’s description.
109

inflation pressure if the reference temperature is fixed at 18°C (64.4°F). That is why System J
allows the temperature compensation feature to be disabled entirely.
System E had a different approach. When the user sets the tire pressures and initializes the system,
the pressure is referenced to the current tire air temperature, which is equal to the current ambient
temperature as well. If the system senses the tire temperature being more than 36°F (20°C) below
the initialization temperature for more than two weeks, the system sets off a warning and must be
reinitialized. The user is advised to recheck tire pressures (cold) and must reset the system at the new
temperature.
In Scenario 3 of Figure 9.4, the system must detect the low cold inflation pressure before the tires
warm up and their pressures rise above the threshold. Both a fixed or temperature compensated
advisory would activate in this pressure range. However, it may take an appreciable amount of time
before the second notification of underinflation, the underinflation warning, is activated.
Clearly in Scenario 4, the system’s underinflation warning should activate. This warning threshold
should be fixed, since a temperature compensated threshold may allow very low tire pressures in
extreme cold environments.
Temperature compensated warnings may help eliminate nuisance warnings due to daily temperature
fluctuations while giving the vehicle operator more useful tire information. Conversely, the
algorithm for temperature compensated warnings is very complicated and requires that the cold
inflation pressure be referenced to a temperature level. As previously mentioned, many vehicles
currently on the market monitor ambient temperature as a driver convenience. The pressure-sensor
based TPMS could reference the cold placard inflation pressure to the coldest temperature observed
that day and compensate the advisory accordingly.
Overall, temperature compensation can provide important benefits. The underinflation advisory is
most likely to be activated shortly after the vehicle begins moving (tires cold). It is assumed that
most drivers will eventually travel to a service station to service the low tire(s). If the vehicle is
driven a sufficient distance to heat the tires before arriving at the service station, the tires will have
110
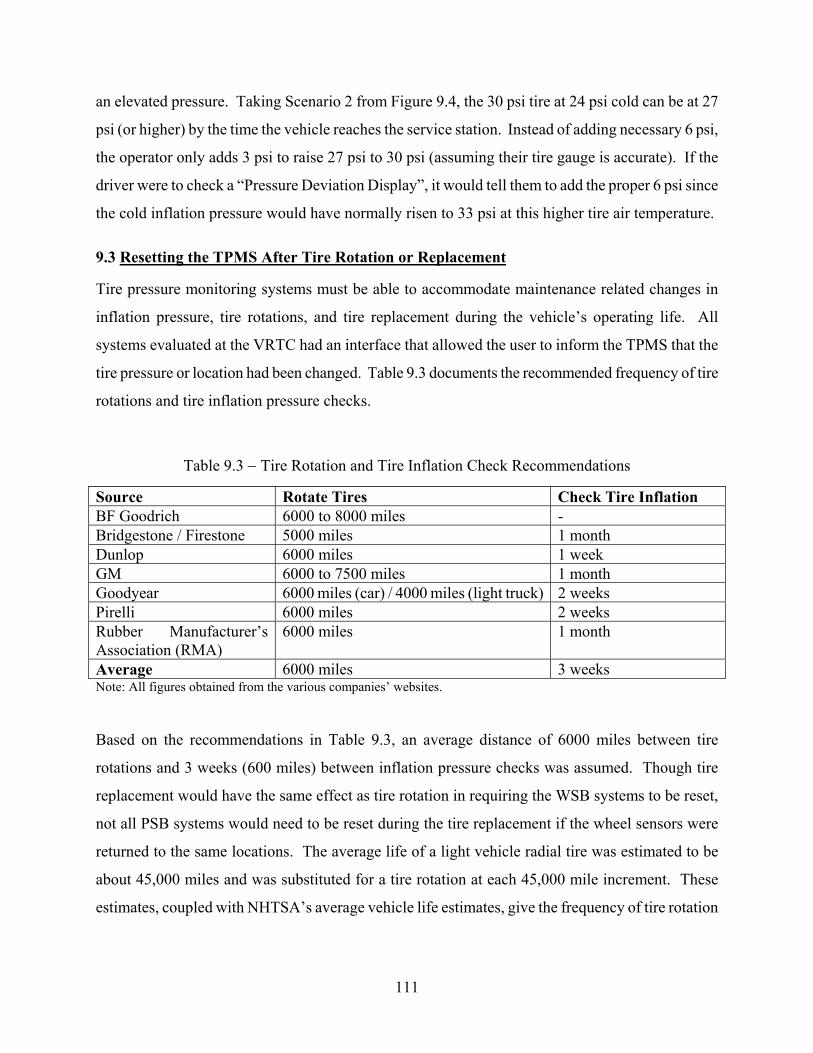
an elevated pressure. Taking Scenario 2 from Figure 9.4, the 30 psi tire at 24 psi cold can be at 27
psi (or higher) by the time the vehicle reaches the service station. Instead of adding necessary 6 psi,
the operator only adds 3 psi to raise 27 psi to 30 psi (assuming their tire gauge is accurate). If the
driver were to check a “Pressure Deviation Display”, it would tell them to add the proper 6 psi since
the cold inflation pressure would have normally risen to 33 psi at this higher tire air temperature.
9.3 Resetting the TPMS After Tire Rotation or Replacement
Tire pressure monitoring systems must be able to accommodate maintenance related changes in
inflation pressure, tire rotations, and tire replacement during the vehicle’s operating life. All
systems evaluated at the VRTC had an interface that allowed the user to inform the TPMS that the
tire pressure or location had been changed. Table 9.3 documents the recommended frequency of tire
rotations and tire inflation pressure checks.
Table 9.3 − Tire Rotation and Tire Inflation Check Recommendations
Source Rotate Tires Check Tire Inflation BF Goodrich 6000 to 8000 miles -Bridgestone / Firestone 5000 miles 1 month Dunlop 6000 miles 1 week GM 6000 to 7500 miles 1 month Goodyear 6000 miles (car) / 4000 miles (light truck) 2 weeks Pirelli 6000 miles 2 weeks Rubber Manufacturer’s Association (RMA)
6000 miles 1 month
Average 6000 miles 3 weeks Note: All figures obtained from the various companies’ websites.
Based on the recommendations in Table 9.3, an average distance of 6000 miles between tire
rotations and 3 weeks (600 miles) between inflation pressure checks was assumed. Though tire
replacement would have the same effect as tire rotation in requiring the WSB systems to be reset,
not all PSB systems would need to be reset during the tire replacement if the wheel sensors were
returned to the same locations. The average life of a light vehicle radial tire was estimated to be
about 45,000 miles and was substituted for a tire rotation at each 45,000 mile increment. These
estimates, coupled with NHTSA’s average vehicle life estimates, give the frequency of tire rotation
111

and tire replacement. The complete breakdown is contained in Appendix 8 and the results are
summarized in Table 9.4.
Table 9.4 − Estimates for the Frequency of TPMS Reset / Retrain
Vehicle Type Average Vehicle
Lifespan (years)
Average Vehicle Mileage in
Lifetime (miles)
Average Frequency of
Rotation (years)
Number of Tire Replacements
in Lifetime
TPMS Resets
Passenger Cars 12.5 126,678 0.6 2 to 3 19* Light Trucks 15.5 153,319 0.6 3 23*
*Figure could be less for pressure-sensor based systems since they may not need to be retrained after tire
replacement if the wheels are returned to the original locations.
On average, it is estimated that every 7.2 months a driver will have to reset the wheel-speed based
TPMS or retrain the sensor locations for pressure-sensor based TPMS due to tire rotation or
replacement. This may require up to 23 resets / retrains over the lifetime of a typical light truck. In
addition, the owner’s manuals of the four WSB and one PSB (System E) also instruct the owner to
reset the TPMS after inflation pressure has been manually adjusted. In theory if vehicle owners
checked their inflation pressure every 3 weeks (as recommended) and the tires required air 50
percent of the time, this could add another 100 resets over the life of the vehicle. Therefore, the
reset /retrain process for both the wheel-speed based and pressure-sensor based TPMS should be
simple and straightforward. The condensed TPMS reset / retrain procedures for the ten systems
evaluated are listed in Table 9.5.
112

Table 9.5 − Reset / Retrain Procedures for the TPMS Evaluated
System TPMS Reset / Retraining Method (From Vehicle Owner’s Manuals) A Turn key to position 2
Press system button until the yellow indicator lamp on the instrument panel lights up
Drive for a few minutes B Turn ignition to run
Press gage info button on DIC (Driver Information Center) until “TIRE PRESSURE” appears on display
Press and hold DIC RESET button for about five seconds…”TIRE PRESSURE NORMAL” will appear in display
Drive 45 to 90 minutes C Turn ignition to ON
Push reset switch until pressure warning light blinks three times Drive at speeds over 19 mph for 8 hours
D Turn ignition to position 2 Press system button until “Set tyre pressure” is displayed Drive at least 10 minutes
E Turn ignition to position 2 Press system button until : “SET TYRE PRESSURE” is displayed Drive for several minutes for automatic sensor location recognition
F NA – Prototype G Sensors have wheel locations marked on them
Unscrew sensors from valve stems and reattach them to designated tire valve Press “RESET” on the receiver
H Only a qualified technician is authorized to retrain the sensor locations I Ignition on
Push “Tire” and “Mode” at the same time for ten seconds of more Push “Tire” to display Fr__Id Depress front right valve core for 10 seconds until display beeps and flashes Push “Tire” to display Fr__Id Continue pressure dropping process for front right, rear right, and left rear tires
in that order Confirm registration by manually deflating each tire and looking for a warning
J Wheels are externally color coded to indicate the sensor within (color indicates numerically designation) Press “MODE” to enter tire rotation mode Press “TIRE” to scroll through locations and “Mode” to select a location for
editing Adjust tire locations to proper sensor numeric, i.e. change right front from “1”
(green wheel) to “3” (blue wheel)… Press “SET” when finished with all four locations
113
As Table 9.5 documents, resetting the four wheel-speed based systems involves pushing buttons on
the dash or in the driver information consoles and then driving the vehicle to allow the system to
“relearn” the tire profiles. Resetting the OE pressure-sensor based system with automatic wheel
location recognition (System E) was similar, simply push a button and drive the vehicle. System G’s
sensors have their locations marked on them and just screw onto the valve stems. System H
specifies that only qualified technicians should retrain sensor locations. System I’s procedures were
essentially the same as the installation procedures, requiring a lengthy process of training the sensor
locations to the receiver by leaking down each tire in a predetermined sequence. Having gone
through this process installing Systems H, I, and J, we think it doubtful that consumers will want to
do this 19 to 23 times over the life of their vehicles. System J’s “Tire Rotation Mode” was a
compromise between automatic location recognition and manual retraining. System J’s receiver had
a menu that allow the wheel locations to be reassigned, without requiring the tires to be dropped in
pressure. This mode did require the user to know what sensor had moved to what location.
114
10.0 SUMMARY
Research was conducted to examine both commercially available and prototype tire pressure
monitoring systems (TPMS). TPMS features examined included the type of warnings given, the
thresholds at which they occurred, the time delay from a low pressure occurrence to driver
notification, and some of the human factors of the warning information displays. The findings were
grouped according to the two system types: Wheel-Speed Based (WSB) and Pressure-Sensor Based
(PSB) measurement.
10.1 Hardware Performance Results
A summary of the findings regarding the performance of WSB and PSB TPMS is provided in Table
10.1.
115
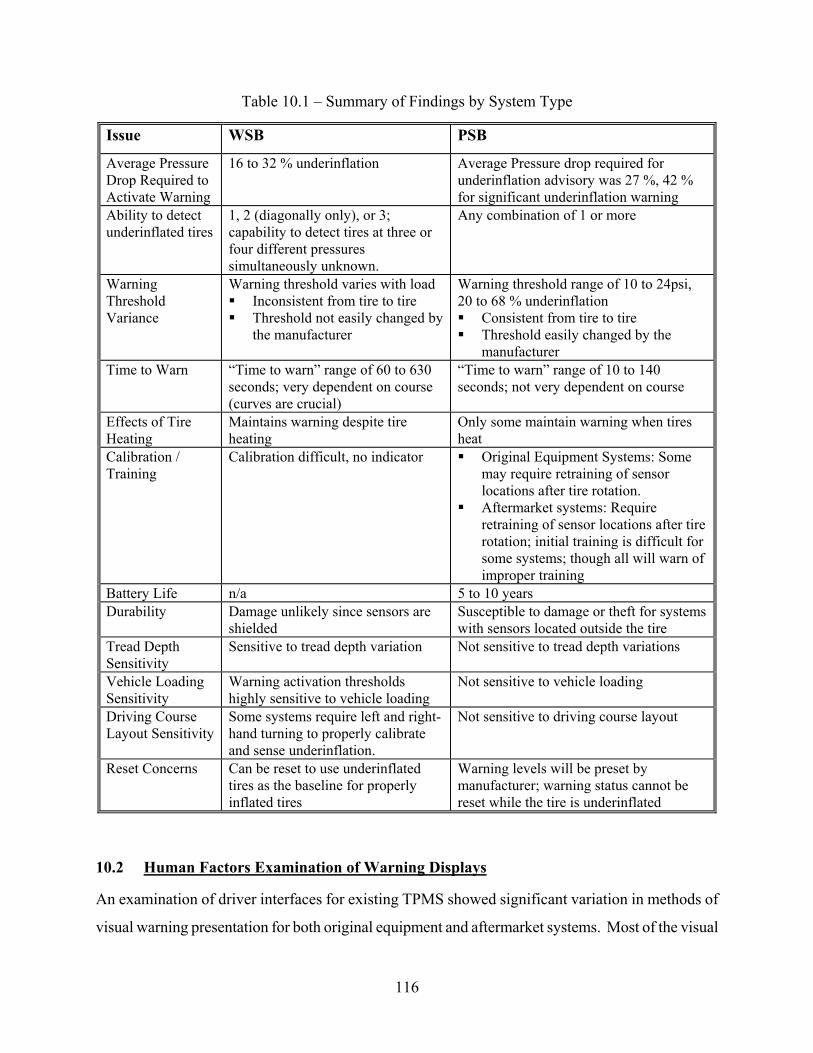
Table 10.1 – Summary of Findings by System Type
Issue PSB
Average Pressure Drop Required to Activate Warning
16 to 32 % underinflation Average Pressure drop required for underinflation advisory was 27 %, 42 % for significant underinflation warning
Ability to detect underinflated tires
1, 2 (diagonally only), or 3; capability to detect tires at three or four different pressures simultaneously unknown.
Any combination of 1 or more
Warning Threshold Variance
Warning threshold varies with load Inconsistent from tire to tire Threshold not easily changed by
the manufacturer
Warning threshold range of 10 to 24psi, 20 to 68 % underinflation Consistent from tire to tire Threshold easily changed by the
manufacturer Time to Warn “Time to warn” range of 60 to 630
seconds; very dependent on course (curves are crucial)
“Time to warn” range of 10 to 140 seconds; not very dependent on course
Effects of Tire Heating
Maintains warning despite tire heating
Only some maintain warning when tires heat
Calibration / Training
Calibration difficult, no indicator Original Equipment Systems: Some may require retraining of sensor locations after tire rotation.
Aftermarket systems: Require retraining of sensor locations after tire rotation; initial training is difficult for some systems; though all will warn of improper training
Battery Life n/a 5 to 10 years Durability Damage unlikely since sensors are
shielded Susceptible to damage or theft for systems with sensors located outside the tire
Tread Depth Sensitivity
Sensitive to tread depth variation Not sensitive to tread depth variations
Vehicle Loading Sensitivity
Warning activation thresholds highly sensitive to vehicle loading
Not sensitive to vehicle loading
Driving Course Layout Sensitivity
Some systems require left and right-hand turning to properly calibrate and sense underinflation.
Not sensitive to driving course layout
Reset Concerns Can be reset to use underinflated tires as the baseline for properly inflated tires
Warning levels will be preset by manufacturer; warning status cannot be reset while the tire is underinflated
WSB
10.2 Human Factors Examination of Warning Displays
An examination of driver interfaces for existing TPMS showed significant variation in methods of
visual warning presentation for both original equipment and aftermarket systems. Most of the visual
116

displays were either difficult to see or hard to comprehend, or both. Auditory warnings were overall
fairly similar for all systems. The variation in visual warning presentation demonstrated the need for
standardization of the visual warnings of tire underinflation to avoid driver confusion.
A summary of findings from the examination of existing systems and icon development and
comprehension testing are listed in the following Table 10.2.
Table 10.2 – Summary of Low Tire Pressure Warning Display Findings
Issue
Consistency/
Standardization
Methods of providing visual warnings varied greatly from system to system
Need a standard icon and/or vehicle-based wheel-by-wheel display
Most visual displays were difficult to comprehend
An icon was developed which proved to be more recognizable than the ISO
icons for indication of low tire pressure
Use of a vehicle-based wheel-by-wheel display, properly oriented, may be a
suitable substitute for use of a standard icon.
Conspicuity Most visual displays were difficult to see (e.g., due to glare)
Method of Warning
Presentation
Significant underinflation warning may include visual and auditory signals;
underinflation advisory may be only visual.
Findings
10.3 Low Tire Pressure Icon Comprehension Testing
Results of the icon comprehension tests showed that recognition was poor for the ISO tire pressure
icons (K.10 and K.11). The ISO tire pressure and tire failure icons received the lowest
comprehension scores of the 16 icons tested, 38 percent and 25 percent, for K.10 and K.11
respectively. Percent correct observed for the icons based on tire images ranged from approximately
62 percent to 100 percent (6 of the 12 had 100 percent comprehension). The percentage of correct
responses associated with the vehicle image icon was 81 percent. Respondents showed near perfect
(95 percent) comprehension results for the ISO engine icon, which was used as a baseline for
comparison.
117

Based on these results, it was suggested that an alternative to the existing ISO icons be considered
for use in alerting drivers to the condition of low tire pressure. Considering the best recognized
features of the icons tested, a single icon (one of the 6 whose results showed 100 percent
comprehension) is suggested as that which is most likely to be recognized by the general population.
The suggested icon for use as a visual indicator of significant tire underinflation is pictured in
Figure 10.1.
Use of a top-view vehicle display showing individual tires (as shown in Figure 10.1) could also be
implemented in vehicles for the presentation of low tire information. Use of this display would
allow the presentation of tire specific information to the driver, i.e., tell which tire is underinflated.
This type of display could be permitted as an alternative to, or in lieu of, a telltale. Of course a WSB
system cannot detect which tire is low, only that one or more tires are low. Therefore, WSB systems
would be limited to the use of a telltale.
Figure 10.1 – Suggested icon for indication of significant tire underinflation and alternative vehicle-based display.
118
11.0 REFERENCES
1. Rubber Manufacturers Association. “Tire and Auto Safety.” [Online] Available at
http://www.rma.org/tiresafety/auto_safety_facts.html, March 2001.
2. Tire Business. “RMA Weighs in on Tire Labeling Regulations.” [Online] Available
http://www.tirebusiness.com, Crane Communications Inc., February 2001.
3. Normann, Norbert. “Tyre Pressure Monitoring System for all Vehicle Categories.” ATZ
Worldwide, 2000.
4. Wingert, Larry. “Not to Air Is Human.” [Online] Available http://www.tirebusiness. com,
Crane Communications Inc., November 2000.
5. BMW AG, M3 Convertible-Owner’s Manual for the Vehicle, Online Edition for Part No. 01
41 0 155 719 - 12/00 BMW AG
6. General Motors Corp. H-Platform 2000 Buick LeSabre Service Manual, Vol. 1. 1999 page
3-76 & Year 2000 Buick LeSabre Owner’s Manual (pp. 6-42 to 6-45).
7. BMW AG, Supplementary Owner’s Handbook, Online Version zu Sach-NR. 01 40 0 155
275 - 08/99 BMW AG
8. Toyota. 2000 Toyota Sienna Owner's Manual.1999.
9. Rubber Manufacturers Association. “Be Tire Smart, Play Your Part.” [Online] Available
http://www.rma.org/tiresafety, 2001.
10. The Tire and Rim Association, Inc. 2001 Year Book. Copley, OH: The Tire and Rim
Association, Inc., 2001.
11. U.S. Department of Commerce, National Oceanic and Atmospheric Administration, National
Climatic Data Center. [Online] Available at http://www.ncdc.noaa.gov, 2001
12. Green, P. “Development of Pictographic Symbols For Vehicle Controls and Displays,”
(SAE paper 790383). Warrendale, PA: Society of Automotive Engineers, 1979.
13. International Standards Organization, Road Vehicles – Symbols For Controls, Indicators,
and Telltales (ISO Standard 2575). Geneva, Switzerland: International Organization for
Standardization, 2000.
14. Green, P. “Design and Evaluation of Symbols For Automobile Controls and Displays.”
Automotive Ergonomics (pp. 237-268). Edited by Peacock and Karwowski. London:
Taylor & Francis. 1993.
119

15. Campbell, J. L., Carney, C., and Lee, J. D. In-Vehicle Display Icons and Other Information
Elements Task C4: Preliminary In-Vehicle Symbol Guidelines (Technical Report No.
DTFH61-97-C-00061). Washington, DC: U. S. Department of Transportation, Federal
Highway Administration. 1999.
120

12.0 APPENDICES
121
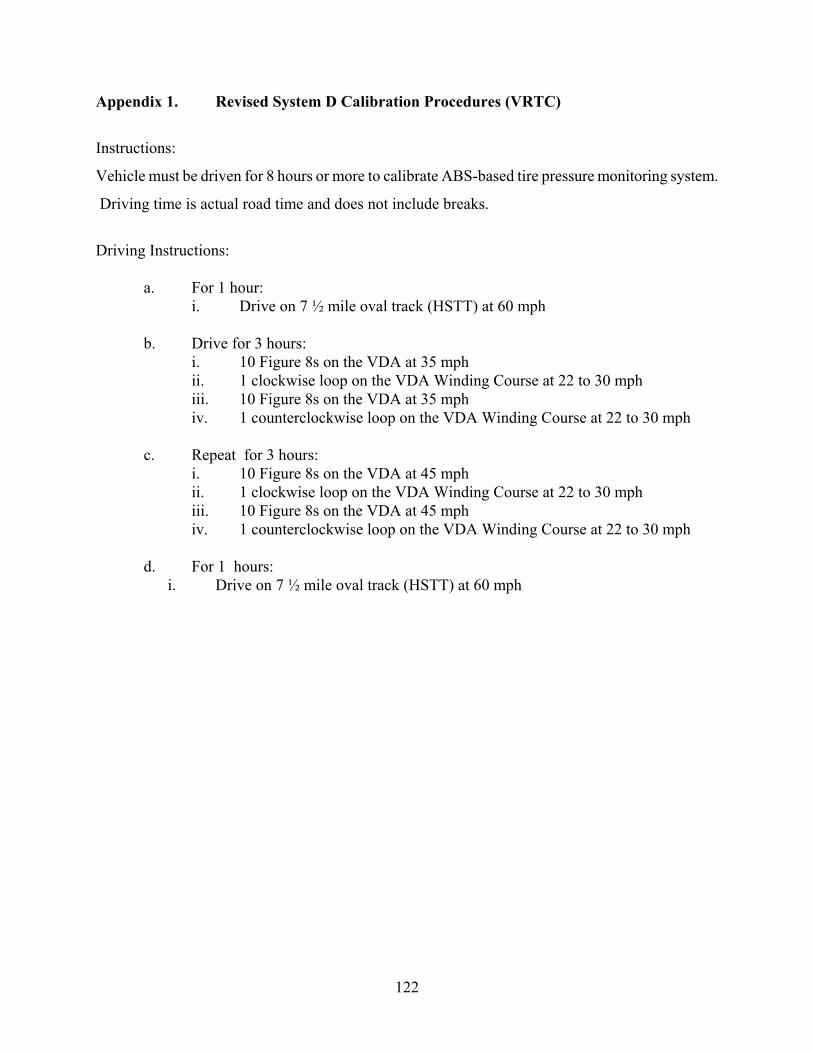
Appendix 1. Revised System D Calibration Procedures (VRTC)
Instructions:
Vehicle must be driven for 8 hours or more to calibrate ABS-based tire pressure monitoring system.
Driving time is actual road time and does not include breaks.
Driving Instructions:
a. For 1 hour: i. Drive on 7 ½ mile oval track (HSTT) at 60 mph
b. Drive for 3 hours: i. 10 Figure 8s on the VDA at 35 mph ii. 1 clockwise loop on the VDA Winding Course at 22 to 30 mph iii. 10 Figure 8s on the VDA at 35 mph iv. 1 counterclockwise loop on the VDA Winding Course at 22 to 30 mph
c. Repeat for 3 hours: i. 10 Figure 8s on the VDA at 45 mph ii. 1 clockwise loop on the VDA Winding Course at 22 to 30 mph iii. 10 Figure 8s on the VDA at 45 mph iv. 1 counterclockwise loop on the VDA Winding Course at 22 to 30 mph
d. For 1 hours: i. Drive on 7 ½ mile oval track (HSTT) at 60 mph
122
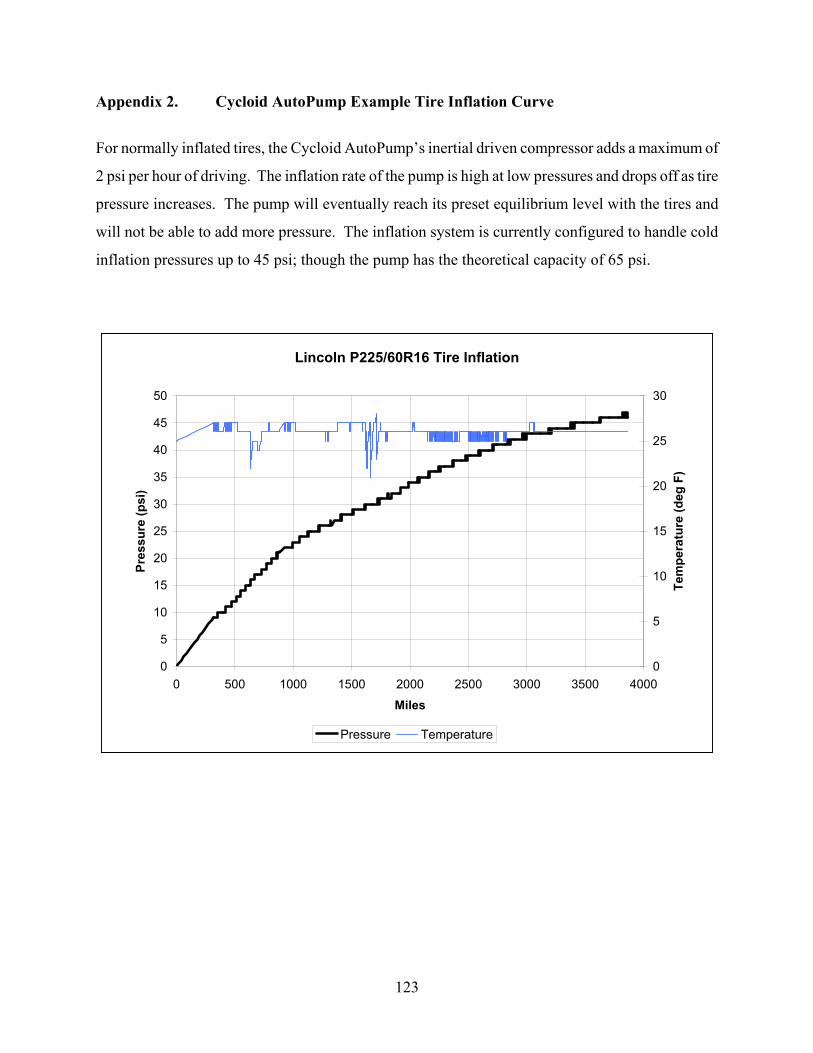
Appendix 2. Cycloid AutoPump Example Tire Inflation Curve
For normally inflated tires, the Cycloid AutoPump’s inertial driven compressor adds a maximum of
2 psi per hour of driving. The inflation rate of the pump is high at low pressures and drops off as tire
pressure increases. The pump will eventually reach its preset equilibrium level with the tires and
will not be able to add more pressure. The inflation system is currently configured to handle cold
inflation pressures up to 45 psi; though the pump has the theoretical capacity of 65 psi.
Lincoln P225/60R16 Tire Inflation
0
5
10
15
20
25
30
35
40
45
50
0 500 1000 1500 2000 2500 3000 3500 4000 Miles
Pres
sure
(psi
)
0
5
10
15
20
25
30
Tem
pera
ture
(deg
F)
Pressure Temperature
123
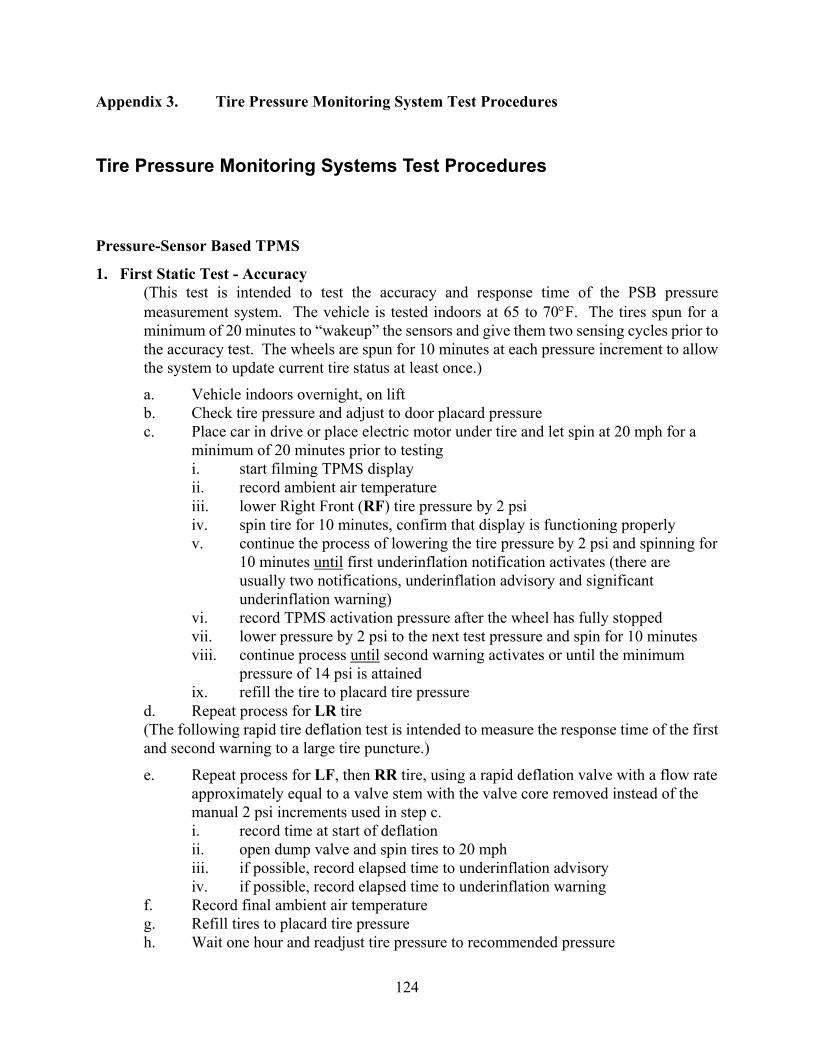
Appendix 3. Tire Pressure Monitoring System Test Procedures
Tire Pressure Monitoring Systems Test Procedures
Pressure-Sensor Based TPMS
1. First Static Test - Accuracy (This test is intended to test the accuracy and response time of the PSB pressure measurement system. The vehicle is tested indoors at 65 to 70°F. The tires spun for a minimum of 20 minutes to “wakeup” the sensors and give them two sensing cycles prior to the accuracy test. The wheels are spun for 10 minutes at each pressure increment to allow the system to update current tire status at least once.)
a. Vehicle indoors overnight, on lift b. Check tire pressure and adjust to door placard pressure c. Place car in drive or place electric motor under tire and let spin at 20 mph for a
minimum of 20 minutes prior to testing i. start filming TPMS display ii. record ambient air temperature iii. lower Right Front (RF) tire pressure by 2 psi iv. spin tire for 10 minutes, confirm that display is functioning properly v. continue the process of lowering the tire pressure by 2 psi and spinning for
10 minutes until first underinflation notification activates (there are usually two notifications, underinflation advisory and significant underinflation warning)
vi. record TPMS activation pressure after the wheel has fully stopped vii. lower pressure by 2 psi to the next test pressure and spin for 10 minutes viii. continue process until second warning activates or until the minimum
pressure of 14 psi is attained ix. refill the tire to placard tire pressure
d. Repeat process for LR tire (The following rapid tire deflation test is intended to measure the response time of the first and second warning to a large tire puncture.)
e. Repeat process for LF, then RR tire, using a rapid deflation valve with a flow rate approximately equal to a valve stem with the valve core removed instead of the manual 2 psi increments used in step c. i. record time at start of deflation ii. open dump valve and spin tires to 20 mph iii. if possible, record elapsed time to underinflation advisory iv. if possible, record elapsed time to underinflation warning
f. Record final ambient air temperature g. Refill tires to placard tire pressure h. Wait one hour and readjust tire pressure to recommended pressure
124

i. Record indoor temperature j. Move vehicle to outdoors and leave overnight
2. Second Static Test - Temperature Effects (This test is intended to evaluate the effects of temperature changes on PSB systemperformance. It explorers the influence of temperature compensation on warning thresholds.)
a. With the vehicle still outdoors, record outdoor ambient weather conditions b. Place vehicle on four jack stands c. Check, but do not adjust tire pressures from previous day d. Repeat First Static Test procedures c through g e. Move vehicles indoors and leave overnight
3. Third Static Test - Accuracy (This test is a repeat of the first static test and is intended to evaluate the repeatability of the warning thresholds)
a. Repeat First Static Test procedures a through g indoors (again for accuracy)
4. Human Factors Evaluation (A comprehensive evaluation of each user interface will be completed)
a. The vehicle will remain on the lift from the Third Static Test and run through various deflation cycles to evaluate the following human factors considerations: i. warning method ii. context of message iii. message timing iv. failure messages v. reset controls
5. Loaded Dynamic Test - Dynamic Warning Thresholds (This test evaluates the on-road response of the PSB system to a slow leak and also a medium sized tire puncture. In addition, the leaks are stopped as soon as the system’s first warning activates. The warning condition is monitored as brake snubs heat the tires and raise pressure back above the warning threshold. If the warning shuts off at the higher warmtire pressure, this may be an indication of possible “nuisance” warnings.)
a. Load vehicle to GVWR on calibrated vehicle scales (do not exceed either axle’s GAWR )
b. Move vehicle outdoors and allow tires to cool for at least one hour (test at ambient “cold” inflation pressure)
c. Record ambient weather conditions d. Adjust all tires to placard cold inflation pressure e. Test on the High Speed Test Track, Bituminous Asphalt Lane f. Vehicle speed: 60 mph g. Start data acquisition at a 20 Hz rate
125

h. Begin slowly leaking Right Front (RF) tire pressure at approximately 0.025psi/sec (1.5 psi/min) - Stop if 14 psi is reached
i. Trip first digital marker when the significant underinflation warning activates and stop the air leak i. get permission from TRC Control Tower to complete brake snubs in
asphalt lane ii. drive 3 laps (22.5miles) around TRC test track. Initiate a 60 to 20 mph
brake snub at 10 ft/s2 deceleration during each mile of driving. iii. Record warning signal status (on / off) at end of run.
j. Stop DAQ and refill the tire to placard tire pressure k. Repeat steps c through j for LR tire l. Initiate a rapid deflation rate of 0.1psi/sec (6psi/min) for RR tire - Stop if 14 psi is
reachedm. trip first digital marker when underinflation advisory activates (if the system has
two levels of notification of underinflation) n. trip second digital marker when the significant underinflation warning activates o. stop immediately at a safe track location and refill the tire to placard tire pressure p. Repeat step l for LF tire q. Record final ambient weather conditions
6. Loaded Dynamic High Speed Test (Explores the effects of high vehicle speeds on the TPMS threshold. High speeds will heat the tires, raise the pressure inside, and possibly turn off the low tire pressure warning. This is similar to the previous test but high speed is substituted instead of brake snubs for tire heating.)
a. Load vehicle to GVWR on calibrated vehicle scales (do not exceed either axle’s GAWR )
b. Record ambient weather conditions c. Test on the High Speed Test Track, Bituminous Asphalt Lane d. Start data acquisition at a 5 Hz rate e. Deflate LR tire to 2 psi below the average value of the first low pressure
indication from the two indoor static tests. f. Drive vehicle at 20 mph and confirm that warning system has detected the low
tire pressure g. If warning does not occur, lower tire pressure in 2 psi increments until dynamic
activation occurs - Stop if 14 psi is reached h. Drive the vehicle at 75 mph for 22.5 miles (3 laps around HSTT) and note the
status of the TPMS warning i. Stop data acquisition j. Record final ambient weather conditions
7. System Failure Effects Test (Since consumers will tend to rely on this monitoring system as a warning system, the drivermust be alerted to sensor failure.)
126

a. If possible, the TPMS will be made inoperable and the mode by which the system informs the driver will be noted i. this will entail coming back to the VRTC and removing or disabling one
sensor and then driving on the HSTT until a warning is detected or 0.5 hours is reached.
Wheel-Speed Based TPMS
1. Sensing Capabilities Test (For the following tests, it is only necessary to test whether the system activates for multiple tires low or not. ABS-based systems function better on roads with curves, hence the Winding Road Course AWRC” is used. This is a “best-case@ scenario, with just the empty vehicle and driver for load. The tires start out being set cold at recommended inflation pressure. The test tire(s) is set to 50 percent below the current pressure in that tire after the calibration and warm-up laps are completed. The vehicle is given more than 10 miles of driving to alert that the tire or tires 50 percent underinflated. Often, full resetting the system between tests requires vehicle specific procedures or even full recalibration.)
a. Load vehicle to LLVW on calibrated vehicle scales: LLVW = Empty vehicle + driver + observer + instrumentation [ Curb weight + 500 lb
b. Allow tires to cool for at least 1hr c. Set tire pressure to exact placard recommendations for given load d. Properly calibrate TPMS e. At WRC - drive 2 laps (3.0 miles) with all tires properly inflated f. Set RF tire to 50 percent below the current tire pressure or 16 psi minimum (for
safety). i. record pressures. ii. zero the trip odometer iii. drive 30mph until warning activates or 7 laps (10.5 miles) have elapsed iv. if TPMS warns, stop immediately and record distance to activation v. wait 15 minutes in pit area vi. after tires have cooled, refill tire to original recorded tire pressure vii. reset warning according to procedures (reset, do not recalibrate unless it is
required by the reset procedure) g. Repeat e.& f. for LR tire h. Repeat e.& f. for RF and LF tires simultaneously i. Repeat e.& f. for RF and RR tires simultaneously j. Repeat e.& f. for LF and RR tires simultaneously k. Repeat e.& f. for RF, LF, LR tires simultaneously l. Repeat e.& f. for all four tires simultaneously
2. First Accuracy Test - LLVW (For the two tires, RF and LR, it can be determined exactly where the system activated, i.e. 20 percent low, 30 percent low... A good indicator of WSB system resolution)
127
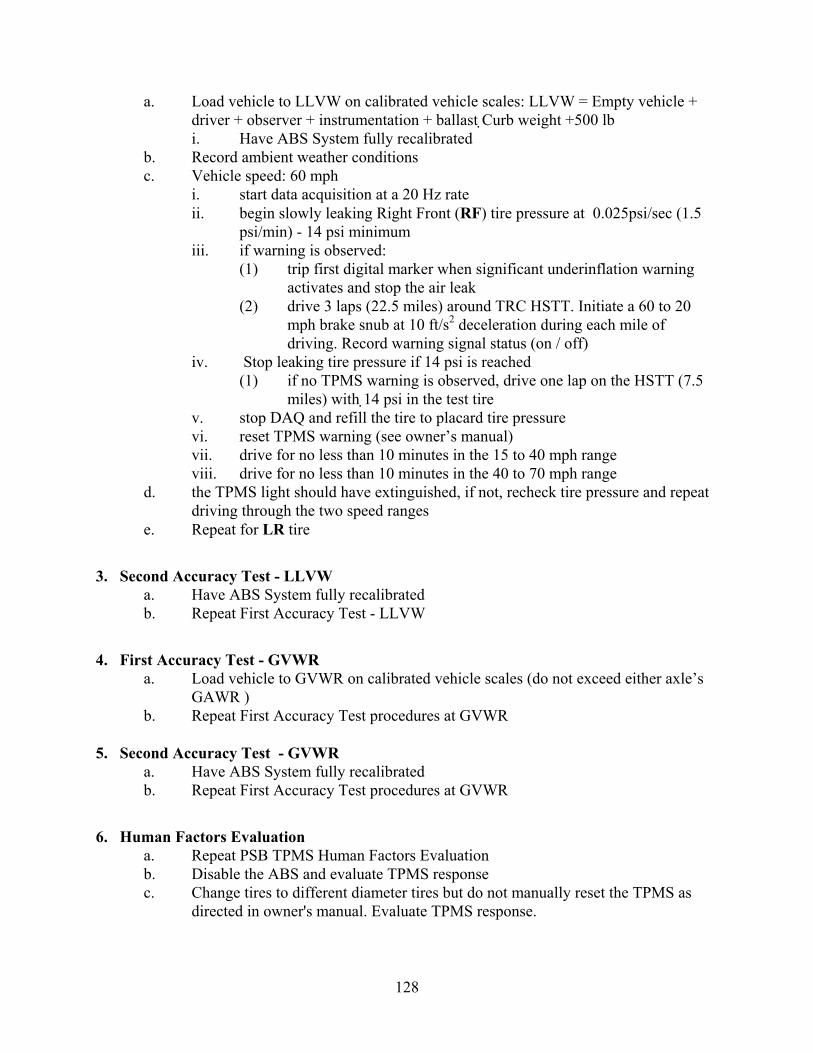
a. Load vehicle to LLVW on calibrated vehicle scales: LLVW = Empty vehicle + driver + observer + instrumentation + ballast Curb weight +500 lb i. Have ABS System fully recalibrated
b. Record ambient weather conditions c. Vehicle speed: 60 mph
i. start data acquisition at a 20 Hz rate ii. begin slowly leaking Right Front (RF) tire pressure at 0.025psi/sec (1.5
psi/min) - 14 psi minimumiii. if warning is observed:
(1) trip first digital marker when significant underinflation warning activates and stop the air leak
(2) drive 3 laps (22.5 miles) around TRC HSTT. Initiate a 60 to 20 mph brake snub at 10 ft/s2 deceleration during each mile of driving. Record warning signal status (on / off)
iv. Stop leaking tire pressure if 14 psi is reached (1) if no TPMS warning is observed, drive one lap on the HSTT (7.5
miles) with 14 psi in the test tire v. stop DAQ and refill the tire to placard tire pressure vi. reset TPMS warning (see owner’s manual) vii. drive for no less than 10 minutes in the 15 to 40 mph range viii. drive for no less than 10 minutes in the 40 to 70 mph range
d. the TPMS light should have extinguished, if not, recheck tire pressure and repeat driving through the two speed ranges
e. Repeat for LR tire
3. Second Accuracy Test - LLVW a. Have ABS System fully recalibrated b. Repeat First Accuracy Test - LLVW
4. First Accuracy Test - GVWR a. Load vehicle to GVWR on calibrated vehicle scales (do not exceed either axle’s
GAWR ) b. Repeat First Accuracy Test procedures at GVWR
5. Second Accuracy Test - GVWR a. Have ABS System fully recalibrated b. Repeat First Accuracy Test procedures at GVWR
6. Human Factors Evaluation a. Repeat PSB TPMS Human Factors Evaluation b. Disable the ABS and evaluate TPMS response c. Change tires to different diameter tires but do not manually reset the TPMS as
directed in owner's manual. Evaluate TPMS response.
128

7. Loaded Dynamic Test on Loose Surface (WSB systems have trouble warning on loose surfaces since they rely on wheel speed measurements. On loose surfaces, the wheels are constantly changing speed due to varying levels of slip and loss of solid contact with the surface.)
a. Load vehicle to GVWR on calibrated vehicle scales (do not exceed either axle’s GAWR )
b. Repeat First and Second Accuracy Tests on the gravel load c. Follow posted gravel road speed limits
8. Empty Dynamic Test on Loose Surface a. Load vehicle to LLVW on calibrated vehicle scales: LLVW = Empty vehicle +
driver + observer + instrumentation + ballast [ Curb weight +500 lb b. Repeat one-tire Accuracy Tests on the gravel load c. Follow posted gravel road speed limits
Notes:
Weather condition data includes: Time, dry bulb temperature in deg F, wind speed and direction,
percent relative humidity, barometric pressure in inches of mercury (Hg), and sky and track
conditions.
129
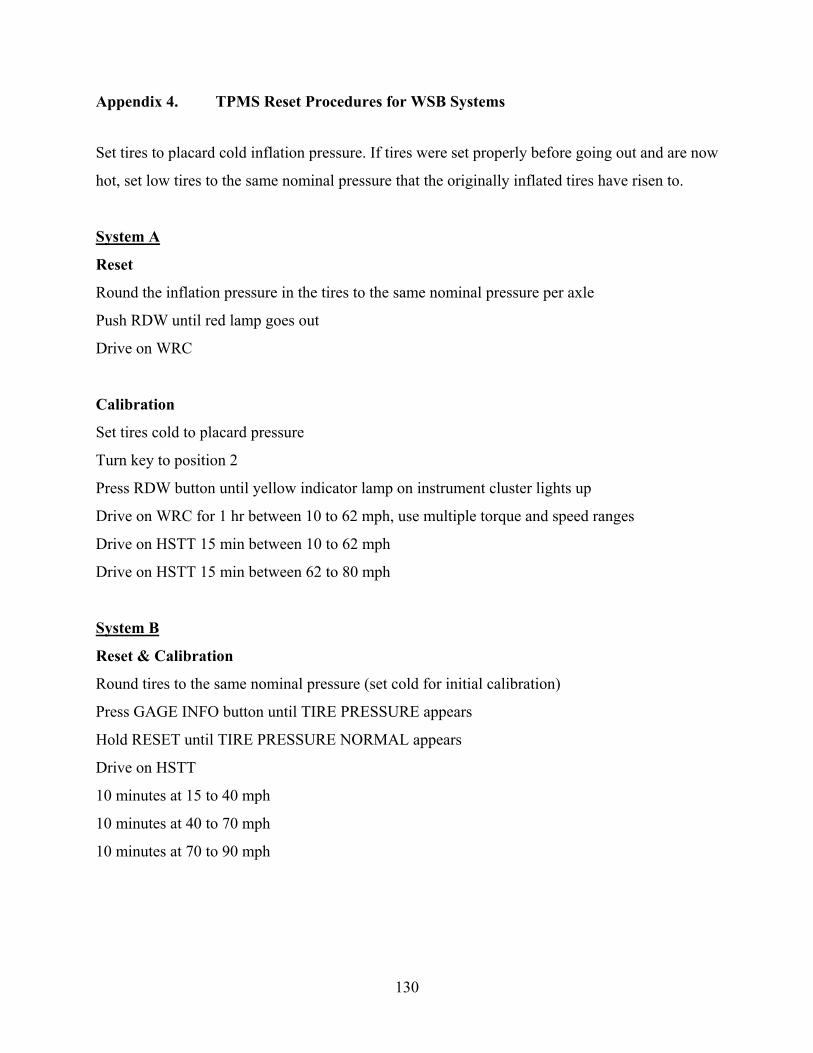
Appendix 4. TPMS Reset Procedures for WSB Systems
Set tires to placard cold inflation pressure. If tires were set properly before going out and are now
hot, set low tires to the same nominal pressure that the originally inflated tires have risen to.
System A
Reset
Round the inflation pressure in the tires to the same nominal pressure per axle
Push RDW until red lamp goes out
Drive on WRC
Calibration
Set tires cold to placard pressure
Turn key to position 2
Press RDW button until yellow indicator lamp on instrument cluster lights up
Drive on WRC for 1 hr between 10 to 62 mph, use multiple torque and speed ranges
Drive on HSTT 15 min between 10 to 62 mph
Drive on HSTT 15 min between 62 to 80 mph
System B
Reset & Calibration
Round tires to the same nominal pressure (set cold for initial calibration)
Press GAGE INFO button until TIRE PRESSURE appears
Hold RESET until TIRE PRESSURE NORMAL appears
Drive on HSTT
10 minutes at 15 to 40 mph
10 minutes at 40 to 70 mph
10 minutes at 70 to 90 mph
130

System C
Round tires to the same nominal pressure (set cold for initial calibration)
Turn off ignition
Turn key to position 2
Press button until the display says ASET TIRE PRESSURE@ for several seconds
Drive 15 minutes on the WRC
System D
Reset
Round tires to the same nominal per axle pressure
Drive until light warning light goes out
Calibration
Set tires cold to placard pressure
Ignition on
Hold reset button until warning light flashes 3 times
Drive for up to 8 hours depending on maneuvers
131
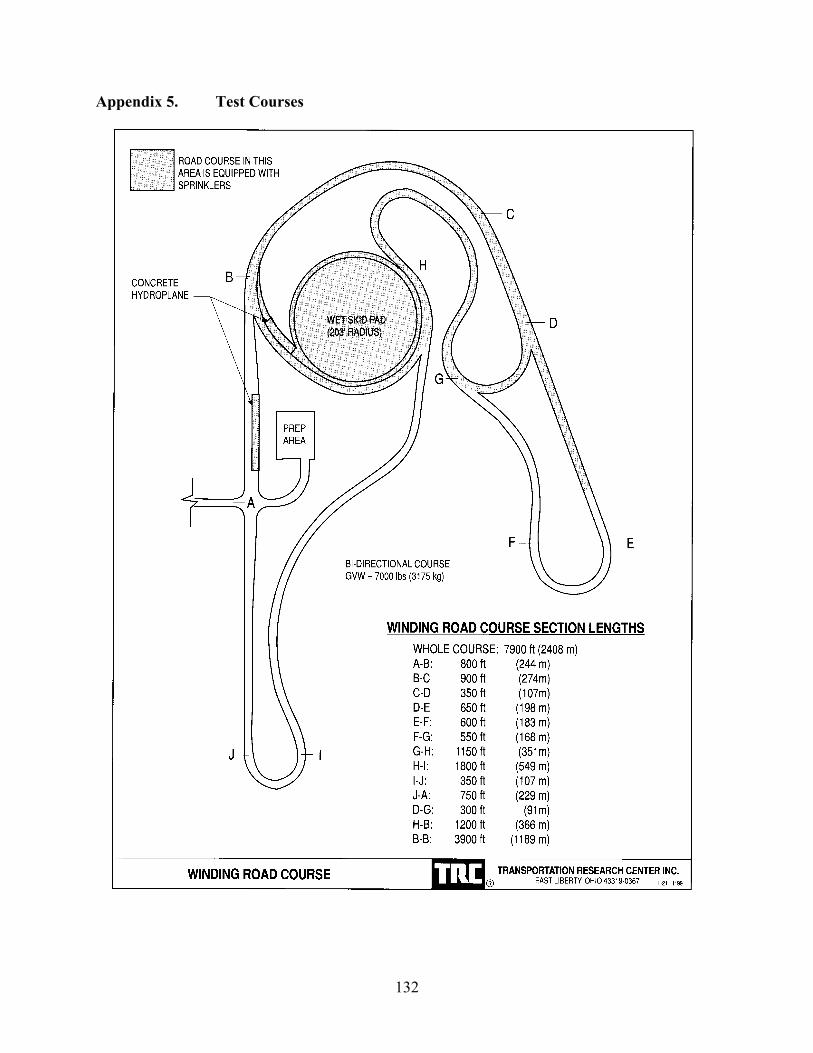
Appendix 5. Test Courses
132
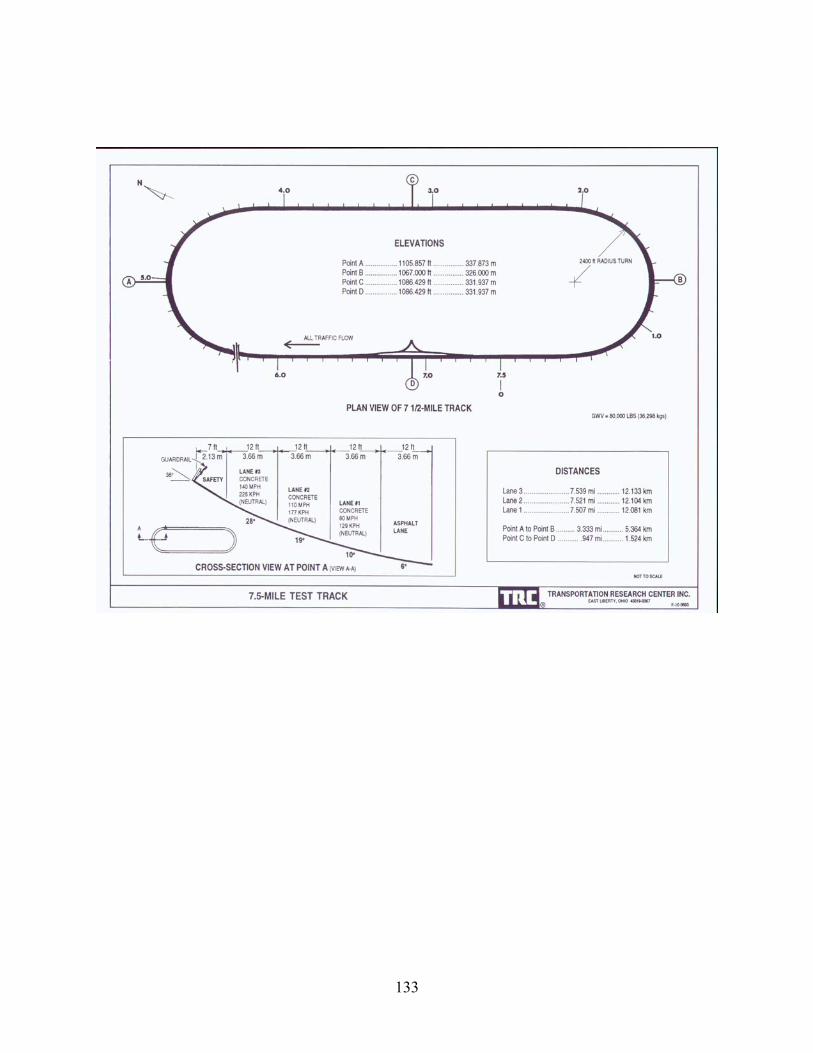
133
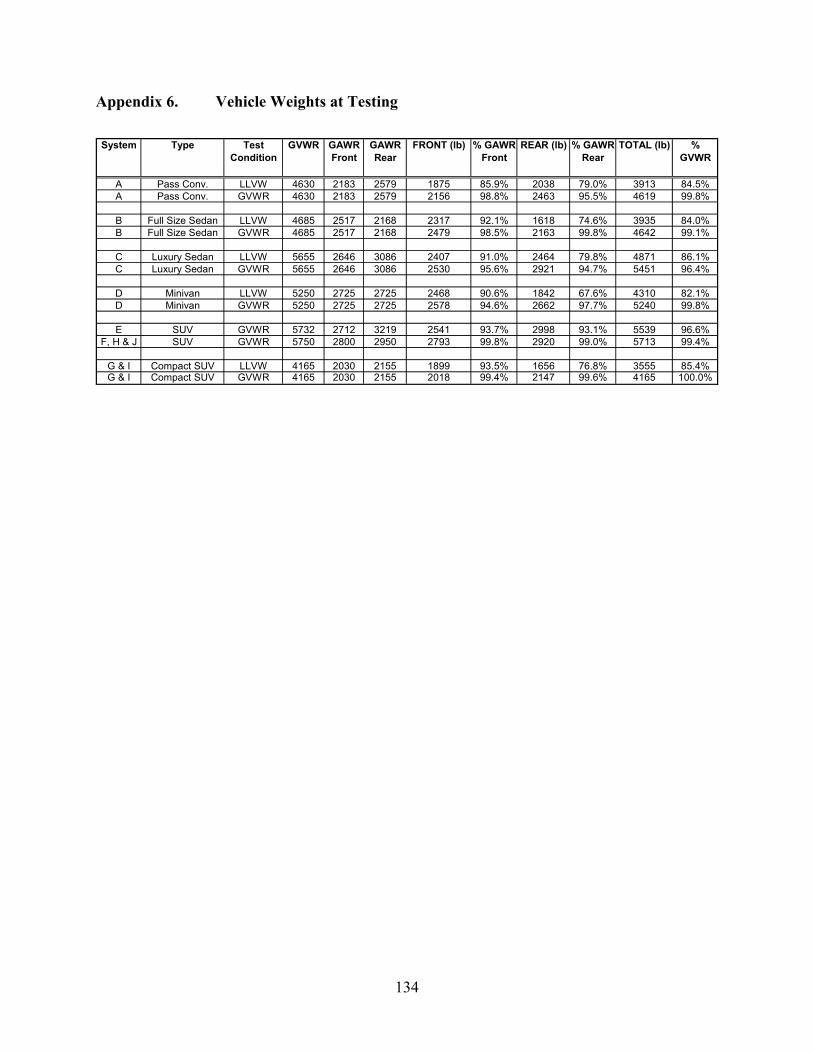
Appendix 6. Vehicle Weights at Testing
System Type Test Condition
GVWR GAWR Front
GAWR Rear
FRONT (lb) % GAWR Front
REAR (lb) % GAWR Rear
TOTAL (lb) % GVWR
A Pass Conv. LLVW 4630 2183 2579 1875 85.9% 2038 79.0% 3913 84.5% A Pass Conv. GVWR 4630 2183 2579 2156 98.8% 2463 95.5% 4619 99.8%
B Full Size Sedan LLVW 4685 2517 2168 2317 92.1% 1618 74.6% 3935 84.0% B Full Size Sedan GVWR 4685 2517 2168 2479 98.5% 2163 99.8% 4642 99.1%
C Luxury Sedan LLVW 5655 2646 3086 2407 91.0% 2464 79.8% 4871 86.1% C Luxury Sedan GVWR 5655 2646 3086 2530 95.6% 2921 94.7% 5451 96.4%
D Minivan LLVW 5250 2725 2725 2468 90.6% 1842 67.6% 4310 82.1% D Minivan GVWR 5250 2725 2725 2578 94.6% 2662 97.7% 5240 99.8%
E SUV GVWR 5732 2712 3219 2541 93.7% 2998 93.1% 5539 96.6% F, H & J SUV GVWR 5750 2800 2950 2793 99.8% 2920 99.0% 5713 99.4%
G & I Compact SUV LLVW 4165 2030 2155 1899 93.5% 1656 76.8% 3555 85.4% G & I Compact SUV GVWR 4165 2030 2155 2018 99.4% 2147 99.6% 4165 100.0%
134

Appendix 7. TPMS Adapter Plate Assembly
A rubber hose threaded into the hole in the top of the adapter plate connected the plate to the tire’s
valve stem. Three extra-long stainless steel lug nuts replaced the normal nuts and connected the
plate to the wheel. The plate and the hose connecting it to the valve stem rotate with the wheel. On
the other side of the rotating air coupling (rotary union), a plastic hose connected the union to the
pressure manifold inside the vehicle. The plastic hose was taped to the car to prevent it and the
outside piece of the rotary union from rotating.
135
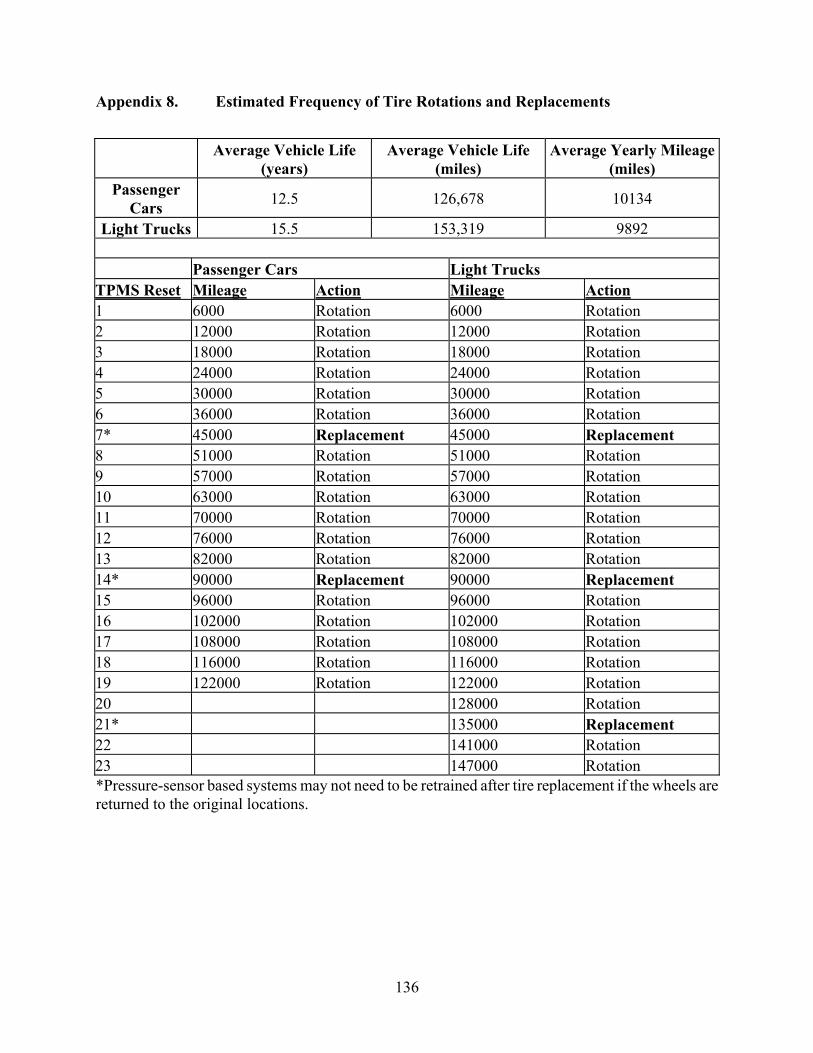
1 2 3 4 5 6
Appendix 8. Estimated Frequency of Tire Rotations and Replacements
Average Vehicle Life (years)
Average Vehicle Life (miles)
Average Yearly Mileage (miles)
Passenger Cars 12.5 10134
Light Trucks 15.5 9892
Passenger Cars Light Trucks TPMS Reset Mileage Action Mileage Action
Rotation 6000 Rotation Rotation 12000 Rotation Rotation 18000 Rotation Rotation 24000 Rotation Rotation 30000 Rotation Rotation 36000 Rotation
7* 45000 Replacement 45000 Replacement 8 Rotation 51000 Rotation 9 Rotation 57000 Rotation 10 Rotation 63000 Rotation 11 Rotation 70000 Rotation 12 Rotation 76000 Rotation 13 Rotation 82000 Rotation 14* 90000 Replacement 90000 Replacement 15 Rotation 96000 Rotation 16 Rotation 102000 Rotation 17 Rotation 108000 Rotation 18 Rotation 116000 Rotation 19 Rotation 122000 Rotation 20 128000 Rotation 21* 135000 Replacement 22 141000 Rotation 23 147000 Rotation
126,678
153,319
6000 12000 18000 24000 30000 36000
51000 57000 63000 70000 76000 82000
96000 102000 108000 116000 122000
*Pressure-sensor based systems may not need to be retrained after tire replacement if the wheels are returned to the original locations.
136