an evaluation of foods processed in tray … · ir natick/tfr.46/011 / an evaluation of foods...
TRANSCRIPT

Ir
NATICK/TfR.46/011 /
AN EVALUATION OF FOODS PROCESSEDIN TRAY PACK VERSUS TWO STANDARD
FOOD SERVICE CONTAINERSPart 1: Sensory, Container and Bacteriological
N. Tests00
¢d BYVol ROBERT A. KLUTER
JOSEPH W. SZCZEBLOWSKIgMARGARET BRANAGAN
FINAL REPORT 1976-1979
FEBRUARY 1986
APPROVED FOR PUBLIC RELEASE;DISTRIBUTION UNLIMITED
UNITED STATES ARMY NATICKRESEARCH, DEVELOPMENT AND ENGINEERING CENTER
NATICK, MASSACHUSETTS 01760-5018
FOOD ENGINEERING DIRECTORATE
Disclaimers
The findings contained in this report
are not to be construed as an official
Department of the Army position unless
so designated by other authorized
documents.
Citation of trade names in this report
does not constitute an official endorse-
ment or approval of the use of such items.
DESTRUCTION NOTICE
For classified documents, follow the procedures in DoD
5200.1-R, Chapter IX or DoD 5220.22-M, "Industrial Security
Manual," paragraph 19. For unclassified documents, destroy
by any method which precludes reconstruction of the document.

. . . . . . - ....- --
UNCLASSIFTED
REPORT DOCUMENTATION PAGE OMB No 0704-01 8E__p Date Jun 30, 19 "
Ta REPORT SECURITY CLASSIFICATION lb. RESTRICTIVE MARKINGS I
UNCLASSIFIED nIl2a SECURITY CLASSIFICATION AUTHORITY 3. DISTRIBUTION IAVAILABILITY OF REPORTn/a %
2b. DECLASSIFICATION/DOWNGRADING SCHEDULE Approved for public release? distribution % ,n/a unlimited.
4 PERFORMING ORGANIZATION REPORT NUMBER(S) S. MONITORING ORGANIZATION REPORT NUMBER(S)
NATICK/TR-86/011
6a. NAME OF PERFORMING ORGANIZATION 6b. OFFICE SYMBOL 7a. NAME OF MONITORING ORGANIZATION
6c. ADDRESS (ty, State, and ZIP Code) 7b. ADDRESS (City, State, and ZIP Code)U.S. Army Natick RD&E CenterNatick, MA 01760-5018
Ba. NAME OF FUNDINGISPONSORING Sb. OFFICE SYMBOL 9. PROCUREMENT INSTRUMENT IDENTIFICATION NUMBERORGANIZATION W appkab)
8c. ADDRESS (City, State, and ZIP Code) 10. SOURCE OF FUNDING NUMBERSPROGRAM PROJECT TASK IWORK UNITELEMENT NO. NO NO. ACCESSION NOAH99BC I1L762724 --'
11 TITLE (Include Security Classification)An Evaluation of Foods Processed in Tray Pack Versus Two Standard Food Service Containers.Part 1: Sensory, Container and Bacteriological Tests
12 PERSONAL AUTHOR(S)
Kluter. Robert A: Szczeblowski. Josnh_ and . r-An-n,-- n Mrnro.13a. TYPE OF REPORT I13b. TIME COVERED f14. DATE OF REPORT (Year, Month, Day) 1S. PAGE COUNTFinal FROM 1976 TO 1979 February 1986 I -67-
16. SUPPLEMENTARY NOTATION
17 COSATI CODES 18. SUBJECT TERMS (Continue on reverse if necessary and identify by block number)FIELD GROUP SUB-GROUP TRAY PACK(S) RATIONS PACK AGING CWNSUIE ACCEPTANCE
CANS ENTREES NUTRITION ALUMINUM FOIL
CYLINDRICAL FOOD PROCESSING HEATING OONTAINERS9 ABSTRACT (Continue on reverse if necessary and identify by block number)
" Purpose of the study was to evaluate nine main meal foods over a 36-month period ofstorage. Three processingipackaging combinations of each food were included: (1) precookedfrozen, packed'tn half-size steamtable aluminum foil trays; (2) heat-processed in cylindricalNo. 10 cans; and (3) heat-processed in rectangular tray cans. ' Frozen-products were storedat a constant o-188C.0{F'-Ttheat-processed products at 21 and 38C.(70 and IoOOF).A Productswere evaluated initially and following 6, 12, 18, 24 and 36 months storage. Two sensorypanels were used concurrently for product evaluations: (1) a panel of food technologistsusing a quality evaluation scale, and (2) a Natick RD&E Center employee panel using anhedonic scale. In addition to the sensory evaluations, interior surfaces of the containerswere examined for corrosion after selected periods of storage. Prior to initial and six-month evaluations, all products were bacteriologically cleared for consumption.
Sensory tests generally indicated that expected storage life of Tray Packs exceededthat of cylindrical cans at both storage temperatures. Precooked frozen products were
20 DISTRIBUTION/AVAILABILITY OF ABSTRACT 21 ABSTRACT SECURITY CLASSIFICATION2 UNCLASSIFIED/UNLIMITED 0 SAME AS RPT. 0] DTIC USERS
22a. NAME OF RESPONSIBLE INDIVIDUAL 22b TELEPHONE (Include Area Code) 22c OFFICE SYMBOLMARY V. KLICKA AV 256-5201 TRNC-
DO FORM 1473, 84 MAR 83 APR edition may be used until exhausted SECURITY CLASSIFICATION OF THIS PAGEAll other editions are obsolete UNCIASS I Fl ED (c nt nu d
(continued) """- - o . ." " . . • . .• . . . . . . . - . . . . . . . . ... . -
.. -- - . -,-. ..,k. ' - ' .j . .: ', '-...', -', .', -: ,_ ': ,' , . • ", '. " , : ." ," % .".,, ." ," , - . " ," ," " " ," .',.." • ," ." o" " , - ,,- -" -. ". .- ".

UNCLASSIFIED 61.
(continued) . , 'a
* 7generally highest rated, and No. 10 heat-processed produ ts were""1pwest. Thus, of the
03 heat-processed products, the Tray Pack foods were rated lpreferredO. The expected storage
r 0'" life in aths-A--given- -TA t.cookd--'a-- for each No. 10 canand Tray-Pack at both 210C and 38 C.... & The interior enamel food contact coating of the tin-free steel container ved F'te N.L;Lk E uenter-p-roducvd [-. was the most resistant to attack over the 36-month
period of the study.) Least resistant was the aluminum foil pan which, for two precooked
and frnzow s, was corroded/pitted after 18 months.*. In the bacteriological test, both procured and Natick RD&E Center-produced foods
were completely sterile when examined prior to the initial and six-month sensory tests.
m' *Precooked frozen foods had aerobic plate counts that were well below Military standards
and contained no fecal coliforms.
4- -o.
: Accestc5 k27
'NTT3 ,'1 .,
~DTIC
It,- _ 1.'- E L EC TE f!,, ...... ! APR 2 9 1986 .
-' d-
* " . " 1.°% .',
-°i "
• -,, .-% .,-.....I.. .,.. ..,..L,,,-. ... ..,,K..W. , , ...-. .., , -. ... .-, ..,.-,-.... .

PREFACE
This study was initiated by the Food Engineering Directorate (FED), U.S.Army Natick Research, Development and Engineering Center (NRDEC),* andfinanced under Project 1L762724AH99 - Joint Services Food/NutritionTechnology, Technical Effort AH99BC - Food Packaging during 1976 to 1979.
Of the nine entree food products evaluated, four were developed by thelate Raymond G. Young, Food Technologist in FED's Product Development andEngineering Branch. The products that were filled and closed ;n number 10cans and Tray Packs were under the supervision of Joseph Szczeblowski,formerly Physical Scientist (Packaging) in FED's Subsistence ProtectionBranch, who developed the test and evaluation plan with other collaboratorsand was responsible for storage and withdrawal of products at scheduledintervals. Product sensory evaluations that involved FED food technologistsand use of the food quality scale were conducted by FED's Ration Design andEvaluation Branch, Mary V. Klicka, Chief; Margaret Branagan, same Branch,constructed the Appendix Tables. Robert A. Kluter designed and supervised theconsumer evaluations conducted by the Sensory Analysis Branch, Science andAdvanced Technology Directorate (SATD).
The authors are indebted to Dr. Gerald Powell, formerly StaffStatistician for the Behavioral Sciences Division, SATD, for reanalyzing theacceptability data and for his helpful interpretations of the statisticalprocedures.
This report is Part I of a two-part series. Part 2 is subtitledNutritional Analyses by Leslie A. Wyzga, Mary V. Klicka, Christine A. Kubik,Joseph W. Szceblowski (NATICK/TR-86/012).
*Formerly, Food Engineering Laboratory, U.S. Army Natick Research andDevelopment Center.
iii
,r.'.-''L ;."; ; ' . -' - - . . = = 2 . .-. - -. --.-.-. -.. - . - . . . . . . .-. •. .- - . . -.J . ..q. *es -- . * U ' V-b ""o " ". . . - ' . " % ""%"%, %
TABLE OF CONTENTS
Page
PREFACE iii
LIST OF ILLUSTRATIONS vi
INTRODUCTION I
EXPERIMENTAL APPROACH 2
Design of Experiment 2
Sources, Preparation and Presentation of Foods for Sensory ..1
Panel Evaluations 3Selection of Panelists 7Statistical Analyses of Sensory Data 8Food Containers 9Bacteriological Tests 9Nutritional Analyses 10
RESULTS AND DISCUSSION 10
General 10Open-Ended Comments 11Sensory Panel Results 11Container Performance 18Bacteriological Findings 19
SUMMARY AND CONCLUSIONS 20
Expected Storage Life of Products 20 I-
Rank Sensory Comparison of Precooked Frozen and Heat '.Processed Products for Overall Quality and Acceptability 22
Container Performance During Storage 23Bacteriological Tests 24
REFERENCES 25
APPENDICES PA'
A. Label Declarations for Entrees Produced by Kraft 26
B. Formulas and Processing Procedures for Entrees Producedby Natick RD&E Center 31
C. Quality Scoring Sensory Panel Instructions, Descriptive Termsand Ingredient Declarations for Nine Entrees 38
D. Sensory Evaluation Rating Forms 41E. Mean Quality Scores for Nine Entrees 43F. Hedonic Scale Acceptability Data for Nine Entrees 52
G. Quality Evaluation and Consumer Acceptance Two-Factor Analysisof Variance for Nine Heat-Processed Entrees Stored up to36 Months at 210 C 54
H. Quality Evaluation and Consumer Acceptance Three-Factor Analysis
of Variance for Nine Heat-Processed Entrees Stored up to18 Months 59
I. Results of Container Examinations, Nine Entrees, After Storage 63
v
%..........................
LIST OF ILLUSTRATIONS
Figures Page
1. Container and Process, Storage Conditions, and Other 4Analyses Performed for Nine Entrees
2. Beef Stew, Packed in the Three Container Types 5,
Investigated
3. Beef Burgundy with Vegetables and Rotini Packed in the Three 6
Container Types Investigated
Tables
. 1. Reheating, Schedule, Nine Entree Items, General Electric 3Model CN90A Forced - Convection Oven Preheated to 1770C
2. Expected Months Storage Life for Nine Entree Items Subjected 21to Five Process/Container/Storage Temperature Conditions
3. Means and Ranks for Overall Quality and Acceptability 23
E-1. Mean Quality Scores, Beef Burgundy with Rotini 42
E-2. Mean Quality Scores, Beef Ravioli 43
E-3. Mean Quality Scores, Beef Stew 44
E-4. Mean Quality Scores, Chicken Cacciatore 45
E-5. Mean Quality Scores, Chili con Carne 46
E-6. Mean Quality Scores, Creamed Chicken 47
E-7. Mean Quality Scores, Macaroni and Cheese 48W.
E-8. Mean Quality Scores, Smoky Pork 49
E-9. Mean Quality Scores, Swiss Steak 50
vi
.d6.
.- * ~ * * . . .* * * .~ .;-*4, 4. .*% .. ., - .. , " . . *".-, " ,r ., :. -"- ," . - ." " . : , , .: .'' -.' ,.," ,... ' ' " ' ' ,.'*' '

AN EVALUATION OF FOODS PROCESSED IN TRAY PACK VERSUS TWO STANDARDFOOD SERVICE CONTAINERS
PART 1. Sensory, Container and Bacteriological Tests
INTRODUCTION
For the U.S. high-volume segment of the food service industry, the 1970swere marked by an emphasis on convenience foods, brought about in great partby rapidly rising labor and energy costs. Simultaneously, the militaryservices were considering new or redesigned garrison and field feeding systemsto reduce the numbers of trained cooks needed to facilitate rapid deploymentof food service units in the field.1
U.S. Army Natick Research, Development and Engineering Center (NRDEC)food and packaging scientists first became interested in the concept ofhermetically sealed multi-serving containers when they learned that in 1969 aSwiss group had developed a line of heat-sealable, sterilizable, single-servecontainers.2
In the early 1970s, major U.S. packaging materials and containermanufacturers were contacted regarding their interest in developing arectangular half-size steamtable container that would fit into standardsteamtable openings. 'Of various containers evaluated for resistance to heat-processing and to contact with corrosive foods, one emerged as worthy offurther evaluation. It was a two-piece unit consisting of a body air-drawnfrom an aluminum polypropylene laminate and a heat-sealable membrane cover.Preliminary consumer evaluations of three entree items over a six-monthstorage period indicated that two of them were as acceptable, or more so, thantheir precooked frozen equivalents. The other, a macaroni and cheese item,was more acceptable in frozen form. Container performance proved satisfactoryfor all three items over the term of the study.'
By the mid-1970s, Kraft, Inc., and Central States Can Co., independent ofeach other, developed rectangular tinplate and tin-free steel containers,respectively, with double-seamed lids. These containers had the same capacityas a number 10 can, but required approximately one-half the heat processingtime in a still retort to achieve commercial sterility. For serving, theywere reheatable in a water bath, could be opened with a standard can opener,and would fit in a standard steamtable, two trays per opening.4 5 In late1975, Kraft be an test-marketing five entrees in their version of thecontainer. 6',7 ,9 High acceptability of these items was claimed in threedifferent food service settings - a private hospital, a university and apublic school system.
Concurrently, the four U.S. military services were developing field foodservice system concepts that included convenience foods packed in the traycontainer, referred to hereafter as the Tray Pack. The first field consumeracceptance data on these foods was obtained during four Air Force exercises.Acceptability of the majority of the items -entrees, starches, vegetables,
2 .. .. .. .
.6*_
e7
and desserts - was considered high as were overall meal ratings for the two 0.0
menus served. In another garrison evaluation, six Tray Pack entrees were ,rated against their precooked frozen and kitchen prepared counterparts. TrayPack item acceptability was equivalent to or better than kitchen prepared. Ina third study, ratings of NRDEC employee consumer panels were combined withthose from trials with two other military services. Of 22 Tray Pack entreeitems evaluated, ratings for 20 of these were considered in the acceptablerange (6.0 or higher on the nine-category hedonic scale), confirming the otherstudies.
5
To this point, no studies had been conducted with the steel container todetermine: (1) comparative sensory quality and acceptability with no. 10 cansand precooked frozen packed foods; (2) shelf life of Tray Pack vs. the no. 10can at ambient and stressful storage temperatures; (3) changes in nutrient
composition, in particular, vitamin levels from raw to processed phases andwhen reheating and holding processed foods; (4) bacterial counts, bothpostprocessing and after six months of storage; and (5) container integrityover time. This study was an effort to address the above informationneeds/objectives and provide a data base to facilitate successful launching ofTray Pack foods in various military field food service systems.
EXPERIMENTAL APPROACH
Design of Experiment
Two concurrent sensory studies were designed to assess, separately,changes over a 36-month period in quality and acceptability occurring in ninemeat, poultry, or pasta combination foods. The independent variablesconsidered in this study were as follows.
1. Storage time. Sensory evaluations were conducted shortly afterpacking (initially) and after 6, 12, 18, 24, and 36 months.
2. Containers and Processes
a. Frozen, precooked (FP). NRDEC products were packaged in halfsteamtable size Ecko disposable formed aluminum foil pans with a full curlrim. Covers were rigid foil crimped on by an Ecko closing machine describedin Appendix B. The Kraft-produced items were packed in Reynolds tray of thesame construction with plug-type foil coated paperboard lids crimped on.
b. No. 10 cylindrical can (CC), hermetically sealed. Products wereheat processed to commercial sterility.
c. Tray Pack (TP). The container, as previously described, hadcontents processed to commercial sterility.
3. Storage Temperatures. The frozen precooked products were stored at aconstant 18°C; by design, no further evaluations were conducted after the 18-month withdrawal. Thermally processed products were divided into sublots,
2

which were stored at 210C and 380 C. After the 18 month evaluation, again bydesign, tests on 380C stored products were terminated. Evaluations of 210Cstored products were continued after 24 months and concluded after 36 monthsof storage.
Figure 1 is a schematic for the sensory evaluations and other analysesperformed during this study. Figures 2 and 3 are photographs of the threecontainer types investigated.
Sources, Preparation and Presentation of Foods for Sensory Panel Evaluations
Five of the nine entrees were commercial items produced by Kraft, Inc. inall three container types. These were: Beef, Ravioli, Beef Stew (Figure 2),Chili with Beans, Creamed Chicken (Chicken a la King), and Macaroni andCheese. Formulas were not made available to NRDEC, but label declarations inorder of predominance are given in Appendix A, Parts 1 through 5. Thestandard cylindrical can for the creamed chicken pack was a no. 3 tall size;all others were no. 10. The other four products were formulated and producedby technologists in the Food Engineering Laboratory's Pilot Plant. Thesewere: Beef Burgundy with Rotini (Figure 3), Chicken Cacciatore, Smoky Pork (abarbecue-type item), and Swiss Steak. Formulas and processing procedures forthese items are given in Appendix B. Note that for each of these fourproducts, frozen and heat processed packs were prepared in the same manner,except for the starches used in sauces or gravies. Products for bothacceptance testing and sensory quality scoring were reheated simultaneously ina forced-convection oven. Table 1 indicates the experimentally derived reheattimes at 177 0 C to reach the desired serving temperature.
TABLE 1. Reheating Schedule, Nine Entree Items, General Electric ModelCN90A Forced -Convection Oven Preheated to 1770C*
Process/PackageItem Frozen Precooked Cylindrical Can Tray Pack
(Minutes)
Beef Burgundy with Rotini 105 55 35
Beef Ravioli 80 55 35
Beef Stew 90 55 35
Chicken Cacciatore 100 50 35
Chili con Carne 60 45 30
Creamed Chicken 70 55 30
Macaroni & Cheese 70 55 25
Smoky Pork 100 50 35
Swiss Steak 105 55 35
RTime Required to reach 740C serving temperature.
3
is..

. 0) L .*04 LO04J0 C
tn U 41' L- in-
(L) t 00 1 WDL. 0 0C/~u ~ 4J) -
4-) -
u4-V) 7 0
-J; .l; 10)(
0 - . =0 C0r
w)U C cCD 3r 0o0
3C 0)
C 4 '
-0 C
C0 C)
u- f0.
--- ---- 0 0 cCL L
00cx ~ cc oo - 4).6) V
C ~~a 4-b Enci ou "aV)0) 0
0.) 0 &LCL 0 0 "
-) CX 0).
OL- Luu >
to LALJ
L) 0- L
SIL
U w 0(U 0
ec <L) 4 LA-W 4-
C). ? .h ~ 3 ~ k , ~ . LL-- -. 4Kj-.1 ~ *. * * *

%4e
II.
U. 41
a av
C up
if U7.7

-. - - .'& - a -
4-.
4-.
I;F.1I* a..
SaS
.1*U0 ~6U
Aa
-4
US
- a4.'
0 I- 00
,I.m
00U Eu amu SN £50 mtm U
w U 5~ ii -4- u.~( A
Ugs S
S
*~ 4.'
as
:A
U~i.4SS
Sadbe
-4hi
6/
6
.J
Procedures were as follows:
1. Frozen precooked foods. Containers were kept in frozen conditionuntil reheated. They were placed in the preheated oven after lids wereperforated in several places to prevent steam. After 10 minutes, trays wereremoved from the oven and contents transferred to half-size stainless steelpans to ease later handling and serving. These pans were covered withperforated heavy duty aluminum foil and placed back into the oven untilreheating was completed.
2. No. 10 cans. Contents of these cans were transferred directly tohalf-size stainless steel pans, covered with foil as above, and placed in theoven.
3. Tray Packs. Lids were punctured in several places to vent steam, andtrays were placed intact into the oven. Lids were removed after heating witha counter-mounted stab-type can opener.
Since like products in the three container types required differentreheat times to reach the desired serving temperature (740 C), products wereplaced in the oven in the order of the longest to shortest reheat times givenin Table 1. After reheating, products were held in a steamtable or water bathto maintain the 740C serving temperature. Preheated ceramic sauce dishes orflat plates, as appropriate for the food type, were used for acceptanceevaluations as an additional temperature control measure.
A single sensory panel session for each of the nine entree items wasrequired for both quality scoring and acceptance evaluations at eachwithdrawal from storage. Through the first 18 months, each panel session,including the initial evaluations, comprised five samples: The precookedfrozen product and the no. 10 can and Tray Pack products allocated to the 210Cand 380 C storage conditions. At the 24 and 36 month withdrawals, only theno. 10 cans and Tray Pack products stored at 210 C were evaluated by thequality and acceptance sensory panels. For quality scoring evaluations,samples were presented simultaneously in prewarmed coded sauce dishes coveredwith aluminum foil. They were evaluated one at a time in a prescribedposition-balanced random order. For acceptability testing, samples werepresented one at a time for evaluation by panelists. Dishware and anyleftover samples were returned prior to presenting another sample;presentation order was identical to the quality scoring procedure.
Selection of Panelists
Quality Scoring. Food technologists involved in product developmentactivities were asked to describe specific attributes of appearance, odor,flavor, and texture they observed in both precooked frozen andthermostabilized forms of each of the nine entree items. These observationswere compiled and summarized for each food for use as descriptive standards insubsequent evaluations. These word standards were then included as part ofthe standard test instructions with the ingredient declaration for each food.(See Appendix C for descriptions and Appendix D for rating form). All %..
7
I'.

personnel participating in these evaluations had previously evidenced theirability to discriminate among foods of the same kind on the basis of generalcharacteristics of color, odor, flavor, and texture. Twenty panelistsparticipated per session initially; however, as the study progressed to 24-and36-month withdrawals, as few as 11 of the original individuals remainedavailable. Each general attribute was rated according to the nine-categoryquality scale at the top of the form.
Acceptability Evaluations. For each session, panelists were telephonedfrom the randomly arranged list of nearly 450 NRDEC volunteer panelists. Foodtechnologists on this list were specifically excluded from this series ofevaluations inasmuch as they were being utilized in quality scoring panels.The remaining individuals on the list were experienced in making consumer -
type judgments on a wide variety of foods, but they had no specific trainingin food judging. They were not aware of the food to be rated until theirarrival at the Food Acceptance Laboratory, nor were they aware of the natureof the study. The nine-category hedonic scale test form used is reproduced inAppendix D.
All sensory quality scoring work was conducted by the Ration Design andEvaluation Branch, Food Engineering Laboratory, and all acceptance evaluationswere conducted by the Sensory Analysis Branch, Science and Advanced TechnologyDirectorate.
Statistical Analyses of Sensory Data
Numerical scores from both quality attribute and acceptability ratingswere subjected to an analysis of variance (ANOVA). Follow-up Newman-Keuls vs.Duncan multiple range tests were computed when F-ratios were significant todetermine to significant differences between mean scores. Because oneobjective of the study was to determine if significant differences overstorage time would occur between like foods heat processed in cylindrical cansvs. Tray Packs, other ANOVAs were computed for both quality and acceptabilitypanel scores. These computations must be considered "statisticallyconvenient" since they departed from the design of the study by selectivelyexcluding variables as indicated below.
1. Over the first 18 months, a three factor analysis to determine theeffects of storage time, storage temperature, and process/container. Herefrozen sample data were excluded.
2. Because storage time of the 210C no. 10 and Tray Pack processed foodswas, by plan, extended to 36 months, data from all withdrawals were comparedseparately in a two-factor ANOVA, again as if they had been the only variablesstudied (the 380C stored and the precooked frozen products were excluded).Here the factors were storage time and process/container only.
An additional two-factor ANOVA was computed for acceptability panelscores that included the frozen samples. In this case process/container and .1storage temperature were combined as individual treatments or lots, accordingto the original experimental design. This analysis covered the initial 6, 12
8
S.......... ...........

% P:ir J.
and 18 month withdrawals, the period during which all treatments wereevaluated. The follow-up Newman-Keuls routine included multiple comparisonsfor significant differences between one mean score and every other mean scorein addition to its normal use to determine significance of differences betweenmain variables. For purposes of data interpretation, however, only row andcolumn comparisons were relevant, as these represented the independenttreatments studied.
Food Containers
Description. Container and coating descriptions for US Army Natick RD&ECenter produced products were as follows.
1. Foil tray/lid (precooked frozen products). Ecko Products, Inc. plainaluminum foil tray, plug paperboard lid laminated with aluminum foil on theinterior surface.
2. Number 10 (603 x 700) can (heat processed products). American CanCo. Designation 4J oleoresinous (C enamel) coating, body and lid, on interiorfood contact surface; plain tin exterior.
3. Tray Pack (heat processed products). Central States Can Co.Dimensions: 313 mm long, 254 mm wide, 51 mm deep (12-5/16" x 10-1/16 x 2").Tin-free steel. Interior food contact coating designation S-9009-102
(modified vinyl). Exterior coating S-9364-001 (epoxy).
Interior surfaces of containers used by Kraft for heat processed TrayPacks and cylindrical cans were enameled in accordance with the bestcommercial practice by the can manufacturer. Coating designations were notprovided. Construction of trays and lids for precooked frozen products wasthe same as for Natick RD&E Center produced products.
Examinations. The Natick RD&E Center Subsistence Protection Laboratoryconducted visual examinations of interior food contact surfaces of eachcontainer type following selected periods of storage under each temperaturecondition. For each examination, the Sensory Analysis Branch, SATD, providedtwo washed and dried containers with lids from each of the five storage
conditions following evaluation of the products. Tray and cylindrical caninteriors were examined for (1) coating, staining, softening and blistering;(2) coating failure (separation and removal), and (3) detinning and/orcorrosion as appropriate for construction of the container. Aluminum foilpans for the frozen products were examined for signs of corrosion andsubsequent pitting failure. Standerd guides for container condition were usedas they applied to a particular container type.
Bacteriological Tests
Prior to the initial sensory evaluations and the evaluations followingsix months storage, the Natick RD&E Center Microbiology Branch, SATD,conducted standard bacteriological tests to certify safety for human
consumption. Both Natick RD&E Center and Kraft products were subjected to
9I.,:-':
.-.....-... .. .. .

these tests. Aerobic plate counts (APC) and most probable number (MPN)coliform counts were run on all precooked frozen foods. In the eventcoliforms were detected, a fecal coliform test was run. Mesophile andthermophile determinations for both aerobic and anaerobic organisms were runon all foods heat processed in Tray Packs and the standard cylindrical cans.Before these containers were opened for the initial determinations, they wereincubated at 350 + 20C for 10 to 12 days to promote outgrowth of anythermophilic organisms present. The six month samples were not subjected toincubation since half the stored foods had undergone 38OC storage during thisperiod. Two containers of each food product were sampled; in the case ofNatick RD&E Center produced foods, which were made in two separate lots,
sampling was one container per lot.
Nutritional Analyses
This portion of the study is covered in a separate Technical Report.9 Itincludes both proximate and vitamin analyses of selected foods evaluated inthis study.
RESULTS AND DISCUSSIONGeneral
Sensory data are presented as tables in the following four Appendices.
1. Appendix E Tables 1 to 9. Mean Quality Scale (QS) ratings by foodtechnologist judges are presented without further statistical analysis for thefive container-storage condition combinations over time. Comments aretherefore restricted to observations of rating trends over time and relative .*
differences among the five samples of each food product. It should be notedthat the number of panelists ranged from a high of 20 initially to a low of 9at 24 months. This was brought about by departure of panelists originallyselected for the study or their inability to participate in the later b
sessions.
2. Appendix F. Acceptability (Hedonic Scale - HS) ratings only are
given in this table for the five container-storage temperature combinations
over time. Although the 24 and 36 month ratings were not included in the two- .factor ANOVA as indicated before, they are given here for comparison with theearlier ratings, and because the mean values over time given in Appendix G areaveraged across no. 10 and Tray Packs. The unconfounded significantdifferences for each food, i.e., those occurring among container-temperaturecombinations (rows), or among storage times (columns), are mentioned in thetext since notation in the table might cause confusion.
3. Appendix G. Presented are results of a two-factor ANOVA for both QSand HS data in which, for statistical convenience, 210C stored no. 10 can andTray Pack QS and HS ratings were analyzed over 36 months of storage. Thisanalysis was necessitated by the experimental plan to terminate storage andevaluation of the precooked frozen and 380C stored heat processed packs at 18months, beyond which they were not expected to be serviceable.
10

4. Appendix H. Given in this table are results of a three-factor ANOVAof QS and HS data in which, for statistical convenience, data for theprecooked frozen product was excluded. This analysis was computed to isolatethe main effects of storage temperature and container (process time) for eachof the nine heat processed foods.
Open-Ended Comments
Reference to additional written comments by food technologist judgesabout the five QS attributes is made in the text following when the commentshelp explain significant differences in mean ratings. The same policypertains to open-ended comments from consumer panel (HS) data. Unfortunately,not all such remarks were tabulated due to personnel shortages during thestudy.
Sensory Panel Results
Beef Burgundy with Rotini (NRDEC). Quality scale (QS) means are given inAppendix E, Table 1. For all five attributes rated, mean scores for theprecooked frozen (PF) product were equivalent to scores for the Tray Pack (TP)product for withdrawals over the first 18 months of the study. Scores for theno. 10 cylindrical canned (CC) product were equivalent to TP scores initially,but tended to decrease at a greater rate over the same period than TP scores.QS data also indicated that the 380C stored TP product held up somewhat betterafter 18 months than the CC product.
Hedonic scale (HS) data, presented in Appendix F, indicated only onesignificant difference: At the 18 month withdrawal, the 210 C stored TP wasrated significantly higher than the 380 C CC sample.
When storage of the heat processed TP and CC samples was extended to 24and 36-months at 210C (Appendix G), there were no significant changes inratings averaged across the two container types except for the QS textureattribute. This significant effect seemed attributable more to inconsistencyin technologists' ratings between 18 and 36 months than to any physicalchanges occurring in the product (see also Appendix E, Table 1).
In the three-factor analysis of variance output (Appendix H), significantdifferences occurred for the three main effects of storage time, container, ,
and storage temperature due to the 380C samples. Over time, a significantdecrease in QS ratings occurred for all attributes except appearance; HS dataindicated no significant change. The TP sample was rated significantly higher
than the CC sample for odor, flavor, and overall quality ratings. There were,however, no significant differences in acceptability. Finally, the 210 C wererated significantly higher than the 380C samples on the QS attributes of odorand flavor and also on HS acceptability; the magnitudes of these differenceswere, however, small.
Beef Ravioli (Kraft). In general, QS data in Appendix E, Table 2indicated that technologists perceived the TP product to be somewhat higher inquality than the CC or PF products over 18 months at both storage
* -1
temperatures. This was also generally the case with acceptability ratingsgiven in Appendix F, although the 380C TP product decreased significantly at18 months from the initial and six month ratings. Food technologists' QSratings over the same period (Appendix E, Table 2) suggested, however, thatthe TP product was stable. When storage time of the 210C product was extendedto 36 months (Appendix G), no significant changes in QS ratings occurred whenaveraged across both TC and CC containers; however, consumer panelists ratedthe later withdrawals significantly higher than the earlier ones.
With respect to the container main effect, the TP rated significantlyhigher than the CC only on the QS texture attribute, and consumer panelratings produced a significant difference in the opposite direction. Thethree-way analysis of variance given in Appendix H corroborated the Appendix Ganalyses on storage time means across both container and temperature. Therewere no significant changes in any QS attribute over 18 months. Withacceptability, there was a significant decrease between the six month and the12 month sampling which was not repeated at 18 months. The TP ratedsignificantly higher than CC on flavor, texture and overall quality; this wasconfirmed by acceptability ratings in direction only. For storagetemperature, the 210 C was significantly higher than the 380 C on the QS flavorattribute; but magnitude of the difference was small. Except for noteddiscrepancies between QS and HS data, other statistical analyses of thesensory data suggested the TP and CC products were stable over time at bothstorage temperatures.
Beef Stew (Kraft). QS scores, given in Appendix E, Table 3, indicatethat, in general, the PF product rated higher over the first 18 months of theevaluation. Over the same period, the TP product was scored somewhat higherthan the CC, and scores of the 380C stored products decreased at about thesame rate for all attributes. Acceptability data in Appendix F corroboratedthese findings. The single significant time effect was with the 380C TPsamples - the initial rated significantly higher than 18 month sample; aftersix months the PF product rated significantly higher than CC product stored atboth 210 C and 38oC; at 18 months, the PF product rated significantly higherthan all heat processed products, and the 210 C stored TC, in turn, wassignificantly higher than both 380C stored samples.
An effect of extending storage time of the 210C TP and CC samples(Appendix G) was seen with all QS attributes except appearance; a significantdecrease from initial perceived quality levels was seen at the 24 month
* withdrawal or afterwards in flavor, texture and overall quality. At 18months, technologists noted sour odors. Bitter, metallic scorched andslightly sour off-odors were noted in the 380C stored CC product.Acceptability ratings, however, suggested products were stable over the sameperiod. The TP product was rated significantly higher in flavor and overallquality across storage times on the QS scales; magnitude of these differenceswas small and was not supported by similar differences in acceptabilityratings. .-%
In the three-factor ANOVA, Appendix H, in which the 380 stored sampleswere included, significant decreases in all QS attributes except
12
%

- b-. - -
appearance occurred by 12 months or afterwards. Significant differences werefound in all but the appearance and texture attributes between storagetemperatures and containers; 210C rated higher than 380 C and TP higherthan CC. A significant difference between TP and CC was also found inacceptability ratings, but ratings between storage temperatures across theother two variables were identical.
Chicken Cacciatore (NRDEC). As shown in Appendix E, Table 4, the PFproduct QS attribute ratings were equivalent to TP ratings over the first 18months. For all attributes, the TP products tended to decrease in perceivedquality at a lesser rate than the CC products. With respect to acceptabilityratings (Appendix F), the PF product was rated significantly higher than boththe 380C stored heat processed products beginning with the six monthwithdrawal and at 12 and 18 months. At 12 months the 210C TP ratedsignificantly higher than the 380C CC, and at 18 months both the 210 C TP andCC products rated significantly higher than the 380C CC product. Over storage
time, both initially evaluated heat processed products were ratedsignificantly higher than the 18 month products stored at 380 C.
When the 210C stored TP and CC products were statistically analyzed forchanges over time (Appendix G), significant decreases in QS flavor and overallquality scores were noted at 18 months, and significant decreases in allattribute scores occurred by 24 months. Technologist judges observeddarkening of the tomato base sauce at 24 months, scorched and metallic odorsand flavors by 18 months, and dry, fibrous/stringy meat at 24 months. Bitter,sour, and oxidized flavors were also noted at these later withdrawals. Inaddition, the TP was rated significantly higher than the CC product for allattributes but texture. As can be seen in the same table, however,acceptability ratings did not follow a similar trend with respect to storagetime or container.
When the 380 C stored heat processed products were included in the three-factor ANOVA, significant decreases in all QS attribute and HS ratings wereobserved between initial evaluations and the six month withdrawal. InAppendix G, notable decreases between the two evaluations had already beenseen in QS ratings, but they were not statistically significant. InAppendix H, as in Appendix G, the TP product was rated higher in all QSattributes as well as for acceptability (Appendix H only). Finally,Appendix H indicated that the 210 C stored heat processed products ratedsignificantly higher in QS flavor and overall quality than the 380 C storedproducts and in HS acceptability. It was clear from the statistical analysesthat food technologists and consumer panelists reacted similarly to the 380 Cstored products. By 12 months, consumer comments suggested negative reactionto chicken meat texture: nearly one-third of the panel commented on "stringy"or "dry" meat in both the TP and CC products. A similar proportion of theconsumer panel made texture comments at the final (36 month) withdrawal of the210C TP and CC products.
Chili con Carne (Kraft). As indicated in Appendix E, Table 5, both theCC and PF products were scored somewhat lower in QS flavor and overall qualityover 18 months than the TP product. Flavor and overall quality scores of the
13

380 TP products decrease considerably by 12 months while 380C CC productscores, which were somewhat low initially, changed little over the sameperiod. The PF product exhibited the same level and pattern of scores as the380C CC product for these two attributes. Technologist judges characterizedthe 380C, 18 month TP product as tasting "sour", "stale", and "tinny".
Over the first 18 months of the study, acceptability ratings(Appendix F), in general, were characterized by (1) high standard deviations,particularly through the 12 month withdrawals and (2) particularly in the caseof both 210 C stored heat processed products, by mean ratings that were counterto trends ordinarily observed over time, i.e., they increased rather thandecreased. There was no apparent reason for this occurrence. The post hocNewman-Keuls analysis indicated that both the 12 and 18 month 210 C stored CC - "products received a significantly higher score than the initial sample. Othersignificant differences appeared at the 12 month withdrawal only: The PFproduct was rated significantly higher than the 210 C TP and CC products storedat both temperatures; the 210C TP rated significantly higher than the 380C CC.
Storage time extension of the 210C TP and CC products, shown inAppendix G, did not result in significant changes in any quality attributesrated by technologists. However, the increasing rather than decreasingconsumer ratings over time were also evident when they were averaged acrossboth container types. Averaged across storage time, the TP was ratedsignificantly higher than the CC product for the QS attributes of odor,flavor, and overall quality as well as for HS acceptability. In the three-.ayanalysis of variance, Appendix H, which included both storage temperatures, asignificant decrease in QS odor, flavor, and texture scores was noted between12 and 18 months. Acceptability scores gave evidence of the reverse trend asnoted before. Significant differences between containers did not occur exceptfor the QS flavor scores. Finally, the 210C stored product was ratedsignificantly higher than the 380 C product on QS flavor and overall qualityattributes and HS acceptability.
Creamed Chicken (Kraft). QS data are given in Appendix E, Table 6.Overall, the PF product exhibited stability in all attributes over 18 monthsand dropped slightly in texture and overall quality over that period. Overthe same period, the 210 C stored TP product was rated higher than the 210C CCproduct on all attributes; for the odor, flavor, and overall quality ratings,this difference approached one scalepoint for all withdrawals. All attributeratings for the 380C stored CC product decreased at a greater rate than thosefor the 380 C TP product, as evidenced by the sharp drop for the former betweenthe initial and six month evaluations.
Acceptability ratings are exhibited in Appendix F. Frozen sampleratings, as with Chili con Carne product ratings discussed previously, alsowere a reversal of the normal trend over time; no additional information(descriptive observations, written comments) was available to explain productchanges, if any, that might have occurred. Ratings for the 210C stored heatprocessed products also exhibited the "reverse order" phenomenon over 36months. The main significant finding was a clear separation of sample ratingsat 18 months. Both the PF and 210C TP products were rated significantly
14
' " ,

higher than the 380 C TP and CC products. At 12 months, the PF product ratingwas significantly higher than the 380C CC. Finally, the 12 and 18 month PFproduct ratings were significantly higher than initial product ratings, thereverse trend mentioned above.
In the two-way analysis of variance of 210 C stored TP and CC productsover the 36 month period (Appendix G), QS texture was the only attribute to
decrease significantly from initial ratings. This occurred at 24 months.Technologists' comments indicated the meat component in both container typeswas tough, dry, chewy and stringy. For each attribute, the TP wassignificantly higher rated than the CC product. Averaged across bothcontainer types, HS acceptability ratings corroborated QS ratings except forthe initial sample rating. However, there was no significant differencebetween container types which suggested either that consumer panelists did notreact differently to quality differences or that quality differences wereunnoticed.
In the 18 month three-way analysis of variance of the heat processedproducts, Appendix H, the observed decrease in QS odor, flavor, and overallquality attribute scores between initial and six month withdrawals wassignificant. The TP product was rated significantly higher than the CCproduct on all attributes, and 210 C stored product rated significantly higherthan the 380 C products, also on all attributes. HS acceptability data in thisstatistical analysis did not corroborate QS data with respect to storage time.This was explained bya significant time-container interaction term in theANOVA, a reflection of the variability and "reverse order effect" over timeobserved with the 210 C product ratings. However, the main container effectindicated a significantly higher overall rating for the TP over the CCproduct.
Macaroni and Cheese (Kraft). Mean QS ratings are given in Appendix E,Table 7. Odor, flavor, and overall quality scores over the 18 month periodplaced the TP product in the poor to fair quality range from the outset. Theproduct was informally regarded as a poor execution likely attributable toingredient and/or processing problems. QS ratings for the same attributes ofCC product were as much as one scale-point higher initially and through 12months than the TP product, but tended to converge on the TP ratings at 18 and24 months. Ratings for 380C stored product in both container types indicateda substantial loss in appearance, odor, flavor, and overall quality betweenthe 12 and 18 month withdrawals. The 210C stored products were evaluated at .24 months after which evaluations were terminated.
All planned acceptability tests were conducted as indicated inAppendix F. In general, ratings for heat processed products were close to theneutral HS category with relatively high standard deviations. The CC productwas rated higher than the TP product at both storage temperatures at eachwithdrawal over the 18 month period for which the analysis of variance was
computed. Initially and at 12 months, the PF product was rated significantlyhigher than TP products at both storage temperatures, and 6 and 18 months,significantly higher than the 380C stored product only.
1s
p ' _ . ' . . . . " " " " " " " . . . . .. ."
• """ : ' ' -'"," ,," , '" " "' .-"'. '" ' .,- --. . -7'- '

In Appendix G, statistical analysis of QS scores for extended storage of210 C CC and TP products indicated no significant changes between initial and
% 24 month (final) withdrawals, or for HS ratings, between initial and 36 monthratings. Again, however, it should be noted that initial ratings were low inboth instances. Analyzed by container across storage time, the CC was ratedsignificantly better than the TP product in odor, flavor and overall quality
attributes as well as in acceptability.
The 18 month three-way analysis of variance of the heat processedproducts given in Appendix H confirmed the QS and HS results for the effect ofcontainer. With the storage temperature effect included, however, there was asignificant decrease in QS odor, flavor, and overall quality scores betweeninitial and 18 month withdrawals. No significant differences were found overthis period with HS ratings. For all QS attributes except texture, scoreswere significantly higher for 210 C over 380 C stored products; HS ratingsindicated the same direction and statistical significance.
Smoky Pork (NRDEC). QS ratings are given in Appendix E, Table 8. Exceptfor the appearance attribute, initial ratings for the PF product wereequivalent to heat processed product ratings. Over time, scores for the CCproducts decreased at a faster rate than those for TP products. Over thefirst 18 months, scores for 380C stored heat processed products decreased at afaster rate than those for the 210C stored products. Within the 210 storageseries of TP product, there was a sharp decrease in scores for all attributesbetween 18 and 24 month withdrawals. The rate of decrease in odor, flavor,and overall quality scores was greatest for the 380C stored CC product.
Acceptability ratings for 210C stored products, Appendix F, variedrandomly over 36 months. Consumer ratings for the 380 C stored CC productshowed the same rapid decreases as technologist panel scores. At six months,the PF product rated significantly higher than the 380C stored CC product; at12 and 18 month withdrawals, all other products rated significantly higherthan this sample. For the 380C stored CC product, a significant decrease inHS ratings occurred between the six and 12 month withdrawals. No othersignificant differences were noted, although the TP products generally ratedhigher than CC products throughout the study. From written comments it wasevident at six months that, compared to other samples, a higher percentage ofconsumer panelists noted general off flavor, burnt flavor, and tough meatcubes in both TP and CC products stored at 380 C.
Extension of storage of the 210 heat processed products from 18 to 24 and36 months resulted in a significant decrease in QS scores for all attributesas indicated in Appendix G. However, there were no significant changes in HSscores. All QS attribute scores and HS ratings indicated the TP product wassignificantly superior to the CC product across the six withdrawals over the36 month period.
16"
)~~~~~~~~~~~~~~~~~~~~~~~..-...,...- ...,...., ...-............ ,-........ -."'....... ,........- . ....-..-.. ,...- ... ,, .+,. ;.+..... .-...

w"T-
When 380C stored products were included in the three-way analysis ofvariance, Appendix H, a significant decrease in all five QS attribute scoresoccurred between the initial evaluation and the six month withdrawal. Fromexamination of both Appendix E and G data, this was evidently due toincremental decreases in 210 C stored product scores as well as the somewhatgreater rate of decrease in 380 C stored product scores. Between 6 and 18months, however, scores did not further decrease. HS ratings did not decreasesignificantly from the initial value until the 18 month withdrawal. Again,the TP product emerged significantly superior in all ratings over the CC.However, differences in storage temperature ratings were not significant forany of the QS attributes judged, but were significant for HS ratings. Thereason for the former outcome appeared due to the comparable rates of decreasefor 210C and 380C stored product in both container types. --
Swiss Steak (NRDEC). Mean QS scores are given in Appendix E, Table 9.These data indicated that, over the period of the study, the TP product scoredhigher than the CC product at both storage temperatures. Of the storedproducts, the 380C CC samples evidenced the least stability over 18 months andthe PF product the greatest. In addition, the PF product was scored higher onall attributes initially and over time than the heat processed products.
As may be observed in the acceptability data, Appendix F, the PF productalso rated higher initially and over the 18 month period than the heatprocessed products. The TP products stored at both temperatures rated higherthan CC products. Ratings over time, particularly for the 210C stored TP andCC products, varied randomly. At the initial evaluation, the PF product wasrated significantly higher than the CC product assigned to 210 C storage. Alikely explanation was that 25% or more of the consumer panel noted "poortexture" in their comments about the CC products. At this state of the study,the CC lots had not been subjected to storage treatment except for short termholding before the initial evaluations. At 12 months, the PF product wasagain rated significantly higher than the CC product stored at bothtemperatures; in addition, the 210 C TP product rated significantly higher thanthe 380C CC product. This outcome was duplicated at 18 months. Over time,the 380C stored CC product showed a significant decrease between six and 18months; this may have been an artifact, however, die to the random variabilityin ratings over time.
Storage extension of the 210 C heat processed products to 36 months,Appendix G, produced a significant decrease in the QS attributes of flavor,texture, and overall quality between the initial evaluation and the 36 monthwithdrawal. Acceptability ratings however, did not change significantly over - -
the same period. Averaged across storage time, the TP product was scoredsignificantly higher than the CC product in flavor and overall quality; thisdifference was confirmed by the HS acceptability ratings.
In the three-way analysis of variance, Appendix H, the QS odor attributescored significantly lower after the six month evaluation and thereafter,while the overall quality score decreased significantly between initial and 18month withdrawals. At the same time, HS data were inconsistent, particularlybetween initial and six month evaluations. Averaged across temperature and
17
2..
storage time, scores for TP product were significantly higher for all QSattributes except texture; this was corroborated in direction and significanceby HS5 acceptability ratings. In the analysis, there was no significantstorage temperature effect for QS scores, but HS scores were significantlydifferent and favored the 210C stored products.
Container Performance
Tray Packs. From observations given in Appendix I, it was evident thatthe food contact coating on the tin-free steel container for the NRDECproducts performed exceptionally well. Although there was minor staining oninteriors of 38 0 C products after 18 months storage and 21 0 C products after 36months, no softening of the coating had occurred. Although no examinations ofthe tinplate steel tray cans used by Kraft were recorded upon receipt atNRDEC, the heating blisters evidently developed during retorting rather thanduring storage. This was because evidence was found of further coatingdeterioration or failure at both storage temperatures through the final -
withdrawals.
Number 10 Cans. Softening occurred in the oleoresinous lid enamel ofcans used to pack the four NRDEC products as early as the six monthwithdrawal. It was particularly evident on lids and the headspace area on thecan body under the lid seam. This defect did not seem to worsen with storagetime with the beef burgundy and swiss steak items. However, with the chickencacciatore and smoky pork items, traces of corrosion had developed on canbodies exposed to the former item for .36 months and severe enamel softeninghad developed on lids of cans exposed to the later item after 12 months. Thissuggested that this coating would not withstand attack from the wide varietyof foods expected to be provided for the proposed field service system.Although the extent of softening of body enamel was minimal when in directcontact with the foods studied, it is likely that metal serving utensils wouldscrape off enamel when these foods are served directly from the container asenvisioned in future field foodservice systems. This would be undesirable,although harmless, from a consumer viewpoint.
Containers used for the Kraft produced items generally performed well.However, the interior corrosion noted by 18 months in containers used for beefravioli may have been the result of mechanical or machine damage to the enamelduring formation of the can body. For the chicken a la king item, it wasevident that an inappropriate can body coating (plain tin) had been selectedfor the product if it was to be subjected to long-term storage (longer than 12months); extensive detinning had occurred by 36 months. This phenomenon,however, had no apparent effect on food technologists' scores or consumer
.°• .'
panel ratings, either initially or over time; no comments alluding to ametallic or "tinny" character were recorded.
Aluminum Foil Pan. Observations of corrosion after 18 months in pansused to pack the NRDEC products suggested that, despite sensory evidence ofthe high quality and acceptability of precooked frozen compared to heatprocessed foods, the failure rate of these containers was too high for them tobe considered seriously for use in a field foodservice system. Not only would
18
.neioso 38° prdcsatr1 otssoaean 1Cpout fe ...
.onhs n sotnn otecotn hadp ocurd lhuh oeaiain o .

food quality be expected to deteriorate in corroded/pitted containers, butleaking pans during reheating and serving would also create a serious fieldsanitation problem.
1%
The aluminum foil packs used by Kraft to pack its products showed nosigns of deterioration over 18 months storage. They were obtained from adifferent supplier than the pans used for the NRDEC products. AlthoughKraft's were plain foil, they may have been subjected to a differentfabrication process than the pans used by NRDEC, rendering Kraft's moreresistant to corrosion. The foods packed in them may also have been lessreactive to the aluminum material than the foods produced by NRDEC.
Bacteriological Findings
Aerobic plate count (APC) results on the nine NRDEC and Kraft-producedprecooked frozen foods ranged from 102 to 104 organisms per gram, well belowthe 105 specification for Meal, Precooked Frozen (MIL-M-0013966D). Coliformcounts in the Kraft products were negative. Coliform counts belowspecifications were found in two NRDEC foods; however, subsequent fecalcoliform differentiation at 44.50 C was negative. No increases in APC orcoliform counts was observed after six months of frozen storage.
up
.19
p.'
. ~* . 'k-****~.*~.-v~. .:- •. . ."

SUMMARY AND CONCLUSIONS
Expected Storage Life of Products
Table 2 contains a summary of the number of months each of the nine* products might be expected to hold without a significant decrease from initial
ratings in quality or acceptability. All of the five process, container, andstorage temperature conditions are included. Quality scale (QS) figures are"best estimates" based upon Appendix E data, which were not statistically
.* analyzed for significant differences among withdrawals for each storagecondition. Unfortunately, the other analyses omitted the frozen product, as
* previously indicated, and the main effects are averaged across other* independent variables. In the case of Appendix G, the time effect is averaged
across both Tray Pack and the cylindrical no. 10 can; in Appendix H, thiseffect is averaged across both container and storage temperature. The hedonicscale data were reanalyzed for purposes of this report to include all possiblepairwise comparisons for each food as previously described. Thus, the storage
* life estimate here is based upon statistical probability from the post-hocanalyses. For the QS data, a "rule of thumb" was used for each of the five
* storage conditions, i.e., approximately a one scale point decrease in theflavor and overall quality scores from the initial score was taken as evidenceof significant deterioration in product quality and reason to question a
"* product's serviceability. With HS ratings, the decision rule was asignificant decrease from the initial rating at P<0.05. For both sensory
* assessments, the figure in the Table is the withdrawal preceding the one wherethe observed or significant decrease occurred.
In general, the storage life estimates with the QS data were moreconservative than or the same number of months as the HS data. This isexpected inasmuch as the technologist judges are oriented to changes inquality and are presumably more sensitive to such changes compared to consumerpanelists who are oriented to expressing level of liking or disliking, and whohave not been trained or instructed in food judging. Accordingly, the QS data
may be useful in indicating when under each storage condition an inspectionshould be conducted, and the HS data would suggest the length of storage undereach condition the product would be expected to retain its acceptability tothe end user (consumer).
For all precooked frozen (PF) products, both QS and HS data suggestedthey would be stable for the 18 month term of the study, and perhaps longer ifstorage was extended. QS ratings of the heat processed products stored at210C suggested that, of the nine evaluated, seven of the TP products had astorage life greater than or equal to that of the CC packed products. Theother two CC packed products, beef stew and creamed chicken, evidenced alonger storage life than their TP counterparts. HS data for this temperature
series indicated no significant decreases in ratings between initial and thefinal 36 month evaluation, although it should be noted that initial ratingsfor the chili con carne product in both container types were low and increasedon subsequent withdrawals. Reasons for this "reverse order phenomenon" werenot clear, but may have been attributable to blending or diminution of
20
,. v.* * . .- .- . * , o . * . -.. -. - . . . .. . ,-- * . . **-. * -* ..- .- . . . . .
. . . . ..... .. . *.. . . . . .. . . . . . . . . . . . . .'" - . . . . ...... .. -. ,.-. ,. ' ..-. *. -,.' , , . . t - ." . a,. -
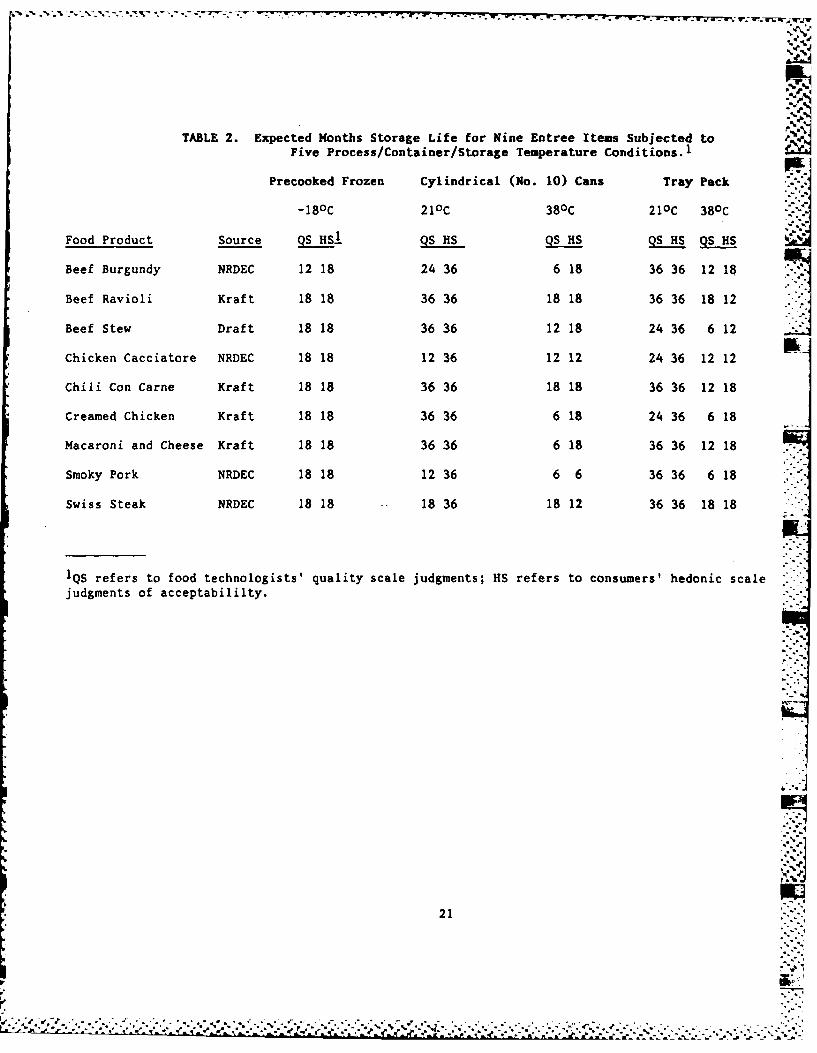
TABLE 2. Expected Months Storage Life for Nine Entree Items Subjected to p-i
Five Process/Container/Storage Temperature Conditions. 1
Precooked Frozen Cylindrical (No. 10) Cans Tray Pack
-180 C 210 C 380 C 210C 380 c
Food Product Source QS HSI QS HS QS HS QS HS QS HS
Beef Burgundy NRDEC 12 18 24 36 6 18 36 36 12 18
Beef Ravioli Kraft 18 18 36 36 18 18 36 36 18 12
Beef Stew Draft 18 18 36 36 12 18 24 36 6 12
Chicken Cacciatore NRDEC 18 18 12 36 12 12 24 36 12 12
Chili Con Carne Kraft 18 18 36 36 18 18 36 36 12 18
Creamed Chicken Kraft 18 18 36 36 6 18 24 36 6 18
Macaroni and Cheese Kraft 18 18 36 36 6 18 36 36 12 18
Smoky Pork NRDEC 18 18 12 36 6 6 36 36 6 18
Swiss Steak NRDEC 18 18 18 36 18 12 36 36 18 18
IQS refers to food technologists' quality scale judgments; HS refers to consumers' hedonic scalejudgments of acceptabililty.
21
* .* .. -.. " .

intensity of the flavoring ingredients over time. In addition, ratings forthe macaroni and cheese product, as previously indicated, were considered lowinitially. Inasmuch as consumer panelists typically do not use HS categoriesexpressing strong degrees of dislike, there was little downward movement inratings.
Of the heat processed products that were storage temperature stressed at380 C, QS data indicated that expected storage life of seven of the CC productswas less than or equal to their TP counterparts. On the other hand, beefravioli and beef stew products indicated the reverse, beef stew beingconsistent with its counterpart stored at 210 C. Range of storage was 6 to 18months for both CC and TP products. HS data suggested, that from a consumeracceptability standpoint, a longer usable life might be the case for both CCand TP products. Here also, all but two of the TP products, beef ravioli andbeef stew, could be considered to have a usable life equal to or greater thanthe CC products. The fact that TP products required less heat processing to
achieve commercial sterility may account for the observation that some foodshave a longer serviceable storage life potential under stressful temperatureconditions than their CC counterparts.
Rank Sensory Comparison of Precooked Frozen and Heat Processed Products forOverall Quality and Acceptability
One objective of this study was to determine which, if any, of the threeprocessing and packaging procedures studied would yield the best product fromtechnical quality and acceptability viewpoints. Therefore, Table 3 wasconstructed to summarize QS and HS data for the nine entree productsevaluated. Means were computed and ranks assigned as indicated in thefootnotes. The statistical significance of differences between mean valueswas not computed inasmuch as the statistical analyses used for QS and HS datadid not provide a post-hoc Duncan or Newman-Keuls computation when means forall three treatments (PF, TP, CC) were averaged across the four storagewithdrawals.
Table 3 indicates that eight out of nine PF and TP products received
adjacent ranks 1 or 2 on at least one of the rating scales. This observationsuggested that the TP items were perceived by technologist judges and consumerpanelists alike as more comparable to PF products than the conventionally heatprocessed CC products. In addition, the PF version of seven out of the nineitems emerged as highest rated on at least one rating scale; for three foods,both rating scales indicated the PF version was highest in quality andacceptability. Excepting the macaroni and cheese product on both ratingscales and HS ratings for the beef stew item, the TP products were ratedhigher than the CC products. This was clear and consistent evidence of thesuperiority of the Tray Pack configuration for multipleserving of heat-processed entrees.
22

.° --, • . . ° o , 4o , *. ". .° °
.. .. .... . .. .-*" _.-.. ---r .. . aQ a.
TABLE 3. Means and Ranks for Overall Quality and Acceptability1
Overall Quality (QS) Acceptability (HS)
Product PF TP CC PF TP CC
Beef Burgundy (NRDEC) 6.3(1)2 6.1(2) 5.8(3) 6.5(2) 7.0(1) 6.3(3)
Beef Ravioli (Kraft) 5.7(3) 6.2(1) 6.0(2) 5.6(2) 6.0(1) 5.6(2)
Beef Stew (Kraft) 6.6(1) 6.2(2) 5.8(3) 7.1(0) 6.0(3) 6.1(2)
Chicken Cacciatore 5.4(2) 5.7(1) 5.2(3) 6.4(1) 5.8(2) 5.6(3)(NRDEC)
Chili con Carne (Kraft) 5.8(2) 6.0(1) 5.8(2) 6.3(1) 6.0(2) 5.4(3)
Creamed Chicken (Kraft) 6.4(1) 6.1(2) 5.3(3) 5.8(3) 6.0(0) 5.9(2)
Macaroni and Cheese 6.1(1) 4.8(3) 5.6(2) 6.2(1) 5.0(3) 5.4(2)
(Kraft)
Smoky Pork (NRDEC) 6.1(2) 6.2(1) 5.6(3) 6.1(2) 6.4(l) 6.0(3)
Swiss Steak (NRDEC) 6.4(1) 6.2(2) 5.7(3) 6.8(1) 6.4(2) 5.8(3)
IMeans computed across four (4) trials - initial evaluation and withdrawalsat 6, 12 and 18 months. Storage temperature for heat processed (TP and CC)products was 210C.
2Numbers in parentheses are ranks. Means are ranked from highest to lowestratings.
Container Performance During Storage
The interior coating of the tin-free steel Tray Packs used in productionof the NRDEC products was clearly the most stable of the food contact surfacesseen in this study. It survived retorting and subsequent storage at stressfuland ambient temperature storage. Performance of the oleoresineous (C-enamel)coating used in the NRDEC no. 10 cans was variable, indicating a lack ofstability during storage exposure to certain foods. The aluminum foil pan wasthe least satisfactory of the containers since, after 18 months of frozen
storage of certain foods, corrosion and pitting was observed, indicatingfailure under anticipated conditions of use.
23

Bacteriological Tests
Both NRDEC and Kraft-produced foods processed in tray and cylindrical
cans were completely sterile, i.e., beyond commercial sterility, which
requires that food-borne pathogens be destroyed. This finding pertained to
both the initially produced items subjected to 10 to 12 days incubation and
the product withdrawn from storage after six months at 210C and 380 C. This
was clear evidence not only of the adequacy of the heat process but also of anadditional margin of safety compared to precooked frozen foods.
I,
.. 1
24
% ...-

REFERENCES
1. Nuss, E. M., J. Wall, P. Brandler and L. Symington. An empiricalevaluation of Air Force field feeding with recommendations for a newsystem. U.S. Army Natick Research and Development Center, NATICK/TR-8407 June 1984. (AD A146 628).
2. Lane, J. H. and K. Widner. Sterilizable semi-rigid aluminum foodcontainers. Star Aluminum Co., Ltd., Wolverhampton, UK. Paper presentedat the Preservation and Packaging of Food Congress - Institute of"..*Packaging at Harrsgate, 25-26 June 1969.
3. Szczeblowski, J. W. Tray packs for thermally processed foods.Activities Report R&D AssociateS 25(1), 1973.
4. Szczeblowski, J. W. and E. A. Nebesky. Tray Pack foods. Proceedings,International Symposium on Ready-to-serve Foods, Karlsruhe, Germany, 23-24 August 1977.
5. Szczeblowski, J. W. The future of the half steam table tray in militaryfeeding based on field tests, experiments and new products. ActivitiesReport R&D Associates 32(2), 1980.
6. Anonymous. Thin profile foodservice container improves food quality.Food Product Development, May 1976.
7. Andres, C. Thermally processed shelf-stable foods have quality equal to"fresh prepared". Food Processing, August 1977.
8. Wanzebe, C. S. Kraft Pan Entrees: A New Package Concept Becomes aCommercial Realty. Food Product Development, 12(6), 1978. ..
9. Wyzga, L. A., H. Klicka, C. A. Kubik, and J. W. Szczeblowski. Anevaluation of foods processed in Tray Pack versus two standard foodservice containers. Part 2. nutritional analyses, NATICK/TR-86/012,March 1986.
2-
25 ""-
. . . . .~~~2- . . . .. . . . . . . . . . . . .

Appendix A. Label Declarations for Entrees Produced by Kraft
BEEF STEW
* Kraft-Pan #10 Can Frozen
*Gravy Beef Water
Beef Potatoes Beef. Potatoes Water Beef Drippings
Carrots Carrots Potatoes* Peas Peas Carrots
Onions Tomato Puree CeleryDehydrated Onion OnionFlour Beef Fat
Salt Peas*Beef Broth & Water Hydrolyzed Vegetable Protein Food Starch-ModifiedFood Starch-Modified Monosodium Glutamate Potato FlourSalt Caramel Color Flavoring Hydrolyzed VegetableHydrolyzed Vegetable Protein SaltMonosodium Glutamate Monosodium GlutamateTomato Paste **Imitation Beef FlavorSugar Caramel ColorSpice SpicesPaprika Oleoresin PaprikaArtificial Color Citric AcidOnionGarlic
Natural Flavor **Hydrolyzed VegetableProtein
Monosodium GlutamateHydrogenated Vegetable FatAutolyzed Yeast
Disodium InosinateDisodium Guanylate
26

Appendix A. Label Declarations for Entrees Produced by Kraft (Cont'd)
BEEF RAVIOLI in SAUCE P-L
Kraf t-Pan #10 Can Frozen
Water Tomato Water
Wheat Flour Water Tomato Paste
Beef Flour Flour
Tomato Paste Beef Beef
Cottonseed Oil Bread Crumbs Eggs
Bread Crumbs Sugar Cottonseed Oil
Salt Salt Spinach
Sugar Food Starch-Modified Salt
Eggs Eggs Parmesan Cheese
Onion Egg White Sugar
Food Starch-Modified Flavoring **Dehydrated Vegetables
Hydrolyzed Vegetable Protein Soybean Oil ***Hydrogenated Soybean Oil
Monosodium Glutamate Celery Spices
Spices Carrots Flavoring
Garlic *Romano Cheese
Celery Dehydrated Onion
Natural Flavor
*Made from Cow's Milk **Onion
ParsleyCeleryGarlic
***with Mono and
Diglycerides
..-
27
........ ........................ ...-

Appendix A. Label Declarations for Entrees Produced by Kraft (Cont'd)
CHILI CON CARNE with BEANS
Kraft-Pan #10 Can Frozen
Water Water Kidney BeansBeef Beef BeefBeans Tomato Puree Water P-Corn Flour Beans Tomato PasteFood Starch-Modified Textured Soy Flour Food Starch-ModifiedSpice Cereal Hydrolyzed Vegetable ProteinHydrolyzed Vegetable Protein *Chili Seasoning Chili PepperSalt Food Starch-Modified SaltWheat Flour Salt SugarSugar Dehydrated Onions PaprikaPaprika Spices Dehydrated OnionOnion Flavoring FlavoringMonosodium Glutamate Oleoresin Paprika SpiceGarlic Monosodium Glutamate Monosodium GlutamateArtificial ColorCitric Acid - -...-
*Chili Pepper
Cumin
SaltOreganoGarlic
U -%
28
° * * * .* .

Appendix A. Label Declarations for Entrees Produced by Kraft (Cont'd)
MACARONI & CHEESE
OldKraft-Pan 1/ #10 Can Frozen
*Cheese Sauce ***Cheese Sauce Water i'
**Macaroni **Macaroni Cooked Macaroni
Cheddar CheeseCottonseed OilNon-Fat Dry Milk
*Water ***Water Modified Tapioca Starch
American Cheese Cheddar Cheese Bread Crumbs
Butter Butter Sodium Phosphate
Skim Milk Skim Milk Parmesan CheeseFood Starch-Modified Food Starch-Modified Salt
Sodium Phosphate Sodium Phosphate SpicesSalt Salt Artificial ColorArtificial Color Sodium Hexametaphosphate
Articifical Color
**with added Glyceryl Monostearate
I/ Aged Cheese
.
.- --'- ----'---.- -- ..- ,-.....-..-,_.,z ,..: -'J _-.•. ,,. .•... -" - - ." " . -' " - ". ." ." - " . ". :" :'_ "":., , ,;:--: __-::

• Appendix A. Label Declarations for Entrees Produced by Kraft (Cont'd)
Kraft-Pan #3 Can Frozen(Creamed Chicken) (Chicken a la King) (Chicken a La King)
Water Milk WaterChicken Chicken Meat Chicken MeatMilk Chicken Broth Chicken BrothChicken Broth Cream Food Starch-ModifiedFood Starch-Modified Mushrooms Partially Hardened Vegetable
Oil
Chicken Fat Flour *VegetablesVegetable Oil Red Sweet Pepper Sherry WineWheat Flour Chicken Fat Chicken FatMushrooms Food Starch-Modified Salt
Red Bell Peppers Green Peppers **Chicken FlavorGreen Bell Peppers Salt LactoseSalt Monosodium Glutamate SugarHydrolyzed Vegetable Protein Sugar Sodium CaseinateOnion Flavoring Monosodium GlutamateLactose Spice ExtractivesMonosodium Glutamate Xanthan GumSodium Caseinate Dipotassium Phosphate
Dipotassium Phosphate SpiceSpice Tricalcium PhosphateTurmeric Disodium Inosinate
Garlic Disodium GuanylateNatural Flavor Natural Color
**Salt
SugarChickenMalto-Dextrin
Chicken FatHydrolyzed Veg. ProteinDehydrated Onion FlavoringDisodium InosinateDisodium Guanylate
Turmeric
Oxygen Interceptor(to preserve flavor)
*Mushrooms
Red Pepper
OnionGreen Pepper
30
. - .. . .

Appendix B. Formulas and Processing Procedures forNRDEC* Produced Entrees
1. Beef Burgundy with Rotini
Gravy formula:
Percent
Carrots, frozen, dice 10.00Dehydrated onion pieces, rehydrated 10.00Mushrooms, pieces, canned 9.50Tomato paste, 26% solids 4.00Flour 1.50Burgundy wine flavor, Vie-Del 3.50Margarine 1.50Hydrolyzed vegetable protein, Nestles 4BE 1.00Starch* 2.50Vinegar, cider, 40 grain 1.00Salt .75Monosodium glutamate .75Sugar, white .60Celery seed, ground .09Black pepper .03Garlic powder .02Broth and water, 50/50 53.26
100.00
For heat processed products, "Clearjel" (National Starch) was used. For theprecooked frozen product, "Col-Flo," same vendor, was substituted.
Procedure
All ingredients except starch, flour, carrots, burgundy flavor, and a smallportion of the water were placed in a steam-jacketed kettle with agitator. A
starch-flour slurry was prepared with the remaining water and added when thetemperature reaches 71 C (160 F). Heating continued until the temperaturereached 82 C (180°F), at which time the carrots and burgundy flavor wereadded. Volume was adjusted with water to original formula weight and sauce washeld hot until filling (less than one hour).
* NRDEC Notebook No. 7058, 27 May 1977, pp. 6, 10, 13, and 16
31
-..
* .... *

Appendix B (con'd)
Meat Component
Frozen diced beef was used. For number 10 and tray can packs, beef diceswere browned in a steam-jacketed kettle until all surfaces had changed color.Depending upon batch size sufficient water was added to extract broth andprovide one-half of liquid requirement for the gravy. For the precooked frozenproduct, dices were placed with sufficient water for the broth requirement,into field pans. Pans were placed in a 177 C (350°F) bakery rotary ovenand the dices cooked to finish. The oven was stopped intermittently and thecubes stirred to prevent sticking/scorching.
Fill Proportions, All Containers
Ounces Percent
Beef dice 35.0 33.0Rotini, water blanched to double weight 11.0 10.4Gravy 60.0 56.6
Total 106.0 100.0
Retorting/Freezing
Approximate fill temperature for retorted products was 490C (1200F).Tray Packs were closed on a Callahan-AMS Machinery Co., 227 SV Vacumn Sealer.Number 10 cans were closed on an American Can Co., No. I Pacific SV Closin.Machine. Both Tray Packs and number 10 cans were still processed in a 121 C(250°F) horizontal steam-air retort at 17-68 PSI equipped with water spraycooling. Process times were: Tray Packs - 64 minutes; number 10 cans - 225minutes. For filled plain foil pans containing product for freezing, an ElksPlus Machinery, Inc., closing machine was used to crimp on lids. These panswere chilled, then placed in a -32°C (-200F) blast freezer for approxi-mately 18 hours. Pans were then moved to a -18°C (00F) freezer forstorage.
32
h -

Appendix B (con'd)
2. Chicken Cacciatore "Gravy formula:
Percent
Monosodium glumate 1.00Salt 1.00Tomatoes, whole 12.00Tomato paste, 26% solids 3.00Starch* 3.00Flour 1.00Dehydrated onion pieces, rehydrated 1.91Sugar, white 0.75Cinnamon .007Stock 71.393Burgundy wine flavor, Vie-Del ** 3.00Chicken fat & emulsified turkey skins 1.79Garlic powder 0.02Rosemary, ground 0.05Celery seed, ground 0.05Black pepper 0.03
100.00
For heat processed products, "Clearjel" was used; for precooked frozen, "Col-Flo."
Emulsified with water in Waring Blender until skin was completely marcerated. -ft"
Procedure
All ingredients except starch, flour, burgundy flavor and a portion of water forslurry production were placed in a steam-jacketed kettle with agitator. The starch-flour
0 0slurry was added when the temperature reached 71 C (160°F). Heating continued to820 (1600F) and the burgundy flavor was added. Sauce was held hot for filling (lessthan one hour). "
Meat Component
Frozen turkey breasts, bone-in, were used. The breasts were placed inroasting pans with approximately on and one-half quarts water, and covered withfoil. For both precooked frozen and heat processed products, pans were placedin steamer and steamed to an internal temperature of 77 C (171 F), cooled, .-.]boned and handcut into dices.
33
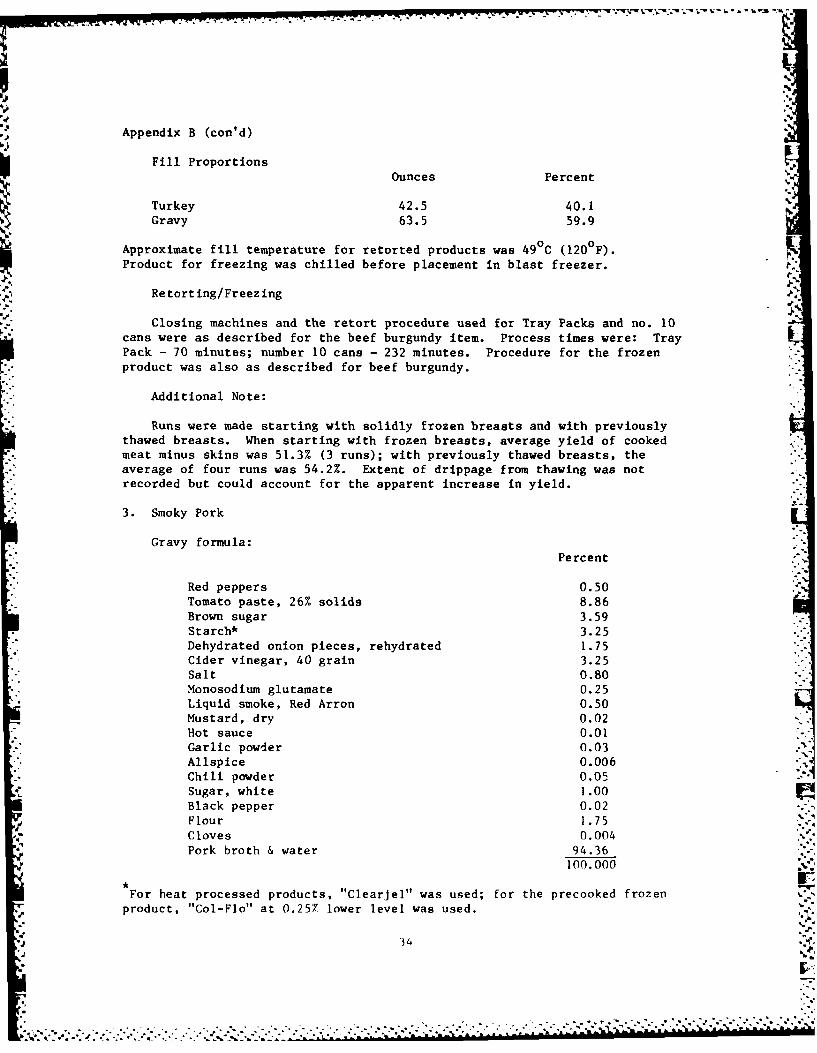
Appendix B (con'd)
Fill Proportions One ecn
Turkey 4unce PercentGravy 63559.9
Approximate fill temperature for retorted products was 490C (120 0F)Product for freezing was chilled before placement in blast freezer.
J"%
Retorting/Freezing
Closing machines and the retort procedure used for Tray Packs and no. 10cans were as described for the beef burgundy item. Process times were: TrayPack - 70 minutes; number 10 cans - 232 minutes. Procedure for the frozenproduct was also as described for beef burgundy.
Additional Note:
Runs were made starting with solidly frozen breasts and with previouslythawed breasts. When starting with frozen breasts, average yield of cookedmeat minus skins was 51.3% (3 runs); with previously thawed breasts, theaverage of four runs was 54.2%. Extent of drippage from thawing was notrecorded but could account for the apparent increase in yield.
3. Smoky Pork
Gravy formula:Percent
Red peppers 0.50Tomato paste, 26% solids 8.86Brown sugar 3.59Starch* 3.25Dehydrated onion pieces, rehydrated 1.75Cider vinegar, 40 grain 3.25Salt 0.80Monosodium glutamate 0.25Liquid smoke, Red Arron 0.50Mustard, dry 0.02Hot sauce 0.01Garlic powder 0.03Allspice 0.006Chili powder 0.05Sugar, white 1.00Black pepper 0.02Flour 1.75Cloves 0.004Pork broth & water 94.36
100.000
For heat processed products, "Clearjel" was used; for the precooked frozenproduct, "Col-Flo" at 0.25% lower level was used.
,4 34
%o• _ .~~ ~ ~~ ~~~- .-.. ... * ..-..-.. -..... . . -. '-, ' .'.''.. -.-. , ,

W ,W
Appendix B (con'd)
Procedure
All ingredients except starch, flour, smoke flavor, and an aliquot of waterfor starch-flour slurry preparation were combined in a steam-jacketed kettle
with agitator and heated to 71°C 160°F . The starch-flour slurry wasadded and heating continued to 82 (180 F) at which time the smoke flavorwas added.
Meat Component
Frozen boneless butts were used. Due to high fat content, the resultingpork dice was retrimmed. Identical procedures to those used for meat componentof the Beef Burgundy items were followed, both for heat processed and precookedfrozen products. Meat yield, frozen butts to cooked cubes, was 60.3%.
Fill Proportions, All Containers
Pork dice were filled into containers first, then gravy. Prior to fillingthe frozen product, both meat and gravy components were chilled. Filltemperature for retorted products was approximately 49°C (120 0 F).
Proportions
Ounces PercentPork dice 53 50.0Gravy 53 50.0
Total 106 100.0
Retorting/Freezing
Closing machines and the retort procedure used were as described for thebeef burgundy item. Process times were: Tray Pack - 62 minutes; number 10 can- 223 minutes. Procedure for the frozen product was also as described for beefburgundy.
35
a. I€
. .. . .
'7 %*-'L -C

S.1
Appendix B (con'd)
4. Swiss Steak
Gravy formula: J
Percent
Celery seed, ground 0.10
Brown sugar 0.20Garlic powder 0.31Dehydrated onion pieces, rehydrated 9.71Black pepper 0.07Salt 1.23Worcestershire sauce 1.84
Hydrolyzed vegetable protein, Nestles 4BE 0.92Flour 1.50Starch* 3.00Beef broth & water, 50/50 81.12
100.00
For heat processed products, "Cleargel" was used; for the precooked frozen
product, "Col-Flo" was used.
Procedure
All ingredients except starch, flour, and a small amount of water forslurry preparation were combined in a steam-jacketed kettle. When thetemperature reached 71 0C (160 0 F), the starch-flour slurry was added andheating continued to 820 (1800 F). Sauce was held hot for filling (lessthan one hour).
Meat Component
Swiss steaks, boneless, frozen choice, were used. They were placed inroasting pans while still frozen and approximately two quarts water added perpan for broth production. For heat processed products, pans were covered withfoil and placed in a steamer and steamed until the surface pink color haddisappeared (about 20 minutes). Average yield was 70.4%. For the precookedfrozen product, pans were placed in a 260'C (500 F) rotary oven and bakeduntil pieces were browned on both sides. After browning, pans were placed inthe steamer for one hour to cook to finish. Average yields, 52.3%.
Filling Proportions, All Containers
Ounces Percent
Swiss Steak 46.25 44.3Gravy 58.00 55.7
Total 104.25 100.0
36
-77

Appendix B (con'd)
Fill weights for frozen product were the same as for heat processed productsalthough the meat yield for frozen product was lower. Approximate fill %temperature 49 C (120 F) for retorted products. Product for freezing waschilled before placement in blast freezer.
Retorting/Freezing
Closing machines and the retort procedure used were as described for thebeef burgundy item. Process times were: Tray Pack - 60 minutes; number 10 can- 224 minutes. Procedure for the frozen product was also as described for beefburgundy.
37. .
~ *..\..*.*.s. .. .r *. W*.~ '.xQ~.\K".-."". ."

I...
Appendix C. Quality Scoring Sensory Panel Instructions, Descriptive Terms andIngredient Declarations for Nine Entrees /
COMMON INSTRUCTIONS
You will be testing a processed food similar to products prepared forinstitutional feeding where only heating and serving are required.
Below are descriptive phrases that may be helpful in evaluating this testproduct. Feel free to use your own descriptive terms for the productevaluation. The descriptions listed include: (they were then listed with aningredient declaration for the product being evaluated).
Your rating will indicate the the quality of the product. The objectiveis to evaluate and describe the test product as a processed food. Your owninitial description will be the basis for your future evaluations.
PRODUCT DESCRIPTIONS
Beef Burgundy with Rotini:
Appearance: large pieces of beef, browned beef, large carrotpieces, thick gravy, medium to dark gravy, oilseperation.
Odor: burgundy, browned beef, spice, onion, beef broth, sour,canned.
Flavor: burgundy, browned beef gravy, canned beef, onion,salty, sour, fatty, metallic, bitter, canned beef.
Texture: tender, stringy beef, mushy carrot, soft pasta.
The ingredients of this product are beef, rotini, carrots, dehydrated onion,mushrooms, tomato paste, flour, wine flavor, margarine, HVP, starch vinegar,salt, MSG, sugar, ground celery, pepper, garlic powder, broth.
Beef Ravioli:
Appearance: sauce-orange-red color, insufficient amount forproduct, slightly thick, starchy appearance;meat filling - gray brown to gray green in color.
Odor: cooked spiced tomato sauce, canned tomato paste, spice,beef, oregano. ...
Flavor: cooked, canned tomato paste, spice (pepper, oregano)salty, beef, metallic.
Texture: filling - moist to dry, grainy, pasta - slightly tomoderately thick, tender, gummy, doughy, firm, chewy.
The ingredients of this product are tomatoes or tomato paste, water, flour,beef, bread crumbs, eggs, egg whites, sugar, salt, food starch - modified, soybean oil, cottonseed oil, celery, carrots, spinach, parmesan or romano cheese,dehydrated onion, parsley, garlic, HVP, MSG, spices, flavoring.
38

Appendix C (Cont'd)
Creamed Chicken:
Appearance: sauce - pale yellow to tan orange color (like pimientoblend), smooth, slightly fluid to moderately fluid.
Odor: blended chicken broth, cream sauce, subtle seasoning,sl. cooked milk (evaporated milk), canned-scorchedcream sauce, pimento, cooked chicken, lacks chickencharacter.
Flavor: blended chicken broth cream sauce, subtle seasoning,cooked chicken, pimento, green pepper, salty, slightcanned scorched cream sauce, si. cooked milk (evapor-ated milk), metallic.
Texture: Sauce: smooth, slightly to moderately fluid.Chicken: tender, firm chicken pieces, chicken stringyand chewy.
The ingredients of this product are milk, chicken meat, water, chicken broth,cream, mushrooms, flour, food starch modified, red sweet peppers, greenpeppers, vegetable oil, salt, HVP, onion, sherry wine, chicken flavor, MSG,sugar sodium caseinate, spice, turmeric, garlic, lactose.
Macaroni and Cheese:
Appearance: light yellow-orange cheese sauce, orange bread crumbs,oil droplets, thick, fluid.
Odor: cheese, canned cheese, milk solids, scorched.
Flavor: cheese, starch, canned, bitter, metallic, scorched
cheese sauce, tangy, sour.
Texture: smooth, starchy, gummy, oily, soupy, grainy cheesesauce, tangy, sour.
The ingredients of this product are water, cheddar cheese, American cheese,butter, cottonseed oil, skim milk, food starch modified, bread crumbs, sodiumphosphate, salt, spices, artificial color, macaroni with added glycerol
monostearate.
Smokey Pork:
Appearance: red-brown gravy, fluid gravy, excess meat fines in
gravy, large pork pieces.
Odor: smoke, sweet-sour, sour, scorched, canned sauce, spicy,
BBQ spice.
Flavor: sour, sweet, smoke, scorched, bitter, canned sauce,canned meat.
Texture: tender, chewy, stringy.
The ingredients in this product are pork, pork broth, tomato paste, brown
sugar, starch, cider vinegar, onion, white sugar, flour, red dehydrated
39

Appendix C (Cont'd)
peppers, salt, MSG, liquid smoke, dry mustard, hot sauce, garlic powder,
allspice, chill powder, black pepper, ground cloves.
Swiss Steak:
Appearance: Gravy - medium brown color, moderately fluid, onionpieces.Meat - light tan to moderate red-brown color, fibrouswhen cut, stringy appearance.
Odor: beef gravy, onion, spice, sweet.
Flavor: onion, beef broth, salt, pepper, cooked beef, spice,sweet.
Texture: Gravy - sI. fluid.Meat- dry, stringy, fibrous.
The ingredients for this product are water, U.S. Choice beef, beef broth,dehydrated onion, food starch modified, Worcestershire sauce, flour, salt, HVP,garlic powder, brown sugar, ground celery seed.
%
%o.
40

*0 >
-l -1 1 o 10 UU
~~0
R -x
-o 0a
0
E LL
0 C;
~IL
0
4): )
14 - a
Ix00
CX
-0 0-l uE a
4)
0 w
a..
Ln
E0 V E
a 0
.- 0* U In 00 .
V). o ) Ll0 -J :2 V
41*

Appendix D-2. Hedonic Scale Form for Consumer Evaluation
to - ,•t
PREFERENCE
- t6o-t.o °%'.
o: -" '-
LIKE
EXTREMELY
LIKE CID
h,.,,=VERY MUCH
LIKEd-o MODERATELYU .o
=ut, LIKE
SLIGHTLY
to
NEITHER LIKEt to NOR DISLIKE
Ato DISLIKE
.,,o SLIGHTLY
DISLIKE
MODERATELY
M L_ DISLIK- :o IVERY MUCH
to _DISLIKE
.. to IEXTREMELY
COMMENTS.
,o - 0o042
. . 0J
- ' " , ". . , - ", . ", " , ° " , ". , - . . ' . . - .' . , . ' , ° ". . . - . . - o .' ' , - - . • ' . - -oto. ' . , - -
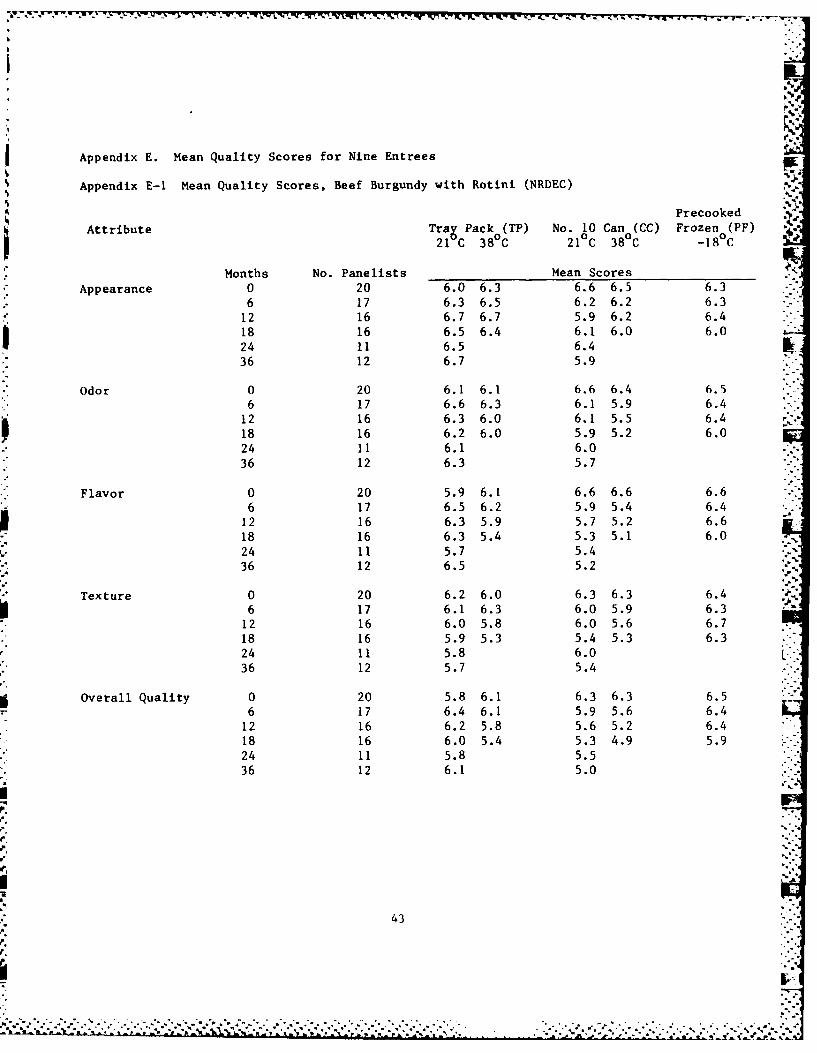
Appendix E. Mean Quality Scores for Nine Entrees
Appendix E-1 Mean Quality Scores, Beef Burgundy with Rotini (NRDEC)
PrecookedAttribute Tray Pack (TP) No. 10 Can (CC) Frozen (PF)
21 C 38°C 210C 38°C -18°C
Months No. Panelists Mean Scores
Appearance 0 20 6.0 6.3 6.6 6.5 6.36 17 6.3 6.5 6.2 6.2 6.312 16 6.7 6.7 5.9 6.2 6.418 16 6.5 6.4 6.1 6.0 6.024 11 6.5 6.436 12 6.7 5.9
Odor 0 20 6.1 6.1 6.6 6.4 6.56 17 6.6 6.3 6.1 5.9 6.4
12 16 6.3 6.0 6.1 5.5 6.418 16 6.2 6.0 5.9 5.2 6.024 11 6.1 6.036 12 6.3 5.7
Flavor 0 20 5.9 6.1 6.6 6.6 6.66 17 6.5 6.2 5.9 5.4 6.4
12 16 6.3 5.9 5.7 5.2 6.618 16 6.3 5.4 5.3 5.1 6.024 11 5.7 5.436 12 6.5 5.2
Texture 0 20 6.2 6.0 6.3 6.3 6.46 17 6.1 6.3 6.0 5.9 6.3
12 16 6.0 5.8 6.0 5.6 6.718 16 5.9 5.3 5.4 5.3 6.324 11 5.8 6.0 -36 12 5.7 5.4
Overall Quality 0 20 5.8 6.1 6.3 6.3 6.56 17 6.4 6.1 5.9 5.6 6.4
12 16 6.2 5.8 5.6 5.2 6.4
18 16 6.0 5.4 5.3 4.9 5.924 11 5.8 5.536 12 6.1 5.0
43
,I.°
""-" .'- .-.-- ..-. -'--'-. .,-- .. -. . .. ' •.-',.."-'' -... ..... ..... "A
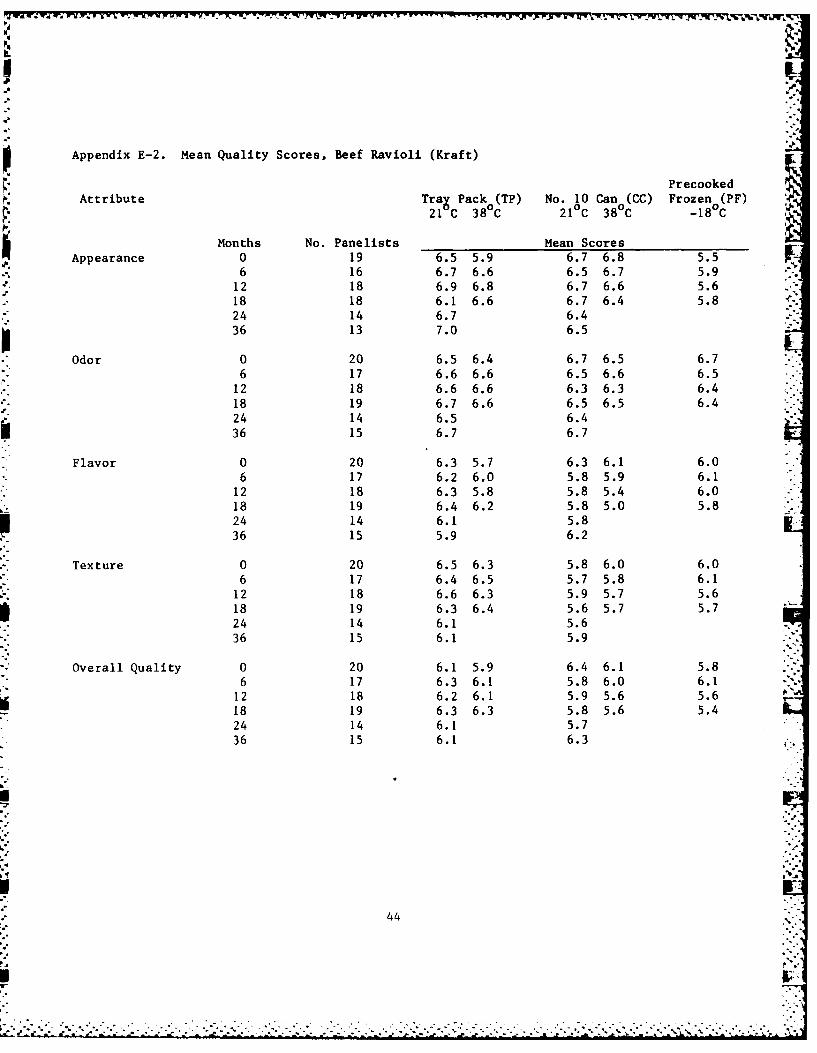
Appendix E-2. Mean Quality Scores, Beef Ravioli (Kraft)
PrecookedAttribute Tray Pack (TP) No. 10 Can (CC) Frozen (PF)
21°C 38°C 210 C 380C -180C
Months No. Panelists Mean ScoresAppearance 0 19 6.5 5.9 6.7 6.8 5.5
6 16 6.7 6.6 6.5 6.7 5.912 18 6.9 6.8 6.7 6.6 5.618 18 6.1 6.6 6.7 6.4 5.824 14 6.7 6.436 13 7.0 6.5
Odor 0 20 6.5 6.4 6.7 6.5 6.76 17 6.6 6.6 6.5 6.6 6.5
12 18 6.6 6.6 6.3 6.3 6.418 19 6.7 6.6 6.5 6.5 6.424 14 6.5 6.436 15 6.7 6.7
Flavor 0 20 6.3 5.7 6.3 6.1 6.06 17 6.2 6.0 5.8 5.9 6.1
12 18 6.3 5.8 5.8 5.4 6.018 19 6.4 6.2 5.8 5.0 5.824 14 6.1 5.8
36 15 5.9 6.2
Texture 0 20 6.5 6.3 5.8 6.0 6.06 17 6.4 6.5 5.7 5.8 6.112 18 6.6 6.3 5.9 5.7 5.618 19 6.3 6.4 5.6 5.7 5.724 14 6.1 5.636 15 6.1 5.9
Overall Quality 0 20 6.1 5.9 6.4 6.1 5.8
6 17 6.3 6.1 5.8 6.0 6.112 18 6.2 6.1 5.9 5.6 5.618 19 6.3 6.3 5.8 5.6 5.4
24 14 6.1 5.736 15 6.1 6.3
44
• p°
.' .' .. .' .,.. .... ... -. ''- o'' .% -'.,.-'." ".. .. - - .- . ..- - . . . ,- .. °. '. .. .- - -% , - . - - , -• ,.-' .

'-I 7 V..
Appendix E-3. Mean Quality Scores, Beef Stew (Kraft)
Precooked
Attribute Tray Pack (TP) No. 10 Can (CC) Frozen (PF) .-
21C 38°C 21°C 38°C -18°C IV
Months No. Panelists Mean ScoresAppearance 0 20 6.9 7.1 6.5 6.4 6.1
6 19 6.7 6.9 6.9 6.4 6.312 16 6.7 6.7 6.2 6.4 6.618 19 6.6 6.5 6.5 6.1 5.924 12 6.9 6.4
36 12 6.6 6.6
Odor 0 20 6.6 6.4 6.5 6.6 6.86 19 6.4 6.4 6.4 6.1 6.7
12 16 6.4 5.8 5.7 5.6 7.0
18 19 6.2 5.7 5.8 5.4 6.824 12 6.0 5.7
36 12 5.7 6.3
Flavor 0 20 6.6 6.5 6.0 5.9 6.96 19 6.5 6.1 6.1 5.3 6.7
12 16 6.1 5.4 5.3 5.2 7.3
18 19 5.9 5.3 5.7 4.8 6.824 12 5.9 5.336 12 5.0 5.6
Texture 0 20 6.4 6.5 6.4 6.2 6.36 19 6.4 6.2 6.4 6.3 6.7
12 16 6.2 5.7 6.3 6.2 6.818 19 5.9 5.7 6.1 6.1 6.424 12 5.7 6.036 12 5.4 6.2
Overall Quality 0 20 6.3 6.5 6.2 5.7 6.36 19 6.3 6.0 6.1 5.4 6.712 16 6.3 5.3 5.4 5.5 7.018 19 6.0 5.2 5.6 5.2 6.624 12 6.0 5.536 12 5.0 5.6
45

Appendix E-4. Mean Quality Scores, Chicken Cacciatore (NRDEC)
PrecookedAttribute Tray Pack (TP) No. 10 Can (CC) Frozen (PF)
21°C 38°C 21°C 38°C -18°C
Months No. Panelists Mean ScoresAppearance 0 20 6.4 6.4 6.3 6.2 5.9
6 17 5.9 5.9 5.6 5.6 5.212 17 6.0 6.1 5.9 5.6 5.818 17 6.2 5.5 5.5 4.9 5.624 13 5.8 5.136 11 5.7 5.3 p sk.
Odor 0 20 6.3 6.3 6.1 6.0 5.96 17 5.7 5.7 5.4 5.4 5.512 17 6.1 5.6 5.2 5.2 5.918 17 5.6 5.3 5.2 4.5 5.424 13 5.4 5.136 11 5.4 4.8
Flavor 0 20 6.1 6.0 5.7 5.3 5.8
6 17 5.3 5.2 5.2 4.9 5.112 17 5.8 5.4 4.9 4.4 5.318 17 5.4 4.7 4.5 3.8 5.424 13 5.4 4.636 11 5.0 4.1
Texture 0 20 5.8 6.0 5.9 6.0 6.16 17 5.5 5.3 5.1 5.2 5.712 17 5.7 5.3 5.3 4.9 5.618 17 5.5 5.0 5.2 4.5 5.724 13 5.0 5.036 11 4.6 4.5
Overall Quality 0 20 6.1 6.0 5.8 5.4 5.76 17 5.5 5.3 5.2 4.9 4.912 17 5.8 5.4 5.0 4.5 5.218 17 5.4 4.9 4.6 4.1 5.424 13 5.3 4.736 it 4.9 4.2 a
46
b.I-..
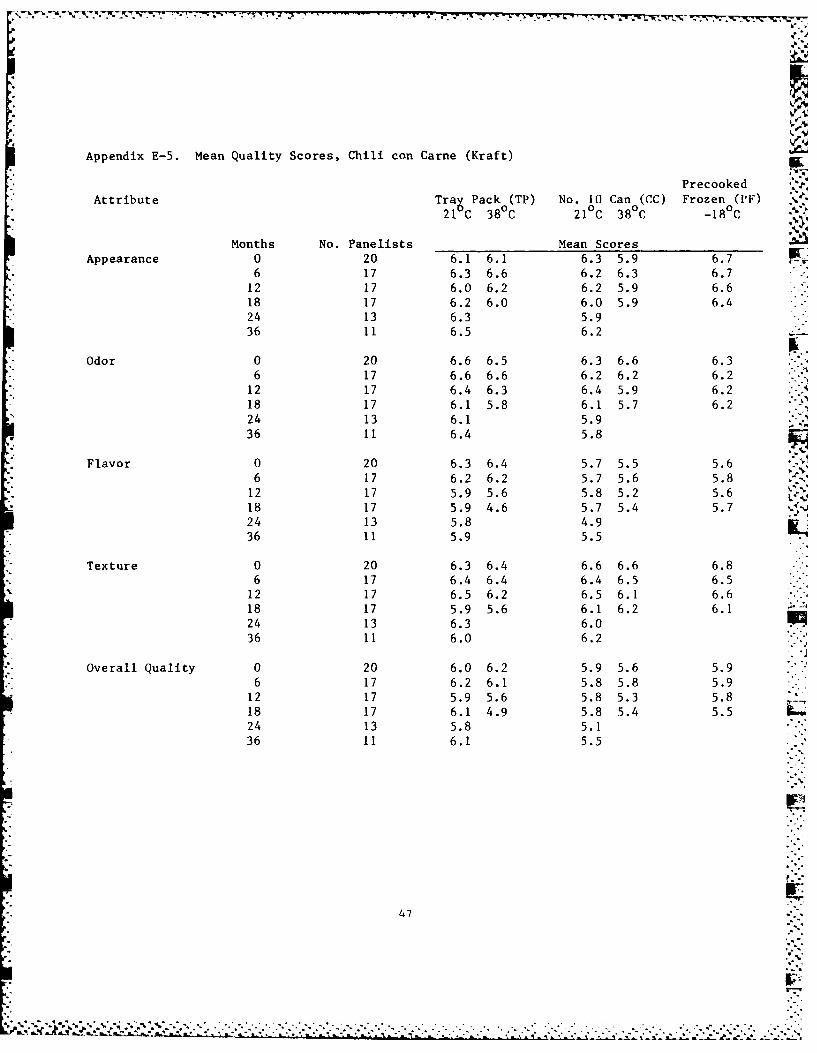
Appendix E-5. Mean Quality Scores, Chili con Came (Kraft)
PrecookedAttribute Tray Pack (TP) No. 10 Can (CC) Frozen (i'F)
21 C 38°C 210 C 38°C -180C
Months No. Panelists Mean ScoresAppearance 0 20 6.1 6.1 6.3 5.9 6.7
6 17 6.3 6.6 6.2 6.3 6.712 17 6.0 6.2 6.2 5.9 6.618 17 6.2 6.0 6.0 5.9 6.424 13 6.3 5.936 11 6.5 6.2
Odor 0 20 6.6 6.5 6.3 6.6 6.36 17 6.6 6.6 6.2 6.2 6.2
12 17 6.4 6.3 6.4 5.9 6.218 17 6.1 5.8 6.1 5.7 6.224 13 6.1 5.936 11 6.4 5.8
Flavor 0 20 6.3 6.4 5.7 5.5 5.66 17 6.2 6.2 5.7 5.6 5.812 17 5.9 5.6 5.8 5.2 5.618 17 5.9 4.6 5.7 5.4 5.724 13 5.8 4.936 11 5.9 5.5
Texture 0 20 6.3 6.4 6.6 6.6 6.86 17 6.4 6.4 6.4 6.5 6.512 17 6.5 6.2 6.5 6.1 6.618 17 5.9 5.6 6.1 6.2 6.124 13 6.3 6.036 11 6.0 6.2
Overall Quality 0 20 6.0 6.2 5.9 5.6 5.96 17 6.2 6.1 5.8 5.8 5.9
12 17 5.9 5.6 5.8 5.3 5.818 17 6.1 4.9 5.8 5.4 5.524 13 5.8 5.136 11 6.1 5.5
47
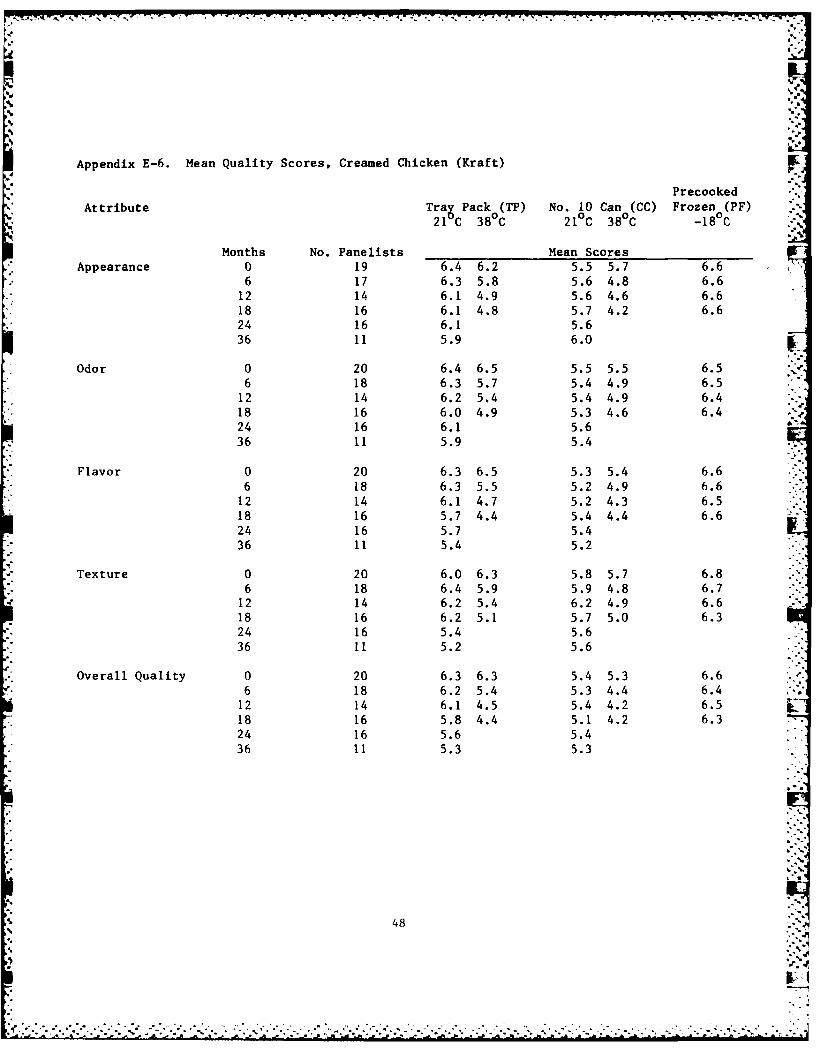
. . . .. .. .. . . . . . . 7-
Appendix E-6. Mean Quality Scores, Creamed Chicken (Kraft)
PrecookedAttribute Trag Pack (TP) No. 10 Can (CC) Frozen (PF)
21 C 38 C 210C 38 C -18 C
Months No. Panelists Mean Scores i*Appearance 0 19 6.4 6.2 5.5 5.7 6.6
6 17 6.3 5.8 5.6 4.8 6.612 14 6.1 4.9 5.6 4.6 6.618 16 6.1 4.8 5.7 4.2 6.624 16 6.1 5.636 11 5.9 6.0
Odor 0 20 6.4 6.5 5.5 5.5 6.56 18 6.3 5.7 5.4 4.9 6.5
12 14 6.2 5.4 5.4 4.9 6.418 16 6.0 4.9 5.3 4.6 6.424 16 6.1 5.636 11 5.9 5.4
Flavor 0 20 6.3 6.5 5.3 5.4 6.66 18 6.3 5.5 5.2 4.9 6.6
12 14 6.1 4.7 5.2 4.3 6.518 16 5.7 4.4 5.4 4.4 6.624 16 5.7 5.436 11 5.4 5.2
Texture 0 20 6.0 6.3 5.8 5.7 6.86 18 6.4 5.9 5.9 4.8 6.7
12 14 6.2 5.4 6.2 4.9 6.618 16 6.2 5.1 5.7 5.0 6.324 16 5.4 5.636 11 5.2 5.6
Overall Quality 0 20 6.3 6.3 5.4 5.3 6.66 18 6.2 5.4 5.3 4.4 6.4
12 14 6.1 4.5 5.4 4.2 6.518 16 5.8 4.4 5.1 4.2 6.324 16 5.6 5.436 11 5.3 5.3
48

Appendix E-7. Mean Quality Scores, Macaroni and Cheese (Kraft)
Precooked
Attribute Tray Pack (TP) No. 10 Can (CC) Frozen (I'F) .21°C 38°C 210C 380 C -180 C .
Months No. Panelists Mean Scores
Appearance 0 20 5.6 5.5 5.4 5.1 6.6 I6 16 5.7 5.3 6.0 5.6 6.5
12 17 5.6 4.9 5.9 4.6 6.618 15 5.5 4.1 5.7 3.5 6.7]24 16 5.5 5.536 - - -
Odor 0 20 5.4 5.6 6.0 5.8 6.66 16 5.4 5.2 6.1 5.9 6.1
12 17 5.2 5.1 5.8 5.2 6.518 15 5.3 4.9 5.8 4.3 6.2
24 16 5.4 5.636 - - -
Flavor 0 20 4.7 4.9 5.8 5.8 6.16 16 4.7 4.2 5.7 5.2 6.2
12 17 4.6 4.5 5.8 4.8 6.418 15 4.7 3.8 5.3 3.4 5.824 16 4.6 5.136
Texture 0 20 5.8 5.8 5.9 5.8 6.36 16 5.9 5.7 6.1 5.7 5.8
12 17 5.9 6.1 6.1 5.9 6.218 15 6.0 5.7 5.9 5.4 5.924 16 5.9 5.936
Overall Quality 0 20 4.9 5.2 5.6 5.5 6.0
6 16 4.9 4.3 5.9 5.2 6.012 17 4.6 4.8 5.8 4.7 6.518 15 4.7 3.8 5.2 3.1 5.824 16 4.9 5.1
3 6.- -
49
..- :. .
.'-ma, _" ,. _ y. , .,. ,. . -, ., , ,, * m m II- I ... -"
' '""

Appendix E-8. Mean Quality Scores, Smoky Pork (NRDEC)
PrecookedAttribute Tray Pack (TP) No. 10 Can (CC) Frozen (PF)
21°C 38°C 210 C 380C -180C
Months No. Panelists Mean ScoresAppearance 0 19 6.4 6.5 6.4 6.7 5.6
6 17 5.8 6.3 5.6 5.6 5.912 14 6.2 6.3 5.3 5.9 5.218 12 6.7 6.3 5.7 5.1 5.724 10 6.1 5.536 12 6.3 5.5
Odor 0 20 6.7 6.7 6.5 6.7 6.66 17 6.6 6.4 5.8 5.5 6.6
12 14 6.2 6.1 5.6 5.6 6.118 12 6.5 6.3 5.6 5.3 6.224 10 5.8 5.336 12 6.2 5.7
Flavor 0 20 6.5 6.6 6.2 6.4 6.46 17 6.4 6.2 5.5 5.2 6.7
12 14 6.1 5.8 5.2 4.9 6.118 12 6.3 5.7 5.2 4.6 6.224 10 5.4 4.9
36 12 5.9 5.2
Texture 0 20 6.7 6.7 6.3 6.4 6.66 17 6.2 6.1 5.8 5.5 6.812 14 6.0 5.8 5.6 5.1 6.418 12 6.2 5.8 5.4 5.1 6.624 10 5.7 5.236 12 5.8 5.4
Overall Quality 0 20 6.4 6.6 6.1 6.4 6.16 17 6.1 6.3 5.4 5.2 6.712 14 6.1 5.6 5.4 5.0 5.718 12 6.3 5.8 5.3 4.7 6.024 10 5.5 5.036 12 5.7 5.1
50
.. ""
o- ,o °
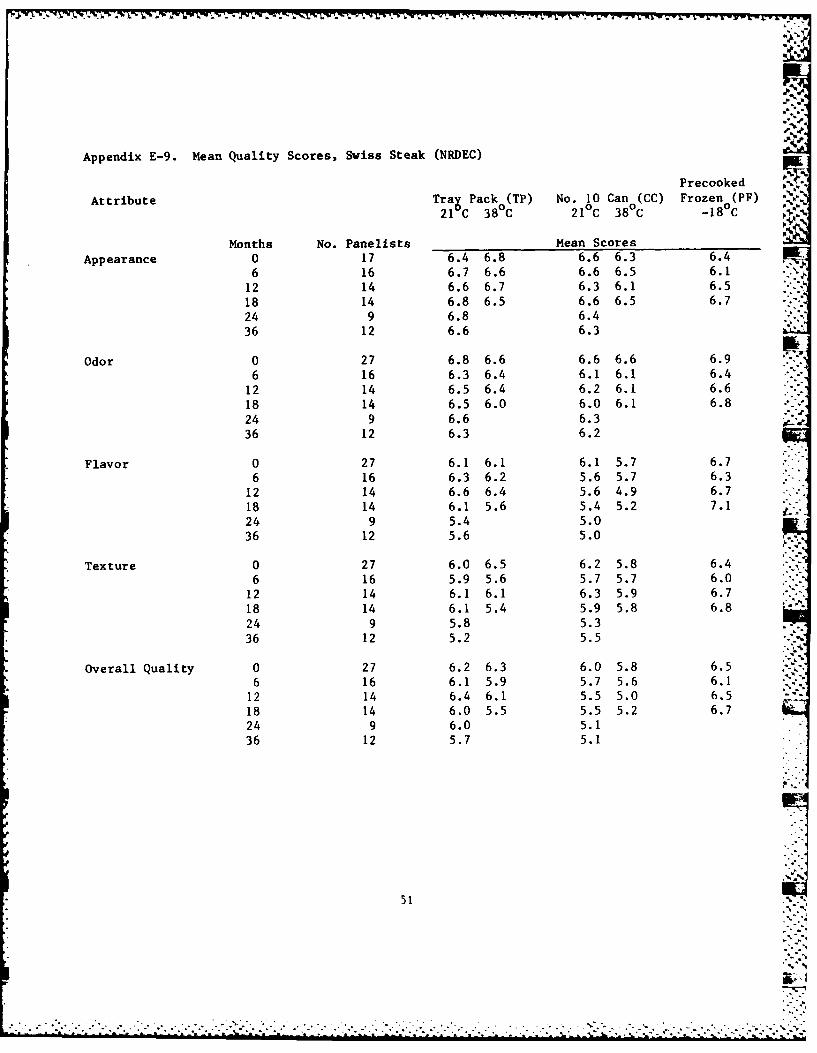
Appendix E-9. Mean Quality Scores, Swiss Steak (NRDEC)
Precooked
Attribute Tray Pack (TP) No. 10 Can (CC) Frozen (PF) ,
21°C 38°C 21°C 38°C -18 C
Months No. Panelists Mean Scores
Appearance 0 17 6.4 6.8 6.6 6.3 6.4
6 16 6.7 6.6 6.6 6.5 6.1
12 14 6.6 6.7 6.3 6.1 6.5
18 14 6.8 6.5 6.6 6.5 6.7
24 9 6.8 6.4
36 12 6.6 6.3
Odor 0 27 6.8 6.6 6.6 6.6 6.9
6 16 6.3 6.4 6.1 6.1 6.4
12 14 6.5 6.4 6.2 6.1 6.6
18 14 6.5 6.0 6.0 6.1 6.8
24 9 6.6 6.3
36 12 6.3 6.2
Flavor 0 27 6.1 6.1 6.1 5.7 6.7
6 16 6.3 6.2 5.6 5.7 6.312 14 6.6 6.4 5.6 4.9 6.7
18 14 6.1 5.6 5.4 5.2 7.1
24 9 5.4 5.0
36 12 5.6 5.0
Texture 0 27 6.0 6.5 6.2 5.8 6.4 M6 16 5.9 5.6 5.7 5.7 6.012 14 6.1 6.1 6.3 5.9 6.7
18 14 6.1 5.4 5.9 5.8 6.8
24 9 5.8 5.3
36 12 5.2 5.5
Overall Quality 0 27 6.2 6.3 6.0 5.8 6.56 16 6.1 5.9 5.7 5.6 6.1
12 14 6.4 6.1 5.5 5.0 6.5
18 14 6.0 5.5 5.5 5.2 6.7
24 9 6.0 5.136 12 5.7 5.1
5,
51 a!i
'I .

7 7 _-L --t .3 ..W %-I -a: Z S-
"°J
7.
Appendix F. Hedonic Scale Acceptability Data for Nine Entrees (1 )
Precooked
Storage Time Frozen (PC) No. 10 Can (CC) Tray Pack (TP _Product (Months) (-18°C) (210C) (380 C) (21°C) (38 C)
Beef Burgundy 0 6.1 + 2.0 6.6 + 1.9 6.3 + 1.4 7.0 + 1.4 6.9 + 1.2with Rotini 6 7.1 + 1.6 6.2 T 2.3 6.3 + 1.8 7.0 T 1.7 7.1 T 1.7(NRDEC) 12 6.7 T 1.4 5.8 + 2.0 6.1 T 2.1 6.8 + 1.5 6.7 + 1.4
18 6.2 + 2.1 6.7 + 1.2 5.8 + 1.7 7.1 + 1.1 6.3 + 1.124 6.4 + 1.9 7.3 + 1.536 6.8 + 1.4 7.1 + 1.4
Beef Ravioli 0 5.4 + 2.3 5.4 + 1.8 5.7 + 1.6 6.4 + 1.5 6.3 + 1.6(Kraft) 6 5.6 + 2.2 5.8 + 2.0 5.8 + 1.8 6.1 + 1.9 6.0 + 1.5
12 5.8 2.2 5.2 1.9 5.1 2.2 5.5 1.9 5.4 + 1.918 5.8 + 2.4 5.9 + 1.8 5.6 + 2.2 5.9 + 2.0 4.7 + 2.524 6.2 + 1.6 6.8 + 1.136 6.2 + 2.0 6.5 + 1.5
Beef Stew 0 6.7 + 1.7 6.2 + 2.2 5.8 + 2.4 6.1 + 2.0 6.1 + 1.8
(Kraft) 6 7.2 + 1.5 5.7 + 1.7 5.1 + 2.1 6.1 + 1.9 5.9 + 1.8
12 6.9 + 2.0 6.2 + 1.7 5.8 + 1.8 5.8 + 1.6 5.8 + 1.718 7.4 + 1.2 6.1 + 1.9 5.4 + 1.9 6.1 + 1.3 4.9 + 1.824 6.3 + 1.7 6.6 + 1.836 6.2 + 1.7 6.1 T 1.6
Chicken 0 5.9 + 2.0 5.9 + 2.0 5.5 + 1.8 6.0 + 1.7 5.9 + 1.8Cacciatore 6 6.6 + 1.5 5.6 + 1.9 4.9 T 2.1 5.5 + 1.5 5.1 + 1.5(NRDEC) 12 6.3 + 1.8 5.3 + 2.2 4.6 + 1.7 5.8 + 1.7 5.1 + 1.6
18 6.7 + 1.7 5.4 + 2.2 4.3 + 2.1 5.7 + 1.8 4.9 + 2.024 6.1 + 1.5 6.4 + 1.636 5.4 + 2.0 5.3 + 2.2
Chili Con 0 6.4 + 2.2 5.0 + 2.4 5.4 + 2.2 5.7 + 2.1 6.1 + 1.9Carne with 6 6.2 + 1.9 5.5 + 2.2 5.3 + 2.2 6.2 + 1.5 6.2 + 1.6Beans (Kraft) 12 6.4 + 2.0 4.7 + 2.6 4.4 + 2.2 5.7 + 1.8 5.1 + 2.1
18 6.3 + 1.8 6.3 + 1.6 5.6 + 2.1 6.3 + 1.8 5.6 + 1.824 6.3 + 1.9 6.4 + 1.7 -36 6.1 1.6 6.3 1.7
407
52
%. -. . .-
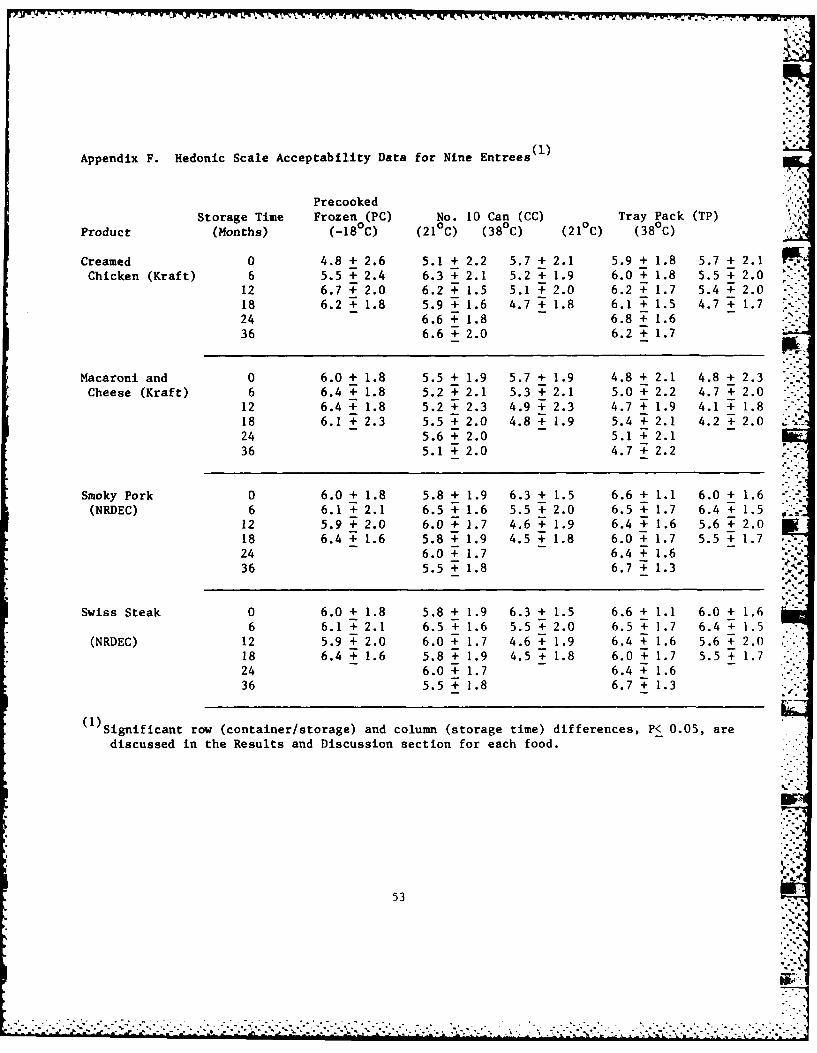
VNR
I:,-
Appendix F. Hedonic Scale Acceptability Data for Nine Entrees l1
PrecookedStorage Time Frozen (PC) No. 10 Can (CC) Tray Pack (TP)
Product (Months) (-18°C) (210C) (38°C) (21°C) (38°C)
Creamed 0 4.8 + 2.6 5.1 + 2.2 5.7 + 2.1 5.9 + 1.8 5.7 + 2.1 PO."Chicken (Kraft) 6 5.5 + 2.4 6.3 + 2.1 5.2 + 1.9 6.0 + 1.8 5.5 T 2.0
12 6.7 + 2.0 6.2 + 1.5 5.1 + 2.0 6.2 + 1.7 5.4 + 2.018 6.2 + 1.8 5.9 + 1.6 4.7 + 1.8 6.1 T 1.5 4.7 T 1.724 6.6 + 1.8 6.8 + 1.636 6.6 + 2.0 6.2 + 1.7
Macaroni and 0 6.0 + 1.8 5.5 + 1.9 5.7 + 1.9 4.8 + 2.1 4.8 + 2.3Cheese (Kraft) 6 6.4 + 1.8 5.2 + 2.1 5.3 + 2.1 5.0 T 2.2 4.7 T 2.0
12 6.4 + 1.8 5.2 + 2.3 4.9 + 2.3 4.7 + 1.9 4.1 + 1.818 6.1 + 2.3 5.5 + 2.0 4.8 + 1.9 5.4 + 2.1 4.2 + 2.024 5.6 + 2.0 5.1 + 2.136 5.1 + 2.0 4.7 T 2.2
Smoky Pork 0 6.0 + 1.8 5.8 + 1.9 6.3 + 1.5 6.6 + 1.1 6.0 + 1.6(NRDEC) 6 6.1 T 2.1 6.5 + 1.6 5.5 + 2.0 6.5 T 1.7 6.4 + 1.5 "'.-
12 5.9 T 2.0 6.0 + 1.7 4.6 + 1.9 6.4 + 1.6 5.6 + 2.018 6.4 + 1.6 5.8 + 1.9 4.5 + 1.8 6.0 + 1.7 5.5 + 1.724 6.0 + 1.7 6.4 + 1.636 5.5 + 1.8 6.7 + 1.3
Swiss Steak 0 6.0 + 1.8 5.8 + 1.9 6.3 + 1.5 6.6 + 1.1 6.0 + 1.66 6.1 2.1 6.5 1.6 5.5 2.0 6.5 + 1.7 6.4 T 1.5
(NRDEC) 12 5.9 + 2.0 6.0 + 1.7 4.6 + 1.9 6.4 + 1.6 5.6 + 2.018 6.4 + 1.6 5.8 + 1.9 4.5 + 1.8 6.0 ; 1.7 5.5 + 1.724 6.0 + 1.7 6.4 + 1.636 5.5 + 1.8 6.7 + 1.3
(1)Significant row (container/storage) and column (storage time) differences, P< 0.05, arediscussed in the Results and Discussion section for each food.
53
......................................*.**~*.... .... ...

Appendix G. Quality Evaluation and Consumer Acceptance, Two-Factor Analysis of Variance forNine Heat Processed Entrees Stored up to 36 Months at 21 C (Scales 1 to 9)
ConsumerTechnologists' Quality Scale Rating Panelists
1Acceptability
No. of INo. of HedonicFood Name/ Judge- Appear- Overall IJudge- ScaleVariable (b) ments ance Odor Flavor Texture Quality :ments Rating
Beef Burgundywith RotiniStorage Time,Months
0 40 6.3+0.7 a 6.3+0.9 a 6.3+1.0 a 6.3+1.0 a 6.1+1.0 a 70 6.6+1.9 a
6 34 6.5+0.8 a 6.4+1.0 a 6.2+1.0 a 6.1+0.9 ab 6.1+0.9 a 70 6.6+2.1 a
12 32 6.3+0.7 a 6.2+1.1 a 6.0+1.3 a 6.0+1.0 ab 5.9+1.1 a 70 6.3+1.8 a
18 32 6.3+0.6 a 6.0+0.7 a 5.8+1.2 a 5.6+0.9 b 5.7+1.0 a 70 6.9+1.2 a
24 22 6.4+0.6 a 6.0+0.8 a 5.5+1.0 a 5.9+0.6 ab 5.6+0.8 a 70 6.9+1.7 a
36 24 6.3+0.9 a 6.0+1.0 a 5.9+1.1 a 5.6+0.6 b 5.5+1.0 a 70 6.9+1.4 a
Container,Tray Pack 92 6.5+0.7 a 6.3+0.9 a 6.2+1.0 a 6.0+0.9 a 6.1+0.9 a 210 7.0+1.5 a
No. 10 Can 92 6.2+0.7 b 6.1+0.9 a 5.8+1.2 b 5.9+0.9 a 5.7+1.0 b 210 6.4+1.8 b
Beef RavioliStorage Time,
Months0 39 6.6+0.7 a 6.6+0.7 a 6.3+0.7 a 6.2+1.1 a 6.3+1.0 a 70 5.9+1.7 b
6 34 6.6+0.7 a 6.5+0.6 a 6.0+0.9 a 6.1+0.8 a 6.1+0.8 a 70 5.9+1.9 b
12 36 6.8+0.6 a 6.4+0.7 a 6.1+1.2 a 6.2+1.0 a 6.0+1.1 a 70 5.4+1.9 b
18 38 6.7+0.6 a 6.6+0.6 a 6.1+0.9 a 5.9+0.9 a 6.1+0.8 a 70 5.9+1.8 b
24 28 6.5+0.6 a 6.4+0.6 a 6.0+0.8 5.8+0.9 a 5.9+0.8 a 70 6.5+1.4 a.... . -
36 30 6.7+0.6 a 6.7+0.6 a 6.1+0.9 a 6.0+0.7 a 6.2+0.8 a 70 6.5+1.7 a
Container,Tray Pack 103 6.7+0.5 a 6.6+0.6 a 6.2+1.0 a 6.3+0.8 a 6.2+1.0 a 210 5.8+1.8 b
No. 10 Can 102 6.6+0.7 a 6.5+0.6 a 6.0+0.9 a 5.8+0.9 b 6.0+0.8 a 210 6.2+1.7 a
54
-7.* . . a..,
-~~~~~~~~~~~~~~~~~~ ~~~~~~~.-.:'"-.'. . :. . ... ... . . . . . . . . . . . . . . . . . . . . . . . . . . . . .. "" "'
- '" " '
""' '
" "'"'""
"a ."* *" "a -' "''' " "

Appendix C. Quality Evaluation and Consumer Acceptance, Two-Factor Analysis of Variance forNine Heat Processed Entrees Stored up to 36 Months at 21 0 C (Scales 1 to 9)(Cont 'd)
ConsumerTechnologists' Quality Scale Rating 1,Panelists 1
AcceptabilityNo. of Toof Hedonic
* Food Name/ Judge- Appear- Overall :Judge- ScaleVariable (b) ments ance Odor Flavor Texture Quality nIents Rating
Beef StewI-Storage Time,
Months0 40 6.7+0.8 a 6.6+0.6 a 6.3+0.8 a 6.4+0.8 a 6.3+0.8 a 170 6.1+2.0 a
6 38 6.8+0.7 a 6.4+0.6 ab 6.3+0.9 a 6.4+0.7 ab 6.2+0.8 a 70 5.9+1.8 a
12 32 6510a 6108b 5.1. b6208ac5810bi 7 .+.
*12 32 6.5+1.0 a 6.1+0.8 be 5.7+1.1 ab 6.2+0.8 abc 5.8+1.0 ab, 70 6.0+1.7 a
*24 24 6.7+0.7 a 5.8+0.8 c 5.6+0.9 b 5.9+0.7 be 5.7+0.8 abj 70 6.6+1.6 a
36 24 6.6+0.7 a 6.0+0.9 be 5.3+1.0 b 5.8+1.0 c 5.3+1.0 b :70 6.2+1.7 a
*Tray Pack 98 6.7+0.7 a 6.3+0.8 a 6.1+0.9 a 6.1+0.9 a 6.1+0.9 a 1210 6.2+1.8 a
No. 10 Can 98 6.5+0.9 a 6.1+0.8 a 5.7+1.1 b 6.2+0.8 a 5.8+1.0 b 210 6.1+1.7 a
- ChickenCacciatore__________________
Storage Time,IMonths
0 40 6.4+0.7 a 6.2+0.7 a 5.9+0.8 a 5.9+0.9 a 5.9+0.8 a 70 5.9+1.9 a
6 34 5.8+0.7 ab 5.6+0.9 ab 5.2+0.8 b 5.3+1.1 ab 5.3+0.9 ab, 70 5.6+1.7 a
12 34 5.9+1.0 ab 5.7+1.3 ab 5.4+1.1 b 5.5+1.2 ab 5.4+1.2 ab, 70 5.5+2.0 a
*18 34 5.9+1.1 ab 5.4+1.4 b 4.9+1.3 be 5.4+1.2 ab 5.0+1.3 bc: 70 5.6+2.0 a
24 26 5.5+1.3 b 5.2+1.4 b 5.0+1.3 be 5.0+1.3 be 5.0+1.4 bcl 70 6.2+1.6 a
36 22 5.5+1.0 b 5.1+1.1 b 4.5+1.1 c 4.5+1.0 c 4.5+1.0 c 70 5.4+2.1 a
* Container,ITray Pack 95 6.1+0.8 a 5.8+1.0 a 5.5+1.0 a 5.4+1.1 a 5.6+0.9 a 210 5.6+2.0 a
No. 10 Can 95 5.7+1.1 b 5.4+1.3 b 4.9+1.2 a 5.3+1.2 a 5.0+1.2 b 210 5.8+1.8 a
55

Appendix G. Quality Evaluation and Consumer Acceptance, Two-Factor Analysis of Variance forNine Heat Processed Entrees Stored up to 36 Months at 21 0C (Scales I to 9)(Cont'd)
1 ConsumerTechnologists' Quality Scale Rating Panelists
AcceptabilityNo. of !No. of Hedonic
Food Name/ Judge- Appear- Overall IJudge- ScaleVariable (b) ments ance Odor Flavor Texture Quality Iments Rating
Chili ConCarneStorage Time,
Months0 40 6.2+0.9 a 6.5+0.8 a 6.0+1.2 a 6.5+0.8 a 5.9+1.1 a 70 5.4+2.2 b
6 36 6.3+0.8 a 6.4+0.7 a 5.9+1.1 a 6.4+0.6 a 6.0+1.0 a 70 5.8+1.9 ab
12 34 6.1+1.0 a 6.4+0.7 a 5.9+1.3 a 6.5+0.7 a 5.9+1.1 a 70 5.2+2.3 b
18 28 6.1+0.9 a 6.1+0.8 a 5.8+1.0 a 6.0+0.9 a 5.9+0.9 a 70 6.3+1.7 a- - f
24 30 6.1+0.7 a 6.0+0.7 a 5.4+1.3 a 6.1+0.7 a 5.5+1.3 a 70 6.3+1.8 a
36 22 6.4+0.7 a 6.1+0.8 a 5.7+0.9 a 6.1+0.6 a 5.8+0.8 a 70 6.1+1.6 a
Container,Tray Pack 95 6.2+0.8 a 6.4+0.6 a 6.0+1.0 a 6.3+0.8 a 6.0+1.0 a 210 6.1+2.1 a
No. 10 Can 95 6.2+0.9 a 6.1+0.9 b 5.6+1.2 b 6.3+0.7 a 5.7+1.1 b 210 5.6+1.8 b
CreamedChicken
Storage Time,Months
0 40 6.0+0.9 a 5.9+1.1 a 5.8+1.2 a 5.9+1.0 a 5.8+1.0 a 70 5.5+2.0 a
6 36 5.9+1.0 a 5.9+1.1 a 5.7+1.1 a 6.2+0.6 a 5.7+0.9 a 70 6.1+2.0 a
12 28 5.8+1.1 a 5.8+1.0 a 5.7+1.3 a 6.2+0.8 a 5.8+1.1 a 70 6.2+1.6 a
18 32 5.9+0.9 a 5.7+0.9 a 5.6+1.1 a 5.9+0.9 ab 5.5+0.9 a 70 6.0+1.6 a
24 32 5.9+0.8 a 5.8+0.7 a 5.5+1.0 a 5.5+1.0 b 5.5+0.9 a 70 6.6+1.7 b
36 22 6.0+0.9 a 5.6+0.8 a 5.3+1.0 a 5.4+0.7 b 5.3+0.9 a 70 6.4+1.9 b
S Contaner,.- Tray Pack 95 6.2+0.9 a 6.2+0.7 a 6.0+0.9 a 6.0+0.9 a 5.9+0.8 a 210 6.1+1.9 a '.
No. 10 Can 95 5.6+0.9 b 5.4+1.0 b 5.3+1.2 b 5.8+0.9 b 5.3+1.0 a 210 6.2+1.7 a
56
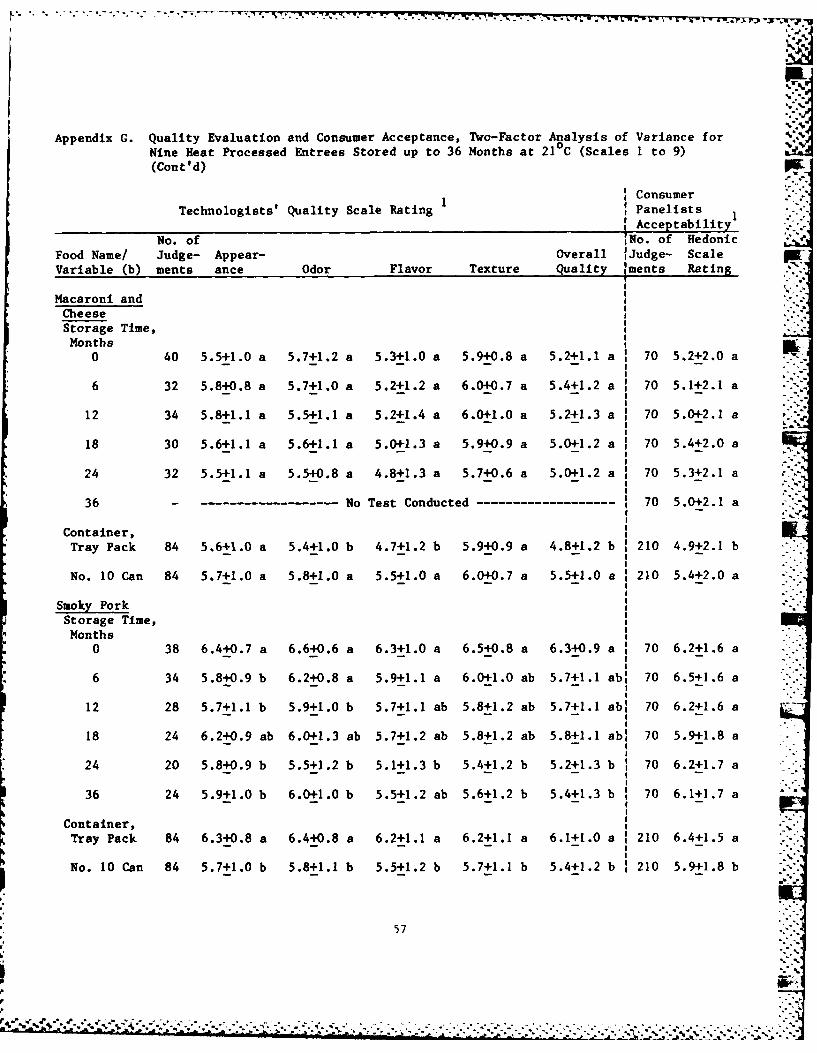
Appendix G. Quality Evaluation and Consumer Acceptance, Two-Factor Analysis of Variance forNine Heat Processed Entrees Stored up to 36 Months at 21 0C (Scales 1 to 9)(Cont'd)
ConsumerTechnologists' Quality Scale Rating 1Panelists
AcceptabilityNo. of ',NO. of Hedonic
Food Name! Judge- Appear- Overall jJudge- Scale MVariable (b) ments ance Odor Flavor Texture Quality Iments Rating
Macaroni and
CheeseStorage Time,MonthsI
0 40 5.5+1.0 a 5.7+1.2 a 5.3+1.0 a 5.9+0.8 a 5.2+1.1 a :70 5.2+2.0 a
*6 32 5.8+0.8 a 5.7+1.0 a 5.2+1.2 a 6.0+0.7 a 5.4+1.2 a 70 5.1+2.1 a
12 34 5.8+1.1 a 5.5+1.1 a 5.2+1.4 a 6.0+1.0 a 5.2+1.3 a 70 5.0+2.1 a
18 30 5.6+1.1 a 5.6+1.1 a 5.04-1.3 a 5.9+0.9 a 5.0+1.2 a :70 5.4+2.0 a
24 32 5.5+1.1 a 5.5+0.8 a 4.8+1.3 a 5.7+0.6 a 5.0+1.2 a :70 5.3+2.1 a
*36---- ---------------------- No Test Conducted -------------------- 70 5.0+2.1la
Container,Tray Pack 84 5.6+1.0 a 5.4+1.0 b 4.7+1.2 b 5.9+0.9 a 4.8±1.2 b 210 4.9+2.1 b
No. 10 Can 84 5.7+1.0 a 5.8+1.0 a 5.5+1.0 a 6.0+0.7 a 5.5+1.0 a :210 5.4+2.0 a
Storage Time,IMonthsI
0 38 6.4+0.7 a 6.6+0.6 a 6.3+1.0 a 6.5+0.8 a 6.3+0.9 a :70 6.2+1.6 a
6 34 5.8+0.9 b 6.2+0.8 a 5.9+1.1 a 6.0+1.0 ab 5.7+1.1 ab: 70 6.5+1.6 a
12 28 5.7+1.1 b 5.9+1.0 b 5.7+1.1 ab 5.8+1.2 ab 5.7+1.1 ab 7 .+.
18 24 6.2+0.9 A 6.0+1.3 ab 5.7+1.2 ab 5.8+1.2 ab 5.8+1.1 abi 70 5.9+1.8 a
2420 5.8+0.9 b 5.5+1.2 b 5.1+1.3 b 5.4+1.2 b 5.2+1.3 b 70 6.2+1.7 a
3624 5.9+1.0 b 6.0+1.0 b 5.5+1.2 ab 5.6+1.2 b 5.4+1.3 b :70 6.1+1.7 a
Container,Tray Pack 84 6.3+0.8 a 6.4+0.8 a 6.2+1.1 a 6.2+1.1 a 6.1+1.0 a 210 6.4+1.5 a
No. 10 Can 84 5.7+1.0 b 5.8+1.1 b 5.5+1.2 b 5.7+1.1 b 5.4+1.2 b 210 5.9+1.8 b
57
...................................................

**. w.
Appendix G. Quality Evaluation and Consumer Acceptance, Two-Factor Analysis of Variance forNine Heat Processed Entrees Stored up to 36 Months at 21 C (Scales 1 to 9)(Cont'd)
ConsumerTechnologists' Quality Scale Rating I Panelists 1
_ Acceptability e"
No. of ;No. of HedonicFood Name/ Judge- Appear- Overall IJudge- ScaleVariable (b) ments ance Odor Flavor Texture Quality jments Rating
Swiss SteakStorage Time,Months
0 34 6.5+0.8 a 6.7+0.6 a 6.1+1.1 a 6.1+1.2 a 6.1+1.1 a 70 5.6+2.3 a
6 32 6.7+0.6 a 6.2+0.8 a 6.0+1.0 ab 5.0+0.8 ab 5.9+0.8 ab 70 6.4+1.6 a
12 28 6.5+0.7 a 6.4+0.8 a 6.1+1.1 a 6.2+0.8 a 5.9+0.9 ab 70 6.0+1.9 a
18 28 6.7+0.6 a 6.3+0.9 a 5.8+1.1 ab 6.0+0.7 a 5.7+0.8 ab 70 6.2+1.6 a
24 18 6.6+0.5 a 6.4+0.6 a 5.4+0.9 ab 5.6+0.9 ab 5.6+0.9 ab 70 6.2+2.0 a
36 24 6.5+0.7 a 6.3+0.8 a 5.3+1.0 b 5.3+0.9 b 5.4+0.9 b 70 5.8+2.0 a
Container, I
Tray Pack 82 6.7+0.7 a 6.5+0.7 a 6.1+1.0 a 5.9+0.9 a 6.1+0.9 a 210 6.3+2.0 a
No. 10 Can 82 6.5+0.7 a 6.3+0.8 a 5.5+1.1 b 5.9+0.9 a 5.5+0.9 b 210 5.8+2.0 b
Footnote:I For each column (attribute), and for each main effect (storage time, container), mean
values followed by different letters are significantly different at P<0.05. The mean values foreach main effect are averaged across the other main effect.
58
al

* - . .-- , -
Appendix H. Quality Evaluation and Consumer Acceptance, Three-Factor Analysis of Variance forNine Heat Processed Entrees Stored up to 18 Months (Scales 1 to 9)
1 ConsumerTechnologists' Quality Scale Rating 1 Panelists I
Acceptability
No. of :No. of HedonicFood Name/ Judge- Appear- Overall IJudge- ScaleVariable (b) ments ance Odor Flavor Texture Quality Iments Rating
Beef Burgundywith Rotini(NRDEC)Storage Time,Months '
0 80 6.3+0.8 a 6.3+0.9 a 6.3+1.0 a 6.2+0.9 a 6.2+1.0 a 140 6.4+1.9 a
6 68 6.4+0.8 a 6.2+1.0 a 6.0+1.0 ab 6.1+0.8 a 6.0+0.9 ab! 140 6.6+1.9 a
12 64 6.4+0.7 a 6.0+1.1 ab 5.8+1.3 bc 5.9+1.0 a 5.7+1.2 bc 140 6.4+1.8 a
18 64 6.3+0.7 a 5.8+0.9 b 5.5+1.2 c 5.5+1.0 b 5.4+1.1 c 140 6.5+1.4 a
Container,Tray Pack 138 6.5+0.8 a 6.2+0.9 a 6.1+1.1 a 6.0+1.0 a 6.0+1.0 a 280 6.6+1.8 a
* No. 10 Can 138 6.2+0.7 b 6.0+1.1 a 5.8+1.2 b 5.9+1.0 a 5.7+1.1 b 280 6.4+1.7 a
StorageTemperature
210C 138 6.4+0.7 a 6.2+0.9 a 6.1+1.1 a 6.0+1.0 a 6.0+1.0 a 280 6.8+1.6 a38 C 138 6.3+0.8 a 6.0+1.1 b 5.8+1.2 b 5.8+1.0 a 5.7+1.1 a 280 6.3+1.9 b
Beef Ravioli(Kraft)Storage Time,Months
0 79 6.5+0.9 a 6.6+0.7 a 6.1+1.1 a 6.2+1.1 a 6.1+1.0 a 140 5.9+1.7 a
6 68 6.6+0.6 a 6.6+0.6 a 6.0+0.9 a 6.1+0.8 a 6.1+0.9 a 140 5.9+1.8 a
12 72 6.7+0.6 a 6.4+0.7 a 5.8+1.2 a 6.1+1.0 a 5.9+1.2 a 140 5.3+2.0 b
18 76 6.6+0.7 a 6.6+0.6 a 6.0+0.9 a 6.0+0.8 a 6.0+0.8 a 140 5.5+2.1 ab
Container,Tray Pack 148 6.6+0.8 a 6.6+0.7 a 6.1+1.1 a 6.4+0.8 a 6.2+1.0 a 280 5.8+1.9 a
No. 10 Can 147 6.6+0.7 a 6.5+0.6 a 5.9+1.0 b 5.8+0.9 b 5.9+0.9 b 280 5.5+2.0 a
StorageTemperature
021 C 147 6.7+0.6 a 6.6+0.6 a 6.1+1.0 a 6.1+1.0 a 6.1+0.9 a 280 5.8+1.9 a
38 C 148 6.5+0.8 a 6.5+0.7 a 5.8+1.0 b 6.1+0.9 a 6.0+1.0 a 280 5.5+1.9 a
59

W Y __ 7.- - X - -. - -- -- , r w~. J
ILLAppendix H. Quality Evaluation and Consumer Acceptance, Three-Factor Analysis of Variance forNine Heat Processed Entrees Stored up to 18 Months (Scales 1 to 9) (Cont'd)
1 ConsumerTechnologists' Quality Scale Rating 1 Panelists 1
Acceptability
No. of ;No. of HedonicFood Name/ Judge- Appear- Overall iJudge- Scale ""Variable (b) ments ance Odor Flavor Texture Quality Iments Rating'
Beef Stew(Kraft)Storage Time,Months
0 80 6.7+0.8 a 6.5+0.6 a 6.3+0.8 a 6.4+0.9 a 6.2+0.9 a 140 6.1+2.1 a
6 76 6.7+0.8 a 6.3+0.8 a 6.0+1.0 a 6.3+0.8 a 5.9+0.9 a 140 5.6+1.9 a
12 64 6.5+0.8 a 5.9+0.9 b 5.5+1.0 b 6.1+1.0 ab 5.6+1.0 b 140 5.9+1.7 a
18 76 6.4+1.0 a 5.8+0.9 b 5.4+1.0 b 5.9+0.9 b 5.5+1.0 b 140 5.6+1.8 a
Container,Tray Pack 148 6.8+0.7 a 6.2+0.8 a 6.1+0.9 a 6.1+0.9 a 6.0+0.9 a 280 6.0+1.8 a
No. 10 Can 148 6.4+1.0 b 6.1+0.9 b 5.5+1.0 b 6.2+0.9 a 5.6+1.0 b 280 5.6+2.0 b
StorageTemperature
21 C 148 6.64+0.8 a 6.3+0.8 a 6.0+1.1 a 6.3+0.8 a 6.0+0.9 a 280 5.8+1.8 a
38°C 148 6.6+0.9 b 6.0+0.9 b 5.6+1.0 b 6.1+0.9 a 5.6+1.1 b 280 5.8+2.0 a
.,-
ChickenCacciatore(NRDEC)Storage Time,Months
0 80 6.3+0.7 a 6.2+0.7 a 5.8+1.0 a 5.9+0.9 a 5.8+0.9 a 140 5.9+1.8 a
6 68 5.7+0.9 b 5.6+1.0 b 5.1+1.0 b 5.3+1.1 b 5.2+1.0 b 140 5.3+1.8 b
12 68 5.9+1.0 b 5.5+1.2 b 5.1+1.2 b 5.3+1.2 b 5.2+1.2 b 140 5.2+1.8 b
18 68 5.5+1.3 b 5.2+1.5 b 4.6+1.4 c 5.0+1.3 b 4.7+1.4 c 140 5.1+2.1 b
Container,Tray Pack 142 6.1+0.9 a 5.8+1.0 a 5.5+1.0 a 5.5+1.1 a 5.6+1.0 a 280 5.7+1.9 a
No. 10 Can 142 5.7+1.1 b 5.4+1.3 b 4.9+1.3 b 5.3+1.3 a 5.0+1.3 b 280 5.1+1.9 b
StorageTemperature
0
21°C 142 6.0+0.9 a 5.7+1.1 a 5.4+1.1 a 5.5+1.1 a 5.4+1.1 a 280 5.5+1.7 a ...
38°C 142 5.8+1.1 a 5.5+1.3 a 5.0+1.3 b 5.3+1.3 a 5.1+1.3 b 280 5.2+2.1 b
60
-....,.. .,. .. ... ,.. .,. , . .. ... ...-.. ........... : .... ........ ,.,. ..? ..- ..- . ..:.',-:;', *,"o'-.- ,.-, ,., r'.':',' . ..,. . .,-, - - .- , .-. '.,..,-' ' ,- & .. ' -- '-'i; a)..--." -..
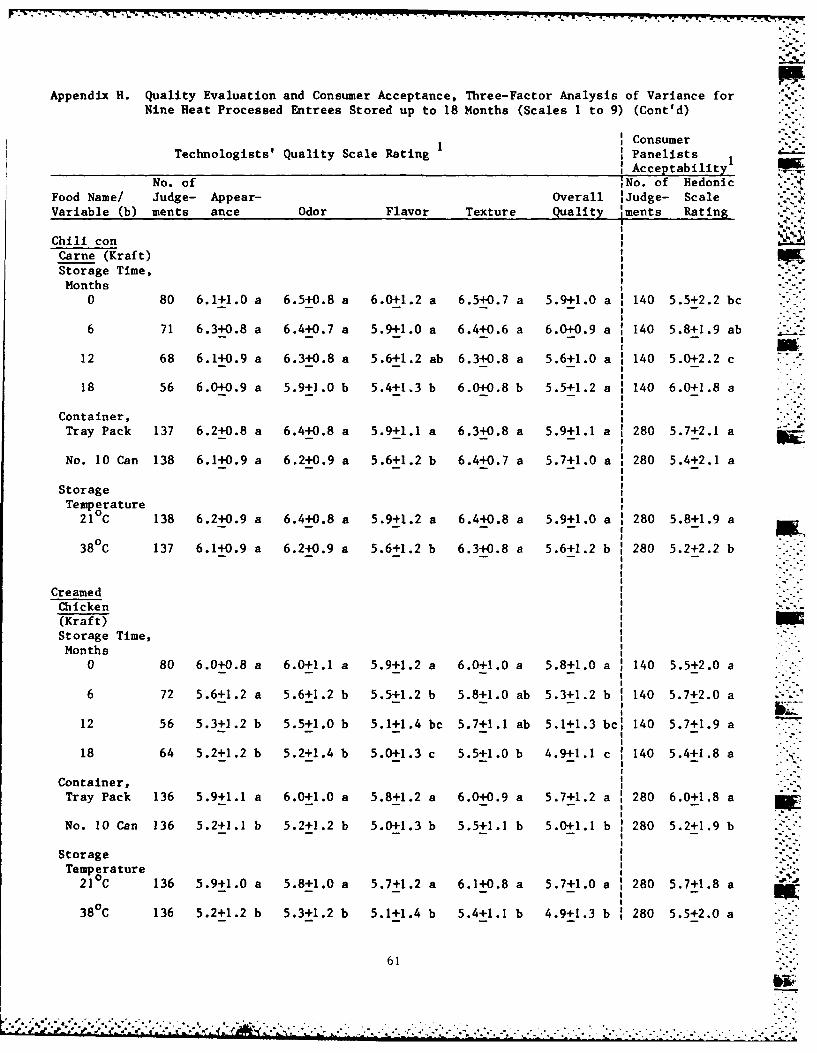
Appendix H. Quality Evaluation and Consumer Acceptance, Three-Factor Analysis of Variance forNine Heat Processed Entrees Stored up to 18 Months (Scales 1 to 9) (Cont'd)
ConsumerTechnologists' Quality Scale Rating 1 Panelists
AcceptabilityNo. of ;No. of Hedonic
Food Name/ Judge- Appear- Overall Judge- Scale,.-.Variable (b) ments ance Odor Flavor Texture Quality ,ments Rating.
Chili conCarne (Kraft)Storage Time,Months
0 80 6.1+1.0 a 6.5+0.8 a 6.0+1.2 a 6.5+0.7 a 5.9+1.0 a 140 5.5+2.2 bc
6 71 6.3+0.8 a 6.4+0.7 a 5.9+1.0 a 6.4+0.6 a 6.0+0.9 a 140 5.8+1.9 ab
12 68 6.1+0.9 a 6.3+0.8 a 5.6+1.2 ab 6.3+0.8 a 5.6+1.0 a 140 5.0+2.2 c
18 56 6.0+0.9 a 5.9+1.0 b 5.4+1.3 b 6.0+0.8 b 5.5+1.2 a 140 6.0+1.8 a
Container, "Tray Pack 137 6.2+0.8 a 6.4+0.8 a 5.9+1.1 a 6.3+0.8 a 5.9+1.1 a 280 5.7+2.1 a
No. 10 Can 138 6.1+0.9 a 6.2+0.9 a 5.6+1.2 b 6.4+0.7 a 5.7+1.0 a 280 5.4+2.1 a
StorageTemperature
0
21°C 138 6.2+0.9 a 6.4+0.8 a 5.9+1.2 a 6.4+0.8 a 5.9+1.0 a :280 5.8+1.9 a
380C 137 6.1+0.9 a 6.2+0.9 a 5.6+1.2 b 6.3+0.8 a 5.6+1.2 b 280 5.2+2.2 b
Creamed .Chicken(Kraft)Storage Time, "Months
0 80 6.0+0.8 a 6.0+1.1 a 5.9+1.2 a 6.0+1.0 a 5.8+1.0 a 140 5.5+2.0 a
6 72 5.6+1.2 a 5.6+1.2 b 5.5+1.2 b 5.8+1.0 ab 5.3+1.2 b 140 5.7+2.0 a
12 56 5.3+1.2 b 5.5+1.0 b 5.1+1.4 be 5.7+1.1 ab 5.1+1.3 bcj 140 5.7+1.9 a
18 64 5.2+1.2 b 5.2+1.4 b 5.0+1.3 c 5.5+1.0 b 4.9+1.1 c 140 5.4+1.8 a
Container,Tray Pack 136 5.9+1.1 a 6.0+1.0 a 5.8+1.2 a 6.0+0.9 a 5.7+1.2 a 280 6.0+1.8 a
No. 10 Can 136 5.2+1.1 b 5.2+1.2 b 5.0+1.3 b 5.5+1.1 b 5.0+1.1 b 280 5.2+1.9 b
Storage -Temperature
21 C 136 5.9+1.0 a 5.8+1.0 a 5.7+1.2 a 6.1+0.8 a 5.7+1.0 a 280 5.7+1.8 a
038 C 136 5.2+1.2 b 5.3+1.2 b 5.1+1.4 b 5.4+1.1 b 4.9+1.3 b 280 5.5+2.0 a
61
,.'.,.' '...-.'.' -. ,.. .. . - '. . ,. . . .. . . . . .. " ..
. . . . i. m . mmm ummmm .. " t

e- 7. °".7
Appendix H. Quality Evaluation and Consumer Acceptance, Three-Factor Analysis of Variance forNine Heat Processed Entrees Stored up to 18 Months (Scales I to 9) (Cont'd)
I ConsumerTechnologists' Quality Scale Rating 1 Panelists 1
AcceptabilityNo. of ;No. of Hedonic
Food Name/ Judge- Appear- Overall :Judge- ScaleVariable (b) ments ance Odor Flavor Texture Quality 'ments Rating
Macaroni and 'Cheese (Kraft) !.?!
Storage Time,Months .
0 79 5.4+1.1 a 5.7+1.1 a 5.3+1.0 a 5.9+0.8 a 5.3+1.0 a 140 5.2+2:0 a
6 64 5.6+1.0 a 5.6+0.9 a 5.0+1.3 a 5.8+0.8 a 5.1+1.3 a 140 5.1+2.1 a
12 68 5.3+1.3 a 5.3+1.2 ab 4.9+1.3 a 6.0+0.9 a 4.9+1.3 a 140 4.7+2.1 a
18 60 4.7+1.4 b 5.1+1.3 b 4.3+1.3 b 5.7+1.0 a 4.2+1.3 b 140 5.0+2.0 a . --
Container,Tray Pack 135 5.3+1.1 a 5.3+1.1 b 4.6+1.2 b 5.9+0.9 a 4.7+1.2 b 280 4.7+2.0 ab
No. 10 Can 136 5.2+1.4 a 5.6+1.2 a 5.2+1.2 a 5.9+0.8 a 5.2+1.3 a 280 5.2+2.1 a
StorageTemperature
210C 136 5.7+1.0 a 5.6+1.1 a 5.2+1.2 a 5.9+0.8 a 5.2+1.2 a 280 5.2+2.1 a
38 0 C 135 4.9+1.3 b 5.3+1.2 b 4.6+1.3 b 5.8+0.9 a 4.6+1.3 b 280 4.8+2.0 b
Smoky Pork(NRDEC)Storage Time,Months
0 76 6.5+0.7 a 6.6+0.5 a 6.4+0.8 a 6.5+0.8 a 6.4+0.8 a 140 6.2+1.6 a
6 68 5.9+0.9 b 6.1+0.9 b 5.8+1.1 b 5.9+1.0 b 5.7+1.0 b 140 6.2+1.7 a
12 56 5.9+1.0 b 5.9+1.0 b 5.5+1.2 b 5.6+1.3 b 5.5+1.2 b 140 5.7+1.9 a
18 48 5.9+1.0 b 5.9+1.2 b 5.4+1.2 b 5.6+1.2 b 5.5+1.2 b 140 5.4+1.9 b
Container,Tray Pack 124 6.3+0.8 a 6.5+0.8 a 6.2+0.9 a 6.2+1.0 a 6.2+0.8 a 280 6.2+1.7 a
No. 10 Can 124 5.9+1.0 b 5.9+1.0 b 5.5+1.2 b 5.7+1.2 b 5.5+1.2 b 280 5.6+1.9 b
StorageTemperature
021 C 124 6.0+0.9 a 6.2+0.9 a 6.0+1.1 a 6.1+1.1 a 5.9+1.0 a 280 6.2+1.6 a
380C 124 6.1+0.9 a 6.1+1.0 a 5.7+1.2 a 5.9+1.1 a 5.8+1.1 a 280 5.6+1.9 b
62

- ------
Appendix H. Quality Evaluation and Consumer Acceptance, Three-Factor Analysis of Variance for .-
Nine Heat Processed Entrees Stored up to 18 Months (Scales I to 9) (Cont'd)
Consumer_ t-
Technologists' Quality Scale Rating 1 Panelists ,Acceptability
No. of ,No. of Hedonic .Food Name/ Judge- Appear- Overall IJudge- ScaleVariable (b) ments ance Odor Flavor Texture Quality ments Rating V
Swiss Steak(NRDEC)Storage Time,Months
0 68 6.5+0.8 a 6.7+0.6 a 6.0+1.0 a 6.1+1.1 a 6.1+1.1 a 140 5.6+2.2 b
6 64 6.6+0.6 a 6.2+0.8 b 6.0+1.0 a 5.7+1.0 a 5.8+0.9 ab 140 6.3+1.7 a
12 56 6.4+0.8 a 6.3+0.7 b 5.9+1.1 a 6.1+0.8 a 5.7+1.0 ab 140 5.9+1.9 ab
18 56 6.6+0.6 a 6.2+0.9 b 5.6+1.1 a 5.8+0.9 a 5.6+0.8 b 140 5.8+1.8 ab
Container,Tray Pack 122 6.7+0.6 a 6.5+0.7 a 6.2+1.0 a 6.0+1.0 a 6.1+0.9 a 280 6.1+1.9 a
No. 10 Can 122 6.4+0.8 b 6.3+0.8 b 5.5+1.0 b 5.9+1.0 a 5.6+0.9 b 280 5.7+2.0 b
StorageTemperature
21°C 122 6.6+0.7 a 6.4+0.8 a 6.0+1.1 a 6.0+0.9 a 5.9+0.9 a 280 6.2+1.9 a
38°C 122 6.5+0.8 a 6.3+0.7 a 5.7+1.1 a 5.9+1.1 a 5.7+1.0 a 280 5.6+2.0 b
1 For each column (attribute), mean values followed by different letters are significantlydifferent at P<O.05. Mean values for each main effect (storage time, container,temperature) are averaged across the other two main effects.
C .
,,,..
,. .
63
-e.

1%ra'rrrr ., . W . w;- .- '-w.- ' ,* * . ..
Appendix 1. Results of Container Examinations, Nine Entrees, After Storage.,
NRDEC Products Withdrawal Container Observations, Two ContainersT_.
Beef Burgundy 6 No. 10 Cans 121°C: Lids stained, some enamel fingernail softmonths 38°C: Lids stained, some enamel fingernail soft
Tray Packs - : Slight gray splotches, body enamel; slightbrowning on covers
I I
Aluminum Pans :-18°C: No deterioration/pitting
12Months No. 10 Cans 21°C: Slight stain to fingernail soft lid enamel,
10 & 50% of surfaces38°C: Pronounced staining and fingernail soft lid
enamel, 10 & 15% of surfaces
No. 10 Cans 21°C: Slight staining and enamel softening of
enamel on can ends and body, easily scratched36 with fingernail
MonthsI I 0
Tray Packs 21 C: Slight staining of can body and lid. Enamel
could not be scratched with fingernail
.o Chicken No. 10 Cans -:Lids stained, enamel slightly fingernailCacciatore soft. Can body enamel near lid seam12 stained and fingernail soft
MonthsTray Packs 38 C: Slight brownish blotches on one lid; red-
dish hue to enamel of other body
0Aluminum Pans '-18°C: No deterioration/pitting
No. 10 Cans 21°0C: Few scratches on body enamel; lids stained18 and fingernail soft, 30 & 60% of surfaces
Months 38°C: Ditto for scratches on body enamel; staining
on lids, fingernail soft, 10 & 20% of surfaces
Tray Packs -:Slight buff cast on can bodies; very slight."tan stains on lids.'.,
No. 10 Cans 21°0C: Traces of corrosion on can bodies. On lids,
enamel softening of stained areas, can be36 N scratched with fingernail
iMonthsI0
Tray Packs 21 C: Same degree of staining as at 18 Months ed
64 .. 64
I I dsh he toenaml ofothe bod

*7 C.. 7 7. -. 7 -T.,* R:
Appendix I. Results of Container Examinations, Nine Entrees, After Storage (Cont'd)
NRDEC Products Withdrawal Container Observations, Two Containers I'
Smoky Pork No. 10 Cans - Severe staining, softening and peeling oflid enamel
Months
Tray Packs - : Very slight brownish stain on lids; slightpinkish stains on bodies
Aluminum Pans 1-18°C: No deterioration
I 0No. 10 Cans 21 C: Extensive enamel softening and separation on
20% of area on lids and lid end of body; 1/2"wide maximum stain developed on lid end of
12 bodyMonths 38 C: Extensive enamel softening and separation on
90% of area on lids and end of body; same
development of staining on lid as for21 C containers.
Tray Packs - : Faint brownish blotches on lids; faintpinkish blotches on body
No. 10 Cans 21 C: Extensive softening and peeling of lidenamel; slight corrosion on exposed base
36 metal. Slight softening of body enamel.Months
Tray Packs 21 C: Lid and body enamel in good condition;traces of staining
Swiss Steak No. 10 Cans Both Temperatures:
Lid enamel stained and fingernail soft, 5, 10,12 30 & 60% of areas. Maximum of 3/8" of enamel
Months at lid end of body stained and fingernail soft
' ,|
Tray Packs - : Very slight brownish stain on 10 & 15% of lidarea; a few very slight grey stains on bodies
I I 0Aluminum Pans -18 C: Corrosion patterns on pan ends; penetration
had occurred (1).
I 0 -No. 10 Cans 21 C: Enamel of lids stained and fingernail soft,
18 25 & 85% of areaMonths 38 C: Same as above; 20 & 65% of area
Tray Packs : Slight staining of enamel
65
.. %

.. . . . . . . . . . . .. ."
Appendix I. Results of Container Examinations, Nine Entrees, After Storage (Cont'd)
NRDEC Products Withdrawal Container Observations, Two Containers1r I 0
Swiss Steak No. 10 Cans 21°C: Slight staining and softening of lid enamel(Cont'd) It _e
36 .Months Tray Packs 21°C: Very slight staining of lid and body; enamel
in excellent condition, could not be scratch-ed with fingernail
Kraft Products Withdrawal Container Observations, Two Containers
Beef Ravioli No. 10 Cans - : No enamel deterioration12
MonthsTray Packs , - : Heating blisters on lids
Aluminum Pans 1-18OC: Orange hue stains on food contact surfacesI
18
Months No. 10 Cans - : Slight corrosion due to 1/16" pinholing andscratching of enamel. One of two 38 storedcontainers had slide 100 major defect. (2)
No. 10 Cans -:Slight to moderate corrosion on inside enamel-
ed, tinplated bodies. Trace of corrosion on
36 inside enameled tin free steel ends.
months
Tray Packs -:Trace of corrosion on inside enamel tinplate
steel bodies and lids
Beef Stew No. 10 Cans '! -:No enamel deterioration
12
Months
Tray Packs !, -:Heating blisters on lids
Aluminum Pans 1-18C: No deterioration
I I
18 No. 10 Cans - : Virtually no deterioration of enamel slight
Months dulling only -.
Tray Packs Heating blisters on lids
No. 0 Cans Enamel/contaner in good condtlon
36 '''Months ___-"
Tray Packs - Heating blisters on lids,. .
____ ___ ___ ____I _ ___ __ I___ ___ ____ ___ ___ ____ ___ ___ ____ ___ ___ ____ ___ ___ ____ _7__7 1

Appendix I. Results of Container Examinations, Nine Entrees, After Storage (Cont'd)
Kraft Products Withdrawal Container Observations, Two Containers
Chili con No. 10 Cans No deterioration of enamel on containerCarne 12 _
Months III '-
Tray Packs - Heating blisters on lidsI, o
Aluminum Pans 1-18°C: No deteriorationI I
18Months No. 10 Cans -: No deterioration
Tray Packs -:Heating blisters on lids
No. 10 Cans :In good condition *l
36 ".Months
Tray Packs :Heating blisters found on lid by rubbing"with fingers -
Creamed No. 3 Tall 1-21°C: Pigmented aluminum enameled body ends; "-i
Chicken Cans amber enameled lids. Code stamp deeply..-embossed in lids resulting in enamel break- -
through. Tinplate bodies slightly corroded.12 Very slight exposure of base metal of 210C
Months can bodies; more exposure of base metal,"'-38°C bodies. "-
Tray Packs , -:Heating blisters on lids -_-
Aluminum Pans 1-18°C: No deterioration i!
No. 3 Tall 21C: No deterioration of body end or lid enamel.
Cans Tinplate bodies detinned; defect concentrated -18 around lid seam and beaded areas. Some base
Months metal exposed. '-
38C: Signs of corrosion on code stamp. More can ".body detinning than 21° C cans -about 75% oftinplate still bright.
Tray Packs -:Heating blisters on lids ii-
67 i::

Appendix I. Results of Container Examinations, Nine Entrees, After Storage (Cont'd)en1
Kraft Products Withdrawal Container Observations, Two Containers
Creamed No. 3 Tall 21C: Body end and lid enamel in good conditionChicken except for slight corrosion an lid code stamp.
( C I(Cont'd) Moderate corrosion on tinplate bodies and36 slight to moderate base metal exposure.
Months
Tray Packs 21C: Traces of heating blisters on lids found byI I I
rubbing with fingers
" I
Macaroni and No. 10 Cans - No deterioration
Cheese 12Months
Tray Packs g - : Heating blisters on lids
I 0Aluminum Pans 1-18 C: No deterioration
I I I
18Months No. 10 Cans N i
I Tray Packs : Heating blisters on lidsI I
No. 10 Cans : In good condition36
MonthsTray Packs : Trace of heating blisters found on lid by
rubbing with fingers
(1)At the conclusion of 18 months storage, the remaining foil pans containing NRDEC-produced
precooked frozen products were examined for development of corrosion. Results were asfollows:
Product No. of Pans No. Corroded Percent
Beef Burgundy 13 3 23Chicken Cacciatore 11 2 18Smoky Pork 10 6 60Swiss Steak 4 2 50
Totals: 38 13 34
(2)Slide 100 from: Visual Inspection Guide (Metal) Food Containers. Pictorial Key to Proj-ection Slide Series PS-20. U.S.D.A., A.M.S., Fruit and Vegetable Division, ProcessedProducts Standardization and Inspection Branch. File Code 125-A-21, January 1976. Slidedescription: enamel fracture with excessive etching confined mostly in inside containerbeads. MAJOR DEFECT.
68
~~~~~~~~~~~. .. .......... . ......... ... .. . ... .. ... , . .. .. ... .. . .. .... .. . . . . . .. .. . . ,, , . .. ,, . , . . '.