an evaluation of sedation level using …libres.uncg.edu/ir/wcu/f/grey2014.pdf · and correlated...
TRANSCRIPT

AN EVALUATION OF SEDATION LEVEL USING BISPECTRAL INDEX (BIS) AND CORRELATED ADVERSE EVENTS IN PATIENTS UNDERGOING
COLONOSCOPIES
A thesis presented to the faculty of the Graduate School of Western Carolina University in partial fulfillment of the requirements for the degree of Master of Science in Nursing.
By
Paula Michelle Grey & Jenna Lee Poziombke
Director: Dr. Mark A. Kossick Professor
Graduate Anesthesia Simulation Education Coordinator
School of Nursing
Committee Members: Dr. Mason McDowell, Nursing Dr. Josh Paschke, Anesthesiologist
March 2014

ACKNOWLEDGEMENTS
We would like to thank our thesis Director, Dr. Mark A. Kossick, and Advisory
Committee, Dr. Mason McDowell, and Dr. Josh Paschke, for their assistance, guidance,
and support in the development of our thesis. We would also like to thank Dr. Paul
Bartels and Lee Crayton for their contributions in analyzing our quantitative data.
Additionally, we offer our warmest regards and thanks to our families, especially
our husbands, for their support and encouragement throughout this process.

TABLE OF CONTENTS
List of Tables .................................................................................................................. v List of Figures ................................................................................................................ vi List of Abbreviations/Symbols ...................................................................................... vii Abstract .......................................................................................................................... ix Chapter One: Background and Rationale for Study ...................................................... 12 Introduction ............................................................................................................... 12 Purpose Statement ..................................................................................................... 13 Justification of the Study .......................................................................................... 14 Scientific Rationale ................................................................................................... 15 Assumptions .............................................................................................................. 16 Research Questions ................................................................................................... 16 Definition of Terms ................................................................................................... 17 Chapter Two: Review of the Literature ......................................................................... 19 Endoscopy and Sedation ........................................................................................... 19 Comparable Research ............................................................................................... 24 Deep Sedation Occurs with Endoscopy .................................................................... 31 Endoscopy, Deep Sedation, and Complications ....................................................... 36 BIS as a Tool for Measuring Sedation ...................................................................... 41 Informed Consent ...................................................................................................... 50 Summary ................................................................................................................... 52 Chapter Three: Methodology ......................................................................................... 56 Research Design ........................................................................................................ 56 Setting ....................................................................................................................... 56 Population and Sample ............................................................................................. 56 Protection of Human Subjects .................................................................................. 57 Instruments ................................................................................................................ 58 Data Collection and Field Procedures ....................................................................... 59 Data Analysis ............................................................................................................ 62 Limitations ................................................................................................................ 63 Chapter Four: Results .................................................................................................... 65 Sample Characteristics .............................................................................................. 65 Major Findings .......................................................................................................... 69 Chapter Five: Discussion ............................................................................................... 80 References ...................................................................................................................... 89 Appendices Appendix A: Observer's Assessment of Alertness/Sedation (OAA/S) .................... 105 Appendix B: Modified Observer's Assessment of Alertness/Sedation (MOAA/S) 106 Appendix C: Ramsay Sedation Score (RSS) ........................................................... 107 Appendix D: Pardee IRB Letter ............................................................................... 108 Appendix E: WCU IRB Letter ................................................................................. 109 Appendix F: Patient Informed Consent ................................................................... 110 Appendix G: Anesthesia Provider Informed Consent ............................................. 112

Appendix H: CRNA Survey Form ........................................................................... 113 Appendix I: Data Collection Sheet .......................................................................... 114

v LIST OF TABLES
Table 1. Study Design Characteristics ............................................................................. 30 2. Patient and Clinical Characteristics ................................................................... 65 3. Anesthesia Provider (AP) Survey Responses .................................................... 68 4. Summary of Length of Procedure Correlations ................................................. 71 5. Summary of Body Mass Index (BMI) Correlations .......................................... 77 6. Summary of Age Correlations ........................................................................... 77 7. Summary of Years as an Anesthesia Provider Correlations .............................. 78 8. Summary of Survey Respondents' Years of Experience Providing Anesthesia for
Colonoscopies .................................................................................................... 79

vi LIST OF FIGURES
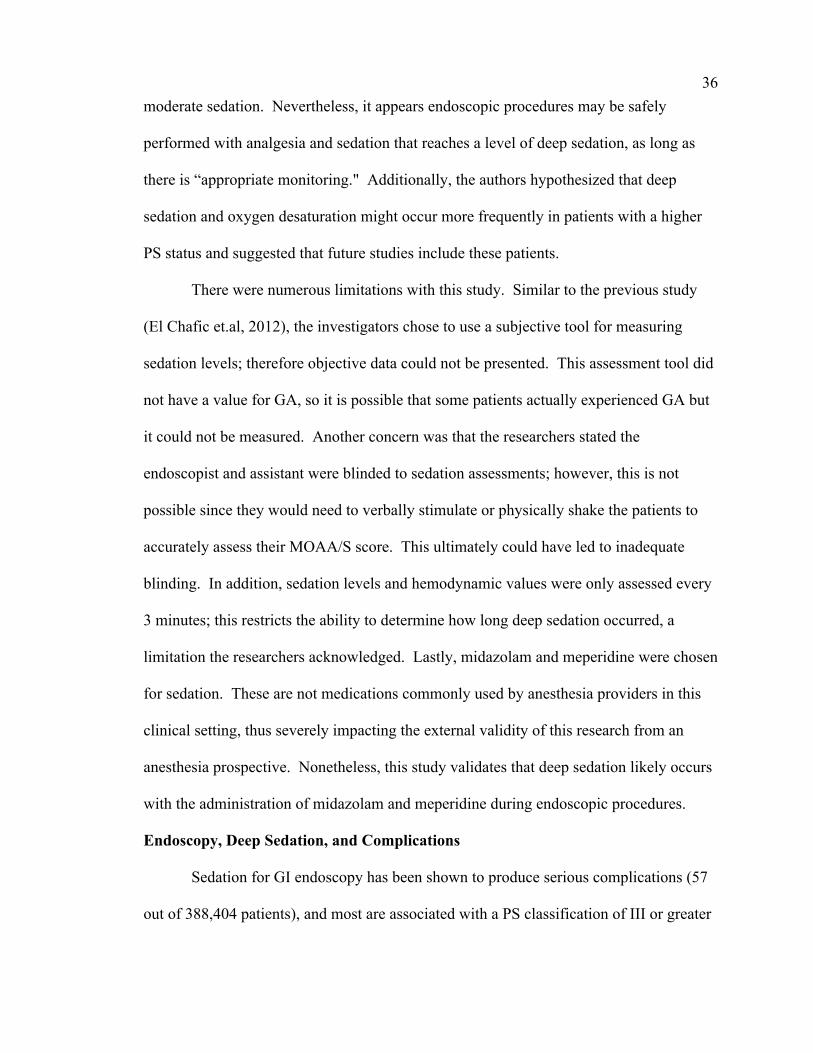
Figure 1. Photograph of BIS A-2000TM monitor ............................................................... 64 2. Bar graph demonstrating the number of minutes of absent ETCO2 .................. 66 3. Bar graph demonstrating the percentage of patients with a MAP decrease < 10.1%
or 10.1-42.4% ..................................................................................................... 67 4. Bar graph exhibiting further breakdown of MAP decrease ............................... 67 5. Pie graph with survey results of the percentage of anesthesia providers who
believed they were delivering a level of sedation .............................................. 69 6. Correlation graph demonstrating the relationship found between the length of
procedure and the number of minutes the patient experienced BIS values ≤ 60 71 7. Correlation graph demonstrating the relationship found between the length of
procedure and the number of minutes the patient experienced BIS values ≤ 40 72 8. Correlation graph demonstrating the relationship found between the length of
procedure and the number of minutes the patient experienced BIS values ≤ 20 72 9. Correlation graph demonstrating the relationship found between the length of
procedure and the number of minutes the patient experienced an absence of ETCO2 ................................................................................................................ 73
10. Correlation graph demonstrating the relationship found between the length of procedure and the number of minutes the patient experienced a SpO2 ≤ 90 ..... 73
11. Correlation graph demonstrating the relationship found between the length of procedure and the patient's lowest BIS value .................................................... 74
12. Correlation graph demonstrating the relationship found between the number of minutes the patient experienced an absent ETCO2 waveform and BIS values ≤ 60 .................................................................................................................... 74
13. Correlation graph demonstrating the relationship found between the number of minutes the patient experienced a SpO2 ≤ 90 and BIS values ≤ 60 ................... 75
14. Correlation graph demonstrating the relationship found between the patient's BMI and the patient's lowest BIS value ..................................................................... 76
15. Correlation graph demonstrating the relationship found between the patient's BMI and the number of minutes the patient experienced BIS values ≤ 60 ................ 76
16. Correlation graph demonstrating the relationship found between the patient's BMI and the number of minutes the patient experienced BIS values ≤ 40 ................ 77
17. Bar graph demonstrating the mean patients' lowest BIS value observed throughout the procedure for each Physical Status classification ........................................ 79
vii LIST OF ABBREVIATIONS/SYMBOLS
ASA: American Society of Anesthesiologists
ASGE: American Society for Gastrointestinal Endoscopy
BiPAP: Bi-level Positive Airway Pressure
BIS: Bispectral Index
BP: Blood Pressure
BMI: Body Mass Index
BSR: Burst Suppression Ratio
CMS: Centers for Medicare & Medicaid Services
CSI: Cerebral State Index
CVA: Cerebrovascular Accident
CRNA: Certified Registered Nurse Anesthetist
CPAP: Continuous Positive Airway Pressure
DBP: Diastolic Blood Pressure
ECG: Electrocardiogram EEG: Electroencephalogram
EMG: Electromyography
ETCO2: End Tidal Carbon Dioxide
ERCP: Endoscopic Retrograde Cholangiopancreatography
EUS: Endoscopic Ultrasonography
EGD: Esophagogastroduodenoscopy
FDA: Food and Drug Administration

viii GI: Gastrointestinal
GA: General Anesthesia
HR: Heart Rate
IRB: Institutional Review Board
IV: Intravenous
LMA: Laryngeal Mask Airway
MAP: Mean Arterial Pressure
MOAA/S: Modified Observer’s Assessment of Alertness/Sedation MAC: Monitored Anesthesia Care
NC: Nasal Cannula
N2O: Nitrous Oxide
NROS: Non-randomized, Observational Studies
OAA/S: Observer’s Assessment of Alertness/Sedation
p value: Level of significance
PS: Physical Status
PACU: Post Anesthesia Care Unit
r value: Correlation Coefficient
r2 value: Coefficient of determination
RSS: Ramsay Sedation Score
RR: Respiratory Rate
SpO2: Saturation of Peripheral Oxygen
SQI: Signal Quality Index
SBP: Systolic Blood Pressure

ix ABSTRACT
AN EVALUATION OF SEDATION LEVEL USING BISPECTRAL INDEX (BIS)
AND CORRELATED ADVERSE EVENTS IN PATIENTS UNDERGOING
COLONOSCOPIES
Paula M. Grey, RN, BSN and Jenna L. Poziombke, RN, BSN
Western Carolina University (March 2014)
Director: Dr. Mark A. Kossick
The purpose of this prospective, observational study was to provide data for
anesthesia providers on current sedation practices during elective colonoscopies. This
included determining the incidence of general anesthesia (GA) and the presence or
absence of correlated adverse events. Additionally, this research considered if patients
who are commonly consented for a MAC anesthetic should be more appropriately
consented for GA.
Participants (N = 39) consisted of a convenience sampling of physical status (PS)
I, II, and III patients scheduled for elective colonoscopies and undergoing sedation with
propofol. Data was collected by researchers over a four-week period at a non-teaching
rural hospital in Western North Carolina. A bispectral index (BIS) monitor was used to
monitor the depth of sedation and values were utilized to determine possible correlated
adverse events.
Statistical analysis showed that 100% (39/39) of patients reached levels of GA
(i.e., BIS ≤ 60) at some point during their procedure. Variables that showed a significant

x correlation with the occurrence of GA were smaller body mass index (BMI) (r = -.42, r2
= .17, p = .008), longer length of procedure (r = .85, r2 = .72, p < .001), and the number
of minutes patients experienced an absent end tidal carbon dioxide (ETCO2) (i.e., apnea)
waveform (r = .49, r2 = .24, p = .002). Additionally, greater BMI correlated with a
greater nadir BIS value obtained throughout the entire procedure (r = .54, r2 = .29, p <
.001), and was found to correlate with less time at BIS values ≤ 40 (r = -.51, r2 = .26, p <
.001). Longer procedures correlated with more minutes spent with BIS values ≤ 40 (r =
.43, r2 = .18, p = .007), and more minutes with absent ETCO2 waveform (r = .52, r2 =
.27, p = .001); however, these findings were clinically insignificant since only one absent
ETCO2 waveform actually resulted in a decrease in saturation of peripheral oxygen
(SpO2) to ≤ 90% (i.e., hypoxia), which quickly resolved with a chin lift. Additionally,
the number of minutes with SpO2 ≤ 90% was not significantly correlated with the
minutes of GA (r = -.17, r2 = .03, p = .299).
The results of this study indicate, in patients scheduled for colonoscopies who are
consented for IV GA, it is common for anesthesia providers to consistently deliver a level
of sedation concordant with GA. The significance of this finding relates to the pre-study
clinical observation, that endoscopic patients being consented for anesthesia designated
as MAC with IV sedation, actually demonstrate intraoperative signs of GA similar to
what were observed in this study. Future studies are warranted to determine the
frequency of the various forms of anesthesia consent obtained for elective colonoscopies,
along with research that assesses anesthetic depth with BIS monitoring in patients
consented for MAC with IV sedation. Such research would help to further enhance
patient safety and address potential medical legal concerns.

xi
Keywords: Bispectral Index (BIS), colonoscopy, monitored anesthesia care (MAC),
propofol sedation, adverse events.

12
CHAPTER ONE: BACKGROUND AND RATIONALE FOR STUDY
Introduction
Bispectral index (BIS) is frequently used as a monitor in the operating room to
measure the depth of anesthesia and to help guide the titration of medications during
general anesthesia (GA); however, it is not routinely used to monitor sedation levels and
titrate medications during monitored anesthesia care (MAC) with intravenous (IV)
sedation during endoscopic procedures. Although there have been some studies in non-
anesthesia journals that have looked at the use of BIS as an adjunctive monitor for
titrating a patient’s sedation level with sedatives and anxiolytics (Bell et al., 2004; Drake,
Chen, & Rex, 2006; Hata et al., 2009), there is limited research that has evaluated BIS
values in patients undergoing sedation given by anesthesia providers for colonoscopies.
The most extensively researched electroencephalogram (EEG) device currently
used to evaluate depth of anesthesia is BIS (Bruhn et al., 2003; Cortínez, Delfino,
Fuentes, & Muñoz, 2007; Doufas et al., 2003; Ge, Zhuang, Y. Wang, Z. Wang, & Li,
2002; Kearse et al., 1998); it has also been shown to be useful with measuring sedation
levels during endoscopic procedures (Bell et al., 2004; Hata et al., 2009; Leslie, Absalom,
Kenny, 2002). Several studies have shown that GA, or deeper levels of sedation than
intended, frequently occur during IV sedation (Drake et al., 2006; El Chafic, Eckert, &
Rex, 2012; Patel et al., 2005; Sieber, Gottshalk, Zakriya, Mears, & Lee, 2010). One
prospective, mixed-design study showed that 87% of elderly patients undergoing
propofol-based sedation combined with spinal anesthesia, experienced GA (i.e., a BIS
value ≤ 60) (Sieber et al., 2010). In another prospective study with an observational
design, it was shown that 76% of participants undergoing endoscopic sedation were

13 unresponsive to "deep stimuli" (El Chafic et al., 2012). It has also been demonstrated
that deeper levels of sedation during endoscopic procedures leads to an increase in
complications such as aspiration, apnea, hypoxia, airway obstruction, respiratory distress,
hypotension, and bradycardia (Arrowsmith, Gerstman, Fleischer, & Benjamin, 1991;
Froehlich et al., 1997; McCloy, 1992; Sharma et al., 2007; Sieber et al., 2010).
According to the American Society for Gastrointestinal Endoscopy (ASGE) (2007),
colonoscopy remains the most effective screening option for colorectal cancer with
approximately 14.2 million colonoscopies performed in the US in 2002 (Seeff et al.,
2004). Therefore, the research findings of this thesis could potentially impact a
significant number of patients and healthcare providers.
Purpose Statement
The purpose of this prospective, observational study was to evaluate the level of
sedation achieved during the delivery of anesthesia services in patients scheduled for
elective colonoscopies; this included determining the incidence of GA and correlated
adverse events. Additionally, the researchers attempted to assess if this patient
population should be consented for GA versus MAC with IV sedation; given the pre-
study clinical observation and literature finding of colonoscopy patients being
increasingly consented for MAC with IV sedation (Cohen & Benson, 2009; Cohen et al.,
2006; Inadomi, Gunnarsson, Rizzo, & Fang, 2010; Rex, 2011; Siddiqui, Shafiq, &
Asghar, 2012; Trummel, 2007). Consequently, the outcomes of this study could have
patient safety, medical-legal, and potential reimbursement implications.
Dependent variables for this study were recorded in the preoperative holding area,
procedure room, and post anesthesia care unit (PACU). They included BIS values,

14 saturation of peripheral oxygen (SpO2) via pulse oximetry, oxygen delivery devices
(e.g., nasal cannula [NC], non-rebreather mask), any required intraoperative changes in
liters of oxygen flow from baseline oxygen flow rates, if measured, the presence or
absence of end tidal carbon dioxide (ETCO2), the number of airway assistance maneuvers
(including but not limited to, chin lift, jaw thrust, combination of chin lift and jaw thrust,
nasopharyngeal airway insertion, oropharyngeal airway insertion, and laryngeal mask
airway [LMA] placement), heart rate (HR), systolic blood pressure (SBP), diastolic blood
pressure (DBP), mean arterial pressure (MAP), temperature, and respiratory rate (RR).
Justification of the Study
Only a paucity of data has been found in the anesthesia literature as it relates to
BIS monitoring for patients scheduled for colonoscopies. As noted earlier, the
significance of this research can potentially impact a substantial number of anesthesia
providers and patients, given that over 14 million colonoscopies were estimated to be
administered in the US in 2002 (Seeff et al., 2004). Additionally, the use of sedation for
endoscopic procedures continues to increase throughout the world (Cohen et al., 2006)
and there has been a significant growth in the number of endoscopic procedures being
performed by anesthesia providers (Liu, Waxman, Main, & Mattke, 2012).
Furthermore, it is recognized that some anesthesia departments choose to consent
patients for MAC with IV sedation instead of GA for elective colonoscopies. The latter
form of anesthesia carries with it an increased risk for complications (Bell et al., 2004;
Bhanaker et al., 2006; Petrini & Egan, 2004), especially in patients with significant
comorbidities (Behrens et al., 2013; Bell et al., 2004; Sharma et al., 2007). Thus, if
research reveals a GA state is being achieved with propofol dosages used by some

15 anesthesia providers during MAC with IV sedation, then a change in the consenting
process may very well be indicated; which could potentially enhance patient safety (alter
preoperative risk assessment), as well as have medical-legal implications (obtaining
informed consent).
Scientific Rationale
Non-randomized, observational studies (NROS) involve viewing unmodified
practice conditions and may represent a more realistic or accurate view of outcomes
under these real-world conditions (Biddle, 2013). NROS may be the only means for a
researcher to study a specific variable of interest or problem in their field of work as well
as the only way to validate findings in the literature (Whittemore & Grey, 2006).
Although there have been some studies that have used BIS monitoring to titrate or assess
a patient's sedation level during MAC anesthetics or conscious sedation (Bang et al.,
2013; Drake et al., 2006; Hata et al., 2009; Sieber et al., 2010; Verma, Paswan, Prakash,
S. Gupta, & P. Gupta, 2013), there has been no research that has quantified sedation
levels via the BIS monitor in patients undergoing MAC with IV sedation or GA during
elective colonoscopies.
Viewing actual practice conditions is important for collecting data that
randomized controlled trials may not interpret correctly in certain scenarios (Black,
1996). Observational research is a type of correlational study that has many advantages
such as: the ability to collect a vast amount of information in an area of interest, the
capacity to examine the existence and strength of relationships between variables, and the
potential to use results as a framework for future experimental studies (Whittemore &

16 Grey, 2006). Furthermore, observation of real-life practices can lead to the
identification of previously unrecognized issues and the development of new research
questions.
Assumptions
1. Anesthesia providers accurately documented the total doses of propofol given
on the anesthetic record.
2. Patient's medication list was accurately recorded to assess whether patients
were taking any medications that could have skewed BIS values.
3. Any preoperative sedation medications given were accurately charted by the
anesthesia provider and/or nurse.
4. A patient's history of a neurological disorder such as dementia or Alzheimer's
disease was accurately recorded on the surgeon's and/or endoscopist's history and
physical note or anesthesia provider's pre-anesthetic assessment form.
Research Questions
The research questions this study intended to answer were:
1. What is the frequency of producing a general anesthetic state, as defined by a
BIS value ≤ 60, during elective colonoscopies in physical status (PS) I, II, and III
patients?
2. Is there an association between GA (i.e., BIS value ≤ 60) and adverse
perioperative and/or postoperative events (e.g., apnea, desaturation) in PS I, II, and III
patients who undergo an elective colonoscopy procedure?

17 3. Does a relationship exist between the anesthesia providers' years or months
of experience and depth of sedation achieved (as determined with BIS values) relative to
the planned anesthetic?
4. Should patients who undergo an elective colonoscopy be more appropriately
consented for GA versus MAC with IV sedation?
Definition of Terms
• GA: a state of loss of consciousness in patients produced by IV sedative
medications or inhalational gases where patients are unresponsive to the painful
stimulus of surgery. Patients usually require assistance with producing a patent
airway by placement of an LMA or endotracheal tube and may also require the
use of vasoactive drugs to support the cardiovascular system.
• MAC: when an anesthesia provider is required to monitor the physiological status
of patients undergoing a diagnostic or minor procedure such as a colonoscopy or
lump excision.
• MAC with IV sedation: When anesthesia providers administer sedation
medications during MAC, including but not limited to, IV sedative and anxiolytic
drugs. Patients' sedation can range from minimal to deep at the discretion of the
anesthesia provider to keep the patient comfortable during the procedure.
• Sedation: a state of decreased consciousness that can range from minimal to deep
produced by titration of sedative or anxiolytic medications. Patients may need
assistance with breathing, maintaining a patent airway, and cardiovascular
function.

18
• Comorbidities: major disease processes or conditions that are in addition to the
patient's primary diagnosis.
• PS I: a healthy patient, also sometimes referred to as American Society of
Anesthesiologists (ASA) I.
• PS II: a patient with mild systemic disease and no functional limitations, also
sometimes referred to as ASA II.
• PS III: a patient with moderate to severe systemic disease resulting in some
functional limitations, also sometimes referred to as ASA III.
• PS IV: a patient with severe systemic disease that is a constant threat to life and
results in significant functional limitations, also sometimes referred to as ASA IV.
• PS V: a patient who is not expected to live 24 hours with or without having
surgery, also sometimes referred to as ASA V.
• Dependent variables: BIS values, SpO2, oxygen delivery device (e.g., NC, non-
rebreather mask), any required intraoperative changes in liters of oxygen flow
from baseline oxygen flow rates, ETCO2 presence or absence if measured, the
number of airway assistance maneuvers (including but not limited to, chin lift,
jaw thrust, combination of chin lift and jaw thrust, nasopharyngeal airway
insertion, and oropharyngeal airway insertion, LMA placement), HR, SBP, DBP,
MAP, temperature and RR in the preoperative holding area and PACU.
• Independent variables: the anesthesia provider, total propofol dose and total
dosages of any other medications given preoperatively and intraoperatively.
19
CHAPTER TWO: REVIEW OF THE LITERATURE
Endoscopy and Sedation According to the ASGE, colonoscopy remains the most effective screening option
for colorectal cancer, and the number of colonoscopies performed each year in the United
States has significantly increased. In 2000, 19.1% of all adults aged 50 to 75 years old
underwent a colonoscopy for screening; this increased to 54.9% in 2010 (National Center
for Health Statistics, 2013). Furthermore, the use of sedation during endoscopy continues
to increase throughout the world (Cohen et al., 2006). Sedation during endoscopy is
often administered in an office or outpatient setting by nurses under the supervision of an
endoscopist (Cohen et al., 2006). However, over the past several years there has been a
substantial growth in the number of endoscopic procedures that incorporate procedural
sedation performed by anesthesia providers, specifically from 14% in 2003, to more than
30% in 2009, and over 66% of these patients were not high risk (i.e., PS I or II) (Liu et
al., 2012). During this time period, Medicare payments for endoscopic procedures
doubled and payment from private insurance companies quadrupled, prompting debate
about which patients should and should not receive anesthesia services for endoscopic
procedures (Liu et al., 2012). Furthermore, by 2015, anesthesia providers are predicted to
provide sedation for over 50% of all colonoscopies (Inadomi et al., 2010). Currently, due
to the added costs of anesthesia services, it is agreed upon by major insurers (such as
Aetna) that anesthesia services for endoscopic procedures is acceptable for high risk
patients only (e.g., PS III or greater, age < 18 or ≥ 70, “prolonged” or “complex”
procedures, pregnancy, intolerance to sedative medications, uncooperativeness, agitation,
history of drug or alcohol abuse, epilepsy, anatomic abnormalities that may increase risk
20 for airway obstruction) (Aetna, 2007). The Centers for Medicare & Medicaid Services
(CMS) as well as UnitedHealthcare have also reaffirmed their insurance coverage for
propofol use in colonoscopies by anesthesia professionals or gastrointestinal endoscopists
(Centers for Medicare & Medicaid Services [CMS], 2011b; UnitedHealthcare, 2008).
With nurse-administered sedation, midazolam and fentanyl are often used. These
agents, when titrated appropriately, are typically considered safe for producing a “light”
level of sedation and patients are usually still able to respond to painful stimuli and
maintain airway reflexes. Sometimes, nurses administer propofol (Diprivan) for sedation
under the direction of a gastroenterologist. This is a controversial practice since patients
can unintentionally reach deep levels of sedation, including GA. The 2011(b)
recommendations from the ASA state that any healthcare provider administering propofol
for sedation should be trained in providing GA. In addition, the manufacturer of propofol
lists the following on the package insert: “for GA or MAC sedation, Diprivan Injectable
Emulsion should be administered only by persons trained in the administration of GA and
not involved in the conduct of the surgical/diagnostic procedure” (Hospira, 2009).
Nevertheless, one large (N = 646,080) retrospective study argued that MAC with IV
sedation is more expensive than endoscopist-directed propofol administration and that
MAC with IV sedation does not result in any increased safety for routine endoscopic
procedures in average-risk patients (Rex et al., 2009). A 2006 nationwide survey also
found that endoscopists were more satisfied with sedation from propofol rather than
sedation with a benzodiazepine combined with a narcotic. The reasons given for this
preference included: better sedation, superior analgesia, reduced recovery time, faster
return to usual activity, and improved quality of endoscopic examination (Cohen et al.,

21 2006). One large (N = 756), prospective, multicenter clinical trial suggested utilizing
anesthesia personnel for gastrointestinal (GI) endoscopic procedures because patients
were found to be significantly more satisfied (p < .0001) when anesthesia personnel were
employed (Iravani et al., 2012). Additionally, a Cochrane review of propofol sedation
during colonoscopies found that the use of propofol for sedation during colonoscopy
procedures in healthy patients (unspecified age range) can speed recovery, quicken
discharge times, and improve patient satisfaction without producing a greater frequency
of adverse events (Singh et al., 2008).
Understanding sedation levels can be an area of confusion since GA can be
regarded as a stage of sedation or as a level of anesthesia on a continuum (American
Society of Anesthesiologists [ASA], Task Force on Sedation and Analgesia by Non-
Anesthesiologists, 2002). For this observational study, GA will be considered a stage of
sedation unless otherwise stated. Sedation will be defined as a drug induced depression
in the level of consciousness consisting of four stages: minimal sedation (anxiolysis),
moderate sedation, deep sedation, and GA (ASA, Task Force on Sedation and Analgesia
by Non-Anesthesiologists, 2002). All patients receiving “anesthesia” (stage not
specified) should have oxygenation, ventilation, and circulation monitored, and body
temperature should be assessed if clinically significant changes are anticipated (ASA,
2011a). The ASA, in a position statement updated in 2009, further clarified these terms.
This document defined and categorized levels of sedation as minimal, moderate, deep,
and GA.
• Minimal sedation: drug induced anxiolysis with no alteration in response to verbal
stimuli and no alteration in cardiovascular, respiratory, or ventilatory function

22
• Moderate sedation: is synonymous with conscious sedation and represents a
drug-induced depression of consciousness during which patients respond
purposefully to verbal command (with or without light tactile stimulation) and are
able to maintain a patent airway without intervention, sustain adequate
spontaneous ventilation, and usually maintain their cardiovascular function
• Deep sedation: a drug-induced depression of consciousness during which patients
cannot be easily aroused but can respond purposefully to repeated or painful
stimulation; independent ventilatory function may be impaired, airway assistance
may be required to maintain airway patency, and spontaneous ventilation may be
inadequate; cardiovascular function is usually maintained
• GA: a drug-induced loss of consciousness during which patients are not arousable
even by painful stimulation, the ability to maintain independent ventilation is
usually impaired, assistance is often needed to maintain a patent airway, positive
pressure ventilation may be needed, and cardiovascular function may be
compromised
The ASA in 2013 defined MAC as including varying levels of sedation (i.e.,
minimal, moderate, or deep), but also indicated if a patient becomes unconscious and the
ability to respond purposefully is lost, GA has consequently occurred regardless of the
need for airway instrumentation. For clarification, there remains in the literature
inconsistency with the use of the acronym MAC. Some authors reference this
abbreviation to be synonymous with MAC with IV sedation; while others view MAC as
representing the monitoring of diverse physiologic parameters without the concurrent use
of IV sedatives.

23 Propofol has a rapid onset and fast recovery time, making it the most
commonly used agent for producing minimal and moderate sedation during endoscopy
procedures (American Society for Gastrointestinal Endoscopy [ASGE], Standards of
Practice Committee, 2008; Cohen et al., 2007; Zakko, Seifert, & Gross, 1999). Propofol
based sedation in GI endoscopy procedures increased to 26% of the total U.S. volume by
2006 (Cohen et al., 2006) and a recent study projected that propofol will be used in 53%
of endoscopy cases by 2015 (Inadomi et al., 2010). Decreased myocardial contractility
and respiratory depression are sometimes seen with the use of propofol; however, these
effects can usually be reversed by stopping the infusion or by decreasing the dose (Cohen
et al., 2007).
The ASGE Standards of Practice Committee (2008) provides updated guidelines
for sedation during GI endoscopy. They state that sedation for these procedures is patient
specific, ranging from no sedation at all to GA. Moderate sedation, as defined by the
ASA, is usually considered adequate for routine, uncomplicated GI endoscopy
procedures. The guidelines further indicate that if propofol is being used for sedation
during these procedures, then physiologic monitoring should be incorporated and include
the use of pulse oximetry, electrocardiogram (ECG), and intermittent blood pressure (BP)
measurements. Capnography should also be considered because it may decrease the risks
associated with deep sedation (Nelson et al., 2000). Propofol can be titrated to moderate
sedation when combined with low doses of opioids and benzodiazepines, but since deep
levels of sedation can quickly occur when propofol is used with or without these sedative
agents, providers should always be prepared for deep sedation (Cohen, Hightower,
Wood, Miller, & Aisenberg, 2004; Rex, 2011; VanNatta & Rex, 2006). This further

24 confirms the occurrence of deep sedation when propofol is used for sedation. Overall,
the ASGE Standards of Practice Committee recommends always focusing on maximizing
patient comfort while minimizing risk during GI endoscopy procedures.
Additional sedation recommendations were provided by the American
Gastroenterological Association Institute after completing a review of endoscopic
sedation in 2007 (Cohen et al., 2007). This article was designed to standardize the
practice of endoscopic sedation. Similar to the previous article from the ASGE Standards
of Practice Committee, it was suggested that the overall goal of endoscopic sedation is to
keep the patient comfortable without producing side effects from drug administration.
They emphasized that endoscopy monitoring should not only include physiologic
assessment (e.g., BP, HR, SpO2) but visual assessment (e.g., grimacing, movement) as
well because the latter can often identify potential complications sooner than physiologic
monitoring.
Comparable Research
Only a few researchers have evaluated the use of BIS monitoring during MAC
anesthetics with IV sedation or conscious sedation (Drake et al., 2006; Hata et al., 2009;
Sieber et al., 2010). These studies are diverse in their findings and difficult to compare
since there is large variability in their designs. Additional research using the BIS monitor
during MAC with IV sedation during endoscopic procedures could lead to a clearer
understanding of the sedation levels (and perhaps unintended GA) actually achieved.
In an attempt to evaluate the usefulness of BIS monitoring in patients undergoing
endoscopic submucosal dissection for removal of neoplasms from the digestive tract, one
randomized controlled trial was conducted over a three-year period (Hata et al., 2009). A

25 total of 366 patients were included in the study. Propofol was titrated to a pre-
determined BIS value; 56 to 65 in one group of patients, and 70 to 75 in another group of
patients. All patients received 2 L/min of oxygen via NC, and pentazocine (Talwin) 15
mg via continuous IV infusion (unspecified duration) immediately preceding initiation of
sedation. A propofol bolus of 40 mg was then administered to all patients, followed by a
continuous infusion at 50 mcg/kg/min, and was titrated by an anesthetist or an
“endoscopy specialist trained in anesthesia” to maintain desired BIS values. Pulse
oximetry, BP and three lead ECG were monitored at unspecified intervals. Data analysis
showed that 3.6% of subjects (13/366) in the 56 to 65 BIS range experienced adverse
events: six had bradycardia (HR <50 bpm), four had hypotension (SBP < 90 mmHg), two
had respiratory depression (patient needing mandatory ventilation), and one experienced
delayed awakening (patient did not awaken within 15 minutes after propofol
discontinuation). There were no adverse events when propofol was titrated to BIS values
between 70 and 75. This study concluded that BIS is useful for the safe performance of
endoscopic submucosal dissection when propofol is titrated to a BIS value between 70
and 75.
The methodology of this study had significant limitations. The first of these being
there were no baseline BIS values recorded. This limitation made it difficult to determine
the actual percent change in BIS values between the non-sedated and sedated states, and
how that may have correlated with adverse events. There was also no mention of other
airway interventions, such as jaw thrust or chin lift, so it is unclear how many participants
in the study experienced obstruction of their airway. Furthermore, there was no
predetermined sample size for each group. Instead, when adverse effects started to occur

26 in the first group of patients (BIS values maintained at 56 to 65), data collection for
that group stopped, and the target BIS value was increased. Data collection was then
initiated for the second group (BIS values maintained at 70 to 75). Consequently,
maintaining BIS values between 56 and 65 could have led to a higher number of recorded
adverse events if data were collected on a pre-determined number of patients. Other
limitations included the lack of statistical consideration for PS classification, the omission
of p values, and failure to report the length of the procedure or exclusion criteria. In
general, the study suggested a greater number of adverse events may occur in patients
undergoing endoscopic submucosal dissection procedures when BIS values are
maintained between 56 and 65.
Research has shown that BIS values ≤ 60 are consistent with a state of GA (Bell
et al., 2004; Cortínez et al., 2007; Drake et al., 2006; Hata et al., 2009). The BIS pocket
guide and other publications have also indicated that BIS values between 40 and 60
correlate with GA (Johansen, 2006; Kelley, 2010). One prospective, mixed design study
examined elderly (> 65 years old) patients undergoing spinal anesthesia with sedation
using propofol during repair of hip fractures (Sieber et al., 2010). The focus of this
research was to determine if sedation in this patient population was equivalent to GA via
BIS monitoring (values ≤ 60). Forty elderly patients undergoing repair for hip fractures
were enrolled in the study. Additional criteria for participant selection were not provided
by the researchers, and specific comorbidities were not discussed. The 40 subjects were
divided into a control group (n = 15) that had no alteration in standardized practice or the
way drugs were administered, and an intervention group (n = 25) that had propofol
titrated based on an alertness and sedation scale, known as the observer’s assessment of

27 alertness/sedation (OAA/S) (see Appendix A). The OAA/S is an assessment tool used
to subjectively gauge the level of sedation on a five point scale; the lowest score on the
scale is 0 and indicates no response to noxious stimuli, and the highest score is 5 and
indicates the patient responds to their name spoken in a normal tone. The goal with the
intervention group was for the anesthesiologist to maintain a minimum level of sedation
by keeping the participant at a sedation level of 4 (i.e., lethargic response to name spoken
in a normal tone) or 5 on the OAA/S scale. Scores were measured every 5 minutes, and
if the OAA/S score was < 4, the propofol infusion was reduced. Both groups had BIS
monitoring throughout the surgical procedure, which was compared between groups to
determine how much time was spent in a state of GA, defined as a BIS value ≤ 60.
Results showed that the control group, which had no alteration in propofol administration
in response to an OAA/S score, had 86.7% (13/15) of its participants experience sedation
levels consistent with GA (BIS values ≤ 60). The control group also spent a mean
surgical time of 32.2% at BIS values consistent with GA. In the intervention group, the
OAA/S scale was used to maintain minimal sedation. Propofol was the primary sedative
and was administered along with fentanyl as needed. With this group, 44% (11/25) of
participants experienced GA for at least 1 minute, and spent a mean surgical time of 5%
with BIS values consistent with GA (p < .001). The number of anesthesiologists
participating in the study was not disclosed; however there was not a significant
difference (p = .797) in the dosing of fentanyl in the control group (1.3 mcg/kg ± 1.0
mcg/kg) and in the intervention group (1.5 mcg/kg ± 2.6 mcg/kg). There was also no
significance in the distribution of the various PS classifications between groups (p =
.486), level of spinal anesthesia (p = .693), or length of surgery (p = .067). A significant

28 difference was found for the following variables in the intervention group: lower
propofol dose (p = .014), older patients (p = .049) (83 ± 7 in the intervention group vs. 78
± 8 in the control group), and lower midazolam dose (p = .002). Statistical analysis also
showed a significant difference (p < .001) in the amount of surgical time spent at sedation
levels consistent with GA (BIS ≤ 60) in the control group versus the intervention group.
It was concluded that GA occurs frequently in elderly patients undergoing spinal
anesthesia combined with propofol sedation, and titrating propofol to a previously
determined BIS value range decreases this occurrence.
Unfortunately, the investigators did not report their exclusion criteria, or the
technique used for administering propofol (e.g., infusion, bolus, combination of infusion
and bolus), which decreased the external validity of this study. Furthermore, internal
validity was weakened because there may have been failure to exclude patients with
potential alterations in baseline BIS values (e.g., cerebrovascular accident [CVA],
dementia). In spite of these limitations, this research seems to offer some evidence that
GA commonly occurs in elderly patients undergoing spinal anesthesia with propofol
sedation for repair of hip fractures. Furthermore, this study provides an impetus for
additional research into the occurrence of unintended GA in other patients scheduled for
surgery or diagnostic procedures.
Of interest during the literature review was the discovering of only one study that
suggested there is no benefit to using BIS monitoring with propofol sedation for
colonoscopies (Drake et al., 2006). This was a randomized control trial that evaluated the
usefulness of BIS monitoring as an adjunct to nurse-administered propofol sedation
during colonoscopy procedures. Effectiveness was determined by measurements of

29 reduction in recovery time and total doses of propofol administered to patients. All
study participants (N = 102) underwent an elective colonoscopy and were over 18 years
old with a PS classification of I or II. The two nurses and one endoscopist participating
in this study were said to have had “several years” of endoscopy experience. Participants
were randomly divided into one of two phases (see Table 1), each consisting of an
intervention group and a control group. In phase 1 (n = 47) and phase 2 (n = 55), the
endoscopist teams (i.e., one of the two nurses administering the propofol and the
endoscopist) were randomly assigned to either the control group (n = 24, phase 1; n = 26,
phase 2) or the intervention group (n = 23, phase 1; n =29, phase 2). For the control
group in both phases, the endoscopist teams were blinded to BIS values, and were
instructed to titrate sedation as they normally would within their routine practice. This
included considerations for physiologic changes (i.e., HR, BP, ventilatory effort) and
subjective assessment of patient discomfort, undesired movement, and the modified
observer's assessment of alertness and sedation (MOAA/S) scale (see Appendix B). In
the intervention group of phase 1 the endoscopy team was not blinded to BIS values.
They were instructed to only use BIS values as an “adjunctive tool” and to avoid titration
of propofol in response to BIS values. At the end of phase 1, the researchers conducted
analysis before proceeding into phase 2. They found no difference in propofol dose (p =
.45) or recovery times (p = .34) with the blinded (control) versus non-blinded
(intervention) groups. Just as in phase 1, the endoscopy team was blinded to BIS values
in the control group for phase 2 and were instructed to titrate sedation as they normally
would within their routine practice. In the intervention group of phase 2, BIS was used as
the primary endpoint for sedation with a target value of 60 to 70 (i.e., deep sedation).

30 The endoscopy team was instructed to refrain from giving propofol boluses when BIS
values were < 60, except when the patient was believed to be experiencing significant
discomfort or moving enough to interfere with the procedure. For all patients, in both
phase 1 and phase 2, propofol was the only sedative agent administered and all patients
received an initial 40 mg bolus, followed by incremental boluses of 10 to 20 mg. BIS
values, HR, SpO2, and 3-lead ECG were recorded continuously on all patients, but it was
not stated how often these variables were documented. Additionally, a baseline BP was
obtained, followed by BP recordings every 5 minutes, and the total dose of propofol was
documented. Vital sign recordings were continued in the PACU for up to 1 hour or until
discharge, whichever came first.
Table 1 Study Design Characteristics Group Phase 1
n BIS value
Phase 2
n BIS value
Controla 24 Blinded 26 Blinded Intervention 23 Used as 29 Targeted to "adjunctive tool" 60-70 with and not used for propofol propofol titration
__________________________________________________________________________________________________ Note. N = 102. BIS = bispectral index aSedation titrated according to routine practice Statistical analysis for both phase 1 and phase 2 showed no significant difference
between intervention and control groups in average BIS values (p = .82, phase I; p = .57,
phase II), sedation levels (p values not provided) using the MOAA/S scale (see Appendix
B), propofol dose (p = .45, phase I; p = .92, phase II), recovery time (p = .34, phase I; p =
.27, phase II), or complications. There were no significant differences found between
phase 1 and phase 2 in regards to patient satisfaction or recall, however, there were no p

31 values provided to validate the accuracy of this finding. Oxygen desaturation, defined
as an SpO2 < 90%, occurred in 2.9% (3/102) of patients and resolved with a chin lift
maneuver, deep breathing, or cessation of propofol administration. The phase or phases
in which these adverse events occurred was not specified by the investigators. Patients
were found to “regularly” experience BIS values consistent with GA during “some part”
of the procedure, but the investigators did not offer any defining characteristics or exact
frequency of this occurrence. Furthermore, the researchers postulated the possibility that
there was no apparent benefit from monitoring with BIS because the endoscopy nurses
were already very experienced with propofol administration when the study began. This
acknowledgement suggests the endoscopist team assigned to the Phase 2 intervention
group may have allowed their propofol titration bias to disregard the prescribed 60 to 70
BIS target value. Lastly, the investigators acknowledged that the sample size was not
sufficient to rule out a safety benefit of BIS.
Deep Sedation Occurs with Endoscopy
In clinical practice, it is possible that deep sedation occurs during endoscopy
procedures. Some studies have specifically identified this occurrence and the potential
associated adverse events (El Chafic et al., 2012; Patel et al., 2005; Soto, Fu, Smith, &
Miguel, 2005). In 2012, one such study examined the intra-procedural incidence of
coughing, hemodynamic changes, and oxygen desaturation and their correlation with
clinical factors and sedation (El Chafic et al., 2012). Although BIS was not used to
provide objective data, there was subjective validation of deep sedation occurring during
endoscopy procedures. This prospective observational study involved a total of 747
consecutive patients undergoing nonemergent endoscopy procedures (El Chafic et al.,

32 2012). These procedures consisted of esophagogastroduodenoscopy (EGD) (n = 254),
colonoscopy (n = 338), combination of colonoscopy and EGD (n = 80), endoscopic
ultrasonography (EUS) (n = 65), and others, which were comprised of mostly push
enteroscopy and deep small bowel enteroscopy (n = 20). Patients were sedated with
propofol, and/or midazolam, and/or fentanyl by a registered nurse under the supervision
of an endoscopist. Specific dosages and method of delivery (e.g., infusion, bolus) of
sedative medications and opioids were not provided, but 63% (476/747) received a
combination of propofol, midazolam and fentanyl; 26% (197/747) received a
combination of fentanyl and midazolam; 9% (66/747) received propofol only; 1%
(10/747) received propofol and midazolam; and 1% (5/747) received propofol and
fentanyl. Data recording included: BP every 5 minutes, HR and sedation levels every 2
minutes, and SpO2 every minute. All patients received oxygen via NC at 4 L/min.
Sedation level was determined by using a subjective tool known as the MOAA/S scale
(see Appendix B). The MOAA/S scale ranges from 0 to 6, with values ≤ 1 being
considered deep sedation, however the scale provides no assessment of GA. Seventy
eight percent (593/757) of patients were reported by the researchers to have experienced
deep sedation (i.e., MOAA/S ≤ 1) or GA (undefined) during their procedure. Twenty
four percent (181/757) of patients were smokers with or without COPD, 8% (59/757) had
asthma, 5% were smokers and had asthma (37/757), and 63% (480/757) did not have
respiratory disease.
Oxygen saturation dropped from baseline (values not provided) more than 4% in
95% of patients, with 4% dropping below 90% saturation and 2% dropping below 85%
saturation. No data was provided indicating the existence of a correlation between

33 decreases in SpO2 and medication administration times. However, “deeper” sedation
was found to be the only significant risk factor for a decline in SpO2 to below 90% (p =
.02). Mean SBP dropped an average of 7.3%, and DBP declined an average of 5.6%,
with all changes resolving spontaneously, but within an unspecified amount of time.
Regardless of dose and type of agents used, there was an 8.53% greater decrease in SBP
with colonoscopy procedures than all other procedures combined (p < .0001). Thirteen
percent of patients experienced cough at least once. Cough occurring one or more times
was greater in patients receiving propofol with or without other agents (p = .0008), and in
non-smokers (p = .05).
The investigators speculated that coughing was associated with upper endoscopy
procedures, the use of propofol, longer procedures (unspecified length) (p = .0001), and
with the development of hiccups (p = .01). The clinical implication of this being that
coughing can lead to microaspiration of gastric contents. Therefore, it is important for
healthcare providers to exercise constant vigilance for signs of aspiration, especially in
patients experiencing hiccups, during repositioning (p = .06), and in those undergoing
“longer” procedures, “deeper” sedation (no p value provided), or both. Furthermore, this
study supported a possible association between the dependent variables of oxygen
desaturation (p = .02) and hypotension (p = .05) in patients who received a deep level of
sedation (i.e., MOAA/S ≤ 1) during endoscopic procedures, as opposed to lighter levels
of sedation.
Some limitations to this study do exist. First, the researchers indicate that some
patients experienced a level of sedation consistent with GA; however, there were no
criteria for GA provided. Additionally, sedation was provided by nurses working in

34 conjunction with endoscopists, so the results may not be consistent with those that may
be obtained from the administration of sedation by certified registered nurse anesthetists
(CRNA) or anesthesiologists. Also, a subjective tool (MOAA/S) was used for measuring
sedation, allowing the potential for some variability in interpretation, and it did not
include criteria for determining the occurrence of GA. Lastly, PS classification was not
included in the presented data. In conclusion, this study identified the occurrence of deep
sedation during endoscopic procedures along with some potential risks associated with
deep sedation during endoscopic procedures.
Another prospective, observational study sought to determine if deep sedation
occurred frequently during elective endoscopy procedures with meperidine and
midazolam (Patel et al., 2005). A sample size of 80 patients was administered IV
midazolam (EGD 3.9 mg ± 1.48 mg, colonoscopy 4.38 mg ± 2.13 mg, endoscopic
retrograde cholangiopancreatography [ERCP] 5.5 mg ± 2.72 mg, EUS 5 mg ± 1.56 mg)
and meperidine (EGD 77.25 mg ± 22.27 mg, colonoscopy 89.38 mg ± 31.22 mg, ERCP
103.75 mg ± 31.70 mg, EUS 101.25 mg ± 23.61 mg) for sedation. All participants were
over 18 years old, and either PS I or II presenting for EGD (n = 20), colonoscopy (n =
20), ERCP (n = 20), or EUS (n = 20). Similar to the previously discussed study (El
Chafic et al., 2012), the MOAA/S scale was used for measurement of sedation levels.
However, the investigators modified the scale by assigning deep sedation a value of 1 or
2 instead of ≤ 1 and eliminating the value of 0. Initial doses of sedation medications
(meperidine 50 to 75 mg and midazolam 2 to 3 mg) were at the discretion of the
endoscopist and administered by a nurse. Supplementary doses were given in increments
of 25 to 50 mg of meperidine or 1 to 2 mg of midazolam based on assessments (i.e., signs
35 of discomfort, restlessness, or agitation that were not related to hypoxemia) by the
endoscopist and nurse. A single independent physician observed all procedures,
documented procedural data, and completed MOAA/S assessments. Recordings of BP,
HR, SpO2, and MOAA/S score were started with the initial dose of sedation medication
and repeated every 3 minutes. Additionally, the time and dose of boluses of sedation
medication, oxygen desaturation (i.e., < 90%), hypotension (i.e., < 90/50mmHg), the
need for emergent airway protection or reversal agents, and the lowest intraprocedural
MOAA/S score were recorded. Oxygen was administered via NC only when SpO2
decreased to < 90%, and IV normal saline was given (unspecified dose) for hypotension.
The endoscopist and registered nurse were blinded to the independent physician’s
MOAA/S assessments.
Results indicated that 68% (54/80) of patients experienced deep sedation, with
45% (9/20) occurring in colonoscopies, 60% (12/20) in EGDs, 85% (17/20) in ERCPs,
and 80% (16/20) in EUSs. This is consistent with the results described in the previous
study in that 78% (593/757) of patients experienced deep sedation (i.e., MOAA/S ≤ 1) or
GA (El Chafic et al., 2012). In the current study, it was also found that transient oxygen
desaturation (SpO2 < 90%) occurred in 58% (46/80) of patients; however, the existence
of a correlation with medication doses or times was not indicated, and none resulted in
severe adverse events, such as those requiring reversal agents, bag-mask ventilation, or
intubation. The procedure type was the only predictor of reaching deep sedation, with
increased occurrence during more advanced endoscopic procedures (i.e., ERCP and
EUS). In conclusion, the investigators found that deep sedation occurs frequently during
elective endoscopy when meperidine and midazolam are used in an attempt to produce
36 moderate sedation. Nevertheless, it appears endoscopic procedures may be safely
performed with analgesia and sedation that reaches a level of deep sedation, as long as
there is “appropriate monitoring." Additionally, the authors hypothesized that deep
sedation and oxygen desaturation might occur more frequently in patients with a higher
PS status and suggested that future studies include these patients.
There were numerous limitations with this study. Similar to the previous study
(El Chafic et.al, 2012), the investigators chose to use a subjective tool for measuring
sedation levels; therefore objective data could not be presented. This assessment tool did
not have a value for GA, so it is possible that some patients actually experienced GA but
it could not be measured. Another concern was that the researchers stated the
endoscopist and assistant were blinded to sedation assessments; however, this is not
possible since they would need to verbally stimulate or physically shake the patients to
accurately assess their MOAA/S score. This ultimately could have led to inadequate
blinding. In addition, sedation levels and hemodynamic values were only assessed every
3 minutes; this restricts the ability to determine how long deep sedation occurred, a
limitation the researchers acknowledged. Lastly, midazolam and meperidine were chosen
for sedation. These are not medications commonly used by anesthesia providers in this
clinical setting, thus severely impacting the external validity of this research from an
anesthesia prospective. Nonetheless, this study validates that deep sedation likely occurs
with the administration of midazolam and meperidine during endoscopic procedures.
Endoscopy, Deep Sedation, and Complications
Sedation for GI endoscopy has been shown to produce serious complications (57
out of 388,404 patients), and most are associated with a PS classification of III or greater
37 and emergency procedures (Behrens et al., 2013). Hypoxia and hypotension are
particularly common occurrences at deep levels of sedation. In an assessment of
complications in patients undergoing GI interventional procedures (N = 100), one study
found that BIS values < 50 were associated with hypoxia, hypotension, or agitation (p
values not provided) (Bell et al., 2004). However, patients with BIS values > 78 did not
experience hypotension, which shows that deeper levels of sedation can correlate with
increased adverse events. This research is discussed more thoroughly later on.
In one retrospective study, an “unplanned cardiopulmonary event” was found to
occur in 3.5 of 1,000 patients undergoing diagnostic colonoscopy (Silvas, Nebel, Rogers,
Sugawa, & Mandelstam, 1976). Similarly, another retrospective study established that
when using midazolam and diazepam for conscious sedation during GI endoscopic
procedures (N = 21,011), serious cardiorespiratory events accounted for 51.3% of
complications in 8,919 colonoscopies, and 5.4 out of 1,000 complications overall
(Arrowsmith et al., 1991). In both of these studies, serious cardiorespiratory events were
not specifically defined, the actual depth of sedation was not evaluated, and the specialty
of the providers administering sedation was not indicated.
Additionally, a large national study evaluated the incidence of unplanned
cardiopulmonary events after GI endoscopy (Sharma et al., 2007). This was a
retrospective review of 324,737 endoscopic procedures: 174,255 colonoscopies, 140,692
EGDs, 6,092 ERCPs, and 3,698 EUSs. All patients underwent GI endoscopy with
conscious sedation, but the specialties of the administering persons were not reported.
There were no exclusions based on demographic data or PS score, however, all patients
that received sedation with propofol were excluded. The goal of this study was to

38 determine risk factors that may predict the occurrence of unplanned cardiopulmonary
events after GI endoscopy. Data was obtained on GI endoscopies from April 1997 to
March 2002 and was voluntarily entered in to a database by endoscopists. Results
indicate that “unplanned events” were reported in 4,477 (1.4%) of procedures performed
with conscious sedation, and 3,011 (0.9%) were unplanned cardiopulmonary events (e.g.,
hypoxia, respiratory distress, chest pain, pulmonary edema, arrhythmias, hypotension,
hypertension). There were a total of 39 (0.01%) deaths, 28 (0.008%) of which were
related to cardiopulmonary causes. Patient age was a significant independent predictor of
cardiopulmonary unplanned events (p < .001), as well as PS classification, with increased
incidence associated with higher PS classification: PS I = 0.7%, PS II = 1%, PS III =
1.8%, PS IV = 3.7%, and PS V = 7.6%. Additionally, inpatient setting (p < .001), non-
university practice sites (p = .005), the need for reversal medications (p < .001), the use
of supplemental oxygen (p < .001), and involvement of a trainee (p < .001) were
significant independent predictors of unplanned cardiopulmonary events as well. It was
determined that gender (p = .5) and race (p = .16) were not significantly correlated with
unplanned cardiopulmonary events.
As previously mentioned, endoscopies performed under propofol sedation were
excluded. This is a significant limitation to the external validity of the research since
propofol is commonly used by anesthesia providers for sedation during GI endoscopy
procedures. Additionally, all procedures were documented to have been performed under
conscious sedation. There was no data provided for establishing the actual sedation level
of the patients. Furthermore, the retrospective design of this study limits the internal
validity. Lastly, there was no information included about intra-procedure complications.

39 Nevertheless, this study provides data suggesting that complications after endoscopy
can be related to cardiorespiratory events.
One common cardiopulmonary complication that can occur during MAC with IV
sedation is apnea. In one randomized controlled trial (N = 39), the incidence was shown
to be 26% (Soto, Fu, Vila, & Miguel, 2004), and was more common when deeper levels
of sedation were obtained (Soto et al., 2005). In a second prospective observational
study, the investigators used BIS and capnography monitoring to determine if BIS values
correlated with apnea in 99 patients receiving MAC with IV sedation. Sedative drugs
included propofol (n = 84) combined with midazolam (n = 82) and fentanyl (n = 35)
which were given during orthopedic, vascular, gastroenterology, or “pain” procedures
(Soto et al., 2005). Patients received an unspecified combination and dosage of these
drugs at the discretion of the anesthesia provider – either an anesthesia resident (year of
residency and total number of providers not reported) or nurse anesthetist under the
supervision of an anesthesiologist. The anesthesia provider was blinded to both BIS and
capnography values, and all patients were administered supplemental oxygen of at least 2
L/min. Data was collected at “baseline” and every 3 minutes (duration not reported). The
investigators notified the anesthesia provider when unnoticed apnea or airway obstruction
occurred for 60 seconds, as detected by capnography.
Statistical analysis of the data showed 49.5% (49/99) of patients experienced at
least one episode of continuous apnea (i.e., apnea for 60 seconds), none of which were
identified by the anesthesia provider. Twenty patients experienced oxygen desaturation
below 90% at least once, with the lowest SpO2 being 88%, and 17 of these 20 patients
also experienced apnea. Patients with apnea had a mean BIS value of 71 ± 14, and those

40 without apnea had a mean BIS value of 83 ± 12, thus the incidence of apnea was
shown to be greater in patients with lower average BIS values than those with higher
average BIS values. Additionally, the mean BIS value in the 3 minutes immediately
preceding apnea was 55 ± 18, which is largely consistent with GA. Regression analysis
showed the likelihood of apnea occurring was 50% when BIS values were approximately
57, and specific medication combinations did not predict the occurrence of apnea. There
were no significant differences in age (51 ± 13), sex, or comorbidities among all
participants. Overall, these results demonstrate that lower BIS values correlate with
increased risk for apnea during MAC with IV sedation.
Aspiration can also be a complication of sedation. From January 2000 to
November 2009, a population based analysis of all procedural claims for outpatient
diagnostic colonoscopies in patients who were Medicare beneficiaries, showed an
increased incidence of aspiration when anesthesia providers were used for the
administration of sedation (Cooper, Kou, & Rex, 2013). Since this was a retrospective
review and Medicare billing codes were used to establish anesthesia involvement,
demographic data (e.g., type of anesthesia provider and years of experience) was not
reported. A total of 165,527 diagnostic colonoscopies in 100,359 patients were analyzed,
of which 35,128 (21.2%) were anesthesia-assisted and 130,299 (78.7%) were non-
anesthesia-assisted. A 30-day period of Medicare claims after each diagnostic
colonoscopy was reviewed for the occurrence of aspiration pneumonia, colonic
perforation, splenic injury/rupture, or splenectomy. The overall 30-day mortality was
similar for colonoscopies assisted by anesthesia (0.32%) versus non-anesthesia (0.28%)
providers (p = .29). Aspiration, however, occurred in 173 patients and with more

41 frequency in the anesthesia-assisted group (p = .02). Splenic perforation occurred in
101 patients and splenic rupture occurred in 12 patients, but statistically the occurrences
of these complications (i.e., splenic perforation or rupture) were similar between
anesthesia-assisted colonoscopies and non-anesthesia-assisted colonoscopies.
The increased risk of aspiration pneumonia with anesthesia-assisted
colonoscopies was thought to be related to the deeper levels of sedation that often occur
with the use of propofol, which would cause decreased ability of the patient to protect
their airway. However, the authors admit this was a non-randomized study and the
rationale for some patients receiving anesthesia assistance and not others was unknown,
thus the patients receiving anesthesia-assisted colonoscopies could have had an increased
number of comorbidities that would also increase their risk for aspiration pneumonia.
Additionally, anesthesia records were not evaluated, so it was assumed that anesthesia
providers only used propofol for sedation in the majority of colonoscopy procedures.
BIS as a Tool for Measuring Sedation
The most recent update on the history and current uses of BIS monitoring was
published in 2006 (Johansen, 2006). The BIS monitor is essentially a modified EEG that
can reflect the decreased cerebral metabolic rate caused by anesthetic agents (Kelley,
2010). It was first introduced in 1996 to help monitor cortical function during hypnotic
states and in 2003 it was approved by the Food and Drug Administration (FDA) for
reducing the incidence of intraoperative awareness (Johansen, 2006; Kelley, 2010). BIS
values are measured on a scale of 0 to 100. A value of 0 indicates complete cortical
suppression (i.e., an isoelectric EEG signal) and a value of 100 indicates the patient is
awake (Johansen, 2006; Kelley, 2010). In actuality, values of 93 or above indicate a state

42 of wakefulness (Johansen, 2006). Sedation is said to occur with BIS values between
65 and 85, and GA occurs between values of 45 and 60 (Johansen, 2006).
BIS does have some limitations. Elevated electromyographic (EMG) activity
(i.e., high frequency, low amplitude waves), which occurs from increased muscle tone in
the forehead or improper electrode placement, may falsely increase BIS values
(Johansen, 2006). The signal quality index (SQI) signifies the reliability of the recorded
BIS value, and should be considered, along with hemodynamics (e.g., BP, HR, RR) and
visual assessment of the patient, when evaluating depth of sedation (Johansen, 2006;
Kelley, 2010). In regards to SQI, a number closer to 100 is more reliable than a number
closer to 0 (e.g., an SQI value of 97 means that the BIS value is more trustworthy than it
would be if the SQI value is 34). Furthermore, BIS values may not be accurate when
monitored during administration of ketamine (Hans, Dewandre, Brichant, & Bonhomme,
2005; Roffey, Mikhail, & Thangathurai, 2000) or nitrous oxide (N2O) (Coste, Guignard,
Menigaux & Chauvin, 2000; Ghoneim, 2001). Additionally, baseline and/or continuous
values may be altered in patients with dementia (Renna, Handy, & Shah, 2003) and those
with neurological dysfunction such as brain injury or postictal states (Covidien, 2011).
Some studies have validated BIS as being “comparable” to other methods of
assessing sedation level, such as the cerebral state index (CSI) (Cortínez et al., 2007) and
Ramsay Sedation Score (RSS) (see Appendix C) (Bell et al., 2004). An overview of
these studies shows BIS is an accurate tool for monitoring level of sedation.
CSI is similar to BIS in that it produces a numerical value that corresponds to
hypnotic states during anesthesia by integrating EEG signals; also like BIS, awake
patients have values closer to 100 that progressively decrease as sedation becomes deeper

43 (Anderson & Jakobsson, 2006; Cortínez et al., 2007; Jensen et al., 2006). The
mechanisms for producing these values differ; CSI integrates information from EEG
signals via ratios (i.e., time to frequency) and fuzzy logic (i.e., statements are true, false,
or on a continuum and based on the logic if X equals Y then Z), whereas BIS uses several
fragments of an EEG in a mathematical model (i.e., precise calculations) to form a
numerical value (Cortínez et al., 2007; Jensen et al., 2006). Both have been shown to
produce a comparable numerical value for similar corresponding clinical states
(Anderson & Jakobsson, 2006; Cortínez et al., 2007; Jensen et al., 2006).
One prospective, observational study performed in 2007 compared EEG
recordings with CSI and BIS over a wide range of sedation levels (Cortínez et al., 2007).
Patients (N =15) were all healthy (i.e., PS I), aged 20 to 40, and all underwent GA for
surgery. After entering the operating room, but before any medications were
administered, baseline CSI and BIS values were recorded for a period of 2 minutes. Then
a propofol infusion was started at 300 ml/hr (specific dose not provided) and CSI and BIS
values were recorded until the burst suppression ratio (BSR) was ≥ 60% in both monitors
or until MAP was < 50 mmHg. This allowed for the evaluation of the effect of burst
suppression activity on both monitors. Of note, burst suppression is an EEG pattern with
alternating slow waves of high amplitude (i.e., burst) and flat EEG (i.e., suppression), and
BSR is the fraction of EEG spent in suppression (Amzica, 2009). The study protocol
assessed every 5 seconds after starting the propofol infusion, three clinical end points to
determine the patient’s level of consciousness. These included: loss of response to verbal
command, loss of eyelash reflex, and drop of a weighted syringe from the patient’s hand.

44 Baseline variability, prediction probability, and agreement analysis between indices
were also evaluated.
Statistical analysis showed significance for BIS and CSI correlation with BSR (p
< .01). Analysis of the effects of burst suppression on CSI and BIS showed that the CSI
performance was nearly completely dependent on BSR at all BSR values. However, BIS
was not significantly affected until a BSR was ≥ 40% (p values not provided). The
overall performance of both monitors were similar, however BIS may have been superior
for evaluating intermediate anesthetic levels (i.e., values between 60 to 40), whereas CSI
was better for evaluating deeper anesthetic levels (i.e., values between 40 to 20). These
results are consistent with other studies comparing BIS and CSI (Anderson & Jakobsson,
2006; Jensen et al., 2006)
Limitations of this study (Cortínez et al., 2007) included not reporting the type of
surgery being performed, how GA was maintained (e.g., titration of propofol infusion,
volatile anesthetic), and EMG activity. Additionally, there was no correction for possible
time delays in index calculations (i.e., lag time from actual cortical suppression to visible
CSI and BIS values). This is a limitation to the internal validity of this research, but it
increased the external validity because it evaluated what would be seen in actual clinical
situations.
Another study compared BIS to the subjective RSS (see Appendix C) for
measurement of conscious sedation in GI interventional procedures such as ERCP,
percutaneous transhepatic stent insertion, pancreatic pseudocyst drainage, gastrostomy,
and oesophageal, duodenal, and colonic stents (Bell et al., 2004). The RSS is a subjective
assessment tool used to evaluate a patient's level of sedation. It ranks the patient’s

45 response to either verbal or physical stimuli on a number scale from 1, meaning the
patient is anxious and agitated or restless or both, to 6, meaning the patient is
unresponsive to a light glabellar tap (i.e., tap on the forehead between the eyebrows) or
loud auditory stimulus. One hundred adult patients with a mean age of 69 years were
studied. Participants' PS classifications were as follows: 24 PS I, 43 PS II, 25 PS III, 7 PS
IV, and 1 PS V. Furthermore, 22 subjects had ischemic heart disease, 10 had diabetes
mellitus, eight had chronic obstructive pulmonary disease, two were said to be demented,
and one patient was dysarthric (i.e., had imperfect speech articulation).
Patients were divided into two groups with 30 subjects in group A and 70 subjects
in group B. Subjects in group A were sedated according to the hospital’s existing
protocol, which stated that to give safe sedation, the patient must be arousable and able to
protect their airway. Consequently, group A patients received baseline sedation
consisting of 50 mcg of fentanyl and 2 mg of midazolam; furthermore, if after 2 minutes
sedation wasn’t deemed adequate via a RSS of 3 to 4, another 2 mg of midazolam was
given. Midazolam continued to be administered in 2 mg increments every 2 minutes as
required. Furthermore, additional doses of fentanyl were given in patients who were
perceived to be in pain, and doses were halved in patients greater than 80 years old or
with a PS classification greater than II. The subjects were assigned a RSS every 5
minutes with the goal being a RSS of 3 to 4. BIS values were recorded at 5-minute
intervals and were blinded to the nurses administering the sedation and the endoscopist or
surgeon performing the procedure.
Group B patients had IV sedation titrated to a predetermined BIS value. This
predetermined level was established from the sedation results obtained from group A,

46 where they found that the optimal BIS range for conscious sedation was 80 to 85
(corresponding to the desired RSS of 3 to 4). Thus, subjects in group B received the
same baseline sedative medications as patients in group A. The only difference in
regards to the baseline sedation administered was that 2 to 5 minutes were given to allow
the BIS to return to a constant reading before giving more sedative medications. If
needed, 2 mg increments of midazolam were administered at 2-minute intervals to target
the pre-determined BIS value, and an additional 50 mcg of fentanyl was given for
perceived pain if it resulted in a sustained increase in BIS for greater than 2 minutes. If
giving fentanyl did not return the BIS value to the optimal range desired, more
midazolam (2 mg) was given until the desired BIS value was achieved.
The results of this study demonstrated that only 46.8% of RSS values in group A
were within the desired RSS of 3 to 4, which in this group correlated to a BIS level of
87.2 and 80.9. Based on those results, an optimal BIS range for conscious sedation was
defined as being between 80 and 85. Also, a significant negative correlation (i.e.,
correlation between -0.8 and -1.0, demonstrating that as one variable increases the second
variable decreases to a similar degree) was found when comparing the RSS and BIS
values between patients (r = -.97, p < .001) and within each patient's values (r = -.90, p <
.001) in group A. This significant negative correlation suggested that as the RSS
increased, BIS values decreased. Statistical significance in this study was determined by
p < .05. Due to the significant negative correlation found between both RSS and BIS in
group A, the authors concluded that BIS monitoring was an accurate measure of patient
sedation levels during interventional radiological procedures.

47 In contrast, Group B’s mean BIS value was 83.79 and this was significantly
higher (p = .001) than group A’s mean BIS value of 79.77. Furthermore, 57.5%
(227/395) of BIS readings in group B were in the optimal BIS range of 80 to 85,
compared to only 26.5% (48/181) in group A. These results suggest that using BIS
values to titrate sedation is more accurate and reliable than the RSS to obtain desired
sedation levels. Additionally, group B had no BIS value recorded that was < 60, but this
occurred 5.5% (10/181) of the time in group A.
Other benefits in using the BIS monitor to titrate patients' level of sedation in
group B included the mean dose of midazolam (4.64 mg) and fentanyl (58.21 mcg) were
both significantly lower (p = .001 and p = .011, respectively) than group A's mean doses
of midazolam (6.27 mg) and fentanyl (74.17 mcg). Likewise, the mean length of the
procedure and recovery time were found to be significantly reduced with BIS monitoring,
from 30.3 minutes and 25.10 minutes respectively, to 23.01 minutes and 19.90 minutes in
group B (p = .018 and p = .001).
Besides the above mentioned benefits, the BIS monitor could be useful for
preventing complications since all patients (unspecified number) sedated to a BIS value <
50 experienced an unplanned complication such as agitation, hypotension and/or hypoxia.
Hypotension was defined in this study as SBP < 80 mmHg, and it did not occur in any
patients with a BIS value > 78. The only patient who developed hypoxia (i.e., oxygen
saturation < 92% for > 1 minute) did so with a BIS value of 44. These results reveal that
the number of correlated adverse events (e.g., agitation, hypotension, and hypoxia)
increases with lower BIS values in GI interventional procedures. Another variable that
correlated with lower BIS readings was higher patient PS classification (i.e., PS III and

48 IV). Subjects with a higher PS classification reached deeper levels of sedation, as a
significant negative correlation was found between the subjects' PS classification and
their lowest recorded BIS value (r = -.35, p = .01).
A limitation of the study included the investigators not mentioning the time the
BIS value recording started or stopped. The authors did state, however, that vital signs
were recorded 5 minutes before the procedure and every 5 minutes during and after the
procedure until the patient was assessed to have fully recovered from sedation, which was
defined as being conversant and awake. Another limitation of this study was that the
researchers did not operationalize what was meant by a "sustained increase" for BIS.
Additionally, the study included an inequality in group size with 30 patients being in
group A and 70 in group B. There was also noticeable hysteresis between the BIS
recordings and the patients' sedation levels. The display of the BIS value was delayed by
7.5 to 15 seconds from real-time data. One way the investigators accounted for this
limitation was by allowing time after the baseline sedative medications were
administered for a consistent BIS value to appear before giving more sedatives or starting
the procedure. By waiting for a consistent value, group B participants had more time for
the sedative medications to take effect, possibly accounting for the fact that group B
patients received less medication and recovered significantly faster than group A. In
addition, a limitation to the RSS was noted in that the researchers did not operationalize
"excessive sedation" and whether this could include GA. Finally, a limitation also
included that no BIS values < 60 were recorded in group B patients at the 5 minute
increments; however, BIS values < 60 still occurred in group B patients as demonstrated
by the BIS ranges given for when complications occurred in each group. Despite these

49 limitations, the researchers recommended the BIS monitor be used as a standard
monitoring tool for patients undergoing "routine interventions" since the dosages of
midazolam and fentanyl, the mean length of the procedure, and the recovery time were all
significantly reduced with BIS monitoring.
Overall, BIS has been shown to be a valid tool for the measurement of depth of
GA (Cortínez et al., 2007). In contrast, well-defined BIS values that correlate with
specific levels of sedation (light, moderate, and deep) remain to be determined. Less
clearly defined BIS values that correlate with sedation levels characterized as
“light/moderate” (Kelley, 2010), “acceptable” (Bell et al., 2004), or the OAA/S scale
(Liu, Singh, & White, 1997) have been reported in the literature. For example, an
OAA/S score of 4 approximates a moderate sedation level and has been shown to
correlate with a BIS recording of 93 to 95 (Liu et al., 1997). The use of a BIS monitoring
system involves minimal risks to the patient and provides anesthesia providers with an
objective way to estimate the depth of sedation they are providing for their patients,
especially at deeper sedation levels when it becomes more difficult to clinically assess
patients (Bell et al., 2004). However, for multiple reasons BIS monitoring continues not
to be accepted as a standard of care for anesthesia providers: it is not cost-effective
(Abenstein, 2009; Liu, 2004), and intraoperative awareness is a rare occurrence (Myles,
Williams, Hendrata, Anderson & Weeks, 2000; Pollard, Coyle, Gilbert & Beck, 2007;
Sebel et al., 2004; Shepherd et al., 2013). Additionally, in one study, authors concluded
they did not find a reduction in intraoperative awareness by using the BIS monitor
(Avidan et al., 2008). Results from this study demonstrated there was no difference in
the occurrence of intraoperative awareness in patients randomly assigned to BIS-guided

50 anesthesia (i.e., targeting BIS values 40 to 60) and end-tidal anesthetic gas-guided
anesthesia (i.e., targeting end-tidal anesthetic gas values 0.7 to 1.3 minimum alveolar
concentration [i.e., the minimum alveolar concentration at which 50% of patients do not
move in response to skin incision]) (Avidan et al., 2008). Furthermore, one prospective
randomized controlled trial used a similar methodology of comparing BIS-guided
anesthesia to end-tidal anesthetic agent concentration-guided anesthesia to assess patients
at high risk for awareness. Criteria to determine high risk for awareness were based on
previous studies, reviews, and guidelines. Results indicated that 0.24% (7/2861) of
patients in the BIS-guided group and 0.07% (2/2852) of patients in the end-tidal
anesthetic agent concentration-guided group were determined to have definite
intraoperative awareness, demonstrating no superior use of BIS compared to end-tidal
anesthetic concentration in preventing intraoperative awareness (p = .98) (Avidan et al.,
2011).
In contrast, however, other studies assessing intraoperative awareness using BIS
monitoring found BIS to be useful (Ekman, Lindholm, Lennmarken, & Sandin, 2004;
Sebel et al., 2004). One study concluded that all cases found to have an incidence of
intraoperative awareness had high BIS values and no cases of awareness were identified
when BIS values were < 60 (Sebel et al., 2004). Similarly, another study discovered that
intraoperative awareness occurred when BIS values were > 60 (Ekman et al., 2004).
Informed Consent
It has been estimated that medications producing sedation and analgesia account
for 50% or more of complications in endoscopic procedures (Petrini & Egan, 2004) and
liability may arise from either failure to administer sedation according to the standard of

51 care or failure to obtain proper informed consent (Petrini & Egan, 2004). In addition,
providing deeper sedation/analgesia is said to reduce a patient's fear of the procedure and
allows for a greater recruitment of more at-risk patients; because endoscopists can offer
"painless" colonoscopy procedures (Petrini & Egan, 2004). Thus, the proceduralist's
desire to provide diagnostic care (which includes "deeper sedation/analgesia") that
generates high patient satisfaction scores, also promotes the undesirable consequences of
increased procedural risks (Bell et al., 2004; Petrini & Egan, 2004).
It is also important to recall that providing deep sedation and/or GA for
endoscopy procedures are generally not within the scope of practice for non-anesthesia
providers (CMS, 2011b; Petrini & Egan, 2004; Rex, 2011). In contrast, the standards of
practice for GI endoscopists working with a highly trained registered nurse recommend
sedation levels not exceed a moderate category - which is recognized by the ASGE as
being usually adequate for routine, uncomplicated GI endoscopy procedures (ASGE,
Standards of Practice Committee, 2008). Going beyond a moderate sedation level could
perhaps result in a violation of the proceduralist's hospital privileges. It could also
constitute a violation of the patient's previously agreed upon informed sedation consent.
Similarly, anesthesia practitioners are under obligation to deliver anesthesia
services both they and the patient have agreed upon during the consenting process. Thus,
if GA was not part of the agreed upon plan of care, reaching this depth of sedation during
a colonoscopy procedure could likewise represent a breach in contract of the preoperative
informed consent (Berg, Appelbaum, Lidz, & Parker, 2001; Bernat & Peterson, 2006).
Understandably, accurately obtaining an informed consent is important due to
differences in risk among the various levels of sedation. GA carries with it more serious

52 risks than MAC with IV sedation, such as loss of protective airway reflexes (Petrini &
Egan, 2004), and when looking at all the closed malpractice claims in the ASA's Closed
Claims Database from 1990 to 2002, only 6% of claims were associated with MAC with
IV sedation, whereas 78% were associated with GA (Bhanaker et al., 2006).
Another issue faced in procedures performed under MAC with IV sedation is
patients may be given false reassurance by the primary care provider, surgeon, or
anesthesia provider that they will be completely "asleep" during the procedure and feel no
discomfort (Feld, 2008). The anesthesia provider needs to dispel this belief of being
entirely asleep without the possibility of recall if the procedure is scheduled to be
performed under MAC with IV sedation. If the patient is not satisfied with receiving
MAC (i.e., minimal, moderate, or deep IV sedation) for his or her procedure, then it is
reasonable to discuss the possibility of consenting for GA instead.
Summary
Colonoscopy is a type of endoscopic procedure that is an effective screening
option for colorectal cancer (ASGE, 2007). Sedation during colonoscopies is sometimes
administered in an office or outpatient setting by nurses under the supervision of an
endoscopist (Cohen et al., 2006). However, there has been substantial growth in the
number of endoscopic procedures performed by anesthesia providers (Liu et al., 2012).
With nurse-administered sedation, midazolam and fentanyl are often used, but sometimes
nurses administer propofol (Diprivan) under the direction of a gastroenterologist. This is
a controversial practice because patients can unintentionally reach deep levels of sedation
when propofol is used, including GA. The 2011(b) recommendations from the ASA
indicate that any healthcare provider administering propofol for sedation should be

53 trained in providing GA. Hospira (2009), the manufacturer of propofol, also states that
only providers trained in GA should administer propofol, but additionally, that person
should not be involved in the conduction of the procedure. A 2006 nationwide survey
found that endoscopists were more satisfied with sedation from propofol rather than
sedation with a benzodiazepine combined with a narcotic because propofol allowed for
better sedation, superior analgesia, reduced recovery time, faster return to usual activity,
and improved quality of endoscopic examination (Cohen et al., 2006).
Levels of sedation can be viewed as a continuum, with minimal sedation
(anxiolysis) being the lightest level, and GA (i.e., patient is not arousable, independent
ventilation is usually impaired, airway assistance is often needed, positive pressure
ventilation may be necessary, and cardiovascular function may be compromised) being
the deepest (ASA, 2009). Furthermore, the ASA (2013) identified MAC as including
varying levels of sedation, but if the patient becomes unconscious and the ability to
respond purposefully is lost, GA has consequently occurred, regardless of the need for
airway instrumentation. Moderate sedation (i.e., patients respond purposefully to verbal
command, maintain patent airways without intervention, sustain adequate spontaneous
ventilation, and usually maintain cardiovascular function) is usually considered adequate
for routine, uncomplicated GI endoscopy procedures, but maximizing patient comfort
while minimizing risk during GI endoscopy should be the clinical goal (ASGE, Standards
of Practice Committee, 2008).
The BIS monitor is a modified EEG that can reflect the decreased cerebral
metabolic rate caused by anesthetic agents (Kelley, 2010). BIS has been validated as
being comparable to other methods of assessing sedation level, such as the CSI and RSS,

54 and has been shown to be a useful tool for the measurement of “different” levels of
sedation to help guide titration of sedative medications (Bell et al., 2004; Cortínez et al.,
2007; Hata et al., 2009). To date, although some studies have used BIS monitoring to
titrate or assess a patient's sedation level during “MAC anesthetics with IV sedation”
(Bang et al., 2013; Hata et al., 2009) or “conscious sedation” (Drake et al., 2006), there
has been no research that has quantified sedation levels (i.e., mild, moderate, deep, and
GA) via the BIS monitor in patients undergoing MAC with IV sedation during elective
colonoscopies.
BIS values ≤ 60 correlate with a state of GA (Bell et al., 2004; Cortínez et al.,
2007; Drake et al., 2006; Hata et al., 2009; Johansen, 2006; Kelley, 2010). A study from
2010 concluded that GA, as measured by BIS monitoring, occurs frequently in elderly
patients undergoing spinal anesthesia combined with propofol sedation, and titrating
propofol to a pre-determined BIS value range decreases that occurrence (Sieber et al.,
2010). Additionally, evidence has suggested that a greater number of adverse events may
occur in patients undergoing endoscopic submucosal dissection procedures when BIS
values are maintained between 56 and 65 (Hata et al., 2009). These deep levels of
sedation during endoscopy can have adverse effects, such as aspiration, hypoxia,
hypotension, and agitation (Bell et al., 2004; El Chafic et al., 2012; Soto et al., 2005).
One study found that during GI interventional procedures, BIS values < 50 were
associated with more adverse events and no patients experienced hypotension with a BIS
value > 78 (Bell et al., 2004). Furthermore, apnea is a complication that can occur with
MAC with IV sedation. One study showed the incidence to be 26% (Soto et al., 2004).

55 There has been significant growth in anesthesia providers administering
sedation for endoscopic procedures (Liu et al., 2012). Due to this growth and the
potential for the occurrence of unintended GA (El Chafic et al., 2012), it is important to
assess the current sedation practices administered by anesthesia personnel and non-
anesthesia healthcare providers for these procedures. In addition, it is imperative to
determine whether a change in practice (e.g., selection of sedation medications, personnel
administering sedation, type of consent) would be beneficial. The BIS monitor has been
demonstrated as an additional way to help assess whether patients undergoing surgical
and/or diagnostic procedures are experiencing GA (Bell et al., 2004; Cortínez et al.,
2007; Hata et al., 2009). Being able to assess GA levels of sedation is essential for
patient safety, given GA carries more risk for ventilatory and circulatory complications
(e.g., aspiration, respiratory arrest) than minimal, moderate, or deep IV sedation (Petrini
& Egan, 2004). Therefore, if levels of GA are being reached in endoscopic procedures
such as colonoscopies, patients should be accurately informed of this possibility and
consented for GA.

56
CHAPTER THREE: METHODOLOGY
Research Design
This study incorporated a non-experimental prospective observational research
design, with a convenience sampling of PS I, II, and III patients undergoing sedation for
elective colonoscopies. This research design allowed surveillance of real-world
conditions that may actually be encountered in clinical settings, and it enabled the
researchers to have limited or no influence on the actions of the anesthesia providers or
participants in the study.
Setting
Data was collected by researchers over a four-week period at a non-teaching rural
hospital in Western North Carolina. All procedures were carried out in an endoscopy
suite, and sedation was provided by either an anesthesiologist (N = 1) or a CRNA (N =
11). A limitation with using only one facility is the possibility that sedation could be
carried out differently at other institutions due to variations in site-specific protocols,
skills of gastroenterologists, and expectations of patients.
Population and Sample
There were a total of 41 subjects enrolled in the study with a range of PS
classifications between I to III. Two patients were excluded from the study because of
documented neurological deficits secondary to residual effects from a CVA. Other
exclusion criteria included patients undergoing sedation in which the anesthesia provider
used ketamine or N2O. Because this was a convenience sampling of patients having
elective colonoscopies over a four-week period, the sample size could not be pre-
determined.

57 Protection of Human Subjects
Before commencement of data collection, approval for this study was obtained
from the institutional review board (IRB) of the participating hospital on March 18, 2013
(see Appendix D). This study was also approved by Western Carolina University’s IRB
on April 11, 2013, with the IRB approval number 2013-0246 (see Appendix E). To
attenuate bias and assure confidentiality of all study participants, identification numbers
were assigned to each patient and anesthesia provider. These identification numbers
allowed avoidance of using any patient or provider identifiers such as name and/or
medical record number. No participation risks were identified for this observational
study.
In the preoperative holding area on the day of their scheduled procedure, the
researchers met with all patients undergoing elective colonoscopies. The purpose of the
study, the participant’s role, confidentiality, and right to refuse were explained to each
patient. As part of the consenting process, contact information for the primary
investigators, Western Carolina University’s IRB, and the participating hospital's IRB
were provided to all subjects (see Appendix F). At that time, all patients who met the
enrollment criteria were invited to participate in the study. Additionally, each anesthesia
provider was informed about the purpose of the study, their right to refuse, and
confidentiality measures (see Appendix G). Contact information for the primary
investigators, Western Carolina University’s IRB, and the participating hospital's IRB
were also shared with the anesthesia providers.

58 Instruments
The BIS monitor is a modified EEG. It was first introduced in 1996 to help
monitor cortical function during hypnotic states, and in 2003 it was approved by the FDA
for reducing the incidence of intraoperative awareness (Johansen, 2006; Kelley, 2010).
BIS values are measured on a scale of 0 to 100 (Kelley, 2010). A value of 0 indicates
complete cortical suppression, and values of 93 or above indicate a state of wakefulness
(Kelley, 2010). Moderate sedation occurs at BIS values between 65 and 85, and GA is
said to occur between values of 45 and 60 (Kelley, 2010). Some studies have shown an
increased number of adverse events such as hypotension and hypoxia with BIS values <
60 (Arrowsmith et al., 1991; Charlton, 1995). Other studies have shown that a BIS value
of 80 correlates with what has been described as an “ideal” level of sedation for
colonoscopies (Bell et al., 2004; Bower et al., 2000).
The BIS monitor is the most extensively researched EEG device currently used to
evaluate depth of anesthesia during surgical procedures, and it is frequently used as a
monitor in the operating room to measure the depth of anesthesia and to help guide the
titration of medications during GA (Bruhn et al., 2003; Cortínez et al., 2007; Doufas et
al., 2003; Ge et al., 2002; Kearse et al., 1998). BIS measurements have also been shown
to be useful with measuring sedation levels during endoscopic procedures when sedation
is administered by anesthesia (e.g., CRNAs, anesthesiologists) and non-anesthesia (e.g.,
registered nurses) providers (Bell, et al., 2004; Hata et al., 2009; Leslie et al., 2002;
Siddiqui et al., 2012). Additionally, there have been some studies that have looked at the
use of BIS as an adjunctive monitor in titrating a patient’s sedation level through the use

59 of various drugs, such as propofol, fentanyl, and midazolam (Bell et al., 2004; Drake et
al., 2006; Hata et al., 2009).
The BIS A-2000™ monitor was used to monitor the depth of sedation and
possible correlated adverse events during colonoscopies. As part of the study design,
interventions were not implemented in response to observed BIS values, and notification
to providers was not given when BIS values dropped below 60 (indicating GA had
occurred).
Data Collection and Field Procedures
Participation in the study began from the time consent was obtained in the
preoperative holding area to the time the patients' first set of vital signs were taken in
PACU. In the preoperative area, per instructions presented on the BIS sensor packaging,
the forehead was cleaned with an alcohol wipe and then dried with gauze. The strip was
then applied in a diagonal direction starting with sensor number 1 about 2 inches above
the bridge of the nose, followed by sensor number 4 directly above the eyebrow and
ending with sensor number 3 on the temple, between the corner of the eye and the
hairline. The edges of each sensor were pressed, and then the center of each sensor was
firmly pressed for about 5 seconds. The sensor strip was then connected to the BIS A-
2000™ monitoring device and the first BIS value was recorded. At this time, a non-
invasive BP cuff was placed on the patient's arm and the first set of vital signs, including
HR, SpO2, RR, SBP, DBP, MAP, temperature, and liters of oxygen flow were
documented.
After arriving in the endoscopy suite (procedure room), a second set of BP
measurements (SBP, DBP, MAP) were taken, followed immediately with a recording of

60 HR, SpO2, RR, and BIS value. A stopwatch was also started just after the BP
measurement was taken to help maintain accuracy for data-recording intervals in the
endoscopy suite. Recording of the presence or absence of ETCO2 (measured via the
Salter Labs 4707F adult Salter NC) and liters of oxygen flow began as soon as the NC
was placed on the patient in the procedure room. BIS values and ETCO2 values then
continued to be recorded every minute throughout the remainder of the procedure. Also
during this time, SBP, DBP, MAP, and HR via ECG (lead chosen by provider) were
recorded every 5 minutes, and any intraoperative changes in liters of oxygen flow from
baseline oxygen flow rates were documented at the actual time they occurred.
Additionally, the SpO2 value was noted every 5 minutes, except when it dropped below
95%. If this occurred, recording of data took place at 1-minute intervals until the SpO2
returned to 95% or greater, when it was again recorded at 5-minute intervals. Without
regard to frequency, the lowest BIS value observed during each procedure was noted.
Also, temperature recordings were taken only in the preoperative area and in the PACU.
All data was recorded and documented by one of the investigators until the patient
was detached from monitors in the procedure room in preparation for transfer to PACU.
Additionally, medications administered and documented by the anesthesia provider
during the procedure were recorded retrospectively, and included the dosage of
medications and time administered. The form of primary medication delivery (i.e., one
time/single bolus followed by infusion, intermittent bolus, infusion, or combination of
intermittent bolus and infusion) was also observed and documented by one of the primary
investigators.

61
Likewise, airway assistance maneuvers and oxygen delivery devices used by
the anesthesia provider were recorded throughout the procedure. This included, but was
not limited to, chin lift, jaw thrust, combination of chin lift and jaw thrust, and placement
of nasopharyngeal airway, oropharyngeal airway, NC, face mask, non-rebreather mask,
bag mask, LMA and endotracheal tube. Upon arrival to PACU, one set of vital signs
including SBP, DBP, MAP, HR, SpO2, temperature, and RR were recorded.
Additionally, the time of arrival in the PACU, oxygen delivery method and liter flow, and
one final BIS value were noted.
Chart documents relevant to the anesthesia care received throughout the
procedure were collected. This included copies of the anesthesia record, and information
from the pre-anesthesia assessment sheet, PACU record, anesthesia and/or surgical
consent form, and surgeon’s history and physical and/or medication list. Total drug
dosages, length of procedure, consented anesthetic plan (e.g., GA, MAC with IV
sedation), postoperative diagnosis, and the patient’s demographic data (i.e., gender, age,
body mass index (BMI), weight, height, and PS) were recorded. Additional information
obtained retrospectively from chart review included use of oxygen at home, presence of
obstructive sleep apnea and use of a home continuous positive airway pressure (CPAP) or
bi-level positive airway pressure (BiPAP) device, history of previous airway surgeries,
and major comorbidities. Lastly, the BIS monitor used in the endoscopy suite was placed
out of immediate view from the anesthesia providers and the gastroenterologists or
surgeons performing the colonoscopy, which facilitated the blinding of healthcare
providers to BIS values obtained during the procedure. The healthcare providers were

62 also reminded of the need to shield their face from the BIS values during the
endoscopy procedure.
A survey tool (see Appendix H) was used to collect demographic data on
anesthesia providers. This included 1) the year the CRNA or anesthesiologist passed
their national certification exam, 2) the number of years or months of experience with
providing anesthesia care for patients scheduled for colonoscopies, 3) the opinion of the
anesthesia provider of the level of sedation they typically provide during colonoscopies
(i.e., MAC, GA or both), and 4) the highest educational degree obtained (i.e., Doctorate,
Masters, Bachelors, or Diploma).
Data Analysis
All quantitative and numerically-coded demographic data was entered into an
Excel spreadsheet before analysis. A statistician was consulted to assure the accuracy of
proposed statistical tests and provide guidance to investigators on the use of additional
statistical tests deemed essential for the study. Correlation analysis (r and r2) was used
for continuous data (e.g., length of procedure, age, BMI, years as provider, propofol
dose/min). The Mann-Whitney U test compares two groups with ordinal data, and was
used for analysis of correlation between SpO2, ETCO2, and gender. One-way ANOVA is
a parametric test used for comparing the means of three or more groups (e.g., BIS values
of ≤ 60, ≤ 40, and ≤ 20) and was chosen for analyzing BIS values versus experience of
the anesthesia provider with colonoscopies (e.g., 1-2 years, 3-5 years, 6-10 years). The
Kruskall-Wallis, which is an extension of the Mann-Whitney U test and incorporates
ordinal data for three or more groups, was utilized to determine if a correlation existed
between BIS values, PS classification, SpO2, ETCO2, education, and length of experience

63 as an anesthesia provider. An unpaired t-test, which compares two or more
independent samples, was used to assess potential relationships between gender and BIS
values. Simple quantitative statistics were used to calculate all other data.
Limitations
The BIS monitor was secured on a pole attached to the head of the bed, so
inadequate blinding of anesthesia providers to BIS values may have inadvertently
occurred. Instructions were provided to anesthesia personnel to avoid titrating sedation
medication based on BIS values accidentally observed; however, it was possible that
titration did occur and statistical analysis could not account for this possibility. Another
limitation of the study was the duration of apnea (i.e., absence of ETCO2) was only
measured at 1-minute intervals. For example, if a patient experienced 1.25 minutes of
apnea, it would have been recorded as a duration of 1 minute; in contrast, if a patient
experienced 35 seconds of apnea it may not have been recorded at all due to the
previously mentioned assessment intervals of 1-minute. Additionally, negative ETCO2
waveforms obtained via Salter NC’s can be the result of situations other than apnea, such
as a patient breathing out of their mouth instead of their nose. Furthermore, some
providers performed a chin lift in the absence of apnea, most likely as a preventative
measure. Since apnea may have occurred in the absence of this prophylactic chin lift,
measuring the actual frequency of apnea, along with resulting interventions during
colonoscopies, was not possible. This inability to precisely record the frequency and
interventions related to apnea was a limitation that likely skewed statistical analysis
involving airway maneuvers in correlation with BIS values, and the presence or absence
of ETCO2.
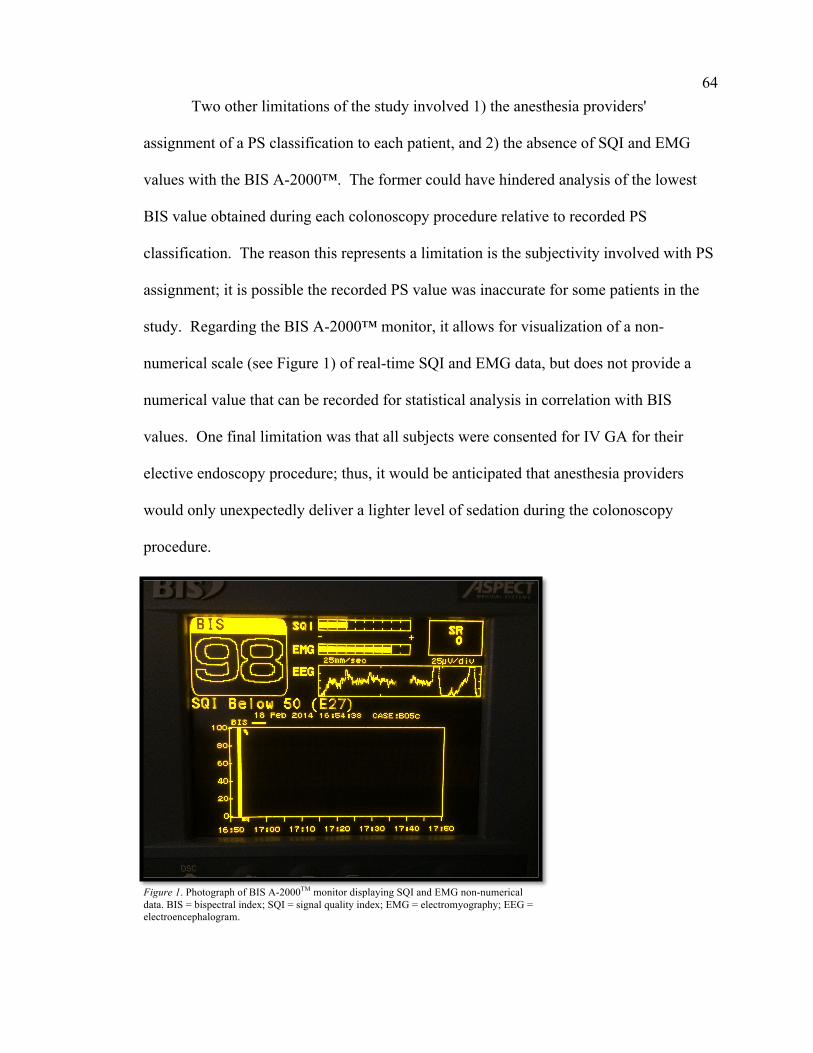
64 Two other limitations of the study involved 1) the anesthesia providers'
assignment of a PS classification to each patient, and 2) the absence of SQI and EMG
values with the BIS A-2000™. The former could have hindered analysis of the lowest
BIS value obtained during each colonoscopy procedure relative to recorded PS
classification. The reason this represents a limitation is the subjectivity involved with PS
assignment; it is possible the recorded PS value was inaccurate for some patients in the
study. Regarding the BIS A-2000™ monitor, it allows for visualization of a non-
numerical scale (see Figure 1) of real-time SQI and EMG data, but does not provide a
numerical value that can be recorded for statistical analysis in correlation with BIS
values. One final limitation was that all subjects were consented for IV GA for their
elective endoscopy procedure; thus, it would be anticipated that anesthesia providers
would only unexpectedly deliver a lighter level of sedation during the colonoscopy
procedure.
Figure 1. Photograph of BIS A-2000TM monitor displaying SQI and EMG non-numerical data. BIS = bispectral index; SQI = signal quality index; EMG = electromyography; EEG = electroencephalogram.
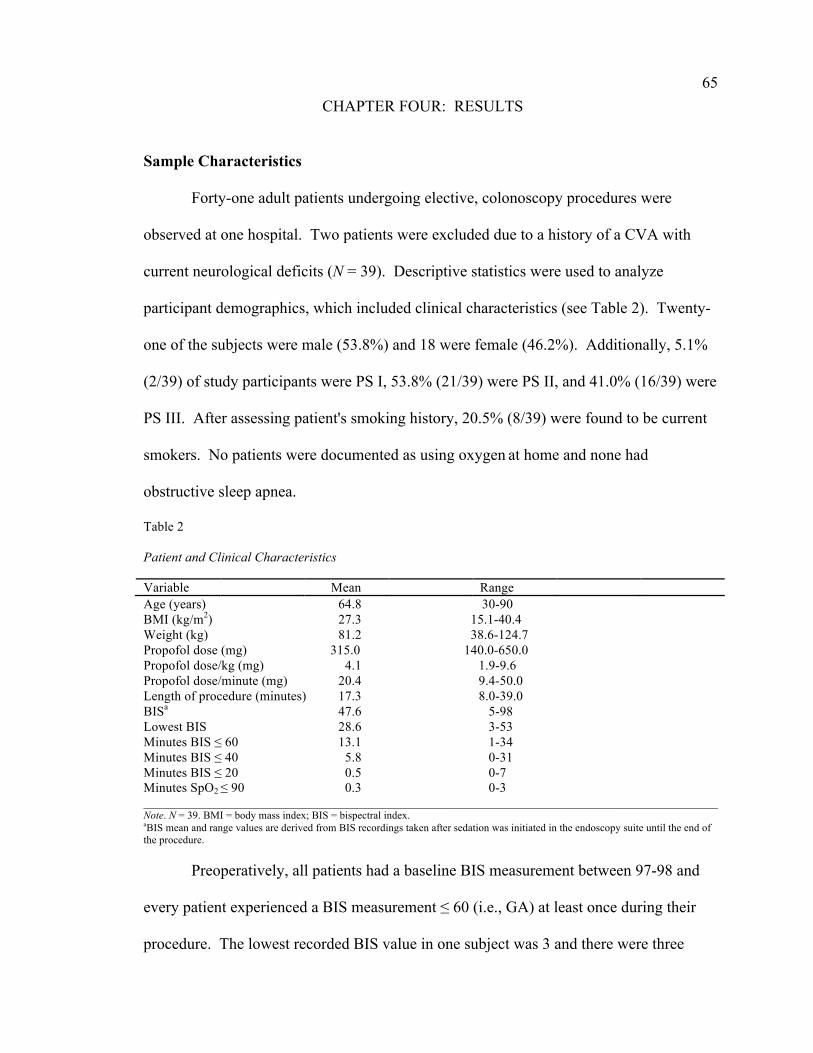
65
CHAPTER FOUR: RESULTS
Sample Characteristics
Forty-one adult patients undergoing elective, colonoscopy procedures were
observed at one hospital. Two patients were excluded due to a history of a CVA with
current neurological deficits (N = 39). Descriptive statistics were used to analyze
participant demographics, which included clinical characteristics (see Table 2). Twenty-
one of the subjects were male (53.8%) and 18 were female (46.2%). Additionally, 5.1%
(2/39) of study participants were PS I, 53.8% (21/39) were PS II, and 41.0% (16/39) were
PS III. After assessing patient's smoking history, 20.5% (8/39) were found to be current
smokers. No patients were documented as using oxygen at home and none had
obstructive sleep apnea.
Table 2 Patient and Clinical Characteristics Variable Mean Range Age (years) 64.8 30-90 BMI (kg/m2) 27.3 15.1-40.4 Weight (kg) 81.2 38.6-124.7 Propofol dose (mg) 315.0 140.0-650.0 Propofol dose/kg (mg) 4.1 1.9-9.6 Propofol dose/minute (mg) 20.4 9.4-50.0 Length of procedure (minutes) 17.3 8.0-39.0 BISa 47.6 5-98 Lowest BIS 28.6 3-53 Minutes BIS ≤ 60 13.1 1-34 Minutes BIS ≤ 40 5.8 0-31 Minutes BIS ≤ 20 0.5 0-7 Minutes SpO2 ≤ 90 0.3 0-3 ________________________________________________________________________________________________ Note. N = 39. BMI = body mass index; BIS = bispectral index. aBIS mean and range values are derived from BIS recordings taken after sedation was initiated in the endoscopy suite until the end of the procedure. Preoperatively, all patients had a baseline BIS measurement between 97-98 and
every patient experienced a BIS measurement ≤ 60 (i.e., GA) at least once during their
procedure. The lowest recorded BIS value in one subject was 3 and there were three

66 separate episodes recorded for this patient of an absent ETCO2 waveform. The first
episode occurred after the initial propofol bolus and was accompanied by a decline in
oxygen saturation to 84%, which resolved with a chin lift. The other two episodes
resulted in a negligible drop in oxygen saturation to 97% and 98%. Overall, out of a total
of 656 minutes of recorded data for 39 patients, 51 minutes of absent ETCO2 (7.9%) were
found (see Figure 2). All patients received oxygen via NC at flows 2-5 L/min and there
were a total of seven patients (17.9%) whose oxygen saturation dropped to ≤ 90% for at
least 1 minute. One anesthesia provider failed to monitor ETCO2; therefore, ETCO2 data
on three patients under their care could not be obtained.
Figure 2. Bar graph demonstrating the number of minutes of absent ETCO2 each patient experienced. Patients 2, 3, and 10 did not have ETCO2 monitored by the anesthesia provider. ETCO2 = end tidal carbon dioxide. The average propofol dose administered per patient during the entire colonoscopy
procedure was 315 mg and 4.1 mg/kg respectively. Propofol was administered via
intermittent boluses in 94.9% (37/39) of patients and by bolus followed with infusion in
5.1% (2/39) of patients. In addition, no patient received fentanyl or midazolam. In
89.7% of patients (35/39) MAP decreased at the first BP measurement after the initial
propofol bolus, of which 61.5% (24/39) of subjects had a 10.1-42.4% MAP decrease at
this time (see Figure 3), and in more than half of these 24 participants (54.2%), the MAP
0
2
4
6
8
10
1 3 5 7 9 11 13 15 17 19 21 23 25 27 29 31 33 35 37 39
Minutes of Absent ETCO2
Patient

67 decreased by 21.5-42.4% (see Figure 4). Overall, the greatest MAP decrease found
was 50.8% and this occurred in one patient 7 minutes after the end of the procedure. In
contrast, 10.3% of patients (4/39) had an increase in MAP at the first BP measurement
after the initial propofol bolus.
Figure 3. Bar graph demonstrating the percentage of patients with a MAP decrease < 10.1% or 10.1-42.4% at the first BP measurement taken after the initial propofol bolus. There were no patients with a MAP decrease > 42.4% at this measurement time. N = 39. MAP = mean arterial pressure; BP = blood pressure.
Figure 4. Bar graph exhibiting further breakdown of MAP decrease at the first BP measurement after the initial propofol bolus in the 61.5% of patients (24/39) who had a MAP decrease from 10.1-42.4%. MAP decreases of 10.1-19.0% and 21.5-42.4% shown. N = 24. MAP = mean arterial pressure; BP = blood pressure. A total of 12 anesthesia providers were surveyed with a 100% response rate (see
Table 3). The average number of years as an anesthesia provider was 14.3, and 41.7%
(5/12) of the respondents had > 10 years of experience with providing anesthesia for
0.0%
20.0%
40.0%
60.0%
80.0%
100.0%
< 10.1% 10.1-42.4%
% of Patients
MAP Decrease
0.0%
20.0%
40.0%
60.0%
80.0%
100.0%
10.1-19.0% 21.5-42.4%
% of Patients
MAP Decrease

68 colonoscopies, 33.3% (4/12) had 6-10 years of experience with colonoscopies and
8.3% (1/12) had 3-5 years of experience with colonoscopies. Only 16.7% (2/12) had 0-2
years of experience with colonoscopies. Additionally, 8.3% (1/12) of anesthesia
professionals' highest level of education was a doctorate, 66.7% (8/12) a master's degree,
8.3% (1/12) a bachelor's, and 16.7% (2/12) a diploma. When asked what percentage of
colonoscopies they believed they were delivering a MAC anesthetic, GA, or a
combination of both, 50% (6/12) of the respondents believed they were administering GA
100% of the time, whereas just one anesthesia provider believed they were delivering
MAC 100% of the time. The remaining anesthesia professionals (5/12) believed they
were administering a combination of a MAC anesthetic and GA (See Figure 5). Survey
responses were likely influenced by the fact that all patients undergoing elective
colonoscopies at this hospital were consented for IV GA.
Table 3 Anesthesia Provider (AP) Survey Responses AP No. of
years as an AP
AP's years of experience
with colonoscopies
Highest degree held
% of Colonoscopies
believe providing MAC
% of Colonoscopies
believe providing GA
% of Colonoscopies
believe providing
combinationc
No. of patients cared for by APd
1 29 > 10 Diploma 0 100 0 2 2a 4 6-10 Doctorate 3 97 0 4 3 9 6-10 Master's 0 0 100 1 4b 12 > 10 Master's 100 0 0 14 5 8 6-10 Master's 0 100 0 1 6 1 0-2 Master's 0 100 0 1 7 28 > 10 Master's 99 1 0 1 8 29 > 10 Bachelor's 0 100 0 4 9 4 3-5 Master's 0 100 0 2 10 1 0-2 Master's 0 0 100 6 11 8 6-10 Master's 0 100 0 2 12 38 > 10 Diploma 90 10 0 2 ______________________________________________________________________________________ Note. AP = anesthesia provider; MAC = monitored anesthesia care; GA = general anesthesia. aAnesthesiologist. bOnly AP who believed they were administering MAC 100% of the time for colonoscopies. cGA and MAC. dDemographic data not included as part of the survey.

69
Figure 5. Pie graph with survey results of the percentage of anesthesia providers who believed they were delivering a level of sedation consistent with MAC 100% of the time, GA 100% of the time, or a combination of MAC and GA during colonoscopy procedures. N = 12. GA = general anesthesia; MAC = monitored anesthesia care. Major Findings
The quantitative data were analyzed using Prism 6.0c software. Alpha was two-
tailed and set at .05 for all tests, and Pearson product-moment correlation coefficient
(Pearson r) test was used to assess whether an association existed between each patient's
BIS measurements and 1) their respective demographics, 2) clinical characteristics for
each subject (e.g., length of procedure, propofol dose given per minute), and 3) each
participant's anesthesia provider. Furthermore, r values provide an estimate of how much
one variable accurately predicts another (Hatcher, 2003). A value of zero means there is
no relationship between the two variables. Values ranging from ±0.2-0.4 represent a mild
or weak association between variables, ±0.5-0.7 a moderate association, and ±0.8-1.0 a
strong association. An r value of 1.0 represents a perfect positive correlation (e.g., the
longer the length of the procedure, the more minutes patients spent with BIS values ≤ 60)
and -1.0 represents a perfect negative correlation (e.g., the longer the length of the
procedure, the less minutes the patients spent with BIS values ≤ 60) (Hatcher, 2003).
50% 42%
8%
Believe Delivering GA 100% of the Time
Believe Delivering a Combination of MAC and GA
Believe Delivering MAC 100% of the Time
70 In addition, the coefficient of determination (r2) was computed. These values
are a measure of the proportion of variance in one variable that can be explained by its
relationship to (or accounted for by) a second variable. The calculated values range from
0 (0%) to 1 (100%). For example, a value of 1.0 means 100% of the deviation in one
variable is correlated with the variance in the second variable (Hatcher, 2003). A value
of 0.0 means knowing one variable does not help to predict the other. In essence, the
higher the number, the better the ability to determine how much divergence of one
variable is due to (or can be explained by) another variable's variability (Hatcher, 2003).
Every patient experienced BIS values ≤ 60 for at least 1 minute or more (range of
1-34 minutes or 11.1-100% of their length of procedure); 76.9% of subjects were
recorded as having a BIS value ≤ 40 for 1-31 minutes or for 4.5-100% of their procedure,
and 15.4% of participants experienced a BIS value ≤ 20 for 1-7 minutes or for 4.0-33.3%
of their procedure. A strong positive correlation was found between the length of the
procedure and the number of minutes patients had a BIS recording ≤ 60 (r = .85, r2 = .72,
p < .001) (see Table 4). This suggests the longer the length of the procedure, the greater
the number of minutes patients experienced BIS values ≤ 60 (See Figure 6).
Additionally, a weaker but still significant correlation was found when comparing the
length of the procedure and the number of minutes patients were reported to have BIS
values ≤ 40 (r = .43, r2 = .18, p = .007) (see Figure 7). The significance demonstrated
between these two variables is an important finding regardless of the weaker correlation;
it suggests there is a low risk that chance alone accounted for the mild positive
correlation, which implies as one variable increases, the other also slightly increases.
Conversely, the correlation for the length of the procedure and the number of minutes
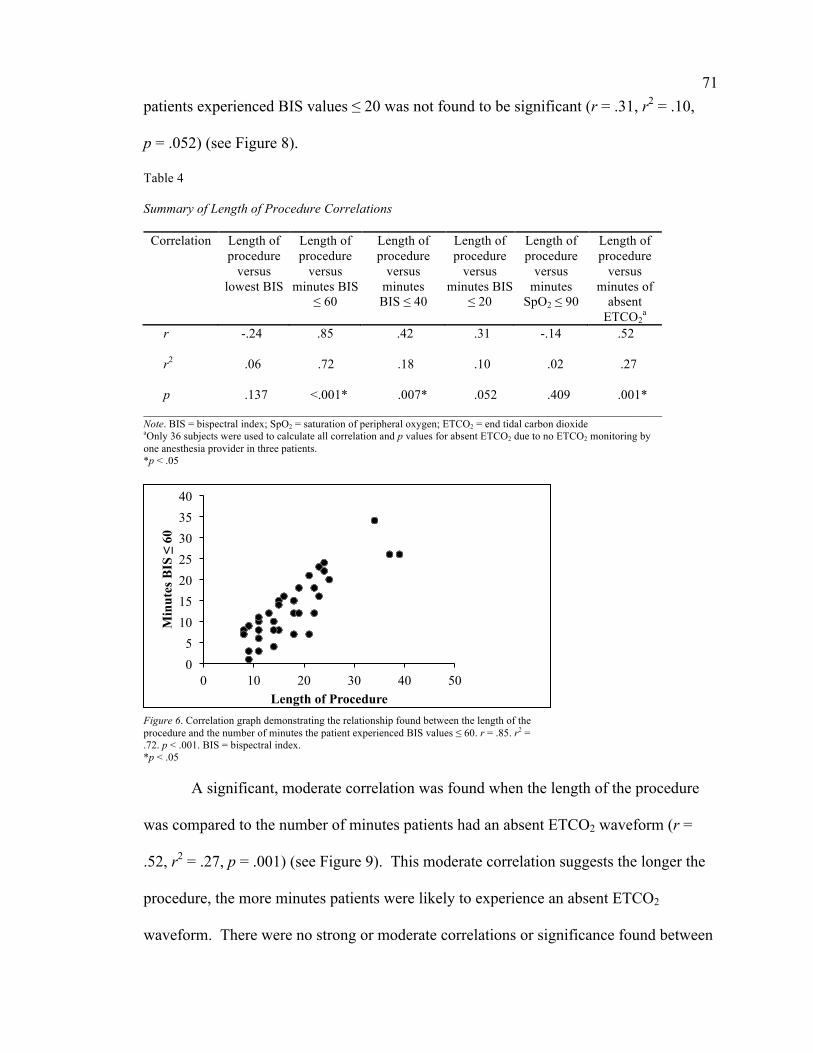
71 patients experienced BIS values ≤ 20 was not found to be significant (r = .31, r2 = .10,
p = .052) (see Figure 8).
Table 4 Summary of Length of Procedure Correlations
Correlation Length of procedure
versus lowest BIS
Length of procedure
versus minutes BIS
≤ 60
Length of procedure
versus minutes BIS ≤ 40
Length of procedure
versus minutes BIS
≤ 20
Length of procedure
versus minutes
SpO2 ≤ 90
Length of procedure
versus minutes of
absent ETCO2
a
r -.24 .85 .42 .31 -.14 .52 r2 .06 .72 .18 .10 .02 .27 p .137 <.001* .007* .052 .409 .001* ______________________________________________________________________________ Note. BIS = bispectral index; SpO2 = saturation of peripheral oxygen; ETCO2 = end tidal carbon dioxide aOnly 36 subjects were used to calculate all correlation and p values for absent ETCO2 due to no ETCO2 monitoring by one anesthesia provider in three patients. *p < .05
Figure 6. Correlation graph demonstrating the relationship found between the length of the procedure and the number of minutes the patient experienced BIS values ≤ 60. r = .85. r2 = .72. p < .001. BIS = bispectral index. *p < .05 A significant, moderate correlation was found when the length of the procedure
was compared to the number of minutes patients had an absent ETCO2 waveform (r =
.52, r2 = .27, p = .001) (see Figure 9). This moderate correlation suggests the longer the
procedure, the more minutes patients were likely to experience an absent ETCO2
waveform. There were no strong or moderate correlations or significance found between
0 5
10 15 20 25 30 35 40
0 10 20 30 40 50
Min
utes
BIS
≤ 6
0
Length of Procedure

72
Figure 7. Correlation graph demonstrating the relationship found between the length of the procedure and the number of minutes the patient experienced BIS values ≤ 40. r = .43. r2 = .18. p = .007. BIS = bispectral index. *p < .05
Figure 8. Correlation graph demonstrating the relationship found between the length of the procedure and the number of minutes the patient experienced BIS values ≤ 20. r = .31. r2 = .10. p = .052. BIS = bispectral index. *p < .05 the length of the procedure and the number of minutes patients had a SpO2 ≤ 90 or the
patient's lowest BIS value obtained during the procedure (see Figures 10 and 11).
Another significant, mild correlation was found when comparing the number of
minutes patients had an absent ETCO2 waveform with the number of minutes patients
experienced GA (i.e., BIS values ≤ 60) (r = .49, r2 = .24, p = .002). This r value suggests
the greater number of minutes patients experienced an absent ETCO2 waveform, the
more minutes patients had BIS values ≤ 60, implying that IV GA has an association with
0
5
10
15
20
25
30
35
0 10 20 30 40 50
Min
utes
BIS
≤ 4
0
Length of Procedure
0 1 2 3 4 5 6 7 8
0 10 20 30 40 50
Min
utes
BIS
≤ 2
0
Length of Procedure

73
Figure 9. Correlation graph demonstrating the relationship found between the length of the procedure and the number of minutes the patient experienced an absence of ETCO2. r = .52. r2 = .27. p = .001. ETCO2 = end tidal carbon dioxide. *p < .05
Figure 10. Correlation graph demonstrating the relationship found between the length of the procedure and the number of minutes the patient experienced a SpO2 ≤ 90. r = -.14. r2 = .02. p = .409. SpO2 = saturation of peripheral oxygen. *p < .05 adverse perioperative events in patients who undergo elective colonoscopies (see Figure
12). Also, after comparing the number of minutes patients had a SpO2 ≤ 90% to the
number of minutes patients experienced GA (i.e., BIS values ≤ 60), no significance or
mild, moderate, or strong correlations were found (r = -.17, r2 = .03, p = .299) (see Figure
13). Overall, the adverse event of an absent ETCO2 waveform (i.e., apnea) was shown to
have a significant correlation with IV GA, but there was no significant correlation shown
when comparing the number of minutes patients had a SpO2 ≤ 90% (i.e., desaturation) to
0
2
4
6
8
10
12
0 10 20 30 40 50
Min
utes
of A
bsen
t ET
CO
2
Length of Procedure
0
0.5
1
1.5
2
2.5
3
3.5
0 10 20 30 40 50
Min
utes
SpO
2 ≤ 9
0
Length of Procedure

74
Figure 11. Correlation graph demonstrating the relationship found between the length of the procedure and the patient's lowest BIS value observed throughout the procedure. r = -.24. r2 = .06. p = .137. BIS = bispectral index. *p < .05 IV GA. In addition, apnea and desaturation did not result in any apparent clinically
significant events and no patients required airway interventions, such as placement of a
nasopharyngeal airway, oropharyngeal airway, face mask, non-rebreather mask, bag
mask, LMA, or endotracheal tube.
Figure 12. Correlation graph demonstrating the relationship found between the number of minutes the patient experienced an absent ETCO2 waveform and BIS values ≤ 60. r = .49. r2 = .24. p = .002. BIS = bispectral index; ETCO2 = end tidal carbon dioxide. *p < .05 Furthermore, a moderate positive correlation and significance (r = .54, r2 = .29, p
< .001) was demonstrated when comparing BMI with the patients' lowest BIS value
0
10
20
30
40
50
60
0 10 20 30 40 50
Low
est B
IS
Length of Procedure
0 5
10 15 20 25 30 35 40
0 5 10 15
Min
utes
BIS
≤ 6
0
Minutes of absent ETCO2

75
Figure 13. Correlation graph demonstrating the relationship found between the number of minutes the patient experienced a SpO2 ≤ 90 and BIS values ≤ 60. r = -.17. r2 = .03. p = .299. BIS = bispectral index; SpO2 = saturation of peripheral oxygen. *p < .05 obtained throughout the entire procedure. This suggested that patients with a larger BMI
(compared to patients with lower BMIs) were more likely to have the greatest nadir in
recorded BIS value (see Figure 14). Additionally, significance was demonstrated when
BMI was compared to the number of minutes patients had a BIS value ≤ 60 (r = -.42, r2 =
.17, p = .008) and ≤ 40 (r = -.51, r2 = .26, p < .001). The r values suggest the greater the
BMI, the fewer number of minutes patients experienced BIS values ≤ 60 and ≤ 40 (see
Figures 15 and 16). No significance or strong or moderate correlations were
demonstrated when comparing BMI to the number of minutes patients had BIS values ≤
20, SpO2 ≤ 90, or an absent ETCO2 waveform (see Table 5). Similarly, no strong
correlations, moderate correlations, or significance were found when the patients' ages
and the survey respondents' number of years as an anesthesia provider were compared to
BIS values, absent ETCO2 waveforms, and SpO2 values (see Tables 6 and 7).
The last data subjected to statistical analysis included the subject's PS
classification and the lowest BIS value obtained during the endoscopy procedure. This
was accomplished via the Kruskal-Wallis test, a nonparametric test which makes no
0 5
10 15 20 25 30 35 40
0 1 2 3 4
Min
utes
BIS
≤ 6
0
Minutes SpO2 ≤ 90

76
Figure 14. Correlation graph demonstrating the relationship found between the patient's BMI and the patient's lowest BIS value observed throughout the procedure. r = .54. r2 = .29. p < .001. BIS = bispectral index; BMI = body mass index. *p < .05
Figure 15. Correlation graph demonstrating the relationship found between the patient's BMI and the number of minutes the patient experienced BIS values ≤ 60. r = -.42. r2 = .17. p = .008. BIS = bispectral index; BMI = body mass index. *p < .05 assumptions about the distribution of data within categorical groups. This test is ideal for
comparing three or more groups when data is ranked numerically (e.g., patients' lowest
BIS value observed throughout procedure) and compared to a categorical data set or
group assignment (e.g., PS I, II, III) (Lomax, 1998; Norman, 1999). Consequently, the
Kruskal-Wallis test was used to compare PS I, II, and III with the patients' lowest BIS
value observed throughout the procedure. This statistical test assigns a rank to all values
in each group, sums and averages the rank values for each group, and then calculates a
0
10
20
30
40
50
60
0 10 20 30 40 50
Low
est B
IS
BMI
0 5
10 15 20 25 30 35 40
0 10 20 30 40 50
Min
utes
BIS
≤ 6
0
BMI

77
Figure 16. Correlation graph demonstrating the relationship found between the patient's BMI and the number of minutes the patient experienced BIS values ≤ 40. r = -.51. r2 = .26. p < .001. BIS = bispectral index; BMI = body mass index. *p < .05 Table 5 Summary of Body Mass Index (BMI) Correlations Correlation BMI
versus lowest
BIS
BMI versus
minutes BIS ≤ 60
BMI versus
minutes BIS ≤ 40
BMI versus
minutes BIS ≤ 20
BMI versus
minutes SpO2 ≤ 90
BMI versus minutes of
absent ETCO2
a r .54 -.42 -.51 -.30 .06 -.25 r2 .29 .17 .26 .09 .00 .06 p <.001* .008* <.001* .067 .728 .143 _____________________________________________________________________________ Note. BIS = bispectral index; SpO2 = saturation of peripheral oxygen; ETCO2 = end tidal carbon dioxide aOnly 36 subjects were used to calculate all correlation and p values for absent ETCO2 due to no ETCO2 monitoring by one anesthesia provider in three patients. *p < .05 Table 6 Summary of Age Correlations
Correlation Age versus lowest
BIS
Age versus
minutes BIS ≤ 60
Age versus minutes BIS ≤ 40
Age versus
minutes BIS ≤ 20
Age versus
minutes SpO2 ≤ 90
Age versus
minutes of absent
ETCO2a
r -.06 -.23 -.12 -.21 .15 .12 r2 .00 .05 .01 .04 .02 .01 p .720 .156 .474 .197 .378 .500 _____________________________________________________________________________ Note. BIS = bispectral index; SpO2 = saturation of peripheral oxygen; ETCO2 = end tidal carbon dioxide aOnly 36 subjects were used to calculate all correlation and p values for absent ETCO2 due to no ETCO2 monitoring by one anesthesia provider in three patients. *p < .05
0
5
10
15
20
25
30
35
0 10 20 30 40 50
Min
utes
BIS
≤ 4
0
BMI

78 Table 7 Summary of Years as an Anesthesia Provider Correlations
Correlation Years as provider versus lowest
BIS
Years as provider versus
minutes BIS ≤ 60
Years as provider versus
minutes BIS ≤ 40
Years as provider versus
minutes BIS ≤ 20
Years as provider versus
minutes SpO2 ≤ 90
Years as provider versus
minutes of absent
ETCO2a
r -.26 .31 .13 .08 -.19 .16 r2 .07 .10 .02 .01 .04 .02 p .107 .056 .443 .645 .244 .360 _____________________________________________________________________________ Note. BIS = bispectral index; SpO2 = saturation of peripheral oxygen; ETCO2 = end tidal carbon dioxide aOnly 36 subjects were used to calculate all correlation and p values for absent ETCO2 due to no ETCO2 monitoring by one anesthesia provider in three patients. *p < .05 number representing the difference between the groups' mean ranks to determine if the
samples are likely to be from the same group (Lomax, 1998; Norman, 1999). For
clarification, the calculated Kruskal-Wallis number is not the value that is cardinal to a
researcher's assessment of gross differences in data sets; actually, it is the derived p
value. If significance is found in the difference between the groups' mean ranks, the null
hypothesis (i.e., the mean rank values in each group are the same) can be rejected,
suggesting there is a difference between at least two of the groups (Norman, 1999; Petrie
& Sabin, 2000). Therefore, significance demonstrated for this test (p = .037) implies
there is a difference between at least two of the following groups: PS I, II, and III (see
Figure 17).
Additionally, the Kruskal-Wallis test was used to compare the survey respondents'
years of experience with providing anesthesia for colonoscopies to BIS values, absent
ETCO2 waveforms, and SpO2 values. Years of experience with colonoscopies was
categorized into four intervals (i.e., 0-2, 3-5, 6-10, and > 10 years). No statistical

79
Figure 17. Bar graph demonstrating the mean patients' lowest BIS value observed throughout the procedure for each Physical Status classification. The population standard deviation is represented by the error bars. Kruskal-Wallis statistic = 6.58. p = .037. BIS = bispectral index. * p < .05 significance, determined by p < .05, was demonstrated for any variables when compared
to the anesthesia providers' experience with colonoscopies (see Table 8). Thus, the null
hypothesis (i.e., the mean rank values in each group are the same) cannot be rejected, in
that there is no apparent difference among the various years of experience groups (i.e., 0-
2, 3-5, 6-10, and > 10 years) when being compared to each dependent variable (e.g.,
lowest BIS, minutes of BIS ≤ 60). In addition, these tests results should be viewed with
caution due to the small sample size of the four categories used (Norman, 1999).
Table 8 Summary of Survey Respondents' Years of Experience Providing Anesthesia for Colonoscopies
Kruskal-Wallis
test
Years of experience
versus lowest
BIS
Years of experience
versus minutes BIS ≤ 60
Years of experience
versus minutes BIS ≤ 40
Years of experience
versus minutes BIS ≤ 20
Years of experience
versus minutes
SpO2 ≤ 90
Years of experience
versus minutes of
absent ETCO2
a
Statistic 2.76 5.26 1.61 4.76 0.45 0.65 p .252 .072 .446 .092 .800 .722 _______________________________________________________________________________ Note. BIS = bispectral index; SpO2 = saturation of peripheral oxygen; ETCO2 = end tidal carbon dioxide aOnly 36 subjects were used to calculate all correlation and p values for absent ETCO2 due to no ETCO2 monitoring by one anesthesia provider in three patients. *p < .05
0
10
20
30
40
50
1 2 3
Lowest BIS
Physical Status

80
CHAPTER FIVE: DISCUSSION
The purpose of this study was to evaluate sedation levels via BIS monitoring in
patients undergoing colonoscopies. Moderate sedation is defined as a drug-induced
depression of consciousness during which patients respond purposefully to verbal
command (with or without light tactile stimulation) and are able to maintain a patent
airway without intervention, sustain adequate spontaneous ventilation, and usually
maintain their cardiovascular function (ASA, 2009); and according to the ASGE, this
level of sedation is common and considered adequate for colonoscopy procedures
(ASGE, Standards of Practice Committee, 2008). In addition, some studies have shown
that a BIS value of 80 correlates with what has been described as an “ideal” level of
sedation for colonoscopies (Bell et al., 2004; Bower et al., 2000). We hypothesized that
levels of sedation in patients receiving anesthesia for colonoscopy procedures are deeper
than what is suspected or intended. A convenience sample of 39 patients having
colonoscopies performed in a hospital-based outpatient setting and undergoing sedation
with propofol, were included in this observational study. Propofol was administered via
intermittent boluses in 37 out of 39 (94.9%) patients and by bolus followed with infusion
in 2 out of 39 (5.1%) patients; no patient received fentanyl or midazolam. It was found
that 100% (39/39) of patients reached levels of GA at some point during their procedure.
The amount of time patients spent at this level of anesthesia ranged from 11.1-100% of
their procedure. This range was surprising in that during the study all patients were found
to be consented for IV GA. The variables that showed a significant correlation with the
occurrence of GA (i.e., BIS ≤ 60) were smaller BMI (p = 0.008), length of procedure (p <
0.001), with longer procedures correlating with more time spent in GA, and the number
81 of minutes with absent ETCO2 (i.e., apnea) waveform (p = .002). Additionally, data
analysis suggested that patients with a larger BMI (compared to patients with lower
BMIs) were more likely to have the greatest nadir in recorded BIS value (see Figure 14).
Similarly, the r values suggest the greater the BMI, the fewer number of minutes patients
experienced BIS values ≤ 60 and ≤ 40 (see Figures 15 and 16). Thus, overall in our
study, patients with larger BMIs tended to exhibit higher BIS values. Studies involving
BIS with this endoscopic patient population where anesthesia services are provided have
not been previously performed.
Closed claims analysis of anesthesia injuries has shown that 10% of all allegations
since 2000 have included “MAC” sedation (Metzner, Posner, Lam, & Domino, 2011).
Since 1990, over 40% of all claims involving MAC sedation resulted in death or
permanent brain damage. Respiratory complications following “over sedation” with
opioids or other sedative drugs was contributory in 21% of these cases, and it was shown
that over half could have been prevented with better monitoring, such as continuous
ETCO2 and pulse oximetry (Bhananker et al., 2006). Of note, the ASA in 2011(a) stated
that all patients receiving “anesthesia” should have oxygenation, ventilation, and
circulation monitored, and that body temperature should also be assessed if clinically
significant changes are anticipated. Furthermore, deep sedation is defined as a drug-
induced depression of consciousness during which patients cannot be easily aroused but
can respond purposefully to repeated or painful stimulation; independent ventilatory
function may be impaired, airway assistance may be required to maintain airway patency,
and spontaneous ventilation may be inadequate, but cardiovascular function is usually
maintained. Reaching deep levels of sedation during MAC with IV sedation can lead to

82 respiratory complications (ASA, 2009; Bell et al., 2004; El Chafic et al., 2012; Hata et
al., 2009; Patel et al., 2005; Soto et al., 2005). Noteworthy in our study was that severe
respiratory complications (i.e., those requiring advanced airway interventions, such as
placement of an LMA or ETT) were not observed, regardless of the sedation level.
However, our sample size was small, and one of the limitations of the study was that it
only included patients scheduled for elective colonoscopies. We recommend future
studies to include the monitoring of sedation levels in patients consented for MAC with
IV sedation for other types of procedures, including those in outpatient centers as well as
in hospitals.
Largely, our data indicated that administration of propofol for elective
colonoscopies by anesthesia providers results in GA (100% experienced GA for at least 1
minute). In this study, no harmful adverse events were observed (e.g., respiratory or
cardiac arrest, unresolved hypotension or hypoxia, aspiration resulting in admission to the
hospital). We suspect this was because 50% (6/12) of the anesthesia providers indicated
via a survey (see Appendix H) that they believed they would be delivering GA
throughout the entire procedure, and all providers (including those that did not believe
they would be administering GA) were skilled in the management of GA; this
demonstrates that it is probably safe for GA to occur during an elective colonoscopy by
an anesthesia provider.
Hypoxia (i.e., SpO2 < 90%) can be a complication that occurs with deeper levels
of sedation (Bell et al., 2004; El Chafic et al., 2012; Hata et al., 2009; Patel et al., 2005;
Soto et al., 2005). Several chin lifts were witnessed in response to hypoxia (SpO2 < 90%)
and apnea (absence of ETCO2 waveform) throughout the data collection period, and

83 surprisingly some anesthesia providers were observed administering a chin lift without
physiological evidence of the need for this action. Therefore, the number of chin lifts
that were required to maintain a patent airway could not be accurately determined, and
this could explain why an absent ETCO2 waveform (i.e., apnea) was shown to have a
significant correlation with IV GA, but not the number of minutes patients had a SpO2 ≤
90% (i.e., desaturation). Furthermore, one patient required a jaw thrust after a chin lift
was not effective and another patient was believed to have had a laryngospasm following
possible aspiration of secretions. This latter patient had a decrease in SpO2 to 87% for 1
minute followed by a fall to 84% for a duration of 2 minutes. Simultaneously, this
patient was coughing and gagging, and subsequently, required suctioning. Return to
baseline SpO2 occurred within 1 minute after suctioning. No patients required advanced
airway interventions, such as placement of a nasopharyngeal airway, oropharyngeal
airway, face mask, non-rebreather mask, bag mask, LMA, or endotracheal tube. Of note,
20.5% (8/39) of patients in our study were found to be current smokers. However, no
patients were documented as using oxygen at home, and none had a history of previous
airway surgery or known serious respiratory comorbidities (e.g., obstructive sleep apnea,
emphysema, lung cancer, pulmonary hypertension).
Six patients experienced hypoxia for at least 1 minute and three patients for at
least 2 minutes. Of the three patients with at least 2 minutes of hypoxia, two had a
decrease in SpO2 to 84% for at least 1 minute each. All except one of the patients with at
least 2 minutes of hypoxia had no ETCO2 waveform at the time of hypoxia, and each of
them required a chin lift or jaw thrust to improve their SpO2 and achieve an ETCO2
waveform on the monitor. Out of a total of 656 minutes of data recorded for all 39

84 patients, a total of 51 minutes of absent ETCO2 (7.9%) was noted (see Figure 2).
Propofol was the only drug used for sedation during all of the colonoscopies from which
this data was obtained. The frequency of hypoxia, absence of an ETCO2 waveform, or
both, that required airway intervention in this study, demonstrates that administering
propofol in the absence of an anesthesia provider could be unsafe.
There is a predicted increase, by 2015, in anesthesia professionals delivering
sedation for over 50% of all colonoscopies (Inadomi et al., 2010). However, in some
endoscopy centers across the United States, nurses administer propofol sedation for
endoscopy under the direction of a gastroenterologist. This practice is advocated by
some who maintain that MAC with IV sedation does not result in an increased safety for
routine endoscopic procedures in average-risk patients (Rex et al., 2009). As mentioned
previously, we obtained one preoperative BIS value and then began recording BIS values
every minute starting just after the first BP was taken in the endoscopy suite. However,
with some cases, several minutes would pass before the endoscopist team was ready for
the start of the colonoscopy and before sedation was administered; this delay necessitated
the elimination of recorded BIS values during this interval. Therefore, only BIS values
documented from the onset of the endoscopic procedure - within 1 to 3 minutes after the
initial propofol bolus in most patients - were used for statistical analysis. Out of a total of
674 recorded BIS values, 512 (76%) were ≤ 60 (i.e., GA). This indicates that after the
first bolus of propofol (dose not recorded on anesthesia record) most patients reached GA
and remained at a GA level of sedation for the majority of their procedure. Therefore, it
is possible that nurses who provide sedation with propofol during endoscopy procedures
may unknowingly achieve a general anesthetic state, which is not in adherence to current

85 recommendations from the ASA (2011b) and Hospira (2009). There have been two
studies evaluating nurse-administered propofol sedation (Drake et al., 2006; El Chafic et
al., 2012). Of note, during the Drake et al. study, all patients were administered an initial
40 mg propofol bolus followed by incremental boluses of 10-20 mg, with a total average
rate of 15.8-17.2 mg/min; however, the study from El Chafic et al. did not provide the
average doses of propofol administered, and neither study specifically evaluated the level
of sedation produced via BIS monitoring. Our study was limited to sedation administered
by anesthesia personnel in patients consenting for IV GA. Since patients were consented
for GA, it is possible the anesthesia providers did not intend to maintain a lighter level of
sedation during any portion of the colonoscopy procedures. We recommend a future
study using similar methodology to evaluate nurse-administered propofol sedation.
Since GA occurs frequently with sedation for colonoscopies, and given the pre-
study clinical observation and literature finding of colonoscopy patients being
increasingly consented for MAC with IV sedation (Cohen & Benson, 2009; Cohen et al.,
2006; Inadomi et al., 2010; Rex, 2011; Siddiqui, Shafiq, & Asghar, 2012; Trummel,
2007), a closer look at informed consent practices may be needed. MAC was defined in
2008 by the ASA as including varying levels of sedation, but when consciousness and the
ability to respond purposefully is lost, GA is said to have occurred. If patients are
receiving GA, but are consenting for MAC with IV sedation or simply “MAC”, then their
informed consent would not accurately reflect the level of sedation actually obtained.
Anesthesia consent forms presented to patients typically include the type of anesthesia to
be administered (e.g., IV GA, MAC with possible GA, MAC with IV sedation, moderate
sedation).

86 Survey responses from our study indicated that only one anesthesia provider
believed they were delivering MAC 100% of the time, and 5 providers believed they
were administering a combination of a MAC anesthetic and GA. The remaining 50%
(6/12) believed they were administering GA throughout 100% of the procedure (see
Figure 5); however, responses may have been influenced by the fact that all patients
undergoing elective colonoscopies at this one hospital were consented for IV GA. It is
likely anesthesia departments that opt to consent patients for IV GA may recognize the
potential medical-legal concerns with obtaining consent for a different level of sedation
than is actually being provided. The guidelines for obtaining informed consent are clear
in that patients must understand the risks and benefits of the prescribed treatment as well
as alternative approaches (e.g., GA, MAC with IV sedation) before giving his or her
consent (Berg et al., 2001; K. Feld & A. Feld, 2010). Understandably, there is an
increased risk for adverse events with deeper levels of sedation, and those risks should be
disclosed when obtaining informed consent for any procedure, including colonoscopies.
Furthermore, it is generally known that there is a high incidence of litigation in healthcare
(U.S. Department of Health and Human Services, 2003), which further emphasizes the
necessity of obtaining an appropriate consent by anesthesia providers. In addition,
adequate informed consent can assist jurors in deciding the validity of some allegations
(Sanford, 2006).
National health care reform is in the process of being implemented and revised.
As such, the secondary changes to Medicare that may ensue remains uncertain, including
the impact on reimbursement for anesthesia services. The future changes to Medicare
reimbursements are important because Medicaid and other large private insurers often

87 follow Medicare policies (Rohlfsen & Sullivan, 2006). In regards to reimbursement
requirements, the CMS (2011a) requires during MAC procedures, close monitoring of the
patient, since GA may be required for the treatment of adverse events (e.g., excessive
pain, difficulty breathing, adverse reactions), and because of the potential for other
unanticipated complications, such as a more extensive procedure with necessary
anesthetic interventions. Furthermore, the CMS (2011a) requirements for MAC and GA
include the following: performance and documentation of pre and post-anesthetic
evaluations, formation of an anesthetic plan, completion of an anesthesia record, and
administration of necessary medications. If all of these requirements are met with MAC
procedures, reimbursement is stated to be the “same amount as allowed for full GA”
(CMS, 2011a). However, this CMS reimbursement policy could understandably change
with the recent implementation of the Affordable Care Act.
This study has confirmed that GA occurs frequently during elective colonoscopies
in patients who are consented for GA; therefore it is probable that GA also occurs with
other endoscopic procedures in patients who are consented for MAC or MAC with IV
sedation when similar doses of propofol are used. Thus, this study may help provide
noteworthy clinical data during the current implementation of health care reform; for
modifying existing billing procedures (that may change) for colonoscopies that are
commonly scheduled for a MAC anesthetic but may actually be performed under GA.
As stated earlier, it is important to note that all participants in this study were
consented for IV GA, not MAC or MAC with IV sedation. The investigators recognize
the limitation this places on the external validity of this study, and recommend that future
studies include patients consented for MAC or MAC with IV sedation.

88 In conclusion, this study evaluated sedation levels via BIS monitoring during
elective colonoscopy procedures when propofol sedation was administered by an
anesthesia provider. All patients received sedation levels equivalent to GA during their
procedure. Factors that correlated with greater time spent in GA were smaller BMI,
longer length of the procedure, and minutes with an absent ETCO2 waveform.
Additionally, the lowest BIS value obtained throughout the entire procedure was greater
in those patients with a higher BMI. The frequency of apnea correlated with length of
procedure, but these findings were clinically insignificant since they did not result in a
sustained decrease in SpO2 for any patient. Serious complications (e.g., unresolved
hypoxia, cardiac arrest, CVA, death) did not occur during the conduction of this study,
and no relationship was found between the survey respondents' number of years as an
anesthesia provider or years of experience with colonoscopies when compared to BIS
values, absent ETCO2 waveforms, or SpO2 values (see Tables 7 and 8). The results of
this study indicate, in patients scheduled for colonoscopies who are consented for IV GA,
it is common for anesthesia providers to consistently deliver a level of sedation
concordant with GA. The significance of this finding relates to the pre-study clinical
observation, that endoscopic patients being consented for anesthesia designated as MAC
with IV sedation actually demonstrate intraoperative signs of GA similar to what were
observed in this study. Future studies are warranted to determine the frequency of the
various forms of anesthesia consent obtained for elective colonoscopies, along with
research that assesses anesthetic depth with BIS monitoring in patients consented for
MAC with IV sedation. Such research would help to further enhance patient safety and
address potential medical legal concerns.

89
REFERENCES
Abenstein, J. P. (2009). Is BIS monitoring cost-effective? Conference Proceedings:
Annual International Conference of the IEEE Engineering in Medicine & Biology
Society, 7041-7044. doi:10.1109/IEMBS.2009.5333305
Aetna. (2007). Clinical policy for monitored anesthesia care (MAC) for GI endoscopy.
Retrieved from http://www.rcmclean.com/pop_letter_aetnaMAC.html
American Society for Gastrointestinal Endoscopy. (2007). Colonoscopy remains the most
effective screening option for colon cancer. Retrieved from
http://www.asge.org/press/press.aspx?id=3800
American Society for Gastrointestinal Endoscopy, Standards of Practice Committee.
(2008). Sedation and anesthesia in GI endoscopy. Gastrointestinal Endoscopy,
68(2), 205-216. doi:10.1016/j.gie.2008.06.002
American Society of Anesthesiologists. (2009). Continuum of depth of sedation:
Definition of general anesthesia and levels of sedation/analgesia. Retrieved from
http://www.asahq.org/For-Members/Standards-Guidelines-and-Statements.aspx
American Society of Anesthesiologists. (2011a). Standards for basic anesthetic
monitoring. Retreived from http://www.asahq.org/For-Members/Standards-
Guidelines-and-Statements.aspx
American Society of Anesthesiologists. (2011b). Statement on granting privilages for
administration of moderate sedation to practitioners who are not anesthesia
professionals. Retrieved from http://www.asahq.org/For-Members/Standards-
Guidelines-and-Statements.aspx

90 American Society of Anesthesiologists. (2013). Position on monitored anesthesia care.
Retrieved from http://www.asahq.org/For-Members/Standards-Guidelines-and-
Statements.aspx
American Society of Anesthesiologists, Task Force on Sedation and Analgesia by Non-
Anesthesiologists. (2002). Practice guidelines for sedation and analgesia by non-
anesthesiologists. Anesthesiology, 96(4), 1004-1017. Retrieved from
http://journals.lww.com/anesthesiology/toc/2002/04000
Amzica, F. (2009). Basic physiology of burst-suppression [Supplemental material].
Epilepsia, 50, 38-39. doi:10.1111/j.1528-1167.2009.02345.x
Anderson, R., & Jakobsson, J. (2006). Cerebral state monitor, a new small handheld EEG
monitor for determining depth of anaesthesia: A clinical comparison with the
bispectral index during day-surgery. European Journal Of Anaesthesiology,
23(3), 208-212. doi:10.1017/S0265021505002206
Arrowsmith, J. B., Gerstman, B. B., Fleischer, D. E., & Benjamin, S. B. (1991). Results
from the American Society for Gastrointestinal Endoscopy/U.S. Food and Drug
Administration collaboration study on complication rates and drug use during
gastrointestinal endoscopy. Gastrointestinal Endoscopy, 37(4), 421-427.
doi:http://0-dx.doi.org.wncln.wncln.org/10.1016/S0016-5107(91)70773-6
Avidan, M. S., Jacobsohn, E., Glick, D., Burnside, B. A., Zhang, L., Villafranca, A., . . .
Mashour, G. A. (2011). Prevention of intraoperative awareness in a high-risk
surgical population. The New England Journal of Medicine, 365(7), 591-600.
Retrieved from http://dx.doi.org/10.1056/NEJMoa1100403

91 Avidan, M. S., Zhang, L., Burnside, B. A., Finkel, K. J., Searleman, A. C., Selvidge, J.
A., . . . Evers, A. S. (2008). Anesthesia awareness and the Bispectral Index. The
New England Journal of Medicine, 358(11), 1097-1108. Retrieved from
http://dx.doi.org/10.1056/NEJMoa0707361
Bang, Y-S., Park, C., Lee, S-Y., Kim, M., Lee, J., & Lee, T. (2013). Comparison between
monitored anesthesia care with remifentanil under ilioinguinal hypogastric nerve
block and spinal anesthesia for herniorrhaphy. Korean Journal of Anesthesiololgy,
64(5), 414-419. Retrieved from http://dx.doi.org/10.4097/kjae.2013.64.5.414
Behrens, A., Labenz, J., Schuler, A., Schroder, W., Runzi, M., Steinmann, R., . . . Ell, C.
(2013). How safe is sedation in gastrointestinal endoscopy? A multicentre
analysis of 388,404 endoscopies and analysis of data from prospective registries
of complications managed by members of the working group of leading hospital
gastroenterologists (ALGK). Zeitschrift Fur Gastroenterologie, 51(5), 432-436.
Bell, J. K., Laasch, H. U., Wilbraham, L., England, R. E., Morris, J. A., & Martin, D. F.
(2004). Bispectral index monitoring for conscious sedation in intervention: Better,
safer, faster. Clinical Radiology, 59, 1106-1113. doi:10.1016/j.crad.2004.04.008
Berg, J. W., Appelbaum, P. S., Lidz, C. W., & Parker, L. S. (2001). Informed consent:
Legal theory and clinical practice (2nd ed.). New York, NY: Oxford University
Press Inc.
Bernat, J. L., & Peterson, L. M. (2006). Patient-centered informed consent in surgical
practice. Archives of Surgery, 141(1), 86-92. Retrieved from
http://archsurg.jamanetwork.com/
92 Bhananker, S. M., Posner, K. L., Cheney, F. W., Caplan, R. A., Lee, L. A., & Domino,
K. B. (2006). Injury and liability associated with monitored anesthesia care.
Anesthesiology, 104(2), 228-234. Retrieved from http://www.anesthesiology.org
Biddle, C. (2013). Randomized controlled trials and nonrandomized observational
studies. In Evidence Trumps Belief (2nd ed.) (pp. 39-45). Park Ridge, IL:
American Association of Nurse Anesthetists.
Black, N. (1996). Why we need observational studies to evaluate the effectiveness of
health care. British Medical Journal, 312(7040), 1215-1218. Retrieved from
http://www.ncbi.nlm.nih.gov/pmc/articles/PMC2350940/
Bower, A. L., Ripepi, A., Dilger, J., Boparai, N., Brody, F. J., & Ponsky, J. L. (2000).
Bispectral index monitoring of sedation during endoscopy. Gastrointestinal
Endoscopy, 52(2), 192–196. doi:10.1067/mge.2000.107284
Bruhn, J., Bouillon, T. W., Radulescu, L., Hoeft, A., Bertaccini, E., & Shafer, S. L.
(2003). Correlation of approximate entropy, bispectral index, and spectral edge
frequency 95 (SEF95) with clinical signs of "anesthetic depth" during
coadministration of propofol and remifentanil. Anesthesiology, 98(3), 621-627.
Retrieved from
http://journals.lww.com/anesthesiology/Fulltext/2003/03000/Correlation_of_Appr
oximate_Entropy,_Bispectral.8.aspx
Centers for Medicare & Medicaid Services. (2011a). Medicare fee schedule, payment and
reimbursement benefit guideline, CPT code billing. Retrieved from
http://www.medicarepaymentandreimbursement.com/2011/08/monitored-
anesthesia-care-cpt-code-list.html

93 Centers for Medicare & Medicaid Services. (2011b). State operations provider
certification: Revised appendix A, interpretive guidelines for hospitals (CMS
Publication No. 100-07). Retrieved from https://www.cms.gov/Regulations-and-
Guidance/Guidance/Transmittals/downloads/R74SOMA.pdf
Charlton, J. E. (1995). Monitoring and supplemental oxygen during endoscopy. British
Medical Journal, 310(6984), 886-887. Retrieved from http://0-
www.jstor.org.wncln.wncln.org/stable/29726875
Cohen, L. B., & Benson, A. A. (2009). Issues in endoscopic sedation. Gastroenterology
& Hepatology, 5(8), 565-570. Retrieved from
http://www.ncbi.nlm.nih.gov/pmc/articles/PMC2886410/
Cohen, L. B., DeLegge, M. H., Aisenberg, J., Brill, J. V., Inadomi, J. M., Kochman, M.
L., & Piorkowski, J. D. Jr. (2007). American Gastroenterological Association
institute review of endoscopic sedation. Gastroenterology, 133(2), 675-701.
Retrieved from http://0-dx.doi.org.wncln.wncln.org/10.1053/j.gastro.2007.06.002
Cohen, L. B., Hightower, C. D., Wood, D. A., Miller, K. M., & Aisenberg, J. (2004).
Moderate level sedation during endoscopy: A prospective study using low-dose
propofol, meperidine/fentanyl, and midazolam. Gastrointestinal Endoscopy,
59(7), 795-803. doi: 10.1016/S0016-5107(04)00349-9
Cohen, L. B., Wecsler, J. S., Gaetano, J. N., Benson, A. A., Miller, K. M., Durkalski, V.,
& Aisenberg, J. (2006). Endoscopic sedation in the United States: Results from a
nationwide survey. American Journal of Gastroenterology, 101(5), 967-974. doi:
10.1111/j.1572-0241.2006.00500.x

94 Cooper, G. S., Kou, T. D., & Rex, D. K. (2013). Complications following colonoscopy
with anesthesia assistance: A population-based analysis. JAMA Internal Medicine,
173(7), 551-556. doi:10.1001/jamainternmed.2013.2908
Cortínez, L. I., Delfino, A. E., Fuentes, R., & Muñoz, H. R. (2007). Performance of the
cerebral state index during increasing levels of propofol anesthesia: A comparison
with the bispectral index. Anesthesia & Analgesia, 104(3), 605-610.
doi:10.1213/01.ane.0000255152.96354.17
Coste C., Guignard B., Menigaux C., & Chauvin, M. (2000). Nitrous oxide prevents
patient movement during orotracheal intubation without affecting BIS value.
Anesthesia & Analgesia, 91(1), 130-135. Retrieved from
http://journals.lww.com/anesthesia-
analgesia/Fulltext/2000/07000/Nitrous_Oxide_Prevents_Movement_During_Orot
racheal.24.aspx
Covidien. (2011). Operating manual addendum: BISTM complete monitoring system.
Mansfield, MA: Covidien Ireland Limited.
Drake, L. M., Chen, S. C., & Rex, D. K. (2006). Efficacy of bispectral monitoring as an
adjunct to nurse administered propofol sedation for colonoscopy: A randomized
controlled trial. The American Journal of Gastroenterology, 101, 2003-2007.
doi:10.1111/j.1572-0241.2006.00806.x
Doufas, A. G., Bakhshandeh, M., Haugh, G. S., Bjorksten, A. R., Greif, R., Sessler, D. I.
(2003). Automated responsivesness test and bispectral index monitoring during
propofol and propofol/N2O sedation. Acta Anaesthesiologica Scandinavica, 47,
951-957. Retrieved from http://0-

95
ehis.ebscohost.com.wncln.wncln.org/eds/pdfviewer/pdfviewer?sid=1b3c2246-
1652-49bb-8b2d-bbb11d54c4ac%40sessionmgr15&vid=13&hid=4
Ekman, A., Lindholm, M. L., Lennmarken, C., & Sandin, R. (2004). Reduction in the
incidence of awareness using BIS monitoring. Acta Anaesthesiologica
Scandinavica, 48, 20-26. Retrieved from http://dx.doi.org/10.1111/j.1399-
6576.2004.00260.x
El Chafic, A. H., Eckert, G., & Rex, D. K. (2012). Prospective description of coughing,
hemodynamic changes, and oxygen desaturation during endoscopic sedation.
Digestive Diseases and Sciences, 57, 1899-1907. doi:10.1007/s10620-012-2057-z
Feld, A. D. (2008). Endoscopic sedation: Medicolegal considerations. Gastrointestinal
Endoscopy Clinics of North America, 18, 783-788.
doi:10.1016/j.giec.2008.06.009
Feld, K. A., & Feld, A. D. (2010). Risk management and legal issues for colonoscopy.
Gastrointestinal Endoscopy Clinics of North America, 20, 593-601. doi:
10.1016/j.giec.2010.07.002
Froehlich, F., Thorens, J., Schwizer, W., Preisig, M., Köhler, M., Hays, R. D., . . .
Gonvers, J.-J. (1997). Sedation and analgesia for colonoscopy: Patient tolerance,
pain, and cardiorespiratory parameters. Gastrointestinal Endoscopy, 45(1), 1-9.
Retrieved from http://0-
www.sciencedirect.com.wncln.wncln.org/science/article/pii/S0016510797702955
#
Ge, S. J., Zhuang, X. L., Wang, Y. T., Wang, Z. D., & Li, H. T. (2002). Changes in the
rapidly extracted auditory evoked potentials index and the bispectral index during

96
sedation induced by propofol or midazolam under epidural block. British
Journal of Anaesthesia, 89(2), 260-264. Retrieved from http://0-
bja.oxfordjournals.org.wncln.wncln.org/content/89/2/260.full.pdf+html
Ghoneim, M. M. (2001). Nitrous oxide effects on EEG and awareness. Bailliere’s Best
Practice in Clinical Anesthesiology, 15(3), 397-407. doi:10.1053/bean.2001.0169
Hans, P., Dewandre, P. Y., Brichant, J. F., & Bonhomme, V. (2005). Comparative effects
of ketamine on bispectral index and spectral entropy of the electroencephalogram
under sevoflurane anaesthesia. British Journal of Anaesthesia, 94(3), 336-340.
doi:10.1093/bja/aei047
Hata, K., Andoh, A., Hayafuji, K., Ogawa, A., Nakahara, T., Tsujikawa, T., … Saito, Y.
(2009). Usefulness of bispectral monitoring of conscious sedation during
endoscopic mucosal dissection. World Journal of Gastroenterology, 15(5), 595-
598. doi: http://dx.doi.org/10.3748/wjg.15.595
Hatcher, L. (2003). Bivariate correlation. In Step-by-step basic statistics using SAS®:
Student guide (pp. 290-338) [Adobe Digital Editions version]. Retrieved from
http://0-
web.a.ebscohost.com.wncln.wncln.org/ehost/ebookviewer/ebook/bmxlYmtfXzEx
NzM2Nl9fQU41?sid=6336ea4b-3f55-4038-967f-
ce9c6f0882ce@sessionmgr4003&vid=17&format=EB&rid=1
Hospira. (2009). Propofol injectible emulsion 1%. Retrieved from
http://www.hospira.com/products_and_services/drugs/PROPOFOL_INJECTABL
E_EMULSION

97 Inadomi, J. M., Gunnarsson, C. L., Rizzo, J. A., & Fang, H. (2010). Projected
increased growth rate of anesthesia professional-delivered sedation for
colonoscopy and EGD in the United States: 2009-2015. Gastrointestinal
Endoscopy, 72, 580-586. doi: 10.1016/j.gie.2010.04.040
Iravani, S., Frootan, M., Zojaji, H., Azizi, M., Saeedi, S., Hashemi, M.R., & Azimzadeh,
P. (2012). Effect of general anesthesia during GI endoscopic procedures on
patient satisfaction. Gastroenterology and Hepatology From Bed to Bench, 5,
S20-S25. Retrieved from http://0-
search.ebscohost.com.wncln.wncln.org/login.aspx?direct=true&db=a9h&AN=75
167592&site=eds-live&scope=site
Jensen, E., Litvan, H., Revuelta, M., Rodriguez, B., Caminal, P., Martinez, P., ... Struys,
M. (2006). Cerebral state index during propofol anesthesia: A comparison with
the bispectral index and the A-line ARX index. Anesthesiology, 105(1), 28-36.
Retrieved from
http://journals.lww.com/anesthesiology/Fulltext/2006/07000/Cerebral_State_Inde
x_during_Propofol_Anesthesia__A.9.aspx
Johansen, J. W. (2006). Update on bispectral index monitoring. Best Practice and
Research Clinical Anesthesiology, 20(1), 81-99. doi: 10.1016/j.bpa.2005.08.004
Kearse, L. A., Rosow, C., Zaslavsky, A., Connors, P., Dershwitz, M., Denman, W.
(1998). Bispectral analysis of the electroencephalogram predicts conscious
processing of information during propofol sedation and hypnosis. Anesthesiology,
88(1), 25-34. Retrieved from

98
http://journals.lww.com/anesthesiology/Fulltext/1998/01000/Bispectral_Analys
is_of_the_Electroencephalogram.7.aspx
Kelley, S. D. (2010). Monitoring consciouness using bispectral index during anesthesia:
A pocket guide for clinicians. (2nd ed). Boulder, CO: Covidien.
Leslie, K., Absalom, A., & Kenny, G. N. C. (2002). Closed loop control of sedation for
colonoscopy using the bispectral index. Anaesthesia, 57(7), 690-709. Retrieved
from http://0-
search.ebscohost.com.wncln.wncln.org/login.aspx?direct=true&db=a9h&AN=68
03786&site=ehost-live&scope=site
Liu, H., Waxman, D. A., Main, R., & Mattke, S. (2012). Utilization of anesthesia services
during outpatient endoscopies and colonoscopies and associated spending in
2003-2009. JAMA, 307(11), 1178-1184. doi: 10.1001/jama.2012.270
Liu, J., Singh, H., & White, P. F. (1997). Electroencephalographic bispectral index
correlates with intraoperative recall and depth of propofol-induced sedation.
Anesthesia & Analgesia, 84(1), 185-189. Retrieved from
http://journals.lww.com/anesthesia-
analgesia/Fulltext/1997/01000/Electroencephalographic_Bispectral_Index.33.asp
x
Liu, S. S. (2004). Effects of Bispectral Index monitoring on ambulatory anesthesia: A
meta-analysis of randomized controlled trials and a cost analysis. Anesthesiology,
101(2), 311-315. Retrieved from
http://journals.lww.com/anesthesiology/Fulltext/2004/08000/Effects_of_Bispectra
l_Index_Monitoring_on.10.aspx

99 Lomax, R. G. (1998). One-factor analysis of variance: Fixed-effects model. In
Statistical concepts: A second course for education and the behavioral sciences
(pp. 87-124) [Adobe Digital Editions version]. Retrieved from http://0-
web.a.ebscohost.com.wncln.wncln.org/ehost/ebookviewer/ebook/bmxlYmtfXzI0
MjcxX19BTg2?sid=6336ea4b-3f55-4038-967f-
ce9c6f0882ce@sessionmgr4003&vid=11&format=EB&rid=2
McCloy, R. (1992). Asleep on the job: Sedation and monitoring during endoscopy.
Scandinavian Journal of Gastroenterology, 27(s192), 97-101.
doi:10.3109/00365529209095987
Metzner, J., Posner, K., Lam M., & Domino, K. (2011). Closed claims' analysis. Best
Practice & Research Clinical Anaesthesiology, 25(2), 263-276.
doi:10.1016/j.bpa.2011.02.007
Myles, P. S., Williams, D. L., Hendrata, M., Anderson, H., & Weeks, A. M. (2000).
Patient satisfaction after anaesthesia and surgery: results of a prospective survey
of 10,811 patients. British Journal of Anaesthesia, 84(1), 6-10. Retrieved from
http://dx.doi.org/10.1093/oxfordjournals.bja.a013383
National Center for Health Statistics. (2013). Health, United States, 2012: With special
feaures on emergency care. (DHHS Publication No. 2013-1232). Hyattsville,
MD: U.S. Government Printing Office.
Nelson, D. B., Freeman, M. L., Silvis, S. E., Cass, O. W., Yakshe, P. N., Vennes, J., &
Hodges, J. (2000). A randomized, controlled trial of transcutaneous carbon
dioxide monitoring during ERCP. Gastrointestinal Endoscopy, 51(3), 288-295.
Retrieved from http://0-

100
www.sciencedirect.com.wncln.wncln.org/science/article/pii/S0016510700703
579?
Norman, G. R. (1999). Non-parametric statistics. In PDQ Statistics (pp. 79-120) [Adobe
Digital Editions version]. Retrieved from http://0-
web.a.ebscohost.com.wncln.wncln.org/ehost/ebookviewer/ebook/bmxlYmtfXzIy
NDQ5X19BTg2?sid=6336ea4b-3f55-4038-967f-
ce9c6f0882ce@sessionmgr4003&vid=15&format=EB&rid=1
Patel, S., Vargo, J. J., Khandwala, F., Lopez, R., Trolli, P., Dumot, J. A., & Zuccaro, G.
(2005). Deep sedation occurs frequently during elective endoscopy with
meperidine and midazolam. The American Journal of Gastroenterology, 100,
2689-2695. doi: 10.1111/j.1572-0241.2005.00320.x
Petrie, A., & Sabin, C. (2000). Numerical data: More than two groups. In Medical
statistics at a glance (pp. 55-57) [Adobe Digital Editions version]. Retrieved from
http://0-
web.a.ebscohost.com.wncln.wncln.org/ehost/ebookviewer/ebook/bmxlYmtfXzUx
NzQyX19BTg2?sid=6336ea4b-3f55-4038-967f-
ce9c6f0882ce@sessionmgr4003&vid=13&format=EB&rid=1
Petrini, J., & Egan, J. V. (2004). Risk management regarding sedation/analgesia.
Gastrointestinal Endoscopy Clinics of North America, 14, 401-414. doi:
10.1016/j.giec.2004.01.007
Pollard R. J., Coyle, J. P., Gilbert, R. L., & Beck, J. R. (2007). Intraoperative awareness
in a regional medical system. A review of 3 years' data. Anesthesiology, 106(2),
269-274. Retrieved from http://dx.doi.org/10.1097/00000542-200702000-00014

101 Renna, M., Handy, J., & Shah, A. (2003). Low baseline bispectral index of the
electroencephalogram in patients with dementia. Anesthesia and Analgesia, 96(5),
1380-1385. doi:10.1213/01.ANE.0000059223.78879.0F
Rex, D. K. (2011). Effect of the Centers for Medicare & Medicaid services policy about
deep sedation on use of propofol. Annals of Internal Medicine, 154, 622-626. doi:
10.1059/0003-4819-155-6-201109200-00020
Rex, D. K., Deenadayalu, V. P., Eid, E., Imperiale, T. F., Walker, J. A., Sandhu, K., ...
Meah, N. (2009). Endoscopist-directed administration of propofol: A worldwide
safety experience. Gastroenterology, 137(4), 1229-1237.
doi:10.1053/j.gastro.2009.06.042
Rohlfsen, L. S., & Sullivan, D. A. (2006, August). The anesthesia turf battle: Differences
in professional identity and workplace interactions by location of practice. Paper
presented at the annual meeting of the American Sociological Association,
Montreal Convention Center, Montreal, Quebec. Abtract retrieved from
http://citation.allacademic.com/meta/p102840_index.html
Roffey, P., Mikhail, M., & Thangathurai, D. (2000). Ketamine interferes with bispectral
index monitoring in cardiac patients undergoing cardiopulmonary bypass. Journal
of Cardiothoracic and Vascular Anesthesia, 14(4), 494-495.
doi.10.1053/jcan.2000.7978
Sanford, S. R. (2006). Informed consent: The verdict is in. ASA Newsletter, 70(7), 15-16.
Sebel, P. S., Bowdle, T. A., Ghoneim, M. M., Rampil, I. J., Padilla, R. E., Gan, T. J., &
Domino, K. B. (2004). The incidence of awareness during anesthesia: A

102
multicenter United States study. Anesthesia & Analgesia, 99, 833-839.
doi:10.1213/01.ANE.0000130261.90896.6C
Seeff, L. C., Richards, T. B., Shapiro, J. A., Nadel, M. R., Manninen, D. L., Given, L.S.,
& Mckenna, M. T. (2004). How many endoscopies are performed for colorectal
cancer screening? Results from CDC's survey of endoscopic capacity.
Gastroenterology, 127(6), 1670-1677. doi:10.1053/j.gastro.2004.09.051
Sharma, V. K., Nguyen, C. C., Crowell, M. D., Lieberman, D. A., de Garmo, P., &
Fleischer, D. E. (2007). A national study of cardiopulmonary unplanned events
after GI endoscopy. Gastrointestinal Endoscopy, 66(1), 27-34.
doi:10.1016/j.gie.2006.12.040
Shepherd, J., Jones, J., Frampton, G. K., Bryant, J., Baxter, L., & Cooper, K. (2013).
Clinical effectiveness and cost-effectiveness of depth of anaesthesia monitoring
(E-Entropy, Bispectral Index and Narcotrend): A systematic review and economic
evaluation. Health Technology Assessment, 17(34). doi:10.3310/hta17340
Siddiqui, K. M., Shafiq, F., & Asghar, A. (2012). Association of nausea and vomiting in
between anaesthetic or patient factors in monitored anaesthesia care (MAC) after
gastrointestinal endoscopies in tertiary care hospital: An audit. International
Journal of Collaborative Research on Internal Medicine & Public Health, 4(9),
1686-1691. Retrieved from http://0-
ehis.ebscohost.com.wncln.wncln.org/eds/pdfviewer/pdfviewer?vid=2&sid=dd4f3
154-dbf8-4864-88b8-11cef9c147c6%40sessionmgr110&hid=110
Sieber, F. E., Gottshalk, A., Zakriya, K. J., Mears, S. C., & Lee, H. (2010). General
anesthesia occurs frequently in elderly patients during propofol-based sedation

103
and spinal anesthesia. Journal of Clinical Anesthesia, 22, 179-183. doi:
10.1016/j.jclinane.2009.06.005
Silvas, S. E., Nebel, O., Rogers, G., Sugawa, C., & Mandelstam, P. (1976). Results of the
1974 American Society of Gastrointestinal Endoscopy survey. JAMA, 235(9),
928-930. Retrieved from http://0-
search.ebscohost.com.wncln.wncln.org/login.aspx?direct=true&db=mnh&AN=12
8642&site=eds-live&scope=site
Singh, H., Poluha, W., Cheung, M., Choptain, N., Inegbu, E., Baron, K., & Taback, S.P.
(2008). Propofol for sedation during colonoscopy. Cochrane Database of
Systematic Reviews, (4), 1-63. doi:10.1002/14651858.CD006268.pub2
Soto, R. G., Fu, E. S., Smith, R. A., & Miguel, R. V. (2005). Bispectral index® and the
incidence of apnea during monitored anesthesia care. Journal of Ambulatory
Surgery, 12(2), 81-84. doi:10.1016/j.ambsur.2005.08.001
Soto, R. G., Fu, E. S., Vila, H. J., & Miguel, R. V. (2004). Capnography accurately
detects apnea during monitored anesthesia care. Anesthesia and Analgesia, 99(2),
379-382. doi:10.1213/01.ANE.0000131964.67524.E7
Trummel, J. (2007). Sedation for gastrointestinal endoscopy: The changing landscape.
Current Opinion in Anaesthesiology, 20(4), 359-364.
UnitedHealthcare. (2008, February 6). UnitedHealthcar reaffirms coverage of propofol
for use in colonoscopies. Business Wire News Releases. Retrieved from
http://finance.paidcontent.org/paidcontent/news/read/4537591/unitedhealthcare_r
eaffirms_coverage_of_propofol_for_use_in_colonoscopies

104 U.S. Department of Health and Human Services. (2003). Addressing the new health
care crisis: Reforming the medical litigation system to improve the quality of
health care. Retrieved from http://aspe.hhs.gov/daltcp/reports/medliab.pdf
VanNatta, M. E., & Rex, D. K. (2006). Propofol alone titrated to deep sedation versus
propofol in combination with opioids and/or benzodiazepines and titrated to
moderate sedation for colonoscopy. American Journal of Gastroenterology,
101(10), 2209-2217. doi: 10.1111/j.1572-0241.2006.00760.x
Verma, R. K., Paswan, A. K., Prakash, S., Gupta, S. K., Gupta, P. K. (2013). Sedation
with propofol during combined spinal epidural anesthesia: Comparison of dose
requirements of propofol with and without BIS monitoring. Anaesthesia, Pain &
Intensive Care, 17(1), 14-17. Retrieved from http://0-
ehis.ebscohost.com.wncln.wncln.org/eds/pdfviewer/pdfviewer?vid=4&sid=3a217
cf5-1c36-47d7-af44-94e0122c6dc0%40sessionmgr114&hid=116
Whittemore, R., & Grey, M. (2006). Data-Collection methods. In G. LoBiondo-Wood, &
J. Haber, Nursing research: Methods and critical appraisal for evidence-based
practice (6th ed.) (pp. 317-334). St. Louis, MO: Mosby Inc.
Zakko, S. F., Seifert, H. A., & Gross, J. B. (1999). A comparison of midazolam and
diazepam for conscious sedation during colonoscopy in a prospective double-
blind study. Gastrointestinal Endoscopy, 49(6), 684-689. doi: 10.1016/S0016-
5107(99)70282-8

105
APPENDIX A: OBSERVER’S ASSESSMENT OF ALERTNESS/SEDATION (OAA/S)
o 0 = does not respond to noxious stimuli
o 1 = does not respond to mild prodding or shaking
o 2 = responds only after mild prodding or shaking
o 3 = responds only after name is spoken loudly or repeatedly, or both
o 4 = lethargic response to name spoken in a normal tone
o 5 = responds readily to name spoken in a normal tone

106
APPENDIX B: MODIFIED OBSERVER’S ASSESSMENT OF ALERTNESS/SEDATION (MOAA/S)
o 0=unresponsive to deep stimuli
o 1=unresponsive to shaking
o 2=responsive to shaking only
o 3=responsive to loud verbal command
o 4=lethargic response to normal verbal command
o 5=responsive & alert
o 6=agitated
• Deep Sedation defined as ≤1

107
APPENDIX C: RAMSAY SEDATION SCORE (RSS)
o Awake
§ 1. Patient anxious and agitated or restless or both
§ 2. Patient co-operative, orientated and tranquil
§ 3. Patient responds to verbal commands only
o Asleep; response to a light glabellar tap or loud auditory stimulus
§ 4. Brisk response
§ 5. Sluggish response
§ 6. No response
o Interpretation
§ 1: Inadequate sedation
§ 2-4: Acceptable sedation
§ 5-6: Excessive sedation

108
APPENDIX D: PARDEE IRB LETTER

109
APPENDIX E: WCU IRB LETTER

110
APPENDIX F: PATIENT INFORMED CONSENT

111

112
APPENDIX G: ANESTHESIA PROVIDER INFORMED CONSENT

113
APPENDIX H: CRNA SURVEY FORM
Survey of CRNAs participating in Colonoscopies Date: __ /__ /___
CRNA ID: _______ 1. What year did you become a Certified Registered Nurse Anesthetist? ________ 2. Highest degree obtained? (Check one)
Diploma
Bachelors
Masters
Doctoral
3. How many years or months of experience have you had with colonoscopies? (Check one)
0-6 months
7 months – 1 year
1 -2 years
3-5 years
6-10 years
More than 10 years
4. What percentage of colonoscopies do you believe you are providing the following levels of sedation? (Numbers must equal 100%)
• MAC __________
• General Anesthesia __________
• Combination of MAC and General Anesthesia _________

114
APPENDIX I: DATA COLLECTION SHEET

115

116