an evaluation of the clean sleat project
TRANSCRIPT

Towards a Cleaner Sleat
An Evaluation of the Clean Sleat
Project
March 2011
PROJECT TEAM
Emebet Bogale Azanaw, Bernice Mawuli Baku, Kusum Barua
Samrawit Yilma Dererie, Diego Alejandro Distel, Nele Rumler
Arthur Ronald Samuel, Rakesh Yogal Shrestha, Nkusuwila Silomba
Yen Kim Thi Tran, Charity Tushemereirwe, Theoneste Uhorakeye
SUPERVISORS
Prof. Dr. August Schläpfer, Dr. Dieter Klein, Dipl.-Ing. Wulf Boie

i
Acknowledgement
We wish to express our heartfelt gratitude to the individuals and organizations that assisted us
in this study in terms of organization, making contacts and providing the necessary information
to prepare this report.
Our special thanks go to the Sleat Community Trust (SCT) for whom this study was done, for
initiating and supporting us during the research, the Highland Council and Sabhal Mor Ostaig for
providing vital pieces of information needed for this study. We are especially grateful to the
residents of Sleat for their hospitality.
We extend sincere thanks to Angus Robertson, Henry Mains, Duncan MacInnes (Sleat
Renewables Ltd), Dòmhnali Angaidh MacIllinnein (Sabhal Mòr Ostaig) and Phil Dewar
(Highland Council) for their invaluable assistance and tireless effort in making our research
easier.
We appreciate the opportunity given to us to explore the culture of the people of Sleat.
The research team is very grateful to our supervisors from the University of Flensburg, Prof. Dr.
August Schläpfer, Dipl.Ing.Wulf Boie and Dr. Dieter Klein for their moral support, academic
guidance and patience before and during the study.
Last but not the least, we greatly recognize and thank the Deutscher Akademischer Austausch
Dienst (DAAD, German Academic Exchange Service), for its financial support which allowed us
to do this International Class 2011.

i
Executive Summary
This study was done by students of the University of Flensburg/Germany on behalf of the Sleat
Community Trust to follow up the Clean Sleat Project (CSP), which was introduced in 2009 as a
consequence of the ecological footprint study done in 2008 by a group of fellow students from
the same University.
Its objective was to evaluate the aforementioned project in terms of its relevance, effectiveness,
impact and sustainability. Based on its overall objective and the various activities done within
the last 2 years the change in CO2 emissions, the satisfaction of the community with the
services offered, as well as the awareness and attitudes of the Sleat population towards the
problem of carbon dioxide emission were assessed. To find out the CO2 emission reduction, the
savings were related to the project activities. Changes in CO2 emissions that did not relate to
project activities were not considered and therefore a new footprint calculation was not
undertaken.
The same impact areas as in the 2008 study were used, namely Direct Energy, Transportation,
Waste, and Food. In the present study however the water and material sector were not
considered because they were not addressed by Clean Sleat Project activities. The time
boundary of the study is from February, 2008 when the baseline was conducted up to the end of
2010.
The findings in the different sectors are in brief:
Direct Energy
The highest emission reductions could be achieved in the direct energy sector. The CO2
emission reduction in this sector was 336 tonnes which accounts for 70% of the total reduction.
Main reasons for the reduction of the CO2 emissions due to the project activities were the
increase in the use of firewood in households, the substitutions of LPG with woodchips in the
college, the improvement in the house insulations and the installation of energy saving bulbs.
The level of satisfaction of the respondents with the different activities of the CSP was high in
general.

ii
Waste
CSP’s main waste management activities focused on waste recycling and reuse. The project
lobbied with the Highland council to provide Sleat residents with bins in order to reduce the
waste that was being sent to land-fills. These activities contributed 20% of the total CO2
emissions reduction in Sleat. It was found that the degree of awareness increased since 2007
and the amount of recyclable material doubled due to the waste separation.
Transport
The transport sector is the third largest contributor of CO2 emissions in Sleat. The data analysis
from households and providers of public services showed that the replacement of car travels by
bicycle or public transport contributed 9% to the reduction of CO2 emissions. It had also been
noticed that people are more aware of using public transport and bikes in order to reduce their
carbon footprint.
Food
The activities that the Clean Sleat Project conducted in the food sector were lending out a
rotavator and a shredder to promote local production of vegetables and fruit. The number of
households that increased the use of compost and own production of food was assessed. The
CO2 emissions reduction was 0.9 tonnes, which represents 0.2% of the total emissions
reduction.
Overall it can be concluded that the Clean Sleat project was relevant because almost all
activities were seen relevant by the residents. The project contributed to reduce the CO2
emissions in Sleat by 3.3% compared to 2007 (See Table 3-21). This figure shows that the
project was only partly effective because it did not reach its ambitious goal of a 33% reduction in
CO2 emissions. But the 478 tonnes of CO2 which were saved show that it had already a
considerable impact. The largest share of this reduction was through the use of biomass and
woodchips. That shows how important the activities in this area were. The project has also
contributed to raise awareness of the issues of climate change within the community.

iii
Table of Contents
Executive Summary ..................................................................................................................... i
1. Introduction ......................................................................................................................... 1
1.1. Objective of the Clean Sleat Project ............................................................................. 2
1.2. Expected Outcomes of the Clean Sleat Project ............................................................ 2
1.3 Activities of the Clean Sleat Project ............................................................................. 2
1.4 Scope of Work ............................................................................................................. 3
2. Methodology of the Study .................................................................................................... 4
2.1. Approach of the Study ................................................................................................. 4
2.2. Defining the Boundaries of the Study ........................................................................... 5
2.3. Survey Tools ................................................................................................................ 7
2.4. Sampling and Data Collection ...................................................................................... 7
2.4.1. Sample of Number of Households in Sleat ............................................................ 7
2.4.2. Estimated Number of Sleat Residents .................................................................. 9
3. Findings, Analysis and Interpretation ..................................................................................10
3.1. Direct Energy ..............................................................................................................10
3.1.1 Energy Audits and Improvements in Home Insulation ..........................................13
3.1.2 CFL Users ...........................................................................................................17
3.1.3 Stand-by Saver Users ..........................................................................................19
3.1.4 Firewood Use.......................................................................................................22
3.1.4 Solar Water Heater Building Workshop ................................................................28
3.1.5 Impact of the Clean Sleat Project on the Target Areas .........................................30
3.1.6 Respondents Willingness to pay for Products and Services .................................31
3.2. Waste Management in Sleat .......................................................................................33
3.2.1 Waste Carbon Footprint .......................................................................................35
iv
3.2.2 Waste Electrical and Electronic Equipment ..........................................................35
3.2.3 Waste Management Practices in Sleat.................................................................37
3.2.4 Respondents’ Impression on the General Waste Management in Sleat ...............38
3.2.5 Interpretation of Waste Results ............................................................................39
3.2.6 Analysis and Interpretation for School and College ..............................................41
3.2.7 Analysis and Interpretation for Hotels and Small Businesses ...............................43
3.2.8 Waste Carbon Footprint from Institutions, Hotels and Small Business .................45
3.3. Finding and Analysis of Transport Sector ....................................................................46
3.3.1 Methodology ........................................................................................................46
3.3.2 Calculation of Reduction of CO2 Footprint from Transport ....................................46
3.3.3 Major Findings .....................................................................................................47
3.3.4 Interpretation of Findings of the Transport Sector ................................................54
3.4. Food ...........................................................................................................................57
3.4.1 Carbon Footprint Methodology for Food ...............................................................57
3.4.2 Findings and Interpretations .................................................................................58
3.5 Summary of CO2 Savings ..........................................................................................63
4. Scenarios ...........................................................................................................................64
4.1. Green Electricity .........................................................................................................64
4.2. Improved Insulation of Residential Homes ..................................................................65
4.3. Replace Heating Fossil Fuel with Biomass .................................................................67
5. Conclusions and Suggestions ............................................................................................69
6. Bibliography ....................................................................................................................73
7. Annex .................................................................................................................................76
Annex 1: Questionnaires .......................................................................................................76
Annex 2: Direct Energy ..........................................................................................................98
Annex 3: Waste .....................................................................................................................99

v
Annex 4: Transport .............................................................................................................. 101
Annex 5: Food ..................................................................................................................... 102
Annex 6: Scenarios ............................................................................................................. 103

vi
List of Abbreviations
CFL Compact Florescent Lamp
CO2 Carbon Dioxide
CSP Clean Sleat Project
EEM Energy and Environmental Management
EF Emission Factor
GSCW Great Sleat Cycle Weeks
IC International Class
LPG Liquefied Petroleum Gas
MTCE Metric Tonnes of CO2 Equivalent
n.d. No date
SCT Sleat Community Trust
SESAM Sustainable Energy Systems and Management
SMO Sabhal Mor Ostaig
UK United Kingdom
US EPA United States Environmental Protection Agency
WEEE Waste Electrical and Electronic Equipment
List of Units
oC Degree Celsius
kg Kilogram
kJ Kilo Joule
km Kilometre
kWh Kilowatt hour
l Litre
m2 Square meter
MJ Mega Joule

vii
List of Tables
Table 2-1: Responsibility boundaries for different sectors .......................................................... 6
Table 2-2: Distribution of household interviews in Sleat ............................................................. 8
Table 3-1: Beneficiaries interviewed for each activity ................................................................11
Table 3-2: Specific section respondents ....................................................................................12
Table 3-3: CO2 emission reductions due to house insulation .....................................................13
Table 3-4: CO2 savings due to stand-by savers ........................................................................21
Table 3-5: CO2 savings due to the increased use of firewood ...................................................26
Table 3-6: College heat energy consumption from 2007 to 2010 ..............................................27
Table 3-7: College CO2 emissions from heating from 2007 to 2010..........................................27
Table 3-8: CO2 savings by replacement of LPG by woodchips in the College ...........................28
Table 3-9: Waste Classification in Sleat (Highland Council 2009). ............................................34
Table 3-10: Sleat waste arising figures (Highland Council 2010) ...............................................34
Table 3-11: Household carbon footprint of waste in Sleat (Source: Author) ...............................35
Table 3-12: Amount of waste collected from primary school and college...................................41
Table 3-13: Comparison of taxi service before and after subsidies............................................48
Table 3-14: Summary of Great Sleat Cycle Week Assessment .................................................49
Table 3-15: Contribution of bike rides in carbon emission reduction ..........................................49
Table 3-16: Emission factors for different modes of transport ....................................................50
Table 3-17: Distance and carbon emissions released by increased public transport .................53
Table 3-18: Net carbon emission reductions and equivalent fuel savings ..................................53
Table 3-19. Equipment hire (Source: Analysis from the household data) ..................................60
Table 3-20: Calculation of the carbon footprint for food .............................................................61
Table 3-21: Summary of CO2 savings .......................................................................................63
Table 4-1: Carbon emission reductions due to using green electricity .......................................65
Table 4-2: Energy and CO2 Savings on Housing Heating Insulation ..........................................66
Table 4-3: CO2 saving using firewood .......................................................................................67

viii
List of Figures
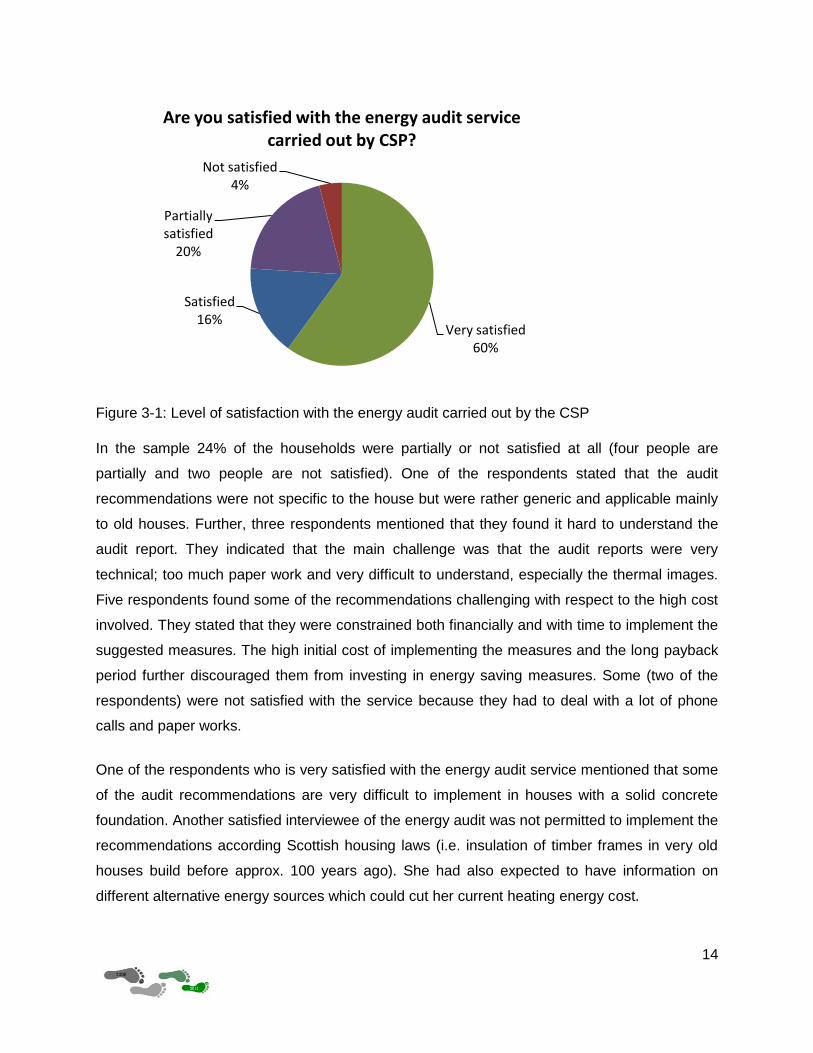
Figure 3-1: Level of satisfaction with the energy audit carried out by the CSP ..........................14
Figure 3-2: Measures applied by energy audits participants ......................................................15
Figure 3-3: Reasons for not implementing the measures suggested by the energy audit ..........15
Figure 3-4: Suggestions for future energy audits .......................................................................16
Figure 3-5: Sources of information on the energy saving measures ..........................................17
Figure 3-6: Satisfaction with the CFL dissemination program ....................................................18
Figure 3-7: Influence of different sources of information on the decision to install CFL..............18
Figure 3-8: What persuaded you to install the stand-by saver? (n=24) ......................................20
Figure 3-9: Satisfaction with the dissemination program (n=20) ................................................20
Figure 3-10: Motivation to meet more of the heat demand from firewood ..................................22
Figure 3-11: Motivation to meet more of the heat demand from firewood ..................................24
Figure 3-12: Reasons for increasing the use of firewood (n=41) ...............................................24
Figure 3-13: Problems faced with the local provision of firewood ..............................................25
Figure 3-14: Respondents’ suggestions on how to improve the local supply of firewood ...........26
Figure 3-15: Reasons for not installing solar water heaters .......................................................29
Figure 3-16: Reasons for interest in solar water ........................................................................30
Figure 3-17: Respondents persuaded by the Clean Sleat Project .............................................31
Figure 3-18: Willingness to Pay for Sustainable Products and Services ....................................32
Figure 3-19: Waste batteries disposal locations (Source: Author) .............................................36
Figure 3-20: Used mobile phone disposal locations (Source: Author) .......................................36
Figure 3-21: Participation of respondents in CSP waste activities (Source: Author) ..................37
Figure 3-22: Ranking results of respondents in CSP waste activities (Source: Author) .............38
Figure 3-23: Satisfaction on the current waste management situation in Sleat ..........................39
Figure 3-24: Percentage of recyclable materials and refuse waste from school and college .....42

ix
Figure 3-25: Percentage of refuse waste and recyclable materials from hotels and small
business .............................................................................................................43
Figure 3-26: Participation of hotels in Clean Sleat Activities ......................................................44
Figure 3-27: Ranking result of the hotels on usefulness of Clean Sleat activities ......................45
Figure 3-28: Assessment of improvement in frequency for bus service .....................................50
Figure 3-29: Assessment of improvement in frequency for ferry service....................................51
Figure 3-30: Assessment of improvement in punctuality for buses ............................................51
Figure 3-31: Assessment of improvement in punctuality for ferry ..............................................52
Figure 3-32: Household uses of compost (Source: Analysis from the household data) .............59
1
1. Introduction
Between February 14 and March 20, 2011, a team of graduate students of Energy and
Environmental Management (former SESAM) from the Flensburg University conducted an
evaluation of the activities of the Clean Sleat Project. This study determined in how far the
project objectives have been met. The study was undertaken on behalf of the Sleat Community
Trust and in cooperation with Community Energy Scotland as part of the Student’s research
assignment at their Master of Engineering course.
The Sleat Peninsula is located at the southern tip of the Isle of the Skye. The population of Sleat
in 2010 was estimated to be around 878 with 394 (Sleat Community Trust 2005).
This is a follow-up study. In 2008 an initial study on the ecological footprint of the Sleat
Peninsula was completed by a group of fellow students from the University of Flensburg. The
2008 study revealed that Sleat residents used more natural resources than the Scottish average
consumption. These findings led to the implementation of the two year Clean Sleat Project with
an initial goal to reduce the carbon emission on the peninsula by 33% over the project time.
The Clean Sleat Project (CSP1) was launched in 2009 as a local initiative. Its main function was
to facilitate implementation of useful community based renewable energy, energy efficiency and
other environmental activities. The Clean Sleat Project is led by a seven member voluntary
working group with Angus Robertson as the project manager. The Sleat Community Trust (SCT)
received a grant of ₤99,000 from the ―Scottish Government Climate Change Fund‖. The fund
was intended to increase the awareness of climate change and to reduce carbon emission over
two years in the community (Sleat Community Trust 2010).
The CSP activities mainly focused on residential energy consumption, household waste
management, transportation and vegetable and fruit production. To meet the envisaged targets
the Clean Sleat Project provided information and free services to households and business
enterprises.
The present study assessed the change in the carbon footprint attributable to project activities
and the awareness and attitudes of the Sleat population towards the problem of carbon dioxide
emission. Further, the study suggested possible focus areas for future projects.
1 In the course of this report we use either the full wording, Clean Sleat Project, or the abbreviation, CSP
or the Project

2
In conducting this research, the study team set its own vision and mission. Accordingly, the
vision of this project was, ―Foot Print towards Sustainability‖, and the mission was to effectively
execute the team’s tasks using their intercultural experiences by cooperating with the local
communities to provide options towards sustainability.
1.1. Objective of the Clean Sleat Project
The main objective of the Clean Sleat project was to reduce the carbon footprint of Sleat
through local initiatives and community engagement (Clean Sleat Project n.d.). A reduction
target of 33% was initially envisaged. In order to achieve this goal, the project devised a number
of activities. These activities were designed to address the main impact areas of the carbon
footprint which included direct energy, waste management, transport and food.
1.2. Expected Outcomes of the Clean Sleat Project
Project activities where targeted at:
1. increasing household energy efficiency
2. Increasing the use of renewable energy resources
3. improving waste management
4. increasing the use of public transport and bicycle
5. Increasing local vegetable and fruit production.
In order to achieve the above targets, the Trust worked with the local school, community groups
and businesses (Sleat Community Trust 1 n.d.).
1.3 Activities of the Clean Sleat Project
The following were the activities of the Clean Sleat Project:
1. Conducting energy audits in households to promote residential energy efficiency
2. Distributing energy saving bulbs (Compact Fluorescent Lamps –CFL)
3. Distributing stand-by energy savers
4. Distributing real energy meters
5. Lending out a log splitter to encourage the use of woodfuel
6. Providing information on reducing, reusing, and recycling of waste
7. Lobbying for the creation of collections points for mobile phones and batteries at the
local school, the Post Office, Kilmore Church (Sleat Community Trust 3 n.d.)

3
8. Lobbying for an on island green disposal of waste and a local 'Swap/Recycle' scheme
for unwanted items (ibid)
9. Encouraging to reuse clothes by sending them to Blythewood or Rag Tag Textiles in
Broadford (ibid)
10. Encouraging the use of reusable nappies
11. Encouraging the use of local materials in building and construction works
12. Lobbying for an improved public transport service from the local ferry and bus
companies
13. Lending out cultivator and shredder to promote local production of vegetable and fruit
Awareness programmes were organized through several community events such as polytunnel
construction and solar panel building workshops, energy savings tips, a solar car boot sale,
showing of the ―Age of Stupid‖ climate change film, crofters market, etc. Other community
events included the Great Sleat Cycle Weeks with which were many mini events such as bike
repair workshop, family bike ride, bike to school week. Two ―waste to useful product‖
competitions at the local school were organised as well as a ―Mini Renewables and Energy
Efficiency Day‖. The Community Trust contributed green pages to the Sleat Tourism website
1.4 Scope of Work
The scope of this study was to evaluate key areas of the Clean Sleat Project. The focus areas
where direct energy, waste management, transport and food. Based on the project activities, the
study included a quantitative and qualitative evaluation. While the 2008 Study focused on the
calculation of the ecological footprint of Sleat, the present study focuses on the contribution of
the Clean Sleat Project activities to the carbon footprint reduction between 2008 and 2010. The
carbon footprint is a part of the ecological footprint. Thus, the work covered included:
a quantitative assessment of the reduction of the carbon footprint by the Clean Sleat
Project
a qualitative evaluation of attitudinal changes of the Sleat residents towards climate
change and carbon footprint.
The work did not include an assessment of the carbon footprint of Sleat. Therefore factors that
could have led to a change in the total carbon footprint, but were not related to the Clean Sleat
Project, such as demographic changes, improvements of the emission factor of the Scottish
electricity mix etc. were not considered in this study.

4
2. Methodology of the Study
This chapter discusses the methodology and approaches followed in the evaluation of the Clean
Sleat Project. It elaborates on the various aspects and the boundaries of the evaluated project,
the tools used for the survey, the sample size and its representativeness, data collection and
analysis as well as the assumptions and limitations of the study.
2.1. Approach of the Study
According to international criteria of project evaluation (OECD n.d.), we looked into aspects
such as relevance, effectiveness, impact and sustainability of the project, but we deliberately left
out to check project efficiency, as this was not requested.
The impact assessment included the reduction in the carbon footprint as well as the attitudinal
change within the community as a result of project activities. However, we found it difficult to
attribute changes to the Clean Sleat project only. This was mainly because there were other
influencing activities such as energy audits conducted by the Energy Saving Trust or the
Highland Council as well as information the community received through the media.
The 2008 study in Sleat categorized the footprint into food, waste, direct energy and transport.
Calculations of the footprint from these categories, which in the 2008 study were called ―impact
areas‖ (SESAM 2008 ,23.), basically followed the ―component method‖. This method focuses on
a bottom-up approach, where all ecological footprints of individual products consumed by the
population are counted and summed up. The ―compound method‖ on the other side follows a
top down approach using national production, as well as import and export data to determine
the total consumption of a nation (Chamber 2007, 68). In this study the component method was
primarily used. However when required the compound method was also applied to complement
the analysis.
The specific methodology used for each of the sectors, namely direct energy, waste, transport
and food is outlined in the chapter on findings and analysis.
Based on the 2008 study the Clean Sleat Project was introduced. So the main assumption of
our survey was that there is a reduction of carbon footprint in Sleat in 2010 compared to 2007.
5
On the basis of project activities quantitative and qualitative aspects were identified. In the
quantitative assessment we estimated the reduction in the carbon footprint of the Sleat
peninsula in 2010 in areas where project activities were implemented. This was then compared
with carbon footprint from the 2008 study. In this way the assumption of the study was tested.
In the qualitative aspects of the study we assessed:
The community’s attitudinal change. This change may or may not necessarily be
reflected in the reduction of the carbon footprint.
Community’s level of awareness of the Clean Sleat Project and its associated project
activities,
Community’s level of satisfaction from services rendered
2.2. Defining the Boundaries of the Study
In order to determine changes in the carbon footprint of Sleat, boundaries of sectors were
defined in similar ways to those of the IC 2008 study. The water sector was excluded from this
study, as according to the 2008 report, it did not contribute significantly to the total carbon
footprint of Sleat. Besides responsibility boundaries, time boundaries were also considered in
this study due to the nature of the objectives.
Detailed responsibility boundaries for each sector (SESAM 2008, 11) are described below and
compared with what the IC 2011 team did in the present study.

6
Table 2-1: Responsibility boundaries for different sectors
Sectors IC 2008
Differences of IC 2011 from IC
2008
Included activities Excluded activities
Direct Energy and water (Excluding transport)
Energy and water consumption within Sleat region in all sectors. Energy and water consumption of tourists staying in hotels, B&B and self-catering accommodation.
Energy and water consumption of Sleat resident outside Sleat boundaries. Domestic water, which is provided through local sources.
Water sector was excluded. Only energy consumption of households, institution and hotels were evaluated, other sectors were excluded.
Transport All modes of travel of Sleat residents
Tourist transportation to and within Sleat
Air travel was excluded
Materials and waste
Long lifetime material consumption within Sleat region in all sectors. Short lifetime material considered under waste. The material required for infrastructure both private (new houses) and shared e.g. road
Long lifetime materials were excluded. Only mobile phones and batteries were included as short lifetime materials.
Waste generation within Sleat region in all sectors. Waste treatment outside Sleat boundaries
Bulk waste (considered as material). Construction waste (assumed to be reused). The specific waste produced by commercial sector which are not collected by Municipal Solid Waste (MSW)
Waste generation from households, institutions and hotels were evaluated, Other sectors were excluded. Only textile, glass and plastic bottles were considered in recycling waste. Other categories are excluded.
Food Food consumption by resident within Sleat. .
Food consumption of self-catering tourists.
Total food consumption was not evaluated. Only replacement of non-local vegetables and fruit production of residents within Sleat in the last 2 years were evaluated. Animal food was excluded.
Source: IC 2011, based on IC 2008 Report
The time boundary of the study was defined based on the specific time schedule of Clean Sleat
Project activities during the period February 2008 to December 2010.

7
2.3. Survey Tools
Three major tools were used for conducting the study: literature review, questionnaires and
interviews.
In the literature review the Ecological Footprint of Sleat (2008 IC Study), websites of Clean Sleat
Project and relevant reports of the Highland Council were reviewed to use as main sources of
the baseline data for the study.
Based on the main objectives of the study, six questionnaires were drafted, discussed with
representatives of the project and tested, including
o A standardized general household questionnaire for obtaining information from
households, which relate to general and background information, transport, waste,
materials and food.
o Five specific (standardized) questionnaires for obtaining information of households that
either participated in the Clean Sleat Project activities or implemented energy related
measures themselves.
o Questionnaire guidelines were used in expert interviews for collecting data from relevant
institutions in Sleat, such as the primary school, college, local transport company and
hotels.
The questionnaires were completed through face-to face interviews. The interviewer read the
questions to the respondent and recorded the responses. Interviews were carried out with
households, institutions and key personnel of Clean Sleat Project.
2.4. Sampling and Data Collection
A sample of 208 households from the 394 households in Sleat was contacted for household
interviews. Of these 164 households were successfully interviewed. 44 households declined to
be interviewed.
2.4.1. Sample of Number of Households in Sleat
Table 2-2 shows the breakdown of interviewed households per village. This was representative
of the contacted households in relation to the population.

8
Table 2-2: Distribution of household interviews in Sleat
Village
Total number of
Households (Approx.) in
2010
Households contacted
Households Declined
Interviews conducted
Interviews conducted
in %
Achnaloich 23 11 3 8 35%
Tarskavaig 40 15 1 14 35%
Kilbeg 60 29 6 23 38%
Eilean Iarmain / Camacross 65 45 15 30 46%
Drumfearn 17 9 3 6 35%
Armadale 26 7 2 5 19%
Calligarry and Ardvasar 77 35 6 29 38%
Aird of Sleat 31 18 1 17 55%
Teangue 24 15 4 11 46%
Saasaig 21 6 2 4 19%
Cruard 7 6 1 5 71%
Tokavaig 10 3 - 3 30%
Ord 30 9 - 9 30%
Holiday homes (approx.) 105
Estimated No. of Household 3942 208 44 164
41,6 %
Total 499 (Source: EEM 2011)
The sample was made by targeting all the households that could be reached through door-to-
door interviews. The aim was to reach as many households as possible. The number of
households was estimated by counting from Google Earth. This was then compared with a list
of households that were physically visited. There were few interviews conducted in Armadale
because most of the potential respondents were not at home at the time of the visit. Sasaig is
also underrepresented because there are a lot of unoccupied houses, which were assumed to
be holiday homes. On an average the sample represents about 41.6% of the total households in
2 [1] Projected number of households based on the Sleat Community Trust. "A Community Plan for Sleat."
June 2005.

9
Sleat. Based on this sample and a total of 394 households at a confidence level of 95% a
confidence interval or margin of error of 5.77% was achieved. This means that it is fairly
representative
2.4.2. Estimated Number of Sleat Residents
According to the Sleat Community Trust, it was expected that there would be an increase of 44
households by 2011. Using this projection, we estimated that there would be 394 households in
2010. The Community trust plan further projected that Sleat would have a population of 878 in
2010. (Sleat Community Trust 2005). Up to date figures of both the number of households and
the population could not be found from Scottish neighbourhood statistics website. The Scottish
neighbourhood statistics estimated a population of 902 by 2009.
To overcome this challenge the 2011 study assumed the households in Sleat were distributed
according to the sample of the 2008 Study. Using this profile, a population for Sleat was
calculated to be 932. So our key assumptions were that:
- there is a constant structure of households
- the number of households is 394 as predicted in the Community Plan for Sleat
Although this leads to a fictitious number of residents (932), it allows for the exclusion of
demographic factors, which are beyond the responsibility of the community, such as change of
household structure and population growth. As the reduction of the carbon footprint is later
calculated per capita the absolute figures can also be determined for the population number in
2007. However, the method might lead to an underestimation of the absolute per capita carbon
footprint reduction in the range of 6%.

10
3. Findings, Analysis and Interpretation
This section presents the findings, analysis and interpretations of the data. The finding are
presented broadly in the four focus areas namely, direct energy, waste separation, transport
and food.
3.1. Direct Energy
According to Chambers et. al. direct energy includes energy used in homes, by commercial &
public services such as hotels, education & health services for lighting, space & water heating,
electrical appliances, communication & entertainment (Chambers, et al. 2005, 1)
The main objective of the study in this section was to quantify CO2 reduction resulting from the
implemented energy measures. Specific questionnaires were used to gather data on energy
saved during the project period under review. However, since a number of respondents could
not quantify the saved energy, standard Scottish household energy saving data was used
(Energy Saving Trust 2011) to estimate the energy saved by each of the implemented
measures.
The activities of the Clean Sleat Project regarding direct energy were:
conducting energy audits in Sleat residences,
disseminating CFL lamps,
distributing stand-by savers,
conducting a solar water heater workshop,
lending out a log splitter to Sleat households,
encouraging the use of biomass,
disseminating real time energy meters.
For those interviewees who participated as a beneficiary in any of these activities, a specific
questionnaire was administered not only to quantify their savings but also to get some feedback
from their experience with the respective activity.
A summary of the number of beneficiaries who were interviewed is presented in Table 3-1.

11
Table 3-1: Beneficiaries interviewed for each activity
Interviewed
Percentage
of the
sample
(n=164)
Total number
of beneficiaries
Percentage of
the total number
of beneficiaries
*
Energy audits 23 14% 52 44%
CFL dissemination 70 43% 200 35%
Stand-by saver
dissemination 20 12% 80** 25%
Solar Water Heater
Workshop 11 7% 16 69%
Log Splitter users 10 6% 16 62.5%
Real time energy meters
distribution 19 12% 30 63%
Non participant in any of the
above activities 78 48%
Source: EEM2011
*) sums up to more than 100% as some households benefitted from several activities
**) number of energy savers which were distributed, some households received two
In order to have a comparison with people who did not participate in the activities, the same
energy related specific questionnaires were administered to people who did not participate in
the corresponding Clean Sleat Project activity but implemented some energy saving measures
on their own. Table 3-2 shows the number of respondents who either benefitted from the Clean
Sleat Project activities or implemented energy related measures on their own initiative.

12
Table 3-2: Specific section respondents
Specific
questionnaire Detail
Total
number
Percentage
of the sample
Energy audits and
home insulation
Improved the insulation on own initiative 24
45 * 27% Had an energy audit and applied one or
more measures 11
Had an energy audit and didn’t apply any
measure 10
CFL users
Received CFL from CSP 70
126 56%
Installed CFL on own initiative 56
Stand-by savers
users
Received Stand-by saver from CSP 20 24 15%
Installed Stand-by saver on own initiative 4
Solar Water
Heater: Workshop
and users
Attended workshop 11
11 7%
Attended workshop and installed solar
water heater 0
Installed a solar water heater on own
initiative 0
Firewood
Hired the log splitter (and increased the use
of firewood) 9
38 23%
Hired the log splitter (and did not increase
the use of firewood) 1
Not hired the log splitter but increased the
use of firewood or purchased a wood stove
after February 2008
28
Source: (EEM 2011)
*) Two more interviewees received an energy audit from the Clean Sleat Project, but they were not asked the
questions of the specific questionnaire because they had been interviewed by the Sleat Community Trust.
Within this section an extrapolation factor of 2.41 was used to extrapolate the CO2 savings from
the sample to the population. This factor is derived as the ratio of the estimated total number of
households in Sleat to the surveyed number of households (2.41=395/164).

13
3.1.1 Energy Audits and Improvements in Home Insulation
The Cleans Sleat Project offered to conduct energy audits in the homes of Sleat residences.
Those residents interested in receiving a home energy audit were contacted by the trust and the
energy audit was carried out by the Energy Saving Trust.
The reduction of CO2 emissions due to improved insulation of houses was quantified using
typical figures of CO2 savings from the Energy Saving Trust webpage (Energy Saving Trust
2011). The webpage provides figures of CO2 savings for common home insulation measures
given the energy carrier used, the type of house (detached, semidetached, etc.) and the number
of bedrooms. When the measures provided by the respondent could not be adequately
described or did not match the one listed in the webpage, the lower value was chosen to avoid
overestimation of savings. By this approach, it was possible to quantify the following savings:
Table 3-3: CO2 emission reductions due to house insulation
(Source: EEM 2011)
The level of satisfaction with the energy audit carried out by the CSP is shown in Figure 3-1.
Interviews
conducted
CO2 emission reduction in 2010
(tonnes of CO2)
Sample Total Population
Energy Audit participants 21 6.3 15
Non participants 24 9.1 22
Total 45 15.4 37
14
Figure 3-1: Level of satisfaction with the energy audit carried out by the CSP
In the sample 24% of the households were partially or not satisfied at all (four people are
partially and two people are not satisfied). One of the respondents stated that the audit
recommendations were not specific to the house but were rather generic and applicable mainly
to old houses. Further, three respondents mentioned that they found it hard to understand the
audit report. They indicated that the main challenge was that the audit reports were very
technical; too much paper work and very difficult to understand, especially the thermal images.
Five respondents found some of the recommendations challenging with respect to the high cost
involved. They stated that they were constrained both financially and with time to implement the
suggested measures. The high initial cost of implementing the measures and the long payback
period further discouraged them from investing in energy saving measures. Some (two of the
respondents) were not satisfied with the service because they had to deal with a lot of phone
calls and paper works.
One of the respondents who is very satisfied with the energy audit service mentioned that some
of the audit recommendations are very difficult to implement in houses with a solid concrete
foundation. Another satisfied interviewee of the energy audit was not permitted to implement the
recommendations according Scottish housing laws (i.e. insulation of timber frames in very old
houses build before approx. 100 years ago). She had also expected to have information on
different alternative energy sources which could cut her current heating energy cost.
Very satisfied60%
Satisfied16%
Partially satisfied
20%
Not satisfied4%
Are you satisfied with the energy audit service carried out by CSP?

15
Figure 3-2 shows in how far the beneficiaries of the energy audits applied the measures
suggested by the audit.
Figure 3-2: Measures applied by energy audits participants
The reasons for not implementing the measures could be grouped as in Figure 3-3.
Figure 3-3: Reasons for not implementing the measures suggested by the energy audit
The suggestions for further energy audits are shown in Figure 3-4.
All of them9%
Some of them43%
None of them48%
Have you applied the energy saving measures suggested by the energy audit?
0%
10%
20%
30%
40%
50%
Economic reasons
The house was well insulated,
there was hardly any measure
It was not technically feasible to apply the measures
seeks help and follow
The audit was recently
conducted
What were the reasons for not implementing energy saving measures?

16
Figure 3-4: Suggestions for future energy audits
36% of the interviewees (5 households) suggested a report in a language easy to understand
with understandable thermal imaging. A further 21% (3 household) proposed to formulate the
recommendations more specifically for the house type. Another 21% of the respondents (3
households) suggested including renewable energy home systems such as solid fuel cooking
systems and solar heating systems. Two interviewees suggested a follow up on the energy
audits to encourage the implementation of the measures.
It was also asked from where the respondent heard of the energy saving measures applied in
their homes. Figure 3-5 describes the respondents’ sources of information about energy saving
measures.
0%
10%
20%
30%
40%
Simplify the report
Recommendations should be specific
to the house
Include renewable energy
home systems
Better follow up
Cooperate with
government
Do you have any suggestions to improve the energy audit service?

17
Figure 3-5: Sources of information on the energy saving measures (n=45, energy audit participants and those that implemented energy saving measures on their own)
In the sample, about one fourth of the households (11 households) stated that they came to
know about the energy saving measures either from the Clean Sleat Project in general or
through its energy audit programme.
3.1.2 CFL Users
The results of the study revealed that 77% (302) of the households in Sleat have installed
energy saving lamps. Further it shows that 56% (168) of the households have benefitted from
the Clean Sleat Project by receiving free CFL.
The figure presented below shows that most of the Sleat residents were satisfied or very
satisfied with the dissemination program. However, some (17%) of them were not or only
partially satisfied, mainly with the quality of the CFL. They mentioned that the light was not
sufficient for several activities and that it takes too long to light up after switch on. Some
interviewees expressed concern on the challenges of CFLs disposal as it contains mercury.
One of the main suggestions of the respondents for future activities was to introduce collection
points for old CFL to protect the environment.
0% 5% 10% 15% 20% 25% 30%
Own needs
Neighbour or friends
Advertisment from companies
Scottish government
Energy Audit
TV/Radio/Internet
Newsletter, advisors, fair etc.
General knowledge
Clean Sleat Project
How did you hear about the energy saving measures applied in your home?

18
Figure 3-6: Satisfaction with the CFL dissemination program
Figure 3-7: Influence of different sources of information on the decision to install CFL
Figure 3-7 shows that about 15% of the respondents were persuaded to use CFL either by the
Clean Sleat Project in general or by its CFL dissemination programme. Due to the phasing out
of incandescent lamps most people are aware of CFL and already install CFLs by themselves.
The CO2 emissions were calculated for each respondent, using the average wattage of the
CFLs installed, the average wattage of the incandescent lamps replaced and the average hours
Very satisfied31%
Satisfied47%
Partially satisfied
13%
Not satisfied4%
No answer5%
Are you satisfied with CFL Dissmination program of the CSP?
0% 2% 4% 6% 8% 10% 12% 14%
Others
Neighbour
Availability
CSP in general
Cost effectiveness
Lifetime
CFLs were free
Advertisment
CSP dissemination program
Energy saving
Environmetal concerns
TV/Radio/Internet
What persuaded you to install the CFLs?

19
of use provided. It was assumed that only two lamps were on at the same time. Based on these
assumptions it was found that 23 tons of carbon dioxide emissions have been saved from CFLs.
This represents a 0.54% reduction of the direct energy emissions in 2007.
3.1.3 Stand-by Saver Users
The stand-by savers were distributed free of charge to Sleat residents who attended some of
the different activities organized by the Clean Sleat Project. Out of a sample of 24 interviewees,
20 had received a stand-by saver from the Clean Sleat Project and 4 had acquired it by their
own initiative. Two different types of stand-by savers were distributed; one suitable for
computers and the other suitable for TV and entertainment equipment.
From the respondents who received the stand-by saver from the Clean Sleat Project, 15
actually installed it, while four did not. The reasons for not installing the equipment were:
The instruction seemed complicated and difficult to understand (2 respondents)
The effect it would have on the computer was not clear from the instruction (1
respondent)
The respondent did not have many electrical equipments (1 respondent)
The respondents who installed stand by-savers had different motivations. As can be seen from
Figure 3-8 it is quite obvious that the Clean Sleat Project was one of the reasons that influenced
respondents to install the stand-by saver.
20
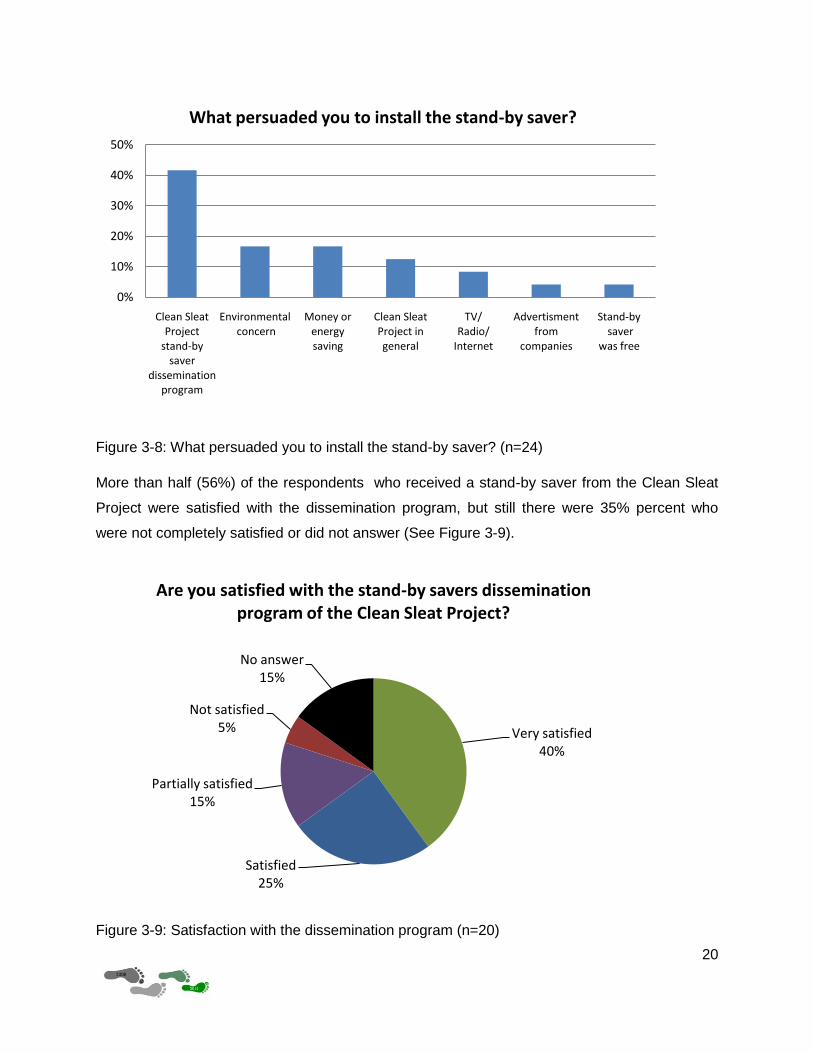
Figure 3-8: What persuaded you to install the stand-by saver? (n=24)
More than half (56%) of the respondents who received a stand-by saver from the Clean Sleat
Project were satisfied with the dissemination program, but still there were 35% percent who
were not completely satisfied or did not answer (See Figure 3-9).
Figure 3-9: Satisfaction with the dissemination program (n=20)
0%
10%
20%
30%
40%
50%
Clean SleatProject
stand-bysaver
disseminationprogram
Environmentalconcern
Money orenergysaving
Clean SleatProject ingeneral
TV/Radio/
Internet
Advertismentfrom
companies
Stand-bysaver
was free
What persuaded you to install the stand-by saver?
Very satisfied40%
Satisfied25%
Partially satisfied15%
Not satisfied5%
No answer15%
Are you satisfied with the stand-by savers dissemination program of the Clean Sleat Project?

21
Respondents who were not completely satisfied with the program were those who could not
install the equipment. The respondents reported that they were not able to understand the
instructions; or that they had expected to receive a stand-by saver that they could connect to the
TV and other appliances, instead of connecting only to the computer.
When asked for suggestions for future dissemination programs, the answers received were:
To provide more information on how to connect the stand-by savers (2
respondents)
To make more promotion of the stand-by savers (2 respondents)
To provide more stand-by savers for PC (2 respondents)
To provide more stand-by savers for TVs and VCR’s (2 respondents)
The list of equipments connected to the stand-by savers and their corresponding standby hours
were obtained from the respondents. With this information the energy savings were estimated,
assuming some typical values for the stand-by losses of the equipment connected. The standby
savers contributed in total 1.2 tons of CO2 saving.
Table 3-4: CO2 savings due to stand-by savers
Savings
Energy savings (kWh) CO2 Saving (ton CO2) *
2967 1.2
*) Derived using an emission factor of 0.406 kgCO2/kWh.
54% of those respondents who installed the standby savers answered that the Clean Sleat
Project persuaded them. To sum up, it could be seen that the stand-by savers were not widely
used among the residents, and the majority of those who used them came to know about them
through the dissemination project. Furthermore this activity contributed to reduce the CO2
emission of Sleat by 1.2 ton of CO2. On the other hand, according to the view of some
respondents the Clean Sleat Project did not make sure that the beneficiaries were informed on
the installation of the equipment and on the type appliances the stand-by savers were supposed
to switch off.

22
3.1.4 Firewood Use
The Clean Sleat Project promoted the use of firewood by acquiring a log splitter that was lent
out to the community for free. Ten log splitter users were interviewed in order to find out whether
they had used more firewood because of the availability of the log splitter lending service.
The same questionnaire was administered to 31 households who, without using the CSP log
splitter, meet more of their heat demand from firewood, or had bought a new wood burning
stove after February 2008.
Households that used the log splitter
Nine of the log splitter users said that they meet more of their heat demand from firewood.
However their motivation was mainly the cost of other fuels (in three cases). The fact that the
wood was easily available or for free (three cases); or the combination of both was the
motivation for the others. The other three said that the availability of the log splitter was one of
the factors that persuaded them to increase the use of firewood.
Figure 3-10: Motivation to meet more of the heat demand from firewood (n=10, more than one answer was possible)
Therefore the log splitter availability has been a motivation for people to increase the use of
firewood.
0
1
2
3
4
Log splitter availability from Clean
Sleat Project
Cost of other fuels
Access to Wood
Clean Sleat
Project in general
TV / Radio/
Internet
Poor Quality of Coal
What persuaded you to meet more of your heat demand from firewood?

23
Eight of the respondents who used the log splitter said they were satisfied or very satisfied with
the hiring service, while two respondents didn’t answer.
Four respondents had suggestions for improvement of the service, which included:
delivery of the equipment to the house;
keeping track of who has topped up or changed the oil, so the users can know if
the previous user did it or not;
buying a bigger log splitter; and
buying more log splitters.
The willingness to pay for the service varied greatly. One respondent said that he would not be
willing to pay but would instead look for an alternative. All others were willing to pay for it
between five pounds per weekend, and twenty pounds per day, with majority saying that they
would be ready to pay ten pounds per hire.
Households that increased the use of firewood
Thirty four of the interviewed households said that they had increased the use of firewood,
which represented 21% of the sample. This includes households that used the log splitter and
households which did not use it.
The motivation for meeting more of the heat demand with firewood was mainly the cost
compared to other fuels. This was followed by firewood being more available, environmental
concerns, and availability of efficient woodstoves. This is shown in Figure 3-11 (multiple reasons
are possible, therefore they don’t add up to 100%).

24
Figure 3-11: Motivation to meet more of the heat demand from firewood
When asked what the factors were which persuaded the respondent to increase the use of
firewood, the answers were as depicted in Figure 3-12.
Figure 3-12: Reasons for increasing the use of firewood (n=41)
0%
10%
20%
30%
40%
50%
60%
Cheaper Compared to other Fuels
Increased Access to Wood
It is Environmentally
Friendly
Availability of Efficient
Technology
Colder Winters More time to cut firewood
What motivated you to meet more of your heat demand from firewood?
0% 5% 10% 15% 20% 25%
Poor Quality of Coal
Log splitter availability from Clean Sleat Project
TV / Radio/ Internet
General Knowledge
Neighbors or friends
Environmental Reasons
Clean Sleat Project in general
Cost
Access to Wood
What persuaded you to meet more of your heat demand from firewood?

25
Almost 15% said they were persuaded by the Clean Sleat Project, directly or by the log splitter
service provided by the project.
Fourteen respondents (34%) get their firewood from the Clan Donald Trust, thirteen (32%) get it
from their own property, one (2%) from John Muir Trust and the remaining thirteen (32%) get it
from other different sources.
Fourteen out of 41 respondents had faced some kind of problem with the local provision of
firewood. The main problems were related to the quality of the firewood, especially the high
moisture content and the fact that the supply is not readily available when needed. Other
concerns include the price and the size of logs and the fact that there is only one supplier.
Figure 3-13: Problems faced with the local provision of firewood
Almost half of the people suggested that the trust should supply firewood, which shows that the
intention of the trust to buy Tormore forest has a strong back up in the community. Suggestions
to improve the quality of the wood mainly refer to the moisture content of the firewood. Other
suggestions are to make more firewood available and to have more suppliers, to sell hard wood
instead of soft wood, to employ qualified personnel and to give bio-licenses to pick up fallen
wood.
0
1
2
3
4
5
6
7
8
Unreliable supply Wet wood Expensive Only one supplier Quality of wood
Do you have any problems with the local provision of firewood?

26
Figure 3-14: Respondents’ suggestions on how to improve the local supply of firewood
The reduction of CO2 emissions was quantified based on the information provided by the
respondents on the amount of fuel being replaced.
Table 3-5: CO2 savings due to the increased use of firewood
CO2 Savings (tonnes
CO2)
193
0
1
2
3
4
5
6
7
8
9
Community owned land Sell dry logs Have other suppliers Others
Respondents' suggestions on how to improve local supply of firewood

27
College
In 2008 the college installed a woodchip boiler to supply the heat demand of the new campus
with woodchips instead of LPG. The consumption data of the different years was provided by
Dòmhnall MacIllinnein, head of estates & services (MacIllinnein 2011).
Table 3-6: College heat energy consumption from 2007 to 2010
Heat Energy Consumed (kWh)
LPG * Woodchips Total
2007 920080 0 920080
2008 1165315 67860 1233175
2009 756082 1438110 2194192
2010 647778 1561650 2209428
*) The LPG consumption was derived using a calorific value of 7.361 kWh/litre.
The CO2 emissions were calculated for the different years. The results are shown in the
following table
Table 3-7: College CO2 emissions from heating from 2007 to 2010
CO2 emitted (tCO2)
LPG Woodchips Total
2007 175 - 175
2008 221 0,1 221,1
2009 144 1,5 145,5
2010 123 1,7 124,7
*) CO2 emissions of wood chips are based on the delivery of woodchips by West Contracts Ltd from
Portree with a 40m3 lorry and an emission factor for the truck of 0.29 kgCO2/km. LPG emission factor 0.19
kgCO2/kWh.
In absolute figures the CO2 savings in 2010 compared to the reference year 2007 are 50 t.
However, the college extension came into effect in 2008. Therefore the consumption in 2010
cannot be compared to the consumption in 2007 without accounting for the different sizes of the
building. The heat energy consumption in 2007 (without extension) was approximately 75% of
the consumption in 2008 (with extension). It is assumed that the heat consumption of the main

28
college building in 2010 was also 75% of the total heat consumption of the college. This results
in CO2 savings of 82 t for the college main building in 2010 compared to 2007.
Table 3-8: CO2 savings by replacement of LPG by woodchips in the College
CO2 Savings in 2010 with respect to 2007
(tonnes CO2)
Savings without considering
emissions of the college
extension
82
The college and the Clean Sleat Project closely cooperate in the promotion of renewable
energies and carbon footprint reduction. For example the college has received advice from the
Sleat Community Trust regarding the woodchip boiler, and one of the subsidiaries of the Sleat
Community Trust is one of the College woodchip providers. Due to quality problems of the
woodchips supplied by the trust the college presently purchases the wood chips from West
Contracts Ltd, based in Portree, 40 miles away from the college. The local supply of woodchips
could further reduce the carbon footprint by 1.7 tons of CO2 which represents a further 0.5%
reduction with respect to its 2010 total emissions.
3.1.4 Solar Water Heater Building Workshop
The Clean Sleat project organised a solar water heater workshop for the residents of Sleat. The
aim of the workshop was to promote solar water heating and renewable energy in general. The
participants expected to build their own solar collectors which they would then install.
However, none of the participants of the workshop installed the solar water heater. The reasons
the participants gave for not installing can be seen in Figure 3-15.

29
Figure 3-15: Reasons for not installing solar water heaters
Five of the participants interviewed expressed their concern that installing a solar water heater
would involve major modifications in their water heating system, in particular that of the hot
water storage tank and the piping. Closely related to this is the concern expressed by three of
the participants that installing a solar water heater would be very expensive.
Eight of the respondents said that they became interested in solar water systems through the
Clean Sleat Project.
0
1
2
3
4
5
6
Involves major modification in the hot water heating system
Too expensive Solar is not a viable option for Sleat
Lack of a pump
Nu
mb
er
of
par
tici
pan
tsWhat were the reasons for not installing the solar water
heater?
0
1
2
3
4
5
6
7
8
9
Clean Sleat Project Media Neighbours/Friends
Nu
mb
er
of
par
tici
pan
ts
How did you become interested in Solar Water Systems?

30
Figure 3-16: Reasons for interest in solar water
Seven of the participants interviewed said their expectations of the workshop were partially met.
Two of the respondents felt their expectations of the workshop were fully met. Therefore nine
participants had their expectations met to a certain degree but only five of those are considering
installing solar water heaters in the future. Four of the respondents did not answer this question.
Four respondents did not think that it is viable to install a solar water heater in their houses in
Sleat or that the water from the solar heaters is neither hot enough nor adequate enough for
usage.
However, a number of solar water heater installations in the Highlands show that solar water
heating works well in the Scottish climate. For Example the inhabitants of Ostaig house in Sleat
use solar energy for heating their water since May 1996 (MacInnes 2009).
There was a suggestion that future solar workshops demonstrate different solar collectors.
These demonstrations might inspire people to install solar collectors. Future solar workshops
should address the issues raised by the participants. Instead of building simple collectors future
workshops should inform about technologies which are suitable for the Scottish climate and
provide information on the benefits as well as the cost and efforts required to install a quality
solar water heating system.
Further suggestions for future workshops included alternative forms of renewable energy, solar
PV (as opposed to just solar thermal) and other decentralised electricity for domestic use and
building materials for solar water heaters.
3.1.5 Impact of the Clean Sleat Project on the Target Areas
The impact that the Clean Sleat Project has had in each of the areas (home insulation, energy
saving bulbs, stand-by savers, solar water heaters and firewood use) was assessed. To do so,
the respondents were asked what persuaded them to undertake actions in the respective fields
of activity. Multiple options, as shown below, were possible. The first one was related to the
specific activity, and the last one (other) was an open option:
Clean Sleat Project activity (i.e. Energy Audit, CFL dissemination program, Stand-by
saver dissemination program, Solar Water Heater Workshop, Log splitter availability
from the CSP)
Clean Sleat Project in general
TV/Radio/Internet

31
Neighbours or friends
Advertisement from companies
Other
The percentage of respondents that ticked at least one of the first two options was calculated for
each of the activities.
Figure 3-17: Respondents persuaded by the Clean Sleat Project
It can be seen that the Clean Sleat Project had a greater impact in the installation of stand-by
savers, heat energy efficiency and on people to become interested in solar water heaters. With
respect to more popular and well known measures, namely installing energy saving bulbs and
increasing the use of firewood, the percentage of people that attributed their decision to the
Clean Sleat Project was still between 15 and 20%. For the energy saving bulbs it could be
observed that many people were already using them before the distribution project and for the
increase in firewood use the cost of other fuels and more availability of wood were the most
common answers.
3.1.6 Respondents Willingness to pay for Products and Services
The survey also asked respondents regarding their willingness to pay for products and services
like electricity, heating, food and transport that produced in a sustainable manner. Figure 3-18
shows that around 62% of the respondents are not willing to pay more for these products. For
the 38% that are willing to pay more, we found out that the community is not willing to pay a lot
0% 10% 20% 30% 40% 50%
... using firewood & woodchips
... solar water heaters
... stand-by saver
… energy saving bulbs
… heat energy saving measures
Percentage of people being persuaded by CSP about …

32
for transport. However they were willing to pay more Figure below shows the different
percentage the Sleat Community is willing to pay for sustainable electricity, heating, transport
and food products.
Figure 3-18: Willingness to Pay for Sustainable Products and Services
(Questionnaire 2011, 8)
0
10
20
30
40
50
60
70
80
90
Nu
mb
er
of
Re
spo
nd
en
ts
0 - 4%
5 - 9%
10 - 15%
16 - 40%
41 - 100%

33
3.2. Waste Management in Sleat
The CSP organised various activities in the Sleat community to encourage the practice of
reducing, reusing and recycling in the area of waste. Some activities like the car boot sale could
be directly attributed to the CSP while some, like the introduction of the blue bin in 2008 for
recyclable materials could indirectly be attributed to the project which lobbied for them. The
purpose of the study in the area of waste was to determine the recycling rate in 2010 and
compare this to 2007. It was also relevant to look at the local collection points designated for the
Sleat community for batteries and mobile phones by the CSP. The interviewees were also
asked about the activities organised by Sleat that they participated in and how they would rank
these activities in accordance to importance. The activities of the CSP in the waste area
included
1. Encouraging reusable nappies
2. Car boot sale
3. Encouraging recycling in general and local recycling in particular
4. Home bin
5. ―Waste to useful‖ competitions at the local school
6. Textile recycling
7. Batteries and mobile phone collection points in Sleat
8. The Clean Sleat recycling website message board
CO2 savings were calculated as the savings of embodied energy due to the waste related
activities. This method is in line with the ecological footprint method and was also applied in the
2008 footprint study. It was however assumed that the CO2 emissions due to the waste
transport remained constant. This is justified by the fact that the recycling bin and the refusal bin
are now collected alternating every second week, while the waste was collected weekly before
the introduction of the blue recycling bin. There is also not a large difference between the
transport from Portree to the recycling plants and the landfill.
Changes of attitude of the community were assessed based on
- Practice of households and institutions in waste classification, recycling at home and
sending waste to collecting points.

34
- Opinions of households and institutions on usefulness of waste management activities of
the Clean Sleat Project via a ranking system.
- The satisfaction of households and institutions on the current waste management
situation in Sleat.
The 2008 Study and statistical data from The Highland Council provided the baseline data for
evaluating the attitude change.
Table 3-9: Waste Classification in Sleat (Highland Council 2009).
Refuse (Green Bin) Recyclable Materials
Blue Bin Recycling Points
Organic kitchen waste,
organic garden waste,
envelopes, tetrapaks,
aluminium foil, food trays,
styrofoam, plastic bags
Paper and Cardboard
Rinsed food tins and drink cans
Plastic bottles (Milk bottles, Water
bottles, Fizzy juice bottles)
Glass bottles and jars
Textiles
According to the extrapolated data collected in interviews the total refuse waste was 284
tonnes/annum (refuse waste from Highland Council data is 311 tonnes/annum), total recyclable
materials was 82 tonnes/annum (recyclable materials from Highland Council data is 84
tonnes/annum) and the reuse quantity was 1 tonne/annum. The accounted recyclable materials
in this case include the recycling materials dumped into blue bin and materials which were
dropped at the recycling points.
Table 3-10: Sleat waste arising figures (Highland Council 2010)
Refuse
Recyclable materials
Blue Bin Recycling Point
Tonnes/year 311 49 35
Percentage (%) 79 12 9

35
As shown in Table 3-10 the recycling rate of the blue bin was 12% and recycling rate of the
recycling points was 9%. Therefore the total recycling rate is 21% for recyclable materials. This
is a 10% increase in the recycling compared to 2007 (SESAM International Class 2008). This
can be attributed to the introduction of blue bins for recycling materials. The 240 litre wheeled
blue bin, which is collected every fortnight, is primarily for paper and plastic (see Table 3-9).
The recycling points in Sleat are located at the Armadale Pier Car Park and the Sabhal Mor
Ostaig Car Park. These recycling points accept paper, drink cans, food tins, glass and textile
waste.
3.2.1 Waste Carbon Footprint
Table 3-11 illustrates the carbon footprint of Sleat in 2010. The reduction in carbon footprint
occurs as an implication of recycling. Recycling reduce carbon emissions by recovering the
embodied energy. According to the 2008 study the carbon emissions reduction from recycling
was 44.41 tonnes/year, the reduction increased to 111.85 tonnes/year in 2010. Therefore Sleat
saved 67 tonnes of CO2 emissions/year from the recycling activities.
Table 3-11: Household carbon footprint of waste in Sleat (Source: Author)
Recyclable materials (Tonnes/year) Carbon emissions reduction
(Tonnes/year)
Saved carbon
emissions
(Tonnes/year)
2008 2010 2008 2010
39.84 84 44.41 111.85 67.44
*: embodied energy factor taken from Barret, J, Simmons, C. 2003. Providing a Tool to Measure
the Sustainability of Local Authorities. Best Foot Forward, Stockholm Environment Institute.
2003. and waste quantity figures from Highland Council (2010)
3.2.2 Waste Electrical and Electronic Equipment
Regarding Waste Electrical and Electronic Equipment (WEEE), Clean Sleat encouraged the
public to drop their waste batteries, and used mobile phone at several recycling collection points
such as the batteries collection points at Kilmore Church and Post Office as well as the mobile
phone collection box at the Armadale Primary School. According to the data collected during
interviews, most (71%) respondents took their batteries to the recycling collection points at the

36
Armadale Post Office, Broadford Recycling Points, Portree Recycling Points, Inverness
Recycling Points. However, 29% of the respondents dump their waste in the green bin together
with the other refuse. Figure 3-19 illustrates the disposal practice related to waste batteries into
the designated recycling points either inside or outside Sleat. .
Figure 3-19: Waste batteries disposal locations (Source: Author)
In Sleat, most of the mobile phones (69%) were returned to the phone supplier, given to family
members or friends, or sent to charity foundations outside Sleat. The
Figure 3-20 illustrates various ways of mobile phone disposal in Sleat
Figure 3-20: Used mobile phone disposal locations (Source: Author)
Dumped into Municipal Collection
30%
Collection Point Kilmore Church
0%Collection Point Post
Office27%
Recycling Point Broadford
31%
Recycling Point Portree
6%
Recycling Point Inverness
6%
Dumped into Municipal Collection
8%
School Recycle Box23%
Given to family/friends
13%
Charity Organisation
31%
Exchanged with supplier
25%

37
3.2.3 Waste Management Practices in Sleat
In the waste sector it was important to identify CSP activities which the community took part-in,
to evaluate the relevance and impact of these activities towards waste management awareness.
Figure 3-21: Participation of respondents in CSP waste activities (Source: Author)
The result shows that the activities supported by Clean Sleat Project which they took part in
and/or practiced were owning a home recycling bin and then practicing recycling.
Furthermore, the interviewees were asked to rank activities of waste management that they
think are the most useful for their household. The results are illustrated as follows in Figure
3-22.
0% 20% 40% 60% 80% 100%
I have a recycling bin at home
I practice waste recycling?
I take our used textiles to a collection point
I went to car boot sale to look for used items
I participated in waste to useful product …
I bought/sold items at car boot sale
I've visited Clean Sleat Website's Recycling …
I've exchanged used items on Clean Sleat …

38
Figure 3-22: Ranking results of respondents in CSP waste activities (Source: Author)
As illustrated in Figure 3-22, the respondents ranked the most significant waste management
activities as follows:
Rank 1: Encourage recycling in general and local recycling in particular
Rank 2: At home bin recycling
Rank 3: Batteries recycling collection point
Figure 3-22 and Figure 3-23 shows that the respondents’ value the practice of recycling and are
content with their recycling bins at home. Figure 3-23 also clearly shows that the residents of
Sleat are aware of the need for battery recycling.
3.2.4 Respondents’ Impression on the General Waste Management in Sleat
The interview also took into consideration the respondents’ level of satisfaction on the general
waste management situation in Sleat (see Figure 3-23). More than 60% of respondents were
satisfied with the current waste management situation. This satisfaction could be attributed to
the Highland Council’s blue bin dissemination pilot programme.
0
10
20
30
40
50
60
70
1 2 3
Nu
mb
er
of
Ho
use
ho
lds
Rank
Recycle in General Home Bin Battery

39
Figure 3-23: Satisfaction on the current waste management situation in Sleat
(Source: Author)
3.2.5 Interpretation of Waste Results
Even though statistics show that 71% of the sample is aware of battery recycling, 29% of the
people damp their batteries in the green bin. This may create a challenge not only for the
highland council which collects the waste but also for the environment because batteries are
hazardous waste and are toxic to the environment. There was the impression from the
interviews that most of the households (especially those further away from the local
recycling/collecting area like Drumfearn, Ord, and Tokavaig) did not know about the local
recycling/collection points for batteries and mobile phones. This was clearly proven in the data
collected with no households from Tokavaig and Ord taking their batteries to the local collection
points and 67% of the households interviewed in these areas dumping their batteries together
with other waste. The interviews revealed that some people are not aware that mobile phones
can be recycled hence dump their mobile phones with the other municipal collection. An
awareness programme that promotes WEEE recycling and information of proper disposal
practice for this particular waste should be considered.
95% of the households have recycling bins at home and 89% of the households practice waste
recycling. An estimated 19 households in the whole of Sleat don’t have recycling bins at home.
If these got bins then the percentage of those who practice recycling would go up. The
inconsistency between those who have blue bins and those that recycle is due to the individuals
not satisfied7%
partially satisfied
27%
satisfied45%
very satisfied19%
no answer2%

40
with the bins who prefer to incinerate their paper and cardboard hence don’t use the bin. There
is a good understanding in the Sleat community on the importance of textile recycling with 74%
of the households taking their textiles to some kind of recycling point either in Broadford, the
Armadale pier or Portree. Another area the Clean Sleat project might need to focus on is the
market place for exchange of used items on their website. Even though 19% of the sample
visited the website only 2% actually exchanged any items via it. This could indicate that internet
may not be the most appropriate platform for the project to encourage reuse in the area. This
could also indicate that the needs and demands of the interested parties are not being matched
on the website. For the car boot sale organised by the Clean Sleat project 22% visited the car
boot sale and 18% actually bought/sold something there. This means over 90% of those who
attended bought/sold. This might be a better way to promote the reuse of used items than the
website.
With 21% of the households having participated in the ―waste to useful‖ product competitions at
the local school, it might be worthwhile for the project to look into eco-friendly fun activities for
kids that don’t target only the local school children but the children in Sleat. This was a
suggestion given because not all the children attend the local school. Some parents would like
to have their children participate in these activities aimed to teach children about the
environment even when they do not attend the local primary school. This could be a way to not
only educate children on climate change but involve population groups in Sleat with no school
going children.
There was a strong agreement from the respondents that encouraging recycling in general and
local recycling in particular is the most useful activity for waste management in Sleat (with 38%
of the respondents ranking it as their first choice for most useful activity for waste management
in Sleat). This was followed by the home bin recycling which the respondents (30% ranked this
as their first choice) felt had helped them a lot when it came to handling their waste. An
estimated 68% of the Sleat households agreed that local recycling and the possession of
recycling home bins is a useful activity in waste management. This could also explain why the
amount of recyclable material in Sleat has increased by 12% in the last 2 years.
The activity of battery collection comes in rank 3 as most useful activity for waste management.
As earlier explained that even though some respondents acknowledged that they were un
aware of the local collection areas for batteries, the fact that an estimated 38% actually take

41
their batteries to the co-op in Broadford, Portree or some other areas for disposing indicates the
community’s awareness of the dangers of battery disposal to the environment and the
importance of recycling them. However awareness for battery disposal and mobile phone
disposal should not be taken slightly as 37 % of the people still dispose their batteries and
mobile phones in the refuse bin.
In the suggestions given on what changes the residents of Sleat would like to be done to
improve their waste management situation, the need for more bins for the different categories of
waste was the most common suggestion. This particular suggestion was given by 39% of the
respondents (43 suggestions from the 110 were about provision of more bins). Even though this
suggestion is a good way to increase the percentage of recycling in Sleat it might not be
pragmatic. This is because the highland council would have to provide three more bins for just
glass bottle recycling as glass can only be effectively recycled when clear, green and brown
glass is collected separately. Therefore not only would it be expensive for the highland council
to install these various bins but the carbon footprint of Sleat would rise due to transport rounds
made to collect the bins.
The second highest option was to increase the local recycling points in Sleat and the third most
popular suggestion was on raising awareness in the Sleat community about recycling. The idea
of more recycling points is a good idea but it should be combined with the suggestion to
promote awareness. If an awareness programme was carried out to promote the current local
recycling point in Sleat, it might result in the people efficiently using them hence revealing no
need for more points or it might reveal that there is a need for more recycling points to reach
those who have difficulty accessing the current local points.
3.2.6 Analysis and Interpretation for School and College
The college generates more waste than the school but it also recycles more.
Table 3-12: Amount of waste collected from primary school and college
Institution Refuse waste (tonnes /year) Recycle materials
(tonnes/year)
Primary school 12 8
College 47 26

42
The 26 tonnes of recyclable materials at college recycling point could not be differentiated by
the amount exclusively generated by the college or that being dropped by Sleat residents.
Figure 3-24: Percentage of recyclable materials and refuse waste from school and college
The Figure 3-24 illustrates the percentage of waste collected from the refuse bin and recycling
bin at the primary school and college. The college was expected to generate more waste than
the local primary school because it has more staff and students than the primary school.
Moreover the college also serves as a local recycling point for paper, glass, and textile. The
primary school is a local collection point for used mobile phone and printer cartridges.
In order to find out the most useful activities of Clean Sleat Project for the primary school, a
ranking question was used. As the result, the most useful waste related activities were
encouraging recycling in general and local recycling in particular, school recycling bins, "Waste
to useful" product competitions at the primary school, bringing used mobile phone to collection
point at the primary school. Beside the CSP activities, the primary school also found the making
compost from organic canteen waste very useful for their primary school garden.
It was assessed that the waste awareness program, which was conducted by Clean Sleat
Project, contributed effectively to help the primary school educate their pupils on waste
management. The activities were suitable with the Scottish EcoProgram(Eco Schools Scotland
n.d.) which the primary school applied.
Refuse waste63%
Recycling materials
37%

43
Regarding the suggestions for improving the waste management situation of the primary school,
the primary school expressed a need for more bins to practice recycling. This might not be
possible since it may not be economically feasible for the Highland Council in the terms of
transportation and operating cost. It would be quite useful if the school was also made a local
recycling point just like the college not exclusively for used mobile phones and cartridges but for
other recyclable materials that are not collected at the college.
According to the interview, the college generates a large quantity of plastic waste but its
recycling options are limited. This could be an opportunity for the college to look for reuse
practices in the area of agriculture such as growing seedling.
3.2.7 Analysis and Interpretation for Hotels and Small Businesses
The data collected from the surveys shows that the three hotels and small business that were
interviewed generated 48 tonnes per year of refuse waste and 24 tonnes per year of recyclable
materials.
Figure 3-25: Percentage of refuse waste and recyclable materials from hotels and small
business
One of the hotels had reused about 100 litres of waste oil and another hotel had also practiced
reuse due to an incentive from the Highland Council. One hotel took its used batteries to the
Refuse waste 67%
Recyclable materials
33%
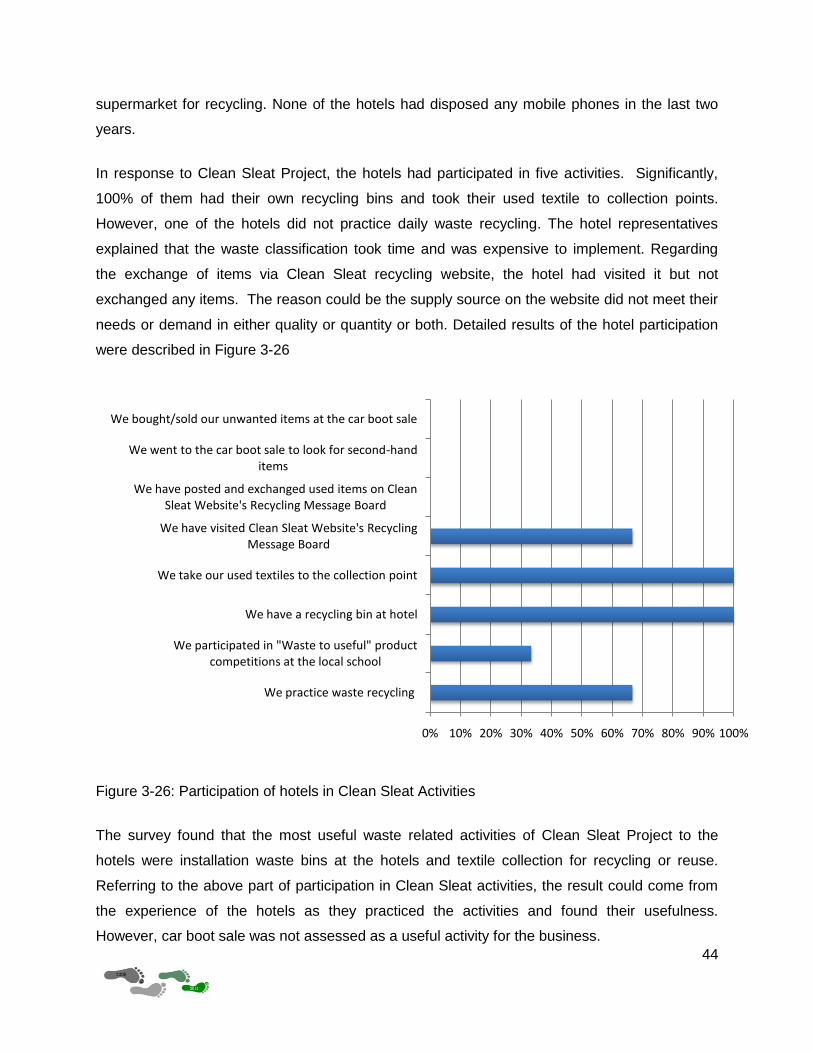
44
supermarket for recycling. None of the hotels had disposed any mobile phones in the last two
years.
In response to Clean Sleat Project, the hotels had participated in five activities. Significantly,
100% of them had their own recycling bins and took their used textile to collection points.
However, one of the hotels did not practice daily waste recycling. The hotel representatives
explained that the waste classification took time and was expensive to implement. Regarding
the exchange of items via Clean Sleat recycling website, the hotel had visited it but not
exchanged any items. The reason could be the supply source on the website did not meet their
needs or demand in either quality or quantity or both. Detailed results of the hotel participation
were described in Figure 3-26
Figure 3-26: Participation of hotels in Clean Sleat Activities
The survey found that the most useful waste related activities of Clean Sleat Project to the
hotels were installation waste bins at the hotels and textile collection for recycling or reuse.
Referring to the above part of participation in Clean Sleat activities, the result could come from
the experience of the hotels as they practiced the activities and found their usefulness.
However, car boot sale was not assessed as a useful activity for the business.
0% 10% 20% 30% 40% 50% 60% 70% 80% 90% 100%
We practice waste recycling
We participated in "Waste to useful" product competitions at the local school
We have a recycling bin at hotel
We take our used textiles to the collection point
We have visited Clean Sleat Website's Recycling Message Board
We have posted and exchanged used items on Clean Sleat Website's Recycling Message Board
We went to the car boot sale to look for second-hand items
We bought/sold our unwanted items at the car boot sale

45
Figure 3-27: Ranking result of the hotels on usefulness of Clean Sleat activities
Due to the expense incurred by the hotel to recycle materials, it might be worthwhile for the
hotels to look for ways to reuse and to reduce their waste generation as well as for the Highland
Council to establish a fee for the commercial sector. The fees should be reasonable to
encourage the commercial sector to recycle more but high enough to prevent them from
generating a lot of waste.
Suggestions from the hotels, the Highland Council should include the collection of glass and
bottle increase in the frequency of the waste collection. Like the argument from the primary
school suggestion this would not be economically feasible.
3.2.8 Waste Carbon Footprint from Institutions, Hotels and Small Business
In total, 35.63 tonnes of CO2 was yearly reduced by CSP activities on waste management in the
institutions* hotels and business. 60% of the reduction was from plastic recycling, 25% from
metal recycling and the other 15% from recycling and reuse of paper, glass and clothing.
*institutions are school and college
0
1
2
3N
um
be
r o
f h
ote
ls

46
3.3. Finding and Analysis of Transport Sector
3.3.1 Methodology
The component method was basically used to quantify the transport carbon footprint from the
different modes of transport employed in Sleat. On the other hand the qualitative aspects of the
study were determined by assessing residents’ preferences of the available modes of transport
such as private car, or public transport. For example, the attitude change was reflected in the
number of people using public transport.
The level of attribution of these quantitative and qualitative changes to the Clean Sleat project is
discussed at the end of this chapter.
According to the 2008 study, the transport sector is the third largest contributor of CO2
emissions in Sleat. Out of 14,397 tonnes of CO2 emitted by Sleat’s residents in 2008, transport
contributed 4,044 tonnes after material and direct energy which contributed 4,511 tonnes and
4,283 tonnes respectively (SESAM 2008, 5-6). Under the Clean Sleat Project, the transport
sector was one of the main areas considered when attempting to reduce the carbon emissions
in Sleat. The activities undertaken in the transport sector include (Robertson 2010):
Lobbied the local bus and ferry companies for a better service.
Held two successful Great Sleat Cycle Weeks with many mini events (bike repair
workshop, family bike ride, bike to school week).
Bike Rack donation to Bun-Sgoil Shleite School.
Subsidized taxi service
3.3.2 Calculation of Reduction of CO2 Footprint from Transport
Parameters used in calculation
The number of car travel miles households replaced with public transport or use of bicycles was
an important parameter obtained from interviews. Emissions from car use and public transport
were compared to quantify the change in carbon footprint in Sleat between 2007 and 2010.
Furthermore, the number of bicycle rides that replaced car travels, were included in the
calculation. Information from interviews with public transport service providers were also
considered to verify data collected from households.

47
Limitation on analysis
Lack of segregated data on ferry passengers between tourists and local people
Lack of details about travel destination and mode of travel
Assumptions for analysis
In order to tackle the problem of lack of information in the analysis of carbon footprint from
transport, the following assumptions were made,
1. The diesel and petrol cars distribution didn’t change since 2008 (i.e. 55% for petrol cars
and 45% for diesel cars).
2. The travelled distance per one litre fuel remains the same as in 2008, i.e. 15.43 km/l for
petrol car and 14.86 km/l for diesel car.
3. The study did not consider air transport as this was not part of the activities of the Clean
Sleat project.
4. Car travels were assumed the same as in 2007 whenever they were not replaced with
either bicycles or public transport
With these main assumptions, the reduction in CO2 emissions was estimated using the fuel
consumption and distance that would have been travelled by private cars. On the other hand, as
some people switched from private cars to public transport, the corresponding emission was
calculated. The net reduction was the difference between the emissions that would have been
emitted if the private car had been used and that emitted by using public transport.
3.3.3 Major Findings
The analysis of the household survey shows that 92% of Sleat households own one or more
cars. The main purposes of the car use were, from the highest to the lowest, shopping, work
and leisure. On bicycle side, the survey shows that 62% of the total households own one or
more bicycles. Contrary with car, the bicycles are mostly used for leisure.
Subsidized taxi service
The introduction of the subsidised taxi was presented by the Sleat Community Trust to the
Highland Council as an alternative solution to the transport problems in the community. The
main reason for subsidising taxi services was to assist people who don’t own cars or who were
unable to drive to undertake some of their activities requiring a car. These activities included

48
appointment with doctors, shopping from the local shop, attending some social events in the
community. The subsidised taxi also allows connecting to the other means of public transport, in
particular the busses and the ferry. This subsidy scheme started in 2010 and 118 travels have
been registered as shown in Table 3-13.
Table 3-13: Comparison of taxi service before and after subsidies
Year No. of passengers Distance covered [km]
Subsidised Non subsidised
2009 0 7146 196420
2010 118 6398 193200
Source: (Peggy 2011)
Great Sleat cycle weeks
Different activities were organised during the Great Sleat Cycle Week (GSCW). The main ones
included the bike repair workshop, family cycle ride and children bike day. The objectives of the
cycle week were ( Sleat Community Trust 2009):
To provide a free bike health check and carry out any minor repairs that are required to
get the bike back into the road
To provide cycling advices and bikes for sell for those who are ready to by them
Encourage family cycle ride
Encourage children to go to school by bike
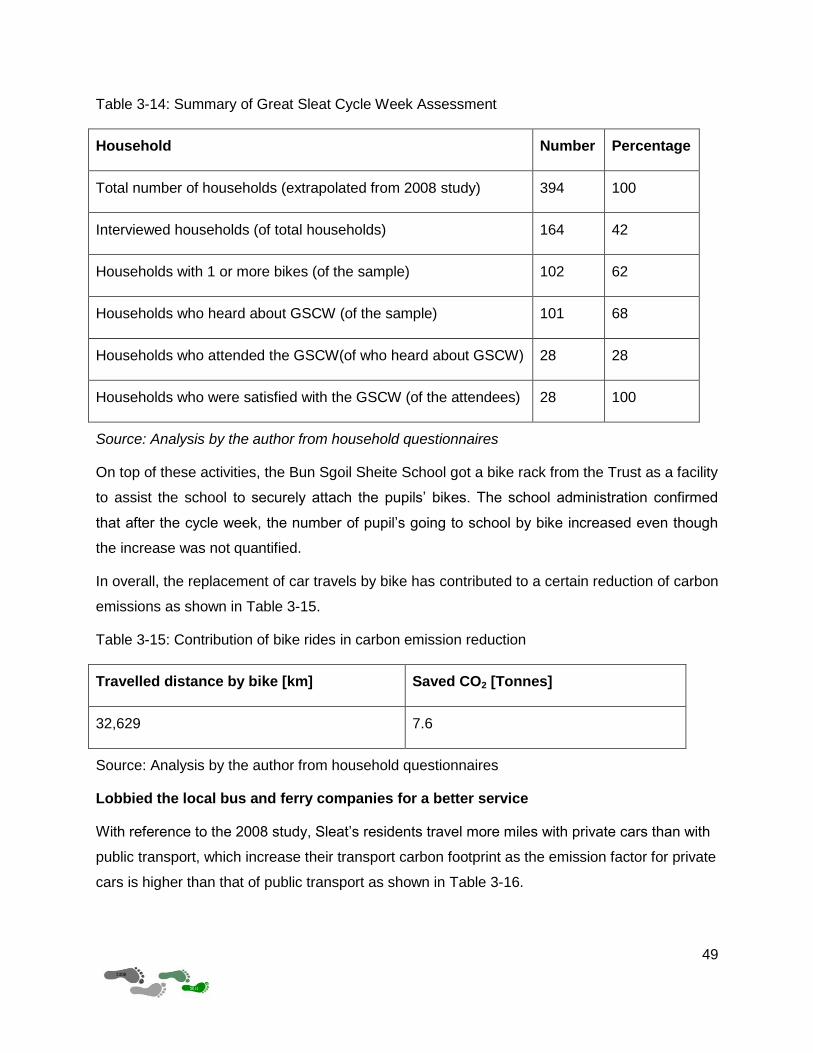
49
Table 3-14: Summary of Great Sleat Cycle Week Assessment
Household Number Percentage
Total number of households (extrapolated from 2008 study) 394 100
Interviewed households (of total households) 164 42
Households with 1 or more bikes (of the sample) 102 62
Households who heard about GSCW (of the sample) 101 68
Households who attended the GSCW(of who heard about GSCW) 28 28
Households who were satisfied with the GSCW (of the attendees) 28 100
Source: Analysis by the author from household questionnaires
On top of these activities, the Bun Sgoil Sheite School got a bike rack from the Trust as a facility
to assist the school to securely attach the pupils’ bikes. The school administration confirmed
that after the cycle week, the number of pupil’s going to school by bike increased even though
the increase was not quantified.
In overall, the replacement of car travels by bike has contributed to a certain reduction of carbon
emissions as shown in Table 3-15.
Table 3-15: Contribution of bike rides in carbon emission reduction
Travelled distance by bike [km] Saved CO2 [Tonnes]
32,629 7.6
Source: Analysis by the author from household questionnaires
Lobbied the local bus and ferry companies for a better service
With reference to the 2008 study, Sleat’s residents travel more miles with private cars than with
public transport, which increase their transport carbon footprint as the emission factor for private
cars is higher than that of public transport as shown in Table 3-16.

50
Table 3-16: Emission factors for different modes of transport
Unit Petrol cars Diesel cars Bus Train Ferry
kgCO2 per passenger
kilometre
0.207 0.197 0.115 0.078 0.115
Source: (Defra 2008, 18,20,21,24,26) based on load of private cars of 2 passengers and
average UK load for local bus, ferries and trains.
From the Table 3-16 it is evident that the use of public transport such as bus, ferry and train
would reduce considerably the emissions. Lobbying the local bus and ferry company to improve
their services so that more people can use them was one of the activities of Clean Sleat Project
in transport sector. To evaluate the achievement of this activity the households were asked if
they have an impression that the service of public transport has improved within the last two
years.
The findings of the analysis of the improvement of ferry and bus services are shown in Figure
3-28 to Figure 3-31.
Figure 3-28: Assessment of improvement in frequency for bus service
Source: Analysis by the author from household questionnaires
From Figure 3-28 it is clear that the majority of the interviewees (66%) are not satisfied with the
bus service in terms of frequency. Contrarily with the bus service (Figure 3-29), only 20% of the
9%
25%
66%
Frequency of Bus
Very improved Slightly improved Not improved at all

51
people said that the frequency of the ferry service has not been improved while 39% were of the
opinion that it has improved very much.
Figure 3-29: Assessment of improvement in frequency for ferry service
Source: Analysis by the author from household questionnaires
Regarding punctuality, the ferry seems to have more improved than the bus, but still, 30% do
not see any improvement (Figure 3-30 and Figure 3-31).
Figure 3-30: Assessment of improvement in punctuality for buses
39%
41%
20%
Frequency of Ferry
Very improved Slightly improved Not improved at all
33%
28%
39%
Punctuality of Bus
Very improved Slightly improved Not improved at all
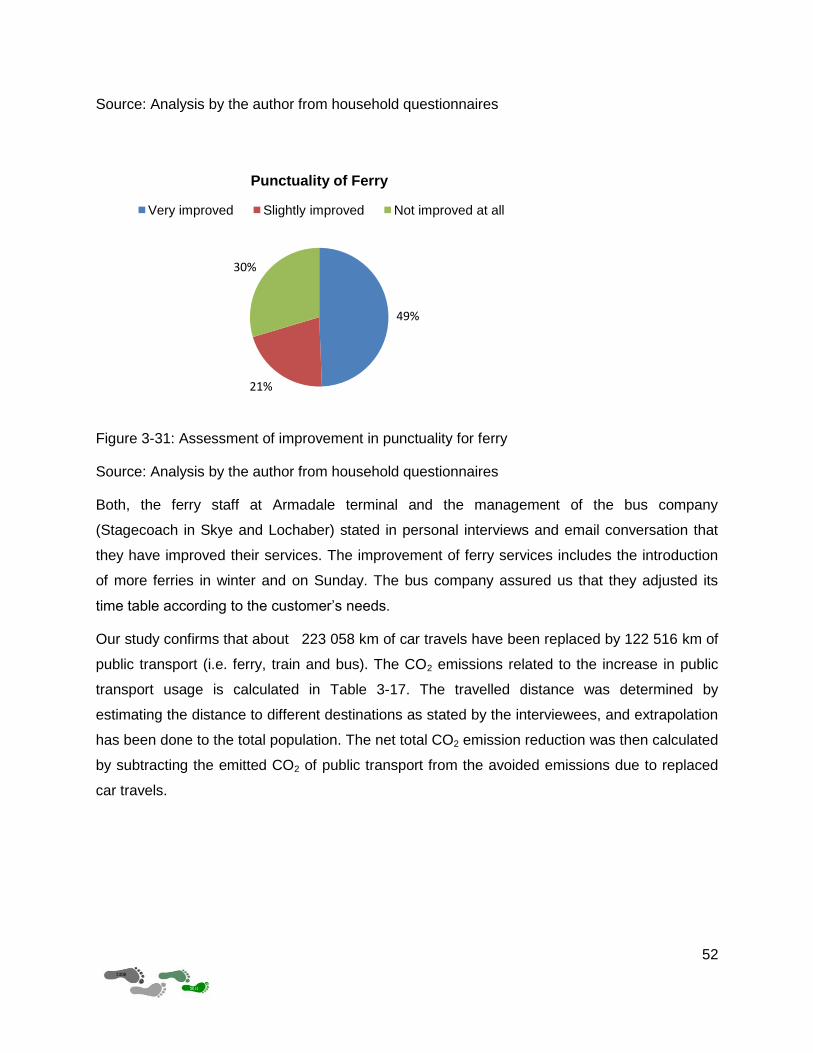
52
Source: Analysis by the author from household questionnaires
Figure 3-31: Assessment of improvement in punctuality for ferry
Source: Analysis by the author from household questionnaires
Both, the ferry staff at Armadale terminal and the management of the bus company
(Stagecoach in Skye and Lochaber) stated in personal interviews and email conversation that
they have improved their services. The improvement of ferry services includes the introduction
of more ferries in winter and on Sunday. The bus company assured us that they adjusted its
time table according to the customer’s needs.
Our study confirms that about 223 058 km of car travels have been replaced by 122 516 km of
public transport (i.e. ferry, train and bus). The CO2 emissions related to the increase in public
transport usage is calculated in Table 3-17. The travelled distance was determined by
estimating the distance to different destinations as stated by the interviewees, and extrapolation
has been done to the total population. The net total CO2 emission reduction was then calculated
by subtracting the emitted CO2 of public transport from the avoided emissions due to replaced
car travels.
49%
21%
30%
Punctuality of Ferry
Very improved Slightly improved Not improved at all

53
Table 3-17: Distance and carbon emissions released by increased public transport
Mode of
transport
Distance travelled
with public
transport [km]
Car km replaced
by public
transport [km]
Avoided CO2
emissions of
cars [Tonnes]
Emitted CO2 of
public
transport
[Tonnes]
Net CO2
savings
[Tonnes]
Bus 53,183 223,058 51.7
14.3 32.5
Ferry 1,946 0.6
Train 65,532 4
Taxi 1,855 0.3
Total 122,516 223,058 51.7 19.2 32.5
Source: Analysis by the author from household questionnaires
The calculations assume that the main destinations were Glasgow, Fort William and Inverness
as some of the respondents specified their destinations. The net CO2 savings due to bike rides
and replacement of car travels by public transport are shown in Table 3-18
Table 3-18: Net carbon emission reductions and equivalent fuel savings
Replacement of cars by
Amount of fuel savings
[litres Diesel equivalent]
Amount of CO2
savings [Tons]
Bike rides 2100 7.6
Public transport 9,000 32.6
Total 11,100 40.2
Source: Analysis by the author from household questionnaires
Per capita this represents 470 kg of CO2 savings or about 1% emission reduction in comparison
to 2007.

54
3.3.4 Interpretation of Findings of the Transport Sector
The following sections will give interpretations to the findings of the transport sector with respect
to the use of cars, bikes and public transport.
Car Use
The high percentage of Sleat resident owning cars is mainly due to three reasons: the next
supermarket, bank and other stores are located in Broadford, which is 25 km miles from
Armadale; the bus goes only along the main road until Ardvasar so that villages like Ard of
Sleat, Tarskavaig, Togavaig and Ord have no bus connection and the schedule and frequency
of the bus are not convenient to enable Sleat residents to use it at all times.
According to our interviews the car is used for shopping, work, leisure and business (from most
important to less important). The same ranking was found in the 2008 study (SESAM 2008, 31).
Shopping is still the main purpose the car is used for, because the Ardvasar shop offers the only
possibility to shop in Sleat.
Bike Use and Cycling Weeks
Bicycles are used mainly for leisure activities. The road conditions and landscape explain why
bikes are not used more often, either for leisure or for other purposes. The roads are very
narrow except for the main road which could pose a risk to the biker if a car comes and the
landscape is hilly. With respect to taking the bike for shopping another difficulty has to be
considered: the supermarket is far and households usually buy supplies for several days thus it
is difficult to transport everything with a bike.
To promote the use of bikes the Clean Sleat project initiated the Great Sleat cycle weeks. 68%
of the households heard of them. From the households where one or more persons own a bike
28% participated in the cycle weeks. Although, at first glance, this figure seems to be not high
the cycle weeks can be considered as successful. One activity during the cycle weeks was, for
example, that on one day of the week car travel was replaced by bike (―Cycle to anywhere day‖)
(Community Trust 2009). But for some people the workplace is too far away to cycle there, so
they could not attend the event. Other activities addressed children or families (―Children’s bike
days‖, ―Family cycle ride and picnic‖), so that households without children could not participate
(Community Trust 2009). Therefore it is not astonishing that the survey showed that a majority
of the participants of the cycling activities during the cycle weeks were children.

55
Another activity of the cycle weeks was a repair workshop. The sample showed that more adults
participated in the repair workshop compared to the cycling activities. And although 61% said
that they knew how to repair bikes before the cycle weeks all attendants of the cycle weeks
were satisfied and had their expectations met. The repair workshop was a good initiative to
show children how to repair a bike and for the adults it was a refreshment of their knowledge on
bike repair because all households who participated in the repair workshop stated that they
repair the bikes on their own. Furthermore, a health check of the bikes was provided which
could encourage people to use their bike more often if it had problems before.
Overall, the cycle weeks helped to promote the use of bikes. Despite the challenges of using a
bike in Sleat, mentioned above, a total of 32 629 km of car travels were replaced by bike rides in
2010. This subsequently contributed to the reduction of the transport carbon footprint.
Furthermore, 23% of the households which own bikes acquired one or two of their bikes in
2010.
Public transport
In total, an estimated 40 tonnes of CO2 were reduced in the transport sector compared to the
study in 2008. This amount, in part, was from the car travel replaced by bike but the larger share
(81%) is from the replacement of the car travels by public transport. In 2010 223 058 km (this
distance equals to 693 times a round trip from Armadale to Inverness) of car travels were
replaced by bus, ferry, train and taxi, although the people did not have the impression that the
service of the public transport had significantly improved and many suggestions were made with
respect to possible improvements.
Particularly for the bus service the people had the impression that the service had not improved.
Within the different categories of the service (frequency, fee, punctuality, comfort) the frequency
was ranked the lowest. This was also found in the suggestions for improvement where 27% of
the respondents were asking for a more frequent bus and ferry service and 13% of the
respondents requested a timetable which is more convenient for local people (especially
improvement for people who want to use the bus or ferry to go to work). Improvement in the bus
time table are probably tailored to suit tourists (who account for two third of the total passengers
according to the information of the bus company) and not residents. The respondents
recognized that there was an increase in the ferry service with respect to. However, they still
made suggestions for a more frequent service in winter time including a ferry on Saturday.

56
The bus company stated that they adjusted their timetables to meet connecting trains and
ferries on a seasonal basis (winter and summer schedule). However, with 47% the most
frequent suggestion for improvement of the service of the public transport was the coordination
between bus, ferry and train timetable. The problem of getting connecting public transport was
perceived as the biggest hindrance for the residents of Sleat in public transport use. That means
that further effort should be made to improve the coordination of bus, ferry and train and these
efforts should also be communicated to the potential customers.
In 2010 a subsidised taxi service was introduced by the Sleat Community Trust and 118 travels
were done through this service. There are three possible reasons why the service was not used
more frequently although 80% of the taxi fee was covered through the Community Trust. First of
all people did not feel well enough informed, although the service was advertised in the
community newsletter. Several interviewees stated that they did not know about this service.
Secondly, the procedure to book the taxi service was perceived as too bureaucratic. One had to
first call the trust who in turn called the taxi. Thereafter the Trust called the person to give
him/her a reference number. Probably people were reluctant to use the taxis as a result,
because this booking procedure could have been perceived as intrusive to their privacy. To
improve the service the procedure to book the taxi should be improved and the service has to
be promoted further. But a suggestion found from the questionnaires was to tailor the
subsidised taxi more to people without a car and people who are unable to drive. From the
perspective of carbon emissions reduction this suggestion should be considered. If car travel is
replaced by taxi travel (with the same number of people) the emissions will increase as the taxi
travels at least twice the distance of an individual car.
Of the households owning a car 23% replaced car travels by public transport and 15% of the
households owning a bike replaced car travels by bike rides in 2010. Although this might partly
be caused by the increased fuel price and the economic crises it can also be attributed to an
increase in the awareness of the negative impacts of transportation on the environment. The
suggestion to encourage car sharing is as well an indicator for this awareness. To turn
awareness into activities, promotion programmes should continue to further encourage people
to use public transport and bikes instead of the car.

57
3.4. Food
This section discussed the methodology, findings and interpretation of food sector. The main
activities discussed under this section were composting and hire of rotavator and garden
shredder.
3.4.1 Carbon Footprint Methodology for Food
Data on vegetable and fruit production were gathered from households, primary school, the
college, and hotels. The focus of information was the production of vegetables and fruits. This
was done to assess how far the hire of the rotavator and the garden shredder led to an increase
in the production of vegetables and fruit. The composting and equipment hire were targeted at
promoting an attitude change in the lifestyle of the Sleat residents which could lead to reduction
of the food carbon footprint.
The change in the net consumption was calculated by aggregating the reported increases in
vegetables and fruit production. It was assumed that this replaced an equivalent amount of
vegetables and fruit that normally would have been bought from the supermarket The change
in the embodied energy was, in part, attributed to the Clean Sleat Project activities.
It was assumed that the use of the rotavator and the making of compost resulted in an increase
of the vegetables grown locally in Sleat. The increase in the vegetables and fruit attributable to
the Clean Sleat project was then multiplied by the energy embodied [EmbEn, (Mj/kg)] to give the
total energy for each product consumed. The embodied energy data come from the Global
Footprint Network database which has been derived from the UN COMTRADE3 database
(Kitzes, et al. 2008).
The practices and attitudes of Sleat residents towards growing their own vegetables and fruit
were assessed with respect to the following aspects:
Frequency of using the community rotavator and garden shredder for growing
vegetables and fruit.
3The COMTRADE database gives the embodied energy for each traded good and quantities for each country. The
carbon emissions associated with internationally traded items are calculated based on the global average carbon
intensity of fuels used for heating and electricity production from the national footprint accounts

58
Household’s involvement in composting and equipment hire from the Clean Sleat
Project.
The degree of satisfaction derived from using the hired equipment.
The household’s willingness to pay for the equipments hired
3.4.2 Findings and Interpretations
According to the ecological footprint study of 2008 the total food consumption for residents and
tourists in Sleat in 2007 was 483 tonnes of which tourists accounted for 53.3%. This led to a
calculated 650 tonnes CO2 emission from food (0.77 tonnes per capita) in 2007. The annual
food consumption profile of Sleat residents in the 2008 study showed that vegetables and fruits
constituted the second largest portion of food consumed.(SESAM 2008, 38-9). In our study we
found the total CO2 emission savings due to food between 2008 and 2010 is 0.93 tonnes of
CO2.
The rotavator uses fossil fuel for operation and therefore has a carbon footprint associated with
it. However, the carbon footprints of vegetables and fruit that are not locally produced are
significantly higher. This is mainly due to the energy embodied in the transportation of such
items from location of their production until they end up in supermarket. Therefore to grow
vegetables and fruits locally results in a reduction of CO2 emissions.
Compost Making Activities
As the sample size of data collected through household interviews was 164, this had to be
extrapolated to a population of 394 households. These figures showed that 245 households out
of the 394 made compost which is 62% of all households in Sleat. 67 of these households
(about 27%) started composting after 2008. This change could partly be attributed to the Clean
Sleat Project since the households were also persuaded to compost through other means.

59
Figure 3-32: Household uses of compost (Source: Analysis from the household data)
As shown in Figure 3-32, a higher share of compost was used to grow flowers before and after
2008. An increase in the use of compost to grow vegetables and fruit might lead to an increase
in production. As was mentioned above, growing own food reduces carbon footprint as
compared to buying it from a supermarket.
26% of total households do not practice composting. Nearly 10% of these households fed their
pets and domestic animals on the organic waste that would have been used for composting.
About 11% of the households that did not compost said they had no time, no interest and no
use for compost. It was found that 249 households had land for growing vegetables and 76%
(189) of these households were composting. This shows that the majority of households which
have land practice composting.
Sabhal Mòr Ostaig College cultivated their own vegetables and fruits within the project period.
They used mainly composting to produce a yield of 250 kilograms per year since 2009 which
replaced to some extent their fruits and vegetable purchased from suppliers.
Two hotels and one cafeteria reduced their carbon footprint by replacing their vegetables and
fruit purchases from suppliers with locally produced ones.
0
50
100
150
200
250
300
before 2008 in 2010
Num
ber
of H
ousehold
s
using compost to grow vegetables and fruit
Spreading compost in garden for flowers
Total composting

60
Equipment Hire
Clean Sleat project provided a rotavator and a garden shredder to encourage local vegetable
and fruit production in the Sleat community. Below in Table 3-19 is a brief summary of this
activity.
Table 3-19. Equipment hire (Source: Analysis from the household data)
Activity Number of Households
Rotavator Hire 31
Garden Shredder Hire 17
Average frequency of hiring rotavator or garden shredder per year = 1
Seventeen households stated that they had an increase in their vegetables and fruit production
in the last 2years. These 17 households’ assigned figures to the increases in vegetables and
fruit production. Ten out of this 17 consequently reduced their purchases of vegetables and
fruits from the supermarket on a weekly basis. It was interesting to note that only these 10 out of
the 17 households that had increased production in the vegetables and fruits actually
participated in both making compost and hiring of the rotavator. Therefore it can be assumed
that the increase in vegetable production between 2008 and 2010 of the households is
attributed to composting and rotavator hire. The role of other factors like weather, soil conditions
and agricultural practices in the vegetable and fruit production should not be ignored.
Twelve out of 17 households (70%) that hired the rotavator or shredder from the Clean Sleat
project had problems with operating them. The major concern of these households was the fact
that there was no delivery track to deliver the rotavator. Five households also mentioned
assistance was needed for delivery since the equipment is heavy. According to the data two
household had clogging problems with the garden shredder during its operation. It was also said
by 7 households to be too small in size to cut or trim bigger branches. The fact that the
equipment hire depends on seasonal gardening activities might have influenced the hiring of the
equipment and discouraged households that are yet to use it. .
The Clean Sleat project did not charge a fee for the use of the rotavator and garden shredder.
To measure the attitude change with respect to the hiring of these two items, respondents were
asked if they were willing and able to pay for their use. . 71% of the households that hired the
rotavator in the past were willing to pay an average of £7.00 per day. This means that

61
households which used the rotavator derived benefits enough to allocate a charge to its use.
Two of the households that used the garden shredder were willing to pay even £20 and £35 for
its hire. It was noticed that these two households participated in almost all activities of the Clean
Sleat project which shows that they were very much interested in the project.
The local production and purchase of vegetables and fruit contributed to reducing the carbon
footprint of Sleat in the past two years. As mentioned above, the households and the college
were the main local producers of vegetables and fruit. The two hotels and one cafeteria
contributed to the reduction of footprint by replacing their purchases of vegetables and fruits
from suppliers with local produce.
The carbon footprint for food for households was calculated based on the reported increase in
the vegetables and fruit production. The households that increased their food production said it
was on the basis of 4% average per year of their production in 2008. Table 3-20 below shows
various categories and the amount they contributed to the food footprint reduction. The total
food footprint savings for 2010 is 0.94 tCO2.
Table 3-20: Calculation of the carbon footprint for food
Category
Activity
Production in
Kilograms
CO2 Emission
savings (tCO2)
17
Households
Composting and hiring
equipment to grow own food
330 0.183
College Composting to grow own
vegetables
250 0.14
2 Hotels and 1
Cafeteria
Purchase of locally produced
vegetables
1100 0.612
Total 1,680 0.94
(Source: Analysis from the household data)

62
Suggestions for improvements on Composting and Equipment Hire
These suggestions were derived from the comments and problems as stated by the
respondents during the survey.
1. There were 19 households that never tried composting and 7 others who claimed
composting was a difficult process. This neglect and hesitation could be addressed
through an awareness programme and training workshops on how to make and use
compost.
2. Seventeen households said they did not have use for the compost. An arrangement
could be made where organic waste from these households could be collected and
sent to local farmers with bigger compost bins. Households should also be
encouraged to exchange organic waste or compost.
3. 10 households had problems with the equipment they hired such as transportation,
logging and handling. The respondents suggest a maintenance team be employed
to address operational problems
Assessment of Attitudes towards local vegetables and fruit production
It was difficult to attribute emission changes or savings directly to the Clean Sleat Project
activities of composting and equipments hire because other influencing activities were
concurrently taking place.
Nevertheless the following attitude changes with respect to composting were found to be:
In practice: An increase of 27% of households that composted within the two year period
of the project shows the readiness to composting. It is a good basis to build upon.
In Knowledge: The understanding of and perceptions about the use of compost is mostly
clear
In Satisfaction: Most households were satisfied with benefits of composting although
they did not have very significant yields.
Attitude changes with respect to equipment hire were as follows:
In practice: Despite the activity being relatively new, (rotavator bought in March 2010
and shredder October 2010) respondents were aware of it. Currently 41 households
have used the equipment.
Opinion on equipments: The households had identified some concerns with the use of
the equipments but, the benefits they derived from using them outweighed the problems.

63
Satisfaction: There is willingness to pay for the use of the equipment, although it was
initially free. This is a good sign of derived satisfaction and taking responsibility/
ownership of the equipment and realizing the benefits it has.
3.5 Summary of CO2 Savings
This section summarises the estimated carbon dioxide emission reduction that have been
quantified during the study. A total of 478 tonnes CO2 has been reduced through the various
activities of the Clean Sleat Project. The table below shows the reductions per capita of the CO2
emissions for the various sectors.
Table 3-21: Summary of CO2 savings
Sector Activity Reductions per
activity [kgCO2]
Reductions per
sector [kgCO2]
Reductions per
capita [kgCO2]
Direct Energy
Energy audits and
home insulation 37 000
336 000 390
CFL dissemination 23 000
Stand-by savers
dissemination 1200
Increased use of
firewood in the
residential sector
193 000
Wood chips in College 82 000
Transportation Bike rides 7600
40 200 43 Public transport 32 600
Waste
Household 65 000
101 000 107 Institutions, hotels and
small business 36 000
Food Local vegetable and
fruit production 930 930 1
TOTAL 478 130 541

64
4. Scenarios
The results of the study indicated that in total 478 tonnes of CO2 emission was avoided through
CSP activities. However, there are still potential opportunities for Sleat to continue reducing the
carbon footprint in future. Therefore, three scenarios are proposed based on the current context
of the peninsula: replacing brown electricity with green electricity in households and college,
improving insulation of residential homes and replacing heating fossil fuel with biomass.
4.1. Green Electricity
This scenario discusses the possibilities of Sleat’s residents to reduce the CO2 emissions if they
shift from the normal to the green electricity. Green electricity ―is the electricity that is generated
from renewable resources with minimal adverse environmental effects‖ (NAGPI 2008). The
brown electricity is that from other sources than renewable or the mixture of renewable and non
renewable sources. When green electricity tariffs are chosen, the utilities supply to the
consumers the electricity from renewable energy sources, and hence the CO2 emissions are
drastically reduced. More details about suppliers of green electricity can be found on the Living
Ethically (Living Ethically 2011). In Scotland however, renewable electricity is eligible for green
electricity tariffs if it is additional. Additional renewable electricity is the amount of renewable
electricity beyond what the suppliers are required to produce under the Renewables Obligation
(RO) (Energy Saving Trust 2011).
According to the study on the ecological footprint of Sleat conducted in 2008, the consumption
of electricity for the residential sector was 2.8 GWh which emitted 1,137 tonnes of CO2 (SESAM
2008, 5-6). Based on this figure we calculated how much the emissions would be reduced if a
certain fraction of the population would switch to green electricity. We must say however, that
we do not know exactly the percentage of Sleat residents and institutions that is already using
green electricity. The Table 4-1 summarises the possible CO2 reductions for different
penetrations of green electricity.
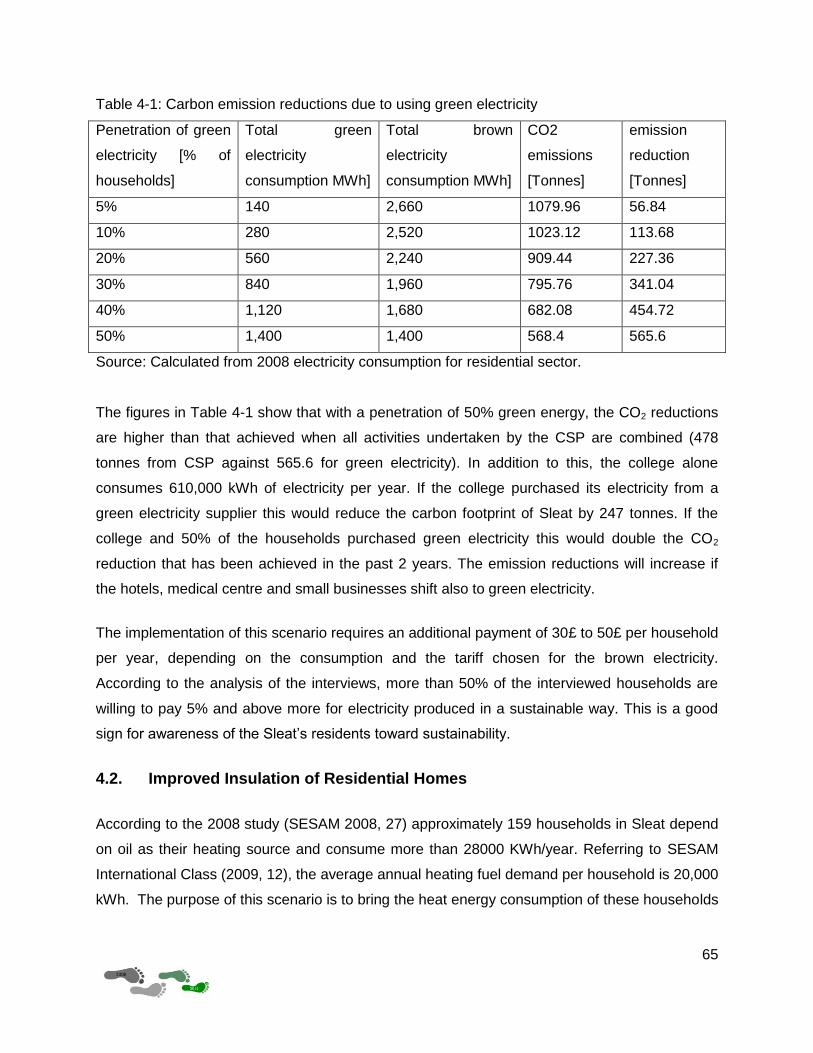
65
Table 4-1: Carbon emission reductions due to using green electricity
Penetration of green
electricity [% of
households]
Total green
electricity
consumption MWh]
Total brown
electricity
consumption MWh]
CO2
emissions
[Tonnes]
emission
reduction
[Tonnes]
5% 140 2,660 1079.96 56.84
10% 280 2,520 1023.12 113.68
20% 560 2,240 909.44 227.36
30% 840 1,960 795.76 341.04
40% 1,120 1,680 682.08 454.72
50% 1,400 1,400 568.4 565.6
Source: Calculated from 2008 electricity consumption for residential sector.
The figures in Table 4-1 show that with a penetration of 50% green energy, the CO2 reductions
are higher than that achieved when all activities undertaken by the CSP are combined (478
tonnes from CSP against 565.6 for green electricity). In addition to this, the college alone
consumes 610,000 kWh of electricity per year. If the college purchased its electricity from a
green electricity supplier this would reduce the carbon footprint of Sleat by 247 tonnes. If the
college and 50% of the households purchased green electricity this would double the CO2
reduction that has been achieved in the past 2 years. The emission reductions will increase if
the hotels, medical centre and small businesses shift also to green electricity.
The implementation of this scenario requires an additional payment of 30£ to 50£ per household
per year, depending on the consumption and the tariff chosen for the brown electricity.
According to the analysis of the interviews, more than 50% of the interviewed households are
willing to pay 5% and above more for electricity produced in a sustainable way. This is a good
sign for awareness of the Sleat’s residents toward sustainability.
4.2. Improved Insulation of Residential Homes
According to the 2008 study (SESAM 2008, 27) approximately 159 households in Sleat depend
on oil as their heating source and consume more than 28000 KWh/year. Referring to SESAM
International Class (2009, 12), the average annual heating fuel demand per household is 20,000
kWh. The purpose of this scenario is to bring the heat energy consumption of these households

66
in Sleat down to the Scottish average of 20000 KWh. The following sub-scenarios have been
considered:
1. Improving heating consumption of 159 old houses using oil heating system down to the
Scottish average of 20000 kWh
2. Switching the 159 household heating fuel source from oil to LPG and bringing them
down to the Scottish average of 20000 kWh
Criteria of selection:
a. Households with an oil heating consumption of more than 28000 kWh/year
b. All 159 households are detached with 3 or more bedrooms
The results of both alternatives are shown in Table 4-2.
Table 4-2: Energy and CO2 Savings on Housing Heating Insulation
Number of Households consuming more than
28,000 KWh
Before improvement After improvement Savings
Sub-scenario Heating
consumption (KWh)/year
CO2* (tonnes)
Heating consumption (KWh)/year
CO2 (tonnes)
Energy saving (KWh)
saved CO2 (tonnes)
Improved insulation
only 159 4593253 1194 3172500 825 1420753 369
Improved
insulation
plus LPG instead of
oil
159 4593253 1194 3172500 603 1331652 591
*: oil emission factor = 0.26 kg CO2/kWh and gas emission factor = 0.19 kg CO2/kWh
The improvement of housing insulation can be done by the following energy saving measures
(Energy Saving Trust 2011):
1. Installing cavity wall insulation
2. Topping up the loft insulation
3. Fitting energy saving recommended windows (double glazing)
4. Fitting draught proofing
5. Installing floor insulation
6. Fitting pipe insulation
7. Turning the thermostat down by 1oC
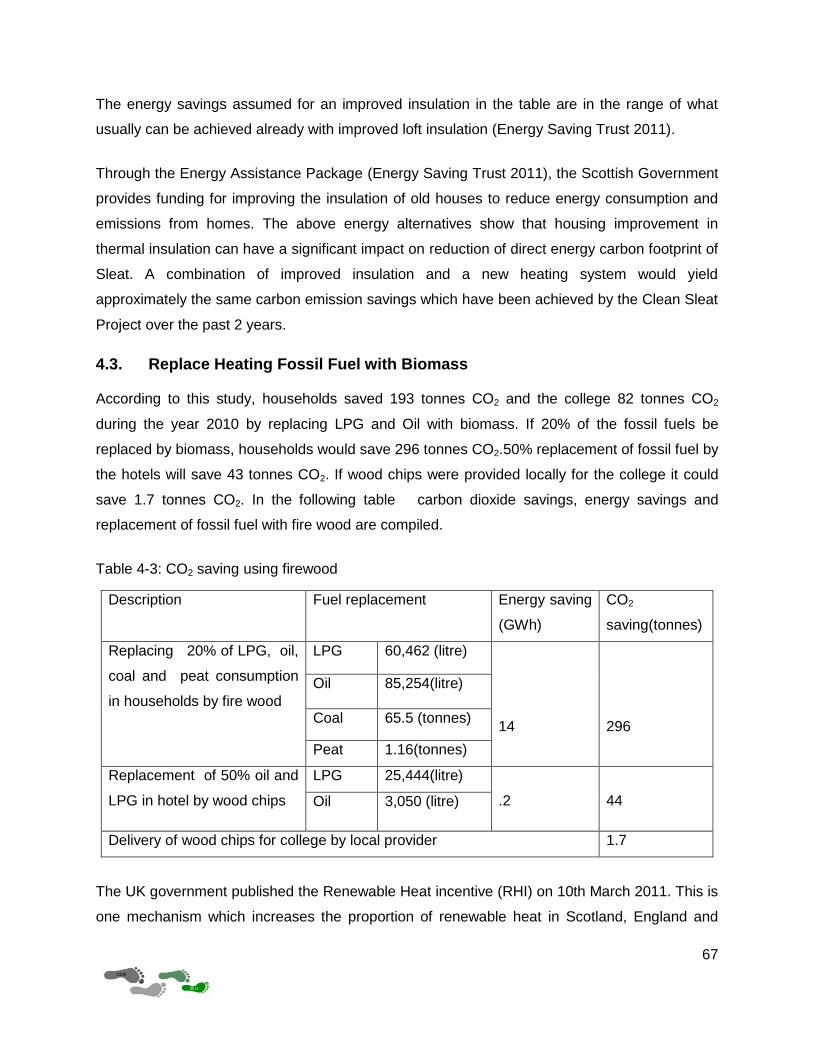
67
The energy savings assumed for an improved insulation in the table are in the range of what
usually can be achieved already with improved loft insulation (Energy Saving Trust 2011).
Through the Energy Assistance Package (Energy Saving Trust 2011), the Scottish Government
provides funding for improving the insulation of old houses to reduce energy consumption and
emissions from homes. The above energy alternatives show that housing improvement in
thermal insulation can have a significant impact on reduction of direct energy carbon footprint of
Sleat. A combination of improved insulation and a new heating system would yield
approximately the same carbon emission savings which have been achieved by the Clean Sleat
Project over the past 2 years.
4.3. Replace Heating Fossil Fuel with Biomass
According to this study, households saved 193 tonnes CO2 and the college 82 tonnes CO2
during the year 2010 by replacing LPG and Oil with biomass. If 20% of the fossil fuels be
replaced by biomass, households would save 296 tonnes CO2.50% replacement of fossil fuel by
the hotels will save 43 tonnes CO2. If wood chips were provided locally for the college it could
save 1.7 tonnes CO2. In the following table carbon dioxide savings, energy savings and
replacement of fossil fuel with fire wood are compiled.
Table 4-3: CO2 saving using firewood
Description Fuel replacement Energy saving
(GWh)
CO2
saving(tonnes)
Replacing 20% of LPG, oil,
coal and peat consumption
in households by fire wood
LPG 60,462 (litre)
14
296
Oil 85,254(litre)
Coal 65.5 (tonnes)
Peat 1.16(tonnes)
Replacement of 50% oil and
LPG in hotel by wood chips
LPG 25,444(litre)
.2
44 Oil 3,050 (litre)
Delivery of wood chips for college by local provider 1.7
The UK government published the Renewable Heat incentive (RHI) on 10th March 2011. This is
one mechanism which increases the proportion of renewable heat in Scotland, England and

68
Wales from 1% of the total heat consumption to at least 12 % by 2020. To encourage the
biomass heating, Carbon Trust (UK wide) and the Energy Saving Trust (Scotland) help
customers to get a loan from this scheme.
(energy, http://www.hwenergy.co.uk/news_item.asp?id=26 n.d.)
69
5. Conclusions and Suggestions
This study aimed at evaluating the achievements of the Clean Sleat Project. The main objective
of the project was to achieve, by 2010, a reduction of 33% in CO2 emissions through
implementation of different activities. The undertaken activities focused on residential energy
consumption, household waste management, transportation and vegetable and fruit production.
The objectives were evaluated against their relevance, effectiveness, impact (quantitative and
qualitative) and sustainability.
For the sector of direct energy all activities except for CFL and stand-by-saver dissemination
were found to be relevant for achieving the project goals. The effectiveness and impact could be
seen for all energy activities which were relevant and also for the CFL dissemination, because
almost all households are using CFL (in total direct energy this contributed about 70% of the
total reductions). With respect to sustainability one has to differentiate between the activities.
Energy audits are only sustainable if they are focused on improving old buildings with respect to
their energy consumption. The promotion of increasing the use of firewood is sustainable,
because the buyout of Tormore forest by the community ensures local supply of firewood on a
long term. The college currently buys its firewood from suppliers outside Sleat. Hence it would
become more sustainable once a local supply of woodchips by the community is ensured.
In the transport sector the Clean Sleat project introduced a subsidised taxi service and lobbied
the bus and ferry company to improve their service. The lobbying with the bus and ferry
company was relevant, but only slightly effective, because people were still not satisfied with the
service. With respect to its impact it was found that Sleat residents replaced car travels by
public transport in 2010, but the number could be increased if the effectiveness is improved (the
transport sector contributed around 8.5% to the reductions). The activity was sustainable,
because the companies will most likely keep on with this service if they recognize the positive
effect it has on the number of passengers.
For the subsidised taxi service it was found that it was only partly relevant and had a small
impact, because not many people used it so far. If it would be promoted for its initial purpose
(being the linkage for people in remote villages to the ferry terminal and the main road so that
they can use the bus) it would be more relevant, probably have a higher impact and also be
more sustainable.
The waste sector concentrated on home bin recycling and local recycling points. Waste
recycling with respect to the home recycling bin is relevant and the impact of this activity is
70
evident (with an 11% increase in the recycling rate from 2007 to date and 21% contribution to
CO2 reductions). Therefore it can be concluded that this activity has been effective. With respect
to sustainability, a large portion of the community is in possession of a home recycling bin and
do practice recycling. Even though local recycling points are relevant, the impact of this activity
has not been seen. This would also imply that this activity has not been so effective. Local
recycling points are only sustainable if more people begin to use them. Therefore sustainability
in this case is directly linked with local recycling awareness programmes.
In the food sector the activities of equipment hire and composting where the focus areas. It
should be noted that the equipment loaned by the community trust was acquired in October
2010. Therefore it is fair to conclude that the relevance of this activity is too early to be
determined and the impacts have not fully been felt (contribution to total reductions less than
1%). Nevertheless, the activity seems to be sustainable, because even though the equipment is
being borrowed for free, there is a willingness to pay for it by most users.
Producing compost may not be directly related to the project activities in the food sector, but it is
of great relevance especially to the people who use compost to grow their food. This has
resulted in the increase of local food production in the area by some households.
Overall it can be concluded that the Clean Sleat project was relevant because almost all
activities were seen relevant by the residents. The project contributed to reduce the CO2
emissions in Sleat by 3.3% compared to 2007. This figure shows that the project was only partly
effective because it did not reach its ambitious goal of a 33% reduction in CO2 emissions. But
the 478 tonnes of CO2 which were saved show that it had already a considerable impact. The
largest share of this reduction was through the use of biomass and woodchips. That shows how
important the activities in this area were.
One of the scenarios shows that there is still the potential to achieve more: if 20% of the
households would replace fossil fuels by biomass the CO2 emissions could be reduced by
another 296 tonnes.
The Clean Sleat Project also aimed at increasing the awareness of the residents with respect to
climate change and the environment. This was quite successfully done as 32% of the
households stated that they learnt more about the issue of climate change through the Project.
Almost two third of the households (64.5%) pointed out that they do their best to reduce their
carbon footprint which shows again the increased awareness. But awareness is just the first

71
step and should be followed by action. To really change attitude takes a long time so that
promotion programmes should be continued.
In general, the residents of Sleat care for the environment and are even willing to pay in
average 8 – 9% more for products and services produced in a sustainable way. This positive
attitude could be used for future activities and projects. From the suggestions we got from the
interviewees and our analysis we think the following aspects should be considered for the
different sectors:
Direct energy
Energy audit reports could be tailored so that beneficiaries are able to understand them.
The audit should also target firstly the old houses as the new ones were built according
to the standards. Follow up services and advise in implementing energy efficiency
measures are essential.
Due to the fact that CFLs contain mercury, the issue of how they are disposed of should
be carefully considered. Other technologies, such as LED are now penetrating in the
market. This should be observed carefully.
The Trust should assist in provision of firewood by either lobbying the suppliers or
becoming the supplier. It is essential that the Trust ensures a good quality of the
firewood and woodchips provided.
The follow up for solar water heaters is required. We suggest that the Trust continues to
organise events and workshops to promote the use of solar water heaters and links up
interested residents with qualified installers.
Three scenarios have been suggested regarding buying green electricity, replacing
heating fossil fuel with biomass and improving the insulation of residential homes.
Waste
Organize fun activities to involve all children of Sleat in the awareness raising not only
those who attend the local primary school
Transport
Continue the lobbying of the providers of public transport to improve their service and
also communicate this to Sleat residents as their potential customers
Analyse how car sharing could be promoted
Promoting the subsidised taxi service tailored to its initial target of connecting remote
villages to the main road

72
Analyse how the car travels for shopping could be reduced through either making the
local shop more attractive or the possibility of a food delivery service
Food
Keep on with the promotion of cultivator and garden shredder and encourage the Sleat
residents to grow their own vegetables and fruit
Introduce a local weekly market where people can buy and sell locally produced
vegetables and fruits
From our point of view the Community Trust should within its means continue to support the
initiatives towards carbon reduction irrespective of the Clean Sleat Project’s phasing out. It is
important to keep on with the promising first steps of awareness raising and encouraging people
to actively reduce their carbon footprint.

73
6. Bibliography
Benn, Hilary. BBC News. September 2007. http://news.bbc.co.uk/1/hi/uk/7016020.stm
(accessed March 13, 2011).
Chamber, Nicky Craig, Simmons and Mathis, Wackernage. Sharing Nature's Interest, Ecological
Footprints as an indicator of sustainability. London: Earthscan, 2007.
Chambers, Nicky, Rachel Child, Nicola Jenkin, and Kevin Lewis. Ecological Footprint analysis
and sustainability assesment. Best Foot Forward Ltd, 2005.
Clean Sleat Project. History: Clean Sleat. http://cleansleat.moonfruit.com/#/history/4535004313
(accessed 03 10, 2011).
—. "Home:Clean Sleat." http://cleansleat.moonfruit.com/# (accessed 03 12, 2011).
Defra. Guidelines to Defra’s GHG Conversion Factors. Methodology Paper for Transport
Emission Factors, London: Department of Environment, Food and rural Affairs, 2008.
Eco Schools Scotland. Eco Schools Scotland Website. http://www.ecoschoolsscotland.org/
(accessed March 14, 2011).
Ecotricity. For Your Home: Ecotricity. http://www.ecotricity.co.uk/for-your-home/fair-price-
promise (accessed March 14, 2011).
Energy Saving Trust. At Home: Energy Saving Trust. 2011.
http://www.energysavingtrust.org.uk/Generate-your-own-energy/Buying-green-electricity
(accessed March 14, 2011).
—. Carbon Cutter - Carbon Footrprint - Energy Saving Trust - UK | Scotland. 2011.
http://www.energysavingtrust.org.uk/calculator/checklist (accessed March 11, 2011).
—. Energy Saving Trust website. 2011. http://www.energysavingtrust.org.uk/Easy-ways-to-stop-
wasting-energy/Energy-saving-grants-and-offers (accessed March 15, 2011).
energy, HW. http://www.hwenergy.co.uk/news_item.asp?id=26. (accessed 3 2011).
—. http://www.hwenergy.co.uk/news_item.asp?id=26. (accessed 3 2011).
Highland Council . Sleat Waste Arisings Figure. 2010.
Highland Council. Waste Aware Highland - Presentation for Public. March 31, 2009.
—. "Your New Recycling and Refuse Collection Guide." Recycling and Refuse Collection Guide.
Dingwall: The Highland Council, September 2010.

74
Highland Real Nappy Project. 2009. http://www.hrnp.org.uk/cms/home.html (accessed March 7,
2011).
Kitzes, Justin, Alessandro Galli, Sarah Rizk, Anders Reed, and Mathis Wackernagel. Guidebook
to the National Footprint Accounts. Oakland: Global Footprint Network, 2008.
Living Ethically. Shopping: Living Ethically. 2011.
http://www.livingethically.co.uk/pages/shopping/services-electricity.htm (accessed March 16,
2011).
MacIllinnein, Dòmhnall Angaidh, interview by Diego Alejandro Distel and Arthur Ronald Samuel.
Sabhal Mòr Ostaig OGE, Head of Estates & Services (March 03, 2011).
MacInnes, Duncan. "Solar Panel advice sheet." Clean Sleat. May 16, 2009.
http://cleansleat.moonfruit.com/cgi-bin/download.cgi (accessed March 16, 2011).
NAGPI. "North American Green Purchasing Initiative." Commission for Environmental
Cooperation . October 2008. http://www.cec.org/Storage/62/5470_NAGPI-Green%20Electricity-
FS_en.pdf (accessed January 14, 2011).
OECD. Home: Evaluation of development Programs.
http://www.oecd.org/document/22/0,2340,en_2649_34435_2086550_1_1_1_1,00.html
(accessed 03 12, 2011).
Peggy. "Subsidiesed taxi." Taxi company owner. (March 08, 2011).
Questionnaire, interview by 2011 International Class. Clean Sleat Project Carbon Footprint
Evaluation (February 2011).
Robertson, Angus. BSCW. University of Flensburg. November 08, 2010. http://soraya.uni-
flensburg.de/bscw/bscw.cgi/443483?client_size=1280x709#A297676_504387 (accessed March
12, 2011).
Scottish neighbourhood statistics. Scottish neighbourhood statistics.
http://www.sns.gov.uk/Reports/PrintReport.aspx (accessed March 8, 2011).
SESAM . Ecological Footprint of Sleat. International Class 2008, Flensburg: University of
Flensburg, 2008.
SESAM - Flensburg University. Ecological Footprint of Sleat. Sleat, Isle of Skye, 3 2008.
SESAM. Ecological Footprint of Sleat. university of Flensburg, 2008.

75
SESAM. Ecological Footprint of Sleat. International Class 2008, Flensburg: University of
Flensburg, 2008.
SESAM International Class . Community development projects for the supply of heat and
electricity from renewables in the Isles of Barra and Vatersay. Study Report, University of
Flensburg, Barra and Vatersay: University of Flensburg, 2009.
SESAM International Class . Ecological Footprint of Sleat. Study Report, University of
Flensburg, Sleat: University of Flensburg, 2008.
SESAM, 08. "Ecological footprint for Sleat." 2008.
SESAM/EEM - International class. "Ecological Footprint of SLeat." International Institute of
Managment, Flensburg University, 2008, 82.
"Sleat Community Trust ." The scottish Government . July 2, 2010.
http://www.scotland.gov.uk/Topics/Built-
Environment/regeneration/engage/empowerment/newsletter/June10/examples/SleatCommunity
Trust (accessed March 8, 2011).
Sleat Community Trust 3. Clean Sleat. http://cleansleat.moonfruit.com/# (accessed March 8,
2011).
Sleat Community Trust. "A Community Plan for Sleat." June 2005.
http://www.sleatcommunitytrust.co.uk/documents/Sleat%20Community%20Plan.pdf (accessed
March 8, 2011).
—.—. Recycling ideas. http://cleansleat.moonfruit.com/#/recycling-ideas/4533014893 (accessed
March 09, 2011).
Sleat Community Trust, Community Trust. August 31, 2009.
http://www.sleatcommunitytrust.co.uk/news.asp?intent=viewstory&newsid=19881 (accessed
March 10, 2011).
US EPA. US EPA Solid Management and Greenhouse Gases: a Life-Cycle Assessment of
Emissions and Sinks. September 2006.
http://epa.gov/climatechange/wycd/waste/SWMGHGreport.html#sections (accessed March 10,
2011).
Wackernagel, Mathis. Sharing Nature's interest London. Wasington DC, 2000.

76
7. Annex
Annex 1: Questionnaires

77

78

79

80

81

82

83

84

85

86

87

88

89

90

91

92

93

94

95

96

97

98
Annex 2: Direct Energy
Conversion factors
1 bag of coal 50 kg
1 Medium truck load 7,5 tonnes
1 6.5" log 0,0023 m3
1 log of wood 2 kg
Density of pine wood 545 Kg/m3
I bag of wood 10 Kg
Density of Heating Oil 890,13 Kg/m3
1 litre of gas 0,51 Kg
1 Gas cylinder 47 kg of gas
Heating values IPCC
Wood 25,9 MJ/Kg
Peat 28,4 MJ/Kg
Bituminous Coal 24,4 MJ/Kg
Heating Oil 19,8 MJ/Kg
Gas (Propane) 18,9 MJ/Kg
Emission factors for combustion
Wood (Renewable Forests) 112 t CO2/TJ
Peat 106 t CO2/TJ
Bituminous Coal 95 t CO2/TJ
Heating Oil 74 t CO2/TJ
Gas (Propane) 73 t CO2/TJ
Electricity 0,41 kg CO2/kWh
Formulas used
365

99
Annex 3: Waste
Volume of waste arising (Highland Council, 2010)
Sleat RCV collected (tonnes)
2007 2010
Refuse 423 311
Recycling - 49
Total 423 360
Sleat recycling points (tonnes)
Material 2007 2010
Glass 18 14
Paper 25 17
Cans 2 1
Textiles - 4
Total 45 35
Density of waste components (SESAM International Class 2009)
kg/l
Plastic 0.023
Paper 0.048
Glass 0.326
Food waste
0.505
Clothing 0.139
Cans 0.037
Mixed waste
0.133
CO2 emissions (kg/year)

100
Waste Carbon Footprint
a. Highland Council Sleat waste arising data (2010)
recyclable materials (ton/a)
carbon emissons reduction (ton/a)
saved carbon emissions (tonnes/a)
2008 2010 2008 2010
39.84 84 44.41 111.85 28
b. Institutions (primary school, college), hotel and small business (survey result)
Type of Waste
2007 2010
recycling
recycling (blue bin & recycling
point)
recycle arising
embodied energy
saved Embodied
Energy
saved CO2 emissions
tonnes/a tonnes/a tonnes/a MJ/tonnes MJ/tonnes tonnes/a
Institutions*, hotel, small business
Plastic 0 4.65 4.65 80000 40800 21.42
Paper 6.34 12.22 5.88 15000 7650 5.07
Glass 9 9.03 0.03 21000 10710 0.04
Clothing 1 1.16 0.16 20000 10200 0.19
Metal 0.30 2.89 2.58 60000 30600 8.92
Total 16.64 29.95 13.31 35.63
*: institutions are primary school and college

101
Annex 4: Transport
Unit Transport mode
Petrol Cars
Diesel Cars
Bicycle (Replacement of petrol car)
Bicycle-Replacement of Diesel Car
Bus Train Ferry Taxi
Transport mode-kms 122 682 100 376 17 946 14 683 53 183 65 532 1 946 1 855
Average km per Litre 15.43 14.86 15 14.86 14.86
Total fuel consumption
7 951 6 756 1 163 988 3 579.51
kg of CO2 emission per p-km
0.05 0.06 0.28 0.11
Uplift factor 1.45 1.45 1.45 1.45 1.60
Weight of CO2 in Kg per litre of fuel 2.36 2.50 2.36 2.50 2.50
Corresponding CO2
emissions in kg 27 209 24 490 3 980 3 583 14 318.02 3 932 545 204
Total CO2 51 699 7 563 14 318.02 3 932 545 204
Net savings in kg 40 200

102
Annex 5: Food
Calculation for Household
Total Increase of Food production for food and vegetable 329.57 kg
Embodied energy 4 MJ kg
Energy 1318.28 MJ
Total C02 reduction 0.18324092 t C02
Calculation for Hotel
Total Increase of Food production for food and vegetable 1100 Kg
Embodied energy 4 MJ/kg
Energy 4400 MJ
CO2 reduction 0.6116 t C02
Calculation for College
Total increase of food production for food and vegetables 250 Kg
CO2 reduction 0.139 t C02
Total C02 reduction of household, hotel andcollege 0.933841 tCO2

103
Annex 6: Scenarios
Heating Insulation Scenario
Total Heating Consumption (KWh)
CO2 emissions (kg/year)
CO2 emissions factor (SESAM International Class 2008)
Energy Source kg CO2 per kWh
Electricity 0.406
Gas 0.19
Oil 0.26
Wood 0
Coal 0.3
Peat 0.3816
Energy savings
CO2 savings