an evaluation of the height velocity diagram of a · faa.ads. 84 00 an evaluation of the height...
TRANSCRIPT

FAA.ADS. 84
00 AN EVALUATION OF THE HEIGHT VELOCITY DIAGRAM OF AHEAVYWEIGHT, HIGH ROTOR INERTIA
SINGLE ENGINE HELICOPTER
TECHNICAL REPORT
D•
NOVEMBER 1966 -D -, Cb ,IAR 0 o ic,6 7
William J. Hanley LiGilbert DeVoreShirrel Martin
National Aviation Facilities Experimental Center
FEDERAL AVIATION AGENCYAIRCRAFT DEVELOPMENT SERVICE
Washington, D. C.
S........I" .....

THIS DOCUMENT IS BEST
QUALI-TY AVAILABLE. TIE COPY
FURNISIED TO DTIC CONTALD
A SIGNIFICANT NUMBER OF
PKGES EW, ni ,I 1 DO NOT
R El;'R0 D C Ul-,GIBIIY-~THIS DOCUMENT CONTAINED
REPRODUCED FROM BLANK PAGES THAT HAVEBEST AVAILABLE COPY BEEN DELETED

TKCHtNIXAI. NIK!4KT
AN EVALUATION OF 111K HKIGHT VEILOCITY D1AGMAM (OF ANKAVYWKWGHT, HIGH ROTOR INKRTIA, SINGLK KPGINK HEK.IOPTER
Project No. 140-006-O1XRepurL No. ADS-6I4
Prepared by:Wtlliant J. Hanley
Gilbert DeVoreShirrol Iartin
National Aviation Facilltios Experimental Center
November 1966
Distribution of this document is unlimited. This document doesnot necessarily reflect Federal Aviation Agency policy in allrespects and it does not, In itself, constitute a standard,specification, or regulation.
FEDERAL AVIATION AGENCYAircraft Development Service
Washington, D. C.

ABS8TRACT
A series of flight tests was conducted at three selected altitudes(sea level. 5000 feot, 6500 feet) to 'sPtermino the effects of' altitudoand weight on the height-velocity (lI-V) tdiagram of a large, hipavywoight,high rotor inertia, high disk loading, single rotor, singlP onginehelicopter. Throe gross weights ot the helicopter were used. Quantita-tive and qualitative toot data wore collected to determine how the 4 Vdiagram varies with density altitude and aircraft gross weight. Aninvestigation was mad* into the effects on the diagram of a delayedcollective pitch application response.
Results disclosed a family of curves showing that Increases Indensity altitude and/or gross weight enlarged the H-V diagram requiredfor a safe power-off landing. Analysis of the results revealed thatthe key points (Vcro hain, and hoax), which partially define the curves,could be determined by the solution of a set of linear equations. Theseresults were identical to those reported In FAA Technical Reports AD6-1and ADS-46 except for the constants of the linear equations and thelocation of the critical height (hcr). The critical height indicated aslight Increase as weight, altitude and collective pitch reduction tinedelay were increased. An average value for hcr can be selected withoutupsetting the family of curves.

TABLE OF CONTENTS
Page
ABSTRACT 1
INTRODUCTION 1
Purpose IBackground 1
DISCUSS ION 1
Teat Aircraft 1Test lnstrumentation 2Test Operations and Procedures 2
Flight Test Site& 2Test Methodology 2Test Criteria 6
ANALYSIS AND RESULTS 8
Discussion of Teatm 8Height-Velocity Diagrams 9Discussion of One-Second Delay 19Effects of Weight and Altitude 23Equat ions 23Constant H-V Diagram for Reduction of Weight With Altitude 27
CONCLUS IONS 29
REFERENCES AND BIBLIOGRAPHY 30
ACKNOWLEDGEMENTS 31
APPENDIX 1 Glossary of Terms (1 page) 1-1
APPENDIX 2 Test Aircraft Specifications and InstrumentationDetails (6 pages) 2-1
APPENDIX 3 Summary of Pilot's Comments (7 pages) 3-1
APPENDIX 4 Summary of Height-Velocity Diagram Flight TestData (2 pages) 4-1
ii

LIST OF ILLUSTRATIONS
ge Figure Pave
1 Typical Height-Vclocity Diagram 2
2 Test Aircraft 3
3 Typical Test Site Layout
4 Height-Velocity Diagrams - Basic Data. HelicopterGross Weight, 9100 poure4 Three DensityAltitudes Shown 10
5 Height-Velocity Diagrams - Basic Data. HelicopterGross Weight, 10,OWO pounds. Three DensityAltitudes Shown 11
6 Height-Velocity Diagrams - Basic Data. HelicopterGross Weight, 11,100 pounds. Two DensityAltitudes Shown 12
7 Height-Velocity Diagram Variation With DensityAltitude and Gross Weight Delay. No Delay andAll Conditions Shown 13
8 Height-Velocity Diagram Variation With DensityAltitude. Gross Weights of 9100, 10,100, and11,100 pounds. Delay and No Delay ConditionsShown 14
9 Height-Velocity Diagram Variation With GrossWeight. Three Density Altitudes Shown forDelay and No Delay Conditions 15
io Comparison of Time History Data for High HoverPoints 20
11 Comparison of Time History Data for CriticalSpeed Area (Vcr' her) 21
12 Comparison of Time History Data for Low HoverPoints 22
13 Critical Velocity (Vcr) Versus Aircraft GrossWeight for the Range of Test Density Altitudes 24
tii

LIST OF ILLUSTRATIONS CONTINUED
Figure Page
14 Critical Velocity (Vcr) Versus Test Altitudefor the Range of Test Weights 24
15 Low Hover Height (hmax) Versus Aircraft GrossWeight for the Range of Test Density Altitudes 24
16 Low Hover ffiiht (hnhx) Versus Test Altitudefor the Range of Test Weights
17 High Hover Height (h.in) Versus Square ofCritical Velocity (VZcr) 26
18 Constant H-V Diagram - Weight Reduction 28
2-1 Airborne Instrumentation (Interior) 2-4
2-2 Airborne Instrumentation (Exterior) 2-5
2-3 Space Positioning Equipment 2-6
2-4 Data Center and Meteorological Equipment 2-6
iv

LIST OF TABLES
Table Page
I Summary of High Hover (hmin) and Near HighHover Data 17
Ii Sumnmary of Typical Data-Area of CriticalSpeed (Vcr) and Critical Height (hcr) 18
V

I NTRODUCTI ON
Purr-)aSe
The purpuse of this project was to determine by flight tests theeffects of altitude and weight on the height-velocity (H-V) diagrams ofa large single-rotor helicopter which has an inherently high rotorinertia and high disk loading.
Mackground
This flight test project is the culmination of a program initiatedby the Aircraft Development Service, Federal Aviation Agency, to acquiresufficient actual flight test data on certain basic helicopter flightparameters associated with the determination of the H-V diagram. Theultimate objective of this program is to obtain a practical technicalapproach for the determination of the effects of altitude and aircraft
gross weight on the helicopter H-V diagram.
The H-V diagram is a chart which defines an envelope of flight withrespect to airspeed and height above the ground where, in the event ofpower failure, a safe power-off landing could not be accomplished. Atypical H-V diagram as referred to in this report is shown in Fig. 1.It is a diagram established froa data based on the criteria of steady-state, level-flight entry conditions.
Previous flight test projects of this program are reported inReferences I and 2. The flight test data obtained on these projectsdisclosed that the H-V diagrams of the lightweight helicopters testedresolved into a family of curves as a function of weight and altitude.To further confirm this relatioxship it was felt advisable to examinethe autorotative characteristics of a heavyweight ,ingle-rotorhelicopter for further correlation.
The helicopter" ,tilized for the tests reported herein generallyrepresents the high extreme in the spectrum of current generationsingle-engine helicopters with respect to considerations of grossweight, disk loading and rotor inertia.
DISCUSSION
Test Aircraft
The test vehicle was a large, heavyweight, single-rotor, singleengine helicopter as shown in Fig. 2. This aircraft was selected forthis H-V test project because of Its relatively high rotor inertia andhigh disk loading. Pertinent specifications of this aircraft arepresented in Appendix 2.

hmin
0
0
hmax
c rVEL OCITY -
FIG. 1 TYPICAL HEIGHT-VELOCITY DIAGRAM
2

If
'Ai4�M� 4
0 I f4� I
'I /
N
I
r.LI
�C
IIa'
1.
I *
II
3

Tent Inatrentaftirn
Airborne and ground instrumentation wee utilised to recordhelicopter performance and meteorological data. Details of thequantitative information measured and the equipment ucilized orepresented in Appendix 2.
ITeat oeratilkna and tr&&edureM
1. rliJth Test SILes
The flight teat pre'ject was conducted at test sites in theState of California during the period September 1965 throughFebruary 1966. The test sites, selected for their elevation and teatenvironments, were as follow:
Thermal Airport Elevation -117 ft. iISLBishop Airport Elevation 4118 ft. MSLLake Tahoe Airport Elevation 6263 ft. )SL
A schematic view of the test site layout showing the relativelocation of the test course, space positioning equipment, meteorologicalequipment and the test control center is shown in Fig. 3.
2. Test Nethodologv
A professional engineering test pilot well skilled in themechanics of determining H*V diagrams was employed for the pilotingtasks. The results of his airvork are therefore representative offlight skills beyond the realm of sverase pilot capabilities andconsequently produced minimum siLe H-V diagrams.
A total of 1044 test runs were conducted to determine H-Vdiagrams at the selected test altitudes for gross weight conditions of9100 pounds, 10,100 pounds, and 11,100 pounds.
The following is a general description of the manner in which
the tests were conducted:
a. general
The pilot would fly over the test course at a specificsteady airspeed at a predetermined entry height above the grouand. Whenstabilized, he would execute a simulated power failure by suddenretardation of the throttle in order to fully disengage the rotorclutch. From this point he would land the aircraft with the power off.This procedure was repeated vith the pilot adjusting his height orairspeed until he reached a point below which he felt a safe landingcould not be made because all usable energy had been expended. Thispoint was then plotted as a point on the H-V diagram.
4

Iti
'4,4
01
IL5) -C 3 0

The validity of his judgment was checked by means oflimited on-site data reduction to determine if the point thus declaredwas usable as a valid data point.
The above procedure was repeated until a sufficiency of
points was obtained from which an H-V diagram could be generated.
b. Collective Pitch Control Application
The usual procedure when power fails in flight with asingle engine helicopter is for the pilot to retain the highestpossible rotor speed to effect a landing. This is accomplished byinmediate full reduction of the rotor blade pitch angle by means ofthe collective pitch stick control when the height above the groundis adequate. When the height above the ground and the consequenttime differential between power failure and touchdown is limited, itis not always possible to effect full collective pitch reductions. Insuch cases, the pilot makes partial collective pitch reductions orsimply utilizes what collective pitch he has remaining as the situationdictates.
The fact that the test vehicle had inherently high rotorinertia suggested a comparative investigation into the effects of ano-delay and one-second delayed response in reducing collective pitchfollowing throttle cut in order to correlate these results with thosefindings reported in Reference 2. Since the one-second delay datareported in Reference 2 indicated that a displacement or step at the"knee" of the curve carried on up to the high hover height, it wasfelt necessary to determine whether a high rotor inertiarotor would exhibit the same characteristics as compared to a low rotorinertia system. Tests using a one-second delay response withcollective pitch application were therefore programed into the testplan.
3. Test Criteria
a. Rotor Speed
In order to eliminate as many variables as possible, therotor speed in steady state autorotation was kept constant at a givenweight by adjusting the low pitch blade angle at each altitude tested.This involved raising the low pitch setting slightly at each increase intest altitude by changing the length of the pitch link. Total collectivepitch travel, therefore, was always available for control purposes.
b. Pilot Procedures
There were no restrictions placed on horizontal touchdownvelocity; that is, the pilot was not instructed to obtain minimu-touchdown speed, nor was he limited as to his maximum touchdown speed.
6
The specific piloting techniques for handling the helicopter were leftto the discretion of the pilot. The only limitations in techniqueimposed upon the pilot were that of the no-delay and one-second delayin collective pitch reduction after throttle cut.
The decision as to whether a landing was a maximumperformance effort was made by the pilot. His evaluation was based onwhether he believed he had any usable reserve energy remaining in theform of rotor speed or airspeed, and the nature and magnitude of theimpact (Pilot estimated landing load factors). The pilot's qualitativecoments on techniques utilized and the related criteria for hisdecisions were used in evaluating the flight test data. A discussionof these techniques can be found under "Pilot's Comsents" in Appendix 2.
c. Weight and Center of Gravity Control
Weight was kept within approximately + 1/2 percent by addingballast after every few runs and refueling as required.
The Center of Gravity (c.g.) of the helicopter was generallyconstant for all tests at a location one inch Q+ 1/2 inch) forward ofthe vertical station through the rotor hub.
d.- Wind Allowables
Limitations were placed or allowable wind velocities forthese tests. The wind velocities were measured at a 12 foot Instrwmenta-tion height. Hovering and very slow speed tests were not conducted inwind velocities in excess of 2 mph, and all other tests were discontinuedwhen the wind exceeded 5 mph at this height. A helium filled balloonmoored so its beight could be varied was utilized as a visual indicatorof wind aloft for the benefit of the pilot.
e. Altitude Control
Density altitude for the tests, with but a few exceptions,was maintained within approximately 600 feet of the average densityaltitude for each consideration of weight and collective applicationtechnique. The exceptions were evaluated and weighed in the final deter-• ination of the K-V curves. It was considered that small variationsin density altitude would have little effect on the test data results.
f. Entry Speeds and Conditions
All speeds used in the program and in this report aregiven in terms of calibrated airspeed (CAS). The entry airspeed usedfor each point on the H-V diagram was obtained from the photographicrecord as ground speed, corrected for observed wind at the 12 footlevel and converted to calibrated airspeed.
7

ANALYSIS AND RESULTS
Discussion of Tests
A brief discussion of several aspects of the test program at thispoint would perhaps contribute to a better understanding of the testresults. The test vehicle, which was large and heavy, was not generallysensitive to the effects of light, steady winds, particularly in the verylow speed regimes. Problems due to wind did exist however, because ofinability to accurately determine the winds aloft which could varyconsiderably from that measured at the 12 foot height and because in verylight wind conditions, winds aloft were frequently variable.
A car pace was used exclusively by the pilot in the low airspeedrange as a means of speed control for both the upper and lower boundaryof the H-V curve. While this system was reasonably effective for thelower boundary, it was considerably less effective along the upperboundary because of the large separation between helicopter and car. Itwas such more difficult for the pilot to sense relative motion betweenthe two vehicles. Along the lower boundary where the winds were moreconsistently known, this technique was quite useful. Along the upperboundary, however, indeterminate winds presented problems in approachinga data point (see Pilot's Comments).
Obtaining high hover and near high hover data was again one of themost difficult parts of the test program. Unstable air conditions,indeterminate airspeeds and unknown winds aloft, all contributed to thedifficulty. In general, weather conditions prevailing at the test siteduring the conduct of the project were not as stable as was desired forthis type of testing.
The use of the radar altimeter in providing correct information tothe pilot for height above the ground was of major importance to thesuccessful completion of the project. The pilot was able to repeat hisruns at a constant known height within one or two feet. This made itpossible for him to be able to tolerate the lack of precise airspeedinformation with some degree of confidence.
The wheel landing gear configuration of the test helicopter exposedit to far greater potential damage as a result of a landing gear failurethan did the skid gear types of References 1 and 2. As a consequence,the pilot exercised extremc caution during the project as evidenced bythe number of runs required to produce data points - a ratio ofapproximately 8 to 1 - during which time he was constantly evaluatingand improving his technique.
8

Heidht-Veg1ciJv Disgrams
Neight-velocity diagrams were first constructed from the experi-mentally obtained data points. Various cross plots of velocity, altitude,weight, and height-above-the-ground were then constr acted and studied todetermine what kind of relationships, if any, existed between the manyH-V diagrams. Information from these cross plots was then used to adjustthe original fairings of the height-velocity curves so that the reworkedcurves thus obtained provided the best fit with the data points and thecross plotted points. These adjusted zurves with the experimental datapoints are shown in Figs. 4, 5, and 6. The variation with aetitudeand gross weight for both no-delay and one-second delay conditions isshown in Fig. 7. The variation with altitude for each of the vhree $rossweights tested is shown in Fig. 8. The variation with gross wel,%ht forthe density altitudes tested is shown in Fig. 9. Since the heliciptertested had limited performance capability at the higher gross welgi~tsat the higher altitudes, it was not possible to obtain daita over a Mul1range of altitudes at the higher disk loadings. The results hereinpresented, however, exhibit linear relationships which are quite similarto those obtained from the testing reported in References 1 and 2, andthere were no indications that this linear relationship would not holdtrue for the higher disk loadings at the altitudes tested.
Since the density altitude spread for all the runs at any given testsite was larger than desired, an average density altitude for eachcondition of weight and collective pitch application was derived andutilized to facilitate data analysis. Test toints could not be qualifiedwith respect to their relative position about an H-V curve in accordancewith their test density altitude alone; i.e., outside the curve for higheraltitude and inside the curve for lower altitude because other vtriableswhich had much greater effect on the data overshadowed the altitudevariation effects.
All of the data points were analyzed on an individual basis as wellas from an overall basis to establish their relative position with respectto the H-V diagrams that were developed. The data was generally goodfor this type of testing and it fit the H-V diagrams very well. In thegeneral analysis there were two basic areas which disclosed data pointsthat fell outside of the developed H-V diagram. These two areas were atBishop at the 9100 pounds test weight (see Fig. 4 - center curve), andat Lake Tahoe (see Fig. 4 - right hand curve) at the 9100 pounds testweight. Host of these data points occurred along the upper boundary ofthe curve and were the most difficult to obtain because of conditionswhich are described in the 'Discussion of Tests". The Bishop runs werethe initial tests performed in the program and while some points werequalified on an individual basis, it is believed that basic skills hadnot yet been achieved. The runs at Tahoe arm explained on the basis ofthe pilot's recorded run-by-run coiments. Most of the points along the
9

w.
o a) 4
4,w
0w
U.U
-4..
w w
m z.
IAA
L..ui..m..I - ]N~AO~) 3AOViV 111U1311 -
H 1
w E) E -4 AG a-P
-0L
o o10

i.0
a_ ___ _
F, *
hi a'-
a 0
0..im -Ný
oaa.a h0
a~ z l
e 0 0 0 14u Vo
0 -:10M4WI I --.00
0 hi-
0 P,
> Ob
X1A-UfOI IOV1-9~
01

- - - 0
In 0
-_ __ 0
(U.
0~~
- .jW W z
_ _ _ _ _ _ _ _ _ _ _ __ _ 4
4.4
11331 - GNAO'I0) E:AOQV.LHOIZH
12U

00 0 V C c
IID- - __ ______ _ -p.
ola,
-J Q z
0-
j., o -4 z
' o v .1 1 v : qI TI'a,~~
0,7
_____~ ~~~ ___ __ __ z
L4 7 0L4__ CC__ 4 .- w.-- - / C
7 000 00-
o a
'1,13

II~ Ah*,k II II1" 1
no
- s-4
14 I1
C; 0
no.4 I
-. -- m1 1 .
0 .4 L.4 .4 .4
141

11,
- - - ...--1 ->--...
I H .4
00
152

upper boundary were not specifically designated an "solid" points by thepilot, but rather they were deolinated for investigation with thepossibility of better qualifying the point at a later date. Weatherconditions and time prevented further testi•g in this area at Tahoe.Points sloag the lover boundary from the "knot," down, on the other hand,were designated by the pilot as 'solid" points.
All runs which were noted as data points or near-data points by thepilot have beem included on Fils. 4, 5, and 6. Ixamination of the data,however, reveals that in certain areas the pilot wa able to reduce theentry speed or change the height appropriately when confirming aparticular point. In general, the landing load factors for points lyingoutside the curve were low and increased as the entry speed was reduced.In a few instances, however, it was noted that lower load factors wereobtained when the entry speed we@ reduced. This was probably due toexceptional pilot technique in executing the maneuver which undoubtedlyis the most important single factor in obtaining a maximum performancedata point. For the most part, individual points were qualified,concerning their position relative to the faired height-velocity diagrams,on the basis of pilot's comments, landing load factors, density altitude,and the time history analysis.
Table I is a summary chart of the pertinent facts taken from thetime histories relative to all of the high hover and near high hover datapoints. In most cases of high hover or near high hover, stabilizing ofthe autorotative descent was instituted within 50 feet of descentfollowing throttle chop. That is to may, aft longitudinal stick wasapplied so thac the aircraft started to arrest its nose-down attitude,and in a very gradual manner this was continued to the maximum nose-upattitude (peak of the flare) which occurred at random times prior totouchdown ranging from a quarter of a second to five seconds. In general,where the elapsed time from maximum nose-up attitude to touchdown was
short, the landing load factor was on the high aide. When the time frommaximum nose-up to touchdown was rather prolonged, the landing loadfactors were relatively low. Correspondingly, the widest variation inlanding load factor occurred in the runs from high hover or near highhover. The touchdown speeds (VTD) appear to increase as the weight andaltitude increase whether the entry is from high hover or in the "knee"area. The vertical descent velocity following simulated power failurefrom high hover or near high hover did not show any consistent trends,the highest rates of descent occuring at the 9100 pound gross weightat Bishop. The rates of descent were generally lower, however, forthose runs in the vicinity of Vcr, hcr, which are listed in Table II.Here again, however, there are no trends with respect to the entry sreed,the rates of descent varying as the entry speed increases. With fewexcaptions, whether entry was from high hover or in the "knee" area, theincrenental vertical accelerations following simulated power failurevaried between .7 and 1.0 S's.
16

PA
C. at-.U
~ -LON N
w- f* N&Uý hqm 0umt--, - cyl UN
in i MrH-4 4 H H H H 4nI H A
4 4 Ni -
L .ifN4IN OD -4 4 HN 4*. 4 ,-9- 0:O
.- LJý A t-t-M-Ot- I'-H t-M7 t'-t--0 tA LIN 1 R* (nC4UN I I
Ail ~ ~~~ ~ ~ ~ ~ .- N(0 0 tAIn4Up nnn i rp cr
0 ~ ) kN'HJ 4 0 LAOO -4 0 CA R UN inC4I
R 4 R,,H 4 1-4 H4 H ON -4 W CJ~J '' H C14NW NNOIN 4"WCINWNNNCUN4N iJlNN
19 t ltr..i). C( : , P t . .4 - (nm t)4*IN* .** t N-tW N r"(n,* MSV' cn"1NLA**
1 '0 0% rýo 0 m ItIN -LALAU Oi ALn L44K 0\. .(30 '0 0 '0 q- ('Yt
.,?I C9 .*In14 M
*0 le 1*1 OfN I 0H.a 0
~20000HC000000000040000000LA N0N0%00 0 c
M
____ om A.__ __ _ _ __ :LA.~~LA*Ht-LA'0r~*0 81'* AA** ~ 0
Ci* Q N 64 *** -I
14* Hl H J 14 r4 vH*ýý M-
LA0.(J**eMI HN\U 10. LA\ as 0 (7%AW
IA\C'J c H - LAt- w0 * t-' LIn'J &R'C.'~ 8SL* 00-0~000- 0,4OOO HHOsooO,-oooO
* - ~ OOO ,O.OtO OLO OOO H~t%0%HHHHH `4M - HH4 - HI1. f 4H H4 1
0% f- * ~o .- O C 4 - OID t- LCD H0% 14I 0,m o4d'0
g~L N**0 * ID \9 iL**0 (30Om'mOi04NN N NW (rn in r~. ('I ('.* Ill d- ý*
17

Ch 4 310
no U'iO' 00D (\-4i 0,tJp ' Dti"A
-4:1
UN t- %D( n i4 - 7 4O n -NtOC y f
31 EM i-Hr
'-4 4* OR~
In.
cl CU (n' VH0SI m e m 14 14040H 00 C ij M 00 r(1- Uup.
14K r*0 0-4t-4~~%H .40~~g~n i',4r~%rrt..-. I~Ji~iJt~- HO O 0 404CU1: ý 1 ,4H (RCUC (0%1% C U i * 4 JC iJ I?
9) ~ a%_ _ _ __ _ _ _ __ _ _ _ 0 4. 1- H4pm1 40% 4ROý%f~t Nt r
('i 0 0 ' IH 0 H 0 - 1414 0 Cy i C'JNHJ4C - nl 0 HI 0I Cý 0 0t '. 0 0-.
.- -, .IN MIV%
14 a, .-o H '" HY \,4 HHH .- 4 NH g4 o. it' t- inJ t - -H 'D 9\ 4 0- IZ NH
0H T44 19 OCPý
U11-t0 Lnrg0HO4CR Cii, *40N ilCii' t- iO4nn(
14~~~ 4,4 HtHN-
o3 1) zrC 4 0
r.- CNiCo OD * 0ýorn~ n 0 0 HCIH40 00 d0 iJ <O7\ n11 -ID n O f lH - pl4 ioin, C\AO i-
02 c-. K 01 g0\- r ýuNCCiJg~ctii\ lCiIH9cugfiusa ý
HiO...............s...............s4O14 .0L)0 P-
- ~ tý q .S .0id . .. .Pq . .:H
0 Q Q O Q Q~ 0 H HN o C'D 14O -t" C
H 'to 4 0H o-i H .4
In rnloan I r,4no DI
I I I t I I I . I I .8

There were two factors which entered into testing which may havebeen limiting or controlling factors with respect to determining a datapoint. These factors were blade stall and pitching control. The pilotfrequently reported some "shakes" during the flare portion of thelanding maneuver. The "shakes" were apparently associated with bladestall. The prevalence of this condition limited his recovery techniqueat touchdown, thereby controlling his entry speed and height for agiven weight and altitude. The other factor ?ess related to the testhelicopter's relatively slow response in pitch. It was difficult forthe pilot to pitch the helicopter nose-down , pick up airspeed andflare in the time available from entry to touchdown for runs in theclose proximity of the "knee". This factor undoubtedly played animportant part in the determination of a data point. Both of thesefactors are discussed in greater detail under "Sumary of Pilot'sComments."
Figs. 10 through 12 show a comparison of time history data forhigh hover, low hover, and the critical speed area for sea level versushigh altitude. The figures show that the control inputs and aircraftattitudes are quite similar over the range of altitudes and weightstested. This comparison of the high hover and Vcr - hcr, time historydata includes all the weights tested to show the effects of weight aswell as altitude.
Discussion of One-Second Delay
As a result of the tests of Reference 2, it was learned that afairly large increase in the size of the height-velocity diagram existedabove the knee when a one-second delay was used after throttle cutbefore collective pitch reduction. It was not known whether this samesituation would exist with the high inertia rotor of the S-58 or whetherthe inertia would cause this displacement to disappear as was indicatedby the tests of Reference 1. It was decided, therefore, that theproject would be conducted on a no-delay basis with additional testingof one-second delay maneuvers to ascertain what the effect would be.The data obtained utilizing a one-second delay in collective pitchreduction following throttle cut did show a similar displacement asthat obtained in Reference 2. Furthermore, the characteristic shape ofthe one-second delay curve is consistent with the rest of the datadefining a family of curves. It would appear, therefore, that there isa specific increase in the size of the H-V diagram above the "inee" asa result of the one-second delay. The tests of Reference I were notprogramed to seek this out. It should be noted, however, that the one-second delay was only applied above the "knee" in accordance withconventional procedures. The effect of a one-second delay below the"knee" is not known.
19

w
LEGEND: '•"•"•'•'"• 9, I00 POUNDS, }lD -I00 FI"ET - I"LIGHT •0
"-'-'-'-- .. .. 9. i00 POUNDS, }lD 6400 F'I;;:.•I' - FLIGHT 46
,.• '' 11.100 POUNDS, IID 4400 FF:ET - F1.{GIIT 40
I• m • •eI• - • ' • I •*L
a,• -zo _-- I [ I ,._.,
- 40 ...... .... .,JII.'
SIS÷10 .., • .•-•-; -
S• \- _• II-, • -I0 -- --- •..-'• '" 4' • .,"
-zo•• • • - , 1_/•i/, ,' ° I '"- r l'• ""S-.- r,__ .. • ic I :
o ',
S10 ..... S" :
5• t•J i /mo 5 "" ..... ... •- - " I ilo i
• ,,o ." . ... i i
Z0 Z •S : J " -•.I '
u•
< I
¢n • -I0 - . -Io •oo. ---4.:J _JLi
SZOO , = 7" "" ll-" i "'•o• ,oo i 1 1 1 1! , - -o 2 4 6 • I o ] 2 14 16
I'[MF- SF:(;ON[)S
FiE. 10 COMPARISON OF TIME HISTORY DATAFOR HIGH HOVER POINTS
20

100~~ ~ ~ ~ IllNIN It1 ýý I ~I c.I It 1 48
-40-
40L
"14
I0
w
.4
I..B-I4
-
4,) +
144
FIG. 1 COMARSO 'OF TIM HITR DATFOR CRTIA SPE RA(chr
a. W 21

S1.NI , , ,10 l P US' , 1, I .1011 F T I CI I• II I'
•"+ ~ ~ ~ lo llm lm•' 11, 111( I.A.tI"l,"+ ID '+ ' I,I'1 - VIIGIIT U,lU, I PO UNDS, II h000 i ,FEEl FIA'II 46
I.)
_ _
"- ...... ................ .
.10 - ,- ... ----
w
H2 N
•,L, -io.
-20I
II
<I -- -.% -- -
z Z S
--.. • ---<
< 40
CL F
00 _- o
_100 '" - me.0
FOR LOW HOVER POINTS
22

Effects of Wgight ad Attltudt
As previously discussed, H-V diagrams were individually drawn
through each set of test points and thee cross plots constructed ofspeed versus weight and altitude from which final K-V diagrams weredrawn. The controlling points of the H-V diagrams such as Ver, hmle,and hmsx were then cross plotted in a manner to define the f-V diagramrelationships.
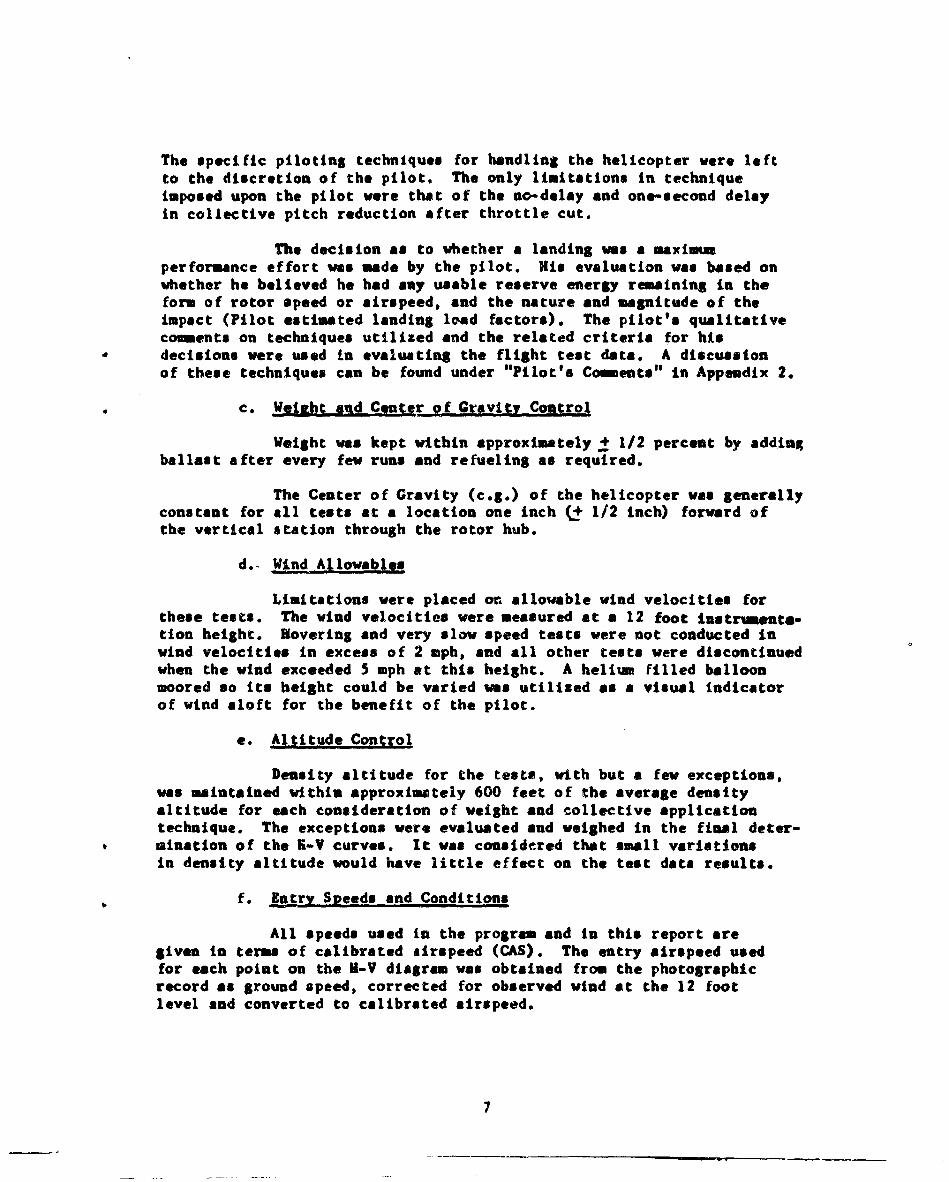
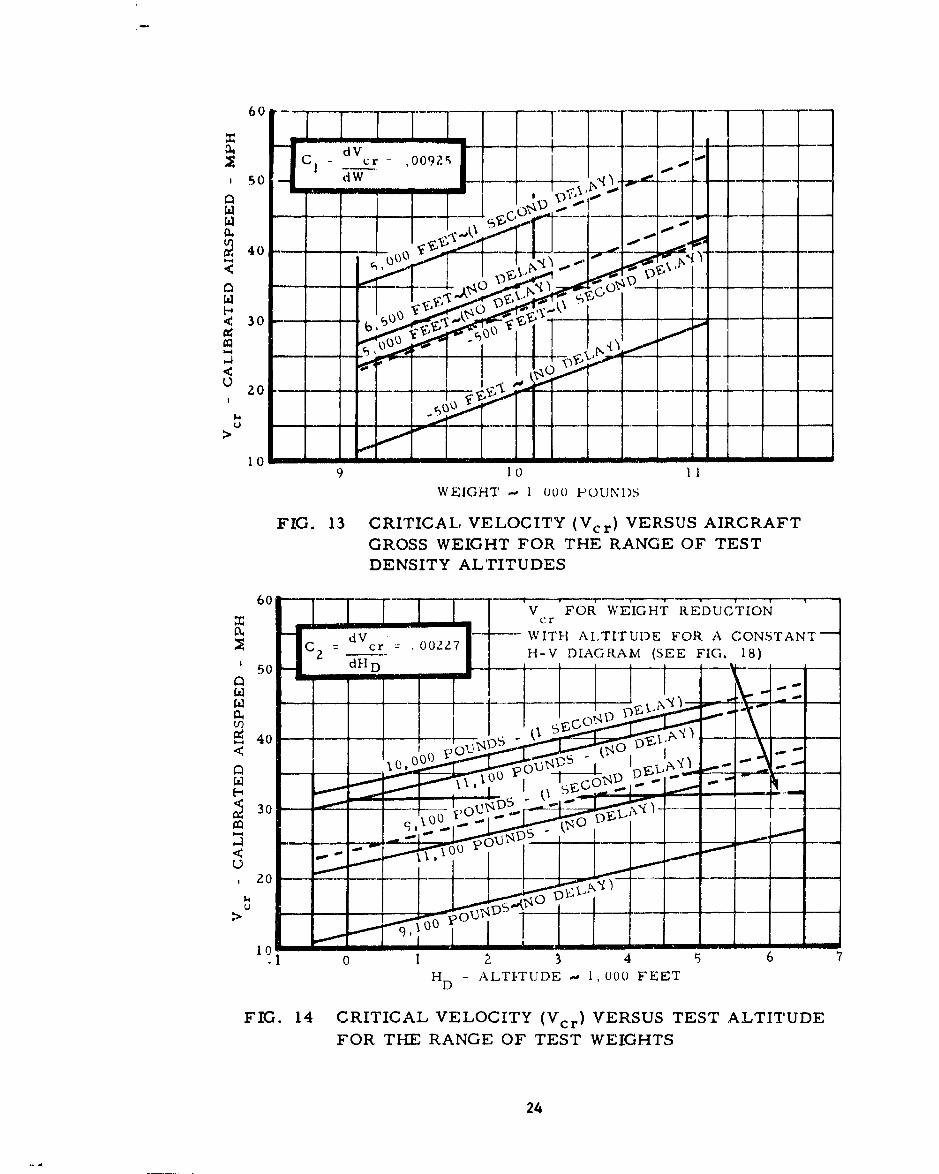
These cross plots are shown in Figs. 13 through 16. The highhover height, hmin, is shown to very linearly with the square of thecritical speed independent of weight, altitude and the time delay incollective pitch reduction as shown in Fig. 17. A set of H-V diagramsresulting from these tests can be partially defined in terms of thecritical governing points on the o-V diagram which can be obtained froma set of linear equations. These equations are basically identical tothose obtained in References 1 and 2. The differences between theseequations and those of the previous tests are in the constants whichdefine the slopes of these linear expressions. The height, hcr, mustalso be known in order to properly locate the point Vcr, hcr. Inprevious tests, hcr was reported as essentially constant at approximately95 feet for Reference 1 and as varying between 80 and 100 feet forReference 2. The current tests clearly indicate that hcr increases withweight and altitude as shown on Fig. 7 by the dotted lines. Throughoutthe ranges of weights and altitudes tested this height varied fromabout 90 feet to approximately 110 feet. Inasmuch as the expressionshown below for Vcr holds true for speeds at heights above and belowthe height for Vcr for approximately 40 to 50 feet as well, the shapeof the family of curves is seen to be relattvely constant in the area ofthe "knee." Therefore, selecting an average hcr of 100 feet would noteffect the construction of the H-V diagrams. No attempt was made toestablish an expression for hcr.
Eauatiogs,
1. Vcr - V cr(test) + Cl W + C2 A HD
where Vcr a critical velocity at a given weight and densityaltitude
Vcr(test) - critical velocity obtained through test
dVcr
dW
C2 - dVcr
d2D
23
6 0 I -
C I -cr7 ,0 92;.0O
sodW)0 ? 0
10 T 0n
V 10WeGH 3 00 (a b ......
FIG.13 CITICL VLOCIY (Vr) ERSU AIRRAF
GROSSWEIGHT FO TH RA0PONGEOSTS
DENSITY ALTITUDES
dV- WITH ALTITUDE FOR A CONSTANT-
(I)
4 0 - p o U'2
< o I I000 LT.UD 1,O 0( FEE
224

30
WEGH 100 POUNDS04
H - -96,0o RON
0
HWEALIGTUD - 1000 FEETD
FIG. 16 LOW HOVER HEIGHT (hmax) VERSUS TS
ALIUEFRTERANGE OF TEST WEST LIUEIGT
ýyl 25

1!11
I+IeI
\ ',
,,i
S... .. L * ": < I D O .0 U '+
I.ImI A,
I =)
! i"
'ra'
4 Ii'iI ' * I + i ' I
a.. .•.1 .,.
C) 4 .
al~ • ) l ) :l \ '~ l \ l - '. .lt l t $t l4'l~ l 4I' \ • I ll -
I I
2. hmau - 4.04(001) 4 CIAW + '4 AND
whre has a low hover height at a wellibi anti density alituset
1tmaw(toi) ,a low hover height obtaslneid thiugh lest ing
dma
dW
C4 a ...
dflg)
1. two * K 4IVer
where 9 - a constant (the htw intercept)
de r
The constants oa these empirical ouatione are applicable only tothe teat helicptor as were the constants af Reference I. It isintoresting to note, however, that all toots resulted in a set oa lineareopressions in which only the constants were different, Further, a briefcomparative examination or the data of all tests indicates othercorrelatinl factors, It appears quite probable, therefore, that a sot ofequations can be obtained by the application of a mondteonsionalanalysis of the beasi parameters and toot results of the helicopter usedtn this project and in the two other projects of this program. which wouldbe applicable to all single o8gino, stoine rotor helicopters, Such asanalysis might determine whether N-V diagrams can be predicted for aran*e of woeihts and altitudes or developed from sin8le weight aindaltitude test data. No attept has been made to do this in this report,
Constant H-V DtAaML-fgr R!dutdijgi gf Weiaht With A14Ltd
One approach to the problem ot establishing an appropriate H-Vdiagram for variation* of weight and altitude is to establish adiagram for smaimum gross weight at seo level and hold this dialtamconstant while reducing weight to compeseastd for altitude. Such anapproach is &hove it chart form on Fig. 18. The data for this chart isobtained from Fig. 14 for a constant Vcr. Since hot. is a function of 'crindependent of weight and altitude, the upper part of the diagram isreadily obtainable. The lower part of the diagram can be obtained in alike manner fron Fig. 16 because the error in h~ay is regligible.
27

It' I
I~~~~ IV I I' I 1H A IA I, II I~ I I' ITy 'N
4'1 I~ I.A\¾It N
I I ' (NI% I*Nk It
kil
0 ~ ~ t V -M--"--------
OI I I
IFkSI WK6V IIIH~
)C. F "K I< I" I. .() ,i.
~A SS: ~KIIl E Dit I 1K I oi I 'K
FIG. IS C2ONS1I'AN I' I WIGHTP ViELOcIY DIAGRAMWEIGHTV REDOUCTION
28

WOMMUSIONS
Based upon the tests of this larSe single rotor helicopter and ananalysis of the test results it is concluded that:
1. The I-V diagrams for this helicopter at different weightsand altitudes form a family of curves for the altitudes and weightstested which are defined by a set of equations involving key points onthe N-V diagram such as Vcr, hmin, and hmsx. These equations show that:
a. Vcr Is a linear function of weight or altitude.
b. hoax is a linear function of weight or altitude.
C. huwint a linear function of Vcr 2 .
2. The height (hcr) for critical velocity (Vcr) increasesover the range of weights and altitudes tested varying between 90 to 110feet. Since the shape of the H-V curves are relatively constant inthe area of the "knee,' a constant average height of 100 feet for Mcrcan be assumed without destroying the family relationships of thesecurves.
29

BIBLIOCRAPHY
Jepson, W. D., Sge Cogniderations of the Landinp end Take-OffCharacteriticgS of Twin Eaning He copter, Journal of ARlS, Part I,October 1962.
Kataenberser, E. F., and Rich, H. J., An Invesyization of HelicopterDescent and Landing Charact.ristics Folloving Power Falure,Journal of Aero Sciences, April 1956.
Rich, M. J., An Energy Absorption Sjflty A|Iahtinx Gear ForHlelicOpter and VTOL Aircraf.t, XAS Paper No. 6?-16, January 1962.
REFERRUC ES
1. HManley, W. J., and DeVore, G., An Evaluation of thl Effects ofAltitudg on the Height Velocity Diatram of & SinAle Engine, Helicopter,Technical Report ADS-I, February 1964.
2. Hanley, W. J., and DeVore, G., An Evaluation of the Effects ofAltitude on the Height Velocity Dia gram of a Ligghtweight. Low RotorIngri1i. Single Engine Helicopter, Technical Report ADS-46, July 1965.
30

ACKNOWLEDGEMENTs
We wish to acknovledge with sincere thanks our grateful appreciationto the U. S. Navy Bureau of Navel Weapons for granting permission to useone of their helicopters, Bureau No. 150729, which was provided by MarineHelicopter Squadron HDX-1, HCAS, Quantico, Virginia, and for theirauthorization to organizational units within thetr jurisdictiom to providesupport to the FAA for this project.
To the following organiutions who provided facilities, maintenance,supplies and equipment, we are deeply indebted. Without their graciouscooperation and prompt and effective support, completion of this projectwould not have been possible.
1. Overhaul and Repair Activity Naval Air Station, North Island,
San Diego, California.
2. U. S. Army Aviation Test Ahctivity, Edwards APB, California.
3. U. S. Air Force Flight Test Facility, Edwards APB,Cali fornia.
4. U. S. NAAF, China Lake, Californii.
5. Colonel Loren D. Everton, USNC and the MCAS, E1 Toro,California.
6. Hr. R. W. Frieburg and the Aircraft Maintenance Base, FAA.Western Region, Los Angeles, California.
7. The many FAA Control Towers, Flight Service Stations, andU. S. Weather Bureau Stations.
To Michael Antonlou, Project Test Pilot and former U. S. ArmyEngineering Test Pilot from Edwards AFI, California, our special thanksand grateful appreciation is acknowledged for his meritorious effort inthe conduct of this project. Extreme courage, skill, and judgment,which were vital to the successful cappletion of this project weredemonstrated time and again by Mr. Antoniou. In addition, his technicalcontributions were invaluable toward the analysis and understanding ofthe date.

APPKNDIX I
GLOISARY OF TKRMS
(1 pass)

APPIUNIX I
GLOSSARY OF TZRI0
Vcrt critical velocity. The speed above which an autorotativelanding can be made from any height after power failurein the low speed regime, mph, CAC.
hcri the height above the ground at which Vcr occurs, feet.
"hsin the high hover height - the height above the ground fromabove which a safe autorotative landing can be made afterpower failure at sero airspeed, feet.
htoax the low hover height - the height above the ground frombelow which a safe power off landing can be mad* afterpower failure at zero airspeed, feet.
RD: density altitude at the point of landing, feet.
h.- height of the helicopter above the ground, feet.
W: helicopter weight, pounds.
CAS: calibrated airspeed- indicated airspeed corrected forinstrument and position error, mph.
1- 1

APPENDIX 2
TEST AIRCRAFT SPECIFICATIONS ANDINSTRUMENTATION DETAILS
(6 pages)

APPE1DIX 2
TEST AIRCRAFT SPECIFICATIONS
Significant specifications of the test aircraft are as follows:
1. Powerplant: Wright Model R-1820-84C
a. Horsepower Ratings
Takeoff - 1525 hp @ 2800 rpm S. L.
Maxim= Continuous - 1275 @ 2500 rpm S. L.
b. rpm limitations - 2800 maximum, 2000 minimum
2. Gross f'eight:
a. Maximum certified - 13,000 pounds
3. Hovering Ceiling @ 2700 rpm, standard temperature,0.00 specific humidity
a. @ 13,000 pounds - 9000 feet in ground effect
b. @ 13,000 pounds - 7000 feet out of ground effect
4. Maximum Speed:
a. Sea level- 107 knots - IAS
5. General Data:
a. Rotor diameter- 56.0 feet
b. Rotor disk area - 2460 square feet
c. Rotor biade chord - 16.4 inches
d. Slade t.: - 40 40' @ 3/4 blade radius station
e. Airfoil section - NACA .0012
f. Nhmber of blades - 4
g. Solidity ratio - .0569 (.06048 - Eastern Region)(.059 Sikorsky)
h. Disk loading - 5.28 pounds/feet2 @ 13,000 pounds,mu•imum G. W.
2- I

i. Rotor inertia - 5239 slug feet 2
J. Rotor system configuration - fully articulated
k. Flapping hinge offset - 12.0 inches
1. Engine to main rotor ratio - 11.29:1
m. Roror speed limitations
(1). 258 rpm maximum
(k). 170 rpm minirmm
TEST INSTRiUMTATION
A brief description of the test instrumentstion utilized for this flighttest program is as follows:
1. Airborne - the airborne quantitative information was:
a. Airspeed
b. Altitude
c. Rotor rpm
d. Engine rpm
e. Collective stick pos!tion
f. Cyclic stick position
g. Acceleration (vertical, lateral, longitudinal)
h. Fuselage attitude (pitch)
i. Angular velocity (pitch rate)
J. Height (radar altimeter)
k. Instantaneous vertical velocity
1. Throttle position
m. Wheel loads
This information was recorded on an ocillograph. Figs. 2-1 through 2-2show the installation of the recording equipment and some of the basicinstrumentation installed on the test aircraft.
2- 2

2. Ground
Space position equipment utilized for tracking the aircraftis shown in Fil. 2-3.
Correlation of events between the tracking camera and theairborne instrumentatlon was accomplished by means of a radio data link.
Meteorological equipment utilized for recording atmosphericconditions during the flight tests is shown in Fig. 2-4.
2- 3

- -- a- .--- ��
N I
9¼
Id"I
S., --. � \ 4 [4
IIU . a________ 4�. I..A, � 1-'
'U
'I0
-4
N
N
U,-
4'ii
�;I I�Ž� _
4.- 4

'14
2-5'

162-6

APPENDIX I
3W'HANY OF PILOT'S C(O@4INTS
(1 piage$)
AWI'IflPI X .1
$i00A"Y OF PIOTAS COtINTS
The purp ose of those coweents to to provide a qualitative analysisof test results and of specific toot methods and procedures uttlised inthe flight teats ti order to enable an accurate interpretatron of theresults to be made. Qualicative cmente in this report or* based onpilot's commeuts and note. made in the field and on a qualitative*valuation of Lhe height-velocity characteristic* of the test helicopter.
The following ore*& of the toot program will be discussed hereini
a. Pilot techniques and their derivation.
I. Lower boundary points.
2. Unee" and upper boundary point%.
3. One-second delay technique.
b. Data point validation by the pilot.
c. Entry airspeed control.
d. Bilds stall chareccterstics during lending.
e. Stability and control eftects on autorotative per forwsnce.
f. Wind and turbulence etffect on autorotative performance.
a. Pilot Techaltvte and Their Derivaqt-
The techniques utilised in thLs program were developed to accommodatethe geometry and handling qualities of the test helicoptar and to obtainthe maximum autorotative performance inherently available in the vehiclefor a given set of entry conditions on a repeatable basis; i.e.. thetechniques employed ware rationalixed and applied such that, for a givenset of test conditions, use of the same techniques would produce similartest results. This condition of repeatability is inherently essentialto an engineering flight test program.
3- 1

The landing losa, structural and geometrical configuration and theoverall mine ot the toot holicopter dictated that. for landings utillainga cyclic flare, the flare should be soquenced to obtain initial touc~h-down on the tail wheel. tAtiliving flare woorgy and partial colloettivpuitch application for otiie purpose. The remainder of the collectivepitch together with aft cyclic control application would thson beutilized to cushion the maim &sat Impact. This procedure was designedto take advantage of the energy abaorptioa characteristics of the tailwheal as well as relieve the pilot of the e'vtroe difficulty associatedwith so.ecutim4 pricisica autorotative touch-downs io a levol attitude(three-point) in this aircraft. This difficulty arises becaume thepilot's seot io approximiately nine to ten toet above ground levelthereby increasing the depth perception requirmmentm considerably whengaouging tho heitht at which to apply the collectivo pitch to effect thethree-point touch-down. Additionally, tho three-point technique roquiresan extra control motiong i.e., following the landing flare, thehelicopter must be re-leveoled using cyclic control to affect the three-point touch-down. Is large helicopter@, this additional control motionis extrommely difficult to time accurately due to the relatively lowpitch response of the, helicopter. That is. the aircraft does not seemito respond readily to pilot control inputs. This apparent lack ofresponse becomes a critical factor whom attempting to arrest a highautorotative sink rate by flaring followed by a cyclic control reveorsal.to level the helicopter.
To sumamriza, the "tail wheel first" touch-down is used in thisaircraft because It takes advantage, of the energy absorption character-istics of the tail wheel, relieves depth perception requirements andminimizes, the effects of lag In helicopt~er response, thereby enablingthe pilot to optimize the precision and repeatability of the landings.
I., Lower bouqdary Point
For data points obtained along the lower boundary of the K-Vcurve, from the low hover puint (hmax) to an airmpeed corresponding tothe onset of translational lift (approximately 20-25 mph), the followingtec~hnique was utilized. Power was manipulated to obtain an airspeed suchthat relative motion between the aircraft and the pace car was stopped,thereby obtaining the desired throttle chop airspeed. Rotor speed wasthen adjusurd by use of the throttle to obtain 239 rpm! 5 rpm. Heightabove ground yeosmonito1red using the radar altimeter to obtain thedesired height. The run vas then continued in a stabilized conditionuntil euteriug the test course after which the throttle was closedabruptly. In this segiment of the curve close proxinity to the groundprecluded appreciable r~duction of collective pitch following throttlechop. Consequently, the collective pitch control was either iteld fixedor decreased as possible, followin~g the chop. Little or no cyclic flarewasn used in this seguent of the curve. As the helicopter approached the
3- 2

ground, collective pitch control was applied at a gradually increasingrate such that full control travel was reached just prior to groundimpact (Q 0.3 seconds). Because no flare was used, ground impact inthis area of the curve tended to be in a three point attitude. Followingimpact, the collective control was reduced to the bottom stop to preclude&round resonance and/or unnecessary aircraft motion, and then thethrottle was reapplied to obtain a power-on condition.
2. "!gq" and UDpIK Roundnr .Po ýq
For the "knee" and upper boundary areas of the curve, preliminarystabiliastion was as described above. Following throttle chop, however,the collective pitch control was imediately and firmly reduced to thebottom stop to prevent excessive rotor speed decay and the helicopterwas simultaneously nosed over, usnto forward cyclic control to obtainthe nose-down attitude that would produce the desired flare entryairspeed. This attitude was obtained and stabilized ts rapidly aspossible usinug large forward cyclic control inputs. Left yawing ofthe helicopter due to lose of torque was counteracted by using theright anti-torque pedal. As flare haight was reached, the helicopterwas flared using a rather abrupt aft cyclic control input. As XjU offlare reached a peak value, collective control application comenced.Simultaneously, as the helicopter reached the desired flare attitude,the flare rate was terminated and the flare attitude was fixed byapplication of forward cyclic control. Collective pitch applicationcontinued with the objective of reducing tail wheel touch-down sinkrates to a low value in order to preclude excessive tail wheel loadsfrom pitching the helicopter nose-down onto the main landing gear. Astail wheel touch-down was obtained, aft cyclic control was applied toutilize remaining flare energy and collective application was continuedso that full collective application was obtained just prior to mainlanding gear impact. Following main Sear impact, the collect've controlwas reduced to the bottom stop to preclude ground resonance andunnecessary aircraft motion and throttle was reapplied to obtain apower-on c:ondition.
3. One-Second DelX Technique
One-secend delay p)ints were executed essentially as describedin Paragraph a.2. above. No unusual difficulty was experienced inexecuting the throttle chop and the delay prior to collective pitchreduction. A verbal count was employed to time the ditay and wasinitiated when the throttle reached the fully closed position. Aconscious effort was made to execute the throttle chop itself within aconsistent period of tire, usually one to two tenths of a second. Verylittle helic.opter moti-.'a was obtained aj a result of the throttle chopand no difficulty was experievced in controlling the helicopter. Using
3 -3

a verbal count, it was possible to control the delay time constantwithin a range of plus or minus two tenths of a second from the desiredvalue sad the requirement to verbally count was not distracting to thepilot.
No unusual difficulties were encountered during the descentsegment from a delayed throttle chop. There was, however, a markeddeterioration in the ability to quickly and accurately obtain thepushover pitching rate which would yie'd the desired ,ive angle. Thisprobl,. was probably due to the decreaesad pitching control sensitivityat the lower rotor speeds obtained following a delay; i.e., the timerequired to reach a given dive angle with a given cyclic Input increased.It is possible that this factor was accounted for by using largercyclic inputs but some difficulty was experienced in obtaining thedesired response. This characteristic was particularly evident duringpushovers from the "knee" of the delay curve since, in this area, due tothe limited time available, rapid attitude positioning was critical. Onseveral of the delay points at the "knee". particularly at the heavierweights, it was felt that the slow response in pitching preventedobtaining an attitude which would hýve yielded better energy utilization.
Significant variations in flare and collective pitch techniquewere required between the no-delay and delay landings. These variations
were introduced primarily to accommodate the possibility of blade stallduring the flare and subsequent collective application.
(a) Flar
Flaru pitching rates used during delay landings weregenerally lower than those used for no-delay landings. This wasnecessary to prevent normal acceleration (g) build-up from causing rotordisk loads which would produce blade stall. This lower pitching rate,although used on almost all delay landings, wae probably more apparentwhen landing from a "knee" throttle chop than when landing from a higherheight. This was found to be necessary becausc "knee" throttle chopstended to produce a decelerating rotor just prior to flare whereas chopsfrom higher heights provided sufficient time for the rotor to begin toarcelerate prior to flare. It was observed that the test helicopter'srotor system was particularly susceptible to blade stall whendeceleratinX. Therefore, a lower pitching rate was used on "knee"points.
(b) Flale Reimh t
Because of the lower pitching rates used, it was necessaryto provide more time for the helicopter to reach a landing attitude. It
is probable, therefore, that flare initiation heights for delay landiegswere generally higher than those used for no-delay landings. Thischange in flare height was intuitive on tte part of the pilot.
3- 4
(c) CCollecttie Pit•h ApplicMtigo
Collective application, as on no-delay points, weintuitively initiated as rotor speed acceleration peaked (approximately)so as to obtain the uaximum benefit from rotor inertial forces. Asignificantly slower rate of application was used on delay landings,again to preclude the possibility of causing blade stall due to highnormal accelerations. Normally, if no stall were obtained, thecollective application was made in two segments, the first to cushionthe tail wheel touch-down and the second timed to reach maximumcollective approximately with main gear touch-down. In a number oflandings where blade stall commenced (very noticeable vibration) withthe initial application c-f collective pitch, the rate of applicationwas slowed and then varied to try to prevent complete blade stall whilestill utilizing all the available energy to land. For landings whereblade stall occurred during the flari, full collective application inone pull was required almost immediately since blade stall in the flareproduced high oink rates which precluded a gentle application ofcollective pitch.
b. Data Point Validation By The Pilot
The objectives of this program were to define the height-velocitycharacteristics of the test helicopter as associated with the attainmentof maximum autorotative performance. Obviously, the attainment ofmaximum pertormance depends upon the complete utilization of all theenergly available to decelerate the helicopter for touch-down, followinga throttle chop from a given set of steady-state entry conditions.Assuming thst optimum energy utilization is obtained, the landing loadfactor (S) then becomes a measure of maximum performance. In explana-tion, if the height-velocity maneuver were initiated from a given setof entry conditions (airspeed and height above ground) and if all theavailable decelerating energy for landing were utilized, then theattainment of a landing load factor near the design limit for thehelicopter under these conditions, would represent a maximum performancepoint on the height-velocity curve for the density altitude and grossweight being examined. This criteria was employed throughout thistest program and produced highly satisfactory results. It is believedthat the quantitative measurement of this parameter (landing g loads) asa means of validating the degree of performance of a height-velocitypoint is, when coupled with pilot qualitative coments, the best approachto obtaining maximum performance data points.
c. En;rA Airspeed Control
The ust of a pace car to obtain desired entry airspeeds proved to bethe most satisfactory means of regulating this parameter in the testhelicopter, particularly for data points obtained in the region of the"knee" and along the lower boundary of the curve. Along the upper
3 - 5

boundary, however, the accuracy of the pace method deteriorated,primarily due to the distance between the helicopter and the car coupledwith the relatively slow speeds required. These factors caused thepilot considerable difficulty in that relative motion between thehelicopter and the car could not readily be sensed, thereby causingvariations in entry airspeeds. These variations were particularlyundesirable when executing a run at an airspeed in the vicinity of amaximum performance point since entry airspeed variations of + 2 mph inthis area would significantly affect th: resulting landing loads.
d. Blade Stall Characteristics During Landing
Blade stall was encountered on several landings In this program. Itis also probable that pilot's colments relative to "falling through" theflare in Reference 2 were caused by this phenomena. Because thischaracteristic, from & maximum energy utilization standpoint, representslanding conditions which are at or in excess of the maximum performancecapabilities of the helicopter, its occurrence was a qualitative criteriafor determining a maximum performance point. The frequency of occurrencewas highest in the area of the "knee" and along the upper boundary ofthe curve, lowest along the lower boundary of the curve. Because thefactors which influence the onset of blade stall do not vary linearlywith variations in entry airspeed and height, the probability of •tsoccurrence was extremely difficult to predict. Depending upon the flareentry conditions (airspeed, rotor speed, sink rate) blade stall wasencountered either as flare rate reached a peak value and/or ascollective pitch application was comenced. Stall was characterized byloss of normal acceleration ("falling through"), random rolling to theleft and high amplitude, 4/rev vibration. Normal pilot response was toincrease rate of collective application to prevent the impending hardlanding. It is probable that tho increased rate of application inducedadditional stalling which consequently resulted in increasing the landingsink rate. It is important to remember, however, that the time availablebetween severe stall onset and ground impact was approximately one totwo seconds thereby precluding any reasoned pilot response.
e. Stability and Control Effects on Autorotative Performance
Thus far, two criteria have been discussed as valid means ofdetermining P maximum performance point, normal energy limits and bladestall. A third and last criteria was utilized for several pointsobtained in this program, that criteria being a stability and controllimit. In the test helicopter, particularly in the area of the "knee"of the curve, it was found that insufficient control power was availableto pitch the helicopter nose-down folloving throttle chop and thenflare to the desired attitude in the time available between throttle chopand ground contact. Consequently, the pilot was unable to take advewntageof all the decelerating energy available in the helicopter.
3- 6

f. Wind and Turbulence Effects on Autorotgt~ve Perfornage
It is probable that no other variable other than pilot technique hasa more pronounced effect on autorotative performance than wind gradientsand thermal turbulence. These variables, therefore, if not accuratelymeasured, or accounted for, will induce significant errors An the datawhich is generated. In this program, throttle chop entry airspeed wgagradually reduced during the build-up to a point, by reducing the speedof the pace car a measured amount from run to run. By pacing on the car,the helicopter thus attained a gradually decreasing &rouad speed.Autorotative performance, however, depends not upon ground speed, butupon true a.rspeed. If, therefore, during the course of a run, a changein wind speed occurred at a fixed car pace speed, a correspondingchange in true airspeed would be obtained, unknown to the pilot. Thisproblem is greatly magnified when a differential wind velocity existsbetween throttle chop height and the ground, particularly if the winddifferential is such that a loss in true airspeed is obtained duringtho !ending sequenep (Cliss headwind component on the ground than aloft)since tnis ctandititn represents an uncontrolled loss of l.nding energywhich is very critical when operating in the vicinity of a maximumper formance point.
The same effects are produced by thermal turbulence. If the throttlechop and descent are accomplished with the helicopter located in a risingcolumn of air and if the flight path of the helicopter. then carries itoutside that rising column prior to landing, it can readily be seen thatan uncontrolled, unfavorable loss of landing energy in again obtained.
3- 7

N
APPENDIX 4
SUMMARY OF HEIGHT VELOCITYDIAGRAM FLIGHT T.SI DATA
(2
4 1
il' .
41. 1

3UI9ANY OP HtXONT -VIL4CITY
DIAORAM PLIONT TIST DATIA
P0Y HUN DATE AIRCKtAFI WEN3TY WIND 1410" CAL CAL ACC, auNO. NO, 099033 WT. ALTI1rJDE COMPONIN (PEE?) (MPH) (NPN) WOS)
DO 4 41. 169:6 040
to 91 ~ I Zio ±119'0: i611 11al 145 0 +13, Rj 10 1 *.1 a.Ijf4 109. 0 19 1 WOV10
14 :0r 1 00 43. It1 1
10 1, -I4.gN+1.0 1.34 1 : V0-T 0 16:0 IS -II 80,
70O +1.16 ,1:5010 10,010290o.
Iollfpý) 1- 10,0 :10It1) :10- 3? T4 10- - +1. 100 s .f 0
16 Io-bO 10,050 1 1a L 1-p ,1.0 "'fr +11 *5 INSIT 0
10 600000
5 10 V-3134
10(`) al30* 11,105 '350 43. 131.0 14 1.009 10- 1 ,t 0 w5000 01 3oi.0 g6. : 3 0.0
1017410 1. 031 11-10-6 904a fA6O0 40.?
1114~6 10 01k10 0II:1 lo':21 OR 11001 1:0.0 2:1o a l 3.1
a 1 11-26 101,06153001.6 6.7 94: 011-16-11 106145 00 ;11118.0.C
1--6 9,095 4I0 1 111.0. 14~I I 1.-6 ,10509 490-: 1 19. 1. 11. . '. 12--! 10,010 6700 IN, 88.:1 35. 1. 0
I~~m a_ _ _ _ _ _ _ _ __7u I IT1 .

SUMMqARY OP NK101W VUL.0I¶'YDIAURAN PLtOHT TEST DATA
FLX. RUN DAT5 AIRCRAPT DINSITY WIND MUCH CAL CAL AGO, MILAYNo. Na. ROSEl WT. AIWITU~* Om'PMK~r? I?9 (MPH) (MPH) Ws') F11c)a
4 40 l'ftG00 40.1 55.8 311,6 1~6 1:711 0
II7 1it10- .0 10, 19 1
134 It . O~ WOO: 151 09 1t.i1- uI 008:t:1
1 1 11t- '1000 t~ 11 11.331113 0
47 4 I-Ot 10, 31 310104.41 04 (3I ) 1-0- 14019 2 ' 11 0
129 1:311- 100 a0 5. 0
1-' 0,60- 15001 *126 17. 13 31 011 - = 10, - 100 13. 311.0 a3 073 0
fill-100 3.1 0 1. 0 113.31 0a 7 1-21: 10 400 -1431T
11 136 to,1 1'0 0l IN 13.6 3.397
11(s Ill11 *11 1N 3013 1 110: +07-.6 330 1 0
I109 1r IN '9. 319wI= 1,0: 0 10 +103 : 0
11,0il -00.0 .066,aa 16.1
4 W s1 11,013 +1 1.0 3.11 00
50 - 30 16 0110 -.
21 30-. 30, D1. 30.5 1: it1 11,80) 1 10 0 3 -01. vi I On 0
113 1160 010 1. IT.10,004 s.3- 11,o L~ 4 079. 0
12 11,0 lw16: .5. 319130
wi 0) 11 0 60 Ro1.6 1E'4 ,161 3.391 0
2. 11: op 307201 .re073a-186 11,07- :10 +1.7& 3190,:51' 1.90 0
(3) OAR LAN5N -1. UIICPI 1 5. Is" 0
I-~11 ACUA 100,00 6 A-5LUREN
I- - 10 1 1440 1 64 IT6 0