an evaluation on overstrength factors of reinforced ... · 1 and bülent akbaş 2 1 research...
TRANSCRIPT

4th International Conference on Earthquake Engineering and Seismology
October 11-13, 2017 – ANADOLU UNIVERSITY – Eskisehir/Turkey
1
An Evaluation on Overstrength Factors of Reinforced Concrete Buildings
Oğuzhan Çetindemir1
and Bülent Akbaş2
1Research Assistant, Civil Eng. Department, Antalya Bilim University, Antalya, Turkey and
PhD Student, Civil Eng. Department, Gebze Technical University, Kocaeli, Turkey 2 Professor, Civil Eng. Department, Gebze Technical University, Kocaeli, Turkey
Email: [email protected]
ABSTRACT:
On August 17, 1999, the moment magnitude (Mw) 7.4 Kocaeli earthquake which was considered to be one of
the most catastrophic events to have ravaged a highly industrialized province since the 1923 Tokyo earthquake,
struck the Marmara Region of northwestern Turkey. Subsequently, on November 12, 1999 the Mw 7.2 Düzce
earthquake hit the same region. Most of the collapsed and damaged structures were typically four-to-eight-
story reinforced concrete buildings (RCBs). Due to the calamitous consequences of these earthquakes, Turkish
Earthquake Code-2007 (TEC-07) and lastly Turkish Earthquake Code-2016 (TEC-16) draft version were
accepted. One of the essential change in TEC-16 is earthquake load reduction factor, Rₐ and one of its
parameters, overstrength factor (Ω) which depends on different factors and the most important of them is
ductility (µ) that is also one of the most crucial keys to design earthquake resistant RCBs. This study mainly
focuses on investigating of Ω values for three different stories (3, 6 and 9) of RCBs. Nonlinear dynamic time
history analyses were performed according to TEC-16 by generating 3D finite element models (FEMs) under
a set of strong ground motions. Using the output of the analyses, Ω values were calculated for each of 3D
FEMs. Finally, the results obtained from the analyses were compared to TEC-16 Ω values and discussed at the
end of the analyses.
KEYWORDS: Overstrength Factor, Nonlinear Dynamic Time History Analyses, Ductility, Reinforced
Concrete Buildings, Strong Ground Motions, Turkish Earthquake Code 2016-Draft Version
1. INTRODUCTION
During major earthquakes in recent years, many reinforced concrete buildings (RCBs) suffered from local
failures and total collapse in Turkey. Therefore, in the last two decades, earthquake codes have undergone
radical changes. In 2016, Turkish Earthquake Code-2016 (TEC-16) draft version was offered. One of the most
important changes in TEC-16 is earthquake load reduction factor, Rₐ and its mentioned parameter overstrength
factor (Ω). Different Ω values are given for every type of building structural systems according to structural
system behavior factors, R and allowed total building height classes, (BHC) in TEC-2016 draft version [1].
Moreover, in TEC-16, some formulas are given in order to calculate Ω. Although all of these given values and
equations below help to calculate Ω values and in reality, those given values for Ω may not be the same for
each building types. Because of different parameters that can also affect ductility, µ Eq. (1) like buildings
material and section properties and etc., every individual building must have its own unique Ω value.
𝜇∆ = ∆𝑚𝑎𝑥/∆𝑦 (1)
𝑅 = 𝑅𝜇 ∗ Ω = 𝑉𝑒/𝑉𝑑 (2)
𝑅𝜇 = 𝑉𝑒/𝑉𝑦, Ω = 𝑉𝑦/𝑉𝑑 (3)

4th International Conference on Earthquake Engineering and Seismology
October 11-13, 2017 – ANADOLU UNIVERSITY – Eskisehir/Turkey
2
𝑅𝜇 ≈ 𝜇∆ (4)
𝑅𝑎 = Ω + (R/I − Ω) (T/𝑇𝐵), 𝑇 ≤ 𝑇𝐵 (5)
𝑅𝑎 = 𝑅/𝐼, 𝑇 > 𝑇𝐵 (6)
𝑅𝜇 is a strength reduction factor, structures with periods bigger than 0.5 sec 𝑅𝜇 can be considered as equal to
structural ductility (𝜇∆) in Eq. (4) and earthquake load reduction factor, Rₐ is shown in Eq. (5) and Eq. (6).
𝑉𝑒 is the maximum seismic demand for elastic response, 𝑉𝑦 is the base shear corresponding to the maximum
inelastic displacement also known as actual strength, 𝑉𝑑 is the design base shear Eq. (3). The relationships
between the force reduction factor (R), structural overstrength (Ω), and the ductility reduction factor (𝑅𝜇) are
shown Fig.1. [7].
Past experience and observation of building behavior following earthquakes has shown that a structure can be
economically designed for a fraction of the estimated elastic seismic design forces, while maintaining the basic
life safety performance objective. This design philosophy implies that structural inelastic behavior (and
damage is expected. This reduction in design seismic force is effected through the use of force reduction factor,
R. The intent of the R factor is to simplify the structural design process such that only linearly elastic static
analysis is needed for most building design.
While some deformation-controlled members, detailed to provide ductility, are expected to deform
inelastically, force-controlled members that are designed to remain elastic would experience a significantly
higher seismic force level than that predicted based on actual design seismic forces. To account for this effect,
the code uses a seismic force amplification factor, Ω, such that the realistic seismic force in these force-
controlled members can be conveniently calculated from the elastic design seismic forces. To control drift or
to check deformation capacity in some deformation-controlled members, a similar approach is also adopted.
Figure 1. The relationships between the force reduction factor, R, structural overstrength, Ω,
and the ductility reduction factor, 𝑅𝜇 [7].
The typical response envelope relating force to deformation is shown in Figure 1 and can be established from
either testing or a pushover analysis. The structure first responds elastically, which is then followed by an
inelastic response as the lateral forces are increased. A series of plastic hinges form throughout the structure,
leading to a yielding mechanism at the strength level 𝑉𝑦.
4th International Conference on Earthquake Engineering and Seismology
October 11-13, 2017 – ANADOLU UNIVERSITY – Eskisehir/Turkey
3
The design method follows a simplified procedure. Based on the fundamental linear elastic period of the
structure, a base shear, 𝑉𝑒 is then reduced by a factor, R, to establish a design seismic force level 𝑉𝑑 beyond
which elastic analysis is not valid. To estimate internal forces that develop in force-controlled members for
capacity design, the corresponding forces at the design seismic force level, 𝑉𝑑 are then amplified by a system
overstrength factor, Ω.
The 3D pushover analysis and nonlinear dynamic time history analysis (NDTHA) are performed in order to
calculate 𝑉𝑦 and 𝑉𝑑. There are various studies in the literature that regarding to calculating not only Ω, but also
𝑅𝑎 and other parameters related to ductility, µ [6, 7, 8, 11]. These studies are mainly focused on nonlinear
static analysis and nonlinear dynamic time history analysis. The time history analysis is the most reliable
analysis method among all the nonlinear analysis methodologies.
However, its easy application comparing to time history analysis, nonlinear static analysis is still being carried
out by many researchers. In this study, pushover capacity curve (Base Shear-Top Displacement) is plotted by
carrying out nonlinear static analysis (NSA) on 3-, 6-, and 9-stories RCBs. In addition to NSA, maximum
displacements and base shear capacities are plotted by using NDTHA.
2. ANALYTICAL STUDY
2.1. Details of 3-,6-, and 9-Story Reinforced Concrete Buildings and Scaled Ground Motions
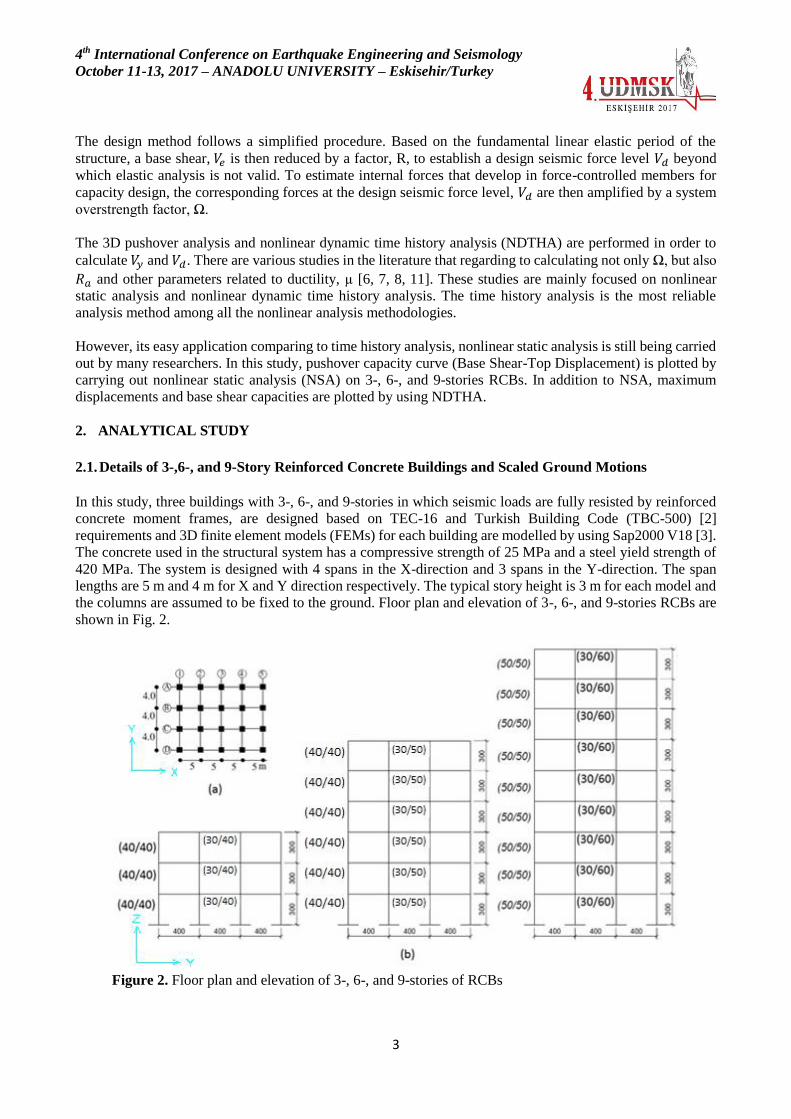
In this study, three buildings with 3-, 6-, and 9-stories in which seismic loads are fully resisted by reinforced
concrete moment frames, are designed based on TEC-16 and Turkish Building Code (TBC-500) [2]
requirements and 3D finite element models (FEMs) for each building are modelled by using Sap2000 V18 [3].
The concrete used in the structural system has a compressive strength of 25 MPa and a steel yield strength of
420 MPa. The system is designed with 4 spans in the X-direction and 3 spans in the Y-direction. The span
lengths are 5 m and 4 m for X and Y direction respectively. The typical story height is 3 m for each model and
the columns are assumed to be fixed to the ground. Floor plan and elevation of 3-, 6-, and 9-stories RCBs are
shown in Fig. 2.
Figure 2. Floor plan and elevation of 3-, 6-, and 9-stories of RCBs

4th International Conference on Earthquake Engineering and Seismology
October 11-13, 2017 – ANADOLU UNIVERSITY – Eskisehir/Turkey
4
Fundamental periods of vibration for the 3-, 6-, and 9-stories of RCBs are found after a modal analysis and
shown in Table 1.
Table 1. Fundamental periods of vibration for the 3- 6-, and 9-stories
The nonlinear dynamic analysis of three RCBs 3D models was carried out using 11 strong ground motions
listed in Table 2 after they were all scaled to the design spectrum corresponding to earthquake ground motion
level with probability of exceeding 10% in 50 years with return period of 475 years which is also defined as
standard design earthquake ground motion in TEC-2016 [1].
Table 2. Selected strong ground motions for nonlinear dynamic analysis
Number Event Year Scale
Factor Station Mag Mechanism Rjb(km) Rrup(km) Vs30(m/s)
Lowest
useable
freq
(Hz)
1 Duzce,
Turkey 1999 3.2129
Lamont
1060 7.14 strike slip 25.78 25.88 782 0.075
2 Duzce,
Turkey 1999 1.7618 Mudurnu 7.14 strike slip 34.3 34.3 535.24 0.1
3 Hector,
Mine 1999 0.7151 Hector 7.13 strike slip 10.35 11.66 726 0.0375
4 Kobe,
Japan 1995 3.8127 Chihaya 6.9 strike slip 49.91 49.91 609 0.1
5 Kobe,
Japan 1995 4.489 OKA 6.9 strike slip 86.93 86.94 609 0.0625
6 Kobe,
Japan 1995 2.8911 TOT 6.9 strike slip 119.64 119.64 609 0.0625
7 Kocaeli,
Turkey 1999 0.7599 Izmit 7.51 strike slip 3.62 7.21 811 0.125
8 Kocaeli,
Turkey 1999 0.7693 Gebze 7.51 strike slip 7.57 10.92 792 0.1
9 Kocaeli,
Turkey 1999 1.1425 Arcelik 7.51 strike slip 10.56 13.49 523 0.0875
10
Helena,
Montana-
01
1935 2.7602 Carroll
College 6 strike slip 2.07 2.86 593.35 0.1625
11 Imperial
Valley-06 1979 0.9314
Cerro
Prieto 6.53 strike slip 15.19 15.19 471.53 0.1125
All buildings were designed for a local soil class ZB in downtown Bostancı, İstanbul where 𝑆𝑠 and 𝑆1 are found
1.007g and 0.274g respectively [5]. By using target spectrum, scale factors for every selected strong ground
motions are found [4] and plotted over the design spectra (target spectrum) Fig. 3.
Story Period (T, sec)
3-Story 0.24071
6-Story 0.50226
9-Story 0.75198
4th International Conference on Earthquake Engineering and Seismology
October 11-13, 2017 – ANADOLU UNIVERSITY – Eskisehir/Turkey
5
Figure 3. Horizontal Elastic Design Spectra (Target Spectra) and Scaled Response Spectra for Selected
Strong Ground Motions according to TEC-16 Draft Version
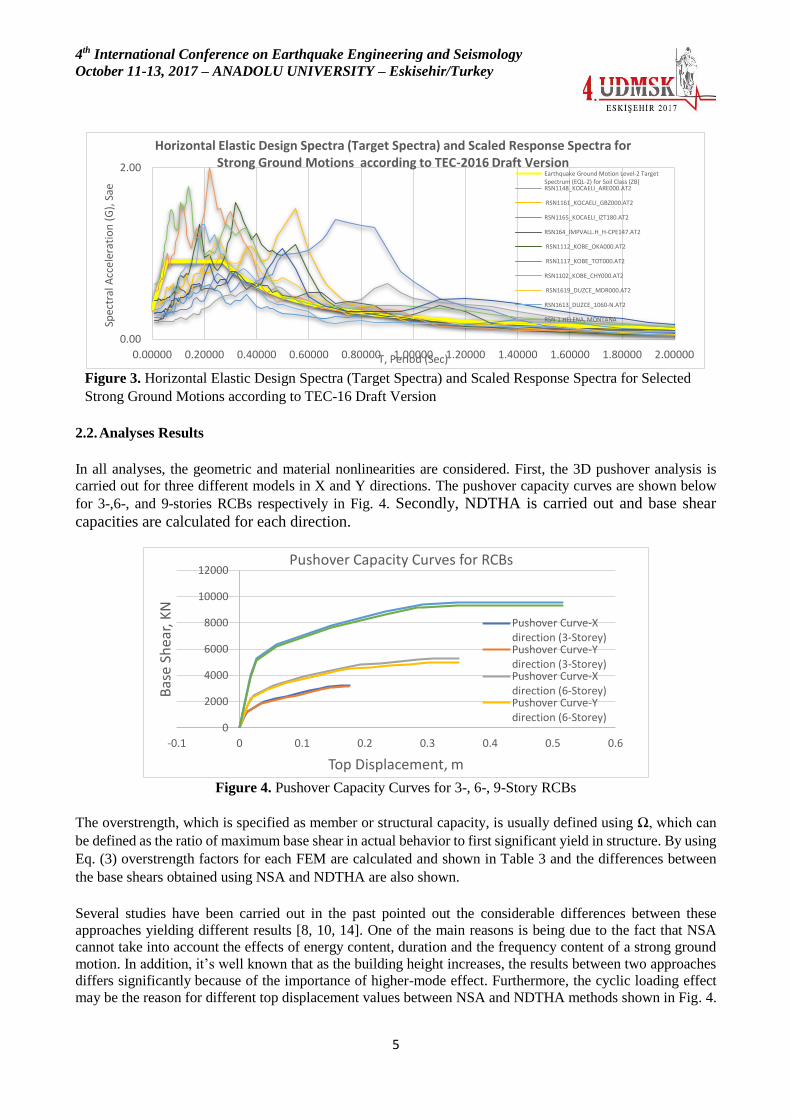
2.2. Analyses Results
In all analyses, the geometric and material nonlinearities are considered. First, the 3D pushover analysis is
carried out for three different models in X and Y directions. The pushover capacity curves are shown below
for 3-,6-, and 9-stories RCBs respectively in Fig. 4. Secondly, NDTHA is carried out and base shear
capacities are calculated for each direction.
Figure 4. Pushover Capacity Curves for 3-, 6-, 9-Story RCBs
The overstrength, which is specified as member or structural capacity, is usually defined using Ω, which can
be defined as the ratio of maximum base shear in actual behavior to first significant yield in structure. By using
Eq. (3) overstrength factors for each FEM are calculated and shown in Table 3 and the differences between
the base shears obtained using NSA and NDTHA are also shown.
Several studies have been carried out in the past pointed out the considerable differences between these
approaches yielding different results [8, 10, 14]. One of the main reasons is being due to the fact that NSA
cannot take into account the effects of energy content, duration and the frequency content of a strong ground
motion. In addition, it’s well known that as the building height increases, the results between two approaches
differs significantly because of the importance of higher-mode effect. Furthermore, the cyclic loading effect
may be the reason for different top displacement values between NSA and NDTHA methods shown in Fig. 4.
0.00
2.00
0.00000 0.20000 0.40000 0.60000 0.80000 1.00000 1.20000 1.40000 1.60000 1.80000 2.00000
Spec
tral
Acc
eler
atio
n (
G),
Sae
T, PerIod (Sec)
Horizontal Elastic Design Spectra (Target Spectra) and Scaled Response Spectra for Strong Ground Motions according to TEC-2016 Draft Version
Earthquake Ground Motion Level-2 TargetSpectrum (EQL-2) for Soil Class (ZB)RSN1148_KOCAELI_ARE000.AT2
RSN1161_KOCAELI_GBZ000.AT2
RSN1165_KOCAELI_IZT180.AT2
RSN164_IMPVALL.H_H-CPE147.AT2
RSN1112_KOBE_OKA000.AT2
RSN1117_KOBE_TOT000.AT2
RSN1102_KOBE_CHY000.AT2
RSN1619_DUZCE_MDR000.AT2
RSN1613_DUZCE_1060-N.AT2
RSN-1 HELENA, MONTANA
0
2000
4000
6000
8000
10000
12000
-0.1 0 0.1 0.2 0.3 0.4 0.5 0.6
Bas
e Sh
ear,
KN
Top Displacement, m
Pushover Capacity Curves for RCBs
Pushover Curve-Xdirection (3-Storey)Pushover Curve-Ydirection (3-Storey)Pushover Curve-Xdirection (6-Storey)Pushover Curve-Ydirection (6-Storey)

4th International Conference on Earthquake Engineering and Seismology
October 11-13, 2017 – ANADOLU UNIVERSITY – Eskisehir/Turkey
6
and Fig. 6. [14]. The building with less displacement in the NDTHA method is subjected to more earthquake
effects than the NSA method [10].
Table 3. Overstrength factors
Analysis Type Parameters 3- Story 6- Story 9- Story
Pushover Analysis
Global Direction X Y X Y X Y
Design base shear,
Vd (kN) 1279.5 1223 2240 2088 3990 3909
Base shear capacity,
Vy (kN) 3215 3137.5 5272.2 5009 9565 9450
Overstrength factor,
Ω = Vy/Vd 2.51 2.56 2.35 2.4 2.4 2.42
Nonlinear Dynamic
Analysis
Design base shear,
Vd (kN) 1905 1235 1890 1984 3054 2.452
Base shear capacity,
Vy (kN) 5850 3778 5686 5987 9524 7237
Overstrength factor,
Ω = Vy/Vd 3.07 3.05 2.94 3.02 3.11 2.95
According to nonlinear dynamic time history analysis results, maximum base shear capacities and maximum
top displacements for all 3D models in the direction of X and Y are given below in Fig. 5 and Fig. 6.
Figure 5a. Maximum Base Shear in the direction of X and Y for 3-story RCB
Figure 5b. Maximum Base Shear in the direction of X and Y for 6-story RCB
Figure 5c. Maximum Base Shear in the direction of X and Y for 9-story RCB
-10000
0
10000
0 10 20 30
Bas
e S
hea
r, K
N
Time, sec
Maximum Base Shear in X direction
(RSN1112_KOBE_OKA000)
-10000
0
10000
0 10 20 30
Bas
e S
hea
r, K
N
Time, sec
Maximum Base Shear in Y direction
(RSN1112_KOBE_OKA090)
-10000
0
10000
0 10 20 30
Bas
e S
hea
r, K
N
Time, sec
Maximum Base Shear in X direction (RSN1161_KOCAEL_GBZ000)
-10000
0
10000
0 10 20 30
Bas
e S
hea
r, K
N
Time, sec
Maximum Base Shear in Y direction
(RSN1161_KOCAEL_GBZ270)
-20000
0
20000
0 10 20 30
Bas
e S
hea
r, K
N
Time, sec
Maximum Base Shear in X direction
(RSN1117_KOBE_TOT000)
-10000
0
10000
0 10 20 30
Bas
e S
hea
r, K
N
Time, sec
Maximum Base Shear in Y direction
(RSN1117_KOBE_TOT090)

4th International Conference on Earthquake Engineering and Seismology
October 11-13, 2017 – ANADOLU UNIVERSITY – Eskisehir/Turkey
7
Figure 6a. Maximum Top Displacements in the direction of X and Y for 3-story RCB
Figure 6b. Maximum Top Displacements in the direction of X and Y for 6-story RCB
Figure 6c. Maximum Top Displacements in the direction of X and Y for 9-story RCB
3. CONCLUSIONS
Many reinforced concrete buildings (RCBs) in Turkey suffered from major failure during recent earthquakes
and that lead to significant changes in Turkish Earthquake Codes. Many seismic codes permit a reduction in
design loads, taking advantage of the fact that the structures possess significant reserve strength (that is Ω) and
capacity to dissipate energy (ductility, µ) [13].
-15
-10
-5
0
5
10
15
20
0 10 20 30
To
p D
isp
lace
men
t, c
m
Time, sec
Top Displacement in X direction
(RSN1112_KOBE_OKA000)
Joint 40-X direction (3-storey) -30
-20
-10
0
10
20
30
0 10 20 30
To
p D
isp
lace
men
t, c
m
Time, sec
Top Displacement in Y direction
(RSN1112_KOBE_OKA090)
Joint 84-Y direction (3-storey)
-25
-20
-15
-10
-5
0
5
10
15
0 10 20 30
To
p D
isp
lace
men
t, c
m
Time, sec
Top Displacement in X direction (RSN1161_KOCAEL_GBZ000)
Joint 15-X direction (6-Storey)-80
-60
-40
-20
0
20
40
60
0 10 20 30
To
p D
isp
lace
men
t, c
m
Time, sec
Top Displacement in Y direction (RSN1161_KOCAEL_GBZ270)
Joint 128-Y direction (6-Storey)
-100
-50
0
50
100
0 10 20 30
To
p D
isp
lace
men
t, c
m
Time, sec
Top Displacement in X direction
(RSN1117_KOBE_TOT000)
Joint 155-X direction (9-Storey)-60
-40
-20
0
20
40
60
80
0 10 20 30
To
p D
isp
lace
men
t, c
m
Time, sec
Top Displacement in Y direction
(RSN1117_KOBE_TOT090)
Joint 188-Y direction (9-Storey)

4th International Conference on Earthquake Engineering and Seismology
October 11-13, 2017 – ANADOLU UNIVERSITY – Eskisehir/Turkey
8
In this study, overstrength factors, Ω and its parameters 𝑉𝑦 and 𝑉𝑑 for RCBs are calculated by carrying out
nonlinear static analysis (Pushover analysis) and nonlinear dynamic time history analysis (NDTHA). The main
outcomes of this study and ideas for future studies can be summarized as follows:
(1) Overstrength factor (Ω) in TEC-16 draft code, is given 3 for the buildings which can resist seismic loads
by reinforced concrete moment frames. The results by carrying out pushover analysis which are presented in
Table 3 show that Ω values for 3- and 9-story RCBs are found to be about 2.5. The overstrength factor
decreases when the ductility of the frame decreases and for that reason, 6-story RCB, Ω value was found to be
smaller than 2.5 in both X and Y directions which is lower than the other FEMs.
(2) Nonlinear dynamic time history analysis results demonstrate that Ω values are compatible with the given
values in TEC-16.
(3) For a future study, according to TEC-16, different types of earthquake ground motion levels (DD-1, DD-
2, DD-3, DD-4) and local soil classes (ZA, ZB, ZC, ZD, ZE and ZF) can be used to generate different target
spectrums and then carry out nonlinear dynamic analysis by using earthquake records that are scaled according
to their individual target spectrums. Moreover, this study can be expanded by analyzing different types of
structural systems.
REFERENCES
[1] Turkish Earthquake Code (Draft Version), 2016.
[2] Turkish Building Code, TBC-500, 2000.
[3] CSI (2016). SAP2000: Static and Dynamic Finite Element Analysis of Structures V-18, Computers and
Structures, Inc., Berkeley, California.
[4] Pacific Earthquake Engineering Research (PEER) Center. (2006). PEER Strong Motion Database,
http://peer.berkeley.edu/smcat/.
[5] Turkey Earthquake Hazard Map and Interactive Web Application, https://testtdth.afad.gov.tr/.
[6] Arslan, M. Hakan, and I. Hakkı Erkan. "An Investigation on Overstrength Factor (Ω) of Reinforced
Concrete Buildings in Turkish Earthquake Draft Code (TEC-2016)", World Academy of Science, Engineering
and Technology, International Journal of Civil, Environmental, Structural, Construction and Architectural
Engineering 10.12 (2016): 1421-1425.
[7] Elnashai, A. S., and A. M. Mwafy. "Overstrength and force reduction factors of multistory reinforced‐
concrete buildings", The Structural Design of Tall and Special Buildings 11.5 (2002): 329-351.
[8] Mwafy, A. M., and A. S. Elnashai. "Static pushover versus dynamic collapse analysis of RC
buildings", Engineering structures 23.5 (2001): 407-424.
[9] Salem, Y. S., and K. Sham. "Nonlinear Time-History Analysis of Modular Structures Isolated by Sliding
Plates under Seismic Loads", 15th World Conference on Earthquake Engineering. Lisbon.
[10] Uygun, Gökay, and Zekai Celep. "Betonarme Bir Binanın Deprem Güvenliğinin Deprem Yönetmeliği
2007’deki Doğrusal ve Doğrusal Olmayan Yöntemlerle Karşılaştırmalı İncelenmesi”, Altıncı Ulusal Deprem
Mühendisliği Konferansı, 16-20 Ekim 2007, İstanbul.
[11] Alam, M. Shahria, M. Moni, and S. Tesfamariam. "Seismic overstrength and ductility of concrete
buildings reinforced with superelastic shape memory alloy rebar", Engineering Structures 34 (2012): 8-20.
[12] A Brief Guide to Seismic Design Factors, SEAOC Seismology Committee, 2008.
[13] R. M. Mahmoud and R. Akbari, Seismic behaviour factor, R, for steel Xbraced and knee-braced RC
buildings, Engineering Structures, Elsevier, 25 1505–1513, 2003.
[14] Çağlar, Naci, et al. "TDY2007’ye Göre Tasarlanmış Betonarme Bir Yapının Doğrusal Elastik Olmayan
Analiz Yöntemleri ile İncelenmesi." ISITES2014 Karabük (2014).