an examination of northeast florida food desert areas
TRANSCRIPT

An Examination of Northeast Florida Food Desert Areas:
Geographic & Demographic Descriptors, SNAP Expenditures,
& Purchasing Behaviors
Bruce Waite, Ph.D., The Common Thread Alliance
Tracy L. Johns, Ph.D., University of Florida David Dinkins, University of Florida
Northeast Florida Food Deserts
2
Abstract Many residents of food deserts rely on small convenience stores to obtain all of their groceries. Food
deserts are often located in economically distressed areas where much of the population relies on the
supplemental assistance provided by the Federal Supplemental Nutrition Assistance Programs (SNAP).
Duval, Clay, Putnam, and St. Johns Counties, Florida, have over 200,000 residents who receive food
stamps valued at over 340 million dollars on an annual basis. Prices of fresh food are significantly more
expensive when purchased in food deserts, which present a lower value of purchase to individuals who
are already economically stressed. Fresh, locally-grown foods are available at farmers markets but very
few of the markets are located in food deserts, making their access difficult for economically
disadvantaged consumers.
Three of these counties (Clay, Putnam, and St. Johns), which are rural in nature with some clusters of
urbanized pockets, are home to over 35,000 acres of on-going agricultural food crop production as well
as many other agriculturally-related businesses. Much of the crops that are produced are grown under
contract and shipped out of Northeast Florida when harvested. Many of the growers market their crops
through brokerage systems, which often purchase commodities at below wholesale prices. The
downturn of the economy, pressure on open land by development, the shifts in weather and the quality
of ground water have continued to put pressure on agricultural enterprise. Many farms in the area
which have been managed through multi-generations are seeing levels of debt unparalleled in their
business history and are experiencing levels of risk which have become intolerable (Kirshenmann, et al.
2012).
The need to realize a new set of solutions to change the current economic trends in fresh food
production has dictated examining markets in a different light. This research reviews these food desert
areas, including their geographic and social characteristics, and examines whether there are potential
markets significant enough to encourage regional growers to engage in the necessary production and
mobility activities.
Introduction Though the US produces enough food agriculturally to meet the caloric needs of the nation, many
families suffer food shortages due to a lack of physical or economic access. All types of families are
affected by food shortage and hunger, though minority and single parent households are
disproportionately affected. Food shortage and hunger also vary regionally and by population density.
Many public and private programs exist to combat food shortage and hunger. Private programs include
soup kitchens, food banks, and community gardens. Three primary federal programs provide food
assistance to families: the Supplemental Nutrition Assistance Program (SNAP), the National School Lunch
Program, and Women, Infants, and Children (WIC). Over half of very low food secure households
reported using at least one of these three major federal food and nutrition assistance programs in 2010.
These programs, along with private sector efforts, have become the primary means for addressing
hunger in America.
Northeast Florida Food Deserts
3
Background
Federal Programs The Supplemental Nutrition Assistance Program (SNAP), or “food stamps,” is the most prominent anti-
hunger program in the country serving over 40 million Americans annually. The program is intended to
assist households with the cost of purchasing nutritionally adequate food for their families. Over 75
percent of households using SNAP are households with children and nearly one-third are households
with elderly or disabled individuals. SNAP is only available to households in which the income to poverty
ratio is equal to or less than 130 percent (a “poverty line” of about $23,800 annually for a three person
family in 2010), assets are limited, and the net income is less than or equal to the poverty line
(Supplemental Nutrition Assistance Program).
A family is considered “food secure” when all members always have physical and economic access to
enough safe and nutritious food to meet their dietary needs and food preferences to lead an active and
healthy life. “Food insecurity” implies limited or uncertain availability of nutritionally adequate and safe
foods or limited or uncertain ability to acquire desired foods in socially acceptable ways. The United
States Department of Agriculture (USDA) measures food security on a four-point scale ranging from
“high food security” to “very low food security.” USDA does not measure hunger per se because hunger
is an individual-level physiological condition while food insecurity is a household-level economic and
social condition. Hunger is therefore a condition included in the USDA measurement of very low food
security (Hunger and Poverty: Definitions and Distinctions).
The American Institute of Nutrition defines food insecurity as the limited or uncertain availability of
nutritionally adequate and safe foods or limited or uncertain ability to acquire acceptable foods in
socially acceptable ways (Anderson 1990).
Research demonstrates the importance of access to an adequate diet as an essential element in lifetime
health outcomes for children and adults. Persistent, long-term hunger results in serious health threats,
including undernourishment or malnutrition. A 2007 study postulated relationships between increased
obesity, food insecurity, and dependence on SNAP, stating that “…obesity may result from an adaptive
physiological response to episodic food insecurity, which can lead to binge eating habits when food is
plentiful” (Dinour, Bergen, and Yeh 2007:1958). This continuing study examines the role of the
Supplemental Nutrition Assistance Program (SNAP) in promoting the roller coaster effect of the feast or
famine cycle that is so detrimental to the maintenance of healthy lifestyles. The research indicated that
in many cases the three-week cycle when food stamps are available is often followed by a weeklong
fasting cycle as the stamps are depleted and not reissued until the end of the month (Dinour et al.
2007). Additional stress is also placed on those individuals who do not have access to stores that have
the highest level of choices of affordable, healthy foods. A 2009 study in the American Journal of
Preventive Medicine examined the disparity of food access on the neighborhood level and found that:
Supermarkets, as compared to other food stores, tend to offer the greatest variety of high-quality products at the lowest cost. In contrast, convenience stores sell mostly prepared, high-calorie foods and little fresh produce, at higher prices. Studies of adults and adolescents have examined associations between neighborhood access to food stores and intake of fruits and vegetables, calories from dietary fat

Northeast Florida Food Deserts
4
and overall diet quality. The majority of these studies suggest that neighborhood residents with better access to supermarkets and other retail stores that provide access to healthful food products tend to have healthier food intakes. (Larson, Story, and Nelson 2009:75)
Increased food costs have out-paced the ability of SNAP and similar programs to provide adequate
resources for a healthy diet. The increasing cost of food for the consumer and declining household
income have reduced food expenditures. USDA’s Economic Research Service reports that median
spending on food by US households declined by 12 percent relative to the rising cost of USDA’s Thrifty
Food Plan and by six percent relative to the rising Consumer Price Index for Food and Beverages for the
period 2000-2007. The incidence of very low food security increased in the same period, and food
security deteriorated the most in the second-lowest income quintile, in which very low food security
increased by about half. Not only poor households reported decreased spending. According to the U.S.
Bureau of Labor Statistics’ Consumer Expenditure Survey, there were similar declines in food
expenditures in middle- and low-income households (Nord 2009). Food Spending Declined and Food
Insecurity Increased for middle-income and low-income Households from 2000 to 2007 (Nord 2009).
Food Deserts There are various indicators of food shortage at the national, regional, or local scale. Food shortage in
America tends to be local, related more to physical and economic access to safe, affordable, and
nutritious food than to issues of agricultural productivity. The presence of “food deserts” can serve as an
indicator of food shortage locally. Food deserts are areas or communities that lack physical and/or
economic access to sources of food that comprise a healthy diet. Most measures of food deserts are
based on the distance to a food store, factors that might affect accessibility such as income or vehicle
availability, and neighborhood-level factors such as availability of public transportation (Thayer, et al.
2008).
The challenge of increasing availability of and access to fresh, healthy foods in food deserts can be
approached in several ways. Traditional food market channels are weak in many disadvantaged urban
communities (Larson et al. 2009; Powell et al. 2007). Limited access to supermarkets affects the cost,
quality and availability of fresh produce (Algert, Agrawal, and Lewis 2006; Liese et al. 2007). Poor,
African-American and Hispanic communities suffer the greatest disparities (Ackerman and Tellis 2001;
Bodor et al. 2010), but access for the aging population is a potentially serious problem (Mojtahedi et al.
2008). Supermarket density is positively related to consumption of fresh fruits and vegetables, dietary
quality and health outcomes, including childhood obesity (Beydoun and Wang 2010; Black et al. 2010).
Strengthening these traditional market channels has received relatively little attention, but has yielded
some promising results (Pothukuchi 2005).
The research reports few studies of interventions designed to lower the price and improve the quality,
affordability and availability of fresh produce in other existing alternatives to supermarkets, such as
convenience stores, but some results are positive (Freedman and Bell 2009). Mobile markets (food
trucks or food busses) are a more recent market innovation, but their efficacy and impacts have not
been evaluated. Farmers’ markets and community gardens have received the greatest attention as
supplements to traditional market chains, but the body of reliable scientific evidence about the impact
Northeast Florida Food Deserts
5
of these alternatives is limited (Brown and Jameton 2000; DeMarco and Thorburn 2009). A review of
the research results from 1980 to 2009 showed that 9 of 16 studies showed some positive impact on
nutrition (McCorkmack et al. 2010). Farmers’ markets may be relatively inaccessible for many (Racine et
al 2010). The working poor have time constraints and the aging and disabled have physical constraints to
participation in community gardens (Martin et al. 2003), and the economic sustainability of community
gardens often depends on continued donor support (East and Dawes 2009).
Food deserts are simply defined as areas that lack access to affordable fruits, vegetables, whole grains,
low-fat milk, and other foods that make up the full range of a healthy diet (CDC: Food Deserts). The
USDA Food Access Research Atlas (accessed July 2013) identifies the neighborhood areas nationally by
census tracts that are both low income (li) and limited access (la), as measured by the different distance
demarcations for food access.
The Food Access Research Atlas provides researchers and other users multiple ways to understand the
characteristics that can contribute to food deserts, including income level, distance to supermarkets,
and vehicle access. The data are derived from the 2012 report, Access to Affordable and Nutritious
Food: Updated Estimates of Distances to Supermarkets Using 2010 Data (ver Ploeg et al. 2012). The
data on population are reported at the Census tract level from the 2010 Census of Population and
Housing. These data were aerially allocated down to half-kilometer-square grids across the United
States.
Low income tracts are defined as tracts with either a poverty rate of 20 percent or more, or a median
family income less than 80 percent of the State-wide median family income; or, tracts in a metropolitan
area with a median family income less than 80 percent of the surrounding metropolitan area median
family income.
Limited access tracts are defined using several attributes such as limited access to supermarkets,
supercenters, grocery stores, or other sources of healthy and affordable food. There are many ways to
measure food store access for individuals and for neighborhoods, and many ways to define which areas
are food deserts—neighborhoods that lack healthy food sources. Most measures and definitions take
into account at least some of the following indicators of access:
Accessibility to sources of healthy food, as measured by distance to a store or by the number of
stores in an area.
Individual-level resources that may affect accessibility, such as family income or vehicle
availability.
Neighborhood-level indicators of resources, such as the average income of the neighborhood
and the availability of public transportation.
With a significant body of research pointing to the health implications of food insecurity, the inability of
current SNAP levels to maintain the steady flow of healthy foods and the identification of neighborhood
(Census tract) areas where healthy food is both expensive and at times inaccessible, concerned groups
and individuals face a number of challenges to provide remediation.
Northeast Florida Food Deserts
6
In a 2012 CDC study that examined a sample intervention methodology designed to increase the
availability of fresh foods to urban food deserts, recommendations were made to create a community-
based dialog, using survey research of proprietors and customers to identify needs and develop
potential intervention strategies (Larson et al. 2013).
The challenge of placing a wider selection of fresh healthy foods in food desert areas can be approached
in several ways: encouraging existing large grocery stores in moving into the affected areas (market
limitations may limit this); encouraging existing small convenience stores already positioned in affected
areas to increase the amount of fresh foods they provide (this may not solve the cost issues); creating
farmers markets (this may not solve the transportation issues); and, developing alternative methods
such as mobile “food busses” or other mobility systems which can move the fresh food to the consumer
and potentially provide competitive prices.
This analysis examines the food desert areas of Clay, Duval, Putnam and St. Johns Counties, all situated
in the geographic area described as Northeast Florida. The four county areas contain a mix of densely
populated urban areas and rural land devoted to agricultural production. Duval County, which
encompasses the consolidated City of Jacksonville, has 29 Census tract areas, Putnam has five, Clay has
two, and St Johns has seven, that are classified by the USDA as urban food deserts where the residents
do not have easy access to supermarkets and lack the transportation resources to reach area where
nutritious and fresh food can be purchased affordably.
The analysis examines each of the Census tracts defined in the USDA Food Access Research Atlas (2010)
as food deserts within the four-county area. It explores the size characteristics and determines
geographic location descriptions for each of the areas defined as single census tracts or clusters of
tracts. Additionally, we attempt to gain a sense of the degree of potential market income by looking at
the county level SNAP expenditures.
Methodology In the preparation of this analysis, the initial Census tracts used in the four county areas to define areas
of low access to food were derived from the USDA Food Access Research Atlas, which reviews 2010
Census data and presents it on an interactive map. The Atlas provides information by presenting a
spatial overview of food access indicators for low-income and other Census tracts using different
measures of supermarket accessibility by providing food access data for populations within Census
tracts; and offering Census-tract-level data on food access that can be downloaded for community
planning or research purposes.
The original definition of food deserts (as defined in the original USDA Food Desert Locator) was used to
determine which tracts to review. In the original Food Desert Locator, “low-access” was measured as
living far from a supermarket, where 1 mile was used in urban areas and 10 miles was used in rural areas
to demarcate those who are far from a supermarket. In urban areas, about 70 percent of the population
was within 1 mile of a supermarket, while in rural areas over 90 percent of the population was within 10
miles (see Access to Affordable and Nutritious Food: Updated Estimates of Distance to Supermarkets
Using 2010 Data). Updating the original 1- and 10-mile low-access measure shows that an estimated
Northeast Florida Food Deserts
7
18.3 million people in these low-income and low-access Census tracts were far from a supermarket in
2010.
In Duval County there are 29 areas defined as food desert areas. These areas appear on the map as
representing a pattern of seven distinct groupings or clusters.
For the purposes of our examination, we treat those Census tract areas that have contiguous borders as
a single cluster area, even though they have not been defined as such by the USDA. Through their
proximity, however, they share certain market dynamics which make this designation useful for this
report. This type of “cluster” grouping will also simplify the confusion of trying to define where each of
the 29 Census tracts begins and ends.
In Clay, Putnam, and St Johns counties, similar areas were identified and also grouped into clusters.
Zip codes were then identified for each Census tract (http://www.unitedstateszipcodes.org/fl/). The
boundaries of Census tracts and zip codes do not readily overlay as zip code boundaries are often larger
than single Census tracts and often may lie in several tracts. Zip code areas are based on population and
are designated by the US Postal Service and are subject to change. The identification of zip codes is
important to this analysis, though, as it provides a way to examine the location of other services such as
churches, schools, and community service agencies by address.
Once the geographic location of each food desert tract cluster was determined, we examined the
number of total population, number of persons who were low income, and the number of households in
each cluster to enable us to identify the most densely populated cluster with the highest number of
individuals classified at low income. We also reviewed the access to transportation in each cluster to
better understand the severity of functional access to stores outside of the cluster. We documented
that access by looking at the raw numbers of low access persons in each tract and designating tracts that
numerically had at least a 10 percent level of “low access.”
We also used the US Census Bureau American Fact Finder to extract data from the American Community
Survey (ACS 2008-2012, 5-year estimates) on the total number of households and the number of
households utilizing food stamp assistance (SNAP) per tract. We then combined these numbers with the
USDA Economic Research Service estimate of the average monthly SNAP benefits per participant for
each county to calculate a rough estimate of the dollar value of food stamps available for expenditure in
each food desert cluster of tracts. For the purposes of this examination, we felt that the rough
estimates had value to our understanding of the potential revenue ranking of the various clusters. The
exactness of this measurement has a moderate confidence level, but lends itself to a basic
understanding of the clusters.

Northeast Florida Food Deserts
8
Food Desert Tracts in Duval County The 29 Census tracts in Duval County identified as food deserts can be effectively sorted into seven
clusters. Within the 29 areas designated as food deserts there are 140,068 individuals living in 55,020
households. Of those, 25,361 individuals (18.5%) are designated as low-income with limited access to
food stores within that area. All Census tracts in Duval County are identified with the numbering system
on the County level of 120-310 plus the individual census track number (for example 120-310-14401).
Figure 1: Overview of the 29 Food Desert Census Tracks in Duval County
Duval Census Tract Cluster One Cluster one is comprised of tracts 10401, 10402, 11000, and 10900 and is geographically defined as
located in the north end of the City of Jacksonville south of Interstate-295. It is bordered on the north
by State Road 104, to the east by North Main St., to the west by Gibson Ave., and to the south by the
Ribault River.
There are 2,692 low-income and low-access individuals who reside in this Census cluster which
represents 17.69% of the overall population of 15,210 persons who reside in 5,910 households. The
percentage of low-income and low-access individuals on a per tract basis ranges from a low of 11.55% in
tract 10401 to a high of 25.69% in tract 11000.
This Census tract cluster contains portions of zip codes 32218 and 32208. A sampling of the
neighborhoods within this Census tract cluster includes Osceola, Riverview, and Hollyford, although
other named areas may be present.

Northeast Florida Food Deserts
9
Figure 2: Duval Census Cluster One (10401, 10402, 11000, and 10900)
Table 1: Duval Census Cluster One
Census Tract Total
Population Total
Households # Individuals
LA/LI
% of Population
LA/LI
Lack of Transportation
in Excess of 10% VA
120-310-10401 3240 1194 584 18.02% Yes
120-310-10402 3955 1635 572 14.46% No
120-310-11000 3998 1534 1072 25.69% No
120-310-10900 4017 1547 464 11.55% No
Cluster Totals 15210 5910 2692 17.69% No
Northeast Florida Food Deserts
10
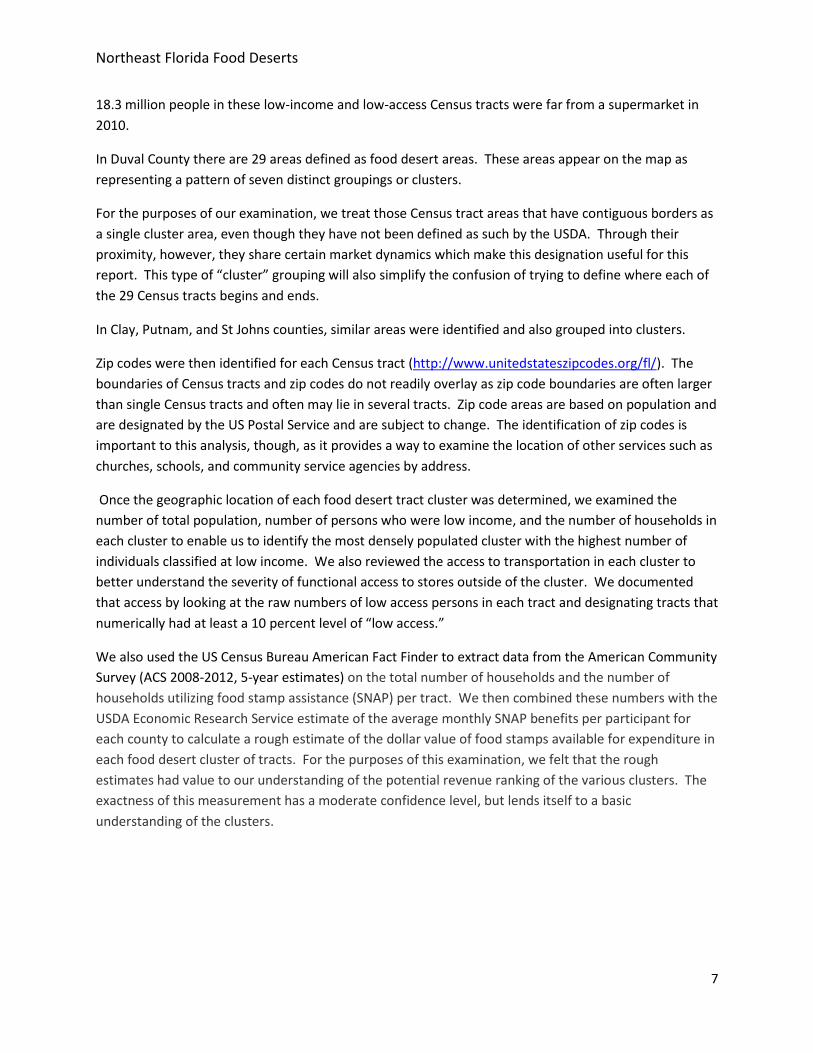
Duval Census Cluster Two This Census tract cluster, located in western Jacksonville, is comprised of Census tracts 11600, 11700,
02701, 02801, 02802, 02600, 02702, and 11800. This area is geographically defined as straddling US 1
and is bordered on the north by Edgewood Avenue West, on the west by Interstate-295 to County Road
117, on the south by Beaver Street West and I-10, and to the east by Interstate-95, Myrtle Avenue
North, and Avenue B Street.
This Census tract cluster is home to 31,995 individuals residing in 10,947 households. This Census tract
cluster contains the highest percentages of individuals who lack access to transportation, which ranges
by tract from 10% to 30%. Seven thousand four hundred and seventy-eight (7,478) of the residents of
this cluster are low-income and low-access individuals representing 23.40% of the total cluster, ranging
from 8.17% in tract 11800 to 55.25% in tract 11700. Of note is the fact that four out of eight tracts in
this cluster have percentages higher than 25 percent of the population representing low-income and
low-access individuals. This cluster is comprised of the largest area and the second highest population
total of the food desert Census tract clusters presented in this report.
This Census tract cluster contains portions of zip codes 32209, 32254, and 32220. A sampling of the
neighborhoods includes Bulls Bay, Biltmore, Paxton, College Gardens, Commonwealth, Woodstock,
Robinson’s Addition, Allendale, Magnolia Gardens and Grand Park, although other named areas may be
present in the area.
Figure 3: Duval Census Cluster Two (11600, 11700, 02701, 02801, 02802, 02600, 02702, and 11800)

Northeast Florida Food Deserts
11
Table 2: Duval Census Cluster Two
Census Tract Total
Population Total
Households # Individuals
LA/LI
% of Population
LA/LI
Lack of Transportation
in Excess of 10% VA
120-310-11600 3850 1533 623 15.18% 30%
120-310-11700 2554 956 1411 55.25% No
120-310-02701 3422 1226 1218 35.59% 20%
120-310-02801 4777 1885 1363 28.53% 20%
120-310-02802 4147 1702 375 9.04% 20%
120-310-02600 3795 1332 1865 49.14% 30%
120-310-02702 6329 1209 368 10.14% 10%
120-310-11800 3121 1104 255 8.17% No
Cluster Totals 31995 10947 7478 25.53% High
Duval Census Cluster Three This Census tract cluster contains Census tracts 00200 and 00300. The cluster is bordered to the east by
the St. Johns River, to the north by the Evergreen Cemetery and Jennings Park and Wigmore Park, to the
south by East 8th Street, and to the west by the SCL railroad tracks.
This Census tract cluster contains 1,886 low-income and low-access individuals which represents 38.48%
of the total cluster population of 4,901 persons who are contained in 1,747 households. The percentage
of low-income and low-access individuals ranges between tract 00300 at 22.58% and tract 00200 at
53.81%. This is considered a high “lack of transportation access” Census tract cluster with percentages
ranging between 20% and 30%.
This cluster contains a portion of zip code 32206, and the neighborhoods of Tallyrand, Longbranch,
Phoenix and Fairfield, although there may be other named areas not identified.
Table 3: Duval Census Cluster Three
Census Tract Total
Population Total
Households # Individuals
LA/LI
% of Population
LA/LI
Lack of Transportation
in Excess of 10% VA
120-310-00200 2496 961 1343 53.81% 30%
120-310-00300 2405 786 543 22.58% 20%
Cluster Totals 4901 1747 1886 38.48% High

Northeast Florida Food Deserts
12
Figure 4: Duval Census Cluster 3 (00200 and 00300)
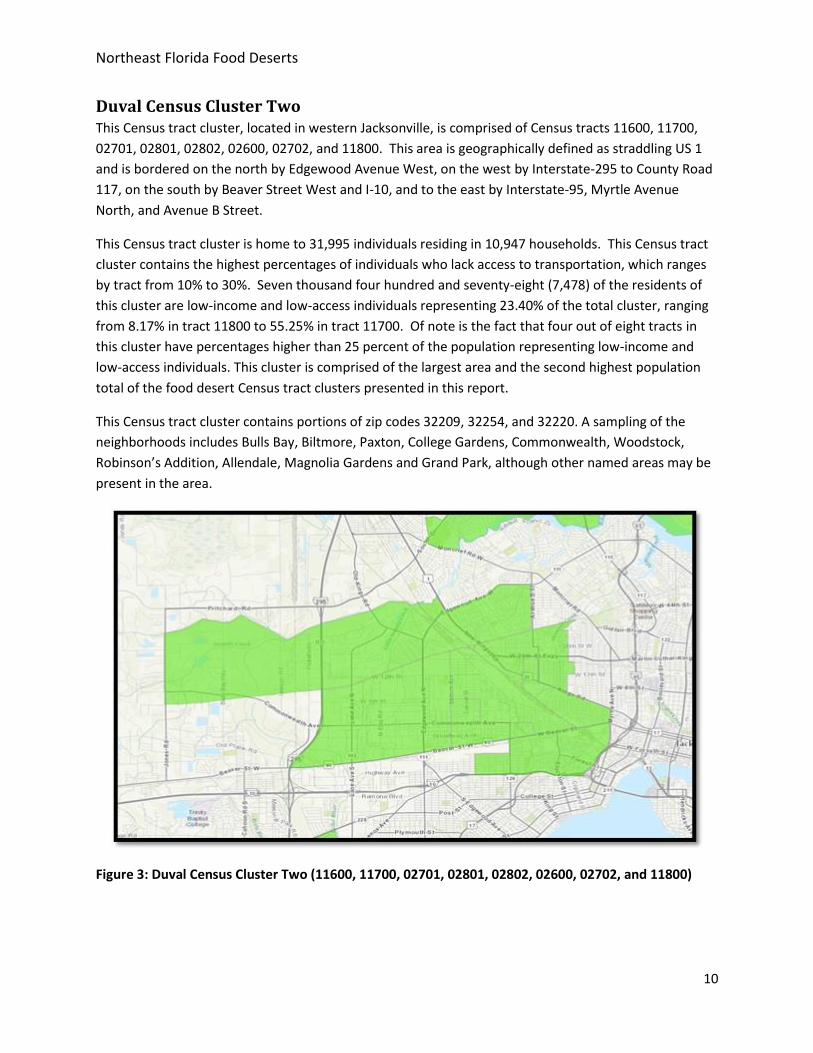
Duval Census Tract Cluster Four This Census tract cluster contains Census tracts 15100, 15501, 15400 and 15700. Beach Boulevard
borders the cluster to the south and Atlantic Boulevard and the St. Johns River border it to the west. It
is bordered on the north by Merrill Road and on the east by North Arlington Road and Townsend
Boulevard. Interstate-10 intersects this cluster.
This Census tract cluster contains 1,385 low-income and low-access individuals which represents 9.23%
of the total population of 15,013 who are contained in 6,153 households. The percentage of low-
income and low-access individuals ranges from tract 15501 at 7.49% to tract 15400 at 11.07%. This is
not considered a “low access to transportation” Census tract cluster as, with the exception of tract
15700 with a 20% ranking, the tracts contained in the cluster do not meet the minimum of 10%.
This Census tract cluster contains portions of zip codes 32211, 32216, and 32207, and the
neighborhoods of Arlington, Woodland Acres, Empire Point, Spring Glen, Atlantic Boulevard, and Love
Grove/Riviera Manor, although there may be other named areas identified.
Northeast Florida Food Deserts
13
Figure 5: Duval Census Tract Cluster 4 (15100, 15501, 15400, and 15700)
Table 4: Duval Census Cluster Four
Census Tract Total
Population Total
Households # Individuals
LA/LI
% of Population
LA/LI
Lack of Transportation
in Excess of 10% VA
120-310-15100 3898 1519 308 7.90% No
120-310-15501 3412 1315 255 7.47% No
120-310-15400 2440 941 270 11.07% No
120-310-15700 5263 2378 552 10.49% 20%
Cluster Totals 15013 6153 1385 9.23% No
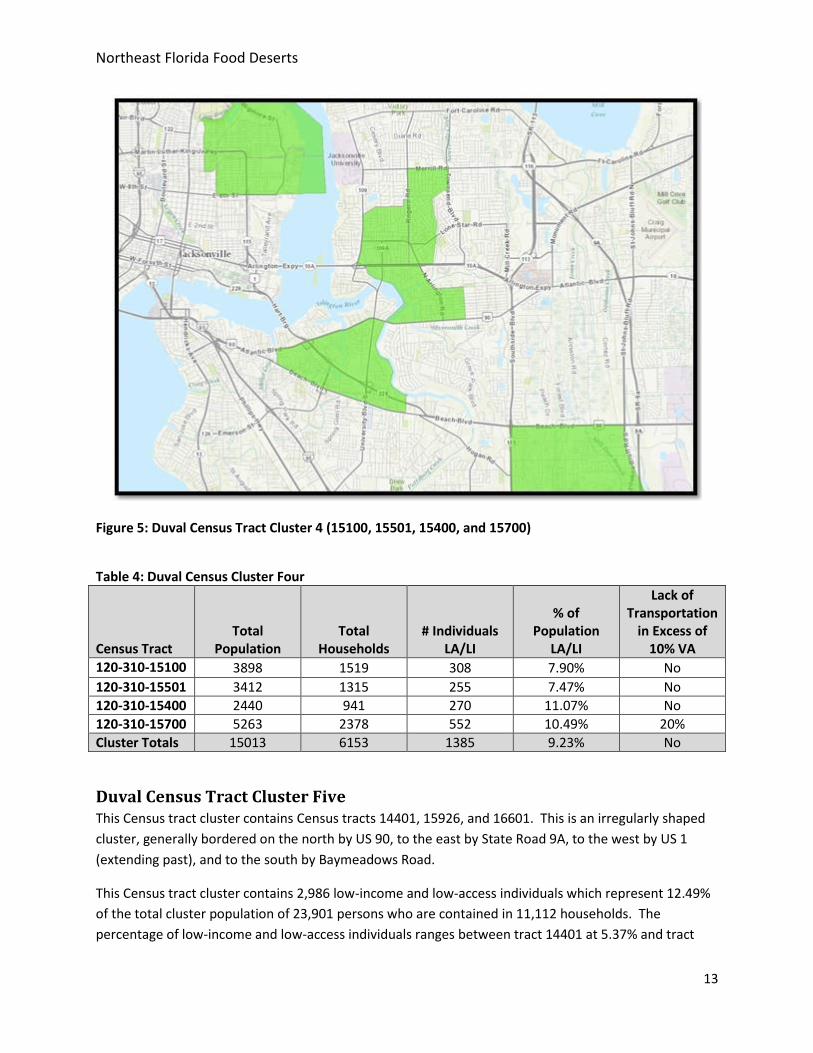
Duval Census Tract Cluster Five This Census tract cluster contains Census tracts 14401, 15926, and 16601. This is an irregularly shaped
cluster, generally bordered on the north by US 90, to the east by State Road 9A, to the west by US 1
(extending past), and to the south by Baymeadows Road.
This Census tract cluster contains 2,986 low-income and low-access individuals which represent 12.49%
of the total cluster population of 23,901 persons who are contained in 11,112 households. The
percentage of low-income and low-access individuals ranges between tract 14401 at 5.37% and tract
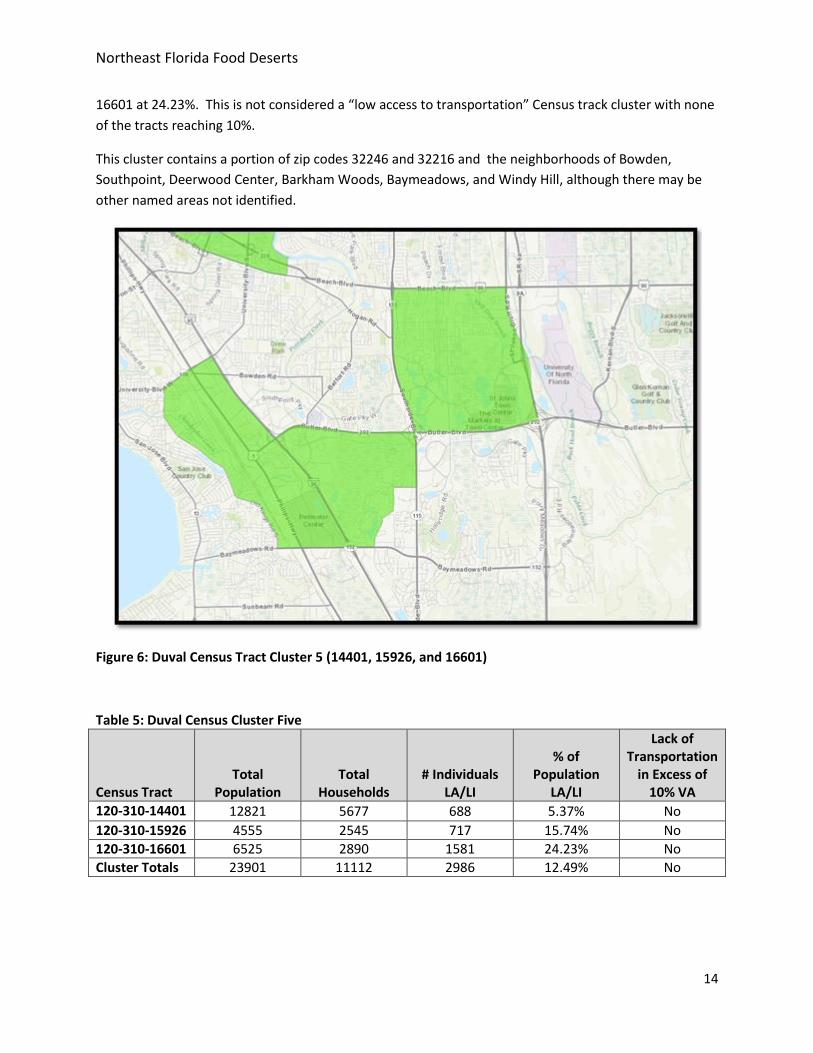
Northeast Florida Food Deserts
14
16601 at 24.23%. This is not considered a “low access to transportation” Census track cluster with none
of the tracts reaching 10%.
This cluster contains a portion of zip codes 32246 and 32216 and the neighborhoods of Bowden,
Southpoint, Deerwood Center, Barkham Woods, Baymeadows, and Windy Hill, although there may be
other named areas not identified.
Figure 6: Duval Census Tract Cluster 5 (14401, 15926, and 16601)
Table 5: Duval Census Cluster Five
Census Tract Total
Population Total
Households # Individuals
LA/LI
% of Population
LA/LI
Lack of Transportation
in Excess of 10% VA
120-310-14401 12821 5677 688 5.37% No
120-310-15926 4555 2545 717 15.74% No
120-310-16601 6525 2890 1581 24.23% No
Cluster Totals 23901 11112 2986 12.49% No
Northeast Florida Food Deserts
15
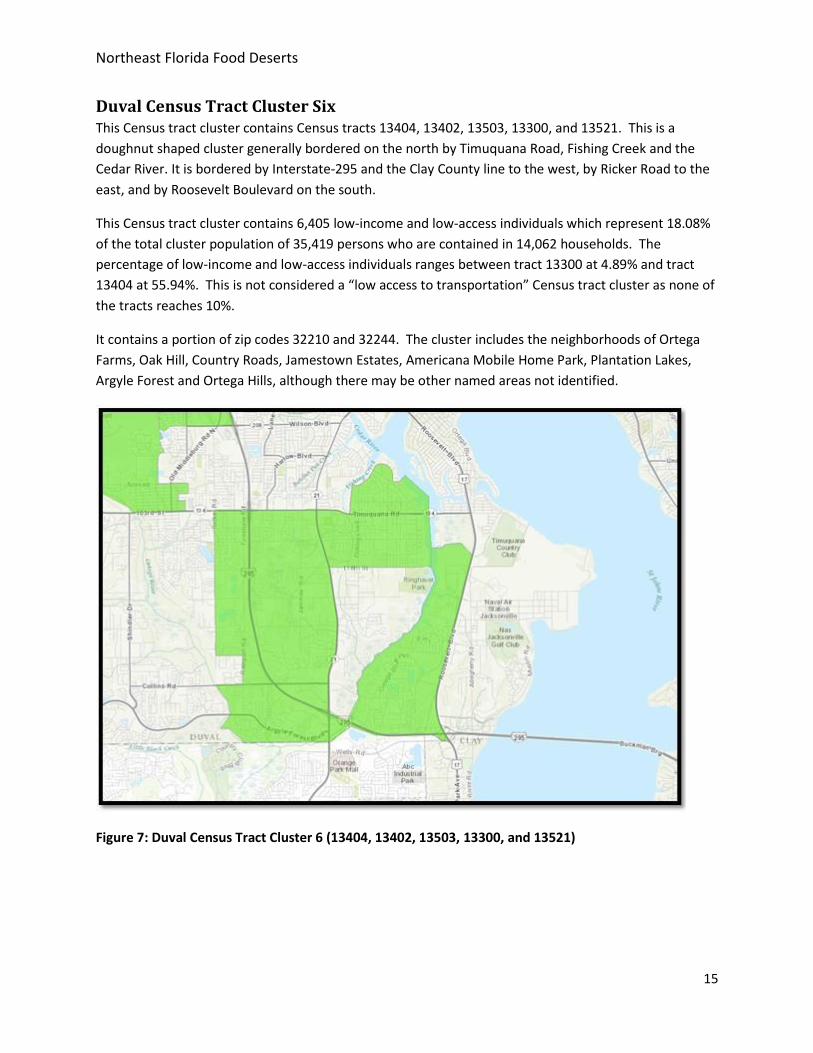
Duval Census Tract Cluster Six This Census tract cluster contains Census tracts 13404, 13402, 13503, 13300, and 13521. This is a
doughnut shaped cluster generally bordered on the north by Timuquana Road, Fishing Creek and the
Cedar River. It is bordered by Interstate-295 and the Clay County line to the west, by Ricker Road to the
east, and by Roosevelt Boulevard on the south.
This Census tract cluster contains 6,405 low-income and low-access individuals which represent 18.08%
of the total cluster population of 35,419 persons who are contained in 14,062 households. The
percentage of low-income and low-access individuals ranges between tract 13300 at 4.89% and tract
13404 at 55.94%. This is not considered a “low access to transportation” Census tract cluster as none of
the tracts reaches 10%.
It contains a portion of zip codes 32210 and 32244. The cluster includes the neighborhoods of Ortega
Farms, Oak Hill, Country Roads, Jamestown Estates, Americana Mobile Home Park, Plantation Lakes,
Argyle Forest and Ortega Hills, although there may be other named areas not identified.
Figure 7: Duval Census Tract Cluster 6 (13404, 13402, 13503, 13300, and 13521)
Northeast Florida Food Deserts
16
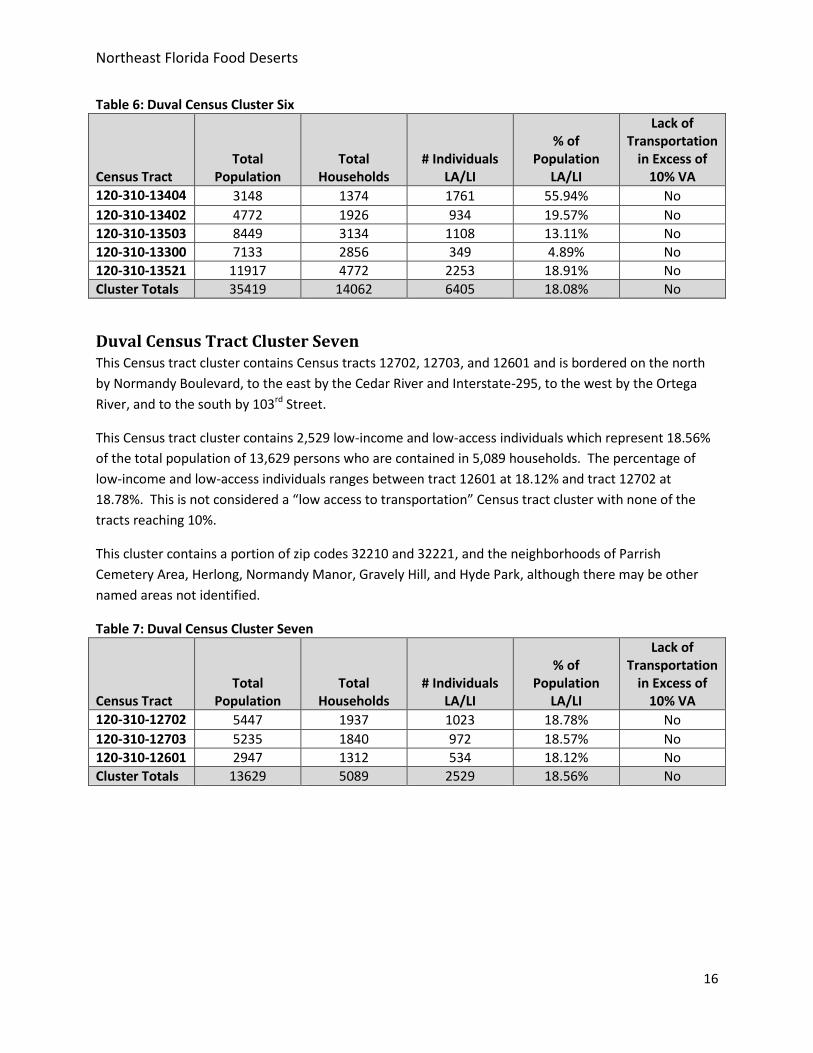
Table 6: Duval Census Cluster Six
Census Tract Total
Population Total
Households # Individuals
LA/LI
% of Population
LA/LI
Lack of Transportation
in Excess of 10% VA
120-310-13404 3148 1374 1761 55.94% No
120-310-13402 4772 1926 934 19.57% No
120-310-13503 8449 3134 1108 13.11% No
120-310-13300 7133 2856 349 4.89% No
120-310-13521 11917 4772 2253 18.91% No
Cluster Totals 35419 14062 6405 18.08% No
Duval Census Tract Cluster Seven This Census tract cluster contains Census tracts 12702, 12703, and 12601 and is bordered on the north
by Normandy Boulevard, to the east by the Cedar River and Interstate-295, to the west by the Ortega
River, and to the south by 103rd Street.
This Census tract cluster contains 2,529 low-income and low-access individuals which represent 18.56%
of the total population of 13,629 persons who are contained in 5,089 households. The percentage of
low-income and low-access individuals ranges between tract 12601 at 18.12% and tract 12702 at
18.78%. This is not considered a “low access to transportation” Census tract cluster with none of the
tracts reaching 10%.
This cluster contains a portion of zip codes 32210 and 32221, and the neighborhoods of Parrish
Cemetery Area, Herlong, Normandy Manor, Gravely Hill, and Hyde Park, although there may be other
named areas not identified.
Table 7: Duval Census Cluster Seven
Census Tract Total
Population Total
Households # Individuals
LA/LI
% of Population
LA/LI
Lack of Transportation
in Excess of 10% VA
120-310-12702 5447 1937 1023 18.78% No
120-310-12703 5235 1840 972 18.57% No
120-310-12601 2947 1312 534 18.12% No
Cluster Totals 13629 5089 2529 18.56% No

Northeast Florida Food Deserts
17
Figure 8: Duval Census Tract Cluster 7 (12702, 12703, and 12601)
Northeast Florida Food Deserts
18
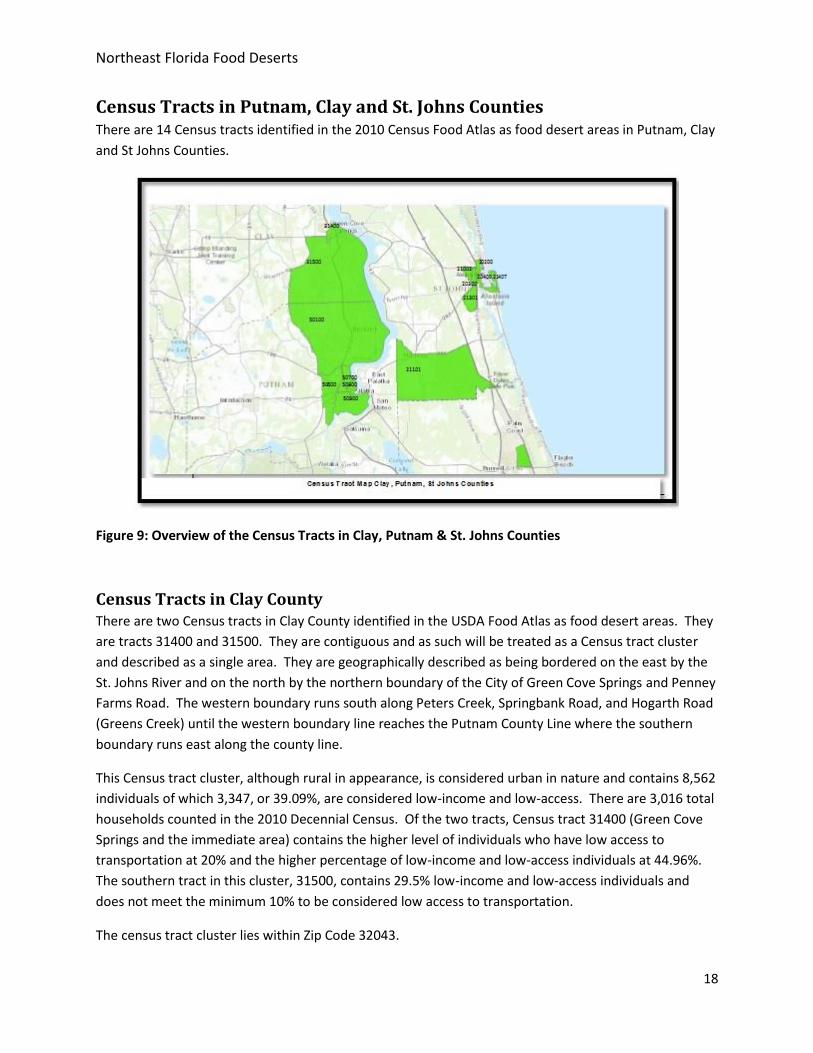
Census Tracts in Putnam, Clay and St. Johns Counties There are 14 Census tracts identified in the 2010 Census Food Atlas as food desert areas in Putnam, Clay
and St Johns Counties.
Figure 9: Overview of the Census Tracts in Clay, Putnam & St. Johns Counties
Census Tracts in Clay County There are two Census tracts in Clay County identified in the USDA Food Atlas as food desert areas. They
are tracts 31400 and 31500. They are contiguous and as such will be treated as a Census tract cluster
and described as a single area. They are geographically described as being bordered on the east by the
St. Johns River and on the north by the northern boundary of the City of Green Cove Springs and Penney
Farms Road. The western boundary runs south along Peters Creek, Springbank Road, and Hogarth Road
(Greens Creek) until the western boundary line reaches the Putnam County Line where the southern
boundary runs east along the county line.
This Census tract cluster, although rural in appearance, is considered urban in nature and contains 8,562
individuals of which 3,347, or 39.09%, are considered low-income and low-access. There are 3,016 total
households counted in the 2010 Decennial Census. Of the two tracts, Census tract 31400 (Green Cove
Springs and the immediate area) contains the higher level of individuals who have low access to
transportation at 20% and the higher percentage of low-income and low-access individuals at 44.96%.
The southern tract in this cluster, 31500, contains 29.5% low-income and low-access individuals and
does not meet the minimum 10% to be considered low access to transportation.
The census tract cluster lies within Zip Code 32043.
Northeast Florida Food Deserts
19
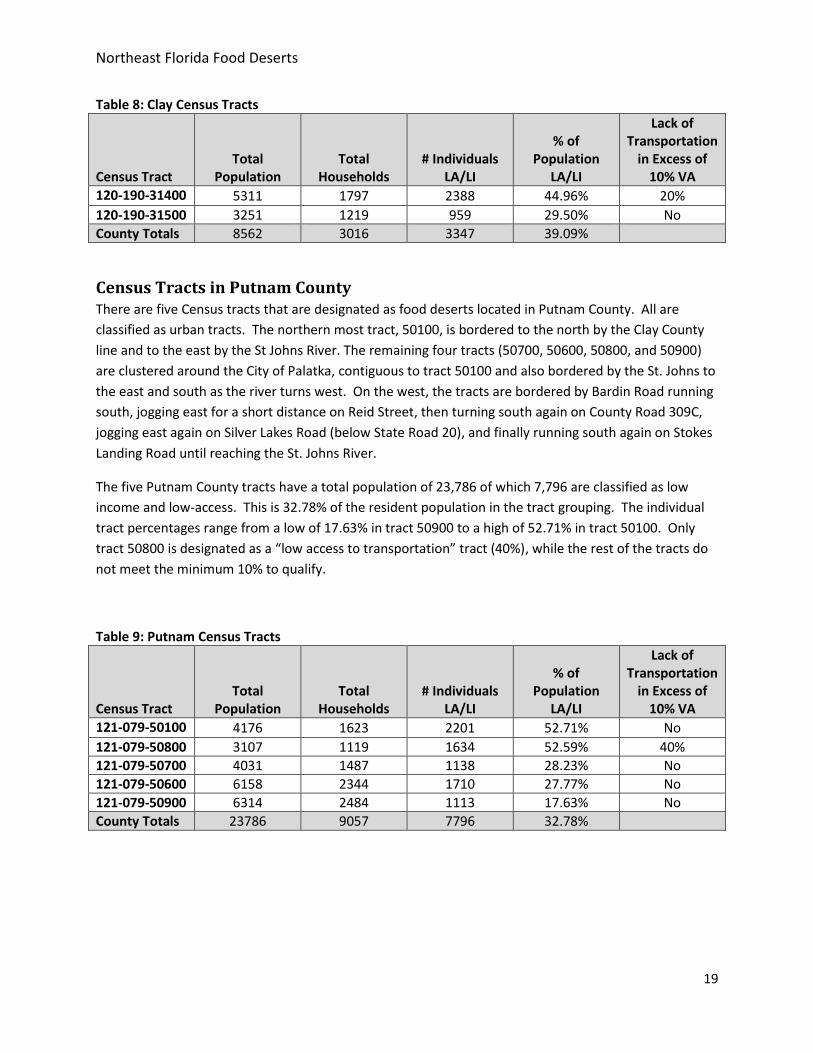
Table 8: Clay Census Tracts
Census Tract Total
Population Total
Households # Individuals
LA/LI
% of Population
LA/LI
Lack of Transportation
in Excess of 10% VA
120-190-31400 5311 1797 2388 44.96% 20%
120-190-31500 3251 1219 959 29.50% No
County Totals 8562 3016 3347 39.09%
Census Tracts in Putnam County There are five Census tracts that are designated as food deserts located in Putnam County. All are
classified as urban tracts. The northern most tract, 50100, is bordered to the north by the Clay County
line and to the east by the St Johns River. The remaining four tracts (50700, 50600, 50800, and 50900)
are clustered around the City of Palatka, contiguous to tract 50100 and also bordered by the St. Johns to
the east and south as the river turns west. On the west, the tracts are bordered by Bardin Road running
south, jogging east for a short distance on Reid Street, then turning south again on County Road 309C,
jogging east again on Silver Lakes Road (below State Road 20), and finally running south again on Stokes
Landing Road until reaching the St. Johns River.
The five Putnam County tracts have a total population of 23,786 of which 7,796 are classified as low
income and low-access. This is 32.78% of the resident population in the tract grouping. The individual
tract percentages range from a low of 17.63% in tract 50900 to a high of 52.71% in tract 50100. Only
tract 50800 is designated as a “low access to transportation” tract (40%), while the rest of the tracts do
not meet the minimum 10% to qualify.
Table 9: Putnam Census Tracts
Census Tract Total
Population Total
Households # Individuals
LA/LI
% of Population
LA/LI
Lack of Transportation
in Excess of 10% VA
121-079-50100 4176 1623 2201 52.71% No
121-079-50800 3107 1119 1634 52.59% 40%
121-079-50700 4031 1487 1138 28.23% No
121-079-50600 6158 2344 1710 27.77% No
121-079-50900 6314 2484 1113 17.63% No
County Totals 23786 9057 7796 32.78%

Northeast Florida Food Deserts
20
Census Tracts in St. Johns County There are seven Census tracts that lie within St. Johns County which have been identified by the USDA
Food Atlas (2010) as being food desert areas. One tract, 21101, lies to the south of the county. It is
geographically described as being bordered on the north by State Road 207 and State Road 206, to the
west by the Putnam County line, to the east by Interstate-95, and to the south by the Flagler County
line. This tract includes the town of Hastings. It is considered as an urban tract by the Census.
The other six Census tracts in St. Johns County are located in the vicinity of St. Augustine and form an
irregularly shaped cluster around the city. This grouping of Census tracts will be treated as a Census
tract cluster and will be described as a single area. This cluster of Census tracts is geographically
described as having a north boundary which runs along State Road 16 then jogs north along US 1 and
east again along Robertson Creek to the St Augustine Inlet. The west boundary is described as
Woodlawn Road (south of 16) with Four Mile Road south to North Volusia St., where it jogs east along
West 6th Street then turns south along the Florida East Coast Railroad track until intersecting State Road
207, and finally running along Moultrie Creek. The southern boundary continues along Moultrie Creek
until it intersects with US 1. The eastern boundary runs from the intersection of Moultrie Creek and US
1, north along US 1. It jogs east along CR 312 to the Atlantic coast including the Anastasia State
Recreational Area then jogs south of (and excluding) Vilano Beach then north again along the west shore
of the St Augustine Inlet.
The combined Census tracts in St. Johns County are home to 5,931 individuals who are low-income and
low-access and represent 22.73% of the 26,089 total individuals residing the tracts in 10,495
households. The two tracts with the highest concentration of low-income and low-access individuals are
tract 21407 (39.97%) and tract 21101 (38.47%). The tracts with the lowest percentages of low-income
and low-access individuals are tract 20200 (7.86%) and tract 24200 (10.62%). Tracts 21002, 20300, and
24200 have the highest rates of low access to transportation at 20% while the remaining tracts do not
meet the 10% minimum cutoff.
Tract 21101 lies in zip code 32145 and the other tracts lie in a majority of zip code 32084 and the north
portion of zip code 32080. St Augustine is the largest town in this cluster.
Table 10: St. Johns Census Tracts
Census Tract Total
Population Total
Households # Individuals
LA/LI
% of Population
LA/LI
Lack of Transportation
in Excess of 10% VA
121-090-21407 1351 643 540 39.97% No
121-090-21101 5462 1923 2101 38.47% No
121-090-21002 4155 1706 973 23.42% 20%
121-090-21301 6060 2426 1166 19.24% No
121-090-20300 3518 1505 630 17.91% 20%
121-090-20400 3088 1060 328 10.62% 20%
121-090-20200 2455 1232 193 7.86% No
County Totals 26089 10495 5931 22.73%
Northeast Florida Food Deserts
21
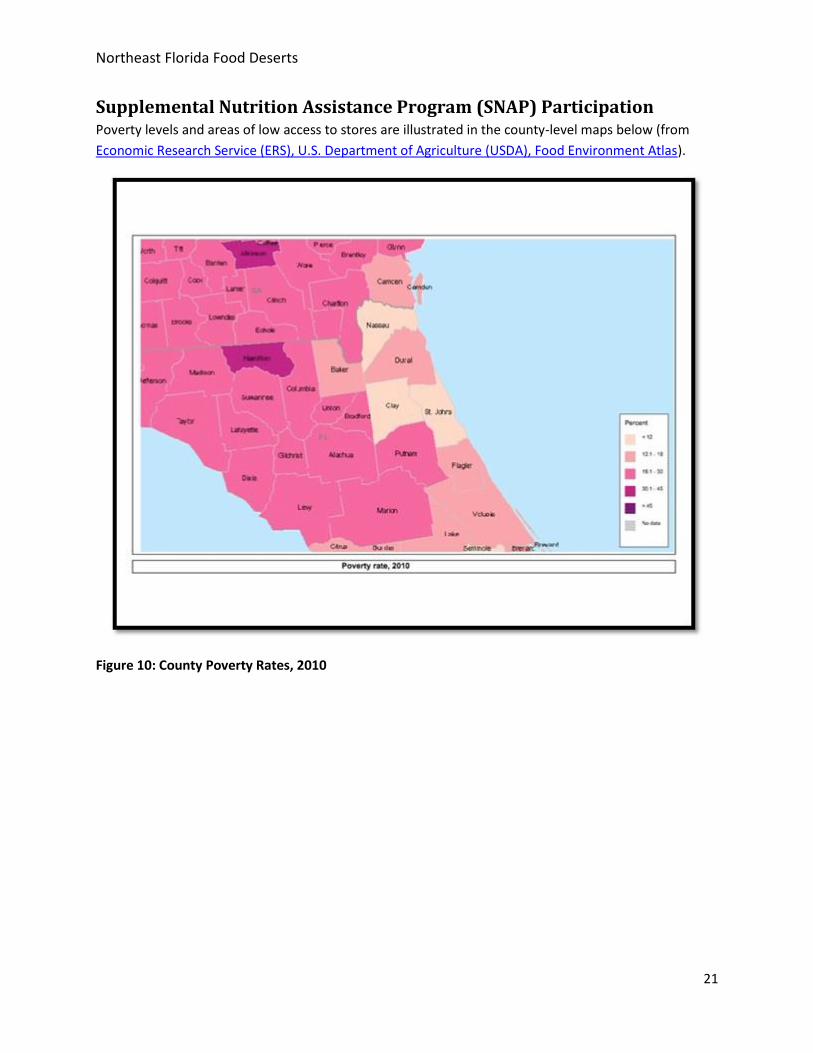
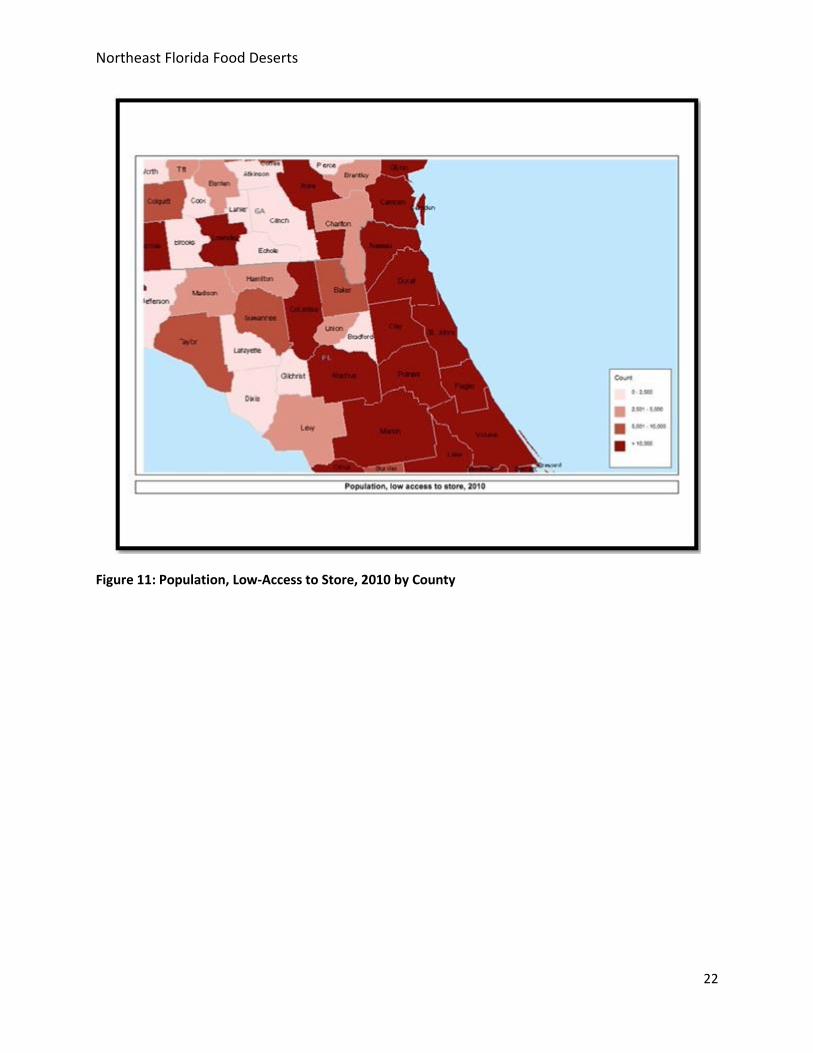
Supplemental Nutrition Assistance Program (SNAP) Participation Poverty levels and areas of low access to stores are illustrated in the county-level maps below (from
Economic Research Service (ERS), U.S. Department of Agriculture (USDA), Food Environment Atlas).
Figure 10: County Poverty Rates, 2010
Northeast Florida Food Deserts
22
Figure 11: Population, Low-Access to Store, 2010 by County
Northeast Florida Food Deserts
23
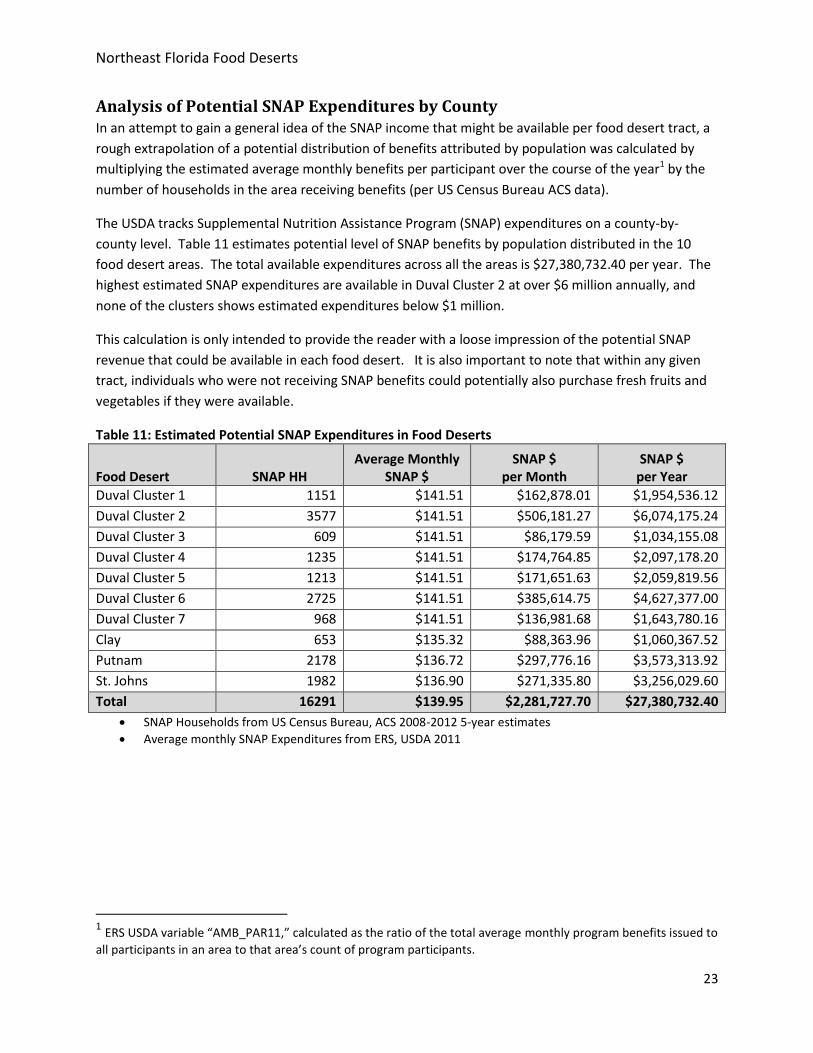
Analysis of Potential SNAP Expenditures by County In an attempt to gain a general idea of the SNAP income that might be available per food desert tract, a
rough extrapolation of a potential distribution of benefits attributed by population was calculated by
multiplying the estimated average monthly benefits per participant over the course of the year1 by the
number of households in the area receiving benefits (per US Census Bureau ACS data).
The USDA tracks Supplemental Nutrition Assistance Program (SNAP) expenditures on a county-by-
county level. Table 11 estimates potential level of SNAP benefits by population distributed in the 10
food desert areas. The total available expenditures across all the areas is $27,380,732.40 per year. The
highest estimated SNAP expenditures are available in Duval Cluster 2 at over $6 million annually, and
none of the clusters shows estimated expenditures below $1 million.
This calculation is only intended to provide the reader with a loose impression of the potential SNAP
revenue that could be available in each food desert. It is also important to note that within any given
tract, individuals who were not receiving SNAP benefits could potentially also purchase fresh fruits and
vegetables if they were available.
Table 11: Estimated Potential SNAP Expenditures in Food Deserts
Food Desert SNAP HH Average Monthly
SNAP $ SNAP $
per Month SNAP $
per Year
Duval Cluster 1 1151 $141.51 $162,878.01 $1,954,536.12
Duval Cluster 2 3577 $141.51 $506,181.27 $6,074,175.24
Duval Cluster 3 609 $141.51 $86,179.59 $1,034,155.08
Duval Cluster 4 1235 $141.51 $174,764.85 $2,097,178.20
Duval Cluster 5 1213 $141.51 $171,651.63 $2,059,819.56
Duval Cluster 6 2725 $141.51 $385,614.75 $4,627,377.00
Duval Cluster 7 968 $141.51 $136,981.68 $1,643,780.16
Clay 653 $135.32 $88,363.96 $1,060,367.52
Putnam 2178 $136.72 $297,776.16 $3,573,313.92
St. Johns 1982 $136.90 $271,335.80 $3,256,029.60
Total 16291 $139.95 $2,281,727.70 $27,380,732.40
SNAP Households from US Census Bureau, ACS 2008-2012 5-year estimates
Average monthly SNAP Expenditures from ERS, USDA 2011
1 ERS USDA variable “AMB_PAR11,” calculated as the ratio of the total average monthly program benefits issued to
all participants in an area to that area’s count of program participants.
Consumption Averages of Fruits and Vegetables Based on Study Figures
in 2006 In a 2006 study commissioned by the U.S. Department of Agriculture, the Thrifty Food Plan was
examined to determine both the prevailing cost of certain food items and levels of consumption by
individuals receiving food stamps (SNAP) benefits. The Thrifty Food Plan (TFP) is described in the study
as a fundamental part of the U.S. food guidance system and the basis for maximum food stamp
allotments. The TFP provides a representative healthful and minimal cost meal plan that shows how a
nutritious diet may be achieved with limited resources. The Plan assumes that all purchased food is
consumed at home.
The TFP is one of four official USDA food plans (the others being the Low-Cost Plan, the Moderate-Cost
Plan, and the Liberal Plan) maintained by the Department. The TFP “market baskets” specify the types
and quantities of foods that people could purchase to be consumed at home to obtain a nutritious diet
at a minimal cost (Carlson et al. 2007).
For the purposes of this analysis, we have examined the purchase habits statistics in the report that list
the amount, by pounds per week, of fresh fruits and vegetables that were purchased by the studied
sample within the trial weeks. We combined the data by gender and age and developed averages of
purchases, which we then divided by the number of individuals in each of the food desert areas and
clusters of areas. The method of determining purchase quantities constitutes a medium reliability of
information as it does not take into consideration either the specific buying habits of individuals that
actually live in the food desert areas (who may have limited access to food at the cost levels displayed in
the study) or the buying habits of non-SNAP supported individuals who may also reside in the areas
under study in this analysis.
However, for the purpose of targeting potential market levels, this analysis appears to be slightly more
exact than the estimates of market revenue streams in the SNAP benefits estimates in Table 11. These
estimates of purchase quantities should be helpful as a strategic planning tool when determining a
distribution/sales plan when considered with other demographic information. It is important to keep in
mind that the figures in the Table 12 below are reflective of the market in 2006. As such, when
considered in light of current population increases and the radical increase of the pool of people who
are now receiving SNAP benefits, these data should provide some helpful information.

Northeast Florida Food Deserts
25
Table 12: Thrifty Food Plan Market Baskets, Quantities of Food Purchased for a Week (in pounds), by
Age-Gender Group, 2006
Female Male Average pounds
purchased per
person 12-13 years
14-18 years
19-50 years
51- 70
years 71+
years 12-13 years
14-18 years
19-50 years
51- 70
years 71+
years
Vegetables 6.18 7.2 7.4 8.44 11 8.25 8.55 9.27 9.62 7.96 8.387
Fruit 5.53 5.49 5.62 8.4 4.29 5.99 7.51 8.41 8.14 5.47 6.485
Total pounds per week
11.71 12.69 13.02 16.84 15.29 14.24 16.06 17.68 17.76 13.43 14.872
Table 12 shows an average weekly purchase of 14.87 pounds of fresh fruits and vegetables per week.
The next analysis, presented in Table 13, uses this average purchase to determine a potential level of
purchase within each food desert cluster.
When the combined fresh vegetable and fruit weekly purchase data (14.87 pounds) is multiplied by the
number of persons living in each food desert cluster or food desert tract and then extrapolated over 52
weeks, the total amount of targeted food purchases equals 79,144 tons of food purchased per year
(2006 purchase-level with 2010 food desert populations).
This quantity is best compared to the potential production of fruits and table vegetables in the rural
areas in Clay, Putnam, and St. Johns Counties being targeted for analysis.

Northeast Florida Food Deserts
26
Table 13: Estimated Potential Fruit & Vegetable Purchases by Food Desert Clusters and County
Total Population
Individuals LA/LI
Average Pounds
Purchased per Person per Week
Total Average Pounds
Purchased per Cluster per Week
Total Average Pounds
Purchased per Cluster
per Year (in Tons)
Duval Cluster 1 15,210 2,692 14.82 225,412 5,860
Duval Cluster 2 31,995 7,478 14.82 474,166 12,328
Duval Cluster 3 4,901 1,886 14.82 72,633 1,888
Duval Cluster 4 15,013 1,385 14.82 222,493 5,785
Duval Cluster 5 23,901 2,986 14.82 354,213 9,210
Duval Cluster 6 35,419 6,405 14.82 524,910 13,647
Duval Cluster 7 13,629 2,529 14.82 201,982 5,252
Duval All Clusters 140,068 25,361 14.82 2,075,808 53,971
Clay All Clusters 8,562 3,347 14.82 126,889 3,299
Putnam All Clusters 23,786 7,796 14.82 352,509 9,165
St. Johns All Clusters 26,089 5,931 14.82 386,639 10,053
Total 2,941,845 76,488

Northeast Florida Food Deserts
27
Strategic Partnerships within the Food Deserts
Churches To determine the number of churches in Northeast Florida food desert areas, we examined data from
two sources. The first was “ChurchPick.Com,” which maintains a comprehensive directory that allows
for zip code based searching. The second was “USA Church,” a data base of community churches that
allows for zip code sorting and further sorting by church size. Both sites had a considerable number of
churches, which list zip codes associated with food deserts as their primary address zip. The number of
churches per zip code is presented in Table 14.
Table 14: Number of Churches per Food Desert Zip Code
County Area Name Zip Code # Of Churches Per Zip
Code
Duval Jacksonville 32218 37
Duval Jacksonville 32208 47
Duval Jacksonville 32209 89
Duval Jacksonville 32254 37
Duval Jacksonville 32220 12
Duval Jacksonville 32206 45
Duval Jacksonville 32211 39
Duval Jacksonville 32216 30
Duval Jacksonville 32207 50
Duval Jacksonville 32246 14
Duval Jacksonville 32210 43
Clay Green Cove Springs 32043 6
Clay Penney Farms 32079 1
Clay Middleburg 32050 1
Clay Middleburg 32068 1
Putman Palatka 32177 57
St. Johns St. Augustine 32084 43
St. Johns Hastings 32145 6
Schools Public schools can be an important resource to any effort to move fresh foods into food desert areas.
In 2010, 47 percent of all participants receiving supplemental nutrition assistance (SNAP) were under 18
years of age and at least half of all SNAP households had at least one child. Households with children
received 71 percent of all benefits in the SNAP program, with about 56 percent of those households
being single parent households (Building a Healthy America: A Profile of the Supplemental Nutrition
Assistance Program 2012).

Northeast Florida Food Deserts
28
Table 15 below shows the distribution of schools by level in each county and the number of schools that
qualify as Title I schools. The Title I program provides financial assistance to local educational agencies
(LEAs) and schools with high numbers or high percentages of children from low-income families to help
ensure that all children meet challenging state academic standards (US Department of Education). The
number of students enrolled in the free and reduced lunch program determines low-income students.
For an entire school to qualify for Title I funds, at least 40 percent of students must enroll in the free and
reduced lunch program.
The Title I School designation can be used as an indicator of the percentage of households who are low
income and may suffer from food insecurity.
Table 15: Number Schools per Level by County
County Elementary
Schools Middle Schools High Schools Number of Title I
Schools
Duval 104 26 26 77
Clay 27 7 9 23
Putnam 12 7 4 14
St. Johns 18 7 7 13 *Data from Duval County School Board; Clay County Schools; Putnam County School District; St. Johns County School District
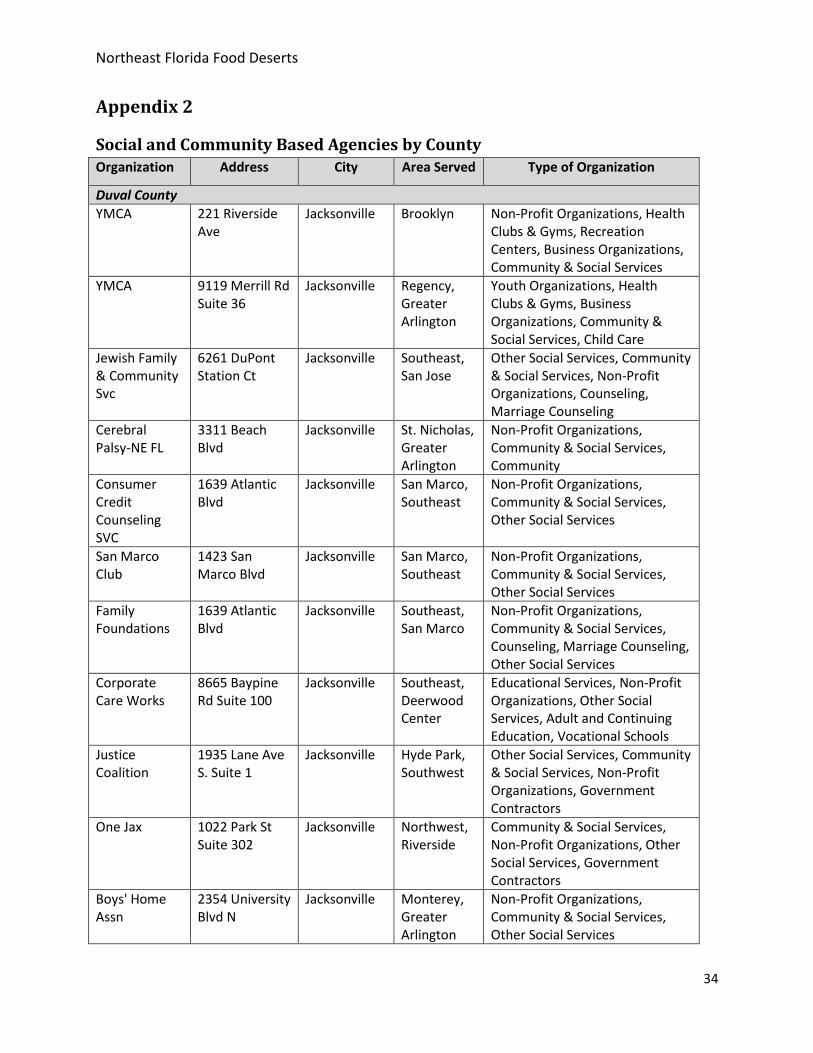
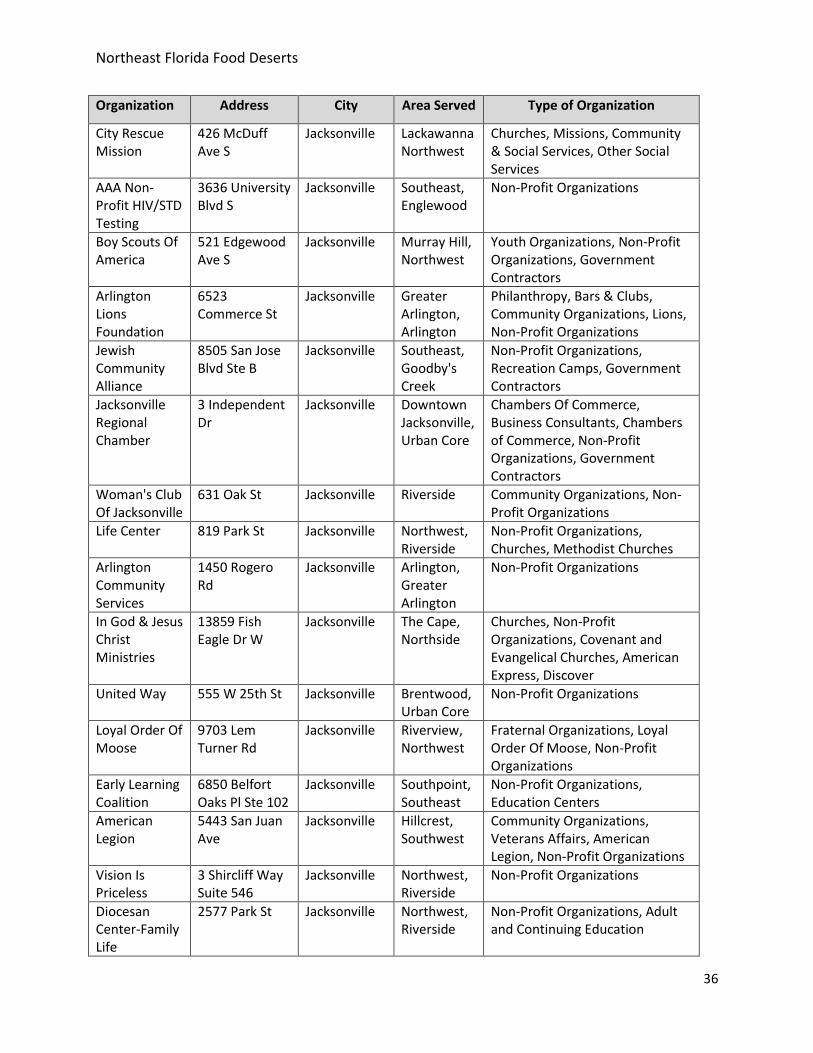
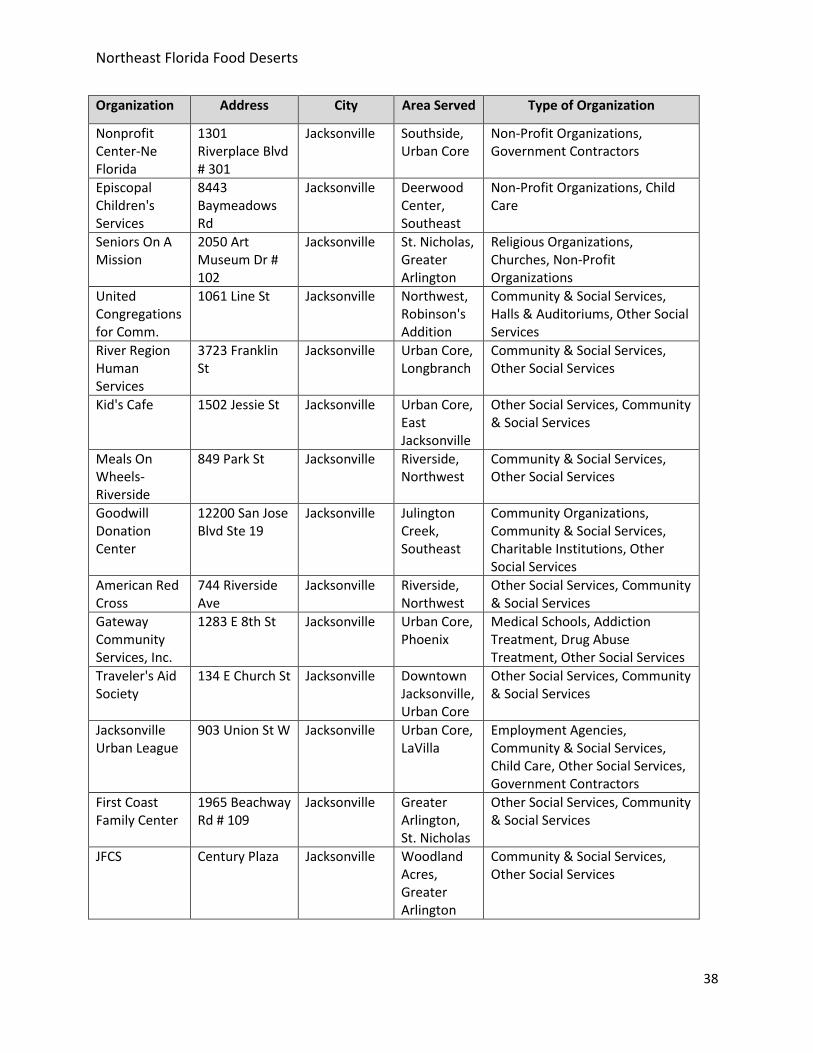
Social and Community Services Another important source of support for the distribution of fresh foods is through social and community
service agencies. In most cases, community services are located and well positioned to serve both their
target populations and the areas where they reside. We reviewed the information available on the
Internet and extracted the names, addresses, and service areas/target populations/core services
information for social and community services in the counties under study and have presented this
information in Appendix 2 of this report.
Table 16 below provides an overall count by county of available service delivery agencies. It is not
presented as an exhaustive list, but rather to provide the reader with a general idea of the approximate
volume of agencies, which could become partners in the marketing and distribution of fresh food.
Table 16: Number of Community-Based Social Service Agencies by County
County Number of Community-Based Agencies
Duval 74
Clay 16
Putnam 19
St. Johns 30
Northeast Florida Food Deserts
29
Summary Many alternative marketing models have been researched (Goodman 2004; Hinrichs 2000), and those
which seem to have the biggest impact display methods which result in a higher economic value to the
prime producer through direct marketing vehicles. Many of the “best value” models involve a high level
of support from the scientific/technical community, sales directly to the end consumer, alternative
marketing approaches, and the development of niche markets. Additionally, growers who process what
they grow into added-value products appear to increase their revenue opportunities but also incur
higher risk at the onset.
The challenge ahead appears to be the development of evidence-based best practices that can connect
the existing resources within the community of practice to the markets with the greatest demand.
This research examined the potential fresh food markets within the areas designated as food deserts,
which lie within a relatively close proximity to the agricultural producers in the rural surrounding areas.
Through several perspectives, we find an emerging market, which in its core designation lacks access to
the products being produced locally. Additionally, a focus on food deserts as markets appears to have
the potential to impact a population of consumers who experience a high level of food insecurity. As
such, not only can these new markets solve a problem for growers, they can also help people with the
greatest needs.
Several next steps should be considered:
A full examination of the supply side of fresh food production should be undertaken to
determine to what extent market needs can be met;
A review of the existing agriculturally-related business structure in Clay, Putnam, and St. Johns
Counties to identify business capacity;
Rural producers in Flagler should be included in both the market and supply analyses.
Stakeholder input should be collected through intercept surveys and analyzed to fully
understand the buying habits of consumers;
The development of cooperatives and other forms of agricultural business should be
encouraged and supported;
Marketing and business plans should be developed to approach the consumer need from an
informed direction;
Case studies of mobility models such as food buses should be generated and used to develop
evidence-based operations;
Business capacity and development training should be made available to businesses that want
to explore new markets.
Today’s business climate presents a question of how a catalytic shift can be undertaken in the current
regional agricultural system to redefine business structure, encourage new enterprise start-ups, provide
technical and business support, and identify new markets and revenue streams which will create an
improved business climate for the farm industry.

Northeast Florida Food Deserts
30
APPENDICES

Northeast Florida Food Deserts
31
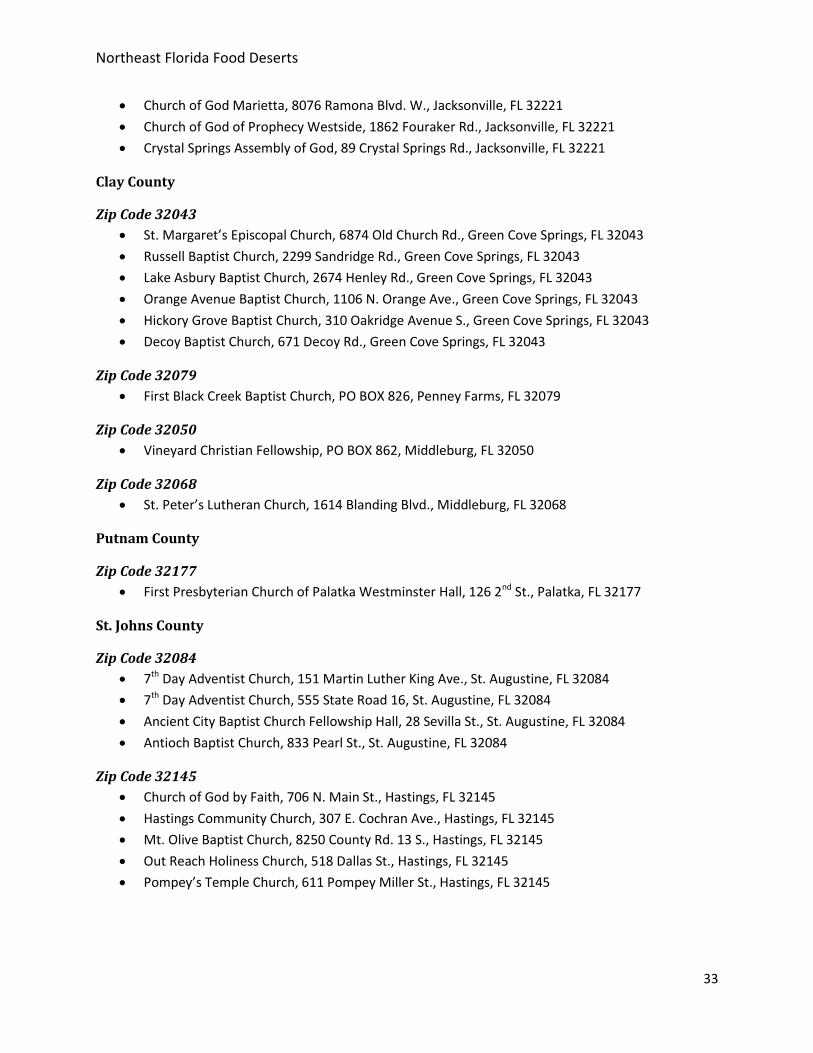
Appendix 1
List by Zip Code of the Five Largest Churches Serving Each Food Desert Area
Duval County
Zip Code 32218 (Cluster 1)
Amazing Grace Full Gospel, 5518 Dunn Ave., Jacksonville, FL 32218
Believers in Christ Christian Center, 11565 N. Main St., Jacksonville, FL 32218
Cavalry Baptist Church, 4040 Dunn Ave., Jacksonville, FL 32218
Cavalry Temple Baptist Church, 168 Duval Station Rd., Jacksonville, FL 32218
Cedar Bay Baptist Church, 11553 N. Main St., Jacksonville, FL 32218
Zip Code 32208 (Cluster 1)
All People Church of God in Christ, Inc., 1973 Edgewood Ave. W., Jacksonville, FL 32208
Beverly Hills Baptist Church, 9714 Ridge Blvd., Jacksonville, FL 32208
Beverly Hills Church of God, 9113 Ridge Blvd., Jacksonville, FL 32208
Church Fellowship, 9117 Lem Turner Rd., Jacksonville, FL 32208
East 44th Street Baptist Church, 281 E. 44th St., Jacksonville, FL 32208
Zip Code 32209 (Cluster 2)
7th Day Adventist Church, 2750 Edgewood Ave. W., Jacksonville, FL 32209
All People Church of God in Christ Westside, 2072 Commonwealth Ave., Jacksonville, FL 32209
Apostolic Church of God in Christ, 2030 Benedict Rd., Jacksonville, FL 32209
Asbury United Methodist Church of West Jacksonville, 1075 Almeda St., Jacksonville, FL 32209
Bowden United Methodist Church, 2025 Pullman Ave., Jacksonville, FL 32209
Zip Code 32254 (Cluster 2)
Bethesda Baptist Church, 422 Luray St., Jacksonville, FL 32254
Biltmore Baptist Church, 3525 Norman E. Thagard Blvd., Jacksonville, FL 32254
Church of God North Lane Avenue, 2956 Lane Ave. N., Jacksonville, FL 32254
Cornerstone Baptist Church, 3436 Lane Ave. N., Jacksonville, FL 32254
Zip Code 32220 (Cluster 2)
Bethel Temple Assembly of God, 8380 Devoe St., Jacksonville, FL 32220
Blessed Faith Missionary Baptist Church, 7941 Nevada St., Jacksonville, FL 32220
Christian Life Church, 400 Cahoon Rd. S., Jacksonville, FL 32220
Jones Road Baptist Church, 2506 Jones Rd., Jacksonville, FL 32220
Marietta Church of Christ, 8150 Driggers St., Jacksonville, FL 32220
Zip Code 32206 (Cluster 3)
Agape New Life Christian Church, 2030 Phoenix Ave., Jacksonville, FL 32206
All People Church of God in Christ East Side Ministries, 1177 E. 14th St., Jacksonville, FL 32206

Northeast Florida Food Deserts
32
Antioch Baptist Church, 513 Odessa St., Jacksonville, FL 32206
Central Christian Baptist Church, 121 E. 8th St., Jacksonville, FL 32206
Zip Code 32211 (Cluster 4)
Abundant Life Church of God in Christ, 855 Townsend Blvd., Jacksonville, FL 32211
Arlington Christian Church, 8075 Lone Star Rd., Jacksonville, FL 32211
Arlington Presbyterian Church, 1300 Sprinkle Dr., Jacksonville, FL 32211
Arlington United Methodist Church, 1400 University Blvd. N., Jacksonville, FL 32211
Changed by Grace Community Church, 49 N. Bowlan St., Jacksonville, FL 32211
Zip Code 32216 (Cluster 4)
7th Day Adventist Church, 3208 Herring Rd., Jacksonville, FL 32216
Apostolic School of Perfection, 7301 Beach Blvd., Jacksonville, FL 32216
Belford Road Baptist Church, 2950 Belfort Rd., Jacksonville, FL 32216
Cavalry Baptist Church, 3266 Southside Blvd., Jacksonville, FL 32216
Christ Community Church Education, 6004 Terry Rd., Jacksonville, FL 32216
Zip Code 32207 (Cluster 4)
All Saints Episcopal Church, 4171 Hendricks Ave., Jacksonville, FL 32207
Assumption Catholic Church, 2403 Atlantic Blvd., Jacksonville, FL 32207
Zip Code 32246 (Cluster 5)
Christ Church, 2226 St. Johns Bluff Rd. S., Jacksonville, FL 32246
Cornerstone Assembly of God, 9767 Ivey Rd., Jacksonville, FL 32246
Cross Road Church, 10005 Gate Parkway N., Jacksonville, FL 32246
Harmony Community Church, 2135 Forest Blvd., Jacksonville, FL 32246
Liberty Community Church, 11417 Saints Rd. #A , Jacksonville, FL 32246
Zip Code 32210 (Cluster 6)
103rd Street Church, 10356 103rd St., Jacksonville, FL 32210
Agape Baptist Church, 3880 Old Middleburg Rd., Jacksonville, FL 32210
Agape Christian Church, 4401 Georgetown Dr., Jacksonville, FL 32210
Bethel Missionary Baptist Church, 2538 Firestone Rd., Jacksonville, FL 32210
Zip Code 32244 (Cluster 6)
7th Day Adventist Church, 5545 Firestone Rd., Jacksonville, FL 32244
Acts 2 Church, 6200 Lake Gray Blvd., Jacksonville, FL 32244
Bibleway Church of God in Christ, 8033 Renault Dr., Jacksonville, FL 32244
Christ is the Way Community Church, 7441 Morse Ave., Jacksonville, FL 32244
Zip Code 32221 (Cluster 7)
7th Day Adventist Church, 7951 Lenox Ave., Jacksonville, FL 32221
Blair Road Baptist Church, 10343 Normandy Blvd., Jacksonville, FL 32211
Northeast Florida Food Deserts
33
Church of God Marietta, 8076 Ramona Blvd. W., Jacksonville, FL 32221
Church of God of Prophecy Westside, 1862 Fouraker Rd., Jacksonville, FL 32221
Crystal Springs Assembly of God, 89 Crystal Springs Rd., Jacksonville, FL 32221
Clay County
Zip Code 32043
St. Margaret’s Episcopal Church, 6874 Old Church Rd., Green Cove Springs, FL 32043
Russell Baptist Church, 2299 Sandridge Rd., Green Cove Springs, FL 32043
Lake Asbury Baptist Church, 2674 Henley Rd., Green Cove Springs, FL 32043
Orange Avenue Baptist Church, 1106 N. Orange Ave., Green Cove Springs, FL 32043
Hickory Grove Baptist Church, 310 Oakridge Avenue S., Green Cove Springs, FL 32043
Decoy Baptist Church, 671 Decoy Rd., Green Cove Springs, FL 32043
Zip Code 32079
First Black Creek Baptist Church, PO BOX 826, Penney Farms, FL 32079
Zip Code 32050
Vineyard Christian Fellowship, PO BOX 862, Middleburg, FL 32050
Zip Code 32068
St. Peter’s Lutheran Church, 1614 Blanding Blvd., Middleburg, FL 32068
Putnam County
Zip Code 32177
First Presbyterian Church of Palatka Westminster Hall, 126 2nd St., Palatka, FL 32177
St. Johns County
Zip Code 32084
7th Day Adventist Church, 151 Martin Luther King Ave., St. Augustine, FL 32084
7th Day Adventist Church, 555 State Road 16, St. Augustine, FL 32084
Ancient City Baptist Church Fellowship Hall, 28 Sevilla St., St. Augustine, FL 32084
Antioch Baptist Church, 833 Pearl St., St. Augustine, FL 32084
Zip Code 32145
Church of God by Faith, 706 N. Main St., Hastings, FL 32145
Hastings Community Church, 307 E. Cochran Ave., Hastings, FL 32145
Mt. Olive Baptist Church, 8250 County Rd. 13 S., Hastings, FL 32145
Out Reach Holiness Church, 518 Dallas St., Hastings, FL 32145
Pompey’s Temple Church, 611 Pompey Miller St., Hastings, FL 32145
Northeast Florida Food Deserts
34
Appendix 2
Social and Community Based Agencies by County Organization Address City Area Served Type of Organization
Duval County
YMCA 221 Riverside Ave
Jacksonville Brooklyn Non-Profit Organizations, Health Clubs & Gyms, Recreation Centers, Business Organizations, Community & Social Services
YMCA 9119 Merrill Rd Suite 36
Jacksonville Regency, Greater Arlington
Youth Organizations, Health Clubs & Gyms, Business Organizations, Community & Social Services, Child Care
Jewish Family & Community Svc
6261 DuPont Station Ct
Jacksonville Southeast, San Jose
Other Social Services, Community & Social Services, Non-Profit Organizations, Counseling, Marriage Counseling
Cerebral Palsy-NE FL
3311 Beach Blvd
Jacksonville St. Nicholas, Greater Arlington
Non-Profit Organizations, Community & Social Services, Community
Consumer Credit Counseling SVC
1639 Atlantic Blvd
Jacksonville San Marco, Southeast
Non-Profit Organizations, Community & Social Services, Other Social Services
San Marco Club
1423 San Marco Blvd
Jacksonville San Marco, Southeast
Non-Profit Organizations, Community & Social Services, Other Social Services
Family Foundations
1639 Atlantic Blvd
Jacksonville Southeast, San Marco
Non-Profit Organizations, Community & Social Services, Counseling, Marriage Counseling, Other Social Services
Corporate Care Works
8665 Baypine Rd Suite 100
Jacksonville Southeast, Deerwood Center
Educational Services, Non-Profit Organizations, Other Social Services, Adult and Continuing Education, Vocational Schools
Justice Coalition
1935 Lane Ave S. Suite 1
Jacksonville Hyde Park, Southwest
Other Social Services, Community & Social Services, Non-Profit Organizations, Government Contractors
One Jax 1022 Park St Suite 302
Jacksonville Northwest, Riverside
Community & Social Services, Non-Profit Organizations, Other Social Services, Government Contractors
Boys' Home Assn
2354 University Blvd N
Jacksonville Monterey, Greater Arlington
Non-Profit Organizations, Community & Social Services, Other Social Services

Northeast Florida Food Deserts
35
Organization Address City Area Served Type of Organization
BrightStar LifeCare
12187 Beach Blvd
Jacksonville Greater Arlington, Sandalwood
Alzheimer’s Information, Nurses, Home Health Care, Geriatrics, Senior Citizens' Services
Lutheran Social Svc Of Florida
1502 Jessie St Jacksonville East Jacksonville, Urban Core
Other Social Services, Community & Social Services
Lutheran Social Svc
4615 Phillips Hwy
Jacksonville Southeast, Englewood
Other Social Services, Community & Social Services, Adoption Agencies, Community Organizations, Government Contractors
Salvation Army
10940 Beach Blvd
Jacksonville Windy Hill, Southeast
Stocked exclusively with donated goods, thrift store contributes all earnings to Bible-based rehab programs throughout the world.
Northeast Florida Safety Council
1725 Art Museum Dr.
Jacksonville St. Nicholas, Greater Arlington
Educational Services, Addiction Treatment, Alcoholism Treatment, Non-Profit Organizations, Driving Instruction
Greenfield Center
3 Shircliff Way Suite 640
Jacksonville Northwest, Riverside
Drug Abuse Treatment, Addiction Treatment, Alcoholism Treatment
Allen Children Center
1804 St. Johns Bluff Rd S
Jacksonville Greater Arlington, Southside Estates
Child Care, Recreation Camps, Day Care Centers, K-12 Schools
ComForCare Senior Services
8825 Perimeter Park Blvd
Jacksonville Secret Cove, Southeast
Home Health Care, Nurses, Alzheimer’s Information, Senior Citizens' Services
Mandarin Christian Counseling
9770 Baymeadows Rd Suite 139
Jacksonville Southeast, Royal Lakes
Marriage Counseling, Family Counseling, Psychotherapists, Counseling
Women's Resource Center - Jax
12456 Sago Ave W
Jacksonville Northside, Duval
Abortion Alternatives, Health Clinics, Information & Referral Services, Pregnancy Information
Family Support Services
4057 Carmichael Ave
Jacksonville Greater Arlington, St. Nicholas
Adoption Agencies, Community & Social Services, Family Planning Information, Other Social Services, Foster Care
Salvation Army
15 E Church St Jacksonville Urban Core, Downtown Jacksonville
Other Social Services, Community & Social Services
My Support Jax
4690 Great Western Lane South
Jacksonville Southeast, Mandarin Station/ Losco
Community & Social Services, Other Social Services
Northeast Florida Food Deserts
36
Organization Address City Area Served Type of Organization
City Rescue Mission
426 McDuff Ave S
Jacksonville Lackawanna Northwest
Churches, Missions, Community & Social Services, Other Social Services
AAA Non-Profit HIV/STD Testing
3636 University Blvd S
Jacksonville Southeast, Englewood
Non-Profit Organizations
Boy Scouts Of America
521 Edgewood Ave S
Jacksonville Murray Hill, Northwest
Youth Organizations, Non-Profit Organizations, Government Contractors
Arlington Lions Foundation
6523 Commerce St
Jacksonville Greater Arlington, Arlington
Philanthropy, Bars & Clubs, Community Organizations, Lions, Non-Profit Organizations
Jewish Community Alliance
8505 San Jose Blvd Ste B
Jacksonville Southeast, Goodby's Creek
Non-Profit Organizations, Recreation Camps, Government Contractors
Jacksonville Regional Chamber
3 Independent Dr
Jacksonville Downtown Jacksonville, Urban Core
Chambers Of Commerce, Business Consultants, Chambers of Commerce, Non-Profit Organizations, Government Contractors
Woman's Club Of Jacksonville
631 Oak St Jacksonville Riverside Community Organizations, Non-Profit Organizations
Life Center 819 Park St Jacksonville Northwest, Riverside
Non-Profit Organizations, Churches, Methodist Churches
Arlington Community Services
1450 Rogero Rd
Jacksonville Arlington, Greater Arlington
Non-Profit Organizations
In God & Jesus Christ Ministries
13859 Fish Eagle Dr W
Jacksonville The Cape, Northside
Churches, Non-Profit Organizations, Covenant and Evangelical Churches, American Express, Discover
United Way 555 W 25th St Jacksonville Brentwood, Urban Core
Non-Profit Organizations
Loyal Order Of Moose
9703 Lem Turner Rd
Jacksonville Riverview, Northwest
Fraternal Organizations, Loyal Order Of Moose, Non-Profit Organizations
Early Learning Coalition
6850 Belfort Oaks Pl Ste 102
Jacksonville Southpoint, Southeast
Non-Profit Organizations, Education Centers
American Legion
5443 San Juan Ave
Jacksonville Hillcrest, Southwest
Community Organizations, Veterans Affairs, American Legion, Non-Profit Organizations
Vision Is Priceless
3 Shircliff Way Suite 546
Jacksonville Northwest, Riverside
Non-Profit Organizations
Diocesan Center-Family Life
2577 Park St Jacksonville Northwest, Riverside
Non-Profit Organizations, Adult and Continuing Education

Northeast Florida Food Deserts
37
Organization Address City Area Served Type of Organization
New Horizon Community Outreach
10960 Beach Blvd # 631
Jacksonville Southeast, Windy Hill
Non-Profit Organizations
Christ In Action Intl Corp
11627 Jerry Adams Ct
Jacksonville Garden City, Northside
Churches, Religious Organizations, Non-Profit Organizations
Sisters With Game Inc.
8549 Turkey Oaks Dr S
Jacksonville Greater Arlington, Arlington Hills
Non-Profit Organizations
Jacksonville Marine Charities
8203 Heckscher Dr
Jacksonville Pumpkin Hill, Northside
Non-Profit Organizations, Community Organizations, Charitable Institutions
Riverside Foundation
9090 Barrister Ct
Jacksonville Southeast, Craven
Philanthropy, Community Organizations, Non-Profit Organizations
Northwest Jacksonville CDC
1122 Golfair Blvd
Jacksonville Urban Core Non-Profit Organizations, Housing Authorities, Government Contractors
Jacksonville Downtown Dev
220 E Bay St Suite 1400
Jacksonville Downtown Jacksonville, Urban Core
City Legislators, City Offices, Non-Profit Organizations
Northeast Florida Community
4070 Boulevard Center Dr # 200
Jacksonville St. Nicholas, Greater Arlington
Community & Social Services, Non-Profit Organizations
Elk's Lodge 1855 West Rd Jacksonville Sans Souci, Southeast
Fraternal Organizations, Elks Lodge, Non-Profit Organizations
Baptist Mission To Forgotten
3787 Old Middleburg Rd N
Jacksonville Jacksonville Heights, Southwest
Churches, Baptist Churches, Religious Organizations, Community Organizations, Non-Profit Organizations
NCCD-Girls & Young Women
1022 Park St # 207
Jacksonville Riverside, Northwest
Non-Profit Organizations
Veteran Reintegration Center
1701 Powhattan St
Jacksonville Urban Core, Mid-Westside
Non-Profit Organizations, Community Organizations
Episcopal Children's Svc
100 Bell Tel Way Suite 100
Jacksonville Holiday Hill, Greater Arlington
Child Care, Non-Profit Organizations, Government Contractors
Jacksonville 4-H Program
1010 McDuff Ave N
Jacksonville Woodstock, Northwest
Youth Organizations, General Government Offices, City Legislators, Non-Profit Organizations
Northeast Florida Food Deserts
38
Organization Address City Area Served Type of Organization
Nonprofit Center-Ne Florida
1301 Riverplace Blvd # 301
Jacksonville Southside, Urban Core
Non-Profit Organizations, Government Contractors
Episcopal Children's Services
8443 Baymeadows Rd
Jacksonville Deerwood Center, Southeast
Non-Profit Organizations, Child Care
Seniors On A Mission
2050 Art Museum Dr # 102
Jacksonville St. Nicholas, Greater Arlington
Religious Organizations, Churches, Non-Profit Organizations
United Congregations for Comm.
1061 Line St Jacksonville Northwest, Robinson's Addition
Community & Social Services, Halls & Auditoriums, Other Social Services
River Region Human Services
3723 Franklin St
Jacksonville Urban Core, Longbranch
Community & Social Services, Other Social Services
Kid's Cafe 1502 Jessie St Jacksonville Urban Core, East Jacksonville
Other Social Services, Community & Social Services
Meals On Wheels-Riverside
849 Park St Jacksonville Riverside, Northwest
Community & Social Services, Other Social Services
Goodwill Donation Center
12200 San Jose Blvd Ste 19
Jacksonville Julington Creek, Southeast
Community Organizations, Community & Social Services, Charitable Institutions, Other Social Services
American Red Cross
744 Riverside Ave
Jacksonville Riverside, Northwest
Other Social Services, Community & Social Services
Gateway Community Services, Inc.
1283 E 8th St Jacksonville Urban Core, Phoenix
Medical Schools, Addiction Treatment, Drug Abuse Treatment, Other Social Services
Traveler's Aid Society
134 E Church St Jacksonville Downtown Jacksonville, Urban Core
Other Social Services, Community & Social Services
Jacksonville Urban League
903 Union St W Jacksonville Urban Core, LaVilla
Employment Agencies, Community & Social Services, Child Care, Other Social Services, Government Contractors
First Coast Family Center
1965 Beachway Rd # 109
Jacksonville Greater Arlington, St. Nicholas
Other Social Services, Community & Social Services
JFCS Century Plaza Jacksonville Woodland Acres, Greater Arlington
Community & Social Services, Other Social Services

Northeast Florida Food Deserts
39
Organization Address City Area Served Type of Organization
Kid Power Program
9775 Ivey Rd Jacksonville Southside Estates, Greater Arlington
Other Social Services, Community & Social Services
Jacksonville Youth Sanctuary
1233 Ingleside Ave
Jacksonville Urban Core, Avondale
Other Social Services, Community & Social Services
Bridge of Ne Florida INC
1824 N Pearl St Jacksonville Urban Core, Springfield
Other Social Services, Community & Social Services
Operation New Hope
1321 N Main St Jacksonville Springfield, Urban Core
Other Social Services, Community & Social Services, Government Contractors
Jacksonville Community Foundation
121 W Forsyth St
Jacksonville Downtown Jacksonville, Urban Core
Other Social Services, Community & Social Services
Bridge Multi-Service Center for Youth
1824 N Pearl St Jacksonville Urban Core, Springfield
Youth Organizations, Community & Social Services, Other Social Services
Hispanic Ministry
134 E Church St # 2
Jacksonville Downtown Jacksonville, Urban Core
Other Social Services
Clay County
Farmworkers Ministry
207 S Palmetto Ave
Green Cove Springs
Non-Profit Organizations, Religious Organizations, Community & Social Services, Other Social Services
Clay County Council On Aging
604 Walnut St Green Cove Springs
Non-Profit Organizations, County Offices, Human Resource Programs, Senior Citizens' Services
Lake Asbury Community Association
282 Branscomb Rd
Green Cove Springs
Business Organizations, Community & Social Services, Community Organizations, Other Social Services
Clay County Victim Serv.
1403 Idlewild Ave
Green Cove Springs
Other Social Services
Village Improvement Association Federated
17 N Palmetto Ave
Green Cove Springs
Community Organizations, Bars & Clubs, Business Organizations, Community & Social Services, Other Social Services
Clay County Food Bank
506 S Highland Ave
Green Cove Springs
Food Banks, Community & Social Services, Other Social Services
Food Pantry Of Green Cove Springs
1107 Martin Luther King Jr Blvd
Green Cove Springs
Other Social Services, Community & Social Services

Northeast Florida Food Deserts
40
Organization Address City Area Served Type of Organization
Haiti Hope Fund, Inc.
428 Walnut St Green Cove Springs
Community Organizations, Charitable Institutions
Salvation Army
2795 County Rd 220
Middleburg Other Social Services, Churches, Community & Social Services
American Legion
3939 County Road 218
Middleburg Non-Profit Organizations, Veterans Affairs, Community Organizations, Fraternal Organizations, American Legion
Veterans Of Foreign Wars
2296 Aster Ave Middleburg Community Organizations, Veterans Affairs, Fraternal Organizations, VFW, Non-Profit Organizations
Agape House Clothes & Food
2645 Blanding Blvd
Middleburg Non-Profit Organizations
Weigel Senior Center
3916 Section St Middleburg Senior Citizens' Services, Community & Social Services, Other Social Services
First Coast Women’s Services, LLC
2555 County Road 220
Middleburg Community & Social Services, Abortion Alternatives, Other Social Services
Challenge Enterprises of N FL
3530 Enterprise Way
Green Cove Springs
Community & Social Services, Other Social Services, Vocational Rehabilitation
Loyal Order of Moose
1932 Long Bay Rd
Middleburg Fraternal Organizations, Loyal Order Of Moose
Girl Scouts Gateway Council
4375 Lazy Acres Rd
Middleburg Youth Organizations
Putnam County
YMCA 141 Kelley Smith School Rd
Palatka Youth Organizations, Child Care, Halls & Auditoriums, Other Social Services
RCMA 120 Main St Palatka Non-Profit Organizations
Veterans Of Foreign Wars
3201 Reid St Palatka Community Organizations, Bars & Clubs, Veterans Affairs, Fraternal Organizations, VFW
Christian Palatka Service Center
Po Box 2465 Palatka Other Social Services
Nefi Community Action Agency
820 Reid St Palatka Other Social Services, Community & Social Services

Northeast Florida Food Deserts
41
Organization Address City Area Served Type of Organization
Lee Conlee House, Inc.
PO Box 2558 Palatka Community & Social Services, Other Social Services, Government Contractors
Putnam Habitat For Humanity
1605 Westover Dr
Palatka Community & Social Services, Christian Ministries, Business Organizations, Community Organizations, Other Social Services
Bread Of Life 320 N 5th St Palatka Other Social Services, Community & Social Services
Palatka Housing Authority
400 N 15th St Palatka Housing Authorities, Community & Social Services, Housing Assistance, Government Contractors
United Way Po Box 981 Palatka Community & Social Services, Other Social Services
Catholic Charities Bureau
1000 Husson Ave
Palatka Other Social Services, Community & Social Services
Community Partnership For Children
1910 Reid St Palatka Other Social Services
Christian Service Center
820 Reid St Palatka Other Social Services, Community & Social Services
Edgar Johnson Senior Center
1215 Westover Dr
Palatka Senior Citizens' Services
Worksource 400 N State Road 19 Suite 33
Palatka Job Training, County Offices, State Offices, County Legislators, State Legislators
North FL Community Action Agency
1201 Madison St
Palatka Community & Social Services
George Wilson's Children Center
401 N 13th St Palatka Child Care
Door-Hope Women's Transitional
1920 Washington St
Palatka Community Organizations
Soup For The Soul
Po Box 595 Palatka Charitable Institutions, Community Organizations
Suwannee River Economic Dev.
600 College Rd Palatka Community Organizations
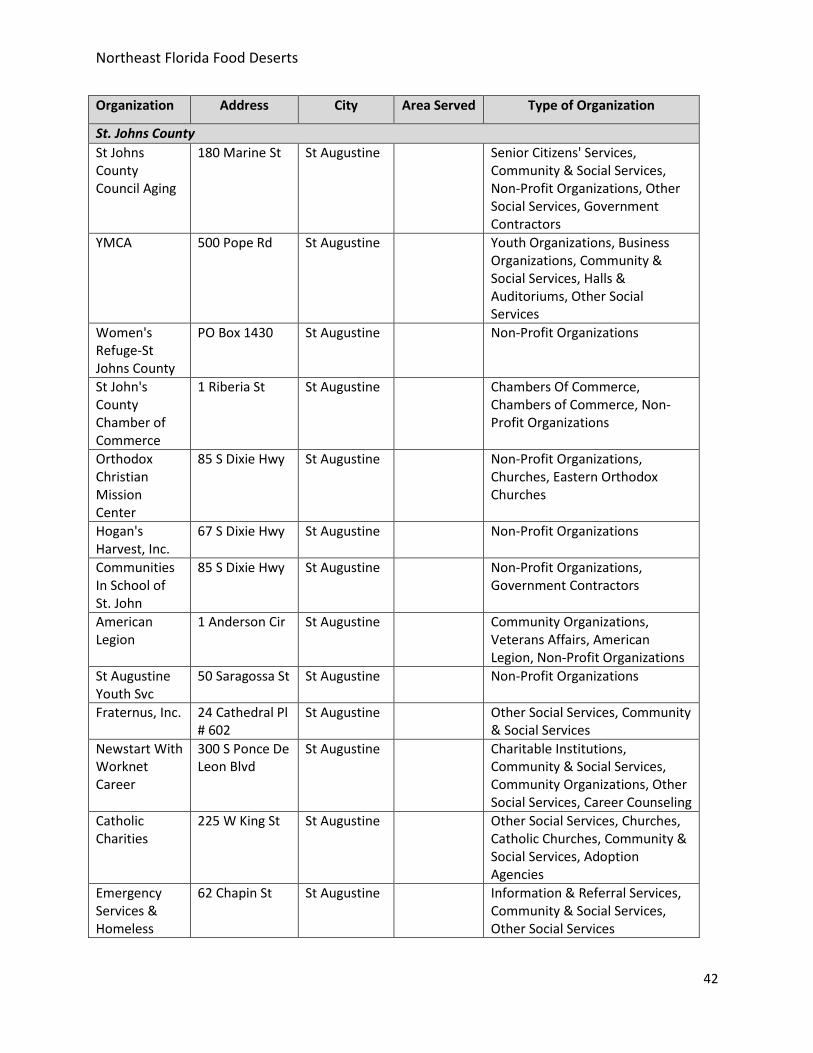
Northeast Florida Food Deserts
42
Organization Address City Area Served Type of Organization
St. Johns County
St Johns County Council Aging
180 Marine St St Augustine Senior Citizens' Services, Community & Social Services, Non-Profit Organizations, Other Social Services, Government Contractors
YMCA 500 Pope Rd St Augustine Youth Organizations, Business Organizations, Community & Social Services, Halls & Auditoriums, Other Social Services
Women's Refuge-St Johns County
PO Box 1430 St Augustine Non-Profit Organizations
St John's County Chamber of Commerce
1 Riberia St St Augustine Chambers Of Commerce, Chambers of Commerce, Non-Profit Organizations
Orthodox Christian Mission Center
85 S Dixie Hwy St Augustine Non-Profit Organizations, Churches, Eastern Orthodox Churches
Hogan's Harvest, Inc.
67 S Dixie Hwy St Augustine Non-Profit Organizations
Communities In School of St. John
85 S Dixie Hwy St Augustine Non-Profit Organizations, Government Contractors
American Legion
1 Anderson Cir St Augustine Community Organizations, Veterans Affairs, American Legion, Non-Profit Organizations
St Augustine Youth Svc
50 Saragossa St St Augustine Non-Profit Organizations
Fraternus, Inc. 24 Cathedral Pl # 602
St Augustine Other Social Services, Community & Social Services
Newstart With Worknet Career
300 S Ponce De Leon Blvd
St Augustine Charitable Institutions, Community & Social Services, Community Organizations, Other Social Services, Career Counseling
Catholic Charities
225 W King St St Augustine Other Social Services, Churches, Catholic Churches, Community & Social Services, Adoption Agencies
Emergency Services & Homeless
62 Chapin St St Augustine Information & Referral Services, Community & Social Services, Other Social Services

Northeast Florida Food Deserts
43
Organization Address City Area Served Type of Organization
Caring Hands-Caring Community
161 Marine St St Augustine Other Social Services, Community & Social Services
Northeast Florida Comm. Action
79 Bridge St St Augustine Other Social Services, Community & Social Services
Habitat For Humanity
7 Hopkins St St Augustine Other Social Services, Christian Ministries, Community & Social Services, Government Contractors
United Way 117 Bridge St St Augustine Other Social Services, Business Organizations, Community & Social Services, Community Organizations
St Johns Food Pantry
12 Madeore St St Augustine Community & Social Services, Other Social Services
Retired Senior Volunteer Program
10 Hildreth Dr St Augustine Community & Social Services, Other Social Services
Council On Aging
180 Marine St St Augustine Senior Citizens' Services, Home Health Care
Young Life of St John County
65 Valencia St St Augustine Youth Organizations
W E Harris Community Center
400 E Harris St St Augustine Community & Social Services
Big Brothers Big Sisters
1400 Old Dixie Hwy Suite B
St Augustine Other Social Services, Community & Social Services, Non-Profit Organizations, Mentoring
Salvation Army Service Center
1850 State Road 207
St Augustine Other Social Services, Community & Social Services
Salvation Army Food Bank
1731 Dobbs Rd Suite 8
St Augustine Food Banks
Orthodox Christian Mission Center
220 Mason Manatee Way
St Augustine Churches, Non-Profit Organizations
First Coast Community Services
2600 Us Highway 1 S
St Augustine Other Social Services, Community & Social Services
American Red Cross
2730 US Hwy 1 S Suite M
St Augustine Other Social Services, Red Cross, Community & Social Services

Northeast Florida Food Deserts
44
Organization Address City Area Served Type of Organization
Clearer Vision Ministries
415 N Main St Hastings Other Social Services, Community & Social Services
W E Harris Community Center
6150 S Main St Hastings Halls & Auditoriums
Hastings Potato Growers Assn
101 E Ashland Ave
Hastings Business Organizations, Community Organizations
Northeast Florida Food Deserts
45
References Ackerman, David and Gerard Tellis. 2001. “Can culture affect prices? A cross-cultural study of shopping
and retail prices.” Journal of Retailing 77(1): 57-82.
Algert, Susan J., Aditya Agrawal, and Douglas S. Lewis. 2006. “Disparities in access to fresh produce in
low-income neighborhoods in Los Angeles.” American Journal of Preventive Medicine 30(5): 365-370.
Anderson, Sus Ann. 1990. “Core indicators of nutritional state for difficult-to-sample populations.”
Journal of Nutrition 120(11S): 1559-1600.
Beydoun, May A. and Youfa Wang. 2010. “Pathways linking socioeconomic status to obesity through
depression and lifestyle factors among young US adults.” Journal of Affective Disorders 123(1-3): 52-63.
Black, Jennifer L., James Macinko, L. Beth Dixon, and George E. Fryer, Jr. 2010. “Neighborhoods and
obesity in New York City.” Health & Place 16(3): 489-499.
Bodor, J. Nicholas, Janet C. Rice, Thomas A. Farley, Chris M. Swalm, and Donald Rose. 2010. “Disparities
in food access: Does aggregate availability of key foods from other stores offset the relative lack of
supermarkets in African-American neighborhoods?” Preventive Medicine 51(1): 63-67.
doi:10.1016/j.ypmed.2010.04.009.
Brown, Kate H. and Andrew L. Jameton. 2000. “Public Health Implications of Urban Agriculture.” Journal
of Public Health Policy 21(1):20-39.
Carlson, Andrea, Mark Lino, WenYen Juan, Kenneth Hanson, and P. Peter Basiotis. 2007. Thrifty Food
Plan, 2006. (CNPP-19). Washington, DC: U.S. Department of Agriculture, Center for Nutrition Policy and
Promotion.
DeMarco, Molly and Sheryl Thorburn. 2009. “The relationship between income and food insecurity
among Oregon residents: Does social support matter?” Public Health Nutrition 12(11): 2104-2112.
Dinour, Lauren, Dara Bergen, and Ming-Chin Yeh. 2007. “The Food Insecurity-Obesity Paradox: A review
of the Literature and the Role Food Stamps May Play.” Journal of the American Dietetic Association
107(11): 1952-1961.
East, Andrew J. and Les A. Dawes. 2009. “Homegardening as a panacea: A case study of South Tarawa.”
Asia Pacific Viewpoint 50(3): 338-352.
Economic Research Service (ERS), US Department of Agriculture (USDA), Supplemental Nutrition
Assistance Program (SNAP) Data System. 2011. Retrieved April 9, 2014 (http://www.ers.usda.gov/data-
products/supplemental-nutrition-assistance-program-%28snap%29-data-system.aspx#.U0b9MVfwr9o).
Freedman, Darcy A. and Bethany A. Bell. 2009. “Access to healthful foods among an urban food insecure
population: Perceptions versus reality.” Journal of Urban Health 86(6): 825-838. doi: 10.1007/s11524-
009-9408-x.

Northeast Florida Food Deserts
46
Goodman, David. 2004. “Rural Europe Redux? Reflections on Alternative Agro-Food Networks and
Paradigm Change.” Sociologia Ruralis 44(1): 3–16. doi: 10.1111/j.1467-9523.2004.00258.x.
Hinrichs, C. Clare. 2000. “Embeddedness and local food systems: notes on two types of direct
agricultural market.” Journal of Rural Studies 16(3): 295-303.
Kirschenmann, Fred, Steve Stevenson, Fred Buttel, Tom Lyson and Mike Duffy. 2012. “Why worry about
the agriculture of the middle?” Unpublished Paper, Retrieved April 8, 2014
(http://www.agofthemiddle.org/papers/whitepaper2.pdf).
Larson, Celia, Alisa Haushalter, Tracy Buck, David Campbell, Trevor Henderson, and David Schlundt.
2013. “Development of a Community-Sensitive Strategy to Increase Availability of Fresh Fruits and
Vegetables in Nashville’s Urban Food Deserts, 2010-2012.” Preventing Chronic Disease 10:E125. doi:
10.5888/pcd10.130008
Larson, Nicole I., Mary T. Story, and Melissa C. Nelson. 2009. “Neighborhood environments: Disparities
in access to healthy foods in the U.S.” American Journal of Preventive Medicine 36(1): 74-81.
Liese, Angela D., Kristina E. Weis, Delores Pluto, Emily Smith, and Andrew Lawson. 2007. “Food store
types, availability and cost of foods in a rural environment.” Journal of the American Dietetic Association
107(11): 1916-1923.
Martin, Katie S., John T. Cook, Beatrice L. Rogers, and Hugh M. Joseph. 2003. “Public versus private food
assistance: Barriers to participation differ by age and ethnicity.” Journal of Nutrition Education &
Behavior 35(5): 249-254.
McCormack, Lacey Arneson, Meissa Nelson Laska, Nicole I. Larson, and Mary Story. 2010. “Review of the
nutritional implications of farmers’ markets and community gardens: A call for evaluation and research
efforts.” Journal of the American Dietetic Association 110(3): 399-408.
Mojtahedi, Mina C., Patty Boblick, James H. Rimmer, Jennifer L. Rowland, Robin A. Jones, and Carol L.
Braunschweig, C.L. 2008. “Environmental barriers to and availability of healthy foods for people with
mobility disabilities living in urban and suburban neighborhoods.” Archives of Physical Medicine &
Rehabilitation 89(11): 2174-2179.
Nord, Mark. 2009A. Food Insecurity in Households with Children: Prevalence, Severity, and Household
Characteristics, EIB-56. Washington, DC: U.S. Dept. of Agriculture, Economic Research Service.
Nord, Mark. 2009B. Food Spending Declined and Food Insecurity Increased for Middle-Income and Low-
Income Households From 2000 to 2007, EIB-61. Washington, DC: U.S. Department of Agriculture,
Economic Research Service.
Powell, Lisa M., Sandy Slater, Donka Mirtcheva, Yanjun Bao, and Frank J. Chaloupka. 2007 “Food store
availability and neighborhood characteristics in the United States.” Preventive Medicine 44(3): 189-195.
Northeast Florida Food Deserts
47
Pothukuchi, Kameshwari. 2005. “Attracting supermarkets to inner-city neighborhoods: Economic
development outside the box.” Economic Development Quarterly 19(3): 232-244.
Racine, Elizabeth F., Ashley Smith Vaughn, and Sarah B. Laditka. 2010. “Farmers’ market use among
African-American women participating in the Special Supplemental Nutrition Program for Women
Infants & Children.” Journal of the American Dietetic Association 110(3): 441-446.
Thayer, Julie, Carolyn Murphy, John Cook, Stephanie Ettinger de Cuba, Rosa DaCosta, and Marianna
Chilton. Sept. 2008. “Coming Up Short: High Food Costs Outstrip Food Stamp Benefits.” Boston: The Real
Cost of a Healthy Diet, A project of: C-SNAP at Boston Medical Center & The Philadelphia Grow Project
at Drexel University.
ver Ploeg, Michele, Vince Breneman, Paula Dutko, Ryan Williams, Samantha Snyder, Chris Dicken, and
Phil Kaufman. 2012. Access to Affordable and Nutritious Food: Updated Estimates of Distance to
Supermarkets Using 2010 Data, ERR-143. Washington, DC: U.S. Department of Agriculture, Economic
Research Service.