an examination of the intonation tendencies of advanced
TRANSCRIPT

Louisiana State UniversityLSU Digital Commons
LSU Historical Dissertations and Theses Graduate School
1994
An Examination of the Intonation Tendencies ofAdvanced Wind Instrumentalists Based on TheirPerformance of Selected Musical Intervals.Brant Gilmore KarrickLouisiana State University and Agricultural & Mechanical College
Follow this and additional works at: https://digitalcommons.lsu.edu/gradschool_disstheses
This Dissertation is brought to you for free and open access by the Graduate School at LSU Digital Commons. It has been accepted for inclusion inLSU Historical Dissertations and Theses by an authorized administrator of LSU Digital Commons. For more information, please [email protected].
Recommended CitationKarrick, Brant Gilmore, "An Examination of the Intonation Tendencies of Advanced Wind Instrumentalists Based on TheirPerformance of Selected Musical Intervals." (1994). LSU Historical Dissertations and Theses. 5804.https://digitalcommons.lsu.edu/gradschool_disstheses/5804

INFORMATION TO USERS
This manuscript has been reproduced from the microfilm master. UMI films the text directly from the original or copy submitted. Thus, some thesis and dissertation copies are in typewriter face, while others may be from any type of computer printer.
The quality of this reproduction is dependent upon the quality of the copy submitted. Broken or indistinct print, colored or poor quality illustrations and photographs, print bleedthrough, substandard margins, and improper alignment can adversely affect reproduction.
In the unlikely event that the author did not send UMI a complete manuscript and there are missing pages, these will be noted. Also, if unauthorized copyright material had to be removed, a note will indicate the deletion.
Oversize materials (e.g., maps, drawings, charts) are reproduced by sectioning the original, beginning at the upper left-hand corner and continuing from left to right in equal sections with small overlaps. Each original is also photographed in one exposure and is included in reduced form at the back of the book.
Photographs included in the original manuscript have been reproduced xerographically in this copy. Higher quality 6" x 9" black and white photographic prints are available for any photographs or illustrations appearing in this copy for an additional charge. Contact UMI directly to order.
U niversity M icrofilms International A Bell & Howell Information C o m p a n y
3 0 0 North Z e e b R oad. Ann Arbor. Ml 4 8 1 0 6 -1 3 4 6 U SA 3 1 3 /7 6 1 -4 7 0 0 8 0 0 /5 2 1 -0 6 0 0


Order N um ber 9508577
A n exam ination o f th e in tonation tendencies o f advanced w ind instrum entalists based on their perform ance o f selected m usical intervals
Karrick, Brant Gilmore, Ph.D.
The Louisiana State University and Agricultural and Mechanical Col., 1994
U M I300 N. ZeebRd.Ann Arbor, MI 48106


AN EXAMINATION OF THE INTONATION TENDENCIES OF ADVANCED WIND INSTRUMENTALISTS BASED ON THEIR
PERFORMANCE OF SELECTED MUSICAL INTERVALS
A Dissertation
Submitted to the Graduate Faculty of the Louisiana State University and
Agricultural and Mechanical College in partial fulfillment of the
requirements for the degree of Doctor of Philosophy
in
The School of Music
byBrant Karrick
B.M., University of Louisville, 1982 M.M., Western Kentucky University, 1984
August 1994

TABLE OF CONTENTS
Page
LIST OF TABLES................................................................................................. iv
LIST OF FIGURES............................................................................................... v
A B STR A C T......................................................................................................... v i
INTRODUCTION AND REVIEW OF LITERATURE................ 1In tro d u c tio n ................................................................................... 1
Need for S tu d y ......................................................................... 10Review of L iterature..................................................................... 11
Vocal Pitch Accuracy............................................................... 11Instrumental Pitch Accuracy................................................. 18Pitch Perception....................................................................... 21Categorical Perception of P itch ............................................. 25Performance of Pitch............................................................... 27
Purpose of S tu d y ........................................................................... 40Terminology Used in Study......................................................... 41
METHOD............................................................................................... 44S u b jec ts ........................................................................................... 44Musical E xam ple........................................................................... 45Procedure......................................................................................... 47
Recording................................................................................... 48Computer A nalysis................................................................. 50Conversion of Frequencies to C e n ts ................................... 53
L im ita tio n s ..................................................................................... 55Reliability......................................................................................... 55Variables........................................................................................... 56
RESULTS............................................................................................... 57In tro d u c tio n ................................................................................... 57Magnitude of Cent Deviation A nalyses................................... 57Directional Deviation A nalyses................................................. 61Subject Indicated Preference Regarding Tuning Systems. . . 64S um m ary ......................................................................................... 67
Summary of Results for Magnitude ofCent Deviation Analyses......................................................... 67Summary of Results for DirectionalDeviation A nalyses................................................................. 68
i i

DISCUSSION......................................................................................... 70In tro d u c tio n ................................................................................... 70Tuning System s............................................................................. 71Location........................................................................................... 73In tervals........................................................................................... 74G ro u p ............................................................................................... 76Subjects' Comments Regarding T u n in g .............................. 77Conclusions and Recommendations for Future Research.. 78
REFERENCES....................................................................................................... 83
APPENDICES
A ADAPTATION OF BACH CHORALE INCONCERT PITCH USED AS MUSICAL EXAMPLEWITH TARGET INTERVALS NUMBERED........................... 91
B INDIVIDUAL DATA ......................................................... 92
VITA....................................................................................................................... 109
iii

LIST OF TABLES
Table Page
1. Directional Cent Deviation from Equal Temperament for thePythagorean and Just Tuning S ystem s........................................... 43
2. W idth in Cents of Intervals in Equal Tempered, Pythagorean,and Just Tunings................................................................................... 54
3. Mean Absolute Cent Deviations from Equal Temperament (E. T.),from Pythagorean Tuning (Pyth.), and from Just Tuning:Group by Location by Interval (rounded to the nearestwhole num ber)..................................................................................... 60
4. Comparison of Sharp (S), Flat (F), & In-tune (I) Responses byGroup and Location (within p lus/m inus 6 centsconsidered in-tune)............................................................................. 62
5. Comparison of Sharp (S), Flat (F), & In-tune (I) Responses byInterval, Group, and Location (within p lus/m inus 6 cents considered in -tune)............................................................................. 63
6. Num ber of Responses to Questions #1 and #2 Regarding T uningSystems in Harmonic and Melodic C o n tex ts ............................... 65
7. Subject Preferred Directional Adjustment from EqualTemperament for Minor Thirds, Major Thirds, MinorSixths, and Major Sixths Performed Above a Root .................... 66
i v

LIST OF FIGURES
1. Questionnaire regarding tuning p reference .............................. 45
2. Amplitude graph of two p itc h e s ................................................... 50
3. Amplitude graph of a complete single p itch ............................... 51
4. Bar chart representing frequency across time for a single pitch . . . 53
5. Mean cent deviations by interval from three tuning systems . . . . 58
v

ABSTRACT
The purpose of this study was to examine performance trends of
advanced w ind instrumentalists with regard to intervallic tuning.
Factors of interest were tuning system, location (above or below a
referential stimulus), interval type, and group (student or professional).
Also of interest was the direction of deviation of the target pitches, sharp
or flat, from equal temperament. Subjects (N =16) were experienced wind
instrumentalists, eight experienced professionals, and eight advanced
university students. Subjects were recorded performing a two-part
reduction of a Bach chorale, first playing the melody with a synthesized
harm ony line, then vice versa. Performances were transferred to a NeXT
com puter where target intervals were analyzed and converted to cent
distance.
Results indicated that overall cent deviation was greatest when
compared to just tuning and least when compared to equal tem pered
tuning. For cent deviation from equal temperament, thirds and sixths
were performed slightly less in-tune than fourths, fifths, unisons, and
octaves. Location also affected the direction of deviation from equal
temperament as it appeared that subjects tended to play sharp and less in
tune when performing below the stimulus. There were no differences
found between groups for the magnitude of deviation, however,
considering direction of deviation from equal temperament, it was
observed that the student group performed less sharp than the
professionals when performing below the stimulus and less in-tune
when perform ing above.
vi

INTRODUCTION AND REVIEW OF LITERATURE
Introduction
There are myriad factors that affect the quality of a musical
performance. Among these are the basic elements of music such as the
performance of rhythm, melody, harmony, texture and tone color. Also
included are more subjective elements such as pitch, tempo, dynamics,
tone quality, style, and musical expression. When attempting to attain a
performance standard of the highest caliber, even slight defects in any of
the aforementioned musical properties may detract from the overall
quality and affect listener evaluation of the performance. These basic
elements also contribute to the overall organization and artistic integrity
of a musical composition.
Music may be defined as a succession of tones or sounds in various
combinations that achieve unity and continuity. All musical sounds are
vibrations of air in the form of pressure oscillations called sound waves.
The num ber of sound waves that pass a given point in one second
represent the sound's frequency, or the number of vibrational cycles per
second (Wagner, 1978). Frequency is measured in terms of Hertz (Hz.)
nam ed after the German physicist Heinrich R. Hertz (Randel, 1986, 376).
The perception of sound on the other hand involves the transmission of
sound energy to the ear, where the ear drum sends a second set of
mechanical vibrations to the small bones of the middle ear and to the
fluid and hair cells of the inner ear where the information is finally
encoded into patterns of nerve impulses ultimately interpreted by the
brain. The perceived quality of a sound, mainly due to its frequency, is
called pitch (Randel, 638). Frequency can be considered the objective
1

2
physiological property of sound while pitch is the subjective
psychoacoustical translation of frequency.
It is generally understood that frequency and pitch are related. The
faster the frequency of a sound the higher the perceived pitch and vice
versa. Considering the two terms, musicians most often use pitch to
describe a sound according to its highness or lowness as perceived from
the frequency of a sound's vibration. Pitch is also the term used to specify
the position of a sound in the musical octave and its relationship to other
sounds.
There are many dimensions of pitch as related to music and music
performance. The ability to match pitch vocally is usually considered
among the first and most important competencies to be acquired by those
participating in music. Within the realm of instrum ental music, pitch-
matching, or in this case the ability to perform in-tune, is consistently one
of the prim ary considerations in the delivery and evaluation of both
ensemble and solo performances. The New Harvard Dictionary of Music
describes tuning as: ..........
The act of adjusting the fundamental sounding frequency or frequencies of an instrument, usually in order to bring it or them into agreement with some predeterm ined pitch.W hether or not two sound sources are in-tune depends both on their fundamentals and on that of their significant shared upper partials. . . .. . . Any ordered interval collection all of whose members can be expressed precisely by rational numbers. Interval collections not displaying this property are temperaments. (Randel, 1986, 884)
Also mentioned is the acoustic fact that if two like pitches are out-of-tune,
the ear will experience fluctuations of intensity, or beats. Interference
beats are caused by a difference in the frequencies of the component tones
w ith the number of interference beats per second generally being the

3
difference between the two frequencies. For complex tones containing
normal harmonic spectra, beats can occur between the fundam ental of
one pitch and a higher harmonic of another allowing the tuning of
intervals other than the unison (Randel, 86).
Therefore, the psychophysical aspect of "in-tuneness" may occur
when (1) the fundamental frequency of two sound waves are identical;
(2) the fundamental frequency or overtone of one complex sound wave is
identical to the fundamental frequency of an overtone in a second
complex sound wave; (3) the frequencies of two sound waves relate to
one another in a way that corresponds to one of the m any known tuning
systems, derived mathematically or otherwise; or (4) the fundam ental
and harmonic frequencies of two sound waves produce a sound that
because of cultural conditioning or musical background "sounds" in-tune
to a listener. The previous definitions of "in-tuneness" were organized
from the most objective to the least objective with much room for debate
in between. In fact, it is difficult to describe tuning to someone who has
not experienced it aurally.
Operationally defined, tuning is the physical process by which a
musician accomplishes in-tuneness. This can occur within the context of
a musical performance as musicians make minute adjustments of a pitch
to more closely agree with other pitches occurring either previous to or
simultaneously with the pitch being tuned. Tuning, for instrum entalists,
also takes place outside a musical context usually in the form of matching
a predeterm ined reference pitch. In this situation a musician m anually
adjusts the length of the instrum ent or the tension of the strings until the
perceived frequency of the performed tuning pitch(es) is in agreeable
harmonic relation to or in-tune with a reference pitch.
4
Intonation is a term that can be used to describe qualitatively the
result of tuning, or the degree to which musicians achieve in-tuneness.
W hen a musician or ensemble consistently performs w ith accurate
tuning, good intonation is the result, although the degree of tuning
required to achieve good intonation is subjective. Most musical
performances by hum an beings include qualitative degrees of intonation.
Intonation can also be used to describe a system of tuning—that is—the
mathematically derived ratios of pitch relationships that produce
intervals. Information regarding specific intonation systems will be
discussed later.
One has to trace the 22 centuries worth of musical evolution to
realize that tuning has historically been an im portant issue in the
performance of music and that the topic of tuning was just as relevant to
musicians of times past as it is to musicians today. A historical perusal of
tuning generally begins in the time of ancient Greece, where simple but
rigid mathematics allowed Pythagoras (540-510 B. C.) to develop the first
musical scale of widespread use. According to Barbour (1951), there was
no general agreement concerning the development of the scale before
Pythagoras. Barbour theorized that the concern of early m an in regards to
prim itive instruments was not the actual interval as such, but the spacing
of sound holes or length of strings to create different pitches. The
Pythagorean system is based on ratios, 2:1 for the octave and 3:2 for the
fifth, making it possible to tune all of the diatonic as well as chromatic
scales. However, even Pythagoras contended that the judgm ent of the ear
concerning intervals was superior to mathematical ratios.
There are problems with the Pythagorean system. Beginning on any
note a series of seven purely (beatless) tuned fifths, at a 3:2 ratio, retuned
5
into the same octave, will produce a diatonic major scale. However, the
chromatic scale derived from purely tuned fifths beginning on C: C, G, D,
A, E, B, F-sharp, C-sharp, G-sharp, D-sharp, A-sharp, E-sharp, B-sharp will
result in two enharmonically equivalent pitches that have a difference of
24 cents, or a syntonic comma (Blackwood, 1985). Another problem with
Pythagorean tuning from a harmonic standpoint is that while the ratios
2:1 and 3:2 result in pure tunings—that is intervals free of beats—the
resulting major third of C-E results in a ratio of 81:64, which produces a
discordant sound. With this ratio, middle C 261.63 Hz., contains a fifth
partial which vibrates at 1308.15 Hz. (261.63 x 5) which combines with the
fourth partial of E of 1324.5 Hz., creating the acoustical disturbance known
as beats of approximately 16 cycles per second. Other intervals formed in
the Pythagorean diatonic scale also present impure ratios and create a
discordant sound when performed harmonically. Nevertheless, the
Pythagorean system and similar systems of such pioneers as Aristoxenus,
Ptolemy, and Didymus were well suited for monophonic singing such as
the unisonal Gregorian chant, if in fact the performers of such music
consistently conformed to any particular tuning.
As music evolved through the middle ages, the intervals of thirds
and sixths became freely used, both melodically and harmonically .
Barbour (1951) raised the question of whether these intervals were as
rough sounding as they would be in strict Pythagorean tuning, or if a
tempering or "softening" process had not already begun. The first
historical account of this was found in the writings of Bartolomeus Ramis
de Preja in his work Musica practica (1482), as he broke away from the
Pythagorean system for the tuning of the chromatic monochord by
slightly flatting some of the major thirds.

6
Traditionally, the system of just tuning within a major key is defined
as that which puts the three primary triads, tonic, subdominant, and
dom inant, into pure tuning. The intervallic ratios for pure tunings are
2:1, 3:2, 4:3, 5:3, 5:4, 6:5 for the intervals of octave, perfect fifth, perfect
fourth, major sixth, major third, and minor third, respectively. Adhering
to these conditions the major triad is formed entirely of pure intervals
and forms the ratio 4:5:6. Just tuning was achieved by starting with
Pythagorean tuning of the notes F, C, G, D, A, E, & B, and lowering E, A, &
B, each by a syntonic comma or approximately 24 cents, producing three
beatless major triads (Blackwood, 1985). While just intonation seemed to
improve the sound of the altered chords, it rendered a musically
unusable melodic scale for instruments of fixed pitch.
Meantone tuning, similar to just tuning, was a tem peram ent whose
purpose was to correct the discordant harmonies associated with
Pythagorean and just tuning. Meantone tuning allowed slight impurities
in the fifths of the just triads, eliminating disturbing melodic
inconsistencies caused by the syntonic comma (Blackwood, 1985). In
A ron's Toscanello in musica (1523), a chapter concerning tem peram ent
describes the tuning of an instrument in stages. First, the major third, C
to E, is tuned purely, or in just, but the fifth, C to G is slightly flattened. To
ensure equality, the remaining fifths, F to C, B-flat to F, and E-flat to B-flat
were tuned similarly. The remaining notes, C# and F# are tuned as pure
thirds from A and D respectively. The term meantone was used to
describe this temperament because the justly tuned major thirds above
and below the tonic were comprised of equal-sized whole tones whose
value theoretically approximated the geometric mean. For instrum ents
7
of fixed pitch, meantone tuning was only a slight im provem ent over just
intonation (Barbour, 1951).
While it is impossible to know when the practice of equal
tem peram ent actually began, it is possible to trace its orgin through the
work of musicians like Gafurius (1969), who at the end of the fifteenth
century pointed out in his Practica musica. that fifths on the organ should
be slightly diminished. According to Barbour (1948), Arnold Schlick, in
1511, was the first person to describe a temperament for every chromatic
note and Salinas, a viol maker, in 1577, claimed that "the octave m ust be
divided into twelve parts equally" (Barbour 1951, 50). Mersenne in his
greatest work, Harm onie universelle (1636-37), expressed equal
tem peram ent in terms of numbers and geometric formulas, and even
tested his theories by listening for beats, as is done today. He was able to
generate a chromatic octave that is similar to the equal tempered system
in use today.
While there were many contributions made in the developm ent of
our m odern tempered system, it should be pointed out that for many
centuries mathematicians as well as musicians continually tried to
develop a better intonation system. As music continued to increase in
harm onic and melodic complexity, the older tuning systems were
insufficient and intolerable especially for the instruments of fixed pitch
such as fretted and keyboard instruments. Musicians of the time may
have been aware when two or more pitches played together "sounded"
displeasing and possibly practiced a sort of tempering w ithout fully
understanding what they were doing. Equal tempered systems were
developed chiefly from a practicality standpoint so that instrum ents with
fixed pitch could perform in a variety of keys, and the vertical harmonies

8
they produced such as thirds and sixths sounded more refined. However,
the biggest drawback to and criticism of the equal tempered system is
that it causes all intervallic relationships to be slightly impure, resulting
in beats and sounding "out-of-tune."
Today the complexity of performing in-tune still challenges the most
accomplished musician. The enigma is further fueled by the many
diverse opinions, theories and speculations rendered by a large
assortment of conductors, performing musicians, and acousticians. The
famous cellist, Pablo Casals, described an "expressive intonation" as a
process that expresses the organic relationship between notes in a musical
context with the ultimate judgment made in the sensitive ear of the
musician (Blum, 1971). He claimed that the equal tempered scale with its
equidistant semitones is a compromise to which string players (or wind
instrum entalists) need not comply. According to Blum:
Casals considered the tonic, subdominant and dom inant of a given tonality (the first, fourth and fifth degrees of a scale) to be points of repose to which the other notes are drawn. Thus, the principle of gravitational attraction is at work within each of the two tetrachords of which a scale is composed. . . . (p. 103).. . . No placement of pitch can be isolated from its brethren; no interval can be considered apart from its gravitational tendency.Thus major and augmented intervals will of necessity be widened, minor and diminished intervals narrowed, (p.107).
Casals further explained that a semitone within a diatonic tetrachord has
a natural tendency to be draw n upwards (particularly the leading tone of
the tonic) toward the upper octave, therefore, it should be raised. He also
believed that the intermediate tones (such as the second and sixth scale
degrees) are affected and must be adjusted slightly upwards.
Although supported by little scientific evidence, debates pertaining to
tuning and tuning systems still run rampant. Many musicians argue that

9
the intervallic relationships of the just intonation system are the most
perfect being devoid of the acoustical interference beats created by closely
opposing frequencies. Bencriscutto (1965) proposed that for wind groups,
thirds are most in-tune in just intonation. Helmholtz (1930) im plied that
a cappella choirs, when trained to sing in-tune, adhere strictly to the
intervals of just intonation.
However, Barbour (1938) speculated that just intonation is the least
satisfactory system to use for a twelve tone octave. Similar to the theories
of Casals, he suggested that string players, even while using such vocal
effects as portamento and vibrato, most closely approach Pythagorean
tuning of pure fifths and sharp thirds. It has also been suggested that
Pythagorean tuning is excellent for tuning within a melody but
unsatisfactory for harmony (Barbour, 1948). Branning (1967) concluded
that when given a choice, subjects preferred just intonation over
Pythagorean for the intervals of thirds, sixths, and augm ented fourths
w hen presented as harmonic intervals as melodic intervals were more
difficult to distinguish.
An interesting point was made by Lloyd (1940), who described the
potential difficulty of playing just "off the note" with exactly the
m istuning required for equal temperament. It was suggested that a
flexibility of tuning within the musical scale exists for instrum ents
unrestricted by fixed intonation. Instruments restricted to fixed
intonation and generally tuned in the equal tempered system include
keyboard instruments, fretted stringed instruments, and tuned percussion
such as mallet instruments and hand bells.
While there has been extensive study of the inherent tuning
deficiencies of wind instruments and physical conditions which disturb

10
tuning (Ahrens, 1947; Bach, 1950; Stauffer, 1954), Pottle (1960) purported
that w ind instrumentalists, in order to improve intonation, can achieve
the ability to "humor, lip, or temper" tones which are slightly sharp or flat
into agreeable intonation. Pottle also suggested that the physical and
perceptual variations between musicians are often greater than the
inherent intonation discrepancies found in well-designed wind
instrum ents.
Need for Study
Many interesting questions are raised by the preceding discussion.
Considering that professional wind players are not limited to the rigid
intonation of fixed pitch instruments, and can make minute adjustments
of pitch during performance, is it possible that they are adjusting toward
some type of temperament or known tuning system? W hat are the
factors that influence the decision to adjust? How might they decide
which direction to make the adjustment, and how much to affect the
pitch? Do professional string and wind instrumentalists use one type of
intonation for melodic passages and another type for harmonic ones?
W hat physical and perceptual musical parameters constitute an in-tune
perform ance?
In addition to the complex nature of tuning, there are m any physical
factors that can contribute to tuning difficulties. For wind
instrum entalists these include variation in loudness, changing
tem perature, insufficient warm-up, and performing off standard tuning
frequency (Pottle, 1960). With rigorous training, practice, and thorough
knowledge of their instrum ent's intonation deficiencies, instrum ental
musicians may be able to overcome the derogatory effects on intonation
caused by the aforementioned physical conditions. But the question

11
remains: What physical and perceptual musical param eters constitute an
in-tune performance?
The mysteries of tuning continue to elude the best of musicians, not
to mention younger instrumentalists who are often ignorant of or are
overwhelmed by the difficulty of performing with accurate intonation.
From a music education viewpoint, the main difficulty in teaching one
to play or sing with good intonation is its highly subjective nature, as
being in-tune is difficult if not impossible to describe. Therefore, any
attem pt at teaching intonation must be done experientially and even then
a complete understanding of the process is vague. Qualitative judgments
regarding intonation remain mysteriously subjective and research in the
areas of pitch acuity, perception, discrimination, and performance
continues.
The purpose of this study was to examine the intonational
performance trends of experienced wind instrumentalists with regard to
intervallic tuning. Of particular interest was the comparison of harmonic
minor thirds, major thirds, minor sixths and major sixths, each compared
to the Pythagorean, just, and equal tempered tuning systems. An attem pt
was made to determine from which system musicians tended to deviate
least and the direction of mis tunings when compared to equal
tem peram ent.
Review of Literature
Vocal Pitch Accuracy
Although much research has been done in the areas of pitch acuity
and discrimination, there is little qualifying empirical evidence about
how students acquire a sense of pitch and how they learn to sing or play
12
in-tune. Vocal pitch-matching studies seem to point to both age and
model characteristics as variables determining success.
Geringer (1983) grouped 72 preschool students and 72 fourth grade
students into low, medium, and high ability groups according to a pitch
discrimination task which consisted of determining if two successive
tones were the same or different. The pairs of tones deviated by tritones,
m inor thirds, quarter tones and eighth tones for a total of twelve trials.
Subjects were subsequently asked to sing three versions of a song, each in
a different key and within appropriate vocal range, and were scored on
their ability to sing with accurate pitch. Scores from the discrimination
task were compared to scores of pitch matching accuracy obtained from
the singing task. There was no significant correlation between the two
tasks although there was a moderate correlation involving the high
ability fourth grade group. Also, age had a significant effect on pitch
matching scores. Conversely, during a study of 55 sixth grade students,
Pedersen & Pedersen (1970) found significant correlations between vocal
pitch production and pitch discrimination as well as between vocal pitch
production and the recognition of music symbols.
Many studies have investigated the effect of the model used on the
pitch-matching ability of young children. Hermanson (1971) recorded
29 kindergarten and 43 fourth grade children singing while imitating four
models: (1) a child's voice; (2) a woman's voice; (3) a piano; and (4) an
oscillator. Subjects sang more accurately with the wom an's voice and
fourth grade subjects performed more in-tune than kindergarten subjects.
Investigating possible differences in the vocal model used for pitch
matching, Green (1990) examined 282 children in grades one through six
by having them sing a descending minor third, G to E, above middle C.

13
The vocal models presented were an adult female's voice, an adult male's
voice, and a child's voice. Unlike Hermanson's findings, there
were more correct responses to the child model (the least num ber of
correct responses was to the male model). Also, responses tended to be
flat to the female and male model and sharp to the child model. Grades
one and six had the highest percentage of incorrect responses. However, a
similar study (Small & McCachern, 1983) found no significant differences
between male and female models on the pitch-matching accuracy of first
grade children either before or after a training period.
A study using similar vocal models as Green (1990) was done by
Yarbrough, Green, Benson, & Bowers (1991). Uncertain singers,
kindergarten through third grade, and seventh and eighth grade, were
recorded imitating the descending minor third presented by two vocal
models, an adult female and an adult male, and responding using one of
three different response modes: (1) Curwen hand signals; (2) Solfeggio
syllables, sol-mi; or (3) "la-la." While there was no difference due to the
mode of response, there was a difference between vocal models w ith
more correct responses to the female model. There was also a significant
difference between the kindergarten and eighth grade w ith the older
subjects performing more accurately.
A related study compared the effect of male timbre, falsetto, and sine
wave models on pitch matching accuracy of uncertain singers (N=216) in
kindergarten through eighth grade (Price, Yarbrough, Jones, & Moore,
1993). Subjects listened to a descending minor third sung by a tenor and
bass in their regular octave, G to E, below middle C, in falsetto an
octave higher, and two sine wave stimuli in the same octaves.
Results dem onstrated that girls responded more accurately to the higher

14
models and boys responded more accurately to the lower models. In an
extension and replication of this study, Yarbrough, Morrison, Karrick, &
Dunn (1993) examined 108 uncertain male singers' responses,
kindergarten through eighth grade, (n = 12 in each grade) to six stimulus
models consisting of a tenor, a bass, and a sine wave. Each model
produced the descending minor third G to E twice, once above middle C
and once below. The vocal models sang in both their normal range and
in their falsetto voices and the sine wave sounded in both octaves. It was
observed that boys spent more time singing correctly when imitating the
higher octave stimuli (falsetto and upper octave sine wave models) than
the lower octave models. There was also an interaction between the
models and grade as the kindergarten through seventh grade boys sang
more accurately to the falsetto and sine wave octave models and the
eighth grade boys sang more accurately to the lower octave models. In
addition, there was also a significant difference between grades with the
fifth, seventh and eighth grades singing correctly a larger percentage of
the time than all other grades.
A study by Yarbrough, Bowers, & Benson (1992) examined the effects
of vibrato on the pitch-matching accuracy of both certain and uncertain
singers. Children in kindergarten through the third grade (N = 200)
responded to three models singing the same descending minor third, G to
E above middle C, which consisted of a child voice, a female voice
with vibrato, and the same female voice w ithout vibrato. Results showed
fewest correct responses to the vibrato model.
Considering other possible factors related to children's ability to sing
in-tune, Smith (1973) recorded 236 sixth graders singing "America" in the
high key of F and the low key of C. Subjects performed under three

15
conditions: (1) with a peer group and accompanied; (2) with a peer group
and unaccompanied; and (3) w ithout the peer group and unaccompanied
for a total of six performances each. Prior to the recordings, subjects were
tested and scored on the pitch and tonal memory sections of the Seashore
M easure of Musical Talent, the Tennessee Self-Concept Scale, and the
Education Development Series measure of intelligence. Smith concluded
that intonation accuracy of singing was related to pitch discrimination,
tonal memory, self-concept, intelligence, vocal range and not affected by
the unison peer group or by the use of accompaniment.
Another study examining the effects of performing with a peer group
on the singing accuracy of children (Goetze, 1985) recorded kindergarten
through grade three subjects singing two melodic phrases in four
treatment conditions: (1) alone using the text; (2) alone using the syllable
"loo"; (3) with five other voices using the text; and (4) with five other
voices using the syllable "loo." Results suggested that subjects sang more
accurately when singing "loo," sang more accurately when singing alone,
and sang most in-tune when singing alone and using the syllable "loo."
It was also observed that the third grade subjects sang more accurately
than the younger subjects.
Finding efficient and effective ways of training young musicians to
sing and play more accurately in-tune has been of great interest to music
educators and researchers. Thus, many methods of remediating
intonation skills have been investigated scientifically. Fifty-one preschool
children, three and four years old, showed significant im provem ent in
the "tunefulness" of their singing following a training period which
consisted of singing folk songs along with piano accompaniment and
recorded vocal examples (Smith, 1963). Even when compared to

16
untrained children a year older the trained subjects performed more
correct pitches. Richner (1976) examined 77 third, fourth and
fifth grade inaccurate singers across four treatment conditions: (1) music
taught by a regular classroom teacher who was not a trained musician; (2)
music taught by a music specialist which included music reading and
theory; (3) music taught by a music specialist consisting only of singing;
and (4) remedial vocal training for small groups. A pretest was given
prior to the treatment which was followed by a similar posttest that
m easured level of singing ability. There were significant differences
between treatment groups at the fifth grade level and at the third grade
level, while no differences due to treatment were found for the fourth
grade level. Inaccurate singers who received remedial vocal training
im proved significantly in comparison to all other treatment groups.
Third grade subjects in treatment conditions involving a specialist and
active engagement in singing also improved significantly when
compared to those who were taught by the classroom teacher.
Similar results were found by Apfelstadt (1984) who investigated the
effects of instruction on the pitch discrimination and vocal accuracy of
kindergarten children. Three treatment conditions were compared:
(1) vocal instruction through a visual and kinesthetic process; (2) vocal
instruction consisting primarily of imitation; and (3) traditional music
instruction. Following the treatment period, it was found that subjects
who had received vocal instruction sang more accurately than those
receiving traditional music instruction. However, there were no
significant differences in the pitch discrimination abilities of the three
groups. Similarly, Shriro (1982) demonstrated that a training program
which consisted of supervised practice and immediate evaluative
17
feedback significantly improved elementary subjects' ability to sing
in-tune.
In an effort to study the effects of reinforcement during training on
intonational im provement in scale singing, Madsen, Wolfe, & M adsen
(1968) divided 144 sixth grade students into eight experimental groups
incorporating four different training conditions in the presence of either
reinforcement or no reinforcement. Reinforcement consisted of giving
each subject verbal approval and a penny for good singing and on-task
behavior. Results indicated the training group that sang songs with
reinforcement improved the most on their performance of scales, and
that both of the song singing groups appeared to be more on task. Greer,
Randall & Timberlake (1971) obtained similar results when investigating
100 sixth grade students who were divided into five groups based on
contingencies of reinforcement. During vocal training, two groups were
rew arded with music listening while another received pennies for
observable attentive behavior. Another group participated in the training
with no reinforcement and a fifth group served as control and received
no training. While there was an overall improvement between pre- and
post-test scores, there was no difference in vocal pitch acuity among the
groups. The contingency groups were, however, observed as
dem onstrating more attentive behavior during training periods.
Considering other behavior modification training techniques, Cobes-
Dennis (1977) found that a shaping procedure incorporating successive
approximations was superior to verbal reinforcement for the
im provem ent of pitch matching abilities of 45 uncertain singers in grades
four, five, and six. It was also observed that incorrect feedback on the part
of the teacher was detrimental to subject performance. Porter (1977),
18
how ever, found that uncertain singers in grades four, five, and six
receiving multiple discrimination training performed better on pitch-
matching tasks than those who received training consisting of successive
approxim ations.
Instrumental Pitch Accuracy
There has been a moderate am ount of research that has examined the
effects of training on the development of pitch acuity among young
instrumentalists. Both instrumental and vocal pitch-m atching may
intrinsically share the same neurological functions, however,
instrumentalists may have the advantage of getting closer to a target pitch
merely because of the acoustical and physical components of the
instruments. Also instrumentalists may associate the perception of pitch
with the instrum ental fingerings and other physical requirem ents in
addition to aural discrimination. More research comparing vocal and
instrum ental pitch-matching is needed.
When considering intonation in the context of instrum ental music,
it is im portant to separate the act of tuning and playing in-tune. As
m entioned earlier, tuning is the physical act of m anipulating the
frequency of a pitch by adjusting the instrum ent to accurately match a
reference pitch or pitches in a musical context, while being in-tune is the
desired outcome, generally free of erroneous beats and pleasing to one's
ear.
Cassidy (1985) compared the relationship between vocal intonation
and instrum ental intonation performed by the same subjects in a melodic
context. Forty-one eighth grade wind instrumentalists were recorded
singing and playing two excerpts from the carol, Tingle Bells.
Approximately half of the subjects played first then sang, while the other

19
half sang first then played. All recorded performances were analyzed for
absolute cent deviation from equal tempered tuning among selected
pitches. Results indicated that instrumental performances deviated
significantly less than vocal performances with no correlation between
the two tasks. Cassidy also discovered the order of performance produced
a significant difference as subjects who played first then sang performed
more accurately. Large deviations were observed for both groups which
indicated relatively poor intonation for most subjects.
Elliot (1974) found the use of vocalization to be effective in
im proving the pitch discrimination and tonal memory of young
instrum entalists (N = 196). An experimental group regularly vocalized
musical lines in addition to playing them during instrum ental
instruction while a control group received instrum ental instruction
which did not consist of vocalization. The experimental group scored
significantly better than the control group in the pitch discrimination and
tonal memory sections of the Seashore Measure of Musical Talent. Smith
(1985), however, obtained contrasting results in an investigation of 94
collegiate wind instrumentalists. Subjects either played a musical passage
or sang through the passage for a period of 30 seconds prior to playing it.
Individual pitches of the instrumental performances were m easured and
converted to cent deviation scores. There were no differences found
between the two performance conditions.
Many instrumental music educators believe that if a student can
accurately tune to a pitch, then s /h e will play more in-tune within the
framework of an ensemble. Consequently, a line of research examined
training methods that may improve tuning accuracy. Miles (1972)
suggested that young instrumentalists can learn to tune more accurately
20
by eliminating acoustical interference, or beats, between a reference tone
and the pitch produced on their instrument. Although the method of
assessment was not discussed, he reported that following a four-month
period including four demonstrations and six discrimination sessions, 118
beginning w ind instrumentalists were taught to eliminate beats between
unison pitches and to perceive when they were eliminated.
Cassidy (1988) studied the effects of beat elimination training coupled
w ith lip flexibility exercises on junior high school (n = 7) and high school
trum pet players (n = 8). Subjects were further divided into experimental
and control groups, where the experimental group practiced eliminating
beats by tuning and mistuning a Johnson Intonation Trainer as well as
m anipulating the pitch of their instrum ent by changing the tension of
their embouchures. Control group subjects simply practiced matching
certain pitches produced by the trainer while playing their instruments.
While both groups improved their tuning ability, the experimental group
was slightly better, although the differences were not statistically
significant. Cassidy also observed that while high school subjects tuned
more accurately than junior high subjects, junior high subjects in the
experimental group performed equally as well with the Johnson
Intonation Trainer as their high school counterparts.
Besides beat elimination, other methods of tuning training have been
effective. Graves (1963) evaluated three methods which included aural
training, visual training, and conventional training. Aural training
consisted of the student playing within the framework of an
accompaniment; visual training allowed students to watch a Stroboconn
as they played; and conventional training consisted of learning the
intonational problems specific to the instrument, receiving a basic
21
knowledge of theory and playing one on one with a teacher. While there
were no significant differences among the three methods, Graves
observed that there was significant improvement for all the training
conditions. It was also reported that the effect of the visual tuning
training rem ained constant over time more so than the other methods.
Pitch Perception
It has been well documented that the perception of pitch is affected by
many physical and acoustical properties of sound as well as by the
individual differences between listeners. Intensity or loudness has been
found to significantly affect the perceived pitch of tones with the
perceived change being different for different frequencies (Fletcher, 1934).
It was observed for lower frequencies, that the perceived pitch seemed to
decrease with an increase in intensity and for higher frequencies, that
perceived pitch seemed to increase with a decrease in intensity. Fletcher
noted that intensity affected timbre as well as pitch perception and
discovered that the perceived changes in pitch were substantially greater
for pure tones than for complex tones. These findings were corroborated
by Stevens (1935) whose subjects matched the pitch of two tones by
increasing the intensity of one. Both Fletcher and Stevens suggested that
the perceived pitch change was due to physical properties of the cochlea,
as the Basilar membrane contains correlating areas of sensitivity to
specific frequencies. It was suggested that as intensity increases, the
corresponding area of sensitivity along the Basilar membrane moves in a
conflicting direction. Stevens also observed that change of pitch with
intensity was less noticeable for middle range frequencies. Sergeant (1973)
concluded that a listener's proximity to a sound source, the distance from
and angle of a listener to a pair of speakers, was related to the intensity of

22
the sound received, thereby affecting the perception of the pitch by the
listener.
Besides intensity, the harmonic structure or timbre of a tone has been
found to affect the perception of pitch. Sergeant (1973) conducted pitch
discrimination tests using simple and complex tones. He found that for
college aged subjects pitch judgments of complex tones were superior to
judgm ents of simple tones. Plomp (1967) observed that when a 10%
increase in intensity was added to the second harmonic of a complex tone
with a frequency up to 1400Hz, subjects indicated the pitch increased as
compared to when 10% was added to the fundamental. When the
frequency was above 1400Hz, the opposite effect occurred. Wapnick &
Freeman (1980) conducted research that examined the perception of pitch
with timbral alterations. Fifty collegiate musicians listened to pairs of
tones with timbral variations consisting of bright-bright, bright-dark,
dark-dark, and dark-bright. The second tone of each pair was either sharp
by twelve cents, flat by twelve cents or the same. It was observed that
more perception errors occurred when the timbre of the two tones was
different than when it was the same and that fewer errors were made
when the second tone was flat. They also found that subjects tended to
associate a darker tone quality with flatness and a brighter tone quality
with sharpness. In an interval identification task, Howell (1977)
examined 80 collegiate musicians' (n = 20 each of pianists, clarinetists,
trum peters, and other) ability to identify intervals prerecorded by either
piano, oscillator, two clarinets, a flute and horn, or two trumpets. It was
determ ined that timbre was a significant variable in the perception of
harmonic intervals, although the perception did not im prove for subjects

23
whose prim ary performance instrum ent was the same timbre as the
intervals heard.
In addition to the physical and acoustical properties of sounds, certain
physical and intellectual differences between listeners are directly related
to their perceived accuracy of pitch, the most mentioned being age and
experience. Petzold (1969), in an attempt to better understand ways in
which children respond to auditory sounds, examined children ages 6 to
12. He observed their overt responses to certain auditory presentations
and concluded that the development of auditory perception reaches a
plateau around the third grade, with significant changes occurring
between grades one and two. He also found that girls tended to
discriminate sounds better than boys.
In a study that related age and experience to frequency modulation,
Madsen, Edmonson, & Madsen (1969) tested 200 subjects across eight
groups (n =25 in each) which consisted of second graders, fifth graders,
eighth graders, eleventh graders, college junior non-music majors,
college junior music majors, graduate music students, and collegiate level
music faculty. Each subject heard 15 stimulus tones, 5 each from one of
three conditions. The pitch either increased at a rate of two cents per
second, decreased at the same rate, or remained the same. The maximum
cent deviation for the 30 second stimulus tone was p lus/m inus 50 cents.
Subjects were instructed to push an "off" switch when they detected a
change in pitch and to indicate the direction in which the pitch
modulated. Results showed that while the older groups were superior to
the younger ones at the task, the most accurate discrimination occurred
during the first five seconds of modulation, suggesting that pitch changes
can be detected within plus/m inus 10 cents of deviation. It was also

24
found, by examining the incorrect responses, that younger subjects chose
sharp more often while older subjects choose flat.
Other related research has found that while there are significant
differences due to age and grade level in pitch perception, subjects could
not accurately discriminate two pitches that deviated by less than
p lus/m inus two cents (Elliot, 1983). Subjects grades 6 through 12, and
practicing adult musicians listened to two successive tones and were
charged with determining if the second tone was higher, lower, or the
same as the first. Pitch differences in the second tone ranged from
p lus/m inus 2 cents to p lus/m inus 15 cents. Replicating previous
research, results showed that subjects discriminated flatness better than
sharpness and that pitch discrimination improved with age.
In another study (Parker, 1983), it was found that for a sample of
college aged violinists, pianists, and trombonists (N =60) the smallest
noticeable pitch deviation for harmonic intervals was around
p lus/m inus 20 cents. These findings differed somewhat from the earlier
findings by Madsen, Edmonson, & Madsen (1969), but were obtained
through different methods. In the study by Parker, subjects listened to 70
pairs of successive pure tones with the second tone varying upw ard in
increments of ten cents to a hundred. Subjects indicated whether they
had heard one tone (same) or two tones (different). Differences between
the three instrumental groups were not significant.
Concerning intervals, Zatorre and Halpern (1979) reported that
musicians were able to more accurately discriminate major thirds over
minor thirds in a task that included differentiating the two intervals from
one another as the cent distance was presented on a p lus/m inus 20 cent
continuum. Similar results were obtained by Killam, Lorton, & Schubert

25
(1975) as major thirds and octaves were most accurately identified while
m inor sixths and minor sevenths were the least accurately identified.
Other research in the area of perception by Geringer (1976) allowed
sixty graduate and undergraduate music students to adjust the pitch of a
variable speed tape recorder while listening to musical excerpts. Subjects
listened to ten orchestral excerpts of symphonic music and were asked to
adjust the pitch as precisely as possible according to their own preference.
Results indicated subjects tended to tune the excerpts in the direction of
sharpness and the m agnitude of deviation was greater when the tuning
was in a sharp direction.
Categorical Perception of Pitch
While an admirable musical performance is generally characterized
by the accurate rendition of written notes on a score, a certain degree of
variability is to be expected. Considering a single artist, there will be
variability among performances of the same work as well as variability
among identical pitches performed. Although the variability is often
m inute and undetectable by the human ear, musical sounds produced by
hum ans will very likely contain slight variations in am plitude, duration,
and pitch, as well as other less distinctive "fingerprints" of sound.
Essentially, identical pitches performed by a single individual will contain
physical and acoustical properties that are unique to each sound and
perhaps uncontrollable by the performer—that is—basic hum an flaws.
Seashore (1938) made extensive acoustic measurements derived from
the musical performances of many well-known artists of the time and
concluded that the musical ear is extremely generous and operates in a
subjectively interpretive manner. He further stated, "Compare this
principle for the various singers, and you will see that the m atter of

26
hearing pitch is largely a matter of conceptual hearing in terms of
conventional intervals." (p. 269).
Previous research has shown that musicians can acquire absolutely
anchored categories for intervals in a similar manner to phonemic
categories of speech (Siegel & Siegel, 1977a). It was also observed that
non-musicians had great difficulty identifying tonal intervals on an
absolute basis as proficiency at the task seems to be correlated with a
formidable am ount of training. Whether through rote m em orization or
mnemonic assistance, with adequate training most musicians obtain
some degree of relative pitch allowing them to accurately label musical
intervals.
Considering direction and magnitude, Seigel & Seigel (1977b) found
that musicians with strong relative pitch, as determined by their ability to
accurately identify melodic intervals, were highly inaccurate and
unreliable in detecting the differences between mistuned sharp and flat
versions of the same interval. Also they had a strong tendency to rate
m istuned intervals as in-tune. It has been shown that while musicians
w ith good relative pitch can accurately label tonal intervals, the categories
m ust have well-defined boundaries with little overlap between adjacent
categories.
The apparent inability to detect variations in interval size in certain
situations suggests that a phenomenon associated with the perception of
speech stimuli called "categorical perception" may be involved.
Categorical perception according to Harnad (1987) occurs when
continuous, variable, or somewhat confusing stimulation reaches the
sense organs and is sorted out by the mind into discrete, distinct categories
whose members somehow come to resemble one another more than they

27
resemble members of other categories. Researchers have concluded that
the perception of musical intervals may be equivalent to the perception of
speech sounds (Burns & Ward, 1978; Zatorre, R. J. & Halpern, A. R., 1979).
They observed that when equal step-size-discrimination tasks are used,
musical intervals are perceived categorically, whereas when variable step-
size-discrimination tasks are employed, a certain am ount of
discrimination training must occur before categorical perception can be
eliminated.
Performance of Pitch
Generally speaking, the aforementioned factors that significantly
affect hum an perception of pitch have been shown to be significantly
related to the intonation of pitch during performance. Among these
factors are timbre, age, and level of experience. Furthermore, additional
param eters shown to affect performance intonation include
accompaniment, interval size, and melodic direction, both scalar and
intervallic. As mentioned earlier, intonation or "in-tuneness" w ithin the
context of music is different from the act of tuning, both of which will be
considered in the following discussion.
For m ost professional orchestras, college level ensembles, and
am ateur instrum ental ensembles of all sizes, a tuning process usually
takes place before the start of a rehearsal or performance. This can consist
of a single instrument, such as the oboe, sounding a reference pitch,
usually A = 440Hz., to which each member of the ensemble attem pts to
match exactly in terms of frequency. Wind instrum entalists norm ally
tune a single pitch while string instrumentalists tune multiple pitches
and usually do so while referring to a single pitch. The remaining strings

28
are tuned by their relationship to a reference pitch with the proper ratio
aurally determined by the player.
Tuning may also consist of an instrumentalist playing certain pitches
while viewing a tuner, an electronic device that produces a visual
representation of the directional deviation from equal tem peram ent for
any pitch. Also many electronic tuning devices produce a sustained
reference pitch to which an instrumentalist can tune, either
sim ultaneously or successively, that is, adjusting the pitch of the
instrum ent while the reference tone is sounding or immediately
following it. For an ensemble, once each instrum ent has been properly
tuned, the blend of frequency relationships produced by the different
instrum ental timbres should produce harmonious sounds according to
cultural and mathematical influences as well as individual subjective
decisions.
In an investigation regarding tuning procedures, Corso (1954) enlisted
five instrumentalists to tune to one of five different timbres: (1) a square
wave; (2) a sine wave; (3) a sawtooth wave; (4) a piano; and (5) a half-sine
wave. He found that musically trained subjects tuned equally well to all
stimuli. Corso also investigated possible differences in tuning accuracy
due to the method of tuning, either simultaneously or successively and
concluded there were no differences. Cassidy (1989) examined possible
effects on tuning due to timbre differences of the reference pitch. Twenty
high school flutists and clarinetists (n =10 each) tuned their instrum ents
while playing nine pitches of differing timbres and octave placement.
The three different timbres were a sine wave, a square wave and a
sawtooth wave which were presented in unison, an octave higher, or an
octave lower. Results indicated significant differences between

29
instrum ent types as clarinetists tuned more accurately than flutists.
There was also a significant interaction between the pitch timbre and the
octave displacement, as the most accurate tunings occurred when the
reference pitch timbre was that of a sine or square wave and was an
octave below the tuning pitch. The sawtooth wave was the most
accurately tuned to when it was presented as a unison. The least accurate
responses were given when the reference pitch was presented an octave
above the tuning pitch.
While Corso (1954) and Cassidy (1989) found that when tuning to a
single pitch during a tuning task, timbre does not affect tuning accuracy,
other research suggested that timbral differences affect intonation
accuracy in a musical context. Greer (1970) tested 32 graduate and
undergraduate brass players by having them attempt to perform in-tune
with recorded combinations of selected scalar patterns with varying
timbres. The timbres of the target recordings consisted of an oscillator, an
organ, a piano, and each subjects' own instrument type. Findings
indicated a significant difference between subjects' ability to perform in
tune for the different timbres with the oscillator tone being the most
difficult. It was also observed that subjects performed with more accurate
intonation when they played with a timbre similar to their instrument.
Swaffield (1974) suggested that the parameters of timbre and intensity
affect fine-tuning responses in a melodic context. He m easured the
responses of 25 undergraduate music students to 108 prerecorded items
across four instrumental timbres, three loudness levels, and three tone
durations. Following a four-note ascending tetrachord, dom inant to
tonic, subjects tuned the pitch of a variable speed tape recorder. The
prerecorded items were presented at 0 cent deviation or p lus/m inus

30
20 cents deviation. Results showed differences among timbres as subjects
tuned most accurately to a horn timbre and least accurately to a violin
timbre. Swaffield also found that a decrease in tuning accuracy occurred
with an increase in both intensity and duration when the target pitch was
twenty cents below standard and an increase occurred in tuning accuracy
with an increase in intensity when the target pitch was twenty cents
above standard. It was also observed that tunings were most accurate
when the pitch was unaltered.
In attem pt to understand tuning practices of inexperienced
musicians, Yarbrough, Karrick, & Morrison (1993) examined 194 young
wind instrumentalists across four groups ranging from one to four years
of instrum ental instruction. Subjects were asked to complete two tuning
tasks consisting of a simple task and a complex task. The simple task
required subjects to manipulate the pitch of a sustained electronic tone
until it matched the pitch of a prerecorded stimulus, while the complex
task required subjects to do the same while performing on their regular
instrum ent. Additionally, one-third of the subjects (n = 62) were
informed that they would begin both tasks from above the target pitch
and one-third (n =64) were told they would begin from below the target
pitch. The remaining third (n = 71) were given no prior instructions
regarding their initial direction of mistuning. Absolute deviation scores
for the simple and complex tasks were compared and it was found that
only years of instruction affected subjects' tuning accuracy, with
significant differences between subjects in the first and third year, first and
fourth year, second and third year, and second and fourth year.
Considering direction of error for both tasks, it was observed that subjects
who tuned from above the pitch tended to deviate in a sharp direction
31
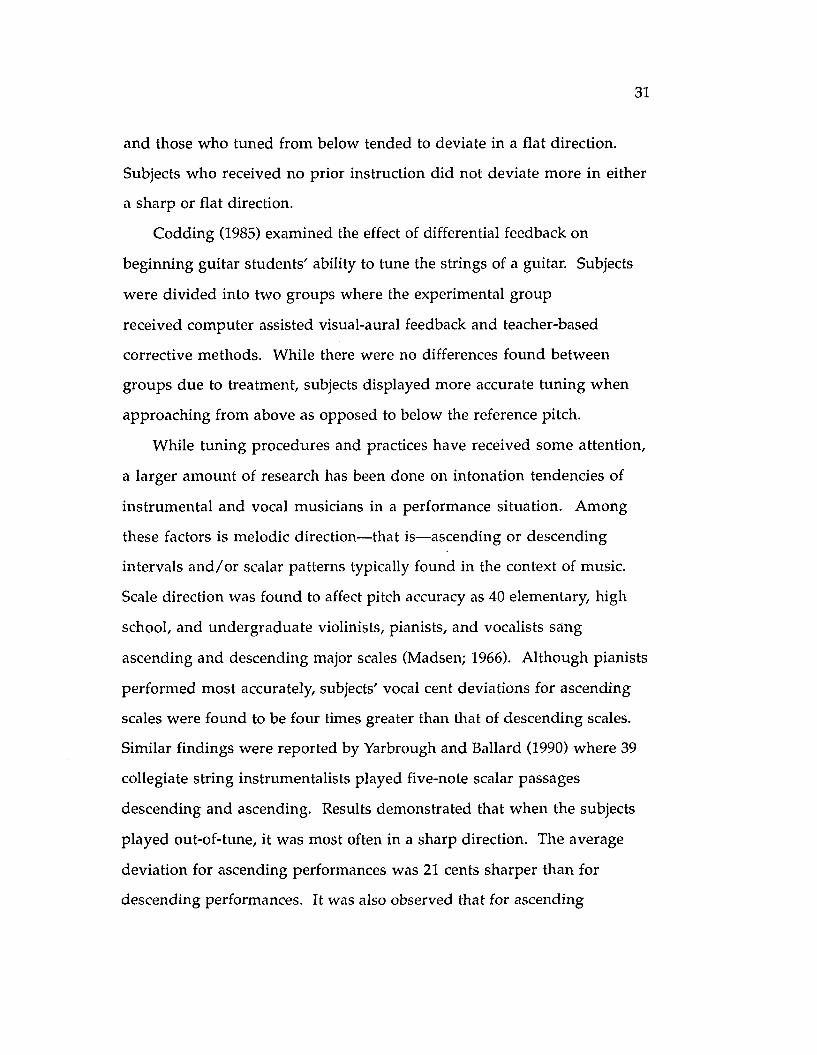
and those who tuned from below tended to deviate in a flat direction.
Subjects who received no prior instruction did not deviate more in either
a sharp or flat direction.
Codding (1985) examined the effect of differential feedback on
beginning guitar students' ability to tune the strings of a guitar. Subjects
were divided into two groups where the experimental group
received computer assisted visual-aural feedback and teacher-based
corrective methods. While there were no differences found between
groups due to treatment, subjects displayed more accurate tuning when
approaching from above as opposed to below the reference pitch.
While tuning procedures and practices have received some attention,
a larger am ount of research has been done on intonation tendencies of
instrum ental and vocal musicians in a performance situation. Among
these factors is melodic direction—that is—ascending or descending
intervals a n d /o r scalar patterns typically found in the context of music.
Scale direction was found to affect pitch accuracy as 40 elementary, high
school, and undergraduate violinists, pianists, and vocalists sang
ascending and descending major scales (Madsen; 1966). Although pianists
perform ed most accurately, subjects' vocal cent deviations for ascending
scales were found to be four times greater than that of descending scales.
Similar findings were reported by Yarbrough and Ballard (1990) where 39
collegiate string instrumentalists played five-note scalar passages
descending and ascending. Results demonstrated that when the subjects
played out-of-tune, it was most often in a sharp direction. The average
deviation for ascending performances was 21 cents sharper than for
descending performances. It was also observed that for ascending

32
intervals, half-steps and whole-steps were slightly smaller than for
descending intervals.
Similar results were obtained in a study by Duke (1985) where 48
junior high school, high school and college undergraduate wind
instrum entalists performed both melodic and harmonic ascending and
descending intervals. It was concluded that direction affected intonation
accuracy as intervals tended to expand when performed descending and
contract when performed ascending. There were also differences due to
age and experience as college undergraduates performed flat from equal
tem peram ent while junior high school subjects performed sharp.
Edmonson (1972) investigated the effect of intervallic direction on the
pitch accuracy of 40 college musicians consisting of string, brass,
woodwind, and keyboard instrumentalists, and vocalists. Subjects
viewed the notation of the interval, received the starting pitch, and then
sang the interval unaccompanied. Results indicated that subjects sang
ascending intervals with greater pitch accuracy than descending, a result
contrary to previously mentioned studies (Madsen, 1966; Yarbrough &
Ballard, 1990). An interaction was also discovered between interval and
direction, as it was observed that the descending major sixth was sung
three times more out of tune than the next most out of tune interval. An
examination of 48 collegiate and professional string instrum entalists
resulted in similar findings in regard to direction of melodic movement
(Sogin, 1989). It was found that subjects performed descending
tetrachords significantly sharper than ascending ones and had a tendency
to deviate in a sharp direction during sustained tones.
Another area of intonation research within a performance context
concerns the effects of accompaniment. Geringer (1978) obtained data

33
from 96 college musicians performing accompanied and unaccompanied
ascending scales. After each performance (accompanied and
unaccompanied) was recorded, it was played back to subjects and they
were allowed to adjust the pitch. Results indicated that unaccompanied
scales were less accurate than accompanied scales and that subjects
deviated most often in a sharp direction. Also the intonation of subjects'
adjusted recordings of scales was significantly sharper and less accurate
than the unadjusted performances. In an attem pt to isolate the effects of
accompaniment on vocal pitch-matching accuracy, Vorce (1964) had
college music majors sing two pitches both accompanied and
unaccompanied. Similar to the findings of Geringer (1978) there was a
significant difference between performances in that accompanied
performances were more accurate than unaccompanied performances.
Kantorski (1986) examined the effects of different accompaniment
conditions on the intonation of string instrum entalists perform ing in
upper and lower registers. Subjects (N = 48) were collegiate string
instrum entalists who performed ascending and descending whole-step
tetrachords with four different computer generated accompaniments.
The accompaniments consisted of unison, two octave displacement,
thirds, and two octaves plus thirds. Subjects performed most accurately to
the unison accompaniments and least accurately to the thirds
accompaniment. While there was a propensity to play sharp in both
registers, absolute deviation means were larger for the upper register
performances with a significant interaction between register and
accompaniment. There was also a significant difference in the means of
the directional performances with descending tetrachords played

34
sharper. These findings were similar to those of Edmonson (1972) and
Sogin (1989) but different from those of Madsen (1966 & 1974).
Papich & Rainbow (1974) studied 17 collegiate string instrumentalists
performing identical excerpts in unison and solo. They found that solo
performances were sharper than ensemble performances and that error
adjustments during ensemble performance were in a dow nw ard
direction.
A preference for sharp intonation was demonstrated by 120 high
school, collegiate, and professional string instrumentalists during a
tuning process that included matching an A = 440Hz., an A 25 cents sharp,
and one 15 cents flat (Geringer & Witt; 1985). There was less overall cent
deviation from the sharp stimulus as subjects performed below the sharp
tuning pitch and above both the flat and in-tune tuning pitch. There was
a significant difference in age as the college and professional subjects
tuned significantly sharper than the high school subjects. Subjects were
also asked to describe the intonation of the stimuli in terms of sharp, flat,
or in-tune. It was observed that subjects' verbal judgments did not
correspond to their performances and most subjects judged the pitches as
flat.
In an investigation of subjects' preferences for intonation in relation
to tone quality, Madsen & Geringer (1976) found a preference for sharp
accompaniments over in-tune or flat accompaniments and that subjects
dem onstrated no preferences between good and bad tone quality. The
song, Twinkle, Twinkle Little Star, was recorded several times by a
professional trumpeter. The performances with the best and worst tone
quality were used as stimuli. Added to both the good and bad tone quality
performances were three electronic keyboard accompaniments which

35
were either in-tune, 25 cents flat, or 50 cents sharp. Although subjects
discriminated between good and bad tone quality during unaccompanied
performances, they did not when the performances were accompanied.
Furthermore, sharp accompaniments were preferred over the flat and
in-tune accompaniments, even when the trum pet tone quality was poor.
A study by Madsen & Geringer (1981) presented 24 flute/oboe duets
representing 12 conditions that varied according to good or bad tone
quality and were performed either in-tune or with one instrum ent 50
cents sharp in comparison to another. Subjects (240 musicians and 240
non-musicians) listened to the duets and were asked to determ ine any
noticeable differences in perception of tone quality and intonation.
Musicians appeared to make more correct discriminations than non
musicians, for intonation trials. Furthermore, subjects perceived
m istuned performances as being flat more often than sharp even though
there were no flat performances. Intonation response categories
contained a significantly greater proportion of errors than tone quality
categories.
An additional study by Madsen & Flowers (1981/1982) examined 40
graduate and undergraduate music majors' responses to recorded
flute/oboe duets that were in-tune, oboe sharp to flute, and flute sharp to
oboe. In addition to the tuning conditions, tone quality errors were
inserted into the performances. Subjects were encouraged to m anipulate
the pitch of each trial performance and asked whether their
manipulations changed the quality of performance for the better or worse
or if it stayed the same, while in actuality their adjustments increased the
pitch of both flute and oboe equally. Findings concluded that subjects
adjusted the pitch in the direction of sharpness when the oboe was sharp

36
to the flute more so than when the flute was sharp to the oboe and
reported that for out-of-tune performances the adjustments they made
positively affected the quality of the performance.
Throughout much of the literature related to tuning performance,
perception, and discrimination there existed a propensity toward sharp
intonation (Geringer, 1978; Geringer & Witt, 1985; Kantorski, 1986;
Madsen, 1974; Madsen, Edmonson, & Madsen, 1969; Mason, 1960; Papich
& Rainbow, 1974; Salzberg, 1980; Small, 1937; Sogin, 1989; Yarbrough &
Ballard, 1990). It has also been documented that subjects discriminated
flatness better than sharpness (Elliot, 1983; Wapnick & Freeman, 1980).
A particularly interesting line of research has examined the tuning
and intonation tendencies of instrumental solo and ensemble
performances in regard to intervallic relationships within a melodic
context. These studies, although antiquated and few in number, have
attem pted to determine whether certain performed intervals are enlarged
or contracted as compared with their theoretical values derived from the
equal tempered, just, or Pythagorean tuning systems.
Greene (1936) analyzed solo performances of six professional
violinists performing three unaccompanied excerpts based on the
distribution of intervals, frequencies, and tempo. Performances were
recorded on film using an oscillographic technique which facilitated
calculations to derive the average frequencies of the fundam ental of each
pitch. Each frequency was compared to the previous and subsequent pitch
within its melodic context and the interval size, in cents, was calculated
and compared to the theoretical values of Pythagorean, equal tem pered
and just tuning. Based upon the average intervallic cent distances of all
six performers, Greene observed that major seconds and thirds tended to

37
be enlarged and minor seconds and thirds tended to be contracted
regardless of the direction, ascending or descending. He also concluded
that for all four intervals, the directional cent deviation was greatest
when compared to just tuning and smallest when compared to
Pythagorean tuning. These tendencies were consistent among subjects
and performed excerpts.
In 1949, Nickerson expanded the Greene (1936) study by examining
both the solo and ensemble performances of six experienced string
quartets. Excerpts were chosen from a Haydn string quartet and
comprised four variations in which the melody was given to each of the
four instrum ents within the same harmonic setting. Solo and ensemble
recordings were made of each subject where a sample of single tones was
re-recorded onto sound loops of 16-mm sound film. A sound loop could
be made to sound continuously until estimates of the frequency were
made with a chromatic stroboscope. Frequencies of the sampled pitches
were converted to intervallic cent distance and compared to equal
tempered, just, and Pythagorean intonations. Results indicated that solo
and ensemble performances varied significantly only for major thirds.
The num ber of significant differences was at a minimum when solo and
ensemble intervallic performances were compared to Pythagorean
intonation and at a maximum when compared to just intonation.
Nickerson concluded that these performers did not completely conform
to any of the three studied tuning systems, but more closely approached
Pythagorean intonation. His findings were similar to those of Greene
(1936).
In an attempt to study the intonational patterns of wind
instrumentalists, Mason (1960) examined the solo and ensemble
38
performances of members of two woodwind quintets. The
instrum entation of each group was flute, oboe, clarinet, horn, and
bassoon. Of the two groups, one consisted of faculty members, most of
whom had extensive training and professional experience, while the
other group consisted of students with limited professional experience.
Following a careful tuning, subjects were recorded first individually, then
as an ensemble. For each of the five ensemble recordings, a different
member of the quintet was recorded by placing a microphone closer to
that performer. Samples of pitches were isolated on tape loops and
analyzed with a stroboscope, resulting in plus or minus cent
deviations. Melodic interval comparisons of pitches from the same
player were then made between solo and ensemble performances in equal
tempered, just and Pythagorean intonation systems. Results indicated
that performers tended to play sharp with few consistent patterns of
differences between solo and ensemble playing. Similar to the Greene
(1936) and Nickerson (1949) studies, the performers deviated most from
just intonation. However, there were differences between the groups, as
the professional quintet deviated least from equal tem perament and the
student ensemble deviated least from Pythagorean tuning.
There is very little empirical evidence that supports any theories that
musicians prefer and perform in a specific tuning system. In 1974, Ostling
summ arized the findings of research and articles related to intonation
and three tuning systems—equal tempered, Pythagorean, and just. The
studies by Greene (1936), Nickerson (1949), and Mason (1960) although
somewhat dated, were among the first efforts that attempted to
empirically explain the tuning tendencies of performing instrum entalists
w ith regard to tuning systems. The results of these studies were

39
som ew hat similar by concluding that the musicians tended to deviate
least from Pythagorean tuning. However, a preference study by Branning
(1967) revealed that for harmonic intervals, subjects, w hen choosing
between Pythagorean and just tunings, preferred intervals tuned in the
just system. Williamson (1942) raised many questions relating to the
intonation patterns that occur during the performance of music. He
questioned whether one standard of intonation fits all types of music for
all performance settings. He suggested that there are inherent tuning
problems among instruments and that perhaps unaccompanied string
and vocal groups produce more in-tune music.
From the previous discussion it should be apparent that pitch-
matching, tuning accuracy, and intonation have been the focal point of a
w ealth of research and continue to be primary areas of concern to
musicians of all levels and specialties. Prior investigation has shown that
there are many factors that affect the vocal pitch-matching accuracy and
singing ability of children. Among these are age/experience, presentation
model, vibrato, accompaniment, performance context and training
techniques. While many of these variables have a similar affect on the
intonation of instrumentalists, additional factors found to influence
tuning accuracy during performance are timbre, intensity, interval size,
and melodic and intervallic direction.
Throughout the literature a proclivity toward sharp intonation has
continually and consistently been observed. Research has shown that
w hen people perform out-of-tune it is most often in a sharp direction.
Related to this forbearance of sharpness is the observation that flatness is
more accurately discriminated than sharpness and that m istuned pitch

40
relationships that deviate in a sharp direction are more often perceived as
in-tune than flat mistunings.
Some research has been done in the area of minimum perceivable
deviation for unison and harmonized pitches. Results tend to differ, with
the observed range of noticeable deviation being from from 5 to 20 cents.
Investigators have suggested that musicians do not accurately
discriminate intervals that deviate by as much as 20 cents but perceive
m istuned intervals categorically and accept a variety of tunings within
the general area of each interval. Related to intervallic tuning are the
questions of performance and preference of tuning system. Although
supported by little evidence, it has been suggested that instrumentalists
perform ing melodic intervals tend to deviate least from the Pythagorean
tuning system but do not completely adhere to any system of tuning.
This body of research has attempted to unlock the mysteries of tuning and
intonation, yet, results from study to study remain inconsistent and
inconclusive.
Purpose of Study
Like so many studies that address tuning issues, those by Greene
(1936), Nickerson (1949), and Mason (1960) suffer from a lack of precision
in measurem ent and forbidding limitations of equipment. However, due
to current technology and computer software, some of these limitations
can be overcome. The purpose of the present study was to examine
performance patterns of advanced wind instrumentalists with regard to
harmonic intervallic tuning. Subject performances were recorded and
analyzed with precise computer analysis. Of particular interest was the
examination of certain performed intervals, each compared to equal
tempered, just, and Pythagorean tuning systems. Also of interest were

41
possible differences in the harmonic intonation and the direction of
deviation for intervals performed both above and below a stimulus
w ithin a tonal musical context. Specific questions addressed were:
1. D o w in d p layers perform harmonic in tervals w i th an
a pprox im ation tow ard either equal tem peram en t, ju s t , or
P yth a g o rea n tu n in g ?
2. A re in te rva ls tuned the same or d ifferen tly w hen p layed above or
below a referentia l s t im u lu s?
3. A re there tu n in g differences am ong var iou s in te rva ls?
4. D o w in d in s tru m en ta lis ts tend to tune certain in terva ls sharp or
f la t in relation to equal tem peram ent?
5. A re there differences between advanced s tu d e n ts and
professionals in regard to tun in g?
Terminology Used in Study
Absolute dev iation— The magnitude of cent deviation disregarding
the direction of mistuning.
C e n t— The unit of measurement which represents 1/100 of an equal
tempered semitone where there are 12 equal semitones in an
octave.
Cent deviation — The difference in cents between a performed
interval and approximately the same interval in equal
tem peram ent.
Directional dev iation— The direction, sharp or flat, of deviation
from equal temperament disregarding the magnitude.
Harm onic in tonation— The cent distance between two pitches that
sound simultaneously.

42
In -tune — The performance of an interval(s) whose cent distance
closely approximates the corresponding value(s) of equal
tem peram ent.
Melodic intonation — The cent distance between two pitches that
sound successively.
Stimulus and stim ulus pitch — A prerecorded, synthesized
musical line calibrated to standard tuning (A = 440 Hz.).
Tuning system s— (1) Equal tempered tuning - A system of tuning
where the octave is divided into 12, equally spaced, half-steps of
100 cents each. (2) Just tuning - A system of tuning based on
intervallic ratios that produce pure (beatless) tunings.
(3) Pythagorean tuning - A system of tuning based on pure fifths
and octaves.
Table 1 shows the directional cent deviation from equal temperament
for the just and Pythagorean tuning systems (Dodge, 1985; Helmholtz,
1930; & Pierce, 1983).

43
Table 1Directional Cent Deviation from Equal Temperament for the Pythagoreanand Tust Tuning Systems
Interval E. T. cents Pythagorean Just
m2 100 -10 +12
M2 200 +4 +4
m3 300 -6 +16
M3 400 +8 -14
P4 500 -2 -2
A4 600 -12 -10
d5 600 +12 +10
P5 700 +2 +2
m6 800 -8 +14
M6 900 +6 -16
m7 1000 -4 +18
M7 1100 +9 -12
P8 1200
m = minor M = major A = augmented d = diminished P = perfect

METHOD
Subjects
Subjects for this study included 18 wind instrum entalists comprising
two groups. The first group consisted of nine professionals who had
distinguished themselves as outstanding performers, having perform ed
in professional musical organizations a n d /o r as members of a university
faculty where their primary responsibility was to teach applied lessons on
their respective instruments. Of the nine subjects in the professional
group, seven were faculty members at a large school of music in a major
southern university, and all nine were, at the time of the study, currently
performing in a professional ensemble. The second group consisted of
nine advanced music students who had shown excellence in performance
by serving as principal players in a large performing ensemble at a major
school of music. The student group ranged from undergraduate to
doctoral students.
The sample included two performers each on flute, oboe, bassoon,
soprano clarinet, alto saxophone, trumpet, horn, trombone, and tuba.
Because of technical problems encountered with the subsequent
computer analysis phase of this study, information was obtained for only
sixteen of the original eighteen subjects, reducing the num ber in each
group by one. Demographic information including age and experience
was collected at the onset along with each subject7s personal preference
regarding tuning systems and intervallic tuning, both melodically and
harmonically (see Figure 1). The mean age of the professional group was
40.1 years with a mean of 18.9 years of professional performing
experience. The mean age of the student group was 25.2 years w ith a
mean of 4.4 years of professional performing experience. Professional
44

45
1. W hat system of tuning do you prefer for harmonic tuning?
a. Pythagoreanb. Justc. Meand. Equal tempered
2. W hat system of tuning do you prefer for melodic tuning?
a. Pythagoreanb. Justc. Meand. Equal tempered
3. When placed above a pitch and in relationship to the equal tempered system, do you prefer to play the following:
a. sharp b. flat c. tuned to equal tem peram ent
minor 3rd ___ minor 6th major 3rd ___ major 6th perfect 4th minor 7th perfect 5th leading tone
Figure 1. Questionnaire regarding tuning preference.
performing experience was represented by the total number of years the
subject had received payment for performing on their instrum ent which
ranged from playing with a regularly performing ensemble to occasional
free lance playing.
Musical Example
An adaptation of the chorale O H aupt voll Blut und W unden (O
Sacred Head Now Wounded) by J.S. Bach was used in this study (see
Appendix A). This selection was on a level of difficulty that presented
minimal technical challenge to the subjects. Specifically, all pitches of the
chorale fall within the range of an eleventh and in a comfortable
46
tessitura; the rhythm is mostly quarter note values with two eighth notes,
three half notes, and three dotted-half notes; and the performance tempo
is approximately quarter note equal to one second. Finally, the chorale is
tonal and includes a variety of intervallic relationships.
The harmonic intervals of primary interest to this study were minor
thirds, major thirds, minor sixths, and major sixths. In order to eliminate
multiple intervallic relationships caused by a typical four-part chord, each
pitch of the chorale melody was harmonized with only one other pitch,
resulting in one harmonic interval per note. Since Bach created
num erous four-part harmonizations of O H aupt voll Blut und W unden.
a two-voice reduction was made by combining elements the of two
chorale harmonizations, numbers 21 and 80. By using selected alto, tenor,
and bass voices of both harmonizations, each interval to be examined
appeared with at least three different sets of pitch classes. The two-voice
combined version of the chorale included, among other intervals, five
different minor thirds, four different major thirds, four different minor
sixths, and three different major sixths.
From the musical example, five major thirds, five m inor thirds, five
major sixths, and five minor sixths were selected as target intervals.
These included all the varieties (pitch classes) of each third and sixth and
included those that represented cadence points within the musical
example. In addition, one each of the perfect intervals, fourth, fifth,
unison, and octave, was also included and used as comparative data.
Therefore, there was a total of 24 target intervals chosen prior to the
experiment and compared during the subsequent analysis.
Ultimately subjects were asked to perform both lines (the melody
with a synthesized harmony line and the harmony line w ith synthesized

47
melody). The intervals created when performing the melody were
formed from above the synthesized stimulus voice. The intervals created
w hen performing the harm ony line were formed from below the
synthesized stimulus voice.
Procedure
Each subject was greeted as they entered a small, acoustically
sufficient recording chamber with proper ventilation, adequate lighting,
and a stable temperature of 74°F. Because they were recorded while
playing along with a prerecorded stimulus, each subject wore a pair of
Realistic LV-20 stereo headphones. Once the headphones were secure,
each subject played a brief warm up of h is/her choice during which the
experimenter positioned the microphone, set the recording input and
output levels for a satisfactory signal to noise ratio, and adjusted the
volume of the headphones according to subject preference.
Immediately following the warm up period, subjects were asked to
tune their instruments to A = 440 Hz. (heard through the headphones)
until they were accurate according to a Korg DTM-12 digital chromatic
tuner being viewed by the experimenter. For all subjects the tuning
stimulus replicated the timbre of an oboe. All sounds used in this project
were generated by an Ensoniq VFX-SD Music Production synthesizer and
were recorded onto and played back from a Tascam 112 variable speed
stereo cassette tape recorder. The tuning stimulus was presented at A =
440Hz. w ithout vibrato, calibrated for accuracy by viewing the Korg
DTM-12 tuner and making slight adjustments of pitch on the Tascam 112.
At this time, further adjustments in volume were m ade according to the
individual preferences of each subject. After the intial tuning subjects
48
performed a single melody as a duet in harmony with the synthesized
second voice that was prerecorded. For the subjects performing on
woodwind instruments, the second voice replicated the timbre of an
oboe. For the subjects performing on brass instruments, the second voice
replicated the timbre of a trumpet. Through headphones, subjects heard a
balanced stereo mix of their sound and the stimulus tape at a comfortable
volume; further adjustments in volume were made following the initial
tuning according to the individual preferences of each subject.
For each experimental session the referential stim ulus frequency of
440 Hz. was recorded in addition to each subjects' tuning procedure. Both
pitches were later analyzed to ensure the accuracy of the tuning. All
performances were recorded through an AKG CS1000 microphone onto
the left channel of a Panasonic SV-3700 professional digital audio tape
deck (DAT), while the stimulus played from the variable speed cassette
deck was simultaneously recorded onto the right channel. All signals
were mixed through a Fostex 450 mixer and recorded onto Fuji,
R-90P DAT cassette tape.
Recording
Prior to the recording and following the tuning, subjects were given
the score of the two-part chorale, correctly transposed for their
instrument. Instructions and verbal inducement to play in-tune preceded
each recording session and consisted of the following prerecorded
directions:
For this recording please play line A with no vibrato as in-tune as possible with line B. After you have finished, the recording will be played back to you. If you are not completely satisfied with your

49
performance, specifically regarding intonation, you will be allowed to re-record the example until you feel you were in-tune. Begin after the seven preparatory clicks which will be given in tempo.
Lines A and B referred to the melody and adapted harmony, respectively.
Subjects were permitted to mark the score at anytime during the task if
they thought marking would aid them in "in-tune" performance.
Immediately following the successful performance of line A, each subject
repeated the procedure, this time performing line B. The recorded
instructions continued as follows:
For this recording please play line B with no vibrato as in-tune as possible with line A. After you have finished, the recording will be played back to you. If you are not completely satisfied with your performance, specifically regarding intonation, you will be allowed to re-record the example until you feel you were in-tune. Begin after the seven preparatory clicks which will be given in tempo.
As stipulated in the verbal instructions, subjects were encouraged to
repeat the process for either or both lines as many times as they felt
necessary. Immediately following each recording, subjects were given the
opportunity to listen to the playback. All subjects initially recorded line
A, however, for subsequent recordings they were allowed to record either
line A or B in any desired order. Subjects were allowed to listen to any of
their previous recordings at any time during the experiment. The intent
was to record and select at least one performance of each line that the
subject felt represented an "in-tune" performance.
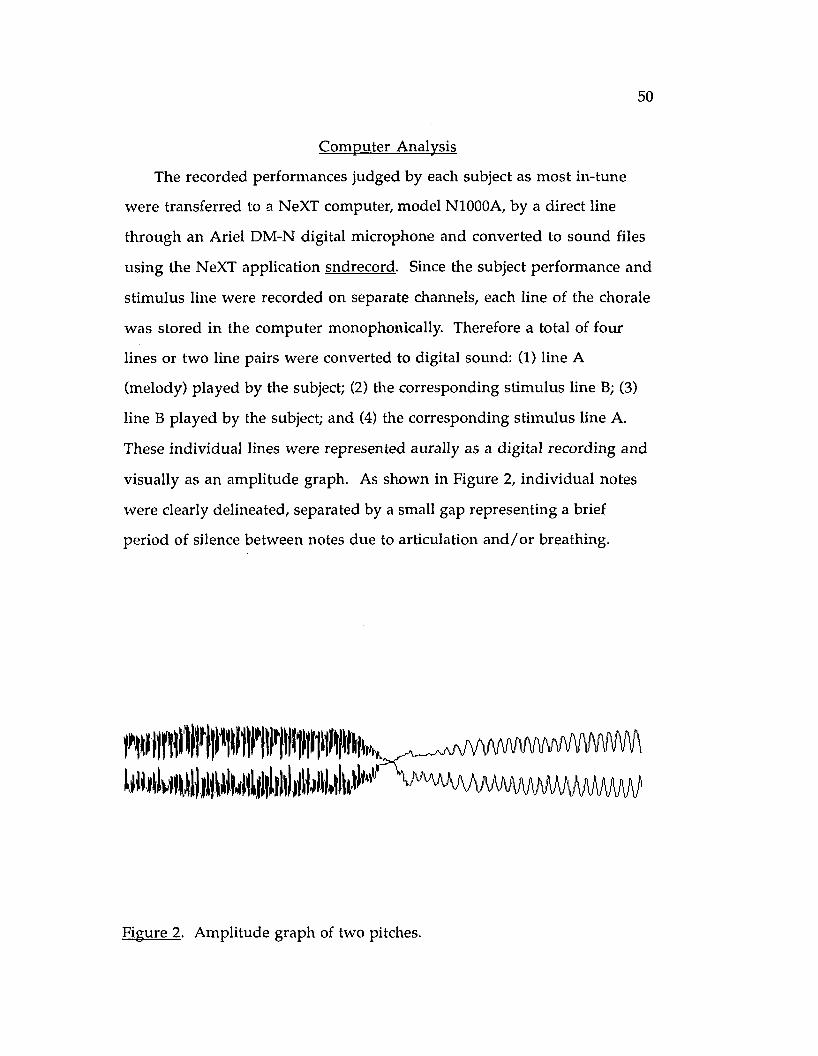
50
Com puter Analysis
The recorded performances judged by each subject as m ost in-tune
were transferred to a NeXT computer, model N1000A, by a direct line
through an Ariel DM-N digital microphone and converted to sound files
using the NeXT application sndrecord. Since the subject performance and
stimulus line were recorded on separate channels, each line of the chorale
was stored in the computer monophonically. Therefore a total of four
lines or two line pairs were converted to digital sound: (1) line A
(melody) played by the subject; (2) the corresponding stimulus line B; (3)
line B played by the subject; and (4) the corresponding stim ulus line A.
These individual lines were represented aurally as a digital recording and
visually as an am plitude graph. As shown in Figure 2, individual notes
were clearly delineated, separated by a small gap representing a brief
period of silence between notes due to articulation a n d /o r breathing.
wiiniiflW
Figure 2. Amplitude graph of two pitches.
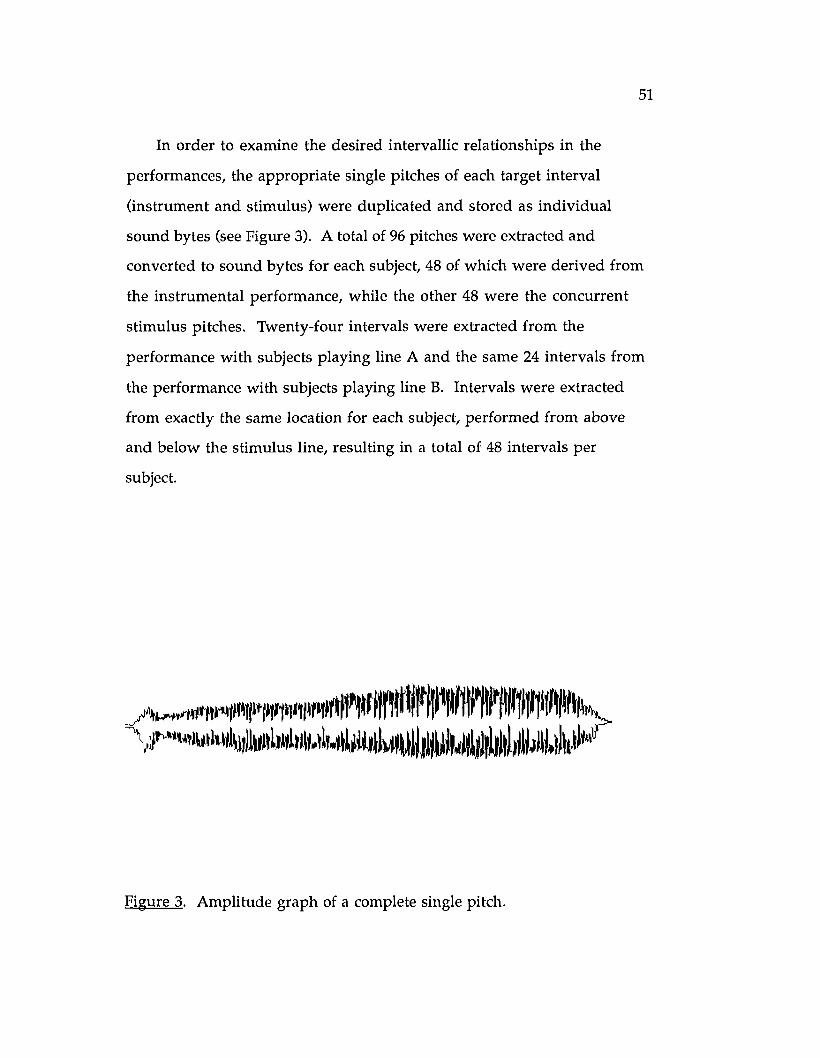
51
In order to examine the desired intervallic relationships in the
performances, the appropriate single pitches of each target interval
(instrum ent and stimulus) were duplicated and stored as individual
sound bytes (see Figure 3). A total of 96 pitches were extracted and
converted to sound bytes for each subject, 48 of which were derived from
the instrum ental performance, while the other 48 were the concurrent
stimulus pitches. Twenty-four intervals were extracted from the
performance with subjects playing line A and the same 24 intervals from
the performance with subjects playing line B. Intervals were extracted
from exactly the same location for each subject, performed from above
and below the stimulus line, resulting in a total of 48 intervals per
subject.
„ — v
\j/w rik iJuiiLiuUik jlulhJ I ill m lli .DliJi M ilil *|J >111 Jh kV
Figure 3. Amplitude graph of a complete single pitch.

52
Once a tone had been recorded, digitized, and stored in a computer
sound file, its frequency was determined through the process of linear
predictive coding (LPC). By analyzing successive segments of the signal, it
was possible to derive the fundamental frequency based upon the
resulting spectrum. Each sampled segment was used to predict the
signal envelope, or the shape, according to its attack, steady-state, and
decay.
The frequency of each individual sound byte was determ ined by
using the linear predictive coding application for the NeXT computer,
LPC View. The computer sampling rate was approximately 100 times per
second which resulted in approximately 90 - 100 frequency readings for
each quarter note value. From LPC View, the pitch frequency was
converted to a text file which displayed the frequency to three decimal
places and appeared as a column of approximately 90 - 100 frames. This
data was stored on a floppy disk and imported into a Macintosh computer
and the application StatView 512+.
A sustained tone produced by even the most expert of wind
instrum entalists will undoubtedly contain minute flaws in regards to
frequency caused by slight muscular fluctuations in the diaphragm and
embouchure as well as other related muscles. These become even more
apparent when the tone is placed under the close scrutiny of the
computer analysis as described above. During the course of a sustained
note, variation in amplitude and frequency normally occur at the
beginning and end of the tone. Figure 4 shows a frequency bar chart for
the pitch represented in Figure 3. Notice the variability in frequency at
the beginning of the pitch and the slight drop at the end. The common
terms used when referring to this basic acoustic principle are

53
475
472.5 470
467.5
465§ 462.5Sof 460£
457.5
455
452.5 450
447.5
Figure 4. Bar chart representing frequency across time for a single pitch.
attack (rise) and decay (fall). The more stable middle part of a tone is
referred to as the steady-state and the combination of the three factors
constitute the envelope or shape of the variation of a tone (Dodge, 1985).
Determining precisely where the steady-state of a tone begins is not a
function of the computer, but was decided by viewing a bar chart of the
frequency values for each pitch and removing the unstable beginning and
ending frames. Generally the first 20 and the last 10 frames were deleted
from each pitch's text file leaving the more stable middle section of the
pitch indicated within the dashed lines in Figure 4. After eliminating the
attack and decay, a mean frequency was calculated for each pitch.
Conversion of Frequencies to Cents
The means of the stimulus tones and the subjects' perform ed tones
were converted to a ratio where it was then possible to determine the
actual w idth of each interval. The width in cents of each interval, that is,
the distance between the subjects' performed pitch in relation to the
corresponding stimulus pitch, was determined by applying the formula:

54
[1200/log2 (logR)] (Backus, 1969). The frequency ratio, R, was determ ined
by dividing the mean of the higher frequency by the mean of the lower
frequency. Applying this formula to the ratio of the two mean
frequencies resulted in an intervallic distance represented in cents.
Once the cent distances of the intervals as performed in this study
were determ ined, each interval was compared to the intervallic cent
distances of the equal tempered, just and Pythagorean tuning systems as
shown in Table 2.
Table 2Width in Cents of Intervals in Equal Tempered, Pythagorean, and Tust Tunings
Interval Equal temp. Pythagorean Just
m3 300 294 316
M3 400 408 386
P4 500 498 498
P5 700 502 502
m6 800 792 814
M6 900 906 884
P8 1200 1200 1200
m = minor M = major P = perfect
For example, if the performed width of a major third was 405 cents, the
difference between a major third in equal temperament, or 400 cents,

55
resulted in a cent deviation score of 5 cents sharp. Similarly, this major
third compared to the just system would result in a cent deviation score
of +19 cents; and when compared to a Pythagorean major third the
difference would be -3 cents.
Thus, each interval size was compared to the three tuning systems
resulting in three deviation scores per interval. Since 48 intervals for
each subject were extracted, 24 above the stimulus and 24 below, a total of
144 deviation scores for each subject were obtained, 48 for each of the
three tuning systems being studied (see Appendix B for the complete data
set). The deviation scores from each tuning system were then subjected
to analysis and descriptive comparisons. In addition, for each subject the
num ber of sharp and flat responses as deviating from equal temperament
were counted and compared.
Limitations
As mentioned earlier there were technical problems with computer
analysis of certain signals. Specifically, the LPC View software could not
reliably analyze signals with frequencies below 80 Hz. and above 1000 Hz.
Therefore, the frequencies for pitches beyond this range could not be
accurately determined. This limitation restricted the am ount of data
received from the subjects who performed on tuba to 58%, and as referred
to earlier resulted in no data from the subjects who performed on the
flute. The incomplete data from the tuba performances, 28 intervals as
compared to 48, was generated from identical intervals for both subjects.
Reliability
A total of 728 intervals were analyzed: 156 minor thirds, 148 major
thirds, 152 minor sixths, 152 major sixths, 32 perfect fourths, 28 perfect
fifths, 32 unisons, and 28 octaves. The analysis procedure was repeated on
56
192 or 26% of the intervals. Disagreements occurred when the cent
distances of the duplicate intervals differed by at least one cent. Reliability
was then calculated by dividing the total number of agreements by
agreements plus disagreements. Reliability was determined to be 98%
with two of the three disagreements differing by only one cent.
Variables
The independent measures of this study were:
1. System: equal tempered, just or Pythagorean tuning systems;
2. Location: intervals performed above or below the stimulus;
3. Intervals (major thirds, minor thirds, major sixths, minor
sixths, perfect fourths, fifths, unisons, and octaves.);
4. Group: professionals versus advanced students.
The dependent measures were:
1. Absolute and directional cent deviation for each interval in
comparison to the Pythagorean, just, and equal-tempered tuning
systems; and
2. Flat and sharp responses compared to equal temperament
disregarding magnitude.

RESULTS
Introduction
Data were collected in an attem pt to describe harmonic intonational
patterns by comparing the differences (1) among the three tuning systems,
(2) between above and below the stimulus performances, (3) among
tuning tendencies for interval types, (4) among tuning tendencies with
regard to sharp, flat and in-tune responses, and (5) between professional
and student performers.
Data were obtained through computer analysis, by determining the
mean frequency for each pitch of the target intervals and converting the
interval frequency ratio into exact cent distance. Data were analyzed first
as absolute cent deviations from the different tuning systems w ithout
regard to direction. Directional responses were further categorized as
sharp, flat, or in-tune when compared to the equal tempered system.
Frequency of occurrence of sharp, flat and in-tune responses for each
targeted interval and for above and below performances were compared.
M agnitude of Cent Deviation Analyses
The first question of this study was, "Do wind players perform
harmonic intervals with an approximation toward either equal
temperament, just or Pythagorean tuning?" All intervals analyzed were
converted to cent deviation from equal temperament, just, and
Pythagorean tuning. The overall means of absolute cent deviation were
calculated from a total of 728 intervals for each system. Overall deviation
was least from equal temperament (M. = 6.5) which was less than the
deviation from Pythagorean (M = 8.7) and just (M = 13.1) intonation. The
mean cent deviation for each interval for both groups combined was
calculated. It appears from Figure 5 that for the thirds and sixths the cent
57

58
18
16•J3
14
12
10
-o 8
6
4
2
0P5 O ctaveM in3 Maj3 Min6 Maj6 Unison P4
O E.T .B Pyth.A Just
Figure 5. Mean absolute cent deviations by interval from three tuning systems.
deviation was greatest from just intonation and least from equal
tem pered intonation. As expected the deviation for unisons and octaves
is equal among the three systems and only slightly different for the
fourths and fifths. Inherently, the cent differences among the three
tuning systems for thirds and sixths are greater when compared to
unisons and octaves which are identical. Perfect fourths and fifths differ
by only 2 cents among the three systems, therefore, the mean deviation
between systems for these intervals was expected to be small.
The second and third questions of this study were, "Are intervals
tuned the same or differently when played above or below a referential
stimulus?" and, "Are there tuning differences among various intervals?"
Considering absolute deviation from equal temperament, there seemed
59
to be no im portant musical differences due to location with the difference
between performances above (M = 5.8) and below (M = 7.1) approximately
1 cent. Table 3 shows the mean absolute cent deviation from the three
tuning systems for each interval type when performed above and below
the stimulus. While octaves, unisons, perfect fourths, and perfect fifths
were tuned similarly across systems, there was greater and less consistent
deviation among the thirds and sixths (see Table 3 and Figure 5).
For all thirds and sixths performed above the stimulus by both
groups, deviation appeared to be least from equal temperament and most
from just tuning. This trend remained consistent for the below stimulus
performances of the same intervals with the exception of the major third
for which the absolute deviation was least from equal tem peram ent and
most from Pythagorean tuning (see Table 3). Further discussion regarding
the location of performance will follow in the directional deviation
analyses section.
Considering absolute deviation from equal temperament, the range
of deviation among the eight intervals was 3 cents for above stimulus
performances for each group and only slightly larger for students (4 cents)
and professionals (6 cents) during below stimulus performances. The
professional group seemed to tune thirds and sixths with greater
deviation when performing below the stimulus than when perform ing
above. The student group performed the same intervals similarly during
above and below stimulus performances (see Table 3).
Considering overall mean absolute cent deviation from equal
temperament, there appeared to be no differences between students
(M = 6.2) and professionals (M. = 6.8) which partially answered the fifth
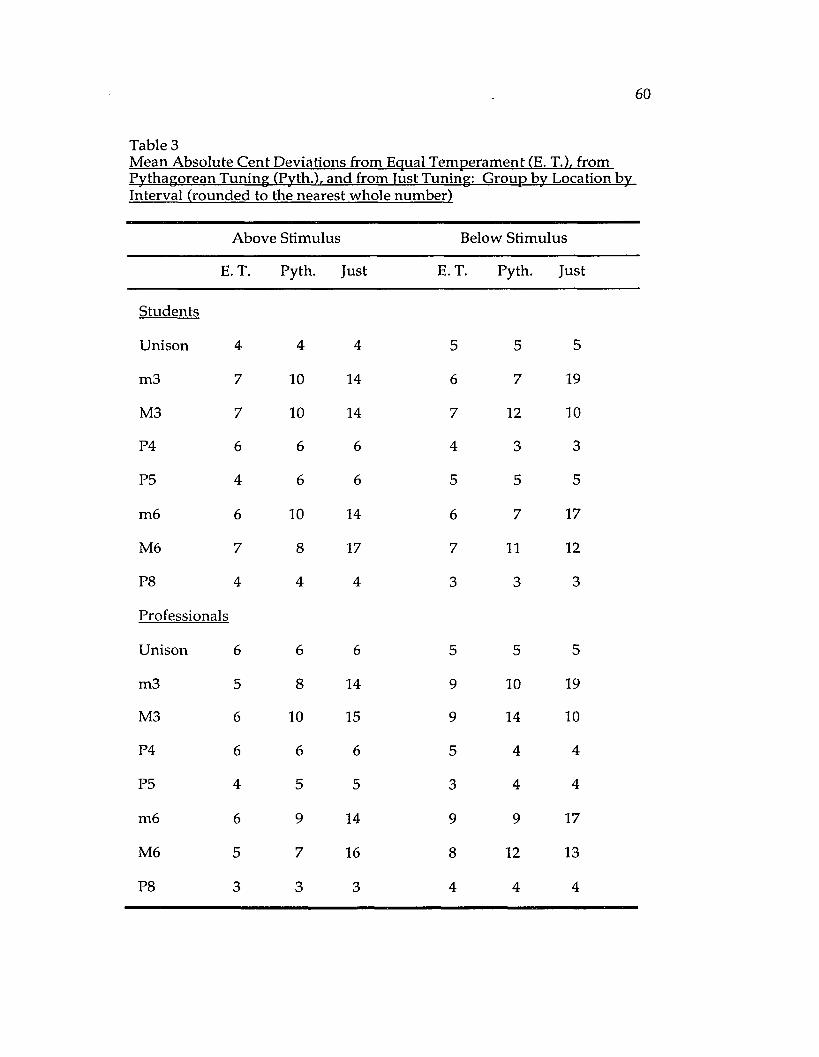
60
Table 3Mean Absolute Cent Deviations from Equal Temperament (E. T.), from Pythagorean Tuning (Pvth.), and from Tust Tuning: Group by Location by Interval (rounded to the nearest whole number)
Above Stimulus Below Stimulus
E. T. Pyth. Just E. T. Pyth. Just
Students
Unison 4 4 4 5 5 5
m3 7 10 14 6 7 19
M3 7 10 14 7 12 10
P4 6 6 6 4 3 3
P5 4 6 6 5 5 5
m6 6 10 14 6 7 17
M6 7 8 17 7 11 12
P8 4 4 4 3 3 3
Professionals
Unison 6 6 6 5 5 5
m3 5 8 14 9 10 19
M3 6 10 15 9 14 10
P4 6 6 6 5 4 4
P5 4 5 5 3 4 4
m6 6 9 14 9 9 17
M6 5 7 16 8 12 13
P8 3 3 3 4 4 4

61
question of this study, "Are there tuning differences between advanced
students and professionals in regard to tuning?". Further discussion
describing observed group differences will follow in the directional
deviation analyses section.
Directional Deviation Analyses
Another question addressed in this study was, "Do wind
instrum entalists tend to tune certain intervals sharp or flat in relation to
equal temperament?" Therefore, the secondary focus of this study was to
examine group, location, and interval type with regard to direction of
deviation from equal temperament. Perfect intervals were om itted from
the following statistical tests because of the disproportionate num ber of
thirds and sixths analyzed, 608, compared to 120 fourths, fifths, octaves
and unisons. Because the minimum threshold of cent deviation that is
accurately discriminated by the human ear may be larger than zero, all
responses with a deviation of 6 cents or less from equal temperament
were categorized as in-tune and responses with deviations greater than 6
cents as sharp or flat.
For the student group, location significantly affected the total num ber
of sharp, flat and in-tune responses [%2 (2, N = 364) = 6.924, p < .05] as there
appeared to be more sharp and fewer flat responses when subjects
perform ed from below the stimulus compared to above stimulus
responses where there were fewer sharp, more flat, and more in-tune
responses. Location also affected the intonation of responses for the
professional group (2, N = 364) = 29.31, p < .05] as results indicated
m ore sharp responses and less in-tune responses when subjects
performed from below the stimulus as compared to the responses from

62
above the stimulus. For the student group there were about an equal
num ber of in-tune responses both above and below the stimulus. There
was no significant difference between groups for the num ber of sharp,
flat, or in-tune responses observed when performing above the stimulus
(g > .05), however, there was a significant difference found between
groups when performing from below the stimulus, [%2 (2, N = 364) =
13.449,g < .05]. It appeared that the professional group perform ed more
sharp and flat responses and fewer in-tune responses than the student
group (see Table 4).
Table 4Comparison of Sharp (S), Flat (F), & In-tune (I) Responses by Group and Location (within p lus/m inus 6 cents considered in-tune)
Student Professional Total
S F I S F I S F I
Above 44 29 109 31 26 125 75 55 234
Below 57 14 111 75 29 78 132 43 189
Considering location and interval there was a significant difference
between the number of sharp, flat, and in-tune responses, [%2 (11, N = 606)
= 26.717, g < .05], for both groups combined. As shown in Table 5, location
significantly affected the intonation of responses for the intervals of
major third [%2 (2, N = 148) = 6.183, g < .05], minor sixth, [%2 (2, N = 152) =

63
Table 5Comparison of Sharp (S). Flat (F), & In-tune (I) Responses by Interval, Group, and Location (within plus/m inus 6 cents considered in-tune)
minor 3rd Major 3rd minor 6th Major 6th
S F I S F I S F I S F I
Students
Above 12 5 22 9 7 21 9 7 22 10 6 22
Below 12 5 22 13 3 21 12 1 25 14 2 22
Professionals
Above 9 4 26 7 5 25 5 8 25 5 4 29
Below 16 8 23 17 6 14 16 8 14 19 5 14
Total
Above 21 9 48 16 12 46 14 15 47 15 10 51
Below 28 13 35 30 9 35 28 9 39 33 7 36
6.911, p < .05], and major sixth [%2 (2, N = 152) = 9.866, p < .05], as it
appeared that there were more sharp and fewer flat responses when
subjects performed below the stimulus, compared to above stimulus
performances where there were fewer sharp, more flat, and more in-tune
responses. There was no significant difference between locations found
for the interval of minor third (p > .05).

64
For the student group only there were no differences found between
locations for the intervals of minor third/ major third, minor sixth, or
major sixth (p > .05); however, location significantly affected the
intonation of responses for the professional group for the intervals of
major third, [%2 (2, N = 74) = 7.36, p < .05], minor sixth [%2 (2, N = 76)
=8.864, p < .05], and major sixth [y } (2, N = 76) = 13.51, p <.05], with no
significant difference for the interval of minor third (p > .05). The
professional group tended to respond sharp more frequently when
perform ing below the stimulus than above and more in-tune when
perform ing above.
Considering the thirds and sixths, there were no significant
differences found between groups when performing above the stimulus
(p > .05). For minor thirds, major thirds, and major sixths there were no
differences found between groups when performing below the stimulus
(p > .05); however, there was a significant difference found between
groups for the interval of minor sixth [%2 (2, N = 76) = 9.118, p < .05].
The student group appeared to have more in-tune responses and fewer
flat responses than the professional group
Subject Indicated Preference Regarding Tuning Systems
At the onset of the experimental session, each subject was asked to
respond to a set of questions regarding intervallic tuning (see Figure 1).
There was ample space provided for any additional comments the
subjects wished to make. A summary of the responses to questions #1
and #2 is provided in Table 6.
While it appeared that 44% of the subjects indicated a preference for
the just system for harmonic tuning, subjects as a whole did not

65
Table 6Number of Responses to Questions #1 and #2 Regarding Tuning Systems in Harmonic and Melodic Contexts
Pyth. Just Mean l E. temp. No response
Question #1: What system of tunine do vou prefer for harmonic tunine?
Students 0 3 1 2 2
Professionals 0 4 0 2 2
Total 0 7 1 4 4
Question #2: What system of tuning do vou prefer for melodic tunine?
Students 0 1 0 3 4
Professionals 2 0 0 3 3
Total 2 1 0 6 7
completely conform to any one system of tuning in their
performances which showed the greatest absolute cent deviation from the
just system and the least from the equal tempered system. Of the
remaining subjects 25% preferred equal tempered tuning and 25% did not
indicate a preference for a specific tuning system.
Subject responses to question #3, regarding the preferred direction of
adjustm ent from equal tem perament for each interval, seem to have the
same variability and inconsistency as the responses obtained for the
questions concerning harmonic and melodic tuning (see Table 7).

66
Table 7Subject Preferred Directional Adjustment from Equal Temperament for Minor Thirds, Major Thirds, Minor Sixths, and Major Sixths Performed Above a Root
Sharp Flat E. temp. No response
Students
m3 2 1 0 5
M3 1 2 1 4
m6 2 1 0 5
M6 2 1 0 5
Professionals
m3 3 0 1 4
M3 0 6 0 2
m6 1 1 2 4
M6 1 2 1 4
Total
m3 5 1 1 9
M3 1 8 1 6
m6 3 2 2 9
M6 3 3 1 9

67
The interval of major third received the largest num ber of responses in a
single category, and, along with the minor third, appeared to elicit a
consistent trend from the professional group. Even though the
professional group seemed to prefer a flattened major third, the results
obtained from their above stimulus performance did not reflect this
preference. Both groups, however, tended to decrease the size of the
major third when performing below it as there were more sharp than flat
responses for both groups when performing below the stimulus.
Sum m ary
The frequency of both pitches for each interval was determ ined
through computer analysis and converted into the intervallic distance in
cents. The cent distance of each interval was then compared to the
respective cent widths of the same interval in the equal tempered,
Pythagorean, and just tuning systems. The absolute deviation of each
interval from equal temperament was then examined while also
considering the location of performance (above and below), group
(students and professionals), interval type, and tuning system.
Considering the direction of deviation from equal temperament, all
responses that deviated from equal temperament by 6 cents or less were
categorized as in-tune and compared along with the sharp and flat
responses. The following is a synthesis of the findings and the detailed
information that was outlined in the accompanying figures, tables, and
appendices.
Summary of Results for Magnitude of Cent Deviation Analyses
Considering the m agnitude of cent deviation:
1.1 Overall mean cent deviation scores deviated least from equal
tem pered tuning and most from just tuning.

68
1.2 The location, above or below stimulus, did not seem to affect the
m agnitude of deviation.
1.3 Considering deviation from equal temperament, subjects seemed to
tune octaves, perfect fifths, perfect fourths, and unisons more
accurately than major and minor thirds and sixths.
1.4 There were no apparent differences between the student and
professional groups.
Summary of Results for Directional Deviation Analyses
Considering the direction of deviation from equal temperament:
2.1 Subjects tended to play sharp more frequently and less in-tune when
performing below the stimulus and more in-tune when playing
above.
2.2 There were no differences between groups for above stimulus
performances. There was, however, a significant difference between
the below stimulus performances as the professional group had more
sharp responses and fewer in-tune responses when perform ing below
the stimulus and more in-tune and fewer m istuned responses when
performing above the stimulus. The student group seemed to have
more in-tune and fewer sharp responses than the professional group
when performing below the stimulus.
2.3 W ith both groups combined, location affected the direction of
deviation for major third, minor sixth, and major sixth, but not for
the minor third.
2.4 Performances of the professional group were significantly different
due to location for the interval of major third, minor sixth, and
major sixth. For the student group there were no differences in the
direction of deviation found due to location for any interval.

69
2.5 There was a difference between groups when subjects performed
below the stimulus for the interval of a minor sixth. The
professional group tended to respond sharp more often and less in
tune than the student group. There were no differences found
between groups among the remaining intervals.
DISCUSSION
Introduction
The purpose of this study was to examine performance trends of
advanced wind instrumentalists with regard to intervallic tuning.
Factors of interest were tuning system, location (above or below a
referential stimulus), interval type, and group (student or professional).
Also of interest was the direction of deviation of the target pitches, sharp
or flat, from equal temperament. Subjects (N =16) were experienced wind
instrumentalists, eight experienced professionals, and eight advanced
university students. Subjects were recorded performing a two-part
reduction of a Bach chorale, first playing the melody with a synthesized
harm ony line, then vice versa. Performances were transferred to a NeXT
computer where target intervals were analyzed and converted to cent
distance.
Results indicated that overall cent deviation was greatest when
compared to just tuning and least when compared to equal tem pered
tuning. For cent deviation from equal temperament, thirds and sixths
were performed less in-tune than fourths, fifths, unisons, and octaves.
Location also affected the direction of deviation from equal tem peram ent
as it appeared that subjects tended to play sharp and less in-tune when
perform ing below the stimulus. There were no differences found
between groups for the magnitude of deviation, however, considering
direction of deviation from equal temperament, it was observed that the
student group performed less sharp than the professionals when
perform ing below the stimulus and less in-tune when perform ing above.
70

71
Tuning Systems
The first question addressed in this study was, “Do wind players
perform harmonic intervals with an approximation tow ard either equal
temperament, just or Pythagorean tuning?" Previous research
dem onstrated that string and wind instrumentalists do not completely
adhere to one system of tuning during either solo or ensemble
performances. Greene (1936) conducted one of the first studies that
attem pted to quantitatively describe intonation tendencies as related to
tuning systems. He examined minor and major seconds and minor and
major thirds in a m elodic context and found that for all four intervals the
directional cent deviation was greatest when compared to just tuning and
smallest when compared to Pythagorean tuning. A study similar to
Greene's was done by Nickerson (1949) where both solo and ensemble
performances of string instrumentalists were examined. Similar to
Greene, Nickerson found that for the melodic intervals of major seconds,
major thirds, perfect fourths, perfect fifths, and major sixths both solo and
ensemble performances of the same melody deviated most from just
tuning and least from Pythagorean tuning.
The present study examined minor and major thirds, m inor and
major sixths, perfect fourths and fifths, unisons and octaves in a
harm onic context. Absolute deviation was least from equal tempered
tuning and greatest from just tuning. While Greene's and Nickerson's
method of analysis was somewhat different from the current study,
conclusions were similar in that the performers tended to deviate most
from just intonation.
Mason (1960) was among the first to examine intonational patterns of
w ind instrumentalists by recording both solo and ensemble performances

72
of two woodwind quintets, one comprised of students and the other of
professionals. Results of the current study were similar to M ason's in
that all performers tended to deviate most from just intonation.
However, Mason observed that for melodic intervals, professional w ind
instrum entalists deviated least from equal tem perament and student
wind instrumentalists deviated least from Pythagorean. In the present
study both students and professionals deviated least from equal
temperament for the tuning of harmonic thirds and sixths.
A good deal of previous literature regarding tuning systems and
harmonic intonation seems to consist mostly of philosophical inquiry
and phenomenological thinking rather than empirical evidence. For
example, Williamson (1942), stated that observers believed the foremost
string and vocal ensembles tended to perform in just intonation. At the
time he speculated about intonation issues, the complicated and difficult
task of quantitative analysis of intonation had not been thoroughly
developed. Williamson (1942) raised the question of whether musicians
can aurally distinguish between the three tuning systems.
A study by Madsen, Edmonson, & Madsen, (1969) suggested that
people can discriminate within plus/m inus 10 cents, while Parker (1983)
suggested the difference limen for pitch discrimination was around 20
cents. Williamson (1942) claimed that trained listeners can distinguish
differences between tones as small as 2 cents which is the smallest
discrepancy between equal temperament, Pythagorean, and just tunings.
This is an area that warrants further investigation. It is possible that
the minimum detectable cent deviation changes as the musical context
changes. For example, musicians might possibly discriminate intonation
discrepancies for two pitches that represent unisons or perfect intervals

73
with greater sensitivity and accuracy than two pitches that comprise more
complex intervals such as thirds and sixths. Performances in this study
appeared to support this notion.
While claims have been made that certain performing ensembles
perform in just intonation (Helmholtz, 1930), the performers in the
present study deviated least from equal temperament. This seems logical
since most of the fixed pitch instruments in use today, such as the piano,
are tuned in equal temperament and have been for the past 200 years. The
training of musicians includes performing solos w ith piano
accompaniment as well as attending many recitals and performances
given with tunings that closely approximate equal temperament. Also
most electronic tuning devices which are used to check individual pitch
are calibrated in equal temperament. Often an ensemble conductor will
insist that the performers "stop the dial" of a tuner on a pitch, regardless
of its harmonic function within a musical context, forcing the interval or
chord to a closer approximation of equal temperament. Therefore, it
seems difficult if not impossible for a well-trained musician to escape the
influence of equal tempered tuning.
Location
The second question of interest in this study was, "Are intervals
tuned the same or differently when played above or below a referential
stimulus?" Location did not seem to affect the overall m agnitude of cent
deviation for either the student or professional group. Students
perform ed all examined intervals similarly during above and below
stim ulus performances; however, professionals tended to deviate more
from equal temperament for thirds and sixths during below stimulus
performances when compared to above. Location also affected the

74
direction of deviation from equal temperament. Subjects performed
sharp more frequently and less in-tune when performing below the
stim ulus and more in-tune when performing above it. These findings
replicated previous research that indicated a tendency toward sharp
intonation.
Although there is little documentation supporting the theory that
proximity or location from a target pitch has an effect on tuning accuracy,
results similar to the present study were obtained by Cassidy (1989). She
observed that high school flute and clarinet players tuned m ore accurately
when they played an octave above a stimulus and were least accurate
when they played an octave below it. In the present study it appeared that
subjects played sharp more often when performing below the stimulus
and more in-tune when performing above. More discussion concerning
location will follow in the next two sections.
Intervals
The third question examined in this study was, "Are there tuning
differences among various intervals?" There were slight differences in
the m agnitude of cent deviation from equal tem perament among the
types of intervals performed. The octave appeared to be performed with
the least am ount of deviation, slightly less than 3.5 cents, and the major
third appeared to be performed with the most deviation, almost 7 cents.
Minor thirds and sixths were tuned slightly more accurately than major
thirds and sixths. However, they were only 2 cents different from unisons
and perfect fourths, and 3 cents different from octaves and perfect fifths.
It could be argued that these observed differences among intervals, 2 or 3
cents, are musically insignificant.
75
The direction of deviation from equal temperament was considered
for the fourth question, "Do wind instrumentalists tend to tune certain
intervals sharp or flat in relation to equal temperament?" The intervals
of major third, minor sixth and major sixth appeared to contain
more sharp, fewer flat, and fewer in-tune responses when subjects
perform ed below the stimulus compared to above stimulus
performances.
For the intervals of major third and major sixth, playing sharp while
perform ing below the stimulus may have been an attem pt to temper the
tuning in the direction of just intonation, where the major thirds and
sixths are smaller when compared to the same intervals in equal
tem peram ent, This, however, did not seem to be the case for above
stim ulus performances. Furthermore, while deviating least from equal
tem perament for below stimulus responses, the thirds and sixths seemed
to deviate most from the tuning system with the larger width. As can be
seen in Table 3, for below stimulus performances, both students and
professionals deviated most from just tuning for minor thirds and sixths
and most from Pythagorean tuning for major thirds and sixths.
It is possible to relate some of the results of this study to the findings
of Siegel & Siegel (1977a) and the theories of categorical perception. All of
the subjects were asked to repeat their performances as many times as
necessary until they felt it represented their most precise intonation. It
appeared from the data collected that while subjects overall deviated least
from equal temperament, there were a variety of sharp and flat responses
in varying degrees of m agnitude for most of the intervals analyzed
(see Tables 4 & 6). Perhaps musicians perceive musical intervals in a
general sense ignoring subtle differences within intervallic categories.

76
Also it is im portant to remember that equal tempered tuning is a
compromise that does not yield precisely beatless intervals. Therefore,
musicians who have been trained in equal temperament may be listening
to and producing performances of melodic intervals which fall into
categories of minor third-ness, major third-ness, and so forth.
Group
The final question of interest to this study was, "Are there differences
between advanced students and professionals in regard to tuning?" For
m agnitude of absolute deviation there seemed to be no difference
between groups. Further comparisons were made across three categories;
sharp, flat, and in-tune for each group, location, and interval. There were
no differences found between groups for above performances; however,
for below performances it appeared that the professional group played
more out-of-tune and sharp when performing below the stimulus than
the student group (see Table 4). Also there were no differences between
groups due to location or interval except for the below stimulus
performances of major sixths. It appeared that the professional group
performed sharp more frequently and less in-tune than the student group
(see Table 5).
The results of this study are similar to those of previous research
showing that age and experience affect accuracy of intonation, (Geringer &
W itt, 1985; Madsen, 1966; 1979; Madsen Edmonson, and Madsen, 1969;
M adsen & Madsen, 1972; and Madsen, Wolfe, & Madsen, 1969). These
studies all suggest that a more musically-experienced group tends to
perform sharper than a less experienced group. This trend was also found
by Yarbrough, Karrick, & Morrison (1993) who found that in addition to
im proving in overall tuning accuracy, more experienced players
77
tuned sharp more often than less experienced ones. These findings are
contrary to those found by Duke (1985) who observed that a younger
group tuned sharp when compared to an older group which tuned flat.
It is difficult to explain why the professionals performed sharp and
more out-of-tune than the students when playing below the stimulus. If
age and experience were solely responsible for the difference between
groups then the same results would have occurred when subjects
perform ed above the stimulus. This was not the case. In fact, the
professional group appeared to have more in-tune responses than the
student group when performing above the stimulus. Another possible
explanation might be due to the fact that most of the subjects in the
professional group were members or former members of an ensemble
where they held a principal position. Generally the principal players
have am ong the highest parts within their section and often are
responsible for playing the melody. In this study the melody was played
w hen subjects were performing above the stimulus. Perhaps the lack of
familiarity and opportunity for playing lower harmony parts by the
professionals caused their intonation to be more unstable. The student
performers, principal players in their own right, have played the
musically subordinate roles more recently than the professionals.
Subjects' Comments Regarding Tuning
The discrepancy between the preference responses and the actual
performances in addition to the no preference responses may support the
assum ption that for many musicians there exists some confusion
regarding tuning and tuning systems. This inference is further
substantiated by the varying written comments supplied by many of the
subjects. One subject wrote, "I really don't think about tuning systems,
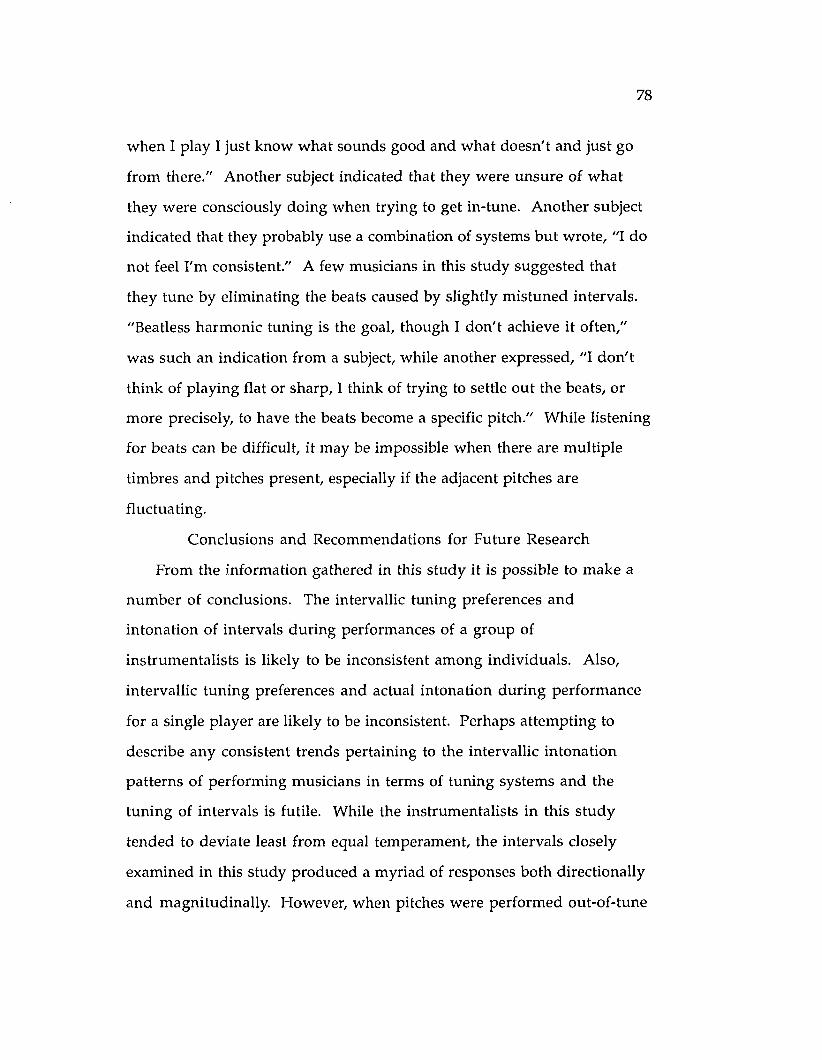
78
when I play I just know what sounds good and what doesn't and just go
from there." Another subject indicated that they were unsure of w hat
they were consciously doing when trying to get in-tune. Another subject
indicated that they probably use a combination of systems but wrote, "I do
not feel I'm consistent." A few musicians in this study suggested that
they tune by eliminating the beats caused by slightly m istuned intervals.
"Beatless harmonic tuning is the goal, though I don't achieve it often,"
was such an indication from a subject, while another expressed, "I don 't
think of playing flat or sharp, I think of trying to settle out the beats, or
more precisely, to have the beats become a specific pitch." While listening
for beats can be difficult, it may be impossible when there are multiple
timbres and pitches present, especially if the adjacent pitches are
fluctuating.
Conclusions and Recommendations for Future Research
From the information gathered in this study it is possible to make a
num ber of conclusions. The intervallic tuning preferences and
intonation of intervals during performances of a group of
instrum entalists is likely to be inconsistent among individuals. Also,
intervallic tuning preferences and actual intonation during performance
for a single player are likely to be inconsistent. Perhaps attempting to
describe any consistent trends pertaining to the intervallic intonation
patterns of performing musicians in terms of tuning systems and the
tuning of intervals is futile. While the instrumentalists in this study
tended to deviate least from equal temperament, the intervals closely
examined in this study produced a myriad of responses both directionally
and magnitudinally. However, when pitches were performed out-of-tune

79
they most often deviated in the direction of sharpness which replicates
previous research.
From the many previous studies that examined intervallic
intonation, a large number of them were mainly concerned w ith melodic
intervals. While this study examined the tuning of harmonic intervals,
it w ould be interesting to compare these findings with results obtained
from a similar study of melodic intervals. Also pertinent w ould be the
comparison of other intervals such as sevenths and seconds, and to
closely examine and compare melodic and harmonic leading tones and
half-steps. The theories of Casals (Blum, 1971) which imply that leading
tones and half-steps deviate in the direction of their resolutions are
unsubstantiated by empirical research and need to be more closely
investigated.
Results from this study seem to indicate that location, performing
above or below the stimulus, had an affect on the tuning of harmonic
intervals and previous research has indicated that direction of approach
effects intonation accuracy. In this study, the melody was always
performed above the stimulus and the harmony line was performed
below. Future investigations might compare performances of the same
melody and harmonizations in different locations, with the melody
above the harmonization as was done in this study, and with the melody
below the harmonization, to determine if intonational differences are a
result of location or musical function.
Also more research is needed in the area of categorical perception and
its possible relationships with tuning systems and intervals. It w ould be
interesting to present to a similar population of musicians, a set of
harmonic intervals randomly tuned to different tuning systems or

80
random ly m istuned in 10 cent increments, to determine if certain tunings
would be perceived as in-tune and if subjects could discriminate with
accuracy the direction of deviation of a specific pitch. Would there be as
much variability in responses from a discrimination task as there
appeared to be from a performance one? Would musicians discriminate
harmonic intervals differently from the same intervals presented
melodically? Are harmonic intervals more or less difficult to
discriminate in terms of intonation than their melodic counterparts?
W ould there be a preference for a specific tuning system for certain
intervals? Would musicians detect pitch change and inaccuracy
differently for different intervals?
A major drawback to tuning research is that most investigations have
been conducted with only one subject at a time and, in many cases,
removed from any actual musical context. The fact is that most
musicians perform as part of a larger ensemble where performers are
constantly listening to and adjusting to one another. Also, intervallic
relationships are increased with more pitches and more instrum ents
performing. Attempting to analyze accurately and reliably the intonation
of the individual musicians in an ensemble, perform ing simultaneously,
could be prove to be quite difficult if not impossible. With the
advancement of technology, studies similar to this one should attem pt to
examine the harmonic and melodic intonation of performers in the
context of larger groups, especially those groups that seem to be able to
perform closely in-tune. Perhaps the intonation of two or more players
adjusting to one another is different than that of only one player
adjusting to a fixed pitch.

81
It is apparent from the data gathered, that playing with consistent
tuning is challenging for seasoned college and professional w ind
instrumentalists. Previous research has found that tuning improves
with age and experience, therefore it is likely that junior and senior high
school wind instrumentalists, on a similar task, w ould perform with
more inconsistencies and a greater magnitude of deviation than
advanced players. While part of this dilemma may be related to physical
and aural limitations, the tuning problems of inexperienced players may
also be a result of inconclusive and inconsistent instruction.
For music educators, the difficulty of teaching young instrum entalists
to play with accurate intonation could be related to the apparent lack of
understanding and mystery of the process by advanced players. There is
some evidence, as suggested by Miles and Cassidy, that the tuning process
can be improved with certain training methods as it seems that the ability
to accurately tune to a unison pitch is a prerequisite to the ability to
accurately play in-tune within an ensemble. However, based on the
performances and comments of the musicians in this study, it seems that
intervallic harmonic tuning is primarily subjective and difficult to
explain clearly. There are many questions related to unison, harmonic,
and melodic tuning that need to be addressed in future research. Can
musicians be taught to differentiate between the subtle interval distances
of different tuning systems as suggested by Williamson, and if so, which
system, if any, would be preferred? What is the least noticeable cent
distance detectable by musicians? How much variability is there between
individuals? Is the minimum threshold lower for tones in unison when
compared to tones in more complex intervals? Does the threshold
increase as the musical context becomes more complex?

82
This study has attempted to uncover only a small part of the tuning
process by examining intervallic tunings of advanced student and
professional wind instrumentalists. While it is highly likely that there
will always be an abundance of unanswered questions and mysteries
pertaining to intonation, for both performance and perception, studies
such as this one can only help place together the smaller pieces of the
large puzzle. Future researchers, musicians, and educators m ust take
advantage of current and future computer technology and continue to
work toward a greater understanding of intonation.

REFERENCES
Aron, R (1523). Toscanello in Musica. Bologna: Forni.
Ahrens, A. W. (1947). Characteristic limitations of the internal tuning of selected wind instruments. Tournal of Experimental Education,15(4), 269-289.
Apfelstadt, H. (1984). Effects of melodic perception instruction on pitch discrimination and vocal accuracy of kindergarten children. Tournal of Research in Music Education, 32 ,15-24.
Bach, V. (1950). Problems of intonation on brass instruments. Sym phony, September, 1950.
Backus, J. (1969). The Acoustical Foundations of Music. New York: W.W. Norton.
Barbour, J. M. (1938). Just intonation confuted. Music and Letters. 19,48- 60.
Barbour, J. M. (1948). Irregular systems of temperament. Tournal of the American Musicological Society. 1,20-26.
Barbour, J. M. (1951). Tuning and Temperament A Historical Survey.East Lansing, Michigan: Michigan State College Press.
Bencriscutto, F. (1665). Intonation—a new approach. Instrum entalist, 20, 66 - 68 .
Blackwood, E. (1985). The Structure of Recognizable Diatonic Tunings. Princeton, New Jersey: Princeton University Press.
Blum, D. (1971). Casals and the Art of Interpretation. New York: Holmes and Meier Publishers.
Branning, H. P. (1967) Audition preferences of trained and untrained ears on hearing melodic and harmonic intervals when tuned in just intonation of Pythagorean ratios. (Doctoral dissertation, The University of Texas, 1965), Dissertation Abstracts International, 28. 4197-4198A.
Burns, E. M., & Ward, W. D. (1978). Categorical perception-phenom enon or epiphenomenon: Evidence from experiments in the perception of melodic musical intervals. Tournal of the Acoustical Society of America. 63. 456-468.
83

84
Cassidy, J. W. (1985). The relationship between second year band students7 intonation on pitches played and sung in a melodic context. Unpublished m aster's thesis, The Florida State University, Tallahassee, FL.
Cassidy, J. W. (1988). The use of instruction in acoustical interference("beats") and lip flexibility exercises to improve intonation accuracy. Unpublished Paper, Florida State University.
Cassidy, J. W. (1989). The effect of instrument type, stimulus timbre, and stimulus octave placement on tuning accuracy. Missouri Tournal of Research in Music Education. 26,7-23.
Cobes-Dennis, C. (1977). The conditioning of a pitch response using uncertain singers. IN C. K. Madsen, D. R. Greer, & C. H. Madsen, Jr. (Eds.), Research in music behavior: Modifying music behavior in the classroom (pp. 139-150). New York: Teachers College Press.
Codding, P. A. (1985). The effect of differential feedback on beginning guitar students' intonational performance in tuning strings. Unpublished Dissertation, The Florida State University.
Corso, J. F. (1954). Unison tuning of musical instruments. Tournal of the Acoustical Society of America, 26,746-750.
Dodge, C., and Jerse, T. A. (1985). Computer Music: Synthesis,Composition, and Performance. New York: Schirmer Books.
Duke, R. A. (1985). Wind instrumentalists' intonational performance of selected music intervals. Tournal of Research in Music Education,33,101-111.
Edmonson III, F. A. (1972). Effect of interval direction on pitch acuity in solo vocal performance. Tournal of Research in Music Education. 29, 246-254.
Elliot, C. A. (1974). Effect of vocalization on the sense of pitch of beginning band class students. Tournal of Research in Music Education, 22 ,120-128.
Elliot, C. A. (1983). Range distribution, timbre, and cent calibration as factors in pitch discrimination capacities. [Review of M. Rodman, Range distribution, timbre, and cent calibration as factors in pitch discrimination capacities!. Council for Research in Music Education Bulletin, 75,59-62.

85
Fletcher, H. (1934). Loudness, pitch, and the timbre of musical tones and their relation to the intensity, the frequency and the overtone structure. Tournal of the Acoustical Society of America, 6,59-69.
Gafurius, F. (1969). Practica musica. Translated by Irwin Young. Madison: The University of Wisconsin Press.
Geringer, J. M. (1976).Tuning preferences in recorded orchestral music. Tournal of Research in Music Education, 24 .169-176.
Geringer, J. M. (1978). Intonation performance and perception ofascending scales. Tournal of Research in Music Education. 26 ,32-40.
Geringer, J. M. (1983). The relationship of pitch-matching and pitch discrimination abilities of preschool and fourth-grade students. Tournal of Research in Music Education. 31.93-99.
Geringer, J. M. & Witt, A. C. (1985). An investigation of tuningperformance and perception of string instrumentalists. Bulletin of the Council for Research in Music Education. 85, 90-101.
Goetze, M. (1985). Factors affecting accuracy in children's singing.(Doctoral dissertation, University of Colorado, 1985). Dissertation Abstracts International, 46, 2955A.
Graves, W. L. (1963). Improving intonation: Three different m ethods evaluated. The Instrum entalist, 18(4), 46-47.
Green, G. A. (1990). The effect of vocal modeling on pitch-matchingaccuracy of children in grades one through six. Tournal of Research in Music Education. 38,225-232.
Greene, P. C. (1936). Violin performance with reference to tempered,natural, and Pythagorean intonation. In C. E, Seashore (Ed.), Studies in the Psychology of Music, 4, (pp. 232-251). Iowa City: University of Iowa Press.
Greer, R. D. (1970). The effect of timbre on brass-wind intonation. Experimental Research in the Psychology of Music, 6, 65-94.
Greer, R. D., Randall, A. & Timberlake, C. (1971). The discriminate use of music listening as a contingency for improvement in vocal pitch acuity and attending behavior. Bulletin of the Council for Research in Music Education. 26 .10-18.

86
Harnad, S. ( Ed.). (1987). Categorical Perception: The Groundwork of C ognition. New York: Cambridge University Press.
Helmholtz, H. L. F. (1930). On the Sensations of Tone as a Physiological Basis for the Theory of Music. New York: Longmans, Green, and Co.
Hermanson, L. W. (1971). An investigation of the effect of timbre on simultaneous vocal pitch acuity of young children. (Doctoral dissertation, Columbia University Teachers College, 1972). Dissertation Abstracts International. 32,3558A.
Howell, R. T. (1977). The effect of timbre on the interval perception and identification skill of instrumentalists. (Doctoral dissertation, University of Oklahoma, 1976). Dissertation Abstracts International, 37, 4686A.
Kantorski, V. (1986). The effects of differential accompaniment on string instrum entalists' intonational performance in extreme registers. Tournal of Research in Music Education. 34.200-210.
Killam, R., Lorton, P., & Schubert, E. (1975). Interval recognition:Identification of harmonic and melodic intervals. Tournal of Music Theory. 19, 212-234.
Lloyd, L. S. (1940). The myth of equal temperament. Music and Letters,2L 347-361.
Madsen, C. K. (1966). The effect of scale direction on pitch acuity in solo vocal performance. Tournal of Research in Music Education. 14.266- 275.
Madsen, C. K. (1974). Sharpness and flatness in scalar solo vocal performance. Sciences de l'art-Scientific Aesthetics. 9, 91-97.
Madsen, C. K., & Flowers, P. J. (1981/1982). The effect of tuning in an attempt to compensate for pitch/quality errors in flute/oboe duets. Contributions to Music Education. 5,2-10.
Madsen, C. K., & Geringer, J. M. (1976). Preferences for trum pet tone quality versus intonation. Bulletin of the Council for Research in Music Education. 4 6 .13-22.
Madsen, C. K., & Geringer, J. M. (1981). Discrimination between tonequality and intonation in unaccompanied flute/oboe duets. Tournal of Research in Music Education, 29. 305-313.

87
Madsen, C. K., Edmonson III, F. A., & Madsen, C. H. (1969). M odulated frequency discrimination in relationship to age and musical training. Tournal of the Acoustical Society of America. 4 6 .1468-1472.
Madsen, C. K., Wolf, D. E., & Madsen, C. H. (1968). The effect of reinforcement and scalar methodology on intonational improvement. Bulletin of the Council for Research in Music Education. 18.22-33.
Mason, J. A. (1960). Comparison of solo and ensemble performance with reference to Pythagorean, just and equi-tempered intonation.Tournal of Research in Music Education, 8,31-38.
Mersenne, M. (1636-37). H arm onie Universelle. France: Centre National De La Recherche Scientifique.
Miles, E. M. (1972). Beat elimination as a means of teaching intonation to beginning wind instrumentalists. Tournal of Research in Music Education. 20,496-500.
Nickerson, J. F. (1949). Intonation of solo and ensemble performance. Tournal of the Acoustical Society of America. 21,593-595.
Ostling, A. H., Jr. (1974). Research in Pythagorean, just temperament, and equal-tempered tunings in performance. Tournal of Band Research, 102.13-20.
Papich, G., & Rainbow, E. (1974). A pilot study of performance practices of twentieth-century musicians. Tournal of Research in Music Education, 22,24-34.
Parker, O. (1983). Quantitative differences in frequency perceptions by violinists, pianists, and trombonists. Bulletin of the Council for Research in Music Education. 76.49-58.
Pedersen, D. M., & Pedersen, N. O. (1970). The relationship between pitch recognition and vocal pitch production in sixth grade students. Tournal of Research in Music Education. 18.265-272.
Petzold, R. G. (1969). Auditory perception of musical sounds by children. Tournal of Research in Music Education, 17.82-87.
Plomp, R. (1967). Pitch of complex tones. Tournal of the Acoustical Society of America. 41 .1526-1533.

88
Porter, S. Y. (1977). The effect of multiple discrimination training on pitch-matching behaviors of uncertain singers. Tournal of Research in Music Education, 25, 68-82.
Pottle, R. R. (1960). Tuning the school band and orchestra. 2nd edition. Hammond, Louisiana: Ralph R. Pottle.
Price, H. E., Yarbrough, C., Jones, M., & Moore, R. S. (1993, April). Effects of male timbre and falsetto, and sine wave models on interval matching by inaccurate boy and girl singers. Paper presented at the Tenth National Symposium for Research in Music Behavior, Tuscaloosa, AL.
Ramis de Pareja, B. (1482). Musica Practica. Bologna: Forni.
Randel, Don M., (1986). The New Harvard Dictionary of Music.Cambridge, Massachusetts: The Belknap Press of H arvard University Press.
Richner, S. S. (1976). The effect of classroom and remedial methods of music instruction on the ability of inaccurate singers, in the third, fourth and fifth grades, to reproduce pitches. (Doctoral dissertation, University of Idaho, 1976) Dissertation Abstracts International, 38, 1447A.
Salzberg, R. S. (1980). The effects of visual stimulus and instruction of intonation accuracy of string instrumentalists. Psychology of Music, 8,3-15. .
Seashore, C. E. (1967). Psychology of Music. New York: Dover.
Sergeant, D. (1973). M easurement of pitch discrimination. Tournal of Research in Music Education, 21,3-19.
Shriro, M. J. (1982). Teaching vocal pitch perception and production. (Doctoral dissertation, The University of Pittsburgh, 1982).Dissertation Abstracts International. 42. 3808A.
Siegel, J. A., & Siegel, W. (1977a). Absolute identification of notes and intervals by musicians. Perception & Psychophysics, 21 ,143-152.
Siegel, J. A., & Siegel, W. (1977b). Categorical perception of tonal intervals: Musicians can't tell sharp from flat. Perception & Psychophysics. 21.399-407.

89
Small, A. M. (1937). An objective analysis of artistic violin performance. In C. E. Seashore (Ed.), Studies in the Psychology of Music. 4,(pp. 172-231). Iowa City: University of Iowa Press.
Small, A. R., & McCachren, F. L. (1983). The effect of male and female vocal modeling on pitch-matching accuracy of first-grade children. Tournal of Research in Music Education. 31,227-233.
Smith, E, R. (1985). The effects of vocalization on the intonation of college wind performers. (Doctoral dissertation, The Florida State University, 1984). Dissertation Abstracts International, 45. 2794A.
Smith, R. B. (1963). The effect of group vocal training on the singing ability of nursery school children. Tournal of Research in Music Education. 11,137-141.
Smith, R. B. (1973). Factors related to children's in-tune singing abilities (Doctoral dissertation, West Virginia University, Morgantown). Dissertation Abstracts International. 34. 7271A.
Sogin, D. W. (1989) An analysis of string instrumentalists' performedintonational adjustments within ascending and descending pitch set. Tournal of Research in Music Education. 37 .104-111.
Stauffer, D. W. (1954). Intonation Deficiencies of Wind Instruments in Ensem ble. Washington, D. C.: The Catholic University of America Press.
Swaffield, W. R. (1974). Effect of melodic parameters on ability to make fine-tuning responses in context. Tournal of Research in Music Education, 22. 305-312.
Vorce, F. W. (1964). The effect of simultaneous stimulus on vocal pitch accuracy. (Doctoral dissertation, The Florida State University, 1974). Dissertation Abstracts International. 25,5327A.
W agner, M. J. (1978). Introductory Musical Acoustics. Raleigh, North Carolina: Contemporary Publishing Company.
W apnick, J., & Freeman, P. (1980). Effects of dark-bright timbral variation on the perception of flatness and sharpness. Tournal of Research in Music Education, 28 .176-184.
W illiamson, C. (1942). Intonation in musical performance. American Tournal of Physics. 10.172.

90
Yarbrough, C. and Ballard, D. (1990) The effect of accidentals, scale degrees, direction, and performer opinions on intonation. Applications of Research in Music Education, Spring-Summer 1990, 19-22.
Yarbrough, C., Green, G. A., Benson, W., & Bowers, J. (1991). Inaccurate singers: An exploratory study of variables affecting pitch- matching. Bulletin of the Council for Research in Music Education. 107.23-34.
Yarbrough, C., Bowers, J. & Benson, W. (1992). The effect of vibrato on the pitch-matching accuracy of certain and uncertain singers.Tournal of Research in Music Education. 40.30-38.
Yarbrough, C., Karrick, B, & Morrison, S. (in press). The effect of knowledge of directional mistuning on the tuning accuracy of beginning and intermediate wind players. Tournal of Research in Music Education.
Yarbrough, C., Morrison, S., Karrick, B. & Dunn, D. (in press). The effect of male falsetto on the pitch matching accuracy of uncertain boy singers, grades K-8. Update: Applications of Research in Music Education.
Zatorre, R. J., & Halpern, A. R. (1979). Identification, discrimination, and selective adaptation of simultaneous musical intervals. Perception and Psychophysics, 26,384-395

APPENDIX A
ADAPTATION OF BACH CHORALE IN CONCERT PITCH USED AS
MUSICAL EXAMPLE WITH TARGET INTERVALS NUMBERED
N on vibrato J = 60
O Sacred Head Now Wounded
j .
*r w f
J. S. Bach
W
i1 2 3 4 5 7 8
>10
B\>a J-¥ rnf
B i 11 12 13 14 15 16 17 18 19 20 21 22 23 24
91

APPENDIX B
INDIVIDUAL DATA
92

Performed Above Stimulus
M6m3U
M3P5M68vamfiP4m6Mfim3M3m3M3m3M Sm6M6m6M3m3m6M3
Frequency Interva'
Ins.A Stim.B Cents
295.83 175.13 908235.84 196.73 314221.25 220.76 4196.02 156.26 392220.65 147.35 699349.77 208.56 895295.94 147.39 1207348.82 220.82 792296.42 220.81 510349.69 220.80 796296.92 175.10 914263.21 220.82 304297.91 233.99 418220.75 185.48 301331.99 262.55 406352.08 294.72 308331.64 196.75 904296.66 185.48 813331.67 196.75 904236.01 147.34 816222.17 175.17 411198.1 165.21 314262.92 165.25 804220.06 175.09 396
Cent deviation
E.T. Pyth Just
8 2 2414 20 -2
4 4 4-8 -If 6-1 j-. -3-5 -11 117 7 7
-8 0 -2210 12 12-4 4 1814 8 304 10 -12
18 10 321 7 -156 -2 208 14 -84 -2 20
13 21 -14 “A 20
16 24 211 3 2514 20 -2
4 12 -10-4 -12 10
M6m3U
M3P5M68vam6P4m6M6m3M3m3M3m3M6m6M6mfiM3m3mfiM3
Subject 1Performed Below Stimulus Student
Frequency Interva]in
CentsStim.A Ins.B
294.39 177.06 880233.71 198.37 284220.45 221.52 8195.96 157.54 378220.48 147.20 699350.29 208.49 898294.35 147.38 1198350.38 220.54 801294.38 220.50 500350.41 220.22 804294.40 175.58 895262.40 222.25 287297.91 235.67 406220.61 183.90 315330.67 263.44 393350.53 296.97 287330.76 196.99 897294.51 185.51 800330.74 197.71
T“<ON
oo
233.85 147.57 797220.65 175.45 397196.66 165.77 296262.54 166.04 793220.68 176.50 387
Cent deviation
E.T. Pyth Just
-20 -26 ■4-16 -10 -32
8 8 8-22 -30 -8-1 -3 -3-2 -8 14-2 -2 -21 9 -130 2 24 12 -10
-5 -11 11-3 3 -196 -2 20
15 21 -1-7 -15 7-3 3 -19-3 -9 130 8 -14-9 -15 7-3 5 -17-3 -11 11-4 2 -20-7 1 -21
-13 -21 1

Performed Above Stimulus
M6m3U
M3P5M68vam6P4m6M6m3M3m3M3m3M6m6M6m6M3m3m6M3
Frequency Interva]in
CentsIns.A Stim.B
104.04 87.41 30298.39 97.91 -E
155.56 92.53 899
155.25 98.25 896131.43 98.00 508155.32 98.23 793
117.23 98.28 .305132.32 103.66 423
99.07 82.71 312147.87 116.26 416155.72 130.92 300147.56 87.42 906131.42 82.64 803147.56 87.51 905
Cent deviation
E.T. Pyth Just
2 8 -14-8 -E -8
-1 -7 15
-4 4 -188 10 10-7 1 -21
5 11 -1123 15 3712 18 -416 8 300 6 -166 0 223 11 -115 -1 21
M6m3U
M3P5Mfi8vamfiP4mfiM6m3M3m3M3m3M6m6M6m6M3m3mfiM3
Performed Below Stimulus
Subject 2 Professional
Frequency Intervalin
Cents
Cent deviation
Stim.A Ins.B E.T. Pyth Just
103.68 87.76 289 -11 5 -2798.20 98.57 7 7 7 7
155.77 92.75 898 -2 -8 14
155.76 98.71 790 -10 -2 -24130.97 98.04 501 1 3 3155.82 98.21 799 -1 7 -15
116.33 98.05 296 -4 2 -20130.98 103.7 404 4 -4 1898.19 82.55 300 0 6 -16
146.77 117.77 381 -19 -27 -5155.77 130.83 302 2 8 -14146.84 87.34 899 -1 -7 15130.91 82.70 795 -5 3 -19146.78 87.98 886 -14 -20 2

Performed Above Stimulus
M6m3U
M3P5M68vam6P4m6M6m3M3m3M3m3M6m6M6m6M3m3m6M3
Frequency Intervalin
CentsIns.A Stim.B
526.19 312.23 904417.02 350.03 303392.85 392.88 0348.18 278.20 388393.21 262.42 700627.67 370.68 912525.19 262.41 1201624.46 392.74 803521.51 392.70 491622.27 392.77 797524.30 312.19 898467.21 392.71 301523.65 416.20 3983925 7 330.37 299594.17 467.16 416626.91 524.15 310592.38 350.01 911526.61 330.43 807591.44 349.98 908418.31 262.44 807394.93 312.28 407349.16 294.67 294467.81 294.66 800393.70 312.27 401
Cent deviation
E.T. Pyth Just
4 -2 203 9 -130 0 0
-12 -2C 2Q -2 -2
12 $ 281 i 13 n -11-9 -7 -7-3 5 -17-2 -£ 141 7 -15
-2 -1C 12-1 5 -1716 8 3010 16 -611 5 277 15 -78 2 247 15 -77 -1 21-6 0 -220 8 -141 -7 15
M6m3U
M3P5M68vam6P4m6M6m3M3m3M3m3M6m6M6m6M3m3m6M3
Subject 3Performed Below Stimulus
Frequency Interva]
Stim.A Ins.B Cents
524.22 311.73 900416.34 349.40 303392.89 392.85 0350.04 274.96 418392.62 261.19 706623.76 371.95 895524.22 261.00 1207623.53 394.41 793524.23 393.23 498623.64 392.51 802524.20 310.18 908467.27 392.61 301524.23 416.28 399392.85 328.89 308588.94 467.79 399623.71 527.55 290589.04 350.17 900524.35 329.80 803588.94 349.91 901416.28 262.12 801392.83 310.91 405350.03 294.65 298467.31 294.52 799392.86 311.03 404
Student
Cent deviation
E.T. Pyth Just
0 -6 163 9 -130 0 0
18 10 326 4 4-5 -11 117 7 7-7 1 -21-2 0 02 10 -128 2 241 7 -15
-1 -9 138 14 -8-1 -9 13
-10 -4 -260 -6 163 11 -111 -5 171 9 -135 -3 19-2 4 -18-1 7 -154 -4 18

Performed Above Stimulus
M6m3U
M3P5M68vam6P4m6M6m3M3m3M3m3M6m6M6m6M3m3m6M3
Frequency Interva'in
CentsIns.A Stim.B
104.17 87.28 30698.33 97.83 9
157.10 92.29 921
156.75 97.87 815131.30 97.84 509155.90 97.88 806
118.00 97.89 324130.82 103.39 40798.10 82.41 302
148.17 115.85 426157.19 130.52 322147.89 87.33 912131.35 82.74 800147.21 87.28 905
Cent deviation
E.T. Pyth Just
6 12 -109 9 9
21 15 V
15 23 19 11 116 14 -8
24 30 87 -1 212 8 -14
26 18 4022 28 619 13 350 8 -145 -1 21
M6m3U
M3P5M68vamfiP4mfiMfim3M3m3M3m3MfimfiMfimfiM3m3mfiM3
Subject 4Performed Below Stimulus Student
Cent deviation
E.T. Pyth Just
-17 -11 -33-1 1 1
-IS -24 -2
-15 -7 29-7 -5 -5-3 5 -17
-3 3 -192 -6 160 6 -16
-19 -27 -5-1 5 -17-6 -12 10
-11 -3 -25-10 -16 6
Frequency Interva]in
CentsStim.A Ins.B
103.31 87.73 28397.78 97.75 1
155.11 93.19 882
155.13 98.58 785130.39 98.05 493155.19 97.95 797
115.89 97.61 297130.44 103.40 402
97.68 82.13 300146.21 117.32 381155.16 130.52 299146.26 87.26 894130.41 82.68 789146.24 86.97 890

Performed Above Stimulus
M6m3U
M3P5Mfi8vamfiP4mfiMfim3M3m3M3m3Mfim6MfimfiM3m3mfiM3
Frequency Interva'
Ins.A Stim.B Cents
523.40 311.45 899415.71 349.59 300392.57 392.46 0349.20 277.27 399391.84 261.77 698627.80 370.15 914524.00 261.76 1202626.61 392.43 810523.84 392.36 500624.78 392.36 805521.93 311.37 894468.87 392.23 309521.86 415.47 395394.41 329.66 310588.56 466.71 402624.21 523.46 305586.13 349.34 896522.68 329.66 798584.22 349.34 890416.80 261.64 806394.46 311.34 410350.39 293.52 307466.44 293.52 802392.47 311.34 401
Cent deviation
E.T. Pyth Just
-1 -7 150 6 -160 0 0-1 _c 13-2 - i -4
14 8 302 2 2
10 18 A0 2 25 13 -9-6 -12 109 15 -7-5 -12 910 16 -62 -f 165 11 -11-4 -1C 12-2 6 -16
-10 -U 66 14 -8
10 2 247 13 -92 10 -121 -7 15
Mfim3U
M3P5Mfi8vamfiF4mfiM6m3M3m3M3m3Mfim6MfimfiM3m3mfiM3
Subject 5Performed Below Stimulus Student
Cent deviation
E.T. Pyth Just
-16 -22 0-7 -1 -237 7 7
-12 -20 2-6 -8 -8-5 -11 11-1 -1 -1-8 0 -22-7 -5 -5-8 0 -22-6 -12 10
-10 -4 -26-4 -12 10-6 0 -22
-10 -18 4-11 -5 -27-21 -27 -5-21 -13 -35
-9 -15 7-13 -5 -27
-7 -15 7-11 -5 -27
-5 3 -19-6 -14 8
Frequency Intervalin
CentsStim.A Ins.B
523.48 314.13 884415.43 350.72 293392.25 393.80 7349.33 279.20 388392.28 262.71 694622.84 371.48 895523.51 261.86 1199622.99 394.25 792523.53 393.69 493622.97 394.24 792523.57 314.29 884466.47 394.49 290523.50 416.37 396392.33 331.06 294588.08 469.58 390622.77 526.95 289587.62 353.70 879523.28 333.74 77 9587.67 351.34 891415.35 263.67 787392.16 314.31 383349.32 295.54 289466.41 294.74 795392.26 312.42 394

Performed Above Stimulus
MBm3U
M3P5MB8vamBP4mBMBm3M3m3M3m3MBmBMBmfiM3m3mfiM3
Frequency Interval
Ins.A Stim.B Cents
263.57 155.88 909207.44 174.70 297195.19 196.26 -9174.97 138.52 404195.90 131.04 696310.54 185.05 896262.23 131.06 1201309.92 196.32 790261.34 196.39 495310.34 196.31 793260.84 155.97 890231.89 196.35 288262.80 208.07 404196.35 164.85 303295.69 233.31 410312.15 262.05 303295.41 174.68 910261.84 164.82 801294.34 174.65 904206.90 131.02 791195.93 155.89 396174.79 146.92 301232.27 146.92 793196.05 155.87 397
Cent deviation
E.T. Pyth Just
9 3 27-3 3 -19-9 _c -94 -4 28-4 -f -6-4 121 1 1
-10 -£ -24-5 -3-7 1 -21
-10 -If 6-12 -f -36
4 -4 183 9 -13
10 2 243 9 -13
10 4 261 9 -134 -A 20-9 -1 -23-4 -12 101 7 -15
-7 1 -21-3 -11 11
MBm3U
M3P5M68vamBP4mBM6m3M3m3M3m3MBmfiMBmfiM3m3m6M3
Performed Below Stimulus
Subject 6Professional
Frequency Interva]
Stim.A Ins.B Cents
261.86 154.97 908207.91 175.20 296196.14 196.03 1174.55 137.57 412196.16 130.92 700311.69 184.03 912261.97 131.48 1193311.73 196.46 799262.04 196.49 498311.74 194.84 814262.04 155.76 901233.42 197.70 288262.13 207.22 407196.32 164.09 310293.89 233.39 399311.95 260.06 315294.06 174.60 902262.13 163.50 817294.08 173.55 913208.08 130.57 807196.38 154.57 414174.75 145.22 320233.47 145.73 816196.34 155.76 401
Cent deviation
E.T. Pyth Just
8 2 24-4 2 -201 1 1
12 4 260 -2 -2
12 6 28-7 -7 -7-1 7 -15-2 0 014 22 01 -5 17
12 18 07 -1 21
10 16 -6-1 -9 1315 21 -12 -4 18
17 25 313 7 297 15 -7
14 6 2820 26 416 24 21 -7 15 VO
00
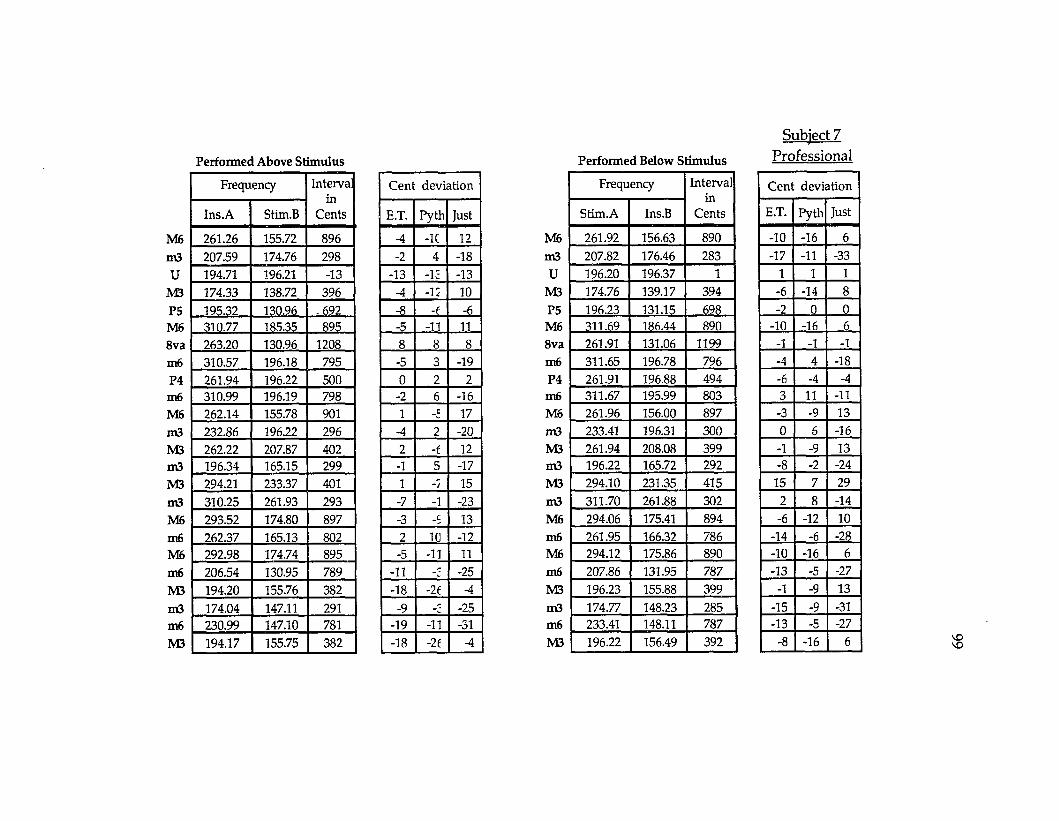
SiaS
&Sa
saS&
S&Sa
safl
isSe
&g
Performed Above Stimulus
Frequency Interva'
Ins.A Stim.B Cents
261.26 155.72 896207.59 174.76 298194.71 196.21 -13174.33 138.72 396195.32 130.96 .692310.77 185.35 895263.20 130.96 1208310.57 196.18 795261.94 196.22 500310.99 196.19 798262.14 155.78 901232.86 196.22 296262.22 207.87 402196.34 165.15 299294.21 233.37 401310.25 261.93 293293.52 174.80 897262.37 165.13 802292.98 174.74 895206.54 130.95 789194.20 155.76 382174.04 147.11 291230.99 147.10 781194.17 155.75 382
Cent deviation
E.T. Pyth Just
-4 -1C 12-2 4 -18
-13 -lc -13-4 -12 10-8 -f -6-5 -11 118 8 8-5 3 -190 2 2
-2 6 -161 _C 17
-4 2 -202 - t 12-1 5 -171 -/ 15
-7 -1 -23-3 _c 132 10 -12-5 -11 11
-11 .j -25-18 - I t -4
-9 -25-19 -11 -31-18 - I t -4
M6m3U
M3P5M68vam6P4m6M6m3M3m3M3m3M6mfiMfimfiM3m3mfiM3
Subject 7Performed Below Stimulus Professional
Cent deviation
E.T. Pyth Just
-10 -16 6-17 -11 -33
1 1 1-6 -14 8-2 0 0
-10 -16 6-1 -1 -1-4 4 -18-6 -4 -43 11 -11-3 -9 130 6 -16
-1 -9 13-8 -2 -24
15 7 292 8 -14-6 -12 10
-14 -6 -28-10 -16 6-13 -5 -27
-1 -9 13-15 -9 -31-13 -5 -27
-8 -16 6
Frequency Interva]
Stim.A Ins.B Cents
261.92 156.63 890207.82 176.46 283196.20 196.37 1174.76 139.17 394196.23 131.15 698311.69 186.44 890261.91 131.06 1199311.65 196.78 796261.91 196.88 494311.67 195.99 803261.96 156.00 897233.41 196.31 300261.94 208.08 399196.22 165.72 292294.10 231.35 415311.70 261.88 302294.06 175.41 894261.95 166.32 786294.12 175.86 890207.86 131.95 787196.23 155.88 399174.77 148.23 285233.41 148.11 787196.22 156.49 392

Performed Above Stimulus
M6m3U
M3P5M68vam6P4m6M6m3M3m3M3m3M6m6M6m6M3m3m6M3
Frequency Interva'
Ins.A Stim.B Cents
525.93 311.73 905416.43 349.42 304392.69 392.12 3351.03 277.76 405392.14 262.02 698624.11 370.04 905523.99 261.99 1200625.20 392.14 808525.05 392.07 506624.31 392.12 805524.49 311.63 901469.99 392.04 314523.32 415.44 400391.00 329.77 295593.29 466.49 416627.03 522.99 314590.85 349.28 910525.29 329.80 806592.57 349.33 915416.13 261.92 801391.88 311.62 397351.37 294.08 308469.71 294.10 811390.81 311.68 392
Cent deviation
E.T. Pyth Just
5 -1 214 10 -123 3 35 j-. 19-2 -4 -45 -1 210 0 08 16 -66 8 85 13 -91 _c 17
14 20 -20 -8 14-5 1 -2116 8 3014 20 -210 4 266 14 -8
15 9 311 9 -13
-3 -11 118 14 -8
11 19 -3-8 -If 6
M6m3U
M3P5M68vam6P4m6M6m3M3m3M3m3M6m6M6m6M3m3m6M3
Subject 8Performed Below Stimulus Professional
Cent deviation
E.T. Pyth Just
-19 -25 -3-13 -7 -2911 11 11-3 -11 11-3 -5 -5-2 -8 140 0 05 13 -9
10 12 1213 21 -1-7 -13 99 15 -73 -5 174 10 -12-9 -17 5
-13 -7 -29-9 -15 7-4 4 -18-7 -13 9-8 0 -22
-10 -18 4-4 2 -200 8 -14
-13 -21 1
Frequency Interval
Stim.A Ins.B Cents
523.34 314.63 881415.62 352.13 287392.17 394.77 11349.41 277.77 397392.12 262.16 697622.60 370.72 898523.24 261.67 1200622.44 391.05 805523.32 389.78 510622.46 389.22 813523.31 312.37 893466.38 390.16 309523.23 414.57 403392.11 329.00 304587.68 468.94 391622.46 527.41 287587.90 351.36 891523.25 330.33 796587.75 350.82 893415.48 262.96 792392.03 312.89 390349.37 294.43 296466.42 293.91 800392.07 313.46 387

Performed Above Stimulus
M6m3U
M3P5M68vam6P4m6M6m3M3m3M3m3M6m6M6mfiM3m3mfiM3
Frequency Interva'
Ins.A Stim.B Cents
525.78 311.82 904416.33 349.47 303393.13 392.20 4349.10 277.79 396392.58 262.04 700623.87 370.16 904524.89 262.02 1203626.97 392.16 812525.67 392.15 507624.07 392.17 804526.63 311.75 908468.19 392.10 307526.28 415.51 409394.14 329.83 308590.37 466.58 407624.72 523.22 307589.20 349.40 905525.85 329.84 807588.87 349.40 904417.27 262.01 806393.94 311.76 405349.95 294.20 300468.46 294.17 806393.89 311.72 405
Cent deviation
E.T. Pyth Just
4 -1 203 9 -134 4 4-4 -i ; 100 -24 203 3 3
12 20 -27 9 94 12 -108 2 247 13 -99 1 238 14 -87 -1 217 13 -95 -1 217 15 -74 206 14 -85 .j 190 6 -166 14 -85 JZ 19
M6m3U
M3P5M68vamfiP4m6Mfim3M3m3M3m3MfimfiMfimfiM3m3m6M3
Subject 9Performed Below Stimulus Professional
Cent deviation
E.T. Pyth Just
-11 17 5-2 4 -185 5 5
-12 -20 2-10 -10
-1 -7 15-8 -8 -8
-12 -4 -26-5 -3 -3-7 1 -21
-23 -29 -7-7 -1 -23-3 -11 11
-16
oT—< 1 -32-15 -23 -1-15 -9 -31
-7 -13 9-11 -3 -27-11 -17 5-16 -8 -32-14 -22 0
-7 -1 -23-7 1 -21
-16 -24 -2
Frequency Interval
Stim.A Ins.B Cents
523.40 313.14 889415.67 349.87 298392.24 393.39 5349.48 279.24 388392.18 262.93 692622.69 370.41 899523.36 262.90 1192622.62 394.84 788523.35 393.10 495622.61 393.82 793523.35 315.27 877466.50 393.95 293523.33 416.05 397392.21 332.78 284587.96 470.63 385622.70 528.10 285588.09 351.15 393523.42 331.80 789587.99 351.78 889415.59 264.31 784392.16 313.77 386349.46 295.10 293466.57 295.07 793392.20 314.14 384
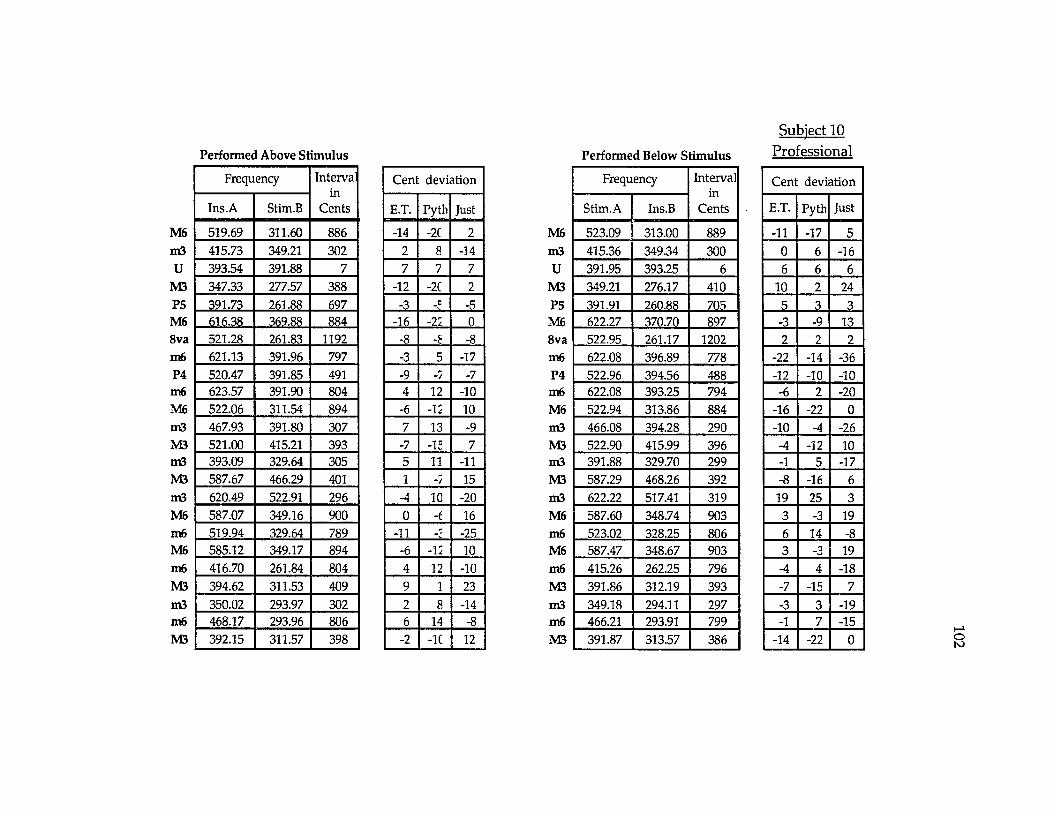
Performed Above Stimulus
M6m3U
M3P5M68vam6P4m6M6m3M3m3M3m3M6m6M6m6M3m3m6M3
Frequency Interval
Ins.A Stim.B Cents
519.69 311.60 886415.73 349.21 302393.54 391.88 7347.33 277.57 388391.73 261.88 697616.38 369.88 884521.28 261.83 1192621.13 391.96 797520.47 391.85 491623.57 391.90 804522.06 311.54 894467.93 391.80 307521.00 415.21 393393.09 329.64 305587.67 466.29 401620.49 522.91 296587.07 349.16 900519.94 329.64 789585.12 349.17 894416.70 261.84 804394.62 311.53 409350.02 293.97 302468.17 293.96 806392.15 311.57 398
Cent deviation
E.T. Pyth Just
-14 -2C 22 8 -147 7 7
-12 -2C 2-3 _C -5
-16 -22 Q-8 -£ -8-3 5 -17-9 -7 -74 12 -10-6 -12 107 13 -9
-7 -If 75 11 -111 -7 15
-4 10 -200 -f 16
-11 .c -25-6 -12 104 12 -109 1 232 8 -146 14 -8
-2 -1C 12
M6m3U
M3P5M68vam6P4m6M6m3M3m3M3m3M6m6M6m6M3m3m6M3
Subject 10Performed Below Stimulus Professional
Frequency Intervalin
CentsStim.A Ins.B
523.09 313.00 889415.36 349.34 300391.95 393.25 6349.21 276.17 410391.91 260.88 705622.27 370.70 897522.95 261.17 1202622.08 396.89 778522.96 394.56 488622.08 393.25 794522.94 313.86 884466.08 394.28 290522.90 415.99 396391.88 329.70 299587.29 468.26 392622.22 517.41 319587.60 348.74 903523.02 328.25 806587.47 348.67 903415.26 262.25 796391.86 312.19 393349.18 294.11 297466.21 293.91 799391.87 313.57 386
Cent deviation
E.T. Pyth Just
-11 -17 50 6 -166 6 6
10 2 245 3 3-3 -9 132 2 2
-22 -14 -36-12 -10 -10
-6 2 -20-16 -22 0-10 -4 -26
-4 -12 10-1 5 -17-8 -16 619 25 33 -3 196 14 -83 -3 19-4 4 -18-7 -15 7-3 3 -19-1 7 -15
-14 -22 0
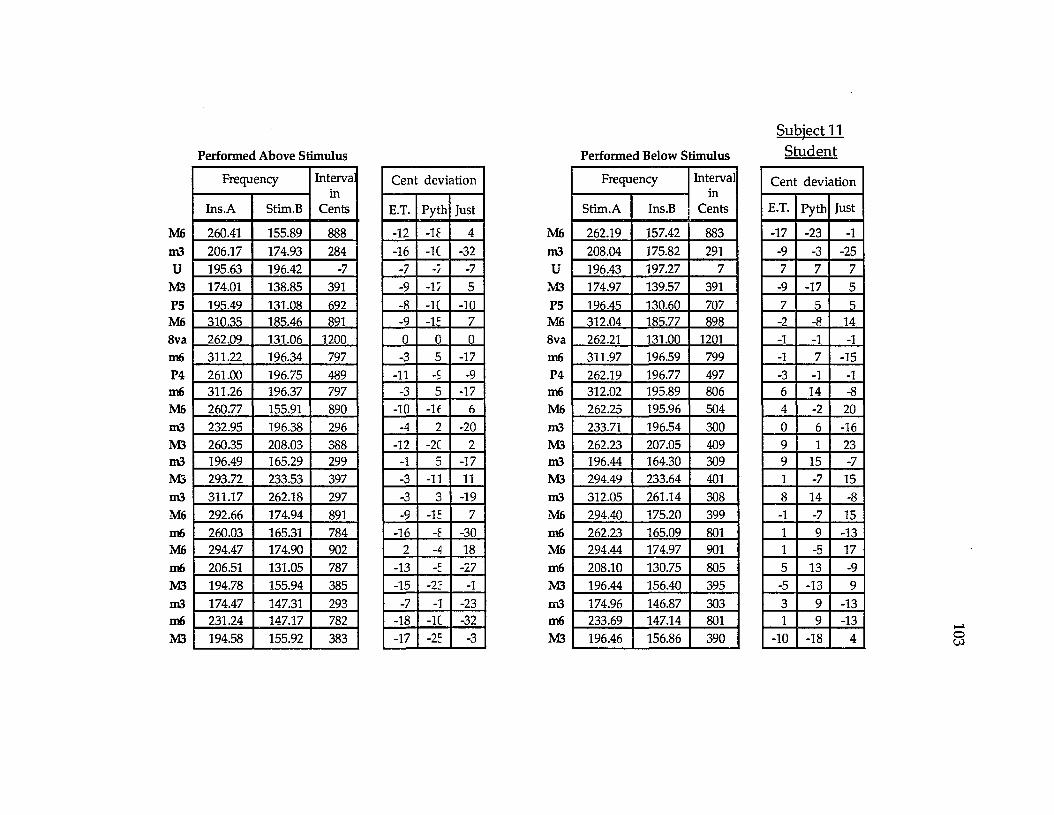
Performed Above Stimulus
M6m3U
M3P5M68vam6P4m6M6m3M3m3M3m3M6m6M6m6M3m3m6M3
Frequency Interva'in
CentsIns.A Stim.B
260.41 155.89 888206.17 174.93 284195.63 196.42 -7174.01 138.85 391195.49 131.08 692310.35 185.46 891262.09 131.06 1200311.22 196.34 797261.00 196.75 489311.26 196.37 797260.77 155.91 890232.95 196.38 296260.35 208.03 388196.49 165.29 299293.72 233.53 397311.17 262.18 297292.66 174.94 891260.03 165.31 784294.47 174.90 902206.51 131.05 787194.78 155.94 385174.47 147.31 293231.24 147.17 782194.58 155.92 383
Cent deviation
E.T. Pyth Just
-12 -If 4-16 -1C -32
-7 -7 -7-9 -17 5
-IQ-9 -1? 70 0 0
-3 5 -17-11 _c -9
-3 5 -17-10 -If 6-4 2 -20
-12 -2C 2-1 5 -17-3 -11 11-3 3 -19-9 -IE 7
-16 -f -302 -A 18
-13 _C -27-15 -2E -1
-7 -1 -23-18 -1C -32-17 -2E -3
M6m3U
M3P5M68vam6P4m6M6m3M3m3M3m3MBmBMBmBM3m3mBM3
Performed Below Stimulus
Subject 11Student
Frequency Interval
Stim.A Ins.B Cents
262.19 157.42 883208.04 175.82 291196.43 197.27 7174.97 139.57 391196.45 130.60 707312.04 185.77 898262.21 131.00 1201311.97 196.59 799262.19 196.77 497312.02 195.89 806262.25 195.96 504233.71 196.54 300262.23 207.05 409196.44 164.30 309294.49 233.64 401312.05 261.14 308294.40 175.20 399262.23 165.09 801294.44 174.97 901208.10 130.75 805196.44 156.40 395174.96 146.87 303233.69 147.14 801196.46 156.86 390
Cent deviation
E.T. Pyth Just
-17 -23 -1-9 -3 -257 7 7
-9 -17 57 5 5
-2 -8 14-1 -1 -1-1 7 -15-3 -1 -16 14 -84 -2 200 6 -169 1 239 15 -71 -7 158 14 -8-1 -7 151 9 -131 -5 175 13 -9-5 -13 93 9 -131 9 -13
-10 -18 4

Performed Above Stimulus
M6m3U
M3P5M68vam6P4m6M6m3M3m3M3m3M6m6M6m6M3m3m6M3
Frequency Interval
Ins.A Stim.B Cents
263.17 155.78 908208.67 176.01 295196.20 196.12 1175.33 138.45 409195.55 130.96 694310.77 184.94 899260.52 130.99 1190312.25 196.18 805260.89 196.26 493310.96 196.22 797261.57 155.87 896233.92 196.27 304262.61 207.96 404195.89 164.77 300295.33 233.14 409313.09 261.94 309295.42 174.60 910260.43 164.73 793294.15 174.56 903207.36 130.95 796195.84 155.79 396175.68 146.87 310233.71 146.88 804195.56 155.76 394
Cent deviation
E.T. Pyth Just
8 2 24-5 1 -211 1 19 1 21-<? -8-1 -7 15
-10 -1C -105 13 9-7 _C -5-3 5 -17-4 -1C 124 10 -124 -4 180 6 -169 1 239 15 -7
10 4 26-7 -1 -213 19
-4 4 -18-4 -12 1010 16 -64 12 -10-6 -14 8
M6m3U
M3P5M68vam6P4m6M6m3M3m3M3m3M6m6M6m6M3m3m6M3
Performed Below Stimulus
Frequency Intervalin
CentsStim.A Ins.B
261.76 156.16 894207.80 176.01 287196.08 196.83 7174.46 138.69 397196.06 130.78 701311.50 184.01 911261.82 131.06 1198311.52 196.27 800261.88 196.98 493311.56 195.70 805261.89 156.98 886233.29 196.83 294261.95 208.71 393196.19 164.60 304293.60 234.91 386311.73 263.72 290293.86 175.89 889261.92 166.16 788293.86 175.86 889207.94 131.79 790196.25 156.32 394174.62 147.97 287233.28 148.08 787196.19 156.01 j 397
Subject 12Student
Cent deviation
E.T. Pyth Just
-6 -12 10-13 -7 -29
7 7 7-3 -11 111 -1 -1
11 5 27-2 -2 -20 8 -14-7 -5 -55 13 -9
-14 -20 2-6 0 -22-7 -15 74 10 -12
-14 -22 0-10 -4 -26-11 -17 5-12 -4 -26-11 -17 5
1* -2 -24-6 -14 8
-13 -7 -29-13 -5 -27
-3 11 -11

Performed Above Stimulus
M6m3U
M3P5M68vam6P4m6M6m3M3m3M3m3M6m6M6m6M3m3m6M3
Frequency Interva!in
CentsIns.A Stim.B
292.92 174.95 892234.37 196.57 304220.41 220.51 -1196.24 156.12 396220.03 147.17 696349.84 208.38 897294.14 147.21 1198350.36 220.54 801293.16 220.60 492349.48 220.52 797293.80 174.96 897261.93 220.64 297294.30 233.75 399220.03 185.29 297329.70 262.50 395351.83 294.47 308330.16 196.59 898293.45 185.24 796330.14 196.53 398234.84 147.22 808219.63 174.94 394195.52 165.07 293262.69 165.02 805220.40 174.89 400
Cent deviation
E.T. Pyth Just
-8 -14 84 10 -12-1 -1 -1-4 -12 10-4 -f -<?-3 _c 13-2 -21 9 -13-8 -( -6-3 5 -17-3 _c 13-3 3 -19-1 _c 13-3 3 -19-5 -12 98 14 -8-2 -E 14-4 4 -18-2 -E 148 16 -6-6 -14 8-7 -1 -235 13 -90 -E 14
M6m3U
M3P5M68vam6P4m6M6m3M3m3M3m3M6m6M6m6M3m3m6M3
Performed Below Stimulus
Subject 13Professional
Cent deviation
E.T. Pyth Just
-9 -15 74 10 -121 1 1
-14 -22 0-2 -4 -412 6 285 5 5
10 18 -4-2 0 09 17 -51 -5 176 12 -10
-4 -12 1017 23 18 0 225 11 -11
22 16 388 16 -63 -3 19-8 0 -223 -5 17
12 18 -49 17 -5
-5 -13 9
Frequency Interva]in
CentsStim.A Ins.B
294.12 175.75 891233.45 195.90 304220.21 220.31 1196.31 157.08 386220.31 147.17 698349.97 206.61 912294.07 146.58 1205350.08 219.30 810294.07 220.59 498350.08 219.36 809294.13 174.81 901262.15 219.64 306294.07 233.88 396220.37 183.53 317330.54 261.19 408350.06 293.54 305330.38 193.98 922294.22 184.49 808330.45 196.20 903233.65 147.87 792220.46 174.68 403196.47 164.09 312262.29 164.42 809220.51 175.50 395

Performed Above Stimulus
M6m3U
M3P5M68vamfiP4m6Mfim3M3m3M3m3MfimfiMfimfiM3m3mfiM3
Frequency Interva'
Ins.A Stim.B Cents
520.45 311.61 888412.03 349.41 285391.44 392.02 -3349.57 277.63 399391.37 261.92 695624.29 369.95 906522.58 261.90 1196625.77 392.01 810523.11 391.95 500625.76 392.03 810523.04 311.61 897465.47 391.95 298522.71 415.35 398391.88 329.78 299588.86 466.30 404624.95 523.10 308588.06 349.31 902522.52 329.78 797587.01 349.31 399414.00 261.92 793392.33 311.65 399350.76 294.08 305464.90 294.08 793391.22 311.64 394
Cent deviation
E.T. Pyth Just
-12 -U 4-15 _c -31
-3 -2 -3-1 _c 13
-7 -76 0 -8
-4 -4 -410 18 -40 2 2
10 18 -4-3 _c 13-2 4 -18-2 -1C 12-1 5 -174 -4 188 14 -82 -4 18-3 5 -17-1 -7 15-7 1 -21-1 _c 135 11 -11-7 1 -21-6 -14 8
Mfim3U
M3P5Mfi8vamfiP4mfiMfim3M3m3M3m3M6mfiMfimfiM3m3mfiM3
Subject 14Performed Below Stimulus Student
Cent deviation
E.T. Pyth Just
-6 -12 10-7 -1 -234 4 44 -4 18-5 -7 -7-1 -7-3 -3 -3-7 1 -21-3 -1 -1-6 2 -20-5 -11 11-4 2 -201 -7 150 6 -161 -7 15
-2 4 -18-9 -15 71 9 -13
-8 -14 8-16 -8 -30
-8 -16 6-1 5 -171 9 -13
-13 -21 1
Frequency Interva]
Stim.A Ins.B Cents
523.23 312.26 894415.58 350.97 293392.12 392.93 4349.35 276.70 404392.02 262.44 695622.56 370.30 899523.21 262.09 119 7622.35 393.70 793523.23 392.60 497622.39 393.46 394523.40 312.18 895466.42 393.05 296523.24 415.14 401392.02 329.68 300587.54 466.13 401622.47 524.01 298587.80 351.32 891523.24 329.34 801587.74 351.15 892415.42 264.16 784391.99 312.50 392349.33 293.87 299466.34 293.64 801392.05 313.50 387

Performed Above Stimulus
M6m3U
M3P5M68vam6P4m6M6m3M3m3M3m3M6m6M6m6M3m3m6M3
Frequency Interva'
Ins.A Stim.B Cents
M6 524.48 311.87 900m3 415.65 350.04 297U 392.70 392.95 -1
M3 348.99 277.65 396P5 391.80 262.11 696M6 627.71 370.54 9138va 524.22 262.09 1200m6 622.29 392.88 796P4 523.75 392.78 498mfi 622.27 392.82 796Mfi 525.83 311.74 905m3 467.28 392.69 301M3 523.98 415.97 400m3 393.58 330.08 305M3 587.48 467.16 397m3 622.78 524.06 299Mfi 586.88 349.90 895mfi 523.92 330.03 800Mfi 588.32 349.81 900mfi 414.37 261.92 794M3 391.68 311.74 395m3 350.02 293.90 303mfi 465.72 293.89 797M3 391.52 311.77 394
Cent deviation
E.T. Pyth Just
0 -f 16-3 3 -19-1 -1 -1-4 -12 10-4 -f -613 7 290 0 0-4 4 -18-2 0 0-4 4 -185 -1 211 7 -150 -£ 145 11 -11-3 -11 11-1 5 -17-5 -11 110 8 -140 - t 16-6 2 -20-5 -13 93 9 -13-3 5 -17-6 -14 8
Performed Below Stimulus
Subject 15Professional
Cent deviation
E.T. Pyth Just
-11 -17 5-22 -16 -3812 12 12-21 -29 -7
1 3 31 -5 172 2 2-7 1 -21-2 0 0
-12 -4 -26-9 -15 7
-13 -7 -29-2 -10 12
-21 -15 -37-12 -20 2
-7 -1 -23-10 -16 6-14 -6 -28
-9 -15 7-6 2 -20
-12 -20 2-18 -12 -34-15 -7 -29-13 -21 1
Frequency Interval
Stim.A Ins.B Cents
524.12 313.68 889415.88 354.28 278392.74 395.55 12349.77 280.97 379392.79 262.02 701623.65 370.66 901524.17 261.81 1202623.67 394.38 793523.75 392.78 498623.81 395.65 788524.25 313.35 891467.06 395.66 287524.11 416.54 398392.84 334.36 279588.80 470.70 388623.57 526.48 293588.34 351.80 890523.98 332.69 786588.42 351.67 891415.90 262.85 794392.59 313.77 388349.73 297.23 282467.02 296.76 785392.74 314.12 387
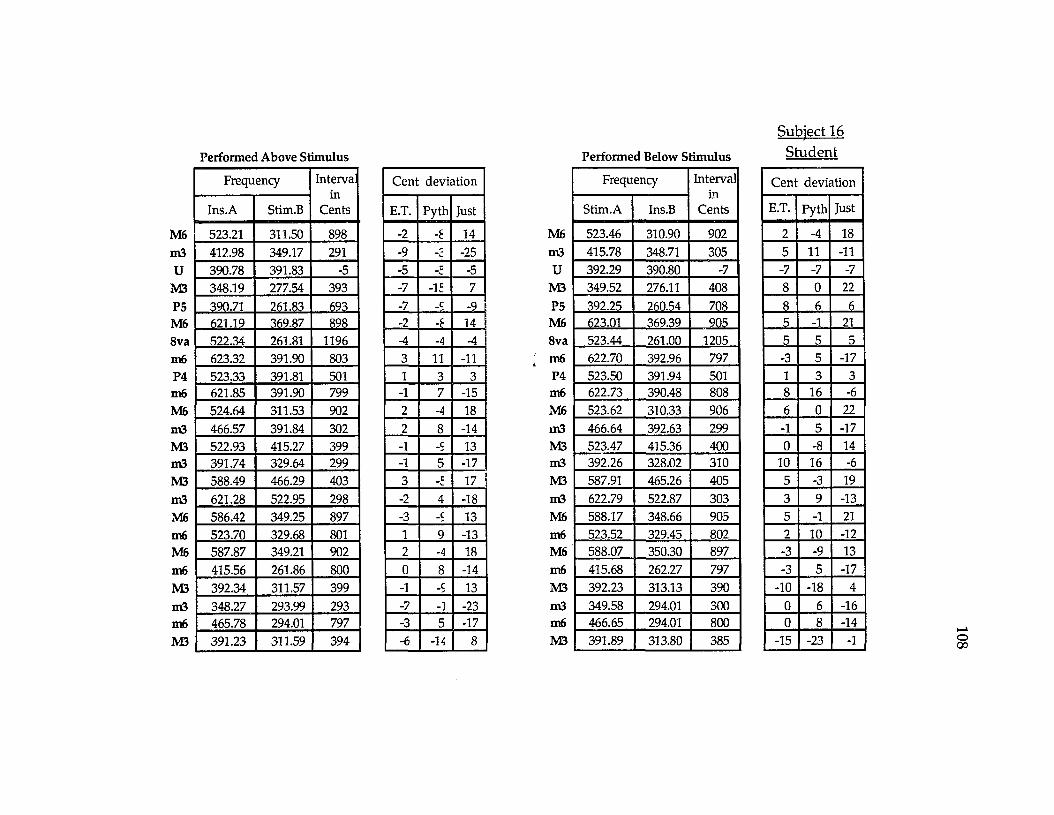
Performed Above Stimulus
M6m3U
M3P5M68vam6P4m6M6m3M3m3M3m3M6m6M6m6M3m3m6M3
Frequency Intervain
CentsIns.A Stim.B
523.21 311.50 898412.98 349.17 291390.78 391.83 -5348.19 277.54 393390.71 261.83 693621.19 369.87 898522.34 261.81 1196623.32 391.90 803523.33 391.81 501621.85 391.90 799524.64 311.53 902466.57 391.84 302522.93 415.27 399391.74 329.64 299588.49 466.29 403621.28 522.95 298586.42 349.25 897523.70 329.68 801587.87 349.21 902415.56 261.86 800392.34 311.57 399348.27 293.99 293465.78 294.01 797391.23 311.59 394
Cent deviation
E.T. Pyth Just
-2 -£ 14-9 -2 -25-5 _C -5-7 -IE 7-7 _c -9-2 -f 14-4 -4 -43 11 -111 3 3-1 7 -152 -4 182 8 -14-1 _c 13-1 5 -173 17-2 4 -18-3 _c 131 9 -132 -4 180 8 -14-1 _c 13-7 -1 -23-3 5 -17-6 -14 | 8
M6 m3 U
M3 P5 M6 8va
; m6 P4 m6 M6 m3 M3 m3 M3 m3 M6 m6 M6 m6 M3 m3 m6 M3
Performed Below Stimulus
Subject 16Student
Frequency Interva]
Stim.A Ins.B Cents
523.46 310.90 902415.78 348.71 305392.29 390.80 -7349.52 276.11 408392.25 260.54 708623.01 369.39 905523.44 261.00 1205622.70 392.96 797523.50 391.94 501622.73 390.48 808523.62 310.33 906466.64 392.63 299523.47 415.36 400392.26 328.02 310587.91 465.26 405622.79 522.87 303588.17 348.66 905523.52 329.45 802588.07 350.30 897415.68 262.27 797392.23 313.13 390349.58 294.01 300466.65 294.01 800391.89 313.80 385
Cent deviation
E.T. Pyth Just
2 -4 185 11 -11-7 -7 -78 0 22
9 9 95 -1 215 5 5-3 5 -171 3 38 16 -66 0 22
-1 5 -170 -8 14
10 16 -65 -3 193 9 -135 -1 212 10 - 1 2
-3 -9 13-3 5 -17
I ►—i
O -18 40 6 -160 8 -14
-15 -23 -1
VITA
Brant Gilmore Karrick was born August 14, 1960 in Bowling Green,
Kentucky. He attended the public elementary and junior high schools of
the Bowling Green City School system and graduated from Bowling
Green High School in 1978. Completing his Bachelor of Music Education
degree from The University of Louisville in 1982, Mr. Karrick went on to
receive his Master of Arts in Education from Western Kentucky
University. While at Western, he also served as Graduate Assistant to the
Director of Bands.
Brant began public school teaching in 1984 when he became director
of instrum ental music for the Beechwood Independent school district in
Fort Mitchell, Kentucky. In 1986 he accepted the position of Director of
Bands in the Bowling Green City School system. In the fall of 1991, he
began his doctoral work in music education at Louisiana State University
where he was awarded a Graduate Teaching Assistantship. Brant has
continued to serve as adjudicator, guest conductor, music arranger, and
drill designer for a myriad of bands in Alabama, Georgia. Louisiana,
Kentucky, Indiana, and Ohio. He will complete his doctorate in A ugust of
1994.
109

DOCTORAL EXAMINATION AND DISSERTATION REPORT
Candidate:
Major Field:
Title of Dissertation:
Date of Examination:
Brant Karrick
Music
An Examination of the Intonation Tendencies of Advanced Wind Instrumentalists Based on Their Performance of Selected Musical Intervals
Approved:
Dean of the Graduate School
EXAMINING COMMITTEE:
June 13, 1994