an examination of the possible effects of sudbury nickel ...dfo-mpo.gc.ca/library/58362.pdf · i c...
TRANSCRIPT
,
, I c
, F
An Examination of the Possible Effects of Sudbury Nickel Mining and Smelting Operations on Fishes and the Water Oiemistry of Lakes within the Whitefish Lake Indian Reserve
by R. J. Beamish, G. A. McFarlane, J. C. Vanloon and J. Lichwa
FISHERIES AND MARINE SERVICE SERVICE DES PECHES IT DES SCIENCES DE LA MER
TECHNICAL REPORT No. 579 RAPPORT TECHNIQUE N'
1975 1+ Environment
Canada Environnement Canada
•
Fisheries Service des peches and Marine el des sciences Service de la mer
,
Technical Reports
Technical Reports are research documents that are of sufficient importance to be preserved, but which for some reason are not appropriate for primary scientific publication. Inquiries concerning any particular Report should be directed to the issuing establislunent.
Rapports Techniques
Les rapports techniques sont des documents de recherche qui revetent une assez grande importance pour etre conserves mais qui, pour une raison ou pour une autre, ne conviennent pas a une publication scientifique prioritaire. Pour toute demande de renseignements concernant un rapport particulier, il faut s'adresser au service responsabJe.
Department of the Environment Ministere de l'Environnement
Fisheries and Marine Service Service des Peches et des Sciences de la mer
Research and Development Directorate Direction du Recherche et Developpement
TECHNICAL REPORT NO. 579 RAPPORT TECHNIQUE NO. 579
(Numbers 1-456 in this series were (Les ,
numeros 1-456 dans cette serie furent
issued as Technical Reports of the utilises comme Rapports Techniques de
Fisheries Research Board of Canada. l'office des recherches sur les pecheries
The series name was changed with du Canada. Le nom de la serie fut change
report number 457.) avec Ie rapport numero 457.)
AN EXAMINATION OF THE POSSIBLE EFFECTS OF SUDBURY NICKEL MINING AND SMELTING
OPERATIONS ON FISHES AND THE WATER CHEMISTRY OF LAKES WITHIN THE
WHITEFISH LAKE INDIAN RESERVE 1
by R. J. Beamish, G. A. McFarlane2 , J. C. VanLoon3 and J. Lichwa 3
This is the 247th Ceci est Ie 247th
Technical Report from the Rapport Technique de la Direction du
Research and Development Directorate Recherche et Developpement
Pacific Biological Station La Station de Biologie du Pacifique
Nanaimo, British Columbia Nanaimo, Colombie-Britannique
lIncludes a review of pollution research conducted in the Sudbury area.
2Present address: Department of the Environment, Freshwater Institute, Winnipeg, Manitoba.
3Present address: Department of Geology, University of Toronto, Toronto, Ontario.

- ii -
ACKNOWLEDGMENTS
The authors gratefully acknowledge the following people for their
assistance in the study: J. Drolet, L. Drolet, C. Royal, M. P. Stainton,
M. Capel, B. W. Hauser, R. K. Schade, L. M. Milanese, and T. Kozubski. The
Department of Indian Affairs supplied funds for helicopter services.

- ii i -
ABSTRACT
Beamish, R. J., G. A. McFarlane, J. C. VanLoon, and J. Lichwa. 1975. An examination of the possible effects of Sudbury nickel mining and smelting operations on fishes and the water chemistry of lakes within the Whitefish Lake Indian Reserve. Fish. Mar. Servo Res. Dev. Tech. Rep. 579: 52 p.
The following water chemistry parameters were determined from lakes
within the Whitefish Lake Indian Reserve: pH, alkalinity, sulfate, chloride,
nickel, copper, zinc, iron, lead, cadmium, manganese, sodium, potassium,
magnesium, calcium, hardness, silicate, total dissolved solids, conductivity,
total dissolved nitrogen, suspended nitrogen, total dissolved phosphorus,
suspended phosphorus, chlorophyl a. The low pH, high sulfate and heavy metal
content of some lakes indicated that lakes in the reserve have been contami
nated as a result of mining activities in Sudbury. In particular, (1) lakes
located to the south and west of the reserve had acid concentrations that
were harmful to fishes; (2) abnormally high concentrations of heavy metals,
particularly nickel, were found in most lakes. While the observed concentra
tions were below levels reported to be directly harmful to fishes, they were
within the range that has been found to be harmful to other aquatic
organisms; (3) the portion of the water system forming the north boundary of
the reserve was found to be heavily contaminated in almost all parameters
tested. Some of the observed concentrations exceeded internationally
accepted limits for drinking water. The high concentrations found from the
single location suggested that the entire water system forming the north and
west boundary of the reserve was also polluted. The extremely high concentra
tion of nickel from this location indicated that mining activities were at
least partially responsible for the contamination of this waterway. A second
survey of the five most acidic lakes showed that water chemistry was similar
to the initial survey and lakes were indeed acidic. These acidic lakes were
found to be relatively deep lakes situated in predominately soilless
drainages indicating the low acidity was not of natural origin. The most
acidic lake was surveyed for the presence of fish and none were captured.
- iv -
, ,-
RESUME
Beamish, R. J., G. A. McFarlane, J. C. VanLoon, et J. Lichwa. 1975. An examination of the possible effects of Sudbury nickel mining and smelting operations on fishes and the water chemistry of lakes within the Whitefish Lake Indian Reserve. Fish. Mar. Servo Res. Dev. Tech. Rep. 579: 52 p.
Les parametres chimiques suivants de l'eau de lacs a l'interieur
de la reserve indienne du lac Whitefish ont ete determines: pH, alcalinite,
sulfate, chlore, nickel, cuivre, zinc, fer, plomb, cadmium, manganese,
sodium, potassiwn, magnesium, calcium, duret~, silicate, matieres dissoutes
totales, conductivite, azote dissous total, azote en suspension, phophore
dissous total, phosphore en suspension et chlorophylle a. La faible valeur du
pH et les concentrations elevees de sulfate et de m~taux lourds de certains
lacs indiquent que ceux-ci ont ete contamines par les activites mini~res a Sudbury. En particulier, (1) les concentrations acides des lacs situes au
sud et a l'ouest de la reserve etaient nocives pour les poissons; (2)
la plupart des lacs possedaient des concentrations ~levees anormales de metaux
lourds, surtout de nickel. Bien que les concentrations observees etaient
inferieures aux niveaux consideres directement nocifs pour les poissons, elles
atteignaient les niveaux juges dangereux pour d'autres organismes aquatiques.
(3) La partie du reseau hydrographique formant la limite nord de la reserve
etait fortement contaminee pour presque tous les parametres examines.
Quelques-unes des concentrations depassaient les limites internationales
acceptables pour l'eau potable. Les fortes teneurs enregistrees a cet endroit
nous portent a croire que tout Ie reseau hydrographique formant la limite nord
et ouest de la reserve etait egalement polluee. Les concentrations de nickel
extr~ement fortes a cet endroit indiquent que les activites minieres sont
responsables au moins en partie pour la contamination de cette voie d'eau.
Un deuxieme releve aupres des cinq lacs les plus acides a ete effectue et " ,. ",. ....
des resultats semblables ont ete obtenus pour les parametres chimiques
de l'eau; ces lacs etaient donc veritablement acides. Les lacs acides
etaient relativement profonds et situes surtout dans des regions de drainage
sans transport de terre, ce qui indique que l'acidite n'etait pas d'origine
naturelle. On a voulu savoir si Ie lac Ie plus acide contenait des pOissons, '" '" , mais aucun n'a ete capture.

REVIEW OF INFORMATION CONCERNING THE GENERAL PROBLEM OF ACIDIFICATION OF LAKES BY ATMOSPHERIC FALLOUT AND IN PARTICULAR TO THE CAUSES AND EFFECTS OF ACID AND HEAVY METAL FALLOUT IN THE SUDBURY AREA
In the atmosphere sulfur dioxide oxidizes and hydrolyzes to form dilute concentrations of sulfuric acid at rates depending on humidity, the presence of catalytic metallic salts and other factors (Junge and Ryan 1958; Foster 1969; Scott and Hobbs 1967; McKay 1971). Once formed acid is transported in the air as small hygroscopic particles. These particles can be washed out of the atmosphere by falling raindrops or can accumulate on surfaces through "dry fallout." At high humidities Gartrell et al. (1963) reported that oxidation to sulfuric acid could be quite rapid. They measured sulfuric acid in a plume at varying distances from the source and found that sulfuric acid concentrations ranged from 2 to 55% of the total sulfur present after 60-108 minutes. Little information exists concerning the relative amounts of "dry acid fallout," but its effects on the environment have been described as being potentially more destructive than acidic precipitation (Oden 1971).
In the atmosphere gases or acid particles can be transported considerable distances. In a Swedish study it was found that very little sulfur dioxide fell out within 10 km (6.2 miles) of the source, while 50% fell out within 100 km (62 miles) and the rest was spread over considerable distances (Oden 1971). Greater air turbulence in summer was reported to increase diffusion distance. Winchester and NiFong (1971) calculated a deposition velocity of 0.5 cm/sec (1.25 in/sec) for pollution aerosols. Particles released at a 100 m (109 ft) altitude would fall back to ground after 5.6 hr. A wind speed of 18 km/hr (11 mph) would carry particles released at this altitude 100 krn (62 miles) .
We are beginning to understand the importance and ecological consequences of atmospheric transport of pollutants. There are several studies that demonstrate the important influence atmospheric transport of materials can have on lake and soil chemistry. Acid precipitation has resulted in the acidification of Scandinavian fresh waters (Od~n and Ahl 1970). Gorham (1958) showed that precipitation was the principal source of major ions of lakes studied in the English Lake District. Likens (1972) has demonstrated that in the Central Finger Lakes Region of New York , the supply of nutrients and other chemicals from precipitation can have a significant effect on the aquatic and terrestrial ecosystems. Contamination of soil and vegetation by airborne metals has been demonstrated by Greszta and Godzik (1969), Ontario Research Foundation (1949), Buchauer (1973), and Whitby and Hutchinson (1974). Aerosol fallout of heavy metals has been shown to have contributed significantly to heavy metal concentration of Lake Michigan (Winchester and NiFong 1971). In general the problem of atmospheric fallout of acid is serious and has been described as "Europe's greatest environmental problem" (Oden 1971) and a problem of highest priority for the Environmental Protection Agency in the United States (Robinson 1971).
The Sudbury area probably represents Canada's greatest single source of sulfur dioxide. A report by the Ontario Research Foundation (1949) noted that from 1940 to 1945, Sudbury smelting operations were responsible for the annual release of 2.76 million tons of sulfur dioxide into the atmosphere. Based on government reports, Beamish and Harvey (1972) estimated that in 1969,
- 2 -
2.6 million tons of sulfur dioxide were released into the atmosphere. A study of all sulfur oxide emissions from Canada in 1970 estimated that the smelters and the city of Sudbury produced 2.9 million tons of sulfur oxides (EPS 1973). From this 1970 survey it was shown that Sudbury accounted for 50% of Canada's total sulfur oxide emissions. A study of the total sulfur oxide emissions from the entire United States in 1968 was made by the Massachusetts Institute of Technology (1970). The 2.6 million tons emitted in Sudbury in 1969 was equivalent to approximately 9% of the total United States emissions. These independent estimates indicate that the Sudbury smelting operations have at least in the past, released almost incredible amounts of sulfur dioxide into the atmosphere.
Sudbury smelters also release . large quantities of heavy metals into the atmosphere. Stack emission reports prepared by one of the mining companies indicate that approximately 14,500 tons of iron, 2,000 tons of nickel, and 1,800 tons of copper have been released annually into the atmosphere over the last decade (Falkowski 1973). By comparison, annual heavy metal emissions from Chicago, Milwaukee, and Northwest Indiana were estimated to be 95,000 tons of iron, 1,100 tons of nickel, and 3,500 tons of copper (Winchester and NiFong 1971). The quantities of heavy metals emitted in Sudbury compare to almost 200% of the nickel, 50% of the copper, and 15% of the iron that is released into the atmosphere from this heavily industrialized area of the United States.
The large amounts of sulfur oxides and heavy metals released into the atmosphere around Sudbury have been associated with damage to plants and animals at distances of at least 65 km (30 miles) from the smelters. Prevailing wind directions in the Sudbury area are northeast and southwest (Fig. 1). Figure 2 has been redrawn from Dreisinger and McGovern (1970) and shows mean ground sulfur dioxide concentrations from 1964 to 1968. By comparing the two figures it is apparent that sulfur dioxide falls out in decreasing concentrations from the smelters in the direction of the prevailing winds. A similar fallout pattern occurs for nickel, iron and copper (McGovern and Basilile 1973; Kramer 1973a). A study of the dispersion of the Sudbury smelter plumes showed that the plumes from the three smelters operated by the International Nickel Co. Ltd. and the one operated by Falconbridge Nickel Mines Ltd. combined to form a plume that was approximately 25 km (16 miles) wide and contained sulfur dioxide concentrations ranging from 0.3 to 0.02 ppm at a distance of 40 km (25 miles) from Sudbury (Whaley and Lee 1971). Whaley and Lee (1974) used the plume dispersion study to show that high groundlevel sulfur dioxide concentrations measured at a site 36 km (22 miles) southwest of the Sudbury smelters during fumigation conditions, could be attributed to Sudbury smelter emissions. These authors computed ground level sulfur dioxide levels using the plume dispersion study and Sudbury smelter production figures, and were able to obtain a good correlation between observed and predicted groundlevel sulfur dioxide levels over the period 1961-1971.
As previously indicated, substances in a plume can be washed out of the atmosphere in precipitation or fallout as an aerosol or "dry" fallout. Water in the atmosphere (in equilibrium with mean carbon dioxide pressures) has a natural pH of approximately 5.7 (Barrett and Brodin 1955). In the immediate Sudbury area the pH of precipitation has been reported to average about 4.5 with an extreme low of 3.2 (Kramer 1973a). At some distance from

- 3 -
024 I I
WIND HOURS
Fig. 1. Average percentage of time wind blew in each of 16 compass directions. Length of arrows indicates the average percentage of
wind-hours that were recorded for each direction from 1961 to 1972. Data from Department of Transport monthly record of meteorological observations in Canada.
S02 CONCENTRATION (PPM)
~~.030
~.020- . 030
~.010- .020
~.005-.010
Lake Huron
Whitefish La
Fig. 2. Average ground concentrations of sulfur dioxide in the Sudbury area from 1964 to 1968. (Figure reproduced from Dreisinger and McGovern
1970.)

- 5 -
Sudbury, in the La Cloche Mountains the average pH of precipitation was 4 . 2 with an extreme low of 2.9 (Beamish and Harvey 1972; Beamish and VanLoon, unpublished data). The pH is recorded on a logarithmic scale and a change from pH 5.7 to 4.7 represents a 10-fold increase in acidity while a change from 5.7 to 3.7 represents a 100-fold increase. Thus the average acidity of precipitation in the Sudbury and La Cloche Mountain areas ranges from 15 to 30 times the natural acidity of rain water. The extreme low pH values range from 100 to almost 1000 times the natural value.
Precipitation in the Sudbury area also contains high concentrations of heavy metals, especially nickel (Beamish 1974a; Kramer 1973a). Kramer (1973b) claimed that most of northern Ontario has been subjected to rates of fall of nickel that are 10 times the rate observed in the continental United States. Kramer (l973a) also concluded that the "precipitation was not generally fit for consumption because of high levels of trace metals." "Dry" fallout studies suggest that substantial amounts of acid and heavy metals that accumulate on rock surfaces during periods of no rainfall are washed into lakes during periods of precipitation. The accumulation of acid on rock surfaces may also influence weathering and indirectly contribute to additions of harmful substances to a lake (Beamish and VanLoon, unpublished data). The consistent observation that substances or byproducts of substances known to be emitted from the smelters, occur in precipitation; the evidence that concentrations decrease with distance from the smelters; the calculations showing that the plume disperses over great distances and is responsible in some areas for high groundlevel sulfur dioxide concentrations; the effective "labelling" of this plume by the large nickel emissions and the anomalously high nickel concentrations in precipitation leave little doubt that fallout of substances from the plume is occurring in the Sudbury area .
The deleterious effects of this fallout on plants and soils in the Sudbury area has been demonstrated in numerous studies over the past 30 years (McCallum 1944; Linzon 1958, 1966, 1971; Gorham and Gordon 1960a, 1960b; McGovern and Basillie 1972, 1973; Hutchinson and Whitby 1973; LeBlanc et al. 1972; Stokes et al. 1973; Costescu and Hutchinson 1972; and others). However the effects of Sudbury emissions on the aquatic ecosystem have not been as extensively studied. Studies undertaken in the early 1960's did show a deterioration in water quality of lakes and ponds in the immediate Sudbury area (Gorham and Gordon 1960a, 1963) and recently lakes located in the La Cloche Mountains some 35-40 miles southwest of the smelters have been found to be too acidic to support fishes (Beamish and Harvey 1972; Beamish 1974a, 1974b; Beamish et al. 1975) . In some of these lakes the concentration of acid has increased more than 100-fold between 1960 and 1970 (Beamish and Harvey 1972). The increased acidity appears to have resulted from additions of sulfuric acid to the lakes (Beamish 1974a). The origin of this acid has been shown to result from non-natural causes, entering the lakes from atmospheric fallout (Beamish and Harvey 1972; Beamish 1974a). To determine the origin of the acid entering the La Cloche Mountain lakes, sulfate concentrations were measured from over 100 lakes southwest of Sudbury. Sulfate concentrations were highest close to the smelters and decreased with distance from the smelters (H. H. Harvey, unpublished MS). The measured levels of positively and negatively charged ions in one of these lakes indicated that the levels of sulfate ion were partially balanced by hydrogen ions , thus forming a solution of sulfuric acid (Beamish 1974a). Thus part of
- 6 -
the sulfate that was entering the lake from the atmosphere was in the form of sulfuric acid and was contributing to the low pH of the lake. It is reasonable to assume the same process occurs in other lakes.
Beamish et al. (1975) conducted a detailed study of the acidification process in one lake and its effects on the fish populations. In this study it was shown that the lake was acidifying at a rate of approximately 0.13 pH units per year. It appears that the acidification of lakes is a slow process requiring several decades of acid additions before the pH of the lake is sufficiently depressed to a level where all fishes are extinct. It was observed that the extinction of fish populations commences with the loss of species such as smallmouth bass, walleye and lake trout, and ends with the loss of most acid-resistent species such as yellow perch, lake herring and cyprinids. The gradual increase in acidity does not appear to be immediately acutely lethal rather the reproduction of a species is arrested and the population may become extinct due to an absence of recruitment of young and perhaps reduced longevity. During this period the species composition of the lake may change as the top predators become extinct and resistent species such as yellow perch become more numerous. In the La Cloche Mountain area the increased acidity has resulted in the extinction of virtually all fishes from at least 33 lakes and a partial loss of species from an additional 37 lakes (Beamish and Harvey 1972). These lakes were identified from a survey of 150 lakes and it is estimated that there are many other acidic lakes in the La Cloche area alone.
The study of the La Cloche Mountain lakes illustrates some important considerations concerning sulfur dioxide fallout in the Sudbury area. The distance of this area from Sudbury insures that it receives lower concentrations of sulfur oxides (Fig. 2). However the local geology is most important in modifying the effects of acid faliout and the quartzite in the La Cloche Mountains does not contribute sufficient neutralizing capacity to the lakes resulting in the acidification of these lakes despite their distance from the smelters. Also the acidification of these lakes and resulting loss of fishes has occurred since the early 1960's. Thus the effects are recent and probably increasing.
STUDY OF WATERS ON OR BORDERING THE WHITEFISH LAKE INDIAN RESERVE
Introduction
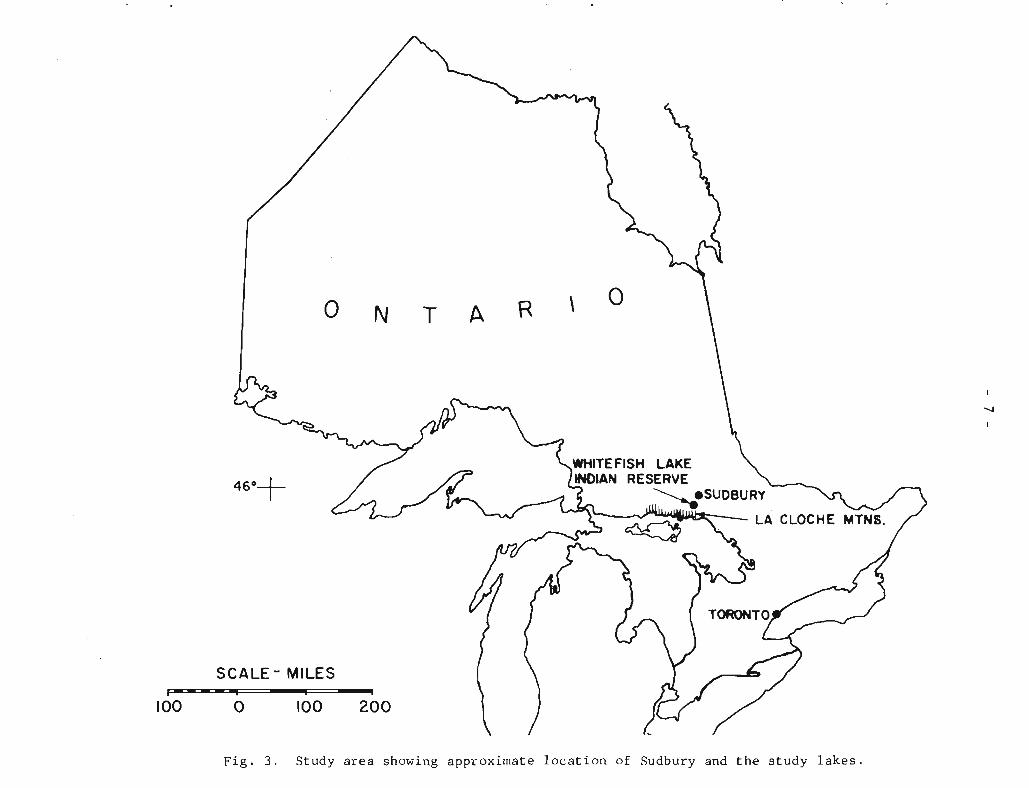
The Whitefish Lake Indian Reserve is situated in the direction of the prevailing winds between Sudbury and the La Cloche Mountain lakes. The reserve receives abnormally high concentrations of sulfur dioxide ranging in concentrations from 0.005 to 0.020 ppm (Dreisinger and McGovern 1970). During the period 1954-1968 there were 50 days in which the area received sulfur dioxide fumigations that were potentially injurious to plants (Dreisinger 1965, 1967; Dreisinger and McGovern 1968, 1969, 1970). Thus this area receives greater concentrations of sulfur oxides than the La Cloche Mountain lakes and it is possible that some changes in the aquatic ecosystem have occurred during the last few decades.
o N T A R \ o
SCALE - MILES "1
100 a 100 200
Fig. 3. Study area showing approximate location of Sudbury and the study lakes.

- 9 -
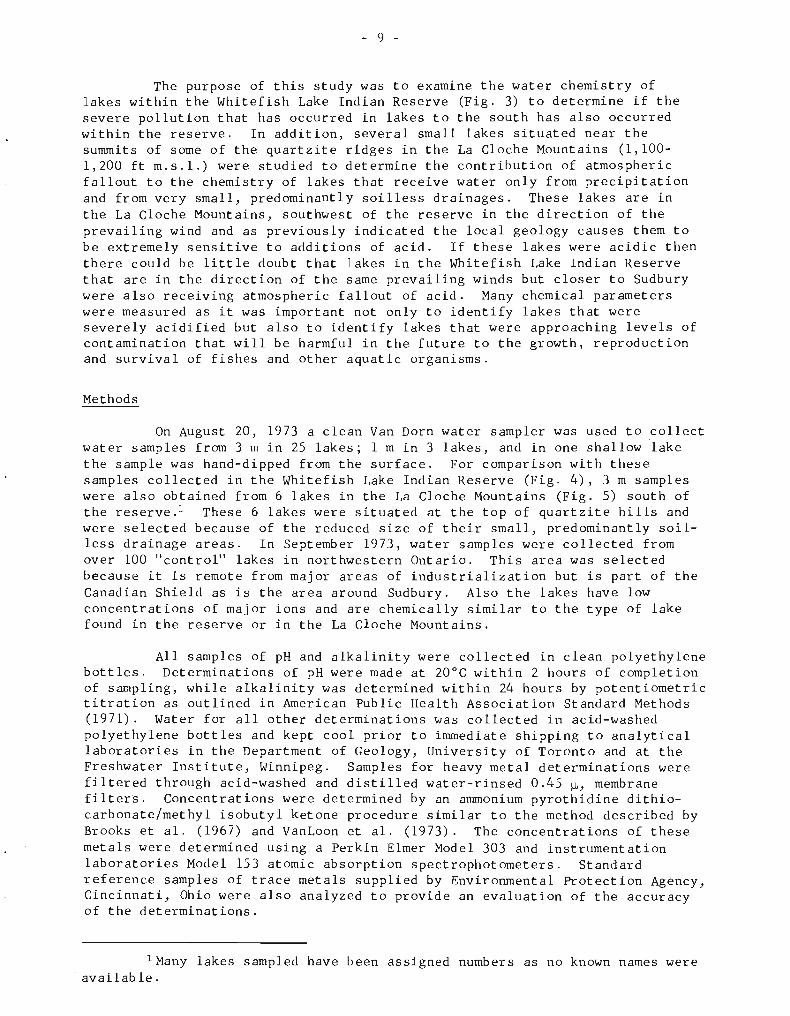
The purpose of this study was to examine the water chemistry of lakes within the Whitefish Lake Indian Reserve (Fig. 3) to determine if the severe pollution that has occurred in lakes to the south has also occurred within the reserve. In addition, several small lakes situated near the summits of some of the quartzite ridges in the La Cloche Mountains (1,100-1,200 ft m.s.l.) were studied to determine the contribution of atmospheric fallout to the chemistry of lakes that receive water only from precipitation and from very small, predominantly soilless drainages. These lakes are in the La Cloche Mountains, southwest of the reserve in the direction of the prevailing wind and as previously indicated the local geology causes them to be extremely sensitive to additions of acid. If these lakes were acidic then there could be little doubt that lakes in the Whitefish Lake Indian Reserve that are in the direction of the same prevailing winds but closer to Sudbury were also receiving atmospheric fallout of acid. Many chemical parameters were measured as it was important not only to identify lakes that were severely acidified but also to identify lakes that were approaching levels of contamination that will be harmful in the future to the growth, reproduction and survival of fishes and other aquatic organisms.
Methods
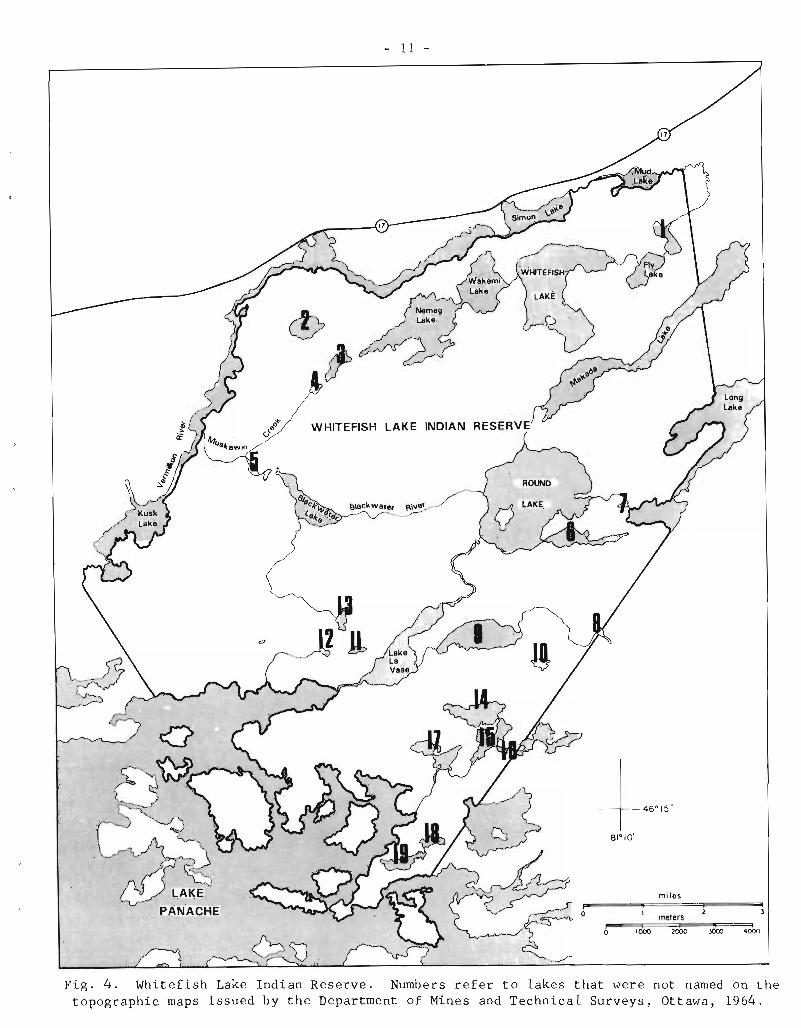
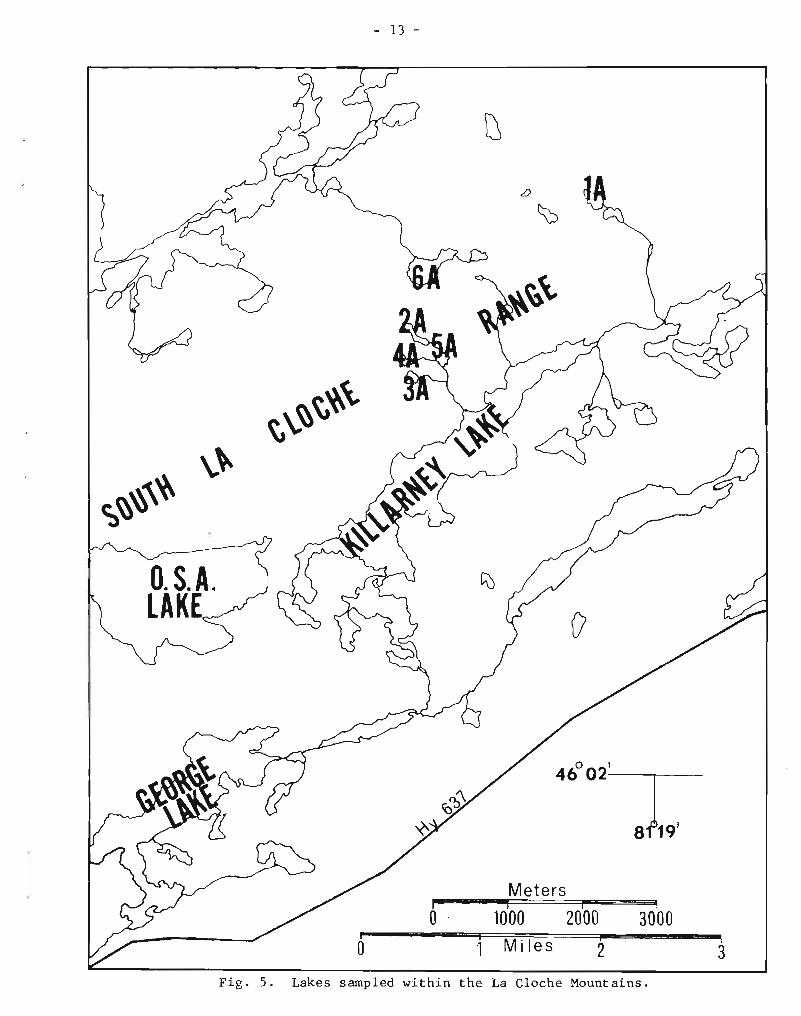
On August 20, 1973 a clean Van Dorn water sampler was used to collect water samples from 3 m in 25 lakes; 1 m in 3 lakes, and in one shallow lake the sample was hand-dipped from the surface. For comparison with these samples collected in the Whitefish Lake Indian Reserve (Fig. 4), 3 m samples were also obtained from 6 lakes in the La Cloche Mountains (Fig. 5) south of the reserve. 1 These 6 lakes were situated at the top of quartzite hills and were selected because of the reduced size of their small, predominantly soilless drainage areas. In September 1973, water samples were collected from over 100 "control" lakes in northwestern Ontario. This area was selected because it is remote from major areas of industrialization but is part of the Canadian Shield as is the area around Sudbury. Also the lakes have low concentrations of major ions and are chemically similar to the type of lake found in the reserve or in the La Cloche Mountains.
All samples of pH and alkalinity were collected in clean polyethylene bottles. Determinations of pH were made at 20°C within 2 hours of completion of sampling, while alkalinity was determined within 24 hours by potentiometric titration as outlined in American Public Health Association Standard Methods (1971). Water for all other determinations was collected in acid-washed polyethylene bottles and kept cool prior to immediate shipping to analytical laboratories in the Department of Geology, University of Toronto and at the Freshwater Institute, Winnipeg. Samples for heavy metal determinations were filtered through acid-washed and distilled water-rinsed 0.45 ~, membrane filter 's. Concentrations were determined by an ammonium pyrothidine dithiocarbonate/methyl isobutyl ketone procedure similar to the method described by Brooks et al. (1967) and VanLoon et al. (1973). The concentrations of these metals were determined using a Perkin Elmer Model 303 and instrumentation laboratories Model 153 atomic absorption spectrophotometers. Standard reference samples of trace metals supplied by Environmental Protection Agency, Cincinnati, Ohio were also analyzed to provide an evaluation of the accuracy of the determinations.
IMany lakes sampled have been assigned numbers as no known names were , availab Ie.

- 11 -
mil es I 0
meters I t
1000 2000 lOOO 4000
Fig. 4. Whitefish Lake Indian Reserve. Numbers refer to lakes that were not named on the topographic maps issued by the Department of Mines and Technical Surveys, Ottawa, 1964.

\.~ f::, ~ ~'\ '+.
O.S.A. LAKE
- l3 -
46° 02-1
------;--
Meters , i i ; o . 1000 2000 3000
i Mi les 2
Fig. 5. Lakes sampled within the La Cloche Mountains.
I 3

- 15 -
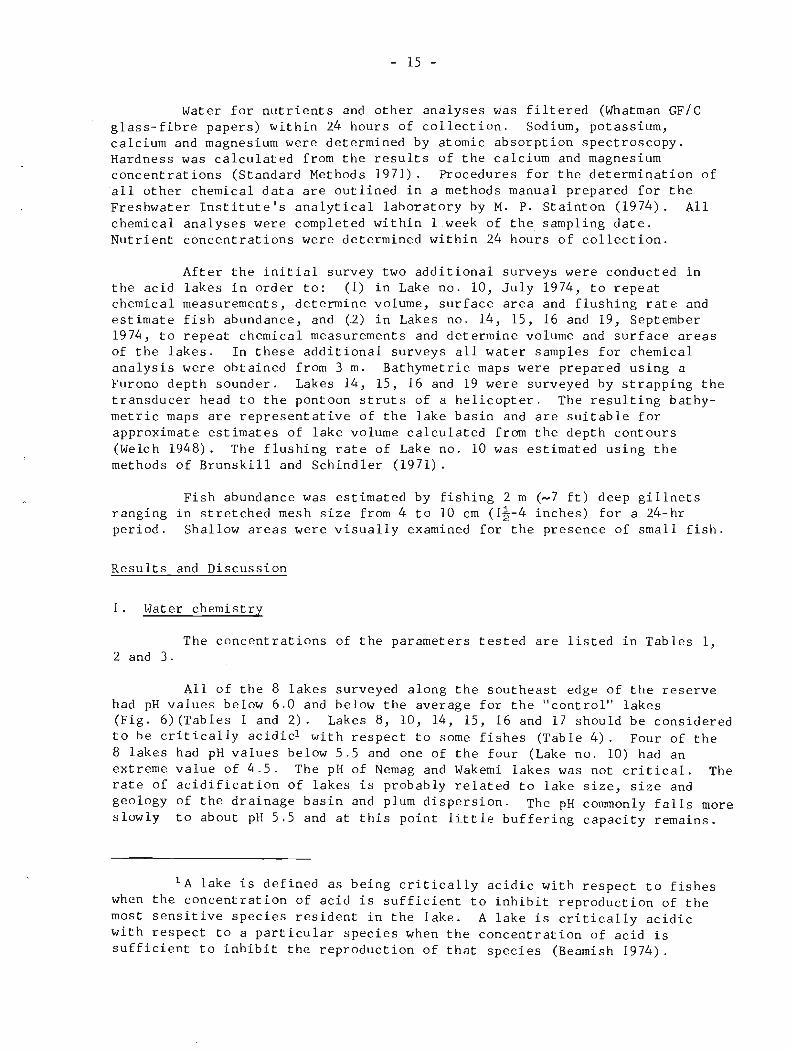
Water for nutrients and other analyses was filtered (Whatman GF/C glass-fibre papers) within 24 hours of collection. Sodium, potassium, calcium and magnesium were determined by atomic absorption spectroscopy. Hardness was calculated from the results of the calcium and magnesium concentrations (Standard Methods 1971). Procedures for the determination of all other chemical data are outlined in a methods manual prepared for the Freshwater Institute's analytical laboratory by M. P. Stainton (1974). All chemical analyses were completed within 1 . week of the sampling date. Nutrient concentrations were determined within 24 hours of collection.
After the initial survey two additional surveys were conducted in the acid lakes in order to: (1) in Lake no. 10, July 1974, to repeat chemical measurements, determine volume, surface area and flushing rate and estimate fish abundance, and (.2) in Lakes no. 14, 15, 16 and 19, September 1974, to repeat chemical measurements and determine volume and surface areas of the lakes. In these additional surveys all water samples for chemical analysis were obtained from 3 m. Bathymetric maps were prepared using a Furono depth sounder. Lakes 14, 15, 16 and 19 were surveyed by strapping the transducer head to the pontoon struts of a helicopter. The resulting bathymetric maps are representative of the lake basin and are suitable for approximate estimates of lake volume calculated from the depth contours (Welch 1948). The flushing rate of Lake no. 10 was estimated using the methods of Brunskill and Schindler (1971).
ranging period.
Fish abundance was estimated by fishing 2 m (-7 ft) deep gillnets in stretched mesh size from 4 to 10 cm (li-4 inches) for a 24-hr
Shallow areas were visually examined for the presence of small fish.
Results and Discussion
1. Water chemistry
The concentrations of the parameters tested are listed in Tables 1, 2 and 3.
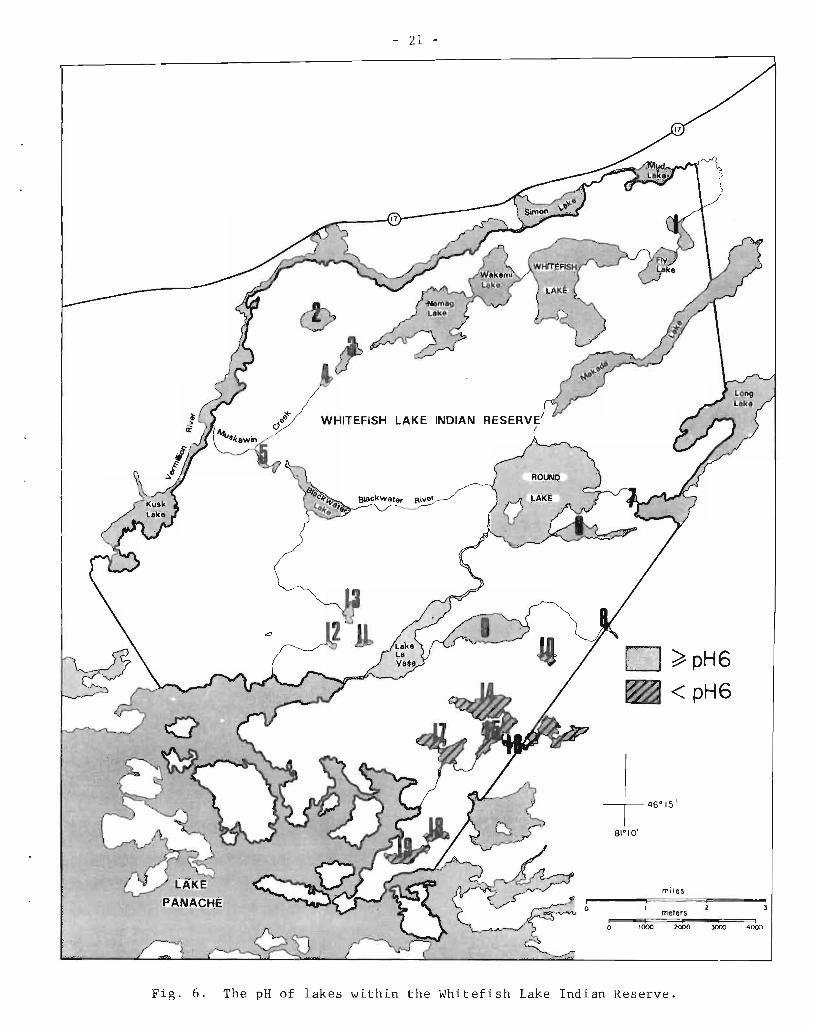
All of the 8 lakes surveyed along the southeast edge of the reserve had pH values below 6.0 and below the average for the "control" lakes (Fig. 6)(Tables 1 and 2). Lakes 8, 10, 14, 15, 16 and 17 should be considered to be critically acidic1 with respect to some fishes (Table 4). Four of the 8 lakes had pH values below 5.5 and one of the four (Lake no. 10) had an extreme value of 4.5. The pH of Nemag and Wakemi lakes was not critical. The rate of acidification of lakes is probably related to lake size, size and geology of the drainage basin and plum dispersion. The pH commonly falls more slowly to about pH 5.5 and at this point little buffering capacity remains.
lA lake is defined as being critically acidic with respect to fishes when the concentration of acid is sufficient to inhibit reproduction of the most sensitive species resident in the lake. A lake is critically acidic with respect to a particular species when the concentration of acid is sufficient to inhibit the reproduction of that species (Beamish 1974).
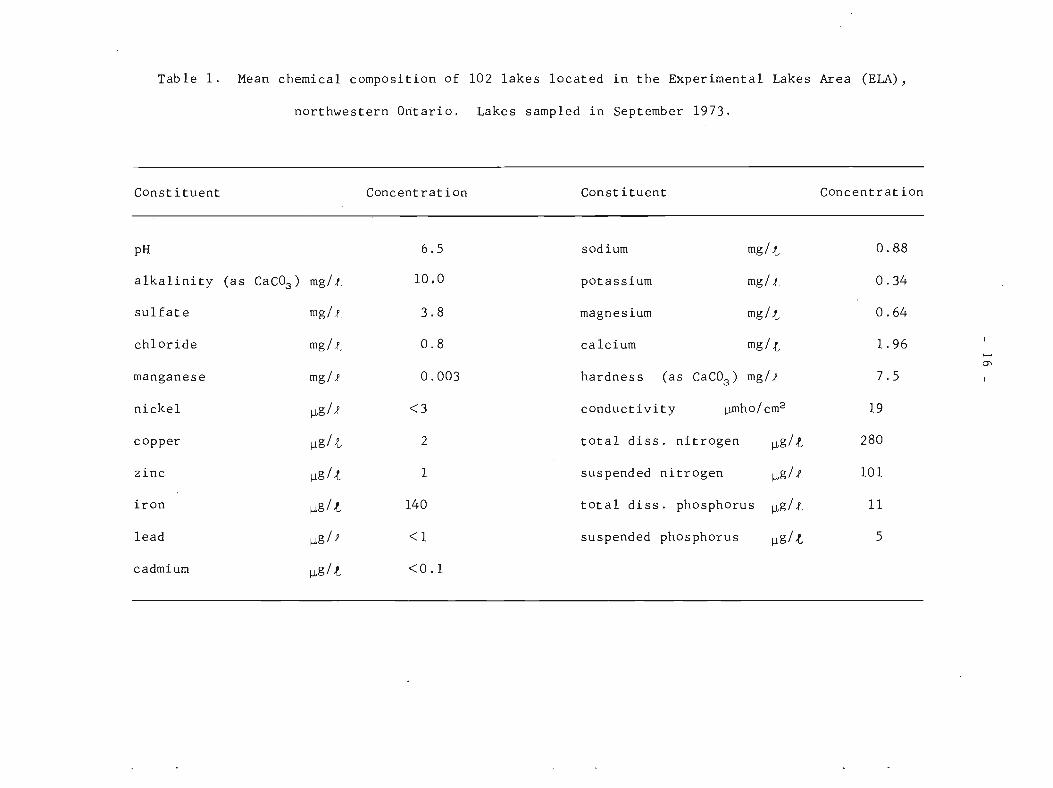
Table 1. Mean chemical composition of 102 lakes located in the Experimental Lakes Area (ELA) ,
northwestern Ontario. Lakes sampled in September 1973.
Constituent Concentration Constituent Concentration
pH 6.5 sodium mg/.{, 0.88
alkalinity (as CaC03 ) mg/~ . 10 , 0 potassium mg/ ~ . 0.34
sulfate mg/ !.. 3.8 magnesium mg/.{, 0.64
chloride mg/ !., 0 . 8 calcium mg/.{, 1. 96 ...... (]\
manganese mg/ !. 0.003 hardness (as CaC03
) mg/!. 7.5
nickel ~g/!. <3 conductivity w,mho/cm8 19
copper w,g/.{, 2 total diss. nitrogen ~g/.{, 280
z inc ~g / .{, 1 suspended nitrogen ~g/,f 101
iron ~g/.{, 140 total diss. phosphorus ~g/,f 11
lead ~g /J <1 suspended phosphorus ~g/.{, 5
cadmium ~g/.{, <0.1
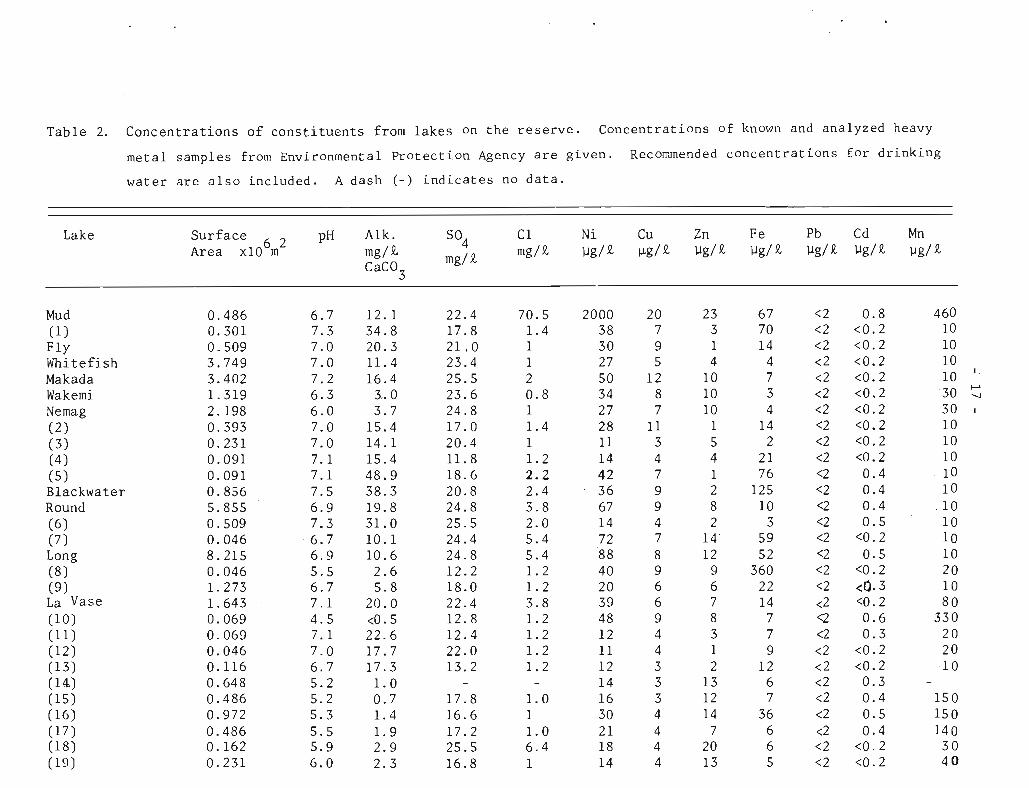
Table 2. Concentrations of constituents from lakes on the reserve. Concentrations of known and analyzed heavy
metal samples from Environmental Protection Agency are given. Recommended concentrations for drinking
water are also included. A dash (-) indicates no data.
Lake Surface 6 2 pH A1k. S04 C1 Ni Cu Zn Fe Pb Cd Mn Area x10 m mg/.Q. mg/R. mg/R. ].Jg/R. I-1g/R. ].Jg/ R. ].Jg/ R. ].Jg/ R. ].Jg/R. ~g/ R.
CaC03
Mud 0.486 6.7 12.1 22.4 70.5 2000 20 23 67 <2 0.8 460 (1) 0.301 7.3 34.8 17.8 1.4 38 7 3 70 <2 <0.2 10 Fly 0.509 7.0 20.3 21. 0 1 30 9 1 14 <2 <0.2 10 Whitefish 3.749 7.0 11. 4 23.4 1 27 5 4 4 <2 <0.2 10 Makada 3.402 7.2 16.4 25.5 2 50 12 10 7 <2 <0.2 10 Wakemi 1. 319 6.3 3 .. 0 23.6 0.8 34 8 10 3 <2 <0.2 30 Nemag 2.198 6.0 3.7 24.8 1 27 7 10 4 <2 <0.2 30 (2) 0.393 7.0 15.4 17.0 1.4 28 11 1 14 <2 <0.2 10 (3) 0.231 7.0 14.1 20.4 1 11 3 5 2 <2 <0.2 10 (4) 0.091 7.1 15.4 11. 8 1.2 14 4 4 21 <2 <0.2 10 (5) 0.091 7.1 48.9 18.6 2.2 42 7 1 76 <2 0.4 . 10 Blackwater 0.856 7.5 38.3 20.8 2.4 36 9 2 125 <2 0.4 10 Round 5.855 6.9 19.8 24.8 3.8 67 9 8 10 <2 0.4 . 10 (6 ) 0.509 7.3 31. 0 25.5 2.0 14 4 2 3 <2 0.5 10 (7) 0.046 6.7 10.1 24.4 5.4 72 7 14 59 <2 <0.2 10 Long 8.215 6.9 10.6 24.8 5.4 88 8 12 52 <2 0.5 10 (8) 0.046 5.5 2.6 12.2 1.2 40 9 9 360 <2 <0.2 20 (9) 1.273 6.7 5.8 18.0 1.2 20 6 6 22 <2 <0.3 10 La Vase 1.643 7.1 20.0 22.4 3.8 39 6 7 14 <2 <0.2 80 (10) 0.069 4.5 <0.5 12.8 1.2 48 9 8 7 <2 0.6 330 (11) 0.069 7.1 22.6 12.4 1.2 12 4 3 7 <2 0.3 20 ( 12) 0.046 7.0 17.7 22 . 0 1.2 11 4 1 9 <2 <0.2 20 (13) 0.116 6.7 17.3 13.2 1.2 12 3 2 12 <2 <0.2 10 (14) 0.648 5.2 1.0 14 3 13 6 <2 0.3 (15) 0.486 5.2 0.7 17.8 1.0 16 3 12 7 <2 0.4 150 (16) 0.972 5.3 1.4 16.6 1 30 4 14 36 <2 0.5 150 (17) 0.486 5.5 1.9 17.2 1.0 21 4 7 6 <2 0.4 140 (18) 0.162 5.9 2.9 25.5 6.4 18 4 20 6 <2 <0.2 30 (19) 0.231 6.0 2.3 16.8 1 14 4 13 5 <2 <0.2 40
I .
~
-...J
1
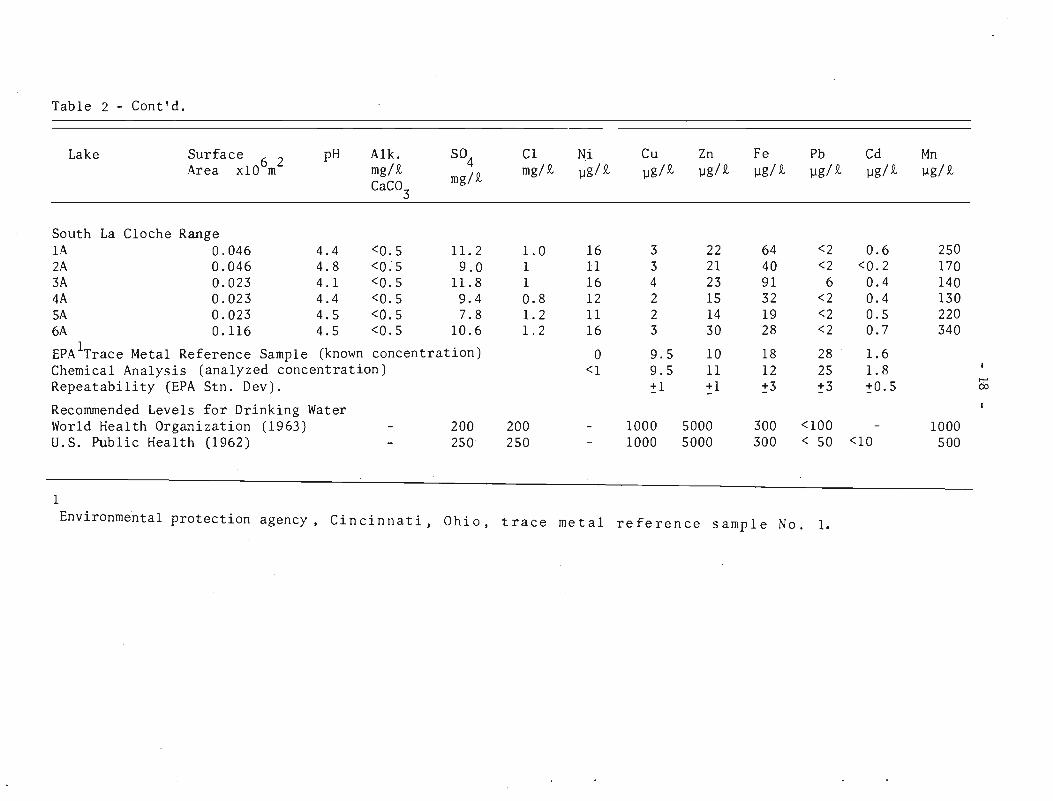
Table 2 - Cont'd.
Lake Surface 6 2 pH Alk. S04 Cl Ni Cu Zn Fe Pb Cd Mn Area xlO m mg/~
mg/~ mg/~ llg/~ llg/~ llg/~ llg/ ~ llg/~ llg/ ~ ).lg/~
CaC03
South La Cloche Range lA 0.046 4.4 <0.5 11.2 1.0 16 3 22 64 <2 0.6 250 2A 0.046 4.8 <0:5 · 9.0 1 11 3 21 40 <2 <0.2 170 3A 0 . 023 4.1 <0.5 11. 8 1 16 4 23 91 6 0.4 140 4A 0.023 4.4 <0.5 9.4 0.8 12 2 15 32 <2 0.4 130 SA 0.023 4.5 <0.5 7.8 1.2 11 2 14 19 <2 0.5 220 6A 0.116 4.5 <0.5 10.6 1.2 16 3 30 28 <2 0.7 340
EPAlTrace Metal Reference Sample (known concentration ) 0 9.5 10 18 28 1.6 Chemical Analysis (analyzed concentration) <1 9.5 11 12 25 1.8 Repeatability (EPA Stn. Dev). ~l +1 ~3 ~3 ~O . S d;
Recommended Levels for Drinking Water World Health Organization (1963) 200 200 1000 5000 300 <100 1000 U.S. Public Health (1962) 250 250 1000 5000 300 < 50 <10 500
1
Environmental protection agency, Cincinnati, Ohio, trace metal reference sample No.1.
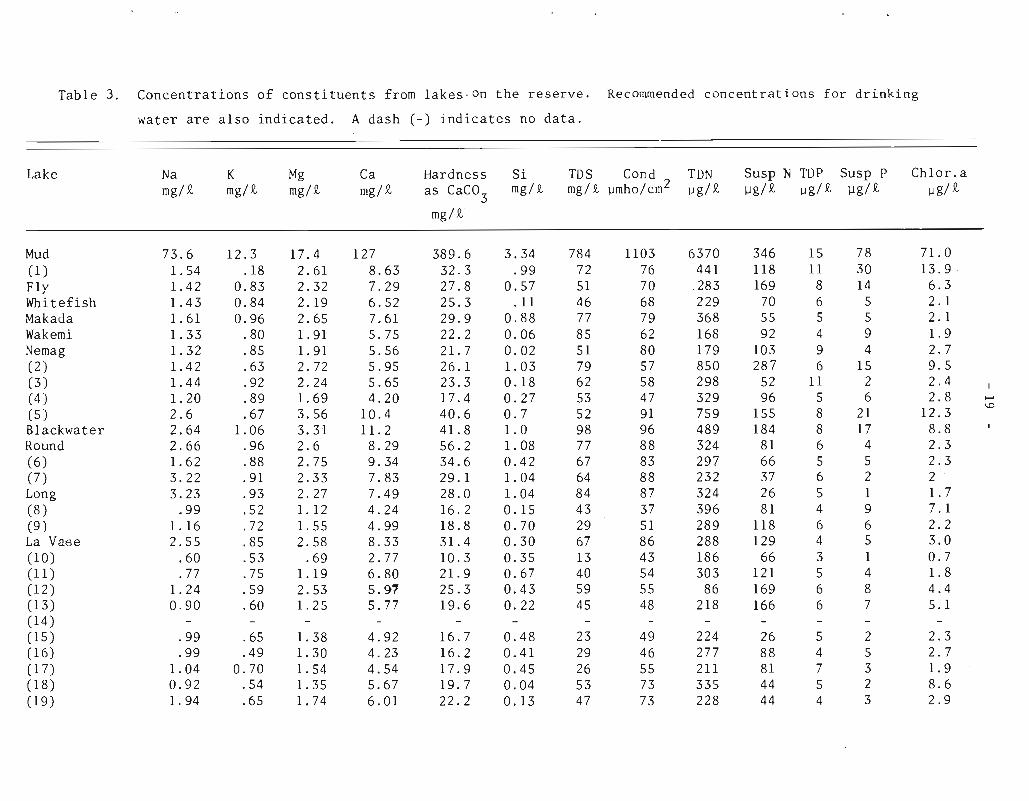
Table 3. Concentrations of constituents from lakes· on the reserve. Recommended concentrations for drinking
water are also indicated. A dash (-) indicates no data.
Lake Na K Mg Ca Hardness Si TDS Cond TON Susp N TOP Susp P Ch1or.a mg/R. mg/R. mg/R. mg/R. as CaC0
3 mg/ ~ mg/~ ~mho/cm2 ~g/R. flg/R. ~g/ R. flg/R. wg/ R.
mg/R.
Mud 73.6 12.3 17.4 127 389.6 3.34 784 1103 6370 346 15 78 71. 0 (1 ) 1. 54 .18 2.61 8.63 32.3 .99 72 76 441 118 11 30 13.9 · Fly 1. 42 0.83 2.32 7.29 27.8 0.57 51 70 283 169 8 14 6.3 Whitefish 1. 43 0.84 2.19 6.52 25.3 .11 46 68 229 70 6 5 2.1 Makada 1. 61 0.96 2.65 7.61 29.9 0.88 77 79 368 55 5 5 2.1 Wakemi 1. 33 .80 1. 91 5.75 22.2 0.06 85 62 168 92 4 9 1.9 Nemag 1. 32 .85 1. 91 5.56 21. 7 0.02 51 80 179 103 9 4 2.7 (2) 1. 42 .63 2.72 5.95 26.1 1. 03 79 57 850 287 6 15 9.5 (3) 1. 44 .92 2.24 5.65 23.3 0.18 62 58 298 52 11 2 2.4 (4 ) 1. 20 .89 1. 69 4.20 17.4 0.27 53 47 329 96 5 6 2.8 (5 ) 2.6 .67 3.56 10.4 40.6 0.7 52 91 759 155 8 21 12.3 Blackwater 2.64 1. 06 3.31 11. 2 41. 8 1.0 98 96 489 184 8 17 8.8 Round 2.66 .96 2.6 8.29 56.2 1. 08 77 88 324 81 6 4 2.3 (6) 1. 62 .88 2.75 9.34 34.6 0.42 67 83 297 66 5 5 2.3 (7) 3.22 .91 2.33 7.83 29.1 1. 04 64 88 232 37 6 2 2 Long 3.23 .93 2.27 7.49 28.0 1. 04 84 87 324 26 5 1 1.7 (8 ) .99 . 52 1. 12 4.24 16.2 0.15 43 37 396 81 4 9 7.1 (9) 1.16 .72 1. 55 4.99 18.8 0.70 29 51 289 118 6 6 2.2 La Vase 2.55 .85 2.58 8 . 33 31. 4 .0.30 67 86 288 129 4 5 3.0 (10) .60 .53 .69 2.77 10.3 0.35 13 43 186 66 3 1 0.7 (11) .77 .75 1. 19 6.80 21. 9 0.67 40 54 303 121 5 4 1.8 (12) 1. 24 .59 2.53 5.9-1 25.3 0.43 59 55 86 169 6 8 4.4 (13) 0.90 .60 1. 25 5.77 19.6 0.22 45 48 218 166 6 7 5.1 (14) (15) .99 .65 1. 38 4.92 16.7 0.48 23 49 224 26 5 2 2.3 (16) .99 .49 1. 30 4.23 16.2 0.41 29 46 277 88 4 5 2.7 ( 17) 1. 04 0.70 1. 54 4.54 17.9 0.45 26 55 211 81 7 3 1.9 (18) 0.92 .54 1. 35 5.67 19. 7 0.04 53 73 335 44 5 2 8.6 (19) 1. 94 .65 1. 74 6.01 22.2 0.13 47 73 228 44 4 3 2.9
t-'
'"
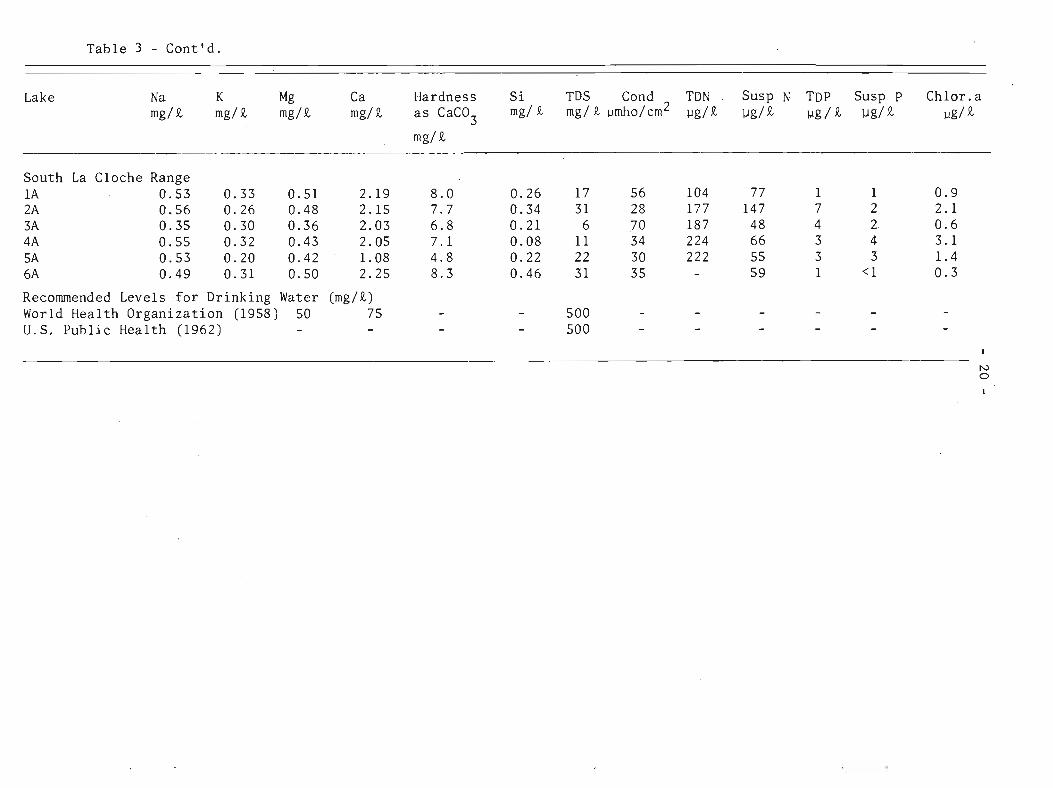
Table 3 - Cont'd.
Lake Na K Mg Ca Hardness Si TDS Cond TON Susp N TOP Susp P Ch1or.a mg/.R- mg/.R- mg/.R- mg/.R- as CaC03
mg/ £, mg/ £, umho/ cm2 ug/.R- ]..Ig/.R- lJ.g/.R- ]..Ig/ .R- ug/ .R-
mg/.R-
South La Cloche Range 1A 0.53 0.33 0.51 2.19 8.0 0.26 17 56 104 77 1 1 0.9 2A 0.56 0.26 0.48 2.15 7.7 0.34 31 28 177 147 7 2 2.1 3A 0.35 0.30 0.36 2.03 6.8 0.21 6 70 187 48 4 2 0.6 4A 0.55 0.32 0.43 2.05 7.1 0.08 11 34 224 66 3 4 3.1 SA 0.53 0.20 0.42 1.08 4.8 0.22 22 30 222 55 3 3 1.4 6A 0.49 0.31 0.50 2.25 8.3 0.46 31 35 59 1 <1 0.3
Reconunended Levels for Drinking Water (mg/£') World Health Organization (1958) 50 75 500 U.S. Public Health (1962) 500
N 0
- 21 -
LAKE INDIAN RESERVE
B'·'O'
o
~pH6
< pH6
miles
meters
1000 2000 JOOO <000
Fig. 6. The pH of lakes within the Whitefish Lake Indian Reserve.

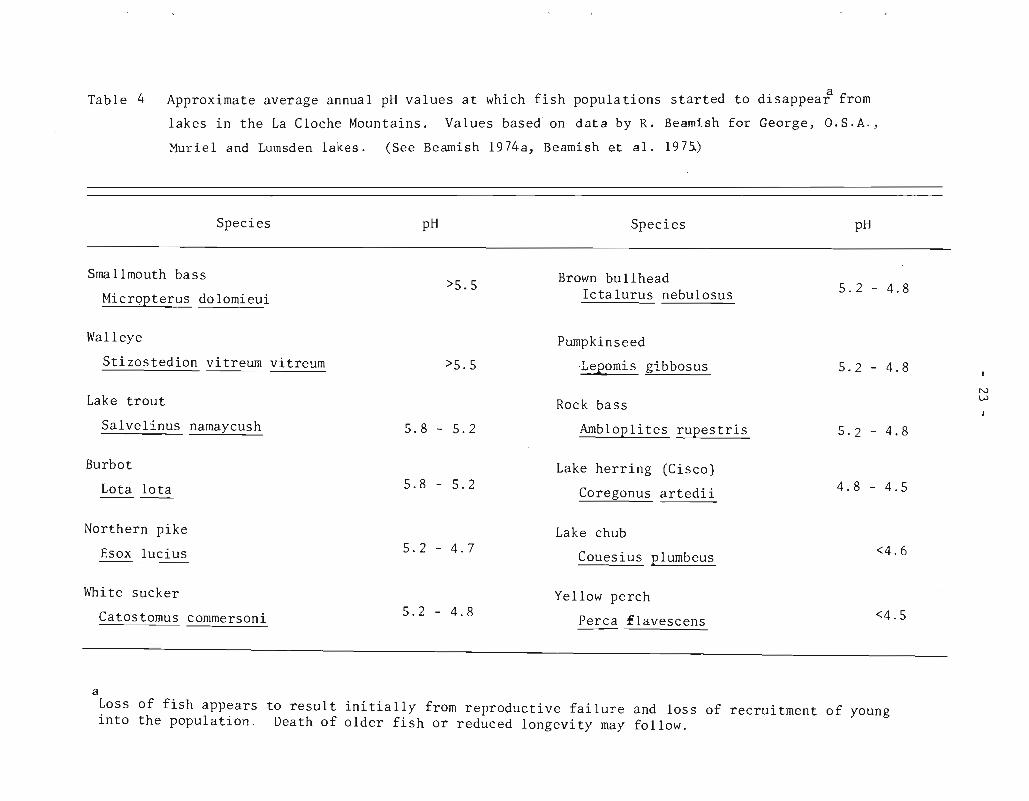
Table 4 Approximate average annual pH values at which fish populations started to disappeaf from
lakes in the La Cloche Mountains. Values based on data by R. Beamish for George, D.S.A.,
Muriel and Lumsden lakes. (See Beamish 1974a, Beamish et al. 197~)
Species pH Species pH
Smallmouth bass >5.5 Brown bullhead
5.2 - 4 . 8 Micropterus dolomieui Ictalurus nebulosus
Walleye Pwnpkinseed Stizostedion vitrewn vitreum >5.5 Le'pomis gibbosus 5.2 - 4.8
Lake trout Rock bass
Salvelinus namaycush 5.8 - 5.2 Ambloplites rupestris 5.2 - 4.8
Burbot Lake herring (Cisco) Lota Iota 5.8 - 5.2
Coregonus artedii 4.8 - 4.5 ----
Northern pike Lake chub Esox lucius 5.2 - 4.7
Couesius Elumbeus <4.6
White sucker Yellow perch
Catostomus commersoni 5.2 - 4.8 Perca flavescens <4.5
a Loss of fish appears to result initially from reproductive failure and loss of recruitment of young into the population. Death of older fish or reduced longevity may follow.
N W
- 24 -
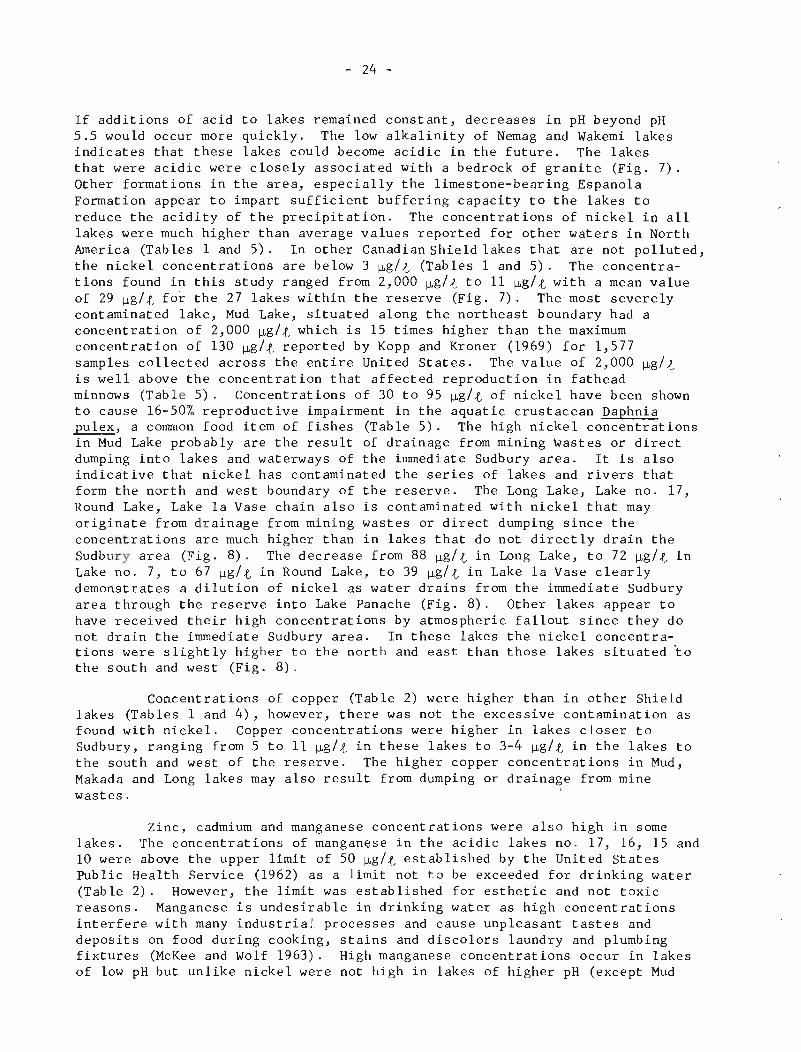
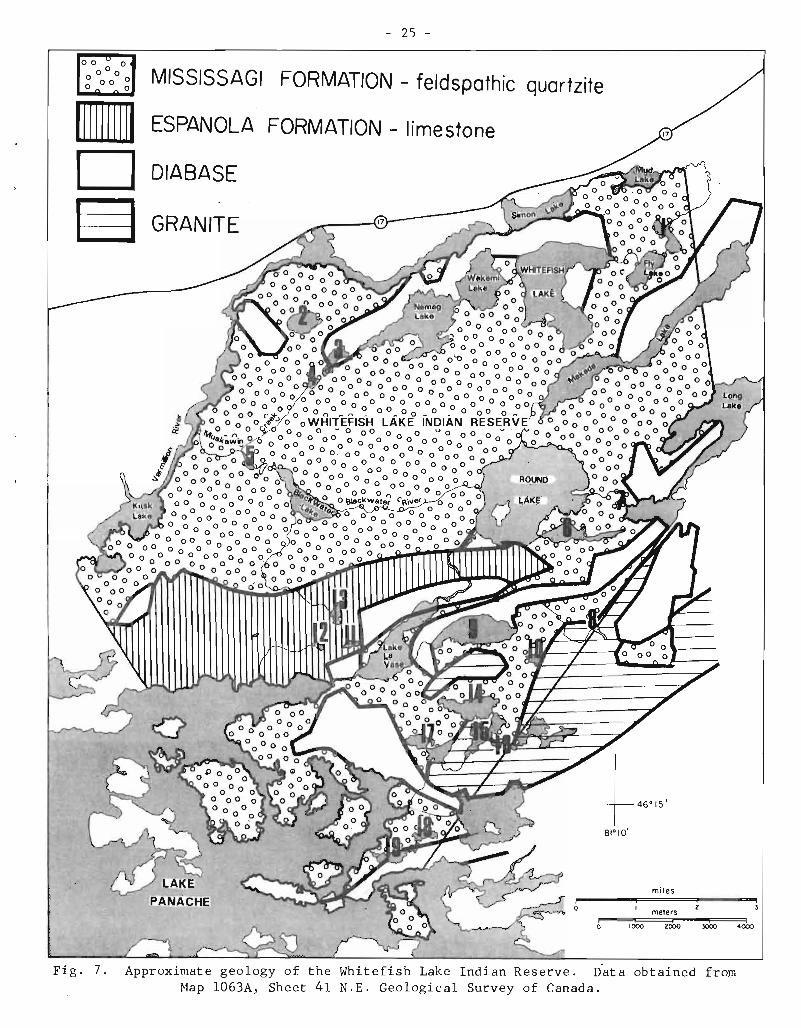
If additions of acid to lakes remained constant, decreases in pH beyond pH 5.5 would occur more quickly. The low alkalinity of Nemag and Wakemi lakes indicates that these lakes could become acidic in the future. The lakes that were acidic were closely associated with a bedrock of granite (Fig. 7). Other formations in the area, especially the limestone-bearing Espanola Formation appear to impart sufficient buffering capacity to the lakes to reduce the acidity of the precipitation. The concentrations of nickel in all lakes were much higher than average values reported for other waters in North America (Tables 1 and 5). In other Canadian Shield lakes that are not polluted, the nickel concentrations are below 3 ~g/t (Tables 1 and 5). The concentrations found in this study ranged from 2,000 ~g/t to 11 ~g/t with a mean value of 29 ~g/ t for the 27 lakes within the reserve (Fig. 7) . The most severely contaminated lake, Mud Lake, situated along the northeast boundary had a concentration of 2,000 ~g/t which is 15 times higher than the maximum concentration of 130 ~g/t reported by Kopp and Kroner (1969) for 1,577 samples collected across the entire United States. The value of 2,000 ~g/t is well above the concentration that affected reproduction in fathead minnows (Tab le 5). Concentrations of 30 to 95 ~g/ t of nickel have been shown to cause 16-50% reproductive impairment in the aquatic crustacean Daphnia pulex, a common food item of fishes (Table 5). The high nickel concentrations in Mud Lake probably are the result of drainage from mining wastes or direct dumping into lakes and waterways of the immediate Sudbury area. It is also indicative that nickel has contaminated the series of lakes and rivers that form the north and west boundary of the reserve. The Long Lake, Lake no. 17, Round Lake, Lake la Vase chain also is contaminated with nickel that may originate from dr ainage from mining wastes or direct dumping since the concent rat ions ar e much higher than in lakes that do not directly drain the Sudb ury area (F i g. 8). The decrease from 88 ~g/ t in Long Lake, to 72 ~g/t in Lake no. 7, to 67 ~g/t in Round Lake, to 39 ~g/ t in Lake la Vase clearly demonst r ates a dilution of nickel as water drains from the immediate Sudbury area through the reserve into Lake Panache (Fig. 8). Other lakes appear to have rec e ived t heir high concentrations by atmospheric fallout since they do not drain the immediate Sudbury area. In these lakes the nickel concentrations were slightly higher to the north and east than those lakes situated to the south and west (Fig. 8).
Conc entrations of copper (Table 2) were higher than in other Shield lakes (Tables 1 and 4), however, there was not the excessive contamination as found with nickel. Copper concentrations were higher in lakes closer to Sudbury, ranging from 5 to 11 ~g/ t in these lakes to 3-4 ~g/t in the lakes to the sout h and west of the reserve. The higher copper concentrations in Mud, Makada and Long lakes may also result from dumping or drainage from mine wastes.
Zinc, cadmium and manganese concentrations were also hi gh in some lakes. The concentrations of manganese in the acidic lakes no. 17, 16, 15 and 10 were above the upper limit of 50 ~g/t established by the United States Public Health Service (1962) as a limit not to be exceeded for drinking water (Table 2). However, the limit was established for esthetic and not toxic reasons. Manganese is undesirable in drinking water as high concentrations interfere with many industrial processes and cause unpleasant tastes and deposits on food during cooking, stains and discolors laundry and plumbing fixtures (McKee and Wolf 1963). High manganese concentrations occur in lakes of low pH but unlike nickel were not high in lakes of higher pH (except Mud
25 -
00 0 000 goo g MISSISSAGI FORMATION - feldspa"thic quartzite
_ ESPANOLA FORMATION - limestone
D DIABASE
§ GRANITE
o
81°10'
miles
meters
1000 2000
Fig. 7. Approximate geology of the Whitefish Lake Indian Reserve. Data obtained fro~ Map l063A J Sheet 41 N.E. Geological Survey of Canada.
4000

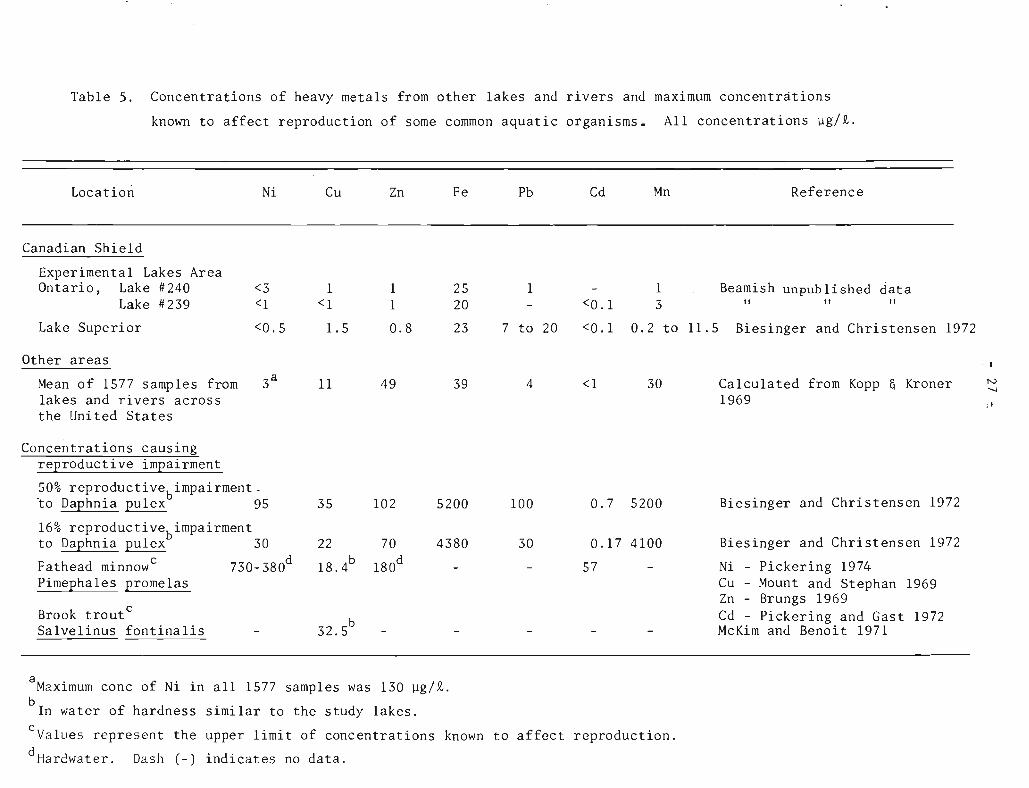
Table 5. Concentrations of heavy metals from other lakes and rivers and maximum concentrations
known to affect reproduction of some common aquatic organisms. All concentrations ~g/~.
Location Ni Cu Zn Fe
Canadian Shield
Experimental Lakes Area Ontario, Lake #240 <3 1 1 25
Lake #239 <I <I 1 20
Lake Superior <0.5 1.5 0.8 23
Other areas
Mean of 1577 samples from 3a II 49 39
lakes and rivers across the United States
Concentrations causing reEroductive imEairment
50% reproductivebimpairment-to DaEhnia pulex 95 35 102 5200
16% reproductivebimpairment to Daphnia pulex 30 22 70 4380
Fathead minnow C 730-380d l8.4b l80d
PimeEhales promelas
Brook trout C
32.5b Salvelinus fontinalis
aMaximum conc of Ni in all 1577 samples was 130 ~g/~.
bIn water of hardness similar to the study lakes.
Pb Cd Mn
1 1 <0.1 3
7 to 20 <0.1 0.2 to 1l.5
4 <1 30
100 0.7 5200
30 0.17 4100
57
cValues represent the upper limit of concentrations known to affect reproduction.
dHardwater. Dash (-) indicates no data.
Reference
Beamish unpublished data " " "
Biesinger and Christensen 1972
Calculated from Kopp & Kroner 1969
Biesinger and Christensen 1972
Biesinger and Christensen 1972
Ni - Pickering 1974 Cu - Mount and Stephan 1969 Zn - Brungs 1969 Cd - Pickering and Gast 1972 McKim and Benoit 1971
N
" i l


- 29 -
LAKE INDIAN
mil es
meters
Fig. 8. Concentrations of nickel in lakes within the Whitefish Lake Indian Reserve. Lines and arrows indicate major drainages.

- 31 -
Lake)', The elevated concentrations of manganese in lakes of low pH has also been reported from acidified Swedish lakes (Hornstrom et aI, 1973), It is also known that the smelters emit only reduced levels of manganese and therefore the increase in manganese concentration in acidic lakes appears to be related to the acidic precipitation causing increased weathering or solubility and not the direct result of fallout.
Sulfate concentrations average 19.5 mg/t and were high compared to many other freshwater lakes (Armstrong and Schindler 1971, Table 1). Except for Mud Lake which had excessive concentrations of almost all parameters tested, the lakes were not outstanding with respect to the other chemical determinations.
In Mud Lake, concentrations of sulfate, manganese, calcium and total dissolved solids exceeded allowable limits for drinking water (Tables 2 and 3). Only Mud Lake was studied, however it is apparent from the observed concentrations and drainage patterns that the system of lakes and rivers that form the north and west boundary of the reserve are contaminated.
2. Second survey of Lake no. 10
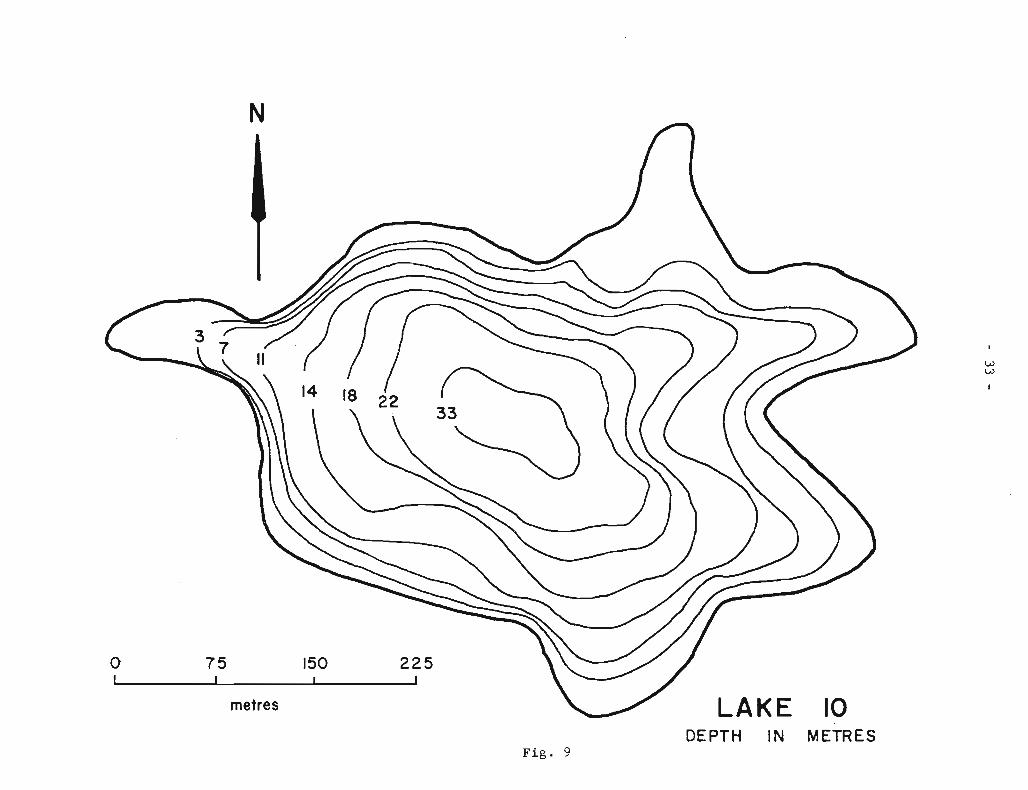
Lake no. 10 is situated at the summit of a hill known locally as Cranberry Hill. The NE and NW sides are steep, exposed bedrock. Low, predominately soilless rock cliffs surround the remainder of the lake. There are no inlets from other lakes. Water drains from the NE end and this outlet probably is dry during the summer months. The lake has a turquoise appearance that has been found to be characteristic of the acidic lakes to the south. Lake no. 10 is a small but deep lake with a maximum depth of 33 m (Fig. 9). It has a surface area of .069 X 106 m2 , a volume of 0.9 X 10⁶ m3 , and a terrestrial drainage area of .076 X 106 m2 .
Using the precipitation records and evaporation maps compiled by the De partment of Transport for the Sudbury area and estimating evapotranspiration (Pe nman 1948), it was estimated that the lake had a flushing rate or renewal time of 17 years.
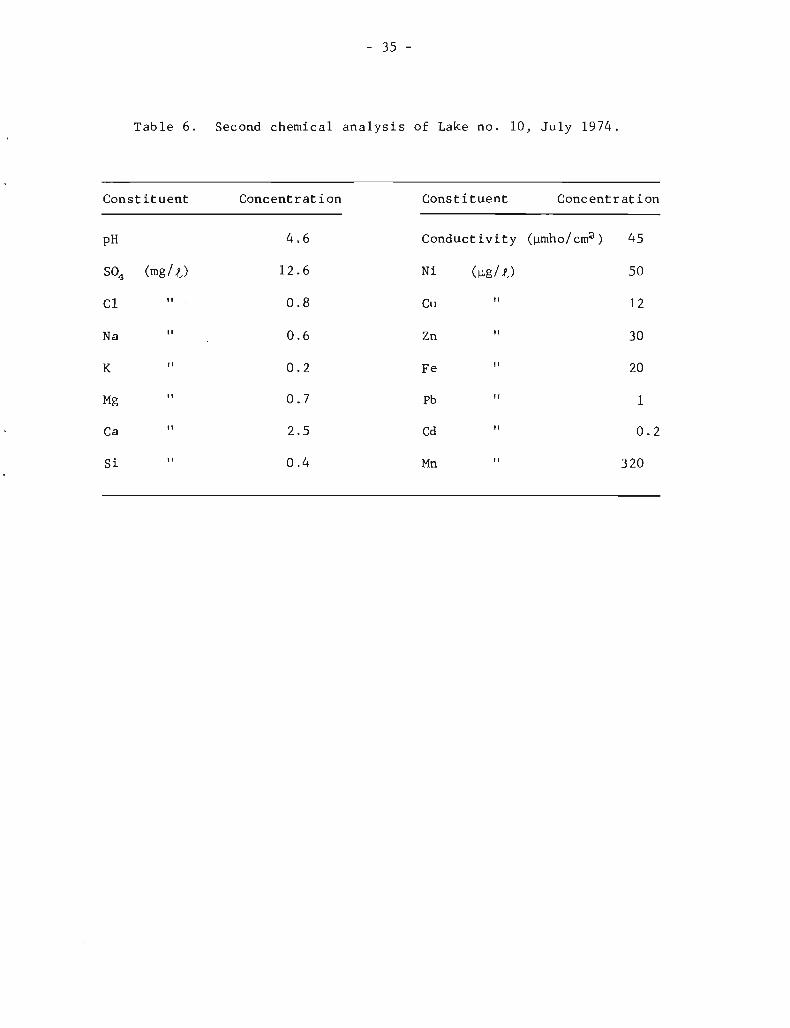
A vertical pH profile showed no appreciable stratification in pH. Acid concentration, nickel, manganese were extremely high (Table 6) while copper and zinc concentrations were higher than found in lakes of similar major ionic composition but remote from the Sudbury area. The pH of 4.6 is well within the range that causes the extinction of most species of fish.
Over the period July 18-21, a was fished and no fish were captured. during the sampling period.
total of 600 m (1,950 ft) of gillnet Also no fish of any size were observed
The most striking observation from this survey was that not a single fish was found in the lake. A comparable amount of netting fished in most lakes in Northern Ontario would yield several thousand fish. The complete absence of fish suggests that the lake has been acidic for a number of years. About half of all precipitation that falls in the drainage area (including lake surface) falls directly into the lake. The small predominantly soilless drainage area indicates that the principal source of water to the lake is

z •
-33
-
If)
N
N
en w
a:::
0..
-w
~
Wz
~
«:1: ...J..-
U)
Q)
... - Q) E
a.. w
o
. bl)
.,4
~

- 35 -
Table 6. Second chemical analysis of Lake no. 10, July 1974.
Constituent Concentration Constituent Concentration
pH 4.6 Conduct i vity (~mho/ cnfl ) 45
S04 (mg/ t) 12.6 Ni (~g/ ,fJ 50
Cl " 0.8 Cu " 12
Na " 0.6 Zn " 30
K " 0.2 Fe " 20
Mg " 0.7 Pb " 1
Ca " 2.5 Cd " 0.2
Si " 0.4 Mn " 320
- 36 -
from unaltered precipitation. The lake is also a deep lake and the possibility can be completely discounted that acids are produced naturally as in some bog lakes. The relatively high sulfate content, the low pH, and high nickel and copper concentrations most probably result from the acidic and heavy metal-laden precipitation that falls in the Sudbury area. The estimate of 17 years to replace the water indicates that considerable time would be required to restore the water quality naturally, once the source of contamination was controlled.
The chemical analyses were extremely similar to those found in the first survey. The higher zinc value in the second analysis cannot be explained other than to note that some yearly fluctuation in zinc values have been recorded in other acidic lakes.
In general this lake appears very characteristic of many lakes to the south that have been shown to have lost fish populations due to acid fallout. Such lakes are particularly susceptible to this kind of pollution because of their geology and direct dependence on precipitation for incoming water.
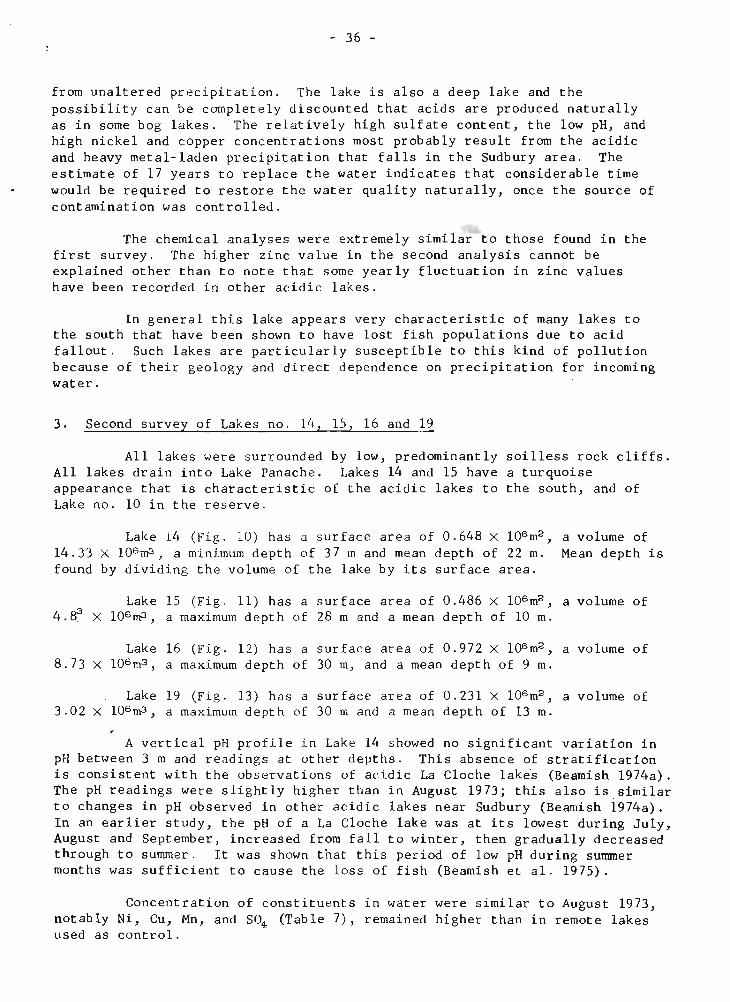
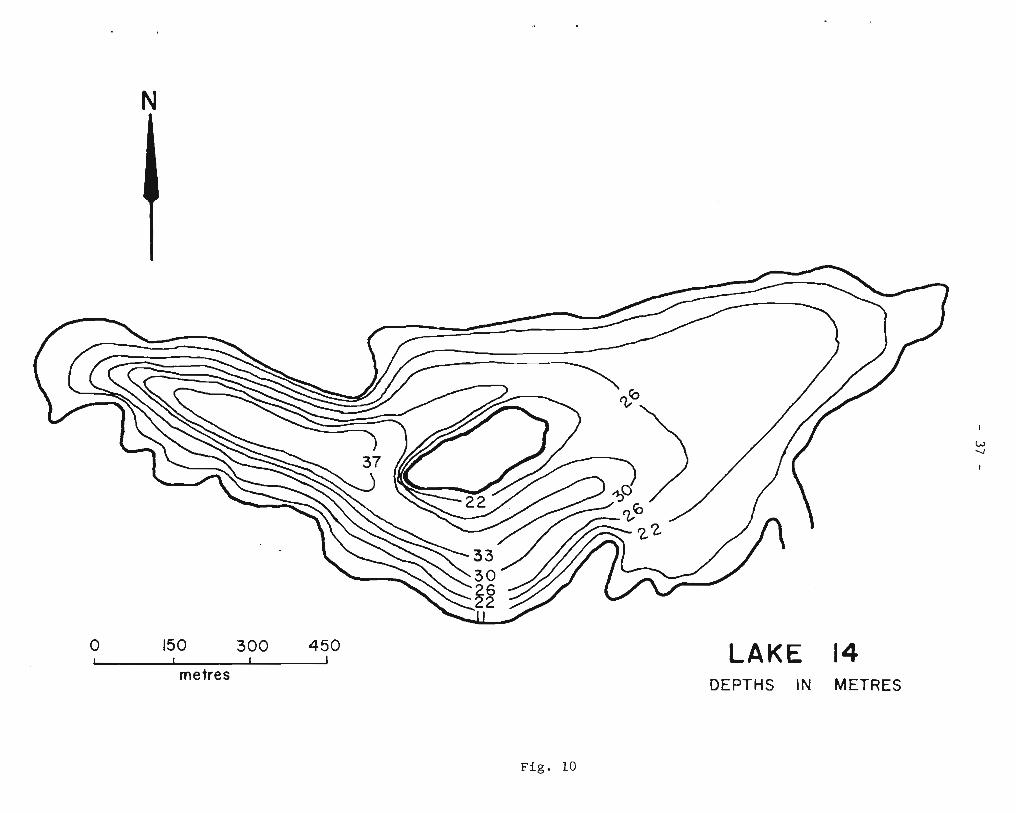
3. Second survey of Lakes no. 14, IS, 16 and 19
All lakes were surrounded by low, predominantly soilless rock cliffs. All lakes drain into Lake Panache. Lakes 14 and 15 have a turquoise appearance that is characteristic of the acidic lakes to the south, and of Lake no. 10 in the reserve.
Lake 14 (Fig. 10) has a surface area of 0.648 X 10⁶ m2 ,
14.33 X 10⁶ m3, a mini.mum depth of 37m and mean depth of 22 m. found by dividing the volume of the lake by its surface area.
Lake 15 (Fig. 11) has a surface area of 0.486 X 10⁶ m2, 4.~ X 106 m3 , a maximum depth of 28 m and a mean depth of 10 m.
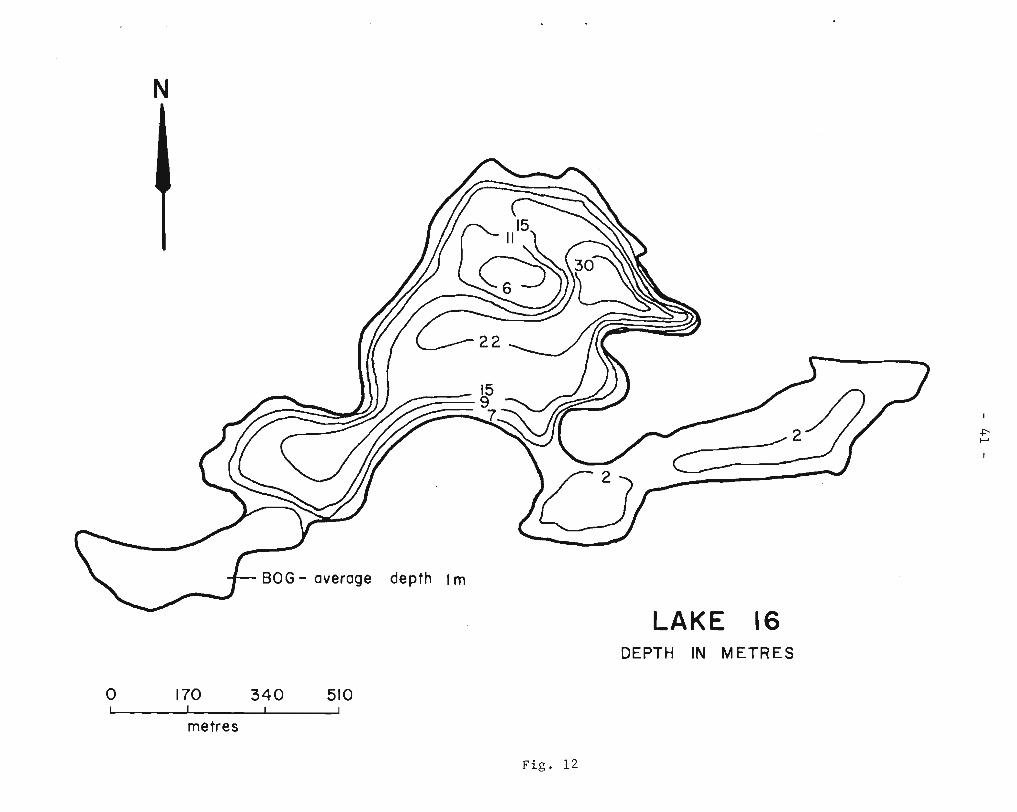
Lake 16 (Fig. 12) has a surface area of 0.972 X 10⁶ m2 ,
8.73 X 10⁶ m3 , a maximum depth of 30 m, and a mean depth of 9 m.
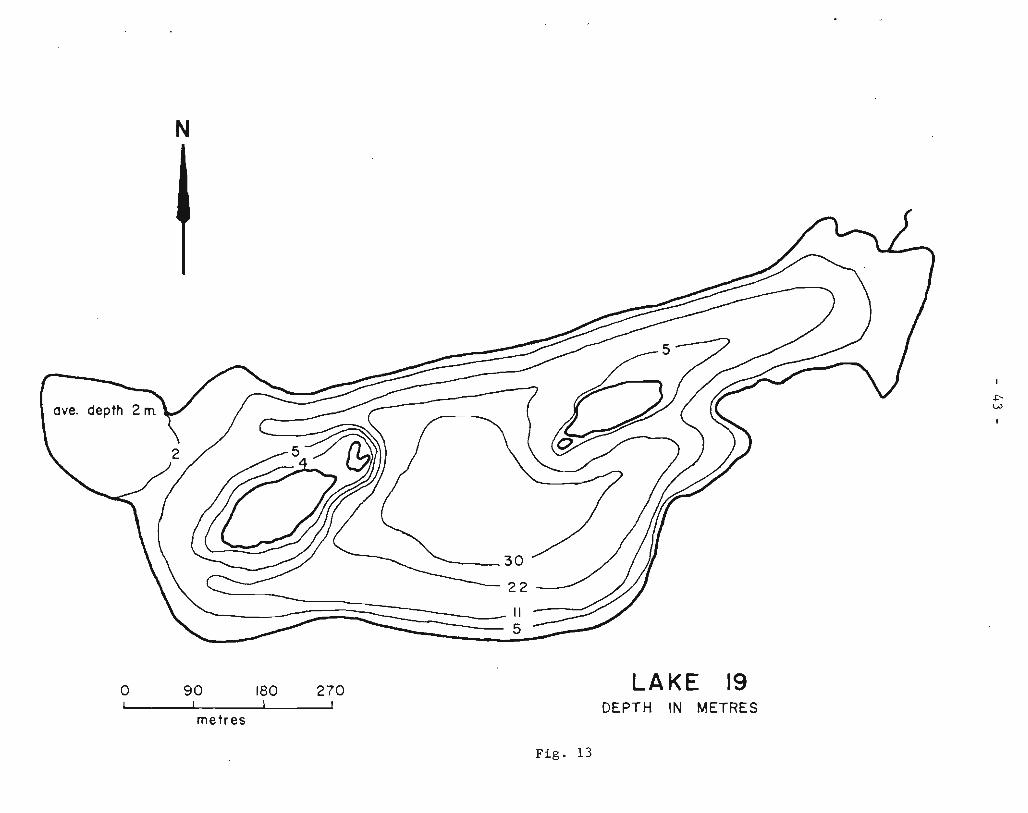
Lake 19 (Fig. 13) has a sur face area of 0.231 X 10⁶ m2 ,
3.02 X 10⁶ m3 , a maximum depth of 30 m and a mean depth of 13 m.
a volume of Mean depth is
a volume of
a volume of
a volume of
A vertical pH profile in Lake 14 showed no significant variation in pH between. 3 m and readings at other depths. This absence of stratification is consistent with the observations of acidic La Cloche lake·s (Beamish 1974a). The pH readings were slightly higher than in August 1973; this also is similar to changes in pH observed in other acidic lakes near Sudbury (Beamish 1974a). In an earlier study, the pH of a La Cloche lake ~.;ras at its lowest during July, August and September, increased from fall to winter, then gradually decreased through to summer. It was shown that this period of low pH during summer months was sufficient to cause the loss of fish (Beamish et al. 1975).
Concentration of constituents in water were similar to August 1973, notably Ni, Cu, Mn, and S04 (Table 7), remained higher than in remote lakes used as control.
-37
-
z----. ....---
~
W ~
« --l
o L()
o;t
CJ)
w
a:: ~
w
:E
z CJ)
I ~
a.. w
0
In
Q)
... - Q) E

C/)
w
a:: ~
lO
w
-:E
W
z
~
C/)
« ::r::
..J ~
Q..
W
£:)
Z---.I--
-39
-
o (\J
~
o OJ
(\J
II) Q
) ~
- Q)
o E
~
o

N
BOG - average depth 1 m
o 170 340 510
metres
LAKE 16 DEPTH IN METRES
Fig. 12
~ I-'

-4
3
-
z •
N
.c: - Q
. Q
) "0
w ~~
«:r: ...11-
0 I'-N
0 to
0 m
0
Q..
W
o
. 00 • ..l ~
III Q
) ~
- Q)
E

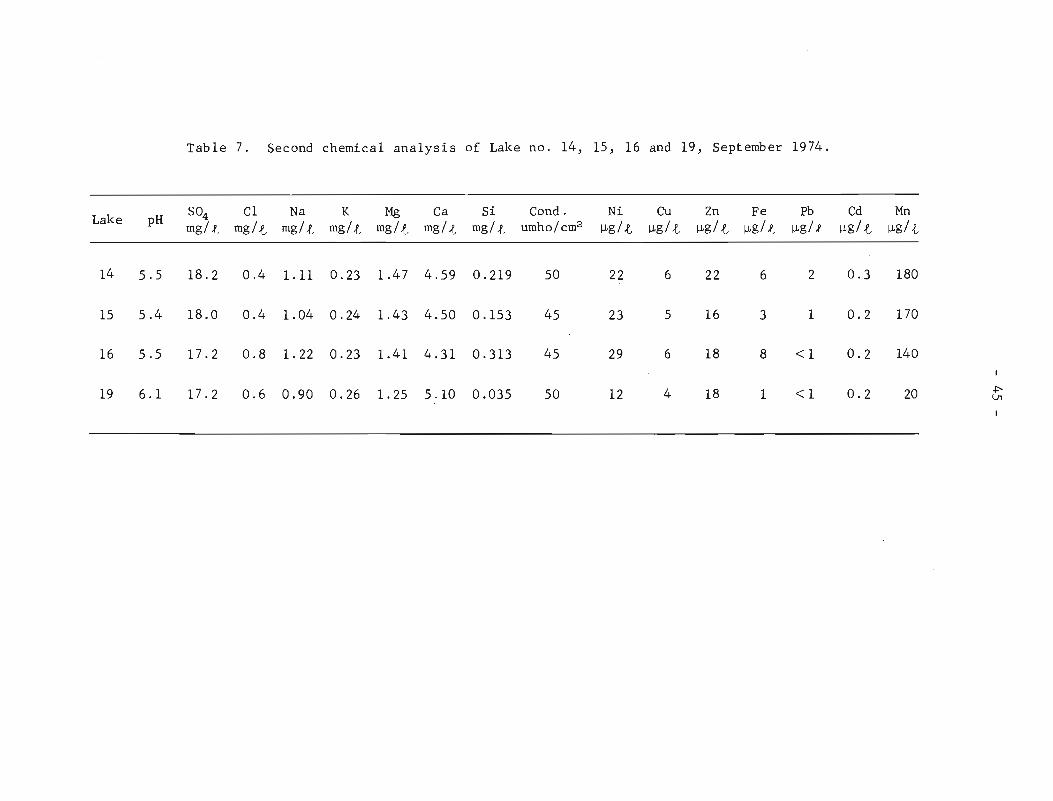
Table 7. Second chemical analysis of Lake no. 14, 15, 16 and 19, September 1974.
Lake pH S04 C1 Na K Mg Ca Si Cond. Ni Cu Zn Fe Pb Cd Mn mg/ ), mg/t mg/,f, mg/t mg/t mg/t mg/,f, umho/cm2 'fJ,g/,t 'fJ,g/t 'fJ,g/ t 'fJ,g/ .f, 'fJ,g/.f 'fJ,g/t 'fJ,g/t
14 5.5 18.2 0.4 1.11 0.23 1.47 4.59 0.219 50 22 6 22 6 2 0.3 180
15 5.4 18.0 0.4 1.04 0.24 1.43 4.50 0.153 45 23 5 16 3 1 0.2 170
16 5.5 17.2 0.8 1. 22 0.23 1.41 4.31 0.313 45 29 6 18 8 <1 0.2 140
19 6.1 17.2 0.6 0.90 0.26 1. 25 5.10 0.035 50 12 4 18 1 <1 0.2 20 +' VI
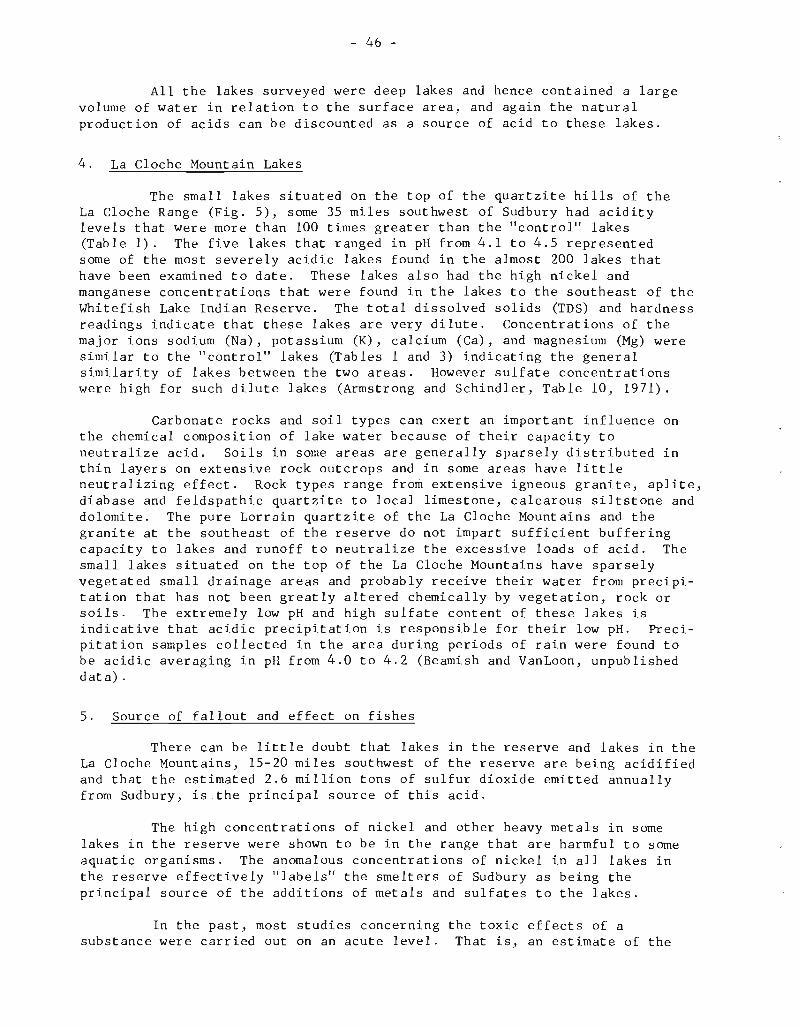
- 46 -
All the lakes surveyed were deep lakes and hence contained a large volume of water in relation to the surface area, and again the natural production of acids can be discounted as a source of acid to these lakes.
4. La Cloche Mountain Lakes
The small lakes situated on the top of the quartzite hills of the La Cloche Range (Fig. 5), some 35 miles southwest of Sudbury had acidity levels that were more than 100 times greater than the "control" lakes (Table 1). The five lakes that ranged in pH from 4.1 to 4.5 represented some of the most severely acidic lakes found in the almost 200 lakes that have been examined to date. These lakes also had the high nickel and manganese concentrations that were found in the lakes to the southeast of the Whitefish Lake Indian Reserve. The total dissolved solids (TDS) and hardness readings indicate that these lakes are very dilute. Concentrations of the major ions sodium (Na), potassium (K), calcium (Ca), and magnesium (Mg) were similar to the "control" lakes (Tables 1 and 3) indicating the general similarity of lakes between the two areas. However sulfate concentrations were high for such dilute lakes (Armstrong and Schindler, Table 10, 1971).
Carbonate rocks and soil types can exert an important influence on the chemical composition of lake water because of their capacity to neutralize acid. Soils in some areas are generally sparsely distributed in thin layers on extensive rock outcrops and in some areas have little neutralizing effect, Rock types range from extensive igneous granite, aplite, diabase and feldspathic quartzite to local limestone, calcarous siltstone and dolomite. The pure Lorrain quartzite of the La Cloche Mountains and the granite at the southeast of the reserve do not impart sufficient buffering capacity to lakes and runoff to neutralize the excessive loads of acid. The small lakes situated on the top of the La Cloche Mountains have sparsely vegetated small drainage areas and probably receive their water from precipitation that has not been greatly altered chemically by vegetation, rock or soils. The extremely low pH and high sulfate content of these lakes is indicative that acidic precipitation is responsible for their low pH. Precipitation samples collected in the area during periods of rain were found to be acidic averaging in pH from 4.0 to 4.2 (Beamish and VanLoon, unpublished data) .
5. Source of fallout and effect on fishes
There can be little doubt that lakes in the reserve and lakes in the La Cloche Mountains, 15-20 miles southwest of the reserve are being acidified and that the estimated 2.6 million tons of sulfur dioxide emitted annually from Sudbury, is the principal source of this acid.
The high concentrations of nickel and other heavy metals in some lakes in the reserve were shown to be in the range that are harmful to some aquatic organisms. The anomalous concentrations of nickel in all lakes in the reserve effectively "labels" the smelters of Sudbury as being the principal source of the additions of metals and sulfates to the lakes.
In the past, most studies concerning the toxic effects of a substance were carried out on an acute level. That is, an estimate of the
- 47 -
concentration required to kill a percentage of fish in a relatively short time was determined. While some laboratories continue this method of testing, it is generally accepted that such tests are of limited value. The long-term chronic exposures for at least one complete life cycle yield more meaningful results. The volume of literature that pertains to pH values that cause 50% mortality greatly overestimate the concentrations that affect fishes as fish populations experience chronic effects and long-term mortality long before acute concentrations develop. The authors are aware of only one long-term complete life cycle exposure involving the effects of pH on fishes (Mount 1973). Mount showed that survival of fathead minnows was not affected at pH 7.5-4.5 but that at pH 5.9 and lower, egg production and hatchability was reduced. At pH 5.2 and 4.5 females did not spawn. The loss of fish populations in the La Cloche Mountain lakes has also been identified as resulting from failure of females to spawn (Beamish 1974a).
In many of the La Cloche Mountain lakes the more acid sensitive species had started to disappear prior to the commencement of monthly pH determinations (Beamish et al. 1975). Also pH fluctuates throughout the year and may exert a greater physiological effect at a particular time of the year, thus the sequence of fish loss in Table 4 has been difficult to accurately relate to the exact pH at which the species started to show signs of acid stress. We do know that species such as smallmouth bass and walleye no longer reproduced successfully in lakes where the summer pH was below 5.5 (Beamish et al. 1975). The observations from the acidified La Cloche Mountain lakes would suggest that the tolerable lower limits for fishes range from approximately 5.5-4.5 depending on the sensitivity of the species (Table 4; see Beamish et al. 1975). The upper value is higher than the generally accepted tolerable lower pH limit for fishes of pH 5.0 (McKee and Wolf 1963; EIFAC 1969). As many of the desired angling and commercially sought species are also the most acid sensitive, the tolerable lower limit should be above pH 5.5 and a safe limit at above pH 6. Thus no sport or commercially sought populations could survive for extended periods in Lake no. 10, and the pH of Lakes no . 14, 15, 16 and perhaps 8 and 17 are in the range that inhibits reproduction of the more acid sensitive species.
- 48 -
REFERENCES
Armstrong, F. A. J., and D. W. Schindler. 1971. Preliminary chemical characterization of waters in the Experimental Lakes Area, northwestern Ontario. J. Fish. Res. Board Can. 28: 171-187.
American Public Health Association, American Waterworks Association, and Water Pollution Control Federation. 1971. Standard methods for the examination of water and wastewater. 13th ed. New York, N. Y. 874 p.
Barrett, E., and G. Brodin. 1955. The acidity of Scandinavian precipitation. Tellus 7: 251-257.
Beamish, R. J. 1974a. Loss of fish populations from unexploited remote lakes in Ontario, Canada, as a consequence of atmospheric fallout of acid. Water Res. 8: 85-95.
1974b. Growth and survival of white suckers (Catostomus commersoni) in an acidified lake. J. Fish. Res. Board Can. 31: 49-54.
Beamish, R. J., and H. H. Harvey. 1972. Acidification of the La Cloche Mountain Lakes, Ontario, and resulting fish mortalities. J. Fish. Res. Board Can. 29: 1131-1143.
Beamish, R. J., L. Lockhart, J. C. VanLoon, and H. H. Harvey. 1975. Long-term acidification of a lake and resulting effects on fishes. AMBIO 4: 98-102.
Biesinger, K. E., and G. M. Christensen. 1972. Effects of various metals on survival, growth, reproduction, and metabolism of Daphnia magna. J. Fish. Res. Board Can. 29: 1691-1700.
Brooks, R. R., B. J. Presley, and I. R. Kaplan. 1967. APDC/MIBK extraction system for the determination of trace elements in saline waters by atomic absorption spectroscopy. Ta1anta 14: 809-816.
Brungs, W. A. 1969. Chronic toxicity of zinc to the fathead minnow, Pimephales promelas Rafinesqueo Trans. Amer. Fish. Soc. 98: 272-279.
Brunskill, G. J., and D. W. Schindler. 1971. Geography and bathymetry of selected lake basins, Experimental Lakes Area, northwestern Ontario. J. Fish. Res. Board Can. 28: 139-155.
Buchauer, M. J. 1973. Contamination of soil and vegetation near a zinc smelter by zinc, cadmium, copper and lead. Environ. Sci. Tech. 7: 131-135.
Costescu, L. M. and T. C. Hutchinson. 1972. Ecological significance of soil pollution by metallic dust from Sudbury smelters. Inst. Environ. Sciences, 18th Annual Conf., New York. p. 540-545.
Dreisinger, B. R. 1965. Sulphur dioxide levels and the effects of the gas on vegetation near Sudbury, Ontario. 58th Annual Meeting Air Pollution Control Assoc., Toronto. Paper 65-121. 21 p.
1967. The impact of sulphur dioxide pollution on crops and forests. In Pollution and our environment, p. 1-7. Conference background paper . Vol. 1. Canadian Council of Resource Ministers, Paper A4-2-1. Montreal.
- 49 -
Dreisinger, B. R., and P. C. McGovern. 1968. Sulphur dioxide levels and resultant injury to vegetation in the Sudbury area during the 1967 season. Ontario Dept. Mines. Toronto, Ontario. 36 p.
1969. Sulphur dioxide levels and resultant injury to vegetation in the Sudbury area during the 1968 season. Ontario Dept. Mines, Toronto, Ontario. 36 p.
1970. Monitoring atmospheric sulphur dioxide and correlating its effects on crops and forest in the Sudbury area. In Proc. Impact of Air Pollution on Vegetation Conference. Toronto, Ontario. 23 p.
EIFAC Working Party on Water Quality. 1968. Water quality criteria for European freshwater fish. Rep. on extreme pH values and inland fisheries. EIFAC Tech. Pap. 4: 24 p. Also in Water Res. 1969. 3: 593-611.
EPS. 1973. Air pollution control directorate, Environmental Protection Service, Department of the Environment. A nation wide-inventory of air pollutant emissions 1970. Rep. EPS 3-AP-73-2, Ottawa, Canada.
Falkowski, P. disaster.
1973. The Inco stack-engineering triumph or biological Steel labor 38(10): 2.
Foster, P. M. 1969. The oxidation of sulphur dioxide in power station plumes. Atmos. Environ. 3: 157-176.
Gartrell, F. E., F. W. Thomas, and S. B. Carpenter. 1963. Atmospheric oxidation of sulphur dioxide in coal-burning power plant plumes. Am. Ind. Hyg. Assoc. J. 24: 113-120.
Gorham, E. 1958. The influence and importance of daily weather conditions in the supply of chloride, sulphate and other ions to fresh waters from atmospheric precipitation. Phil. Trans. Roy. Soc. London Ser. B. Biol. Sci. 247: 147-178.
Gorham, E., and A. G. Gordon. 1960a. The influence of smelter fumes upon the chemical composition of lake waters near Sudbury, Ontario, and upon the surrounding vegetation. Can. J. Bot. 38: 477-487.
1960b. Some effects of smelter pollution northeast of Falconbridge, Ontario. Can. J. Bot. 38: 307-312.
1963. Some effects of smelter pollution upon aquatic vegetation near Sudbury, Ontario. Can. J. Bot 41: 371-378.
Greszta, J., and S. Godzik. 1969. Effect of zinc metallurgy on soils. Rocz. Glebozn [Soil Sci. Annu] Tom XXZ. 1, Warszawa [English Abstract]
Hornstr6m, E., C. Ekstrom, kan p~ vastkustsjoar. 97 p.
U. Miller, and W. Dickson. 1973. Fo~surningens inver Information fran sotvattenslaboratoriet. Drottningholm.
Hutchinson, T. C., and L. M. Whitby. 1973. A study of airborne contamination of vegetation and soils by heavy metals in the Sudbury copper nickel smelters. Proc. 7th Annual Missouri Conf. Trace Substances in Environ.
Health. D. M. Hamphill (ed.).
- 50 -
Junge, C. E., and T. G. Ryan. 1958. Study of the S02 oxidation in solution and its role in atmospheric chemistry. Quarto J. Roy. Meteorol. Soc. 84: 46-55.
Kopp, J. F., and Ro C. Kroner. States (Oct. 1, 1962-Sept. Pollut. Contr. Admin. Div. 28 p. + app.
1969. Trace metals in waters of the United 30, 1967). U. S. Dep. Inter. Fed o Water Pollut. Surveillance Cincinnati, Ohio.
Kramer, J. R. 1973a. Fate of atmospheric sulphur dioxide and related substances as indicated by chemistry of precipitation. Unpubl. Rep. J. R. Kramer, Dep. Geology, McMaster Univ., Hamilton, Ontario. 143 p.
1973b. Atmospheric composition and precipitation of the Sudbury region. Alternatives 2: 18-25.
LeBlanc, F., D. N. Rao, and G. Comeau. 1972. The epiphytic vegetation of Populus balsamifera and its significance as an air pollution indicator in Sudbury, Ontario. Can. J. Bot. 50: 519-528.
Likens, G. Eo 1972. The chemistry of precipitation in the central finger lakes region. Cornell Univ. Water Res. and Mar. Sci. Center Tech. Rep. 50: 47 p.
Linzon, S. N. 1958. The influence of smelter fumes on the growth of white pine in the Sudbury region. Ont. Dep. Lands For., Ont. Dep. Mines, Toronto, Onto 45 p.
1966. Damage to eastern white pine by sulphur dioxide, semimature tissue needle blight, and ozone. J. Air Pollut. Control Assoc. 16: 140-144.
1971. Economic effects of sulfur dioxide on forest growth. J. Air Pollut. Control Assoc. 21: 81-86.
Massachusetts Institute of Technology (M.I.T.). 1970. In Man's impact on the global environment. [Rep. of the study of critical environmental problems. 1 M.I.T. Press. Cambridge, Massachusetts. 319 p.
McCallum, A. W. 1944. Report on a preliminary examination of the Sudbury Smelter Area (Mimeographed report). Ont. Dep. Mines, Toronto, Onto
McGovern, P. C., and D. Basillie. 1972. Sulphur dioxide levels and environmental studies in the Sudbury area during 1971. Air Quality Branch, Min. of the Environ. 33 p.
1973. Sulphur dioxide (1972) - heavy metal (1971) levels and vegetative effects in the Sudbury area. Air Management Branch, Onto Min. of the Environ. 50 p.
McKay, H. A. C. 1971. The atmospheric oxidation of sulphur dioxide in water droplets in presence of ammonia. Atmos. Environ. 5: 7-14.
McKee, J. E., and H. W. Wolf. 1963. Water quality criteria. State Calif. Water Qual. Control Board, Sacramento. Publ. 3A: 548 p.
51 -
McKim, J. M., and D. A. Benoit. 1971. Effects of long-term exposures to copper on survival, growth, and reproduction of brook trout (Salvelinus fontinalis). J. Fish. Res. Board Can. 28: 655-662.
Mount, D. I. 1973. Chronic effect of low pH on fathead minnow survival, growth and reproduction. Water Res. 7: 987-993.
Mount, D. I., and C. E. Stephan. 1969. Chronic toxicity of copper to the fathead minnow (Pimephales promelas) in soft water. J. Fish. Res. Board Can. 26: 2449-2457.
Odtn, S. 1971. Nederbordens torsurning-et generellt hot mot ekosystemen [Acidification by atmospheric precipitation - a general threat to the ecosystem.] In Forurensing eg biologisk Miljouern. [Acidification of the biological environment.] I. Mysterund (ed.). p. 63-98. (Fish. Res. Board Can. Transl. 2564, 41 p. 1973).
, Oden, S., and T. Ahl. 1970. Forsurningen av skandinaviska vatten [The
acidification of Scandinavian lakes and rivers]. Ymer Arsb. 103-122 (Fish. Res. Board Can. Transl. 2535, 32 p. 1973).
Ontario Research Foundation. 1949. The removal of sulphur gases from smelter fumes. Kings Printer, Toronto, Ont. 149 p.
Penman, H. L. 1948. Natural evaporation from open water, bare soil and grass. Proc. Royal Soc. London. 193: 120-145. In Handbook on the principles of hydrology. D. M. Gray (ed.). Natl. Res. Counc , Can. 1970: 558 p.
Pickering, Q. H. 1974. Chronic toxicity of nickel to the fathead minnow (Pimephales promelas) Rafinesque. J. Water Pollut. Control Fed. 46: 760-765.
Pickering, Q. H., and M. Gast. 1972. Acute and chrQnic toxicity of cadmium to the fathead minnow (Pimephales promelas). J o Fish. Res. Board Cano 29: 1099-1106.
Robinson, G. D. 1971. Long-term effects of air pollution: a five year program. Rep. to EPA contract no. CPA-22-69-l55. The Centre for the Environment and Man. CEM 4029-438.
Scott, W. D., and P. V. Hobbs. 1967. The formation of sulfate in water droplets. J. Atmos. Sci. 24: 54-57.
Stainton, M. P. 1974. Methods manual. Fish. Res. Board Cano Misc. Spec. Publ. 25 : 125 p.
Stokes, P. M., T. C. Hutchinson, and K. Krauter. 1973. Heavy metal tolerance in algae isolated from polluted lakes near Sudbury, Ontario smelters. Water Pollut. Res. in Canada 1973. Proc. 8th Sym. Univ o Waterloo 1973. 178-187.
- 52 -
U.S. Public Health Service. 1962. Public Health Service drinking water standards, 1962. U.S. Dep. Health, Education and Welfare, Washington, D.C., Publ. no. 956. Reprinted May 1967, 61 p.
VanLoon, J. C., J. Lichwa, and D. Ruttan. 1973. A study of the determination and distribution of cadmium collected in a heavily industrialized and urbanized region (Metropolitan Toronto). Intern. J. Environ. Anal. Chern. (In press)
Welch, P. S. 1948. Limnological methods. McGraw, New York. 381 p.
Whaley, H., and G. K. Lee. 1971. The dispersion of smelter plumes in the Sudbury area. Canada Dep. Energy, Mines and Resources, Ottawa. Mines Branch Investigation Rep. IR 71-37, 20 p.
1974. Plume dispersion computations for Inco and Falconbridge stack emissions under limited-mixing conditions. Canada Dep. Energy, Mines and Resources, Ottawa. Mines Branch Investigation Rep. IR 74-3, 21 p.
Whitby, L. M., and T. C. Hutchinson. 1974. Heavy-metal pollution in the Sudbury mining and smelting region of Canada, II. Soil toxicity tests. Environ. Conservation 1: 191-200.
Winchester, J. W., and G. D. NiFong. 1971. Water pollution in Lake Michigan by trace elements from pollution aerosol fallout. Water, Air and Soil Pollution 1: 50-64.
World Health Organization. 1963. International standards for drinking water. W.H.O., Geneva, Switzerland, 2nd ed., 206 p.