an examination of the properties, uses and …
TRANSCRIPT

University of Massachusetts Amherst University of Massachusetts Amherst
ScholarWorks@UMass Amherst ScholarWorks@UMass Amherst
Doctoral Dissertations Dissertations and Theses
October 2018
AN EXAMINATION OF THE PROPERTIES, USES AND AN EXAMINATION OF THE PROPERTIES, USES AND
INTERPRETATIONS OF FIRST GRADE READING SCREENING INTERPRETATIONS OF FIRST GRADE READING SCREENING
TOOLS IN ONE SCHOOL DISTRICT TOOLS IN ONE SCHOOL DISTRICT
Amadee Meyer University of Massachusetts Amherst
Follow this and additional works at: https://scholarworks.umass.edu/dissertations_2
Part of the School Psychology Commons
Recommended Citation Recommended Citation Meyer, Amadee, "AN EXAMINATION OF THE PROPERTIES, USES AND INTERPRETATIONS OF FIRST GRADE READING SCREENING TOOLS IN ONE SCHOOL DISTRICT" (2018). Doctoral Dissertations. 1371. https://doi.org/10.7275/12464443 https://scholarworks.umass.edu/dissertations_2/1371
This Open Access Dissertation is brought to you for free and open access by the Dissertations and Theses at ScholarWorks@UMass Amherst. It has been accepted for inclusion in Doctoral Dissertations by an authorized administrator of ScholarWorks@UMass Amherst. For more information, please contact [email protected].

AN EXAMINATION OF THE PROPERTIES, USES AND INTERPRETATIONS OF FIRST GRADE READING SCREENING TOOLS IN ONE SCHOOL DISTRICT
A Dissertation Presented
by
AMADEE MEYER
Submitted to the Graduate School of the University of Massachusetts Amherst in partial fulfillment
of the requirements for the degree of
DOCTOR OF PHILOSOPHY
September 2018
College of Education

© Copyright by Amadee Meyer 2018
All Rights Reserved

AN EXAMINATION OF THE PROPERTIES, USES AND INTERPRETATIONS OF FIRST GRADE READING SCREENING TOOLS IN ONE SCHOOL DISTRICT
A Dissertation Presented
by
AMADEE MEYER
Approved as to style and content by: ___________________________________ Amanda M. Marcotte, Chair ___________________________________ Sarah A. Fefer, Member ___________________________________ Michelle K. Hosp, Member ___________________________________ Jill R. Hoover, Member
___________________________________ Jennifer Randall Associate Dean of Academic Affairs College of Education

iv
ACKNOWLEDGMENTS
I’d like to extend thanks to the many people who have provided support for this
project and throughout my doctoral program. First, thanks to my wonderful committee
members, Sarah, Michelle and Jill for encouraging just the right amount of rigor and
realism and for making the whole process feel very safe and approachable. Special thanks
to my chair and advisor, Amanda, for introducing me to the science behind the reading
assessments I administered as a teacher. You’ve been a sounding board not just for my
academic needs, but for parenting and life in general, and I look forward to continued
friendship and collaboration.
I’d also like to express deep appreciation for the partner school district for valuing
research projects such as this one, and for providing insight, advice and the support I
needed to gather data smoothly. Special thanks to Mike, Doug, and the elementary
principals and first-grade educators.
The family and friends who provided childcare, counseling, commiseration, and
fun distractions along the way are too many to list, but special thanks to the members of
Group Two, to Jen and Pat, my two supervisors and mentors in the field, and to my mom
and dad for encouraging me from the very beginning.
Love and thanks to Wes and Ezra, whose entire lifetimes have been consumed by
Mama’s degree. What I’ve learned from each of you is immeasurable. And baby boy, you
were with me throughout the final months of writing and revision and meeting you will
be the ultimate reward. Above all, thank you to Todd, for your love and patience, and for
holding it all together these past few years. Words can’t express my gratitude for
everything you’ve done to support me in this endeavor. You’re the best, Mano.

v
ABSTRACT
AN EXAMINATION OF THE PROPERTIES, USES AND INTERPRETATIONS OF FIRST GRADE READING SCREENING TOOLS IN ONE SCHOOL DISTRICT
SEPTEMBER 2018
AMADEE MEYER, B.A., CORNELL UNIVERSITY
M.Ed., UNIVERSITY OF MASSACHUSETTS AMHERST
Ph.D., UNIVERSITY OF MASSACHUSETTS AMHERST
Directed by: Dr. Amanda M. Marcotte
Early identification of children who are likely to struggle to achieve reading
proficiency is essential to providing them timely access to effective interventions. Thus,
universal screening is a critical feature of preventative service delivery models that
identify students at risk and provide early support for reading difficulties. As schools
choose assessment tools for this purpose, three aspects of universal screening tools are
especially important to consider: appropriateness for the intended use, technical
adequacy, and usability. Using these standards for assessment review, this study
investigated two screening tools commonly used to identify first-graders at risk for
reading failure: the Aimsweb Tests of Early Literacy (TEL) and Reading Curriculum
Based Measurement- Reading (R-CBM), and the Developmental Reading Assessment-
Second Edition (DRA2), an informal reading inventory (IRI). First, test materials were
examined for evidence of alignment to important constructs of interest, usability, and
technical adequacy. A questionnaire was employed to gather information from twelve
first-grade educators from four elementary schools in one diverse suburban district about
decisions made using data from each assessment. Finally, to examine predictive validity,

vi
an important aspect of technical adequacy, scores on each screening tool as well as third-
grade outcome measures were analyzed for 269 students in the participating district.
Results indicated that the TEL measures were more closely aligned to early
reading constructs of interest than the DRA2, and also demonstrated more efficient
usability characteristics. However, the educator questionnaire revealed that both
assessments are endorsed by teachers for the purpose of screening. While both tools are
indeed predictive of later reading achievement, neither resulted in adequate classification
accuracy to be recommended for use as a stand-alone screening tool. In addition, the
DRA2 resulted in high levels of problematic false negative screening results, meaning
that it under identifies students at risk, potentially neglecting students’ access to timely
intervention. Analysis of classification accuracy for subgroups including English
language learners and students eligible for free and reduced lunch revealed that
classification accuracy varies by subgroup membership, affecting the predictive validity
of screening tools with these populations. Implications for practice and future research
are addressed.
This study replicates previous studies related to the predictive validity of first-
grade CBM tools, fills a gap in the extant research related to the use of IRIs as screening
tools in early grades, and informs educators who wish to evaluate screening tools for
appropriateness at the local level.

vii
TABLE OF CONTENTS
Page
ACKNOWLEDGMENTS .............................................................................................. iv
ABSTRACT ................................................................................................................... v
LIST OF TABLES .......................................................................................................... x
LIST OF FIGURES ...................................................................................................... xii
CHAPTER 1. INTRODUCTION, BACKGROUND, AND PURPOSE ...................................... 1
Introduction ......................................................................................................... 1Trajectories and Consequences of Reading Failure .............................................. 2Prevention of Reading Problems .......................................................................... 4Accountability and Assessment ........................................................................... 6Universal Screening ............................................................................................. 8First-Grade Screening Tools .............................................................................. 10
Curriculum Based Measurement ............................................................ 11Informal Reading Inventories ................................................................. 13
Considerations for Screening Diverse Populations ............................................. 15Purpose of the Current Study ............................................................................. 16Research Questions ........................................................................................... 16
Part 1: Appropriateness for Intended Use and Usability .......................... 16Part 2: Testing the Technical Adequacy of First-Grade Screening
Measures .................................................................................... 17Part 3: Integration of Qualitative and Quantitative Data.......................... 18
2. REVIEW OF THEORETICAL AND EMPIRICAL LITERATURE .................. 19
Introduction ....................................................................................................... 19Historical Perspectives on Early Reading Instruction ......................................... 20Models of the Reading Process .......................................................................... 22First-Grade Reading Constructs ......................................................................... 24Reading Instruction in First-Grade Classrooms .................................................. 28Considerations for Evaluating First-Grade Screeners ......................................... 29
Appropriateness for Intended Use .......................................................... 29

viii
Alignment with Constructs ......................................................... 30 First-Grade CBM Tools .................................................. 30Informal Reading Inventories .......................................... 31
Format of Screening Tools.......................................................... 33Local Compatibility .................................................................... 36
Adequacy of Technical Characteristics ................................................... 39
Adequacy of Norms .................................................................... 39Reliability ................................................................................... 39Validity ...................................................................................... 41Classification Accuracy .............................................................. 42
Classification Accuracy of CBM ..................................... 44Classification Accuracy of IRIs ....................................... 49
Usability ................................................................................................ 49
Conclusion ........................................................................................................ 51
3. METHODS ....................................................................................................... 57
General Design .................................................................................................. 57Setting and Participants ..................................................................................... 58Measures ........................................................................................................... 59
Quantitative Measures ............................................................................ 59
Aimsweb .................................................................................... 59
Aimsweb Reading-Curriculum Based Measurement ....... 60Aimsweb Letter Naming Fluency .................................... 60Aimsweb Letter Sound Fluency ...................................... 61Aimsweb Phoneme Segmentation Fluency ...................... 61Aimsweb Nonsense Word Fluency .................................. 61Aimsweb Composite Score ............................................. 62
Developmental Reading Assessment-Second Edition.................. 62Massachusetts Comprehensive Assessment System .................... 63
Qualitative Data Collection .................................................................... 64
Content Analysis ........................................................................ 64

ix
Educator Questionnaire .............................................................. 65 Procedures ......................................................................................................... 66
Data Analysis ......................................................................................... 67
4. RESULTS ......................................................................................................... 72
Appropriateness for Intended Use and Usability ................................................ 72Predictive Validity and Classification Accuracy ................................................ 76
Correlations and Predictive Validity ....................................................... 76Classification Accuracy.......................................................................... 78
Classification Accuracy for Predicting Third-Grade MCAS ........ 78Classification Accuracy for Predicting Third-Grade Oral
Reading Rate ........................................................................ 79Classification Accuracy for Subgroups ....................................... 81
5. DISCUSSION ................................................................................................... 98
Summary of Findings ........................................................................................ 99 Appropriateness for Intended Use and Usability of Screening
Measures .......................................................................................... 99Technical Adequacy of Screening Measures ........................................ 102Integration of Data ............................................................................... 109
Implications ..................................................................................................... 111Limitations ...................................................................................................... 112Contributions to Extant Research and Future Directions .................................. 114
APPENDICES
A. SAMPLE AIMSWEB PROBES ...................................................................... 117B. SAMPLE DRA2 TEACHER OBSERVATION GUIDE .................................. 122C. EDUCATOR QUESTIONNAIRE ................................................................... 128D. QUESTIONNAIRE RESULTS ....................................................................... 142E. HISTOGRAMS OF VARIABLES................................................................... 157F. SCATTERPLOTS OF VARIABLES ............................................................... 159 REFERENCES ........................................................................................................... 163

x
LIST OF TABLES
Table Page 1. Stages of Reading Development (Chall, 1996) ................................................. 53
2. Concurrent and Predictive Validity Evidence Provided by Assessment Publishers ........................................................................................................ 54
3. Classification Studies of First-Grade Screening Measures ................................ 55
4. Demographic Information ................................................................................ 71
5. Paired Samples Test of Respondents’ Ratings of Appropriateness, Technical Adequacy, and Usability Characteristics .......................................... 84
6. Descriptive Statistics (Cohort 1) ...................................................................... 85
7. Descriptive Statistics (Cohort 2) ...................................................................... 86
8. Pairwise Correlations between First-Grade Predictors and Third-Grade Outcomes (Cohort 1) ....................................................................................... 87
9. Pairwise Correlations between First-Grade Predictors and Third-Grade Outcomes (Cohort 2) ....................................................................................... 88
10. Simple Linear Regression Predicting MCAS Scaled Score for Cohort 1 .......... 89
11. Simple Linear Regression Predicting MCAS Scaled Score for Cohort 2 .......... 90
12. Classification Accuracy Statistics for First-Grade Screeners using Publisher Cut Scores Predicting MCAS Proficiency (Cohort 1) ....................... 91
13. Classification Accuracy Statistics for First-Grade Screeners using Publisher Cut Scores Predicting MCAS Proficiency (Cohort 2) ....................... 92
14. Classification Accuracy Statistics for First-Grade Screeners using Publisher Cut Scores Predicting Third-Grade R-CBM score of 131 WCPM (Cohorts 1 and 2) ................................................................................ 93
15. Alternative Cut Scores and Resulting Sensitivity, Specificity and Overall Correct Classification when Predicting Third-Grade R-CBM score of 131 WCPM. ........................................................................................................... 94
16. Means and Standard Deviations of Scores Across Subgroups .......................... 95

xi
17. Classification Accuracy and Two Proportions Test for ELL Subgroup Analysis .......................................................................................................... 96
18. Classification Accuracy and Two Proportions Test for FRL Subgroup Analysis .......................................................................................................... 97

xii
LIST OF FIGURES
Figure Page 1. Classification Accuracy Indices ....................................................................... 56

1
CHAPTER 1
INTRODUCTION, BACKGROUND, AND PURPOSE
Introduction
Literacy is essential to success in modern society, and it is critical to long-term
academic achievement that reading skills develop during the first few years of
schooling. Early identification of children who are likely to struggle to achieve reading
proficiency is important to providing them access to timely, effective interventions and
ultimately changing the trajectory of their reading development. Educators have limited
instructional resources (i.e., time, teachers and materials) to devote to remediating the
needs of large numbers of struggling readers in second and third-grades, by which time
lower order literacy skills should be mastered to allow for a level of reading proficiency
that allows readers to learn from text. In contrast, preventing delays in the development
of proficient reading is more efficient for educators, and wholly beneficial to students.
Access to screening measures that can be used to accurately identify which students may
need supplemental supports in learning to read and then allocating resources accordingly
is critical to effective preventative school practices. There are numerous early reading
assessments available to support educators as they make these decisions, yet it is the
responsibility of school professionals to consider whether the tools available to them
support the inferences they wish to make. This study explores the properties of two types
of assessments commonly used by first-grade educators to identify students at risk for
reading failure, with particular attention to predictive validity evidence when used as
screening tools in one school district.
2
Trajectories and Consequences of Reading Failure
As students acquire the skills crucial to early reading success, they have more
opportunities to engage with successful reading experiences. These accumulated
experiences lead to the acquisition of increasingly more advanced literacy skills.
However, variations in reading experiences between skillful readers and their less adept
peers results in a growing gap between them. Juel (1988) followed the literacy
development of a group of students from first-grade through 4th grade and found that, for
children who were poor readers at the end of first-grade, there was an 88% chance that
they would remain poor readers in fourth grade. Those students who demonstrated at
least average reading skills at the end of first-grade were likely to remain average or
better readers. She concluded that “the poor first-grade reader almost invariably remains
a poor reader by the end of fourth grade” (p. 440). Juel noted that over the course of their
first-grade basal reading instruction, the strong readers were exposed to thousands more
words than those who were struggling, and that this discrepancy grew exponentially
throughout early elementary school. Further, she found that good readers spent more time
reading outside of school, further exacerbating the reading opportunities gap.
From Juel’s investigation we can project that failure to acquire foundational word
reading skills in kindergarten and first-grade is associated with fewer opportunities to
engage with text. Other consequences of poor acquisition of early skills include negative
attitudes towards reading, fewer opportunities to acquire new vocabulary, and deficits in
reading comprehension strategies (Torgesen, 1998). Stanovich (1986) illustrated this
phenomenon through his metaphor, “the Matthew Effect”, in which he described how the
“rich get richer, and the poor get poorer” through a series of reciprocal causal

3
relationships related to “volume of reading experience”. Without explicit instruction,
children who enter school with weak phonological awareness - the ability to focus on and
manipulate the sounds in spoken words, and the foundational sound processes in reading
acquisition - are unlikely to learn how to apply the alphabetic principle to decode
unknown words. These poor readers are exposed to less text than their peers, meaning
they have less opportunity to develop automatic recognition of words. Strong readers will
rapidly acquire new vocabulary, which is a facilitator of reading comprehension and
leads to even more efficient and enjoyable reading.
The gap between strong readers and weak readers persists long after formal
education is completed - being a poor reader has lasting consequences for individuals and
their communities. Students who are not able to read proficiently by the end of third-
grade are more likely to drop out of school and have difficulty finding employment
(Snow, Burns & Griffin, 1998; Annie E. Casey Foundation, 2010). These consequences
of reading failure become even more urgent when one considers the disparity between
reading achievement of high and low-income students, as well as between students from
racial and language groups that differ from the majority population. For example, in 2015
46% of White 4th graders scored at or above the proficient range on the National
Assessment of Educational Progress (NAEP), while only 18% of Black 4th graders and
21% of Hispanic 4th graders reached proficiency. Fifty two percent (52%) of students not
eligible for school lunch programs scored proficient, while only 21% of those that were
eligible did the same. Large gaps are also observed between English learners (8%
proficient) and their native English-speaking peers (39% proficient) (U.S. Department of
Education, 2015).

4
Prevention of Reading Problems
In recognition of the exponential accumulation of consequences related to early
reading failure, there has been an increased emphasis on prevention and early
intervention. With the passage of the No Child Left Behind Act (NCLB, 2001) which
aimed to improve the academic achievement of all students, especially those who are
disadvantaged, the federal government placed focus on high quality early reading
intervention. Soon after, the reauthorization of the Individuals with Disabilities Education
Act (IDEA, 2004) specifically endorsed service delivery models that identify young
children at risk for reading difficulty and provide research based early intervention.
Research supports the notion that the poor trajectories of reading development for
students can be prevented by providing effective core reading instruction for all students,
and by targeting at-risk children for early intervention (Snow et al., 1998). Torgesen
(1998) noted that the majority of children who fail to reach reading proficiency by later
elementary school demonstrate early weaknesses in phonological awareness and in turn,
difficulty applying the alphabetic principle to identify words. In the study described
previously, Juel (1988) found that poor phonemic awareness among first-grade
participants contributed to the poor outcomes in fourth grade. Explicit instruction in
phonological awareness and decoding skills have been shown to benefit all students, but
especially those at highest risk (Foorman, Francis, Fletcher, Schatschneider & Mehta,
1998; National Institute of Child Health and Human Development (NICHD), 2000).
Research supports the hypothesis that for some at-risk students, intensive reading
intervention in the early grades can act as a sort of “inoculation”, providing protection
against reading failure and negating the need for additional intervention as long as

5
evidence-based core reading instruction continues to be provided (Coyne, Kame'enui,
Simmons, Harn, 2004). As an example, researchers followed the literacy development of
41 low income second graders from minority groups who had participated in an explicit
phonemic awareness and phonics intervention in kindergarten (Cartledge, Yurick, Singh,
Keyes, & Kourea, 2011). They found that many students, who were initially identified as
at risk according to kindergarten assessments, were able to reach benchmark goals by
second grade, and even surpassed their peers who were considered not to be at risk in
kindergarten. By second grade, 62% of students who received one year of intervention
met benchmarks, while only 45% of the control group met benchmarks.
In schools, prevention and intervention initiatives are commonly situated within a
Response to Intervention (RTI) approach. RTI is an intervention decision-making model
that depends upon a multi-tiered framework of service delivery in which schools prevent,
identify, and address learning problems (Fuchs, Mock, Morgan & Young, 2003; Fletcher
& Vaughn, 2009; Lembke, McMaster & Stecker, 2010). At the preventative foundation,
evidence based core instruction meets the needs of a majority of students (Tier I), while
targeted support is provided to students who are not successful with the core program
(Tier II). Finally, intensive interventions are provided to a small percentage of students
with the greatest need (Tier III). When implemented with fidelity, students receive
intervention that is consistent with their needs. However, successful implementation of
RTI practices is contingent upon useful data to guide decision-making at each level.
Torgesen (1998) outlined the critical elements of systems designed to prevent reading
problems, including: “(a) the right kind and quality of instruction delivered with the (b)
right level of intensity and duration to (c) the right children at the (d) right time” (p. 3).

6
By exploring the ways that elementary schools identify first-grade children in need of
intervention beyond Tier I core instruction, the current study focuses on the latter two
critical elements – the right children at the right time.
Accountability and Assessment
In response to trends in reading achievement and in recognition of the efficacy of
preventative reading instruction, there has been an increased focus in recent decades on
assessment and accountability. Under the NCLB Act (2001), states were mandated to
assess and report the reading proficiency of students beginning in third-grade. The high
stakes state tests that emerged from this accountability movement are summative
assessments, and while important for measuring the progress of student populations and
evaluating the overall effectiveness of schools, these tests do not necessarily provide
information that is useful for guiding timely educational decisions for individual students
(Shinn, 1989). Because of this, the NCLB Act also recommended the use of screening
practices to identify students at risk for reading difficulties in early elementary schools.
As part of RTI and prevention-oriented practices, and in response to the accountability
requirements of the mandate, educators have increasingly sought ways to identify
students in need of support far earlier than third-grade, which was common in the wait-
to-fail models of the previous decades. Now educators seek to identify students as early
as kindergarten to provide them with critical early literacy instruction to counteract the
Matthew Effects in as timely a manner as possible.
As more and more accountability innovations are recommended to educators to
improve educational practices, valuable resources are expended on assessment activities.
The Standards for Educational and Psychological Testing, developed jointly by the

7
American Educational Research Association (AERA), the American Psychological
Association (APA), and the National Council on Measurement in Education (NCME),
outline considerations for sound and ethical use of testing practices (AERA, APA &
NCME, 2014). The Standards note that test scores should be interpreted in the ways for
which they have been validated, recommending parameters for test developers, who
must, “set forth clearly how test scores are intended to be interpreted and used,” as well
as obligations of the test user, who must be prepared to provide evidence of technical
quality when using the assessment for purposes not validated by the test developer.
School psychologists play an important role in prioritizing which assessments are
most effective and efficient for answering questions that need to be answered. School
psychologists are not only adept in administering and interpreting, but also evaluating the
use of assessments for a variety of purposes. Based on the work of the National Reading
First Assessment Committee (Kame’enui, 2000), Coyne and Harn (2006) describe four
purposes for assessment within a school wide early literacy system. These include:
screening, progress monitoring, diagnosis, and measuring student outcomes. Assessments
administered for each of these purposes aim to answer specific questions related to the
given purpose.
Screening assessments, which are the focus of the current study and discussed in
detail in following sections, seek to identify children who are at risk for later reading
difficulties and who should receive additional intervention. Assessments used for the
purpose of progress monitoring are used to make idiographic decisions to determine
whether individual students are making adequate progress to meet their respective goals,
and to evaluate whether interventions are working for their specific needs. Data from

8
diagnostic assessments provide information about students’ specific skills and deficits to
inform instructional decisions such as student grouping, learning objectives and
intervention targets. Finally, data from student outcome assessments guide system-level
decisions regarding the school’s reading curriculum and instruction by answering
questions related to the overall effectiveness of the school’s reading program.
The National Association of School Psychologists (2009) similarly outlines the
ways that assessment data should be used to guide educational decision-making at
multiple levels, and draws a distinction between low stakes and high stakes decisions.
Low stakes decisions are routine and reversible, such as the decision to use a particular
instructional technique in the classroom. These decisions are generally guided by less
formal forms of assessment. High stakes decisions, in contrast, are made less frequently
and are more difficult to reverse, such as decisions about retention or special education
eligibility. Along this spectrum of low to high stakes decision-making, information
obtained from assessments is used for routine classroom level decisions, as well as for
problem identification, for problem definition and certification, for problem analysis and
intervention planning, for program evaluation and accountability, and for diagnostic and
eligibility decisions.
Universal Screening
Screening is one purpose of assessment, and is an essential component of RTI
(National Center on Response to Intervention, 2010). Kettler, Glover, Albers, and
Feeney-Kettler (2014) offer a comprehensive definition of screening:
“We define screening as the use of a test or other evidence to make broad
categorizations of examinees to (a) identify which students would benefit from

9
preventive interventions and (b) determine whether school-based instructional or
behavioral assistance are meeting students’ needs. Accordingly, screening
involves brief assessments conducted with all students (i.e., universal screening)
or with targeted groups of students to identify individuals who are at risk for
future difficulties as well as to evaluate existing practices.” (p. 7)
This definition highlights the importance of using screening data not only to
identify specific students in need of intervention, but to evaluate the effectiveness of
classwide or schoolwide instructional practices. For example, if large numbers of
students are identified as at-risk for reading problems, then educators can respond to the
results of the screening data and alter the educational practices for better results. Further,
the focus of the data-based decisions is on the relationship between each student and his
or her instructional environment, providing educators with information regarding how to
meet students’ needs. Thus, screening data are used to formulate critical decisions about
programming for learners, rather than for providing evidence about disabilities and their
subsequent labels.
It is crucial that educators make knowledgeable decisions when selecting from the
screening measures available to them and when the interpreting data elicited from the
screening process. Glover and Albers (2007) identified three important considerations for
evaluating the utility of assessments used as universal screening tools. These include:
appropriateness for intended use, technical adequacy, and usability. Within the authors’
heuristic, information to be considered when evaluating appropriateness for intended use
includes compatibility with local service delivery needs, alignment with constructs of
interest, theoretical & empirical support, and population fit. Attending to these practical

10
characteristics ensures that screeners are appropriate for the context and purpose for
which they will be used. Jenkins, Hudson and Johnson (2007) similarly stress the
importance of ensuring that instruments are aligned with constructs of interest, meaning
that screening tools should “target reading or reading-related skills that are pertinent to
the grade and time the screen is administered” (p. 585).
When considering technical adequacy, Glover and Albers (2007) highlight the
need for choosing instruments that have demonstrated evidence of reliability and validity.
One type of validity, predictive validity, is arguably the most important gauge of
technical adequacy for a screening tool. It refers not only to the strength of the correlation
between the screening measure and a criterion measure administered at a later date, but
also encompasses classification accuracy, the ability of the screening measure to
accurately identify students as at risk in the domain (Jenkins et al., 2007).
Finally, Glover and Albers (2007) note that even when an assessment is
determined to be appropriate and have adequate technical properties, it must also be
evaluated for usability, including efficiency in terms of cost, time and resources,
acceptability to stakeholders, and utility of outcomes.
First-Grade Screening Tools
Although universal screening typically begins upon school entry, kindergarten
screening tools often result in unacceptable levels of false positive classifications
(Compton, Fuchs, Fuchs, & Bryant, 2006). Based on their review of research related to
early identification of reading disabilities, Ritchey and Speece (2004) argue that
classification accuracy of screening measures may be improved by screening in first-
grade, rather than kindergarten. They speculate that developmental factors, including

11
adjustment to the demands of the classroom and rapid acquisition of skills, may make
universal screening of reading skills in kindergarten less reliable than in first-grade.
Compton et al. (2006) suggest three reasons why first-grade screening procedures result
in more accurate classification. First, the developmental skills targeted by screening
measures administered during the first-grade year, such as word reading, are more closely
aligned with overall reading ability. Second, core instruction in kindergarten may reduce
the variability in skills between students based on various literacy experiences prior to
schooling. And finally, variability observed due to within-child error decreases with age.
In the current study, beginning and mid-year first-grade screening tools are examined.
These important benchmarking periods, typically occurring in September and January,
are situated in such a way that all children have had exposure to core literacy instruction
in kindergarten, yet several months of the school year remain to make educational
decisions based on screening results.
Curriculum Based Measurement
Curriculum based measurement (CBM) is an assessment method commonly used
for a variety of purposes within RTI frameworks (Deno, 2003). CBM refers to a set of
standardized procedures to index student performance in academic skill areas such as
reading. In contrast to norm-referenced tests such as those used by states for the purposes
of accountability, CBM tools are highly aligned to curricular expectations, and can be
used formatively to make instructional decisions throughout the year. CBM was
originally designed as a progress monitoring model to formatively evaluate the
effectiveness of instruction for students in special education programs (Deno & Mirkin
1977), but in recent decades CBM tools have been increasingly adopted by school

12
systems for the purpose of screening (Deno, 2003). Due to cost and time efficiency, CBM
methods have become the most common method of universal screening in RTI settings
(Ball & Christ, 2012). Over the course of the academic year, first-grade CBM screening
tools typically measure phonemic awareness, letter sound knowledge, decoding, word
identification, and text reading (Jenkins et al., 2007). One set of CBM tools, the Dynamic
Indicators of Basic Early Literacy Skills (DIBELS; Kaminski & Good, 1998) has been
identified as the most prevalent screening instrument for identifying at risk students in
early elementary school (Johnson, Jenkins, Petscher & Catts, 2009). A comparable set of
measures, the Aimsweb Tests of Early Literacy (TEL; Pearson, 2014) operationalize and
measure the behaviors associated with these foundational early reading skills, and are
also commonly used as first-grade screening tools (National Center on Intensive
Intervention, 2014).
The Aimsweb TEL are comprised of four subtests, including letter naming
fluency (LNF), letter sound fluency (LSF), phoneme segmentation fluency (PSF), and
nonsense word fluency (NWF). All four measures are typically administered during the
fall of first-grade benchmarking period. In the winter benchmarking session, students are
screened using PSF and NWF, as well as Reading Curriculum Based Measurement (R-
CBM), or Oral Reading Fluency (ORF). There is abundant research that demonstrates the
relationship between R-CBM and high stakes tests administered in close proximity to one
another (e. g. Ball & O’Connor, 2016; McGlinchey & Hixon, 2004; Shaw & Shaw, 2002;
Stage & Jacobsen, 2001), as well as evidence that R-CBM performance can predict later
performance on state tests (e.g. Silberglitt and Hintze, 2005). While the research on
predictive validity and classification accuracy of R-CBM with respect to high stakes

13
assessments is well established, there is less literature demonstrating the longitudinal
utility of individual subtests of the TEL.
With respect to Glover and Albers’ (2007) considerations for screening tools,
first-grade Aimsweb measures are generally aligned with constructs of interest (phonemic
awareness, alphabetic principal, fluency) in predicting the trajectory of reading
development, making these tools arguably appropriate for the purpose of screening. In
addition, the format of CBM tasks enjoys theoretical and empirical support. The
Aimsweb measures also demonstrate usability, in that they are efficient and cost effective
to administer. While there is some empirical support for the technical adequacy of the
Aimsweb measures as a screening tool in first-grade, as will be detailed in the following
chapter, they often do not approach the levels of classification accuracy recommended by
Glover and Albers (2007). However, the mere existence of this research allows educators
to carefully consider how they will be used. For example, a school might choose to use a
combination of screening tools to increase predictive validity, or might use further
progress monitoring to reduce the consequences of high false positive rates.
Informal Reading Inventories
Whereas districts wishing to evaluate the use of specific CBM tools as screeners
may turn to any number of the studies described in the following literature review, very
little research has been published on informal reading inventories (IRIs), assessments that
are also commonly used to determine which students are likely to require intervention.
IRIs are individually administered reading assessments in which a teacher observes a
child reading. They were originally designed as a structured observation tool for teachers
to read with their students and identify reading levels and targets for instruction (Pikulski,

14
1974), and according to some authors should be thought of as flexible strategies, rather
than tests (Johnson, Kress & Pikulski, 1987). However, many school districts use IRIs as
screening instruments to identify students in need of supplemental instruction, report the
reading levels elicited from these assessments as a summative measure of early reading,
and use their results as the basis of high stakes decisions (Paris, 2002). Paris and
Carpenter (2003) identify early detection of reading problems as among the most
important purposes of IRIs. However, the test properties of IRIs, including reliability and
validity, have been poorly documented and have been questioned (Spector, 2005; Ball &
Christ, 2012; Burns, Haegele & Petersen-Brown, 2014).
One example of a commercially available IRI is the Developmental Reading
Assessment, 2nd Edition (DRA2; Pearson, 2011a). The earliest levels of the DRA2, used
to assess emergent readers in early first-grade, prompt students to read from highly
patterned text with predictable language structures and picture support for each sentence.
The critical foundational skills consistent with the developmental stage of an emergent
reader, including phonemic awareness and decoding skills, are not explicitly measured
through this assessment. However, later levels of the DRA2 incorporate a measure of oral
reading fluency, in alignment with the development of text-level fluency expected during
the latter part of the first-grade year.
In a review of the DRA2, McCarthy and Christ (2010) noted that the assessment
has strong face validity, yet it is lengthy to administer, especially when students must
read from multiple texts to find the appropriate level. Further, benchmark expectations
are not clearly developed, and administration and scoring procedures were found to be
complicated and exposed to subjectivity, meaning that extensive training must be

15
provided to teachers and other test administrators. This, in conjunction with publisher
reported reliability statistics that are insufficient for high stakes decisions led McCarthy
and Christ (2010) to recommend against its use as a screening tool.
Very few published studies have investigated the technical properties and
decision-making utility of IRIs, and those that do call into question the diagnostic
accuracy of these tools for second and third-grade students (Klingbeil, McComas, Burns
and Helman, 2015; Parker et al., 2015). To this author’s knowledge, no published studies
have investigated the use of IRIs for the purpose of screening in first-grade.
Considerations for Screening Diverse Populations
Critically important to the validation of a screening tool is attention to whether
adequate classification accuracy is achieved across subgroups of students. Although there
is limited research in this area, there is evidence that even when screening tools have
demonstrated predictive validity, this important technical property might not be
consistent across specific populations of students. Hosp, Hosp and Dole (2011) found that
the predictive validity of NWF and R-CBM varied by subgroups including economically
disadvantaged students, English learners, students with disabilities, and racial groups,
suggesting that cut scores developed based on overall classification accuracy might
misidentify students in these groups. Others have found that lower NWF and ORF cut
scores were necessary for English learners and those who qualified for free or reduced
lunch, and have recommended disaggregating screening data to ensure access to tier II
interventions (Johnson et al., 2009). Similar research on the use of a preschool
vocabulary screening measure supported the use of alternative cut scores for screening
tools used with English learners (Marcotte, Clemens, Parker, & Whitcomb, 2016).
16
Purpose of the Current Study
While there is research support for the use of R-CBM to predict later reading
achievement, as well as some support for the use of other Aimsweb TEL measures to
predict later outcomes, research of this type has not been conducted with IRIs. The
primary purpose of the current study is to attempt to hold one IRI, the DRA2, to the same
standards of appropriateness of intended use, technical adequacy, and usability as other
screening measures. Despite the limited research base, IRIs such as the DRA2 are widely
endorsed by teachers (Nilsson, 2013a) and are frequently used as screening tools in
schools implementing RTI (Mellard, McKnight & Woods, 2009). As the uses of IRIs
have evolved since they were originally developed, there has been little formal
investigation into the changing ways that teachers are using IRIs to organize their
contemporary RTI practices. The current study was designed to understand the purposes
for which first-grade educators use IRIs and early reading CBM measures, and to
evaluate the validity of these uses in light of the characteristics of appropriateness,
usability, and technical characteristics, specifically predictive validity and classification
accuracy.
Research Questions
To evaluate the appropriateness, usability, and predictive validity of the DRA2
and Aimsweb TEL measures, as well as the validity of interpretations that teachers make
based on these tools, the following questions were tested.
Part 1: Appropriateness for Intended Use and Usability
1. Do the constructs targeted by fall and winter first-grade Aimsweb and DRA2
reading assessments align with reading related-skills that are germane to the risk

17
and resiliency factors for reading problems that have been identified by
theoretical and empirical support?
2. What is the usability evidence for first-grade Aimsweb and DRA2 reading
assessments? For example, how efficient is each screening method in terms of
cost, time and resources, and acceptability to stakeholders?
3. What inferences do first-grade classroom teachers, special educators & reading
specialists in one school district make based on the results of fall and winter first-
grade Aimsweb and DRA2 reading assessments?
This first set of research questions addresses the appropriateness for intended use,
and usability (Glover & Albers, 2007) of each reading assessment. Qualitative analyses
were used to examine the content and format of each assessment, referencing the
constructs within with theoretical and empirical support. The following chapter will
expand the discussion of which constructs related to early reading acquisition are
supported by empirical research and which are debated. Chapter 2 also includes a critical
analysis of the constructs of each test as a first step to validating their use as screening
tools. In addition to content analysis of each set of measures presented in Chapter 2,
educator input was solicited as part of an inquiry into the intended use of each
assessment, as well as the usability of each set of measures.
Part 2: Testing the Technical Adequacy of First-Grade Screening Measures
4. How much variability in third-grade state standardized test reading scores is
predicted by fall and winter first-grade performance on the DRA2 and the
Aimsweb TEL measures?

18
5. What is the classification accuracy of the fall and winter first-grade DRA2 and
Aimsweb screening measures for this sample using published cut points for risk?
Using a logistic regression approach to establish cut points for risk status, can
classification accuracy of each measure be improved for this sample?
6. How does classification accuracy differ for subgroups including English language
learners and students who are eligible for free or reduced lunch?
This second set of research questions addresses the technical characteristics of the
screening tools. While some aspects of technical adequacy, including norm group
information, reliability, and concurrent validity are reported by the publisher are explored
further as part of the content analysis of each measure, these research questions focus on
the predictive validity of screening measures administered in the fall and winter of first-
grade. The use of existing data, gathered by teachers and other educators as part of one
district’s screening protocol, allows for testing of the robustness of the validity of
decisions made by schools based on actual data, gathered in a fashion consistent with
typical practice in elementary schools that implement universal screening programs.
Part 3: Integration of Qualitative and Quantitative Data
7. Are the inferences and decisions made based on screening results supported by
the constructs assessed by each measure and by the predictive validity evidence?
Finally, qualitative and quantitative data will be synthesized to make a broad
judgment regarding the utility of the first-grade Aimsweb and DRA2 as screening tools in
the participating school district.

19
CHAPTER 2
REVIEW OF THEORETICAL AND EMPIRICAL LITERATURE
Introduction
Early screening for reading problems is an essential component of elementary
prevention and early intervention programs. Data from screening assessments are used to
determine if core instruction is meeting the needs of the majority of students, and to
determine whether further assessment & intervention may be indicated for students who
are likely to struggle. Central features of effective universal screening tools include
efficient administration, suitability for repeated administrations over the course of a
school year, strong technical properties related to predictive validity, and above all, the
ability to elicit data that can be used to make instructional and curricular decisions that
benefit students (Kettler et al., 2014).
When school personnel seek screening tools, there are numerous options available
to them, and it is common for educators to choose assessments based on information
provided by the publisher and their advertisements, without fully considering important
characteristics and contextual fit (Parisi, Ihlo, & Glover, 2014). Several scholars have
suggested critical considerations for educators wishing to ensure that the data collected
through universal screening can effectively guide service delivery to support young
readers. For example, Parisi et al. (2014) suggest the following critical questions:
o Has the instrument been designed & validated for the purpose of screening?
o Do the measured indicators align with service delivery needs in the school? If
so, are the indicators specific enough to determine whether students are

20
meeting benchmark expectations or are in need of additional instruction or
intervention?
o Is the timing & frequency of administration appropriate for identifying
instructional or intervention needs?
These questions are based on the comprehensive conceptual framework developed
by Glover and Albers (2007) as a result of their review of contemporary universal
screening science literature. The authors organize important considerations for evaluating
screening assessments into three broad factors: (1) appropriateness for the intended use,
(2) technical adequacy, and (3) usability, encouraging readers to use the framework to
advise school personnel who are adopting universal screening tools, as well as to focus
future research related to screening. Using evidence from the literature and the
assessment materials themselves, in this chapter the Glover and Albers (2007) framework
will be used to evaluate the two types of first-grade reading assessments to be
investigated in the current study: early literacy CBM, as typified by the Aimsweb TEL
and R-CBM, and informal reading inventories, as typified by the DRA2. A brief
discussion of each consideration described by Glover and Albers (2007) will be followed
by evidence from test publishers, as well as independent theoretical or empirical evidence
to support alignment with important features of screening tools for first grade readers.
Historical Perspectives on Early Reading Instruction
A chief consideration is whether the constructs targeted by screening tools align
with the constructs that predict later risk. Screening tools that identify risk of later
reading problems accurately estimate the reading-related constructs relevant to specific
developmental reading stage at the time of administration, demonstrating sensitivity to

21
the skills relevant to the grade level and at each assessment period over the academic year
(Jenkins et al., 2007). Before exploring the typical reading trajectory of first-graders and
enumerating the characteristics that are indicative of later reading success or failure, it is
worthwhile to briefly review historical reading research and examine the competing
models of the reading process that have resulted from these investigations, and more
specifically, to examine the ways each model has informed competing perspectives on
assessment and instruction for developing readers.
The first formal review of the history and scientific study of reading development
was published in 1908 by psychologist Edmund Burke Huey (Walczyk, Tcholakian, Igou,
& Dixon, 2014). Huey argued against the use of direct instruction to teach reading, and
rather recommended that the focus of reading instruction be on exposing children to
engaging literature. Huey and other early 20th century reading experts argued that phonics
exposure should be incidental, to be discovered in the context of literature, rather than
systematically taught in isolation. These scholars based their techniques on the results of
early eye tracking studies, which made use of skilled adult readers as subjects. They
observed that these practiced readers made saccadic jumps, fixating on whole words and
phrases rather than on individual letters or phonics patterns. Further, these studies noted
that word identification was stronger in the context of meaningful text (Walczyk et al.,
2014). These findings were generalized to beginning readers, leading contemporary
reading experts to argue for a whole word reading approach in which students are
encouraged to memorize whole words and use syntactic context cues to identify unknown
words, and against the direct instruction of sound symbol correspondences.

22
In 1955, Rudolph Flesch offered a refutation of whole word approaches in Why
Johnny can’t Read- And what you can do about it (Flesch, 1955). Flesch systematically
contested research, such as the studies of proficient adult readers described above, that
was used to support whole word, or “look-say” methods of reading instruction. He
contended that, “in every single research study ever made phonics has shown to be
superior to the word method; conversely, there is not a single research study that shows
the word method superior to phonics” (p.60). Flesch advocated for teaching approaches
that introduce phonetic rules, “letter by letter and sound by sound” beginning at age five
or six. Despite the popularity of Flesch’s text among American parents, many reading
educators continued to advocate for a whole word approach, and the modern “whole
language” movement continued to grow by the 1970s (Farrall, 2012).
Whole language advocates argue that learning to read is a natural process, much
like learning to speak. According to this approach, literacy develops from whole to part,
in response to children’s social needs. If they are immersed in a literacy rich
environment, children will learn how to draw upon various cueing systems to create
meaning from text (Goodman, 1986). Beginning readers in whole language classrooms
read familiar, predictable, illustrated texts that allow them to draw upon background
knowledge to comprehend. Like their whole word proponent predecessors, whole
language advocates argue against the teaching of discrete reading skills in isolation
(Edelsky, Alterwerger & Flores, 1991).
Models of the Reading Process
The competing theories described above have advanced several models of the
reading process which can be helpful in understanding the theoretical perspectives

23
involved in distinct approaches to reading instruction and assessment. According to a
psycholinguistic model of reading (Pearson, 1976), which is consistent with whole
language methodology, readers draw on three sources of information to identify words in
text: semantic, or knowledge of word meanings; syntactic, or knowledge of grammatical
structures; and graphophonic, or knowledge of sound symbol correspondences. This
model, commonly referred to as the three-cueing system (Adams, 1998) asserts that
efficient readers rely most heavily on semantic and syntactic clues, and minimize their
reliance on graphophonic cues. As described by Goodman (1967), according to this
model the act of reading is a “psycholinguistic guessing game,” in which linguistic
knowledge prevails, and the print itself is decoded only as a last resort. Hence, in this
model, reliance on graphophonic skills would be behavior indicative of a weak reader.
In contrast, code perspectives on reading offer models that give emphasis to the
role of decoding in the reading process. According to the Simple View of Reading
(Gough & Tunmer, 1986) reading comprehension is a product of decoding ability and
linguistic comprehension ability. More complex models further break down these
domains of word recognition and language comprehension into subskills (Scarborough,
2001; McKenna & Stahl, 2009). Word recognition includes phonological awareness,
print concepts, and decoding and sight word knowledge, while language comprehension
includes background knowledge, semantics and syntax. Further, these models attend to
the increasing automaticity of these skills in developing readers. Information processing
models of reading, such as that proposed by LaBerge and Samuels (1974) presume that
beginning readers expend a great deal of cognitive attention on the act of decoding
accurately, leaving few mental resources available for the processes involved in

24
comprehension. On the other hand, skilled readers automatically process the orthographic
and phonological information in the print, allowing for seamless comprehension. In code
models of reading development, a young reader who attends to the graphophonic cues
would be suggestive of appropriate reading development.
First-Grade Reading Constructs
In response to the contradiction between various approaches to initial reading
instruction, Jeanne Chall (1967) undertook a large-scale study in which she critically
analyzed existing research related to reading instruction and interviewed proponents with
multiple perspectives on what she coined “The Great Debate,” or the national discussion
of the best approaches to teaching reading. Based on this two year study, Chall came to
the conclusion that beginning reading instruction should emphasize the printed code.
Chall’s later research led her to propose a developmental sequence with the purpose of
informing instructional and assessment priorities for children of different ages (Chall,
1996). This widely cited theory of the stages of reading development is useful for
identifying the reading skills expected across each stage of reading acquisition, and thus,
for evaluating the alignment of measurement constructs for developing readers. Chall
described six predictable stages of reading development, from the Pre-Reading stage
(stage 0; birth- age 6), in which children learn concepts of print such as 1:1
correspondence between spoken words and their respective print in text, use illustrations
to tell stories, and recognize environmental print, to the Construction and Reconstruction
stage (stage 5; ages 18+), the most advanced stage during which adults interpret and
respond to abstract text (Table 1). Consistent with the accountability legislation described
previously, by the time students complete third-grade they should be prepared for the

25
Reading for Learning the New stage (stage 3; ages 9-13), which indicates students can
read text to learn new concepts and ideas. To ensure that students are progressing through
the predictable stages of reading acquisition that will result in Reading for Learning the
New by third-grade, reading screening procedures for first-graders should address the
knowledge and skills involved in stages 1 and 2, indicative of kindergarten, first and
second grade reading development. Stage 1(Initial Reading or Decoding; ages 6-7) is
observed when students learn and apply sound symbol correspondences, including basic
letter-sound recognition and more complex letter combination rules to decode words in
print. Stage 2 (Confirmation, Fluency, Ungluing from Print; ages 7-8) is observed as
students begin to automatically apply the phonics skills gained in stage 1 and gain the
fluency and speed necessary for comprehension. According to this developmental
trajectory, pre-reading concepts have been mastered by the end of kindergarten. First-
grade readers are generally developing greater decoding skills, and in the second half of
the school year, beginning to demonstrate greater fluency with connected text.
Correspondingly, the four-phase model of sight word development theorized by
Linnea Ehri (1987, 2005) offers understanding of how readers acquire the skills
necessary to automatically decode complex words. Children in the pre-alphabetic phase
have little to no knowledge of letter names or sounds, yet learn to recognize print in their
environments through other visual and contextual cues such as pictures and graphics in
logos. As students begin to learn about letter sound correspondences, they enter the
partial alphabetic phase, in which they use these correspondences to begin decoding
words. In this stage, children often rely on known associations (typically initial and final
consonants), and thus alphabetic knowledge is considered “partial”. In the full alphabetic

26
phase readers have developed a more complete knowledge of graphophonic connections
and can use this information to decode unfamiliar words. Finally, in the consolidated
alphabetic phase, readers have memorized morphemes and other recurring letter
sequences to enable rapid identification of complex, previously unfamiliar multisyllabic
words. Throughout these stages, as words are encountered multiple times, they are
committed to memory. Once typically developing readers have reached the full
alphabetic phase, they only need a handful of successful encounters to recognize a word
by sight.
Ehri’s work sheds light on the process by which readers move from Chall’s stage
1 to stage 2, or in which they move from being “glued to the print” to becoming fluent
readers capable of reading previously encountered words by sight, as well as
consolidating knowledge of letter sequences to automatically decode unfamiliar words.
Both Ehri and Chall argued that for many children, progression through stages of reading
development does not occur on its own, and that children identified as having poor
reading skills require direct instruction in phonological awareness and the alphabetic
principal. Indeed, Ehri (2005) concluded that “phonics instruction promotes more rapid
movement from the partial to the full phase than whole-word instruction” (p. 147). Based
on the work of Chall (1996) and Ehri (2005), for a screening tool to be deemed
appropriate for the purpose of identifying first-graders who may require more
instructional support in the area of decoding, it must measure the constructs related to
automatic decoding, including knowledge of letter names and sounds, and use of letter
sound correspondences to decode novel words.

27
These developmental reading theories are reflected in the work of the National
Reading Panel (NRP; NICHD, 2000), which became the basis for educational policy
related to the teaching of reading. The panel reviewed the research literature regarding
effective practices for teaching reading, and identified five components of reading
development as most critical: Phonological Awareness, Phonics, Fluency, Vocabulary
and Comprehension. These findings are in turn reflected in the Common Core State
Standards (Massachusetts Department of Elementary and Secondary Education
(Massachusetts Department of Elementary and Secondary Education, 2017a), which
outline curricular frameworks for foundational skills of Print Concepts, Phonological
Awareness, Phonics and Word Recognition, and Fluency, as well as frameworks related
to the comprehension of literature and informational texts. These reading standards
establish expectations that during the first-grade year, children will: demonstrate
understanding of the organization and basic features of print, demonstrate understanding
of spoken words, syllables, and sounds (phonemes), know and apply grade-level phonics
and word analysis skills in decoding words, and read with sufficient accuracy and fluency
to support comprehension. In addition, first-graders are expected to: ask and answer
questions about key details of texts, retell stories using key details, identify the main topic
of informational texts, identify common genres of text, compare and contrast stories and
informational texts, and use text features, including illustrations and details of stories and
informational texts to support understanding. They are expected to distinguish between
information provided by pictures or other illustrations and information provided by the
words in a text. It is understood that for first-graders, instruction focused on these
comprehension standards should be primarily based on texts that are read aloud, as most

28
students will be capable of comprehending stories and informational texts at levels far
beyond what they can read independently.
Reading Instruction in First-Grade Classrooms
Today, decades after Chall first formally addressed the opposing perspectives on
reading instruction in Learning to Read: The Great Debate, the reading science research
and resulting policy decisions have converged on the understanding that children should
receive explicit, systematic instruction in phonics as part of a comprehensive literacy
program (Moats, 2000). Despite negligible evidence to support a whole language
approach, the perspective and associated instructional practices remain commonplace in
first-grade classrooms. For example, within a Guided Reading approach, commonly used
as the core reading instruction for first-grade students (Fountas & Pinnell, 2012), teachers
read leveled, minimally decodable texts with small groups of students, focusing on using
semantic and syntactic cues rather than graphophonic decoding strategies to induce word
identification skills. The developers of the Scholastic Guided Reading Program (Pinnell
& Fountas, 2010) note that all instruction within this model is designed to teach reading
comprehension. However, phonics instruction is noted as an important component of the
program, incorporated as follows:
Guided reading provides the opportunity to teach this kind of problem-solving
using phonics and, in addition, may provide one or two minutes of “hands on”
phonics and word work at the end of each lesson. Phonics is an active part of the
teaching in guided reading: In the introduction, the teacher draws attention to
aspects of words that offer students ways to learn how words “work,” for
example, by point [sic] out first letters, plurals, word endings, consonant clusters,

29
vowel pairs, or syllables. As students read, the teacher teaches, prompts for, and
reinforces children’s ability to take words apart. After reading, the teacher may
make an explicit teaching point that shows students how to take words apart
rapidly and efficiently. The teacher may preplan some specific word work that
shows children phonics elements that they need to know to solve words at this
particular level of text. Students may learn to hear sounds in words (in sequence),
manipulate magnetic letters, or use white boards and dry-erase markers to make
phonics principles explicit. (Pinnell & Fountas, 2010, p. 9-10)
The authors note the alignment of their approach to the findings of the NRP,
emphasizing the NRP’s assertion that phonics is but one component of a literacy
program. However, this approach to phonics, to be accomplished in “one or two minutes
at the end of each lesson,” does not correspond Chall’s (1967) recommendation that
beginning reading programs emphasize learning of the alphabetic code. Further, phonics
instruction after students have engaged in the reading of the text, rather than prior to
reading, implies the importance of using meaning cues to identify words and the use of
phonetic cues as a last resort. In contrast, explicit, systematic phonics instruction,
according to the NRP “typically involves explicitly teaching students a prespecified set of
letter- sound relations and having students read text that provides practice using these
relations to decode words” (NICHD, 2000, p. 2-92).
Considerations for Evaluating First-Grade Screeners
Appropriateness for Intended Use
Assessments used as screening tools must demonstrate appropriateness for the
purpose of screening, meaning not only that they measure the constructs that indicate

30
development and risk factors in the given domain, such as the reading skills described
above, but also that they employ an appropriate format and that the data derived from the
assessment are used to determine instruction and service delivery within the specific
context in which they are to be administered.
Alignment with Constructs
First-Grade CBM Tools
The Aimsweb Technical Manual notes that the TEL measures align to the critical
reading skills identified by the NRP (Pearson, 2012c). Indeed, the first-grade Aimsweb
measures, which include Letter Naming Fluency (LNF), Letter Sound Fluency (LSF),
Phoneme Segmentation Fluency (PSF), Nonsense Words Fluency (NWF), and Reading-
Curriculum-based Measurement (R-CBM) are highly aligned to the important constructs
identified above. PSF is an indicator of phonological awareness, LNF, LSF and NWF are
indicators of the alphabetic principal and decoding skills, while R-CBM an indicator of
fluency with connected text. Research supports the premise that NWF, and to a lesser
extent LNF, measure important constructs predictive of later reading ability (Speece,
Mills, Ritchey & Hillman, 2003). Oral reading fluency, measured by R-CBM is likewise
an indicator of overall reading ability (Fuchs, Fuchs, Hosp & Jenkins, 2001). Print
concepts, one component of the Common Core State Standards, are not explicitly
measured in the first-grade Aimsweb tasks, yet are tacit in the general outcome measure
of R-CBM. The Aimsweb tools typically used for first-grade screening do not include an
explicit measure of comprehension. Nonetheless, Reading Maze is a reading
comprehension task that is available for first-graders as part of Aimsweb. In this
assessment, students silently read a passage in which every 7th word is replaced by a

31
three-word choice prompt from which readers select the correct word for the context of
the passage. However, because the ability to read connected text is developing over the
course of the first-grade year, Maze is not typically administered as a screening tool until
grade 3 and beyond, and was not investigated as a screening tool in the current study.
Examples of the Aimsweb TEL probes can be seen in Appendix A.
Informal Reading Inventories
According to the DRA2 technical manual, the test is designed to measure three
“critical components” of reading, including reading engagement, oral reading fluency,
and comprehension. Factor analysis conducted by the publisher confirms that oral reading
fluency and comprehension are indeed two distinct dimensions that are being measured
by the DRA2 (Pearson, 2011c). The third component, reading engagement, is a
qualitative indicator that is not taken into account when determining a child’s score, or
reading level. In levels A through 3 of the DRA2, oral reading fluency is assessed by
observing and rating three components - Monitoring/Self Corrections, Use of Cues, and
Accuracy – on a Likert-type scale. In these levels, “Printed Language Concepts”,
including directionality, one to one correspondence, and the child’s demonstrated
understanding of the meaning of the terms word, begins, ends, letter and/or sound is
measured in lieu of comprehension. At levels 4 through 12, oral reading fluency is
assessed by evaluating the student’s use of four components - Correct Phrasing,
Monitoring/Self-correction, Problem Solving Unknown Words, and Accuracy. At levels
14 and beyond, oral reading fluency is measured by rating the student’s use of
Expression, Phrasing, Rate, and Accuracy. The comprehension components assessed at

32
levels 4 and beyond include making predictions from text features such as the title and
illustrations, retelling, and responses to questions related to interpretation and reflection.
Decoding and word identification are incorporated in levels A-3 as Use of Cues
(including pictures, sentence pattern and visual information), and levels 4-12 as Problem
Solving Unknown Words. The teacher later completes an analysis of errors (called
miscues), indicating whether they were self-corrected, whether they interfered with
meaning, and how the student attempted to problem solve unknown words. A sample
DRA2 Teacher Observation Guide from texts typically read by mid-year first-graders is
presented in Appendix B.
The DRA2 also includes a word analysis assessment that includes phonological
awareness tasks such as rhyming, alliteration and segmenting, and phonics tasks such as
encoding, decoding, and syllabication. However, this aspect of the DRA2 does not appear
to be routinely administered and is not commonly used to make determinations about
students’ predicted risk or resiliency when screening reading ability. The publisher
recommends that teachers use results of the DRA2 leveled text to determine whether or
not to administer the Word Analysis Task. The assessment is not intended for students
who are “meeting established levels of proficiency” (Pearson, 2011c). The DRA2 Word
Analysis was not administered in the participating school district for this study.
Based on this review of the assessment’s content, it appears that the DRA2 is
most closely aligned with a psycholinguistic perspective on reading. In Level 3 of the
DRA2, which is the expected level for students to read independently in the fall of first-
grade, oral reading is supported and assessed by student’s use of illustrations and
predictable text (the first page is read by the teacher). At Level 8, which students are
33
expected to read independently in the winter of first-grade, oral reading continues to be
supported by predictable text and illustrations on every page, and comprehension is
measured by recording the students’ retelling of the story and noting use of details, ability
to retell in sequence, and use of important vocabulary from the text. These elements of
reading are indeed reflected in the Common Core State Standards, yet do not measure
students’ progression through the decoding stage of reading development. Oral language
skills have been shown to be predictive of later reading (Roth, Speece & Cooper, 2002)
and are likely encompassed in the retelling task. The constructs of phonological
awareness and phonics identified as critical to first-grade reading instruction and
assessment are not explicitly measured by the DRA2.
Format of Screening Tools
The theories of reading reviewed above have implications for assessment of first-
grade readers, not only in terms of test content, but also in terms of item format. Early
literacy indicators that represent the big ideas of phonological awareness, alphabetic
understanding, and accuracy and fluency with connected text are measured via CBM
probes. The probes can be administered repeatedly to measure a child’s growth towards
an expected outcome. Therefore, each probe is equivalent so that growth can be seen
across benchmarking periods. The fluency with which children demonstrate skills is
central to this assessment approach as the raw score gains elicited during each one-
minute testing procedure reflect the cognitive acquisition of mastery of the subskills that
are measured. Consistent with cognitive theories of automaticity, rapid response rates in
fluency tasks can be interpreted as an indicator of learning. In this way, R-CBM has been
demonstrated to be an indicator of not only efficiency of word identification, but also of
34
overall reading competence, including comprehension (Fuchs et al., 2001) because of
underlying fluency in skill acquisition. Similarly, the fluent performance on measures of
component skills can predict later performance on more advanced component skills, and
ultimately on overall reading proficiency (Good, Simmons & Kame’enui, 2001).
Critics of early literacy CBM take issue with the “reductionism” of using a single
one minute measure, such as NWF, to measure knowledge of the broader skill of
alphabetic principal. There is fear that CBM leads to instruction that focuses on
component skills rather than broad reading skills that facilitate understanding, and that
the timed component leads students to focus on speed rather than accuracy and meaning
(Goodman, 2006). However, the DIBELS authors point out that arguments against the
use of these tools are based largely upon misconceptions about the purposes of the
assessment, and subsequent misuse by educators (Kaminski et al., 2007).
Whole language proponents tend to favor a more “naturalistic” approach to
assessment, in the form of anecdotal observations and checklists (Cambourne & Turbill,
1990). Goodman (1986) describes “ongoing kid-watching,” or careful observation of
children as they read and write, or converse and play with peers, as the most effective
assessment tool that whole language teachers have at their disposal.
Published IRIs typically require students to read leveled passages and respond to a
series of comprehension questions. At least some of the text is generally read aloud by
the student to the teacher, who completes a running record to evaluate the student’s
accuracy and interpret errors, referred to as miscues. Fundamental to the format of IRIs is
Betts’ (1946) system of reading levels. A student’s independent reading level is the
highest text readability that a student can independently read with greater than 90%

35
comprehension, and greater than 99% accuracy, while the instructional level is the
highest level of text that the student can comprehend at a rate of at least 75%, and read
with at least 95% accuracy. This level of text was thought to be appropriate for
instruction. Finally, a student’s frustrational level would be that at which comprehension
is less than 50%, and accuracy less than 90%. A student’s “score” on most IRIs is
reported in terms of his independent reading level. For example, on the DRA2, the IRI
used in this study, first-graders are expected to progress from an independent level 3 in
the fall, to a level 8 in the winter, and a level 16 in the spring.
Another integral aspect of IRIs is the use of a running record to document
observations about a student’s oral reading. Miscues are analyzed to determine whether
the error preserves meaning, either interfering with comprehension or not. Miscue
analysis (Goodman, 1969), based on the aforementioned three cueing system, is a
commonly used approach to reading assessment in whole language classrooms, and
manifest in many IRIs. Based on the psycholinguistic perspective of reading, errors that
preserve the meaning of the text are considered less problematic than those that interfere
with meaning. IRI leveled passages or texts are frequently illustrated, allowing the child
to use pictures to confirm text as one of these cueing strategies. After reading, students
are typically expected to retell what they have read, or respond to literal and inferential
questions about the text.
In recent years, perhaps in response to the identification of fluency as an essential
component of reading and a pivotal marker in the development of proficient reading,
many published IRIs, including the DRA2, have added a timed component, in which the
teacher times the student for a portion of the text. The DRA2 introduces the fluency

36
component at level 14, typically achieved in the early spring months of first-grade. This
practice aligns with typical reading development of first-graders, who are commonly
beginning to read connected text by the middle of the year. However, the assessment has
no measure of automaticity of skills for students prior to level 14, instead relying on the
word reading accuracy, expression and phrasing to inform the oral reading fluency
portion of the test. There is evidence that measuring oral reading rate distinguishes
between high and low ability readers with better precision than measuring accuracy
(Fuchs et al., 2001). Therefore, a tool that does not take fluent response rate into account
may not be as sensitive in distinguishing between students who are or are not at risk of
reading problems in later elementary school. Additionally, because this fluency portion of
the assessment is not introduced until the end of first-grade, it has limited utility for
providing preventative instructional support in an RTI model.
Local Compatibility
Finally, when addressing the prerequisite of appropriateness for intended use,
schools should consider the compatibility of the assessment tool with the local
population, as well as the specific service delivery needs of the school (Glover & Albers,
2007). The screening tool should be appropriate both to the developmental needs of the
population, and the contextual factors of the setting. Within this consideration, it is
important to take into account the needs of diverse respondents. Evidence that the tool is
appropriate for various students can be found by again examining the theoretical and
empirical support, and by carefully assessing the normative sample used in standardizing
the measure. Additionally, the timing and frequency of administration of screening
measures should provide timely evidence that can be used to make instructional decisions

37
across all tiers of service delivery within an early elementary preventative reading
program. That is, the tool should be able to predict various levels of risk among the total
population of students, rather than merely those most likely to succeed on later outcomes
and those with the most profound reading disorders.
Aimsweb provides expected performance scores for each benchmark assessment
period for each assessment in its suite. The scores can be used to interpret the
performance of individual students in relation to performance expectations. These default
cut scores were developed based on norm groups in the range of 25,000 – 70,000 students
depending on each subtest. This sample was comparable to the U.S. population in terms
of gender, race, and free or reduced lunch status. English learner information is not
included for this sample, but ELL norms have since been developed by the publisher
(Pearson, 2012b). In contrast, the DRA2 expectations and reading level benchmarks were
not established as the result analyzing of norm group performance, but rather, they are
based on the expert judgement of 11 teachers for kindergarten through second grade
benchmarks. The technical manual references the use of data from 29,000- 65,000
students (depending on grade level) from the DRA2 Online Management System to
confirm the teacher established benchmarks. These data are not presented in the technical
manual, yet it is asserted that, “in all cases, teachers felt that the national data confirmed
the cutpoints they had established. (Pearson, 2011c, p.52).
The Aimsweb publisher (Pearson, 2012c) acknowledges that the tools may not be
a valid measure of early reading skills for all students, such as those with severe speech
or vision impairments. The TEL administration guide lists several acceptable
accommodations, including enlarging print on the probes, repeating instructions, or

38
modifying the environment. When screening English learners, norms are available for the
TEL and R-CBM which compare students to students at similar level of English
proficiency. The DRA2 technical manual does not make reference to accommodations for
students with disabilities, with the exception of the suggestion that depending on specific
needs, students with IEPs be allowed to dictate responses to written retelling and question
tasks in levels 28 and above. The technical manual does not make reference to English
learners except in discussion of validation of the Word Analysis Task.
Both Aimsweb and the DRA2 purport to provide information regarding various
levels of risk. The Aimsweb default cut scores identify students by level of need in a
multi-tiered system of supports, with students above the 35th (45th for R-CBM) percentile
according to national norms considered Tier 1, and not at risk, students below the 15th
percentile considered tier 3 – in need of intensive support, and those in between, tier 2
(Pearson, 2011b). The DRA2 similarly provides cutpoints for independent, instructional
(in need of additional support), and intervention (in need of intensive support). The
DRA2 recommends that students not be tested more than one year above grade level
according to end of the year cut scores, meaning that there is a ceiling for very advanced
readers (Pearson 2011c).
The first-grade Aimsweb measures are meant to be administered as screeners
during three benchmarking periods in the fall, winter and spring of the school year. There
are 30 progress monitoring forms of each measure in addition to the benchmark probes.
The DRA2 is designed to be administered “annually or semiannually in the fall and
spring”, and the publisher notes that, “it can also be administered more frequently to
identify students needing intervention and monitor their progress” (Pearson, 2011c, p.

39
27). For most levels of the DRA2, two benchmark assessment books are available, with
nonfiction texts available for levels 28 and greater.
Adequacy of Technical Characteristics
Adequacy of Norms
Educators wishing to evaluate the utility of screening tools should first look for
evidence that the normative sample used to standardize the measure is reflective of the
target population. The normative sample should be representative in terms of gender, age,
grade, race and ethnicity, socioeconomic status, and disability. The norms should also be
recent and the sample of an adequate size to allow valid interpretations to be drawn.
As described previously, the Aimsweb normative sample ranges from roughly
25,000-70,000 depending on subtest. This norming information was collected during the
2009-2010 school year. Despite the apparent availability of similar magnitude of data in
the DRA2 Online Management System, the test was not standardized using a norming
group. The technical manual describes the sample of students used for field tests in 2006
(1676 students) and 2007 (1084 students). This sample, which is also roughly
characteristic of the larger U.S. population, was used to analyze some, but not all of the
reported investigations of reliability and validity.
Reliability
Reliability refers to the consistency of measurement under differing conditions
(Thorndike, & Thorndike-Christ, 2010). Indicators of reliability include test-retest
reliability, alternate form reliability, internal consistency reliability, and interrater
reliability, reported as correlation coefficients that range from 0-1. Values of .70 to .80
are generally acceptable for screening decisions, with values above .90 expected when

40
the tool might be the basis of high stakes decisions. (Salvia & Ysseldyke, 2004, Christ &
Nelson, 2014).
CBM tools have a demonstrated record of reliability for their performance level
scores, appropriate for screening decisions, albeit not consistently at the level required for
higher stakes decisions (Good et al., 2001; Elliott, Lee, & Tollefson, 2001). For R-CBM,
Aimsweb reports alternate form reliability of .95 for fall and winter first-grade
administrations, and interrater reliability of .99. Based on a sample of 75 kindergarten
students, for the TEL subtests, reliability estimates of .80-.94 are reported depending on
subtest and reliability type. DIBELS Next reports similar reliability levels for probes
identical to the Aimsweb probes, with interrater reliabilities above .96, and alternate form
reliabilities above .94 (Dewey, Powell-Smith, Good, & Kaminski, 2015).
The reliability of IRIs has been questioned for some time (Pikulski, 1974; Klesius
& Homan, 1985). Spector (2005) examined reliability evidence from nine IRIs (not
including the DRA2). She found that fewer than half of the IRI publishers did not report
any reliability information at all, and went as far as to suggest that “failure to address
reliability appears to reflect a considered decision by some IRI authors to ignore widely
accepted professional standards of test quality” (p. 599). While some IRIs did mention
reliability, their studies had weak methodology marked by small sample sizes, and poor
documentation of methods in general. A later replication of Spector’s study (Nilsson,
2013b) found that the reporting of reliability in IRI manuals had improved, but was not
consistent across measurement tools.
In reporting internal consistency, The DRA2 technical manual reports separate
Cronbach’s alpha estimates for the two constructs of oral fluency and comprehension,

41
reporting levels .62-.85 for oral fluency, depending on level, and .69-.85 for
comprehension, again depending on level. These estimates provide an indication of how
consistently the indicators for each construct, (for example, expression, phrasing, rate,
and accuracy as oral reading indictors) measure the construct of interest. The DRA2
reports strong test-retest reliability, with r=.99 for comprehension and r=.97 for oral
fluency. Finally, interrater agreement estimates provided by the publisher (Gwet’s Kappa
coefficient) are .57 for fluency and .65 for comprehension, indicating moderate
agreement between test administrators.
Validity
Reliability is a prerequisite psychometric property of any test, with validity
closely following. Validity refers to the degree to which evidence gathered from an
assessment supports the interpretation of the tests scores for the purposes they will be
used for. (AERA, APA, & NCME, 2014). Valid decisions using test results are supported
by understanding evidence of the test content, which means clear evidence that a
theoretical domain is represented in the tasks of the test. Previous sections of this chapter
described the ways in which developmental reading theories are represented in early
reading screening measures. Two additional sources of validity evidence include
evidence based on relations to other variables of similar constructs, and evidence based
on consequences of interpreting test results. For the former, validity of an instrument in
relation to other variables is demonstrated through alignment between the assessment and
variables of interest, and evidence of correlations between the measure and an established
criterion, either concurrently or at a later time (Christ & Nelson, 2014). For screening
measures, this is reported in predictive validity studies, where performance at one period

42
of time is related to performance on an outcome variable at a later time. Inferences from
predictive validity evidence support decisions regarding whether current performance
levels are indicative of later achievement.
Evidence of the validity of the Aimsweb tests in relation to other variables is
reported via correlations between subtests and several concurrent and future criterions,
with moderate relationships between most subtests and performance on the criterion
measure. Strong correlations are reported between R-CBM and criterion measures
administered concurrently. The DRA2 reports moderate to strong concurrent validity
correlations, and for predictive validity on measures administered 5 months later,
moderate coefficients for fluency, and stronger coefficients for comprehension, albeit
with a small sample of 31 students. The validity evidence reported in the Aimsweb
(Pearson, 2012c) and DRA2 (Pearson, 2011c) technical manuals is presented in Table 2.
Because screening measures are used to identify which students may be at-risk for
later reading problems, validity analyses for a screener must also test whether the
assessment results accurately identify which students are at-risk and which are not.
Classification Accuracy
While validity is traditionally reported in terms of correlation coefficients as
described in the preceding paragraph, recently, more contemporary understandings of
validation have been put forth. Kane (2013) for example, argued that “to validate an
interpretation or use of test scores is to evaluate the plausibility of the claims based on the
test scores” (p. 1). In order to validate a given assessment, the interpretations, uses, and
consequences of test scores must be carefully considered, and it is those interpretations
and uses that are validated, rather than the test itself.

43
As seen in the example of CBM, it has become common for schools to use one
test for multiple purposes (AERA, APA & NCME, 2014). It is important that tests used
in this way be validated for these multiple purposes, which may require different types of
technical evidence. When a test is used for the purpose of screening, it is crucial that it be
able to accurately classify students according to whether they are at risk for later reading
problems. Classification accuracy is typically reported in terms of sensitivity and
specificity (VanDerHeyden, 2011). Sensitivity refers to the proportion of true positives, or
those students who failed to pass the criterion measure and who were identified by the
screener, while specificity refers to the true negatives, or students who attained
proficiency on the criterion and who were not identified by the screener. High false
negative rates (1-sensitivity) are considered most problematic, as students in need of
intervention are not identified (Ritchey & Speece, 2004; Jenkins et al., 2007). However,
high false positive rates are also undesirable, as this leads to wasted resources when
students not in need of intervention are misidentified (Hintze, Ryan & Stoner, 2003).
Two other indices, positive predictive value (PPV) and negative predictive value (NPV)
are indicators of the proportion of students who were identified as at risk who were truly
at risk on the later criterion, and the proportion of students who were identified as not at
risk who were truly not at risk on the later criterion. Glover and Albers (2007) suggest
that PPV and sensitivity are the most important of these four indices in determining the
technical adequacy of a screening tool, because accurately identifying which students
need additional instructional support is the primary purpose for screening in schools.
They also note that an overall hit rate, or proportion of all students that are correctly
classified, is commonly reported yet difficult to interpret depending on the prevalence of

44
reading failure in the sample. These indices for measuring classification accuracy are
presented visually in Figure 1. Based on their review of research related to early
childhood screening, Glover and Albers (2007) question the utility of measures with
sensitivity, specificity, and PPV of less than 75 or 80%. It has been recommended
elsewhere that false negatives be minimized by aiming for a sensitivity rate of .90
(Compton et al., 2006; Jenkins et al., 2007). More moderate values, such as minimum
sensitivity of .80 and specificity of .70 are acceptable according to other authors
(Klingbeil, et al., 2015). Acceptable values vary depending on the screening approach. If
universal screening at benchmark periods is used to identify students for intervention, as
is common practice in schools (Fuchs, Fuchs & Compton, 2012), screening measures
should be highly accurate according to all indices. However, screening practices that
allow for multiple stages of follow up screening might allow more false positives in the
initial screening period (VanDerHeyden, 2011).
The use of receiver operating characteristics (ROC) curves (Swets, 1996) is
common in deriving cut scores that balance sensitivity and specificity. These curves plot
the sensitivity against the false positive rate (1-specificitiy) for each possible cut point.
ROC analysis also provides the area under the curve (AUC), a statistic useful in
evaluating the overall accuracy of a diagnostic test with an AUC greater than .90
indicating excellent classification; .80 to .90, good; .70 to .80, fair; and below .70, poor
classification (Compton et al., 2006).
Classification Accuracy of CBM
There is ample research to support the use of R-CBM in predicting performance
on high stakes state tests, especially when the screener and outcome measure are given in

45
the same year. Stage & Jacobsen (2001) for example, found a relationship between slope
in R-CBM and performance on the Washington state assessment among fourth grade
students. R-CBM performance in the fall of fourth grade was able to accurately predict
performance on the state assessment for 74% of participants. Several other studies have
found fall R-CBM scores in grades three and above to be significant predictors of end of
year performance in high stakes tests in various states. (Shaw & Shaw, 2002; Ball &
O’Connor, 2016; McGlinchey & Hixon, 2004). Relatively fewer studies have examined
longer term predictive validity of R-CBM. Silberglitt and Hintze (2005) examined the
relationship between R-CBM administered three times a year beginning in the winter of
first-grade, and the Minnesota state assessment administered at the end of third-grade.
While correlations and classification accuracy increased for administrations closer to the
outcome assessment, they found that even in the winter of first-grade, R-CBM accurately
predicted third-grade assessment performance, with a moderate correlation of .47
between measures. Using logistic regression and ROC curve analysis, the authors were
able to work backwards to establish the most sensitive cut scores for each benchmarking
period in order to improve the utility of R-CBM as a screener with the specific population
of participants in their study. Using the spring of first-grade benchmarking period, they
were able to attain a sensitivity of .75 and specificity of .71 when predicting third-grade
reading assessment performance. This same procedure for working backwards from a
criterion test to validate a screening tool and establish the most sensitive cut points has
been recommended to researchers, as well as school districts wanting to identify the
students most likely to benefit from intervention (Jenkins et al., 2007). While this type of
research has validated the use of R-CBM to predict same year outcomes, there is less

46
evidence of the utility of R-CBM and other measures (such as LNF, PSF and NWF) for
predicting longer term outcomes for first-graders. Available evidence is reported in Table
3 and reviewed in the following paragraphs.
Good et al. (2001) investigated the utility of individual DIBELS subtests to
predict performance at the subsequent benchmark period and used this information to
derive benchmark goals. For example, 90% of students who reached the winter first-
grade NWF benchmark goal reached the spring first-grade R-CBM benchmark goal, 97%
of students who reached that goal met the second grade R-CBM goal, and 96% of
students who reached that goal passed the Oregon state assessment in third-grade.
Johnson et al. (2009) examined the classification accuracy of DIBELS measures
administered in the fall of first-grade when predicting end of first-grade performance
below the 40th percentile on the Stanford Achievement Test – 10th Edition (SAT-10).
Holding sensitivity at 90%, they found specificity levels of .20 for PSF, .42 for NWF and
interestingly, .59 for ORF which is not typically administered in the fall. Goffreda,
Diperna & Pedersen (2009) investigated longer term prediction, looking at the
relationship between first-grade early CBM measures (including LNF, PSF, NWF and R-
CBM), and the Pennsylvania third-grade outcome measure. They found that R-CBM was
the only significant predictor in a logistic regression model, and the only measure that
demonstrated adequate levels of sensitivity and specificity. In this study, sensitivity for
LNF administered in the winter of first-grade was .47, while specificity was .70.
Sensitivity for PSF was .77, while specificity was .47. Sensitivity for NWF was .89,
while specificity was .50. Sensitivity for R-CBM was .77, and specificity was .88. The
authors used ROC curves to establish optimal cut points to balance sensitivity and

47
specificity for the specific population of participants, yet still did not reach adequate
levels, with the exception of R-CBM.
Catts, Petscher, Schatschneider, Bridges and Mendoza (2009) examined DIBELS
measures for floor effects, and investigated the consequences of these effects on the
predictive validity of subtests administered in kindergarten through third-grade. ORF was
used as an outcome measure for PSF and NWF, while the SAT-10 was used as an
outcome measure for ORF administrations. Initial administrations of each DIBELS
measure were marked by strong floor effects, meaning that many children score near the
lower end of the distribution. Predictive validity for each measure improved across
administrations, with the exception of PSF which became less predictive over time. This
has implications for universal screening, demonstrating the importance of choosing an
optimum time point for the initial administration of each measure. Relevant to the current
study, the authors suggest that based on their results, by the winter of first-grade, floor
effects for LNF and NWF will have been minimized, but ORF will be subject to floor
effects as it is the first administration of this measure and the ability of students to read
connected text fluently is just emerging at this point in time. Based on this study, as well
as those described above, PSF may not have utility as a stand-alone screening tool due to
high false positive rates. Similarly, Hintze and colleagues (2003) investigated the
classification accuracy of PSF, with the Comprehensive Test of Phonological
Processing (CTOPP) as the criterion, and found that PSF over-identified children as
having a weakness in phonological awareness.
Other studies have examined shorter term predictive validity of early literacy
CBM measures. Clemens, Shapiro and Thoemmes (2011) investigated the utility of fall

48
DIBELS subtests, as well as another measure (Word Identification Fluency (WIF)) to
predict end of year R-CBM performance above the 30th percentile. WIF was the most
accurate predictor. When sensitivity was held at .90, PSF led to high rates of false
positives, with specificity at .20. Specificity for LSF and NWF were .64 and .59,
respectively. With a sample of over 800 students, Riedel (2007) examined the utility of
DIBELS subtests in predicting later reading comprehension as measured by performance
above the 40th percentile on the second grade TerraNova reading subtest. For the fall
administration, LNF was the best predictor, with a sensitivity of .67 and specificity of
.64. PSF resulted in a sensitivity of .58 and specificity of .58, and NWF resulted in a
sensitivity of .65 and specificity of .61. Consistent with other research, in the middle of
first-grade, ORF was the most accurate predictor, with a sensitivity of .69 and specificity
of .65 in the winter of first-grade. Sensitivity for PSF administered at the same time was
.54, with specificity .54 as well. Properties of NWF included sensitivity of .62 and
specificity of .58. Based on the poor classification accuracy of PSF and NWF, the author
goes as far as to recommend that only ORF be administered beginning in the middle of
first-grade. While LNF, PSF and NWF have been analyzed as described in the studies
above, use of the LSF measure with first-graders has not been widely investigated in
terms of predictive validity.
Based on available research, it would seem that neither Aimsweb TEL measures,
nor R-CBM approach the recommendations of Jenkins et al. (2007) for appropriate
sensitivity and specificity when used in first-grade. The current study contributes to the
existing literature by establishing cut scores that result in adequate levels of sensitivity.
While higher cut scores might result in lower levels of specificity, this may be acceptable

49
as part of RTI practices that quickly rule out the need for further intervention with
students with potential false positive results on the initial universal screening benchmark.
Classification Accuracy of IRIs
There has been relatively little investigation of the classification accuracy of IRIs.
Klingbeil, et al. (2015) and Parker and colleagues (2015) examined the predictive validity
and diagnostic accuracy of the Fountas & Pinnell Benchmark Assessment System (BAS;
Fountas & Pinnell, 2010), an IRI comparable to the DRA2. They investigated technical
properties of the BAS and R-CBM administered to second and third-graders in the fall,
finding that while correlations between both predictors and the criterion were high, as
were correlations between R-CBM and BAS themselves, neither measure adequately
predicted performance on the Measures of Academic Progress (MAP) in the spring.
However, diagnostic accuracy of R-CBM was much higher than the BAS. The authors
suggest that “poorly developed criteria” may explain the low diagnostic accuracy of the
IRI. These studies cast doubt regarding the utility of IRIs as screening tools for second
and third-grade students, due to the fact that they take much longer to administer than R-
CBM, but are worse at predicting future reading ability. Importantly, no similar study has
tested the classification accuracy when using an IRI with a population of first-graders.
Usability
Usability refers to a screening instrument’s practical characteristics when
administered in a given context. The balance of cost and benefits to using the tool should
be carefully examined, keeping in mind that costly screening tools refer not only to those
that incur monetary expenses, but also those that detract from instructional time.
Screening tools should be acceptable to multiple stakeholders, including school staff,

50
students, and families. Buy-in from these stakeholders is most likely to occur if they see
that benefits outweigh the costs.
Administration of the screening tool should be feasible for school staff who may
experience turnover from year to year. Complicated administration may result in
unreliable data, or incur additional training costs. Administration guides should be able to
be understood by the diverse set of adults who may administer assessments in schools,
and provide enough direction, training materials and support to elicit reliable results
across administrators. Schools can also evaluate the infrastructure requirements for not
only administering screening tools, but also managing and interpreting data.
Usability also includes consideration of whether appropriate accommodations are
available for administering the measure to specific populations such as students with
disabilities or English language learners, and for scoring and interpreting results for these
subgroups. Finally, effective screening tools have evidence of treatment utility, meaning
that the information gathered through use of the screening tool should be useful in
determining what intervention support is best to meet students’ diverse instructional
needs.
In terms of time costs, the Aimsweb tests consist of four one-minute probes in the
fall of first-grade, and three one-minute probes in the winter, making administration time
roughly 5-7 minutes per student to allow for instructions to be read to the student.
Financial costs include $8 per student for an annual subscription which includes
screening as well as progress monitoring, and access to the Aimsweb online data
management system. This price is reduced to $4.50 per student for current members.

51
Training options include free webinars, and online training for $299 per person, or an
onsite training for 30 staff for $3500.
The DRA2 administration time ranges from 5-60 minutes per student, depending
on level, with the levels at which first-graders are typically assessed requiring 10-20
minutes of testing time per student. Financial costs include purchase of a testing kit,
which can be shared between multiple teachers, for $423, and 90$ per year for a
classroom subscription to the optional online management system ($4.50 per student
beyond 30 students). Training options include a 90-minute training DVD included with
the test kit, on demand online tutorials, and onsite professional development at an
additional cost.
It would seem that the DRA2 involves more upfront cost for a classroom of
students, but the kit can be used in subsequent years without making additional
purchases. However, use of the online data management incurs an ongoing cost
comparable to Aimsweb subscription. The time required to administer the DRA2 is
significantly longer than Aimsweb, and indeed, despite their face validity among
educators, the time required to administer, score and interpret IRIs has been identified as
a drawback (Paris & Carpenter, 2003, Klingbeil et al., 2015).
Conclusion
Based on developmental reading research and theory, as well as the limited
available empirical evidence on IRIs, it would seem that the DRA2 does not demonstrate
appropriateness, technical adequacy, nor usability as a screening tool in the way that
Glover and Albers (2007) illustrate. At the very least, educators wishing to adopt early
reading screeners as part of RTI systems can consult abundant studies of CBM tools and

52
consider how these tools fit their need and contexts. However, such studies are not
available to inform the use of IRIs for this purpose. Additional investigation that
evaluates the DRA2 in the same manner as early reading CBM is warranted. The current
study seeks to fill gaps in the preceding discussion of first-grade screening tools,
particularly related to the use of IRIs to predict risk of later reading problems.

53
Table 1. Stages of Reading Development (Chall, 1996) Stage Approximate
grade/age Key characteristics Supported by
0 Pre-reading Birth- Age 6
Preschool
• Ability to retell familiar stories using illustrations • Interest in rhythm and rhyme • Recognition of some letters • Understanding of concepts of print (directionality, etc.).
• Picture books read aloud • Retelling of familiar stories • Language play (nursery rhymes, etc.) • Instruction in phonological awareness, letter
names and sounds
1 Initial Reading or Decoding
Ages 6-7 Grades 1-2
• Developing knowledge of letters and sounds • Able to read decodable text and commonly used irregular
words • “Glued to print” as children decode letter by letter
• Direct instruction in phonics, syllable patterns and common irregular words
• Reading decodable text • More advanced books read aloud to child to
develop knowledge of language structures, vocabulary, and comprehension strategies
2
Confirmation, Fluency,
Ungluing from Print
Ages 7-8 Grades 2-3
• Students consolidate knowledge acquired in Stage 1 • Read simple texts with increasing fluency and speed
• Wide reading about familiar content • Analysis of multisyllabic words • Continued development of oral language and
background knowledge
3 Reading for
Learning the New
Ages 9-13 Grades 4-8
• Students have gained sufficient automaticity with decoding to read straightforward texts to learn new information.
• Reading text books and advanced trade books • Instruction in text structures • Development of background knowledge • Vocabulary instruction
4 Multiple Viewpoints
Ages 14—18 High School
• Students have gained the ability to compare and contrast multiple viewpoints
• Instruction in text structure, inferential thinking, specialized vocabulary
• Wide reading of high quality literature and nonfiction texts
5 Construction
and Reconstruction
Ages 18+ College and
beyond
• Literate adults select what to read based on individual purposes.
• Synthesize information gathered from texts to draw their own conclusions and develop new points of view
• Wide reading • Analysis of text structure, style, author’s
perspective • Written response to reading

54
Table 2. Concurrent and Predictive Validity Evidence Provided by Assessment Publishers
Subtest Administration period Criterion
Criterion administration
period n r Study
LNF Fall 1st PSSA Spring 1st 437 .47
Aimsweb user data (Pearson, 2012c) Fall 1st MCA Spring 3rd 75 .50
Fall 1st R-CBM Spring 1st 48 .76
LSF Fall 1st PSSA Spring 1st 435 .33 Aimsweb user data (Pearson, 2012c)
PSF Fall, Winter, Spring 1st MCA Spring 3rd 130-134 .41-.51
Aimsweb user data (Pearson, 2012c) Winter 1st R-CBM Spring 1st 46 .76
NWF Fall 1st R-CBM Spring 1st 46 .72
Aimsweb user data (Pearson, 2012c) Fall, Winter, Spring 1st PSSA Spring 1st 434-438 .44-.51
Fall, Winter, Spring 1st MCA Spring 3rd 130-134 .42-.53
R-CBM
Winter 1st PSSA Spring 3rd ~ 200 .60 Keller-Margulis, Shapiro, & Hintze (2008)
Winter 1st MCA Spring 3rd 1475 .47 Silberglitt & Hintze (2005)
Spring 3rd PSSA Spring 3rd 185 .67 Shapiro, Keller, Lutz, Santoro, & Hintze. (2006)
Spring 3rd MCA Spring 3rd 2126 .71 Silberglitt & Hintze (2005)
DRA2
Grades 1-3 (Comprehension score) GORT 4 concurrent 66 .60 (comprehension)
.65 (fluency)
Publisher study (Pearson, 2011c)
Grades 1-3 (Fluency score) GORT 4 concurrent 66 .62 (comprehension)
.69 (fluency) Grades 1-3
(Comprehension score) DIBELS ORF concurrent 66 .70
Grades 1-3 (Fluency score) DIBELS ORF concurrent 66 .74
Grades 1-3 (Comprehension score)
GRADE Comprehension 5 months later 31 .69
Grades 1-3 (fluency score) DIBELS ORF 5 months later 31 .51
Note: PSSA= Pennsylvania System of School Assessment; MCA= Minnesota Comprehensive Assessment; SAT-10 = Stanford Achievement Test-10th Edition.

55
Table 3. Classification Studies of First-Grade Screening Measures
Study, sample size Benchmark period
Measures Cut Score
Outcome criterion ROC AUC
Sens. Spec.
Goffreda, et al. (2009) n=51
Winter 1st LNF 37 3rd Grade PSSA Reading Proficient
.47 .70 PSF 35 .77 .47
NWF 24 .89 .50 R-CBM 20 .77 .88
Johnson, et al. (2009) n=12,055
Fall 1st PSF 55* 1st grade SAT-10 score <40%
.663 .90 .20 NWF 42* .781 .90 .42
R-CBM 18* .830 .90 .59 Catts, et al. (2009)
n=>17, 000 Winter 1st PSF *
3rd Grade Spring R-CBM .606 .90 .22
NWF * .869 .90 .51 R-CBM * 3rd Grade SAT-10 .784 .90 .41
Clemens et al. (2011) n=138
Fall 1st LNF 40* 1st Grade Spring R-CBM
.849 .90 .64 PSF 50* .728 .90 .20
NWF 23* .835 .90 .59 Riedel (2007)
n=>800 Fall 1st LNF 39
2nd Grade Spring TerraNova
.700 .67 .64 PSF 17 .620 .58 .58
NWF 19 .680 .65 .61 Winter 1st PSF 32 .580 .54 .54
NWF 34 .650 .62 .58 R-CBM 22 .760 .69 .65
Silberglitt & Hintze (2005) n=1549
Spring 1st R-CBM 49 3rd Grade Spring MCA .75 .71
Note: PSSA= Pennsylvania System of School Assessment; MCA= Minnesota Comprehensive Assessment; SAT-10 = Stanford Achievement Test-10th Edition.

56
Not proficient
according to outcome measure Proficient
according to outcome measure
At risk according to screener
True Positive (TP)
False Positive (FP)
Positive predictive value (PPV) TP/(TP+FP)
Not at risk according to
screener
False Negative (FN)
True Negative (TN)
Negative predictive value (NPV) TN/(FN+TN)
Sensitivity
TP/(TP+FN)
Specificity TN/(FP+TP)
Hit Rate (TP+TN)/(TP+FP+FN+TN)
Figure 1. Classification Accuracy Indices

57
CHAPTER 3
METHODS
General Design
This study examines the appropriateness, usability, and technical adequacy of the
DRA2 when used as a screening tool in first-grade, in comparison to Aimsweb CBM
measures. In order to investigate these properties of each assessment, and to ultimately
make a judgment regarding the validity of inferences made about first-grade readers
based on resulting scores, a mixed method approach was employed. A recent
investigation revealed that while school psychologists naturally use quantitative and
qualitative data to guide decisions, mixed methods studies are underrepresented in the
literature (Powell, Mihalas, Onwuegbuzie, Suldo, & Daley, 2008). The authors further
contend that mixed methods designs provide richer data than monomethod approaches,
thus supporting a better overall understanding of research problems. In the case of this
study, while pre-existing quantitative data was analyzed to evaluate the predictive
validity of screeners, it was crucial to also investigate how the school district actually
uses the scores in the context of their universal screening practices.
Mixed methods research designs are typically classified based on four criteria,
including 1) implementation of data collection, 2) priority given to quantitative and
qualitative approaches, 3) stage at which integration of data takes place, and 4)
theoretical perspective of the researcher (Creswell, Plano Clark, Gutmann, Hanson,
2003). In the current study, quantitative data had already been collected by the
participating school district as part of their existing accountability practices. Qualitative
data, in the form of an educator questionnaire, was collected concurrently with analysis

58
of quantitative data, as each type of data addressed separate questions and did not need to
be analyzed in a particular order. As a study of predictive validity, it might be argued that
priority was given to the quantitative data, however since a judgment about interpretation
of that data cannot be made without understanding the purposes for which educators
actually use it, qualitative data was also emphasized. Data integration took place only
after each set of research questions was explored separately. In terms of theoretical
perspective, this researcher took a deductive approach, meaning that hypotheses were
developed based on existing theory and previous empirical research. The study was
designed to test the validity of these hypotheses in the context of a specific setting. The
first set of research questions focused on the content and format of each assessment, as
well as the ways in which one school district used scores for educational decision-
making. These questions were addressed through a qualitative approach. The following
three research questions examined the technical adequacy of the screeners in question,
and were answered through quantitative inquiry. Tashakkori & Creswell (2007)
recommend that in mixed methods studies, following the qualitative and quantitative
questions, a question explicitly integrating these questions be posed. Consistent with this
guidance, data from both approaches were used to address the seventh research question.
Setting and Participants
Existing longitudinal reading assessment data was obtained from a suburban
school district in Western Massachusetts. The data included assessment scores from 269
students from two cohorts who entered first-grade in the fall of 2013 and 2014 and
completed the third-grade outcome measure in the spring of 2016 and 2017. The district
included four elementary schools, all of which are represented in the sample. Within the

59
total sample of students, 52% of students were male. Forty-five percent (45%) of students
identified as white, 21% Hispanic, 14% Asian, 9% Black and 10% Multiracial. During
their kindergarten through third-grade years, 47% of students were eligible for the free or
reduced-price lunch program for at least one school year, 19% of students received
special education services during at least one school year, and 20% were eligible for
English language learner services during at least one school year. While some students
who had been identified as ELL in first-grade were no longer found eligible for ELL
services in third-grade, for the purposes of analyses, these students were considered ELL.
This decision was made based on the theory that children need 5-7 years, on average, to
acquire the language proficiency required to complete grade level academic work in a
second language (Cummins, 1979). Complete demographic characteristics by grade
cohort are presented in Table 4.
The educator questionnaire was distributed to all educators within the school
district who make educational decisions about first-graders based on reading assessment
data. Twelve (12) teachers completed the questionnaire. Respondents included 2
classroom teachers, 3 special education teachers, 2 reading specialists, 4 reading
intervention teachers, and one district-wide instructional coach.
Measures
Quantitative Measures
Aimsweb
Consistent with the screening timeline recommended by Aimsweb (Pearson,
2012a), the early literacy and R-CBM subtests were administered to students in
60
September, January and May of their first-grade year. The fall and winter screening data
were used in the present study.
Aimsweb Reading-Curriculum Based Measurement
The Aimsweb R-CBM measure was administered in a manner consistent with
other reading CBM probes. Students were required to read three standardized grade level
passages aloud, with the median words read correctly per minute recorded as the score.
The publisher reports winter first-grade alternate form reliability of .95, and interrater
reliability of .97 for the median of three screening scores (Pearson, 2012c). Investigations
of predictive validity using first-grade R-CBM and third-grade standardized tests have
found correlations of .60 (Keller-Margulis, Shapiro, & Hintze, 2008), and .47 (Silberglitt
& Hintze, 2005). In general, research supports the use of R-CBM as an indicator of
broader reading skills (Fuchs et al., 2001) and as a screening tool (Stage & Jacobsen,
2001; Hintze & Silberglitt, 2005).
Aimsweb Letter Naming Fluency
During administration of the Aimsweb LNF measure, students were presented
with a page of upper and lower-case letters and asked to name as many letters as possible
in one minute. The score was the number of letters correctly named in one minute. Based
on a study conducted with 75 students in the spring of kindergarten (Elliott et al., 2001),
the publisher reports retest reliability, alternate-form reliability, and interscorer
agreement ranging from .80-.94 (Pearson, 2012c). The correlation between a fall first-
grade administration of LNF and the third-grade Minnesota state assessment was .50
(Pearson, 2012c)

61
Aimsweb Letter Sound Fluency
On the Aimsweb LSF measure, students were similarly presented with a page of
randomly organized upper and lowercase letters, and were required to point to each letter
and provide the letter sound. The resulting score was the number of sounds correctly
identified in one minute. Reliability estimates are .82-.83 (Pearson, 2012c). Previous
research has not investigated the predictive validity of this measure when used during the
fall of first-grade. However, spring of kindergarten administrations correlated with third-
grade Illinois achievement test with coefficient of .52 (Pearson, 2012c).
Aimsweb Phoneme Segmentation Fluency
The Aimsweb PSF measure requires students to say the phonemes in orally
presented words for one minute, with the number of correct phonemes recorded as a
score. Phonological awareness is an important readiness skill that is prerequisite to
decoding, and similar PSF measures have demonstrated evidence of reliability and
validity for use in educational decision-making (Kaminski & Good, 1998; Good et al.,
2001). Aimsweb reports retest reliability, alternate-form reliability, and interscorer
agreement ranging from .84-.87 for PSF when administered in the spring of kindergarten.
Correlations between first-grade administrations of PSF and a third-grade criterion test
ranged from .41-.51 (Pearson, 2012c).
Aimsweb Nonsense Word Fluency
The NWF measure requires students to say the sounds of visually presented
pseudowords for one minute, with the number of correct sounds recorded as a score. This
assessment captures the emerging decoding skill of young readers, and like PSF, has
demonstrated utility for identifying risk and informing instruction (Good et al.,

62
2001). Only alternate form reliability is reported by the publisher for this measure (.74
between fall and winter administrations, .78 between winter and spring administrations).
Aimsweb reports correlations of .42-.53 between NWF administered in during first-grade
screening periods and a third-grade standardized test (Pearson, 2012c).
Aimsweb Composite Score
In order to create a score that encompassed all of the foundational literacy skills
assessed by the Aimsweb measures, composite scores were calculated for both the fall
and winter Aimsweb administrations. Composite scores were created by calculating the
sum of all individual measures administered within a given benchmarking period.
Although the edition of Aimsweb used in this study does not report composite scores, this
calculation method is consistent with the manner in which first-grade composite scores
are calculated for DIBELS Next, and Aimsweb Plus, two similar early literacy CBM
packages (Dynamic Measurement Group, 2010; Pearson, 2015).
Developmental Reading Assessment-Second Edition
The DRA2 (Pearson, 2011a) is an informal reading inventory used to assess the
reading proficiency of children in kindergarten through eighth grade. According to the
publisher, it measures three “critical components” of reading: reading engagement, oral
reading fluency, and comprehension. The assessment is administered individually;
students read from and respond to a set of illustrated leveled texts ranging from level A to
level 80, to determine which text is at their instructional level. Administration time
ranges from 5-15 minutes for emergent readers to up to 60 minutes for extending (levels
28+) readers. A student’s score on the DRA2 is his or her “independent reading level,” or
the level at which the student can “engage with the text independently.” Thus, the DRA2

63
elicits categorical scores in the form of the student’s reading level. The DRA2 technical
manual reports high test retest reliability estimates of .97-.99 for first-grade. Overall
interrater reliability is reported as .66 for fluency, and .72 for comprehension, with higher
reliability between “expert” test administrators. Internal consistency reliability for oral
reading fluency ranges from .54 to .85 depending on level, and from .58 to .85 for
comprehension. The technical manual provides extensive evidence for face validity
among teachers, and concurrent validity is reported for the Gray’s Oral Reading Test-4th
Edition, DIBELS ORF, and Gates MacGinitie Reading Test-4th Edition, with correlations
ranging from .60 and .76 depending on grade level and criterion measure. Predictive
validity between the DRA2 and the Group Reading Assessment and Diagnostic
Evaluation (GRADE) administered five months later is .69 for grades one through three
(comprehension), and between the DRA2 and DIBELS ORF .51 for first through third-
grades (fluency) (Pearson, 2011c).
Massachusetts Comprehensive Assessment System
The outcome measure used in this study was the third-grade scaled score on the
English Language Arts MCAS, Massachusetts’ criterion referenced test of student
achievement and school accountability for grades 3-10 (Massachusetts Department of
Elementary and Secondary Education, 2015). The test is based on standards of the
Massachusetts Curriculum Framework for English Language Arts and Literacy, aligned
to the Common Core State Standards. The MCAS is an untimed, group administered test
comprised of reading passages followed by multiple choice and short open response
items. It is administered in two sessions in early March. Beginning with the spring 2017
administration of the Massachusetts state achievement test, the “Next Generation” MCAS

64
was introduced, replacing the nearly 20-year-old “Legacy” MCAS. According to the
Massachusetts Department of Elementary and Secondary Education, the new test
“focuses on students’ critical thinking abilities, application of knowledge, and ability to
make connections between reading and writing” (Massachusetts Department of
Elementary and Secondary Education, 2017b). The new assessment was reported to be
generally “more rigorous” than its predecessor in terms of expectations for proficiency.
In the present study, student Cohort 1 was assessed with the Legacy MCAS in the
spring of 2016. Student scores on this measure are reported according to four
achievement levels: Advanced, Proficient, Needs Improvement, and Warning. Student
Cohort 2 was assessed with the Next Generation MCAS in the spring of 2017.
Achievement levels for the new assessment are as follows: Not Meeting Expectations,
Partially Meeting Expectations, Meeting Expectations, and Exceeding Expectations. For
the purposes of analyses in this study, student performance at the higher two levels of
each assessment was considered to be a passing score.
Qualitative Data Collection
Content Analysis
The content and format of each first-grade assessment tool were analyzed in order
to understand the constructs purportedly measured by each tool, as well as details of
administration and technical evidence. Content analysis refers to, “a research technique
for making replicable and valid inferences from texts (or other meaningful matter) to the
contexts of their use” (Krippendorff, 2013, p. 24). In a directed approach to content
analysis (Hsieh & Shannon, 2005), categories that informed the analyses are derived
primarily from existing theory and research, rather than from the texts themselves. In this

65
case, the Glover and Albers (2007) heuristic was used to classify the characteristics of
effective screening tools. Documents examined included student materials, test
administrator instructions for each measure, and relevant portions of the technical manual
for each assessment.
Educator Questionnaire
Qualitative data collection practices emphasize collecting data from a relatively
small number of participants who are closely connected with the research questions. In
this study, a mixed questionnaire was employed to gather input from first-grade educators
who use the reading assessment data being investigated to make educational decisions
about their students. A mixed questionnaire is a self-report data collection instrument that
includes a combination of closed-ended and open-ended items (Johnson & Turner, 2003).
Development of the questionnaire was again guided by the recommendations of Glover
and Albers (2007), as well as the questions put forth by Coyne and Harn (2006) in their
discussion of data-based decision-making across the four distinct purposes of assessment.
Using a Likert scale, participants indicated the degree to which they agreed with
statements derived from each of these sources. Open ended comment boxes were made
available for teachers who wished to elaborate on their responses and provide additional
qualitative information. Additional open-ended questions were employed to investigate
teachers’ perceived purposes for each assessment. The questionnaire was created and
distributed online using Qualtrics (https://www.qualtrics.com). Before dissemination to
study participants, the questionnaire was piloted with first-grade teachers not in the
participating district, as well as school psychology graduate students who were familiar
with early reading instruction and assessment. Revisions were made to improve the

66
clarity of questions and minimize response time for participants. The educator
questionnaire is presented in Appendix C.
Procedures
The content analyses were conducted by the primary investigator. After
examination of the test materials, administrator guidelines, and the technical manuals for
each assessment, evidence related to the pre-determined categories was examined to
facilitate a side by side comparison of each tool.
After being piloted, the final questionnaire was disseminated to each of the four
elementary school principals in the participating district, with a request that principals
forward the recruitment email to any teacher involved in decisions related to first-grade
reading assessments, including first-grade classroom teachers, reading specialists, special
educators, and administrators. The questionnaire was available to teachers for two weeks.
Twelve (12) responses were obtained.
The database of student-level screening data used for the quantitative analyses in
this study was collected by the participating school district as part of their annual
assessment plan. Each of the Aimsweb measures were individually administered to first-
graders by building-based reading intervention staff according to screening timelines
recommended by the publisher (Pearson, 2012a), with three annual benchmarking periods
occurring in September, January, and May. The DRA2 was administered to all first-
graders in the fall and winter by their classroom teachers. The MCAS was group
administered to third-graders in March, according to state guidelines. Scores on each of
the measures were provided to the researcher in spreadsheet form. Because the data was
collected by the school, precise information regarding assessment integrity is not

67
available. However, the data represents information that is typical of school practice and
thus reflects data used to make educational decisions.
Before sharing the reading assessment data with the researcher, district
information technologies (IT) staff created a unique identifying number for each student
and removed all names and local and state ID numbers. Data from individual
spreadsheets obtained from the school district was merged using unique identifying
numbers. Due to normal attrition, some observations were missing either the first-grade
predictor results, or the third-grade outcome results. Listwise deletion was used to
eliminate cases for which no score was available on the outcome measure. Cases were
retained if at least one score among the predictor variables was available.
Data Analysis
The first three research questions were addressed through content review of the
test materials, and the educator questionnaire. Evidence of each set of test materials’
alignment to the criteria for appropriateness, technical adequacy, and usability was
reviewed in the previous chapter. The questionnaire provided further data regarding
teachers’ perceptions of how each assessment meets these criteria, as well as data related
to teachers’ perception of the purpose of each assessment. Two sample t-tests were
conducted to determine whether teachers’ differential agreement with statements about
IRIs and early literacy were significant in this small sample, and open ended responses
were examined as well. Data from the content review and questionnaire were synthesized
to address research questions related to appropriateness of intended use and usability.
All quantitative analyses were conducted using Stata 15 statistical software.
Before beginning the analyses, descriptive statistics for each of the reading assessment

68
variables were generated, and correlations between them examined. To answer the fourth
research question, after testing for satisfaction of assumptions, simple linear regression
analyses were used to examine the amount of variance in third-grade MCAS scores
accounted for by each predictor. Because the MCAS scale, as well as proficiency
standards changed in 2017, regression analyses were conducted separately for each
cohort.
To answer the fifth research question related to classification accuracy, MCAS
scores were dichotomized into a pass/fail variable, and logistic regression was conducted
using publisher cutpoints for risk in order to obtain information about the sensitivity,
specificity, PPV, NPV, and overall classification accuracy of each screening tool using
recommended cut points for risk. Based on the Aimsweb default cutscores, students were
considered to be at risk if their fall of first-grade LNF scores were <40, LSF scores were
<25, PSF scores were <35 and NWF scores were <27. For the winter first-grade
benchmarking period, students were considered at risk if Aimsweb R-CBM scores were
<30, PSF scores were <45, and NWF scores were <45 (Pearson, 2011b). Students were
considered to be at risk if their fall first-grade DRA2 level was < 3, and if mid first-grade
DRA2 level was <8 (Pearson, 2011a). Further, receiver operating characteristics (ROC)
curves (Swets, 1996) were generated, plotting the sensitivity against the false positive
rate (1-specificitiy) for each possible cut point. ROC analysis provides the area under the
curve (AUC), a statistic useful in evaluating the overall accuracy of a diagnostic test with
an AUC greater than .90 indicating excellent classification; .80 to .90, good; .70 to .80,
fair; and below .70, poor classification (Compton et al., 2006). Because Aimsweb does
not recommend cut points for composite scores, they were not considered in this analysis,

69
although AUC values for the composite scores were calculated based on overall
classification.
Again, the cut score analyses were conducted separately for each cohort because
of the variation in the MCAS test between administration years. However, in order to
examine classification accuracy of first-grade measures using the entire sample of
participants, a final classification analysis was conducted using third-grade R-CBM as an
outcome. While the Aimsweb spring third-grade R-CBM cut score is 119, this cut score
was not the most sensitive predictor of MCAS proficiency for either cohort. A cut score
of 131 resulted in the most accurate prediction of an MCAS passing score across cohorts,
with overall correct classification of 76.4%, sensitivity of 84.0%, and specificity of
68.2%. Therefore, for this analysis, a third-grade R-CBM score of less than 131 was used
as an indicator of reading failure.
Next, to ascertain more sensitive first-grade screening cut scores for this
population of participants, ROC coordinates obtained in the previous analyses were used
to identify the cut scores for each individual first-grade measure that correspond with a
sensitivity of 1) at least .80, and 2) at least .90. The resulting conditional probabilities
were recalculated using the new cut scores.
To address the sixth research question related to classification accuracy for
specific subgroups, logistic regression and ROC curves were again employed to calculate
the sensitivity, specificity, and AUC for ELL students and FRL students. Differences
between these statistics and those for non-group members were tested for significance.
Results of the analyses described above are reported in the following chapter. In
Chapter 5, implications of these results are discussed, and data from all sources are

70
integrated to explore the final broad research question, with the qualitative inquiry
providing a context for understanding the student assessment data as it is used in one
school district.

71
Table 4. Demographic Information
Group Cohort 1 Cohort 2
n 135 134
Male 56.3% 47.0%
Female 43.7% 53.0%
American Indian or Alaska
Native 0.7% 0.8%
Asian 14.8% 12.7%
Black 14.1% 4.5%
Hispanic 17.8% 23.9%
Multiracial 9.6% 10.5%
White 43.0% 47.8%
ELL 17.0% 22.3%
Not ELL 83.0% 77.6%
IEP 23.0% 15.7%
No IEP 77.0% 84.3%
Free Reduced Lunch
Eligible 49.6% 44.8%
Not Eligible 50.3% 55.2%

72
CHAPTER 4
RESULTS
The purpose of this study was to investigate the appropriateness, technical
adequacy, and usability of the DRA2 in relation to the Aimsweb TEL. Both assessments
are frequently used for various purposes in first-grade classrooms, and are commonly
used as screening tools to inform the need for targeted or intensive intervention for
specific students at risk of later reading difficulties.
Appropriateness for Intended Use and Usability
As a first step, the content of each measure was examined for evidence of
usability and appropriateness, especially in terms of relevant constructs aligned with first-
grade skills predictive of later reading success. Discussion of this evidence was presented
previously in Chapter 2.
The research questions related to appropriateness and usability were also
addressed through an educator questionnaire (Appendix C). A group of twelve teachers,
comprised of two classroom teachers, three special educators, six reading specialists or
reading intervention teachers, and one instructional coach completed the survey.
Respondents had an average of 19.5 years of teaching experience, and an average of 9.75
years working in the participating school district. One hundred percent (100%) of
respondents had personally administered IRIs to first-graders, while 82% had
administered early literacy CBM. First, participants were asked what source of
information they rely on to determine which students are at-risk for reading failure.
Seventy five percent of respondents said they very much rely on their own professional
judgement, with 25% of respondents saying they do so to a lesser degree, endorsing

73
somewhat on the survey. Participants’ average endorsement of IRIs and the TEL was the
same (2.5) with one person saying they only slightly use the results of IRIs, and the
respondents all positively endorsing the use of the CBM measures with 50% saying they
very much rely on them and 50% saying they somewhat rely on them. These teachers of
first-graders endorsed the oral reading fluency measure to a lesser degree with only 16%
saying they rely on them very much. The least relied upon measures for determining later
risk were the assessments from specific reading curricula.
Respondents were then asked to identify the information they perceived was
provided by both IRIs and early literacy CBM measures. In response to open ended
questions, teachers indicated that IRIs were primarily used to inform diagnostic
decisions, as evidenced by responses related to determining instructional reading level
and analysis of reading behaviors to determine next steps for instruction. Some teachers
also shared responses consistent with the purposes of screening, progress monitoring, and
measuring student outcomes. However, when asked to indicate agreement to more
specific statements regarding IRIs alignment with each purpose of assessment, screening
was the most subscribed to purpose, followed by progress monitoring, measuring student
outcomes, and last, diagnosis for instructional planning.
For early literacy CBM, open ended comments indicated that teachers use results
for screening purposes in addition to diagnostic purposes, and many respondents
suggested that beyond their own classrooms, the school and or district used results for
screening decisions and to measure student outcomes. Similar to the results observed
with IRIs, when asked to indicate agreement with each purpose of assessment based on
more specific survey statements, screening was the most subscribed to purpose, with

74
diagnosis the least. Examination of the specific survey statements derived from Coyne
and Harn’s (2006) questions related to the four distinct purposes of assessment, revealed
that there were no statistical differences between how the two assessments were endorsed
for each assessment purpose.
In addition to the questions about how teachers use the first-grade reading
assessments to make decisions, participants were also asked to indicate their agreement
with several statements about the adequacy of each test aligned to Glover and Albers
(2007) considerations for universal screeners (Table 5). In general, respondents rated IRIs
and CBM similarly when presented with the six statements regarding whether the tests
are appropriate for their intended uses, although some interesting differences emerged
when the results were considered qualitatively. Teachers were slightly more likely to
endorse CBM measures for being administered with appropriate timing and frequency,
having research supporting their use, and measuring relevant skills predictive of later
success, although there were no statistical differences in these response rates.
In terms of technical adequacy, although more teachers rated the CBM measures
as more reliable across forms, time and raters than they did for IRIs, only their rating for
reliability across raters was significantly different (p = .024). The teachers rated both
measures as accurately identifying the students who are at-risk, however they were
significantly more likely to say that the CBM assessments falsely identified students as
at-risk when in fact they were not (p = .008).
No statistical differences were observed in participants’ usability ratings between
the two assessments. However, qualitative examination of the responses suggests that
teachers endorsed the IRIs as slightly more usable than they did the CBM measures.

75
More respondents said that teachers, parents and students are more likely to appreciate
the benefits of the IRI results than the CBM results. They were also more likely to say
that IRIs are helpful for guiding instruction and result in better early literacy outcomes
than do the CBM measures. However, respondents indicated that there were more
resources available to administer, manage, and interpret the CBM measures.
With respect to the characteristics of appropriateness, technical adequacy and
usability, some interesting correlations were observed in this small sample (see Table 5).
It is notable that all significant correlations were negative relationships, meaning that
those who agreed or strongly agreed with a statement for one assessment, tended to
disagree with the same statement for the other assessment. This was observed when
respondents were asked whether the constructs measured by each tool were relevant and
predictive, with those rating IRIs as strong on this criteria rating early literacy CBM as
weak, and vice versa. Additionally, participants who indicated that there were not
enough resources allocated to one assessment were significant more likely to say there
were enough for the other assessment. These results provide evidence that teachers may
have a preferred first grade reading assessment type based on the theoretical perspective
on reading development that they bring to the classroom, favoring the use of one type of
data over another when making screening decisions. However, it was notable that overall,
respondents were more likely to rely on their professional judgement than the results of
either IRIs or CBM, especially during the winter benchmark period. Complete results of
the educator questionnaire are presented in Appendix D.

76
Predictive Validity and Classification Accuracy
The second set of research questions dealt with the technical adequacy of each
screening measure based on existing data from the participating school district.
Descriptive statistics for each cohort of students are presented in Tables 6 and 7. In the
entire sample, 48.1% of students did not meet standards for proficiency on the MCAS,
meaning that according to this measure, the base rate for reading failure in the overall
sample was 48.1%. Approximately forty seven percent (46.7%) of students in Cohort 1
failed the MCAS, and 49.6% of students in Cohort 2 failed the MCAS. Most variables
were not normally distributed. According to the Stata test of skewness and kurtosis,
which is based on the test as described by D’Agostino, Belanger, and D’Agostino (1990),
only the fall LNF, winter PSF, and MCAS scores for both cohorts were normally
distributed. Histograms of all variables are presented in Appendix E.
Correlations and Predictive Validity
Tables 8 and 9 display the correlations of each predictor variable and third-grade
outcomes. For Cohort 1, all correlations were significant at the .05 level, with the
exception of the winter PSF measure, which was not significantly correlated with fall
LNF, LSF, NWF or DRA2 or winter R-CBM. Likewise, for Cohort 2, all correlations
were significant, with the exception of the winter PSF measure, which was not
significantly correlated with fall or winter NWF, or fall or winter DRA2. With the
exception of the winter PSF measure, correlations between predictor variables and
outcomes ranged from moderate to strong (r=.40 to r=.88). Unsurprisingly, the magnitude
of correlations was strongest between the Aimsweb composite scores and their
components, namely NWF in the fall, and NWF and R-CBM in the winter. DRA2 and R-
77
CBM administered concurrently were strongly correlated (r=.82 for Cohort 1 and r=.88
for Cohort 2) These predictors, as well as the winter Aimsweb composite were also those
most highly correlated with the third-grade outcomes. Scatterplots (see Appendix F) were
generated and visually examined for linearity.
Simple linear regression analyses were used to examine the amount of variance in
MCAS scaled scores accounted for by each predictor (Tables 10 and 11). For each
cohort, each of the first-grade measures was a significant predictor of third-grade MCAS
scores, yet differences emerged between the two cohorts. The first-grade predictors
accounted for more variance in third-grade MCAS scores in Cohort 1 than in Cohort 2.
For Cohort 1, the fall Aimsweb composite accounted for 42% of the variance in third-
grade MCAS scores, whereas the fall DRA2 only accounted for 30% of the variance.
This is evidence that the constructs measured in the TEL assessments may be more
predictive of later reading achievement than those measured in the DRA2 during the fall
of first-grade. However, by winter, the Aimsweb composite and the DRA2 accounted for
similar variance in the third-grade MCAS score, .42 and .43 respectively. These
relationships were greater in magnitude but similar to the .38 of the variance accounted
for in the Third-Grade MCAS by the first-grade winter R-CBM scores. The results might
suggest that the fall Aimsweb measures were more predictive of later reading
achievement than the fall DRA2, and that the measures are equally predictive at the
developmental timepoint of the winter benchmarking period. However, these same results
were not observed for Cohort 2.
For Cohort 2, the Aimsweb composite and DRA2 scores that were gathered in the
fall accounted for only 24% and 22% of third-grade MCAS variance, respectively.

78
Therefore, both fall measures had similar predictive relationships. Although the
magnitude of the relationships were not as large as observed with Cohort 1, the R2 values
from the winter scores of Cohort 2 were greater in magnitude from the fall data, and
converged similarly, where R2 was .30 for both R-CBM the Aimsweb Composite, and .29
for the DRA2.
Classification Accuracy
Classification Accuracy for Predicting Third-Grade MCAS
Classification accuracy statistics for each predictor, using MCAS proficiency as
the outcome, are presented in Table 12 and Table 13. Based on the criteria suggested by
Compton et al. (2006), where an AUC of .90 would indicate excellent classification and
less than .70 would indicate poor classification, AUC values for Cohort 1 ranged from
poor (fall and winter PSF), to good (fall NWF, Aimsweb Composite and DRA2, winter
R-CBM, Aimsweb Composite and DRA2).
For Cohort 1, the fall and winter DRA2 scores were least likely to accurately
identify students likely to experience later reading difficulties, with sensitivity estimates
of .32 and .48 for fall and winter respectively. Because sensitivity and specificity are
inversely related, the specificity estimates were very high for the DRA2 (fall = 95%
accurate and winter = 93% accurate) indicating that the DRA2 accurately identifies which
students are on track for reading success.
In contrast, fall LSF and winter PSF were more apt to identify students likely to
struggle, with 83% accurately identified using LSF and 80% identified using PSF.
However, PSF was more likely to identify students as poor readers who were not, with
specificity levels ranging from lows of .35 and .30 for fall and winter PSF. Winter R-

79
CBM scores resulted in the highest overall levels of both sensitivity and specificity, with
approximately 72% of struggling readers and 80% of strong readers accurately identified.
In general, AUC values for Cohort 2 were lower, with fall LNF, fall DRA2, fall
Aimsweb composite, winter R-CBM, winter Aimsweb composite and winter DRA2
attaining only fair levels of classification accuracy. No predictors reached .80 AUC for
Cohort 2. As with the AUC statistic, sensitivity and specificity levels, and in turn overall
prediction, were generally lower for Cohort 2 than Cohort 1, yet general trends were
consistent. Namely, PSF resulted in higher sensitivity but lower specificity, while DRA2
sacrificed sensitivity for high levels of specificity. No predictor reached the .90
sensitivity level recommended for informing high stakes decisions.
Classification Accuracy for Predicting Third-Grade Oral Reading Rate
Cohorts 1 and 2 were combined for the subsequent analyses, in which third-grade
spring R-CBM scores were used as the outcome measure. Rather than use the Aimsweb
spring third-grade default cut score of 119, further analysis was conducted to determine
the cut score with the highest overall classification accuracy when predicting proficiency
on the MCAS for both cohorts, which was determined to be a score of 131 words read
correctly. This score on the Spring R-CBM measure correctly classified 76.4% of
students with respect to MCAS proficiency.
Using the first-grade screening data to predict third-grade oral reading fluency
above 131 WCPM, the AUC values were “good” for fall LNF (.805), the fall Aimsweb
composite score (.807), winter R-CBM (.848), winter composite score (.840) and winter
DRA2 (.815). AUC values were in the “fair” range for fall LSF (.734), fall NWF (.786),
fall DRA2 (.776) and winter NWF (.779). AUC values were “poor” for both the fall and

80
winter administrations of the PSF measure. It is notable that for the ROC curve analysis,
the use of an Aimsweb composite score to predict third-grade R-CBM scores did not
result in AUC values that were better than those generated based on their most predictive
component subtests.
Similarly to when MCAS was used as the outcome, PSF resulted in low levels of
specificity (39.6% for fall, and 37.5% for winter). Overall correct classification of later
reading risk using PSF as a screener was only slightly above chance in both the fall and
winter. The highest overall classification accuracy was demonstrated by LNF in the fall
(sensitivity = 67%, specificity = 84.6%), and by R-CBM in the winter (sensitivity =
75.0%, specificity = 78.6%), with each measure correctly classifying 77.1% of students.
The winter DRA2 also resulted in high overall classification accuracy, correctly
classifying 74.4% of students, yet sensitivity (50%) was compromised at the expense of
specificity (92.4%), indicating students who were at-risk for later reading problems had a
50% chance of being accurately identified using the DRA2. The fall DRA2 resulted in
even an even lower level of sensitivity (35.8%). Complete results of this analysis are
presented in Table 14.
Using the spring of third-grade R-CBM threshold of 131 words per minute as an
outcome, ROC curves were used to obtain alternative cut scores for the overall sample.
The sensitivity and specificity of publisher recommended cut scores, along with
alternative cut scores resulting in 1) greater than 80% sensitivity and 2) greater than 90%
sensitivity are reported in Table 15. For all predictor variables, cut scores needed to be
increased, sometimes dramatically, in order to achieve acceptable levels of sensitivity.

81
However, in doing so, specificity was compromised and, in most cases, overall
classification accuracy was reduced by increasing the cut scores.
Classification Accuracy for Subgroups
To examine the differential predictive validity of the first-grade screening tools
with respect to ELL and FRL subgroups, as a first step, means and standard deviations
for each measure were disaggregated according to subgroups. This information is
presented in Table 16. Two sample t-tests were conducted to compare the means for each
measure between members and non-members of the ELL and FRL subgroups. The
Aimsweb composite scores were not included in these analyses, as recommended
cutscores were not provided by the publisher. Students in both subgroups performed
significantly worse than their peer group with the exception of ELL students on the
winter NWF measure (p=.09). Among ELL students, 81.1% failed MCAS (73.9% in
Cohort 1and 86.7% in Cohort 2). Among students receiving FRL, 71.4% did not reach
proficiency according to MCAS (64.2% in Cohort 1 and 79.7% in Cohort 2).
Publisher recommended cut scores for each predictor variable were used to
predict third-grade R-CBM scores of 131 or greater, consistent with the previous
analyses. Results of these analyses are presented in Table 17 for ELL students and Table
18 for FRL students. The AUC, sensitivity, specificity, PPV and NPV between subgroup
members and nonmembers were then compared using a two proportions test.
For the ELL subgroup, while the differences between AUC and overall
classification accuracy were not significantly different from those of non-ELL students,
significant differences in sensitivity were observed for fall LNF, fall PSF, and fall and
winter DRA2, with these measures leading to higher sensitivity among the ELL

82
population than among the non-ELL population. Therefore, ELL students who were at
later risk for reading problems were more accurately identified using these measures than
non-ELL students. Still, using the fall DRA2 only 56% of ELL students who failed to
meet a proficient reading rate were identified (in comparison, only 25% of at risk English
speaking students were identified). Specificity was also significantly different for fall
LNF, fall LSF, fall and winter PSF, and fall and winter DRA2. Specificity was lower for
the ELL group. With the exception of the DRA2 (both fall and winter administrations),
PPV was higher for ELL students than proficient English speakers, and for all predictors
NPV was lower for ELL students.
Overall correct classification was significantly lower for the FRL subgroup, than
for the non FRL group for fall LNF and fall and winter DRA2, and significantly higher
than the non FRL group for fall PSF. Again, more differences between the predictive
validity of each measure for different subgroups was observed upon closer examination
of sensitivity and specificity. Sensitivity was significantly higher for FRL students when
fall LSF, PSF and NWF, and fall and winter DRA2 were used as predictors for third-
grade R-CBM. Specificity was lower for FRL students for all predictors, with the
exception of R-CBM (p=.06). Similar to the ELL subgroup, for almost all predictors PPV
was higher for FRL students (winter DRA2 excluded with p=.09), and NPV was lower
for all predictors.
As will be discussed further in Chapter 5, these results suggest that the predictive
validity of the Aimsweb TEL and the DRA2 are not consistent across subgroups. In many
cases, cut scores would need to be lowered for ELL and FRL students in order to achieve
comparable levels of sensitivity and minimize false negatives. As will be discussed

83
further in the following chapter, teams using these data to make decisions related to early
reading intervention allocations should consider disaggregated screening data so that
members of subgroups have equal access to interventions.
This study’s final research question seeks to form an overall judgement regarding
the use of the DRA2 as compared to the Aimsweb TEL for the purpose of screening in
first-grade tiered reading systems. In chapter 5, following discussion of findings, this
broad question will be addressed.

84
Table 5. Paired Samples Test of Respondents’ Ratings of Appropriateness, Technical Adequacy, and Usability Characteristics IRIs CBM Paired Sample
Correlation Paired t-test
N M SD M SD r p t df p Timing and frequency is appropriate 10 2.50 1.08 3.00 0.67 -0.31 0.386 -1.10 9 0.299
Constructs measured are relevant 10 2.50 1.08 2.90 0.74 -0.63 0.052 -0.77 9 0.462 Format and content have been validated by research 7 2.71 0.95 3.00 0.82 0.43 0.337 -0.80 6 0.457
Contextually and developmentally appropriate 11 2.36 1.21 2.27 1.27 0.19 0.577 0.19 10 0.852 Measures skills indicative of later reading success 11 2.55 0.93 2.73 1.01 -0.57 0.068 -0.35 10 0.733
Format and items are appropriate 11 2.55 1.04 2.45 1.13 -0.15 0.664 0.18 10 0.858 Alternate forms lead to comparable results 6 2.67 1.03 3.00 0.89 0.65 0.163 -1.00 5 0.363
Measurement is consistent over time 10 2.40 1.08 2.70 1.06 0.41 0.240 -0.82 9 0.434 Scoring consistent across scorers 10 1.70 0.95 2.80 0.42 -0.72 0.018 -2.70 9 0.024
Correctly identifies most students at risk 10 2.50 0.85 2.40 0.84 0.00 1.000 0.26 9 0.798 Does not falsely identify students not at risk 11 2.36 1.03 1.36 0.81 0.43 0.191 3.32 10 0.008
Identification outcomes relevant to service delivery 9 3.11 0.78 2.78 0.83 -0.34 0.369 0.76 8 0.471 Costs associated with the assessment are reasonable 6 2.17 0.75 2.83 1.17 -0.42 0.411 -1.00 5 0.363
Time commitment is reasonable 11 2.18 1.17 2.36 1.57 0.07 0.839 -0.32 10 0.756 School personnel are able to administer 11 2.73 0.79 2.82 1.08 0.53 0.097 -0.32 10 0.756
Teachers appreciate the benefits 9 2.56 1.24 1.89 1.27 0.52 0.149 1.63 8 0.141 Parents appreciate the benefits 8 2.13 1.13 1.50 0.93 0.48 0.229 1.67 7 0.140
Students appreciate the benefits 8 1.75 1.17 0.88 0.64 0.34 0.418 2.20 7 0.064 Resources available to collect/manage/interpret data 9 2.56 0.73 3.00 0.50 -0.69 0.040 -1.18 8 0.272
Teachers understand the implications of outcomes 11 2.45 1.04 2.64 0.92 0.40 0.224 -0.56 10 0.588 Parents understand the implications of outcomes 8 1.75 1.04 1.50 0.93 0.60 0.119 0.80 7 0.451
Outcomes guide instruction/intervention 11 3.00 0.78 2.36 1.29 -0.20 0.554 1.30 10 0.224 Improves student outcomes 9 2.56 0.88 2.22 1.39 0.29 0.443 0.71 8 0.500

85
Table 6. Descriptive Statistics (Cohort 1) Variable N M SD Min Max Skewness Kurtosis
Fall LNF 129 45.36 16.42 8 83 -0.19 2.74
Fall LSF 129 21.59 13.11 0 59 0.50 3.08
Fall PSF 128 26.55 12.67 0 56 -0.18 2.23
Fall NWF 128 33.18 30.12 0 173 1.78 7.07
Fall Aimsweb Composite 128 126.98 58.04 10 316 0.55 3.62
Fall DRA2 113 7.11 5.64 1 22 1.02 2.86
Winter PSF 132 34.77 14.77 4 75 0.03 2.65
Winter NWF 133 49.59 29.74 4 156 1.31 4.46
Winter R-CBM 131 50.93 44.82 2 204 1.06 3.36
Winter Aimsweb Composite 130 135.73 74.11 12 363 0.91 3.39
Winter DRA2 107 15.18 9.42 2 38 0.37 1.84
Grade 3 spring R-CBM 132 132.90 50.84 11 230 -0.47 2.76
Grade 3 MCAS 135 241.10 14.57 206 270 -0.10 2.43

86
Table 7. Descriptive Statistics (Cohort 2) Variable N M SD Min Max Skewness Kurtosis
Fall LNF 133 44.72 17.48 6 83 -0.20 2.43
Fall LSF 133 22.27 12.32 0 66 0.50 3.24
Fall PSF 133 27.78 14.10 0 56 -0.38 2.18
Fall NWF 132 36.55 32.24 0 173 1.85 6.47
Fall Aimsweb Composite 132 131.84 64.09 6 338 0.51 3.41
Fall DRA2 127 7.65 7.025 1 34 1.50 4.63
Winter PSF 133 41.12 13.83 0 75 -0.29 3.60
Winter NWF 133 63.89 34.98 11 212 1.65 6.79
Winter R-CBM 118 52.34 44.76 0 180 1.07 3.34
Winter Aimsweb Composite 118 159.58 81.75 15 425 1.00 4.15
Winter DRA2 103 14.85 9.043 2 38 0.49 2.32
Grade 3 spring R-CBM 133 133.6 48.46 10 249 -0.48 3.10
Grade 3 MCAS 133 501.6 22.72 441 560 -0.04 3.18

87
Table 8. Pairwise Correlations between First-Grade Predictors and Third-Grade Outcomes (Cohort 1)
Variable 1 2 3 4 5 6 7 8 9 10 11 12
1. Fall LNF ¾
2. Fall LSF .56* ¾
3. Fall PSF .33* .46* ¾
4. Fall NWF .59* .60* .37* ¾
5. Fall Aimsweb Composite .78* .78* .61* .90* ¾
6. Fall DRA2 .59* .40* .36* .72* .73* ¾
7. Winter PSF .07 .13 .48* .02 .15 .11 ¾
8. Winter NWF .47* .56* .30* .75* .72* .54* .19* ¾
9. Winter R-CBM .63* .49* .37* .85* .81* .82* .12 .75* ¾
10. Winter Aimsweb Composite .59* .56* .45* .83* .83* .74* .35* .90* .93* ¾
11. Winter DRA2 .66* .52* .43* .65* .74* .81* .29* .57* .82* .78* ¾
12. Grade 3 spring R-CBM .62* .50* .44* .62* 70* .54* .28* .61* .68* .72* .68* ¾
13. Grade 3 MCAS .49* .54* .44* .57* .65* .55* .31* .51* .62* .65* .65* .68*
*p<.05

88
Table 9. Pairwise Correlations between First-Grade Predictors and Third-Grade Outcomes (Cohort 2) Variable 1 2 3 4 5 6 7 8 9 10 11 12
1. Fall LNF ¾
2. Fall LSF .73* ¾
3. Fall PSF .49* .53* ¾
4. Fall NWF .68* .69* .43* ¾
5. Fall Aimsweb Composite .86* .85* .67* .91* ¾
6. Fall DRA2 .66* .54* .42* .75* .75* ¾
7. Winter PSF .28* .21* .38* .13 .26* .13 ¾
8. Winter NWF .68* .65* .37* .85* .81* .71* .26* ¾
9. Winter R-CBM .74* .65* .48* .84* .84* .86* .15 .84* ¾
10. Winter Aimsweb Composite .76* .69* .52* .86* .87* .81* .37* .95* .94* ¾
11. Winter DRA2 .76* .59* .48* .74* .79* .84* .11 .72* .88* .82* ¾
12. Grade 3 spring R-CBM .68* .50* .42* .53* .63* .53* .33* .59* .62* .65* .60* ¾
13. Grade 3 MCAS .47* .42* .40* .41* .49* .48* .20* .42* .55* .54* .54* .66*
*p<.05

89
Table 10. Simple Linear Regression Predicting MCAS Scaled Score for Cohort 1
Model B SE β t p R2 1 Fall LNF .44 .07 .49 6.40 <.001 .24 Constant 221.20 3.31 66.79 <.001
2 Fall LSF .60 .084 .54 7.15 <.001 .29 Constant 228.25 2.11 108.26 <.001
3 Fall PSF .51 .09 .44 5.54 <.001 .20 Constant 227.79 2.70 84.33 <.001
4 Fall NWF .28 .04 .57 7.86 <.001 .33 Constant 232.09 1.58 146.9 <.001
5 Fall Aimsweb Composite .16 .02 .65 9.62 <.001 .42 Constant 220.54 2.37 93.08 <.001
6 Fall DRA2 1.40 .20 .55 6.88 <.001 .30
Constant 231.93 1.84 125.73 <.001
7 Winter PSF .30 .08 .31 3.73 <.001 .10 Constant 230.67 3.07 75.03 <.001
8 Winter NWF .25 .04 .51 6.78 <.001 .26 Constant 229.04 2.10 109.11 <.001
9 Winter R-CBM .20 .02 .61 8.85 <.001 .38 Constant 231.39 1.50 154.50 <.001
10 Winter Aimsweb Composite .12 .01 .64 9.56 <.001 .42 Constant 224.39 2.01 111.32 <.001
11 Winter DRA2 1.00 .11 .65 8.81 <.001 .43
Constant 225.66 2.03 111.30 <.001
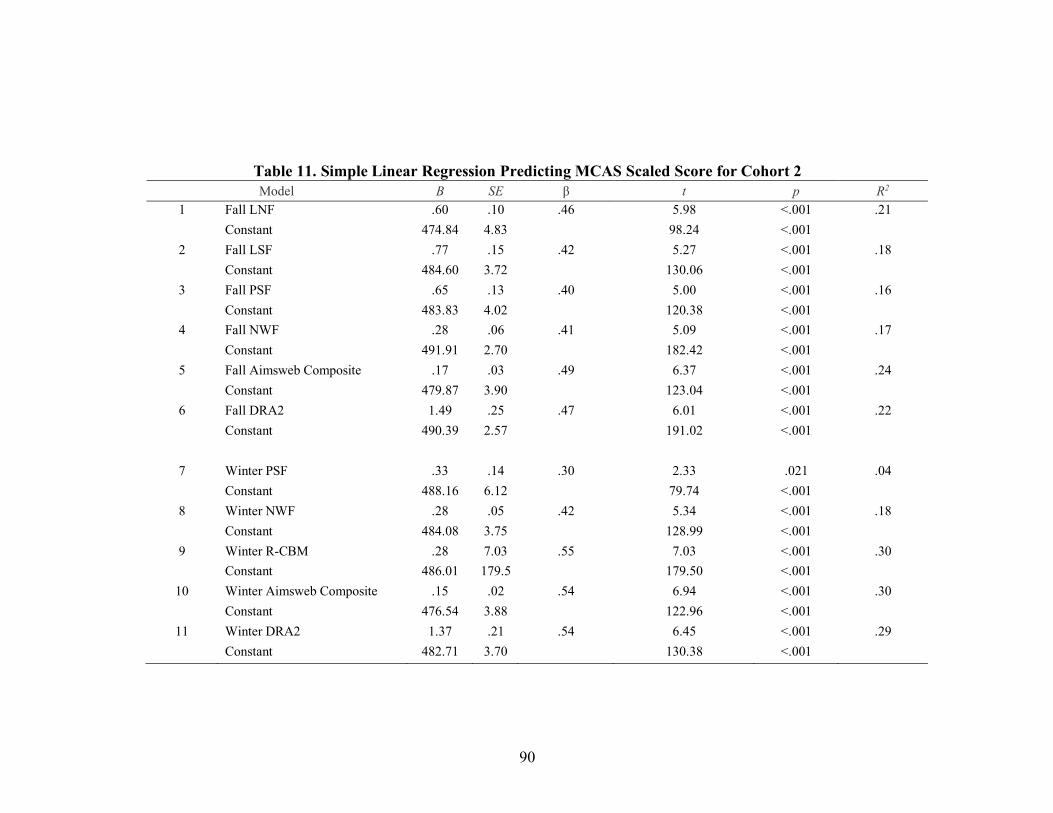
90
Table 11. Simple Linear Regression Predicting MCAS Scaled Score for Cohort 2 Model B SE β t p R2
1 Fall LNF .60 .10 .46 5.98 <.001 .21 Constant 474.84 4.83 98.24 <.001 2 Fall LSF .77 .15 .42 5.27 <.001 .18 Constant 484.60 3.72 130.06 <.001 3 Fall PSF .65 .13 .40 5.00 <.001 .16 Constant 483.83 4.02 120.38 <.001 4 Fall NWF .28 .06 .41 5.09 <.001 .17 Constant 491.91 2.70 182.42 <.001 5 Fall Aimsweb Composite .17 .03 .49 6.37 <.001 .24 Constant 479.87 3.90 123.04 <.001 6 Fall DRA2 1.49 .25 .47 6.01 <.001 .22 Constant 490.39 2.57 191.02 <.001 7 Winter PSF .33 .14 .30 2.33 .021 .04 Constant 488.16 6.12 79.74 <.001 8 Winter NWF .28 .05 .42 5.34 <.001 .18 Constant 484.08 3.75 128.99 <.001 9 Winter R-CBM .28 7.03 .55 7.03 <.001 .30 Constant 486.01 179.5 179.50 <.001
10 Winter Aimsweb Composite .15 .02 .54 6.94 <.001 .30 Constant 476.54 3.88 122.96 <.001
11 Winter DRA2 1.37 .21 .54 6.45 <.001 .29 Constant 482.71 3.70 130.38 <.001

91
Table 12. Classification Accuracy Statistics for First-Grade Screeners using Publisher Cut Scores Predicting MCAS
Proficiency (Cohort 1) n TP TN FP FN AUC Sens. Spec. PPV NPV Overall correct
classification Fall LNF 129 31 54 15 29 .716 51.7 78.3 67.4 65.0 65.9
Fall LSF 129 50 39 30 10 .767 83.3 56.5 62.5 79.6 69.0
Fall PSF 128 47 24 45 12 .692 79.7 34.8 51.1 66.7 55.5
Fall NWF 128 44 46 23 15 .801 75.6 66.7 65.7 75.4 70.3
Fall Aimsweb Composite 128 _ _ _ _ .811 _ _ _ _ _
Fall DRA2 113 16 60 3 34 .811 32.0 95.2 84.2 63.8 67.3
Winter PSF 132 52 21 49 10 .633 83.9 30.0 51.5 67.7 55.3
Winter NWF 133 49 43 28 13 .760 79.0 60.6 63.6 76.8 69.2
Winter R-CBM 131 44 56 14 17 .835 72.1 80.0 75.9 76.7 76.3
Winter Aimsweb Composite 130 _ _ _ _ .838 _ _ _ _ _
Winter DRA2 107 25 51 4 27 .856 48.1 92.7 86.2 65.4 71.0

92
Table 13. Classification Accuracy Statistics for First-Grade Screeners using Publisher Cut Scores Predicting MCAS Proficiency (Cohort 2)
n TP TN FP FN AUC Sens. Spec. PPV NPV
Overall correct
classification Fall LNF 132 40 57 10 25 .740 61.5 85.1 80.0 69.5 73.5
Fall LSF 132 46 33 34 19 .667 70.8 49.3 57.7 63.5 59.9
Fall PSF 132 46 30 37 19 .667 70.8 44.8 55.4 61.2 57.6
Fall NWF 131 39 41 26 25 .671 60.9 61.2 60.0 62.1 61.1
Fall Aimsweb Composite 131 _ _ _ _ .709 _ _ _ _ _
Fall DRA2 126 19 59 5 43 .738 30.7 92.2 79.2 57.8 61.9
Winter PSF 132 43 31 36 22 .585 66.2 46.3 54.4 58.5 56.1
Winter NWF 132 25 51 16 40 .670 38.5 76.1 61.0 56.0 57.6
Winter R-CBM 117 34 44 14 25 .744 57.6 75.8 70.8 63.8 66.7 Winter Aimsweb Composite 117 _ _ _ _ .735 _ _ _ _ _
Winter DRA2 102 21 51 3 27 .740 43.8 94.4 87.5 65.4 70.6

93
Table 14. Classification Accuracy Statistics for First-Grade Screeners using Publisher Cut Scores Predicting Third-Grade R-CBM score of 131 WCPM (Cohorts 1 and 2)
n TP TN FP FN AUC Sens. Spec. PPV NPV Overall correct
classification Fall LNF 258 73 126 23 36 .805 67.0 84.6 76.0 77.8 77.1
Fall LSF 258 89 60 69 20 .734 81.7 53.7 56.3 80.0 65.5
Fall PSF 257 82 59 90 26 .682 75.9 39.6 47.7 69.4 54.9
Fall NWF 256 78 95 54 29 .786 72.9 63.8 59.1 76.6 67.6
Fall Aimsweb Composite 256 _ _ _ _ .807 _ _ _ _ _
Fall DRA2 236 34 132 9 61 .776 35.8 93.6 79.1 68.4 70.3
Winter PSF 261 84 57 95 25 .627 77.1 37.5 46.9 69.5 54.0
Winter NWF 262 74 110 43 35 .779 67.9 71.9 63.3 75.9 70.2
Winter R-CBM 245 75 114 31 25 .848 75.0 78.6 70.8 82.0 77.1
Winter Aimsweb Composite 244 _ _ _ _ .840 _ _ _ _ _
Winter DRA2 209 44 110 9 44 .815 50.0 92.4 83.0 71.4 74.4

94
Table 15. Alternative Cut Scores and Resulting Sensitivity, Specificity and Overall Correct Classification when Predicting Third-Grade R-CBM score of 131 WCPM.
Cut score Sensitivity Specificity Overall correct classification
Fall LNF 40 67.0 84.6 77.1 49 82.6 61.7 70.5 57 90.8 40.9 62.0
Fall LSF 25 81.7 53.7 65.5 34 91.7 24.8 53.1
Fall PSF 35 75.9 39.6 54.9 38 84.2 32.9 54.5 42 90.7 17.5 48.2
Fall NWF 27 72.9 63.8 67.6 30 80.4 59.1 68.0 39 92.5 42.3 63.3
Fall DRA2 3 35.8 93.6 70.3 8 84.2 55.3 67.0 12 92.6 34.8 58.1
Winter PSF 45 77.1 37.5 54.0 48 80.7 27.6 49.8 55 90.8 12.5 45.2
Winter NWF 45 67.9 71.9 70.2 52 83.5 62.1 71.0 67 90.8 41.2 61.8
Winter R-CBM 30 75.0 78.6 77.1 42 81.0 65.5 71.8 63 90.0 46.9 64.5
Winter DRA2 8 50.0 92.4 74.4 16 83.0 59.7 69.6 24 90.9 39.5 61.35
*Bold row indicates publisher recommended cut score

95
Table 16. Means and Standard Deviations of Scores Across Subgroups First-Grade Predictors
Fall Winter Measure Group N Mean SD N Mean SD
LNF
ELL 53 37.92 19.07 — — — non ELL 209 46.84 15.90 — — — FRL 123 39.77 17.13 — — — non FRL 139 49.70 15.37 — — —
LSF
ELL 53 16.83 14.60 — — — non ELL 209 23.23 11.85 — — — FRL 123 17.74 12.30 — — — non FRL 139 25.65 11.89 — — —
PSF
ELL 53 18.25 13.00 51 30.51 13.96 non ELL 208 29.46 12.56 214 39.73 14.25 FRL 122 22.39 13.43 124 35.24 15.93 non FRL 139 31.39 11.94 141 40.34 12.97
NWF
ELL 53 22.98 24.85 51 49.71 28.56 non ELL 207 37.94 31.97 215 58.41 34.04 FRL 121 22.61 19.58 124 45.15 21.76 non FRL 139 45.58 35.30 142 66.86 37.89
R-CBM
ELL — — — 51 32.96 32.65 non ELL — — — 198 56.40 46.18 FRL — — — 120 33.48 30.87 non FRL — — — 129 68.45 48.92
DRA2
ELL 50 4.20 3.77 44 10.55 8.71 non ELL 190 8.24 6.69 166 16.20 9.00 FRL 111 4.77 4.08 97 11.13 8.10 non FRL 129 9.66 7.15 113 18.35 8.83
Third-Grade Outcomes R-CBM MCAS (z score) ELL 52 108.92 43.80 53 -.68 .87 non ELL 213 139.20 49.17 215 .17 .96 FRL 125 112.32 47.80 126 -.50 .88 non FRL 140 151.96 43.38 142 .44 .88

96
Table 17. Classification Accuracy and Two Proportions Test for ELL Subgroup Analysis
Measure Group N AUC p Sens. p Spec. p PPV p NPV p Overall p
Fall LNF ELL 53 .777 .736 77.1 .042 76.5 .029 87.1 .016 61.9 .005 76.9 .963 Non ELL 209 .798 62.2 85.6 70.8 80.1 77.2
Fall LSF ELL 53 .616 .074 82.9 .763 29.4 <.001 70.7 .011 45.5 <.001 65.4 .989
Non-ELL 209 .740 81.1 56.8 51.3 84.3 65.5
Fall PSF ELL 53 .620 .643 88.6 .006 17.6 <.001 68.9 <.001 53.4 .010 65.4 .085
Non ELL 208 .654 70.0 42.4 40.2 71.8 52.2
Fall NWF ELL 53 .717 .325 82.9 .034 52.9 .099 78.4 <.001 60.0 .005 73.1 .338
Non-ELL 207 .781 68.1 65.2 51.6 78.9 66.2
Fall DRA2 ELL 50 .702 .342 56.3 <.001 76.5 <.001 81.8 .400 48.1 .002 63.3 .220
Non ELL 190 .767 25.4 96.0 76.2 71.7 72.2
Winter PSF ELL 51 .572 .637 84.8 .096 11.8 <.001 65.1 .002 28.6 <.001 60.0 .341 Non ELL 214 .608 73.7 40.7 41.2 73.3 52.6
Winter NWF ELL 51 .806 .559 75.8 .124 76.5 .456 86.2 <.001 61.9 .016 76.0 .319
Non-ELL 215 .768 64.5 71.3 55.7 78.2 68.9
Winter R-CBM ELL 51 .778 .175 75.8 .859 70.6 .159 83.3 .015 60.0 <.001 74.0 .540
Non ELL 198 .856 74.6 79.7 65.8 85.7 78.0
Winter DRA2 ELL 44 .700 .054 63.3 .017 69.2 <.001 82.6 .912 45.0 <.001 65.1 .114
Non ELL 166 .830 43.1 95.3 83.3 75.4 76.8

97
Table 18. Classification Accuracy and Two Proportions Test for FRL Subgroup Analysis
Measure Group N AUC p Sens. p Spec. p PPV p NPV p Overall p
Fall LNF FRL 123 .750 .111 67.5 .732 74.4 .002 83.1 <.001 55.2 <.001 69.9 .006 Non FRL 139 .830 65.5 89.1 61.3 90.7 84.2
Fall LSF FRL 123 .679 .917 85.0 .014 44.2 .034 73.9 <.001 61.3 <.001 70.7 .081
Non FRL 139 .685 72.4 57.3 30.9 88.7 60.4
Fall PSF FRL 122 .663 .086 83.5 <.001 27.9 .013 68.0 <.001 48.0 <.001 63.9 .003
Non FRL 139 .559 55.2 42.7 20.3 78.3 45.3
Fall NWF FRL 121 .712 .341 78.2 <.001 51.2 .002 74.4 <.001 56.4 <.001 68.6 .863
Non FRL 139 .764 58.6 70.0 34.0 86.5 67.6
Fall DRA2 FRL 111 .699 .339 41.4 <.001 85.4 .001 82.9 <.001 46.1 <.001 57.7 <.001
Non FRL 129 .754 20.0 97.1 62.5 83.5 82.2
Winter PSF FRL 124 .603 .751 76.3 .557 29.5 .035 66.3 <.001 40.6 <.001 59.7 .099 Non FRL 141 .622 79.3 42.0 26.1 88.7 49.6
Winter NWF FRL 124 .724 .188 68.8 .568 61.4 .009 76.4 <.001 51.9 <.001 66.1 .165
Non FRL 142 .793 65.5 76.1 41.3 89.6 73.9
Winter R-CBM FRL 120 .793 .069 75.3 .800 72.1 .060 82.9 <.001 62.0 <.001 74.2 .227
Non FRL 129 .852 73.9 82.1 47.2 93.5 80.6
Winter DRA2 FRL 97 .740 .125
.
57.6 <.001
.
77.4 <.001
.
84.4 .094
46.2 <.001
63.9 <.001
Non FRL 113 .827 27.3 97.8 75.0 84.8 84.1

98
CHAPTER 5
DISCUSSION
This investigation examined the properties of first-grade reading assessments
employed for the purpose of screening within a multi-tiered instructional model meant to
prevent later reading failure. Because illiteracy is associated with a multitude of poor
outcomes, a primary concern of first-grade educators is ensuring that children acquire the
appropriate foundational skills to support future reading achievement. Unfortunately,
without intervention, students who show reading deficits in early elementary years are
very likely to fall even further behind their classmates (Juel, 1988). Universal screening
is frequently used in elementary schools to identify which students are at risk and to
provide timely intervention. In recent decades, a great deal of research has focused on
identifying the salient foundational reading skills that predict later success. However,
these important skills are not always the constructs represented on early reading
assessments used for the purpose of screening, meaning that children may be
misidentified as on track and subsequently not provided with intervention until it is too
late. In this study, the Aimsweb TEL and the DRA2, two types of screening tools
developed based on contradicting models of the reading process and theories of reading
development, were investigated for appropriateness and usability, as well as tested for
predictive validity and classification accuracy on third-grade outcomes. Appropriateness
and usability were examined through review of test materials, as well as a questionnaire
targeted towards first-grade teachers. Technical characteristics were examined through
review of evidence available from test publishers, as well as analysis of longitudinal test
data from two cohorts of elementary students, totaling 269 participants. This study

99
replicates previous research to add to the existing literature base on the psychometric
properties of early literacy CBM, and represents a preliminary examination of these
properties of IRIs.
Summary of Findings
Appropriateness for Intended Use and Usability of Screening Measures
In chapter two, theoretical and empirical evidence describing the typical
trajectories of early reading development was reviewed, and test materials available from
the publisher of the Aimsweb measures and the DRA2 were critically examined for
evidence of alignment with the reading skills that have been identified as predictive of
later reading development. It was determined that the first-grade Aimsweb reading
assessments are highly aligned with reading related-skills critical to early literacy
development based on the code-based theories of reading development that have robust
empirical support to predict later reading achievement. These skills include phonological
awareness, understanding of the alphabetic principal and ability to use letter sound
associations to decode words, and - later in first-grade - fluency with connected text. The
DRA2, on the other hand, appears aligned to the psycholinguistic theory of reading, and
thus does not explicitly measure the constructs of phonological awareness or decoding
ability. Rather, at the earliest levels this assessment seems to assess students’ oral
language proficiency by focusing on students’ ability to use semantic and syntactic cues,
as well as the ability to gather cues from illustrations. Beginning at DRA2 level 16,
which many participants in this study reached by the winter of first-grade, fluency with
connected text is indeed reflected in the constructs measured.

100
In addition, usability evidence for each assessment was considered in the review
of test materials. Expected administration time is significantly longer for the DRA2
(estimated 10-20 minutes for first-graders) compared to the set of Aimsweb probes (5-7
minutes for first-graders). In terms of financial costs, the DRA2 includes more upfront
expenses, but beyond the initial purchase, the cost to access data management capabilities
of both systems are comparable. Understanding teachers’ perceptions of the usability
characteristics of each tool was one purpose of the educator questionnaire. The overall
agreement with statements related to usability was not significantly different for the
DRA2 and Aimsweb. Given the longer administration time associated with the DRA2, it
was somewhat surprising that respondents did not report this. A possible explanation is
the fact that only two respondents were classroom teachers (who administer the DRA2),
while six were reading specialists or intervention teachers (those who are responsible for
Aimsweb administration). Indeed, one intervention teacher noted that, the Aimsweb
administration is, “very time consuming and intervention groups have to be cancelled for
at least a week if not more”. Interestingly, there was a negative correlation between those
who believed there were enough resources allocated to each assessment. Teachers who
rated one higher, consistently rater the latter lower, which may indicate that they
perceived too little resources allocated to their preferred assessment and enough allocated
to their less preferred assessment.
The primary purpose of the educator questionnaire was to gather information
regarding the inferences that first-grade classroom teachers, special educators, and
reading specialists in the participating school district make based on the results of the
Aimsweb measures and DRA2. Based on the input of twelve educators, it was discovered

101
that while a numerical measure of agreement with various purposes of assessment did not
differ significantly for each tool, differences emerged in teachers’ qualitative comments.
For the DRA2, teachers were most likely to say that the assessment helps them
understand students’ instructional reading levels, and provides an opportunity to observe
oral reading so that teachers can identify what strategies students are currently using to
decode text, and develop instructional targets based on these needs. While these purposes
are primarily diagnostic, teachers’ comments related to the Aimsweb measures were
more likely to relate to screening, as well as measuring student outcomes. Further, it is
noted that while comments related to purposes of the DRA2 were in many cases quite
detailed, the same comments related to purposes of Aimsweb were in many cases brief
and vague, for example, “normed results” or “performance assessment”. Further, there
was indication that teachers believe that both the DRA2 and Aimsweb results are to
inform district level questions – for example, general trends over time, and how students
respond to implementation of new reading programs.
The questionnaire results revealed an apparent difference in the way that the two
assessments under investigation are being used in this district. Compared to IRIs,
respondents were less likely to have training in administering and interpreting the results
of early literacy CBM. Correspondingly, teachers were better able to express how the
DRA2 results were directly used to inform classroom instruction. The Aimsweb package
was perceived to be more related to school and district level efforts to identify students at
risk, and monitor student outcomes.
Teacher support for the DRA2 is unsurprising given the similarity between DRA2
materials and procedures and the expectations for young children in guided reading
102
classrooms. As noted by Pikulski (1974), IRI testing procedures approximate procedures
that are typically used to teach reading in whole language classrooms. Results of the
questionnaire that indicate support for the use of the DRA2 are also consistent with the
strong face validity reported by the publisher (Pearson, 2011c).
Technical Adequacy of Screening Measures
As Pikulski argued in his 1974 critique of IRIs, the face validity of IRI procedures
is important evidence of their value in classrooms when they are truly used “informally”.
Yet once they are used for purposes with consequences beyond daily classroom
decisions, they should be subjected to the same requirements of technical adequacy as
any other assessment. Pikulski further noted that it may be precisely because of this face
validity that so little research had been conducted on IRIs. Decades later, despite a great
deal of research on how reading develops in young children and the assessment
implications of this developmental path, there remains a paucity of empirical studies that
examine the properties of IRIs with respect to their use in educational decision-making.
This study’s second set of research questions pertained to the predictive validity
and classification accuracy of the screening measures in question. The first of these
questions sought to estimate how much of the variance in third-grade state standardized
test reading scores is predicted by fall and winter first-grade performance on each of the
measures being investigated. When the Aimsweb scores were combined into a composite,
in most cases they predicted a similar amount of variance as the DRA2. These data are
not surprising. As more general reading behaviors were assessed, the relationship
between early reading behaviors and later ones would be similar. Depending on the
screening period and cohort, single Aimsweb probes also predicted as much or more

103
variance than the DRA2. For example, fall NWF and LSF screeners had a stronger
correlation to third-grade ORF and MCAS than the broader fall DRA2 measure. This
finding may indicate, consistent with the code-based theories, that the assessment of
decoding is more relevant at the start of first-grade than measuring broader oral language
and comprehension skills represented in the early forms of the DRA2.
For both cohorts, the winter DRA2 scores were more predictive than the fall
DRA2 scores. This is likely related not only to the closer proximity between the
administration of predictor and outcome measures, but also to the fact that the higher
levels of the DRA2 assessment that include text reading fluency and are typically
administered to first-graders in the winter are more highly aligned to the developmental
reading skills of the time period, in which students move from the decoding stage and
fluency with connected text emerges as the strongest indicator of reading ability (Chall,
1996; Jenkins, et al. 2007).
While the correlational and regression analyses provide evidence of the predictive
relationship between the first-grade assessments and later reading proficiency, when
evaluating the technical adequacy of assessments used for the purpose of screening, it is
crucial to understand the classification accuracy of each tool, which provides indices of
utility in identifying students who are on track, or who are in need of intervention. The
fourth research question considered the classification accuracy of the fall and winter first-
grade DRA2 and Aimsweb screening measures for this sample using published cut points
for risk, and subsequently sought to improve the classification accuracy of each measure
by establishing more sensitive cut points for risk status.

104
In most cases, the Aimsweb classification accuracy statistics were similar to
previously published studies (e.g., Goffreda et al., 2009; Silberglitt & Hintze, 2005). For
example, consistent with previous investigations, winter R-CBM emerged as the most
predictive first-grade subtest. Also consistent with previous research, PSF generally
identified an adequate percentage of first-graders at risk, yet resulted in very low
specificity levels, meaning that high rates of false positives were observed. While this
consequence is less problematic than false negatives, it questions the utility of the PSF
measure to efficiently allocate resources.
Use of the DRA2 as a screening tool resulted in low levels of sensitivity (ranging
from 30.7-50.0), and high levels of specificity (ranging from 92.2-95.2). Effectively, this
means that when first-graders reach the recommended benchmark levels on the DRA2, it
is not necessarily indicative of later success on an outcome measure in third-grade. On
the other hand, when first-graders do not meet the recommended level, it is very unlikely
that they will go on to reach proficiency on the outcome measure, whether it be a reading
achievement test or oral reading fluency. PPV values for the DRA2 predicting MCAS
success ranged from 79.2 to 87.5, meaning that there is a high probability that a risk
status on the DRA2 in first-grade indicates later difficulty, yet NPV values ranged from
57.8 to 65.4, meaning that even when a student reaches the DRA2 benchmark score, there
is at least a 35% chance that they will struggle to reach proficiency on a standardized test
of reading in third-grade. The NPV values for the DRA2 improved slightly when R-CBM
was used as the third-grade outcome measure, with a negative result on the DRA2
meaning a 71.4% chance of achieving proficiency. While no previous published
investigations of IRIs examined classification accuracy for first-graders, a study

105
conducted with a sample of second and third-graders found similar trends of low
sensitivity of these tools (Parker et al., 2015).
As was seen in the regression analyses, the winter first-grade DRA2 scores were
more useful in predicting third-grade outcomes than the fall DRA2 scores, with
sensitivity improving from fall to winter and specificity remaining high. Again, this likely
reflects the alignment between the higher DRA2 levels and the important indicators of
reading ability in second semester first-graders, namely, fluency with connected text.
On the whole, first-grade screening tools were less predictive of third-grade
achievement scores for Cohort 2 than they were for Cohort 1. There are two possible
explanations for this. First, upon the time Cohort 1 entered first-grade, the participating
school district adopted a code based early reading curriculum for grades K-2. Previous to
that, a guided reading approach was employed, although individual teachers incorporated
code based instruction to various degrees. However, despite this change, the cohorts did
not perform significantly differently except in the winter NWF measure, in which Cohort
2’s mean score was significantly higher (t (264) = 3.59, p <. 001). As will be explored
further in discussion of this study’s limitations, it is possible that access to tier I
instruction that emphasized foundational skills, as well as targeted intervention for at risk
students, resulted in a weaker relationship between first-grade screening measures and the
MCAS. This indeed appears to be a viable explanation in the case of NWF, for which
Cohort 2 showed fewer true positive screening results than Cohort 1, yet also
significantly more false negatives, resulting in lower sensitivity for Cohort 2 than is
typically reported for NWF. It is possible that direct teaching of decoding skills in first-
grade allowed students to perform well enough to pass the screening test, but first-grade

106
success in this skill did not reflect the higher-level skills needed to be on track for later
overall reading proficiency.
However, upon examination of the correlation coefficients, it is noted that even R-
CBM administered at the same time as MCAS was less predictive in Cohort 2 than in
Cohort 1. This suggests that the more likely explanation for the differential relationship is
that the proficiency expectations of the MCAS test changed between Cohort 1 and Cohort
2. The newer test emphasizes assessment of higher level critical thinking skills that may
be less closely correlated to basic oral reading ability.
Examination of the classification accuracy for each screening measure revealed
the cutpoints recommended by the publishers did not elicit the .90 sensitivity threshold,
or the .80 specificity threshold recommended by Compton et al. (2006) and Jenkins, et al.
(2007). After obtaining classification accuracy statistics for the publisher recommended
cut scores, third-grade R-CBM scores were used as an outcome and ROC curves were
generated to obtain cut scores that would result in sensitivity rates above .80, and above
.90 as recommended by Jenkins et al. (2007). For most subtests, holding sensitivity at
higher levels led to lower rates of overall correct classification, as specificity was
compromised by the increase in sensitivity. For the Aimsweb screeners, when sensitivity
was increased to .90, resulting specificity was similar to levels obtained in previous
investigations of early literacy CBM (see chapter 2, table 3, e.g., Johnson, et al., 2009;
Catts, et al., 2009; Clemens et al., 2011, Riedel, 2007), despite the fact that these most of
studies did not employ third-grade state achievement tests as the outcome measures. The
classification accuracy of the DRA2 has not been previously studied in first-graders.

107
For many measures, cut scores needed to be increased quite dramatically in order
to attain sensitivity of .90. For example, the R-CBM cut score was increased from 30
words read correctly to 63. According to the Aimsweb National Norms, a score of 63
words per minute would be achieved by students at the 72nd percentile in the winter of
first-grade (Pearson, 2014). In order to obtain a sensitivity of .90, the fall DRA2 cut score
needed to be increased from level 3 to level 12, and the winter first-grade DRA2
benchmark needed to be increased from Level 8 to Level 24. According to the publisher,
Level 24 is expected in mid to late second grade (Pearson, 2011c).
This study’s fifth research question was an inquiry into the differential
classification accuracy of each tool for English language learners and students who are
eligible for free or reduced lunch. Given the disparities between educational achievement
of majority and minority groups (U.S. Department of Education, 2015), it is not
surprising that across screening tools and outcome measures, students who were ELLs or
received FRL performed less well. Examination of the classification accuracy statistics
for ELLs compared to proficient English speakers reveals that in general, given the
publisher recommended cut scores, sensitivity was improved, and specificity decreased;
fall LNF, PSF, NWF and DRA2, as well as winter DRA2 were significantly better at
identifying ELLs at risk than non-ELLs at risk. Similar patterns were observed for FRL
students vs. non FRL students. This suggests the need for additional consideration, and
perhaps alternate cut scores when these tools are used to identify student from these
subgroups who are in need of intervention. As an example, while results of the previous
research question suggest that for this study’s population as a whole, cut scores should be
increased to improve sensitivity, raising those cut scores may result in less efficient

108
screening decisions for ELLs. These results are consistent with other studies that have
suggested consideration of alternate cut scores for subgroups (Hosp et al., 2011; Johnson
et al., 2009), and also illustrate the importance of cross validation when using post hoc
selection of cut scores that may not generalize to different populations.
Each measure analyzed in the present study was a test of reading or its the sub-
component skills; thus, it is not surprising that the first-grade variables were generally
correlated with and predictive of later reading proficiency. However, despite moderate
correlations between the Aimsweb Composite and DRA2 and the outcome measure, these
two screening approaches differentially predicted which students were at risk. Using the
publishers’ cutpoints, students who were identified by the DRA2 as likely to encounter
reading difficulties were more likely to do so than students identified as at risk by the
Aimsweb measures. However, more concerning is that the DRA2 was also much less
likely to identify struggling readers who may need intervention than were the Aimsweb
subtests. Each and every one of the Aimsweb TEL measures demonstrated greater
sensitivity than the DRA2 administered at the same time, meaning that they correctly
identified more students at risk. Interestingly, the survey results revealed that classroom
teachers thought the TEL and the DRA2 would identify struggling readers similarly. Yet
they were significant more likely to say that TEL measures over identified students as at-
risk. Indeed, we found the latter to be true, with greater false positive rates observed
using the TEL. Yet the TEL screening measures were more likely to draw attention to the
right students in need of more reading support.
These findings provide evidentiary support that the basic skills assessed using the
TEL are better aligned with important literacy constructs that predict later reading

109
achievement than the broad reading construct measured in the DRA2. Students who met
the DRA2 cut score in many cases did not meet cut scores on the individual TEL
subtests, and subsequently did not perform proficiently on the third-grade MCAS or R-
CBM. Given that false negative predictions often mean that students do not receive
intervention in a timely manner, these results are worrisome.
Integration of Data
This study’s final research question asked whether the inferences and decisions
made based on screening results are supported by the constructs assessed in each measure
and by the predictive validity evidence. On the questionnaire, educators endorsed
statements related to screening for both Aimsweb and the DRA2. Examination of the
relevant constructs revealed that Aimsweb does measure the appropriate first-grade
foundational skills that align to later reading success. Further, it is efficient to administer
and has stronger psychometric properties for screening. Still, the results of this study
confirm what has been noted by previous investigations of the classification accuracy of
early literacy CBM. Namely, that when used alone, screening measures such as LNF,
PSF and NWF are inadequate as screening tools. As will be considered later in discussion
of implications, the relative ability of these tools to minimize false negative results makes
them appropriate as the first gate in a multistep screening process.
However, neither review of the DRA2 content, nor the predictive validity
evidence obtained in this study supports the use of the DRA2 as a screening tool, as it
results in high levels of problematic false negative identifications. Given the additional
time required to administer the DRA2, and its poor utility in identifying students at risk
of later reading problems, it’s use as a screening tool cannot be recommended.

110
While screening was endorsed as a purpose of the DRA2, teachers’ responses to
open ended questions indicated that the DRA2 is used primarily for diagnostic decisions.
IRIs such as the DRA2 do allow for more time to systematically observe students than
individual Aimsweb probes and may provide valuable qualitative information about a
student’s skills, which can be analyzed in order to inform instruction. However, it should
be reiterated that the DRA2 does not include a direct assessment of phonological
awareness or decoding skills, and therefore it’s utility for diagnosing reading problems
and informing instruction must be called into question when used with young children
who are not yet able to read with fluency. Further, the validity of instructional decisions
made based on IRI data has not been tested and disseminated for educators to evaluate.
Despite these findings, it is evident from previous literature, and from the limited
respondents to this study’s questionnaire that teachers appreciate the value IRIs as an
opportunity to observe students’ reading behavior in a structured way, and as a way to
match students to texts. On the other hand, the results of the questionnaire also indicate
that the use of early CBM may not be well understood by all teachers, and that CBM is
not as relevant to the instructional decisions made by classroom teachers. This has
implications for schools who adopt early literacy CBM screening tools. As has been
described previously, early literacy CBM probes are highly aligned to the skills that
predict later reading achievement and their technical properties have been vetted in a way
that those of IRIs have not. The conclusion that CBM screening tools are not well
understood by teachers is suggestive of a missed opportunity to adequately target students
who may benefit from more intensive literacy intervention. Care should be taken to
ensure that professional development is provided to teachers who work directly with
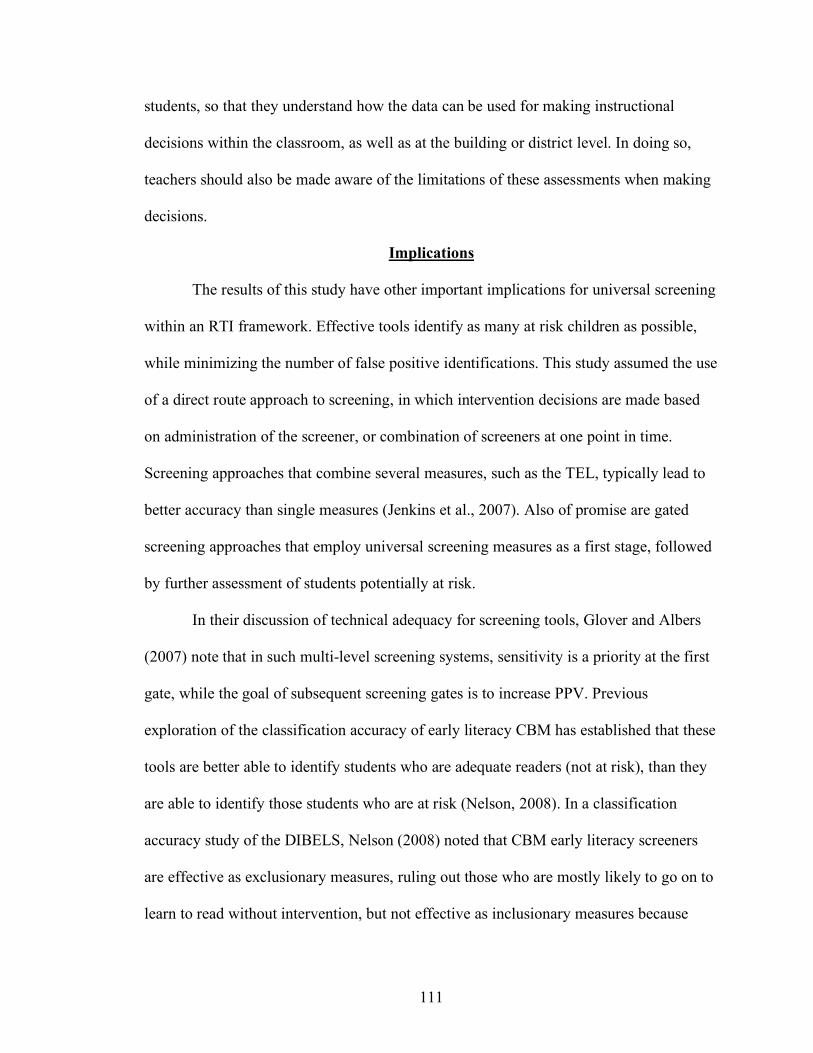
111
students, so that they understand how the data can be used for making instructional
decisions within the classroom, as well as at the building or district level. In doing so,
teachers should also be made aware of the limitations of these assessments when making
decisions.
Implications
The results of this study have other important implications for universal screening
within an RTI framework. Effective tools identify as many at risk children as possible,
while minimizing the number of false positive identifications. This study assumed the use
of a direct route approach to screening, in which intervention decisions are made based
on administration of the screener, or combination of screeners at one point in time.
Screening approaches that combine several measures, such as the TEL, typically lead to
better accuracy than single measures (Jenkins et al., 2007). Also of promise are gated
screening approaches that employ universal screening measures as a first stage, followed
by further assessment of students potentially at risk.
In their discussion of technical adequacy for screening tools, Glover and Albers
(2007) note that in such multi-level screening systems, sensitivity is a priority at the first
gate, while the goal of subsequent screening gates is to increase PPV. Previous
exploration of the classification accuracy of early literacy CBM has established that these
tools are better able to identify students who are adequate readers (not at risk), than they
are able to identify those students who are at risk (Nelson, 2008). In a classification
accuracy study of the DIBELS, Nelson (2008) noted that CBM early literacy screeners
are effective as exclusionary measures, ruling out those who are mostly likely to go on to
learn to read without intervention, but not effective as inclusionary measures because

112
they produce more false positives. Therefore, when using these tools, further screening as
part of a multistep process is warranted. If secondary assessment confirms that students
are at risk, resources can be allocated for intervention. Secondary assessment may come
with additional costs, but tools are administered to a much smaller subset of students after
true negatives have been eliminated. Another viable option would be to monitor the
progress of students found to be at risk on the screening tool. In a study of first-graders,
Compton et al. (2010) found that false positives could be decreased by short periods of
progress monitoring after the initial screening period.
Finally, the finding that relying on one set of cut scores results in differential
classification accuracy for subgroups of learners has important implications for practice.
As noted by Hosp et al. (2011) and Johnson et al. (2009), schools should consider
disaggregating screening results, and also bear in mind the importance of using other data
to validate screening decisions.
Limitations
Several limitations to the present study must be considered. First, this study’s
investigation of technical adequacy employed pre-existing data collected by the
participating school district. Therefore, specific procedures for collecting data, and
information regarding the reliability of assessment administration are not known to the
researcher. While the data was gathered in a way that reflects typical school practice,
precise information regarding how data was collected by school staff would support
understanding of the reliability of each measure and in turn generalizability to other
settings.

113
Related to the educator questionnaire, qualitative data collection typically focuses
on the insight of a small number of respondents with intimate knowledge of the matter at
hand, and indeed the respondents to the survey made decisions about their students based
on the assessment data analyzed in this study. However, another limitation of this study is
the limited number of first-grade educators that completed the questionnaire. Further, the
sample included a relatively small representation of classroom teachers. Had more
teachers offered their input, it would be more likely that results could be generalized to
other settings. Future research might include a larger scale investigation into teachers’
use and interpretation of CBM and IRIs when used as screening tools.
Additionally, the third-grade MCAS scores represent results of a standardized test
of English Language Arts, and may not directly reflect overall reading comprehension
skills, as scores are derived not only from correct responses to multiple choice questions,
but also written responses. Students who were proficient readers but had difficulty in
written expression may not reach proficiency according to this measure. This is reflected
in the merely moderate correlation between MCAS and R-CBM administered
concurrently. While the MCAS and R-CBM were the only available outcome measures in
this dataset, there may be better criterion measures by which to establish reading
proficiency in third-grade. Another, related limitation is the aforementioned change to the
MCAS content and expectations that occurred between Cohort 1 and Cohort 2. In
addition, the reading curriculum was changed at the same time. Without the threat of
these extraneous variables, it would be possible to draw more conclusive inferences
regarding the predictive validity of each tool in this specific setting.

114
A further limitation is the fact this study did not take into account student
participation in reading intervention programs between the first-grade screening periods
and the spring of third-grade. As part of the school’s RTI practices, students at risk based
on screening results may have been offered targeted reading intervention. However, it is
not known exactly which children received this intervention, nor to what degree. It is
likely that students received intervention based on the results of first-grade screening
measures, and that these interventions changed the trajectory of reading development and
potentially biased predictive validity of the measures. Therefore, false positives could be
related to effects of instruction that occurred between administration of the screener and
outcome measure. This threat to validity is difficult, if not impossible, to overcome in
educational settings, where teachers and school systems are tasked with identifying
student’s needs and attempting to meet them. However, future research should attempt to
control for these effects by considering participants’ intervention status in analyses.
Contributions to Extant Research and Future Directions
This study provides further evidence to support the use of early literacy CBM as
part of universal screening practices, and calls into question the use of IRIs for such
purposes. Previous investigations of the predictive validity and classification accuracy of
IRIs (e.g., Parker et al. (2015); Klingbeil, et al. (2015)) have looked at the use of these
measures with second and third-grade students, who have typically moved past the
decoding stage and are building fluency. This study represents an initial inquiry into the
use of these measures in first-graders. Future research should not only cross validate
these findings with additional first-grade samples, but could also investigate the
predictive utility of IRIs administered even earlier. IRIs are commonly used as early as

115
kindergarten to make educational decisions about young children. Based on the results of
this study, in which winter of first-grade DRA2 was more predictive than the fall
administration, it is hypothesized that kindergarten DRA2 would be even more likely to
under identify students at risk, as many children are able to read familiar, repetitive text
with the support of illustrations before they have developed the foundational skills
necessary to later reading success.
The results of this study have implications for the use of early literacy CBM in
gated screening models, and their use in this way should continue to be investigated.
While this study invalidates the use of the DRA2 as a universal screener, it may be an
appropriate tool for gathering more information about individual students who have been
identified as at risk by brief indicators. More research regarding the use of IRIs in RTI
frameworks in warranted. Another direction for future research would be a large-scale
investigation into how teachers use IRIs in tiered reading models. There is agreement in
the literature that IRIs are supported by teachers, yet few large scale investigations into
their current use. As one example, Arthaud, Vasa, & Steckelberg (2000), found that
among 400 special educators in four midwestern states, respondents were more likely to
use IRIs than CBM Oral Reading Fluency in their assessment practices. In another survey
of over 1500 K-2 teachers who employed a guided reading approach, 75% indicated that
they used IRIs and or running records for the purpose of diagnostic assessment (Ford &
Optiz, 2008). However, these surveys did not ask specifically about the use of IRIs as
screening tools or as part of RTI frameworks. Future inquiry in this area would also
provide insight into the ways that the use of assessments such as the DRA2 may be

116
changing in the face of reading reform and newfound emphasis on data-based decision-
making in the field.
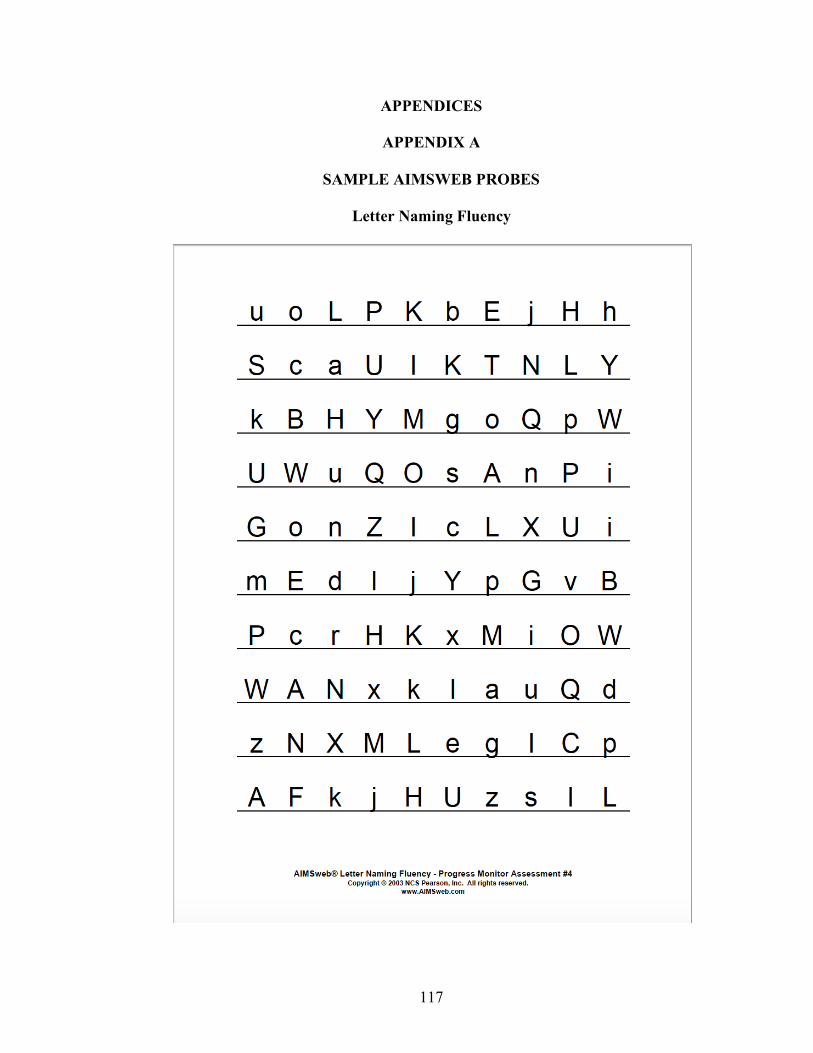
117
APPENDICES
APPENDIX A
SAMPLE AIMSWEB PROBES
Letter Naming Fluency
118
Letter Sound Fluency

119
Phoneme Segmentation Fluency

120
Nonsense Word Fluency

121
Oral Reading Fluency (R-CBM)

122
APPENDIX B
SAMPLE DRA2 TEACHER OBSERVATION GUIDE

123

124

125

126

127

128
APPENDIX C
EDUCATOR QUESTIONNAIRE
EXAMINING THE PROPERTIES, USES AND INTERPRETATIONS OF FIRST GRADE READING SCREENING TOOLS
Online Consent Form
You are invited to take part in a research questionnaire about first-grade reading assessments.
Your participation will require approximately 20 minutes, and is completed online at your computer. You may choose to complete the entire questionnaire in one sitting, or save your work and complete the questions any time within the next month. All eligible teachers who complete the questionnaire by December 20th will have the option to receive a $10 Amazon eGift Card in thanks for their participation! See details at the end of the survey.
There are no known risks or discomforts associated with this survey, other than the time needed to complete the questionnaire. Taking part in this study is completely voluntary. If you choose to be in the study you can withdraw at any time. Your responses will be kept strictly confidential, and digital data will be stored in secure computer files. Any report of this research that is made available to the public will not include your name or any other individual information by which you could be identified. If you have any questions about this research, you may contact Amadee Meyer at [email protected]. If you have questions or concerns about your rights as a research participant that you would like to discuss with someone other than the investigator on this project, you may contact the UMass Amherst Human Research Protection Office (HRPO) at (413) 545-3428 or email [email protected]. Please feel free to print a copy of this consent page to keep for your records. Clicking the “Next” button below indicates that you are 18 years of age or older, and indicates your consent to participate in this survey. Q1.2 Do you currently work at an [Name of School District] elementary school?
o Yes
o No
Skip To: End of Survey If Do you currently work at an [Name of School District] elementary school? = No
Q1.3 In the past 5 years, have you assessed or worked with first-grade students to support their reading development?
o Yes
o No
Skip To: End of Survey If In the past 5 years, have you assessed or worked with first-grade students to support their readi... = No
Q1.4 Which of the following best describes your role as a first-grade educator?
o Classroom teacher
o Special education teacher
o Reading specialist
o Reading intervention teacher
o Administrator
o Other (please describe below) ________________________________________________

129
Q1.5 How long have you worked in your current position?
o Years: ________________________________________________ Q1.6 How many total years of teaching experience do you have?
o Years: ________________________________________________ Q1.7 When considering which first-grade students are at risk of later reading failure, how much do you rely on the following sources of information?
Not at all Slightly Somewhat Very much so
Results of Informal Reading Inventories (DRA or BAS) o o o o
Results of Aimsweb Tests of Early Literacy (LNF, LSF, PSF, NWF) o o o o
Oral reading fluency (words read correctly per minute) on grade level texts o o o o
Reading curriculum (e.g. Superkids, Fundations) assessments o o o o
Your professional judgment o o o o
Other (please describe) o o o o
Other (please describe) o o o o

130
Q1.8 The following list includes indicators that are said to be predictive of later reading proficiency. With first semester (September 1-February 1) first-grade students in mind, please indicate the extent to which you feel each indicator is predictive of later reading success.
not at all predictive
slightly predictive
somewhat predictive
highly predictive
oral language proficiency o o o o
vocabulary o o o o
comprehension of texts read aloud to student o o o o
knowledge of letter/sound correspondences o o o o
self regulation of behavior o o o o
sight word knowledge o o o o
decoding skills o o o o
ability to use illustrations to confirm text o o o o
self monitoring and correction o o o o
knowledge of letter names o o o o
spelling o o o o
phonological awareness o o o o
reading engagement o o o o
oral reading fluency of grade level passages o o o o
Q1.9 Please list any additional indicators that you feel are somewhat or highly predictive of later reading success.
________________________________________________________________
________________________________________________________________

131
Q2.1 The following questions relate to the use of Informal Reading Inventories (IRIs). IRIs are individually administered assessments in which students read leveled texts and respond to comprehension questions. Examples of IRIs include the Developmental Reading Assessment (DRA) and Fountas and Pinnell Benchmark Assessment System (BAS). Please consider these assessment tools as you respond to the following questions. Q2.2 Have you participated in professional development related to the administration or interpretation of informal reading inventories (such as the DRA or BAS)? If yes, please briefly describe this training.
o Yes (please describe below)
o No Q2.3 Have you personally administered informal reading inventories (e.g. DRA or BAS) to first-graders?
o Yes
o No
o Unsure Q2.4 We are interested in understanding why teachers and schools administer informal reading inventories. Please answer the following:
o What information do Informal Reading Inventories provide to you as a teacher?
o What information do Informal Reading Inventories provide to the school or district?
o Other purposes? Q2.5 Do informal reading inventories (e.g. DRA or BAS) provide you with information beyond what you already know from everyday observation of and interaction with your students?
o Not at all
o Slightly
o Somewhat
o Very much so
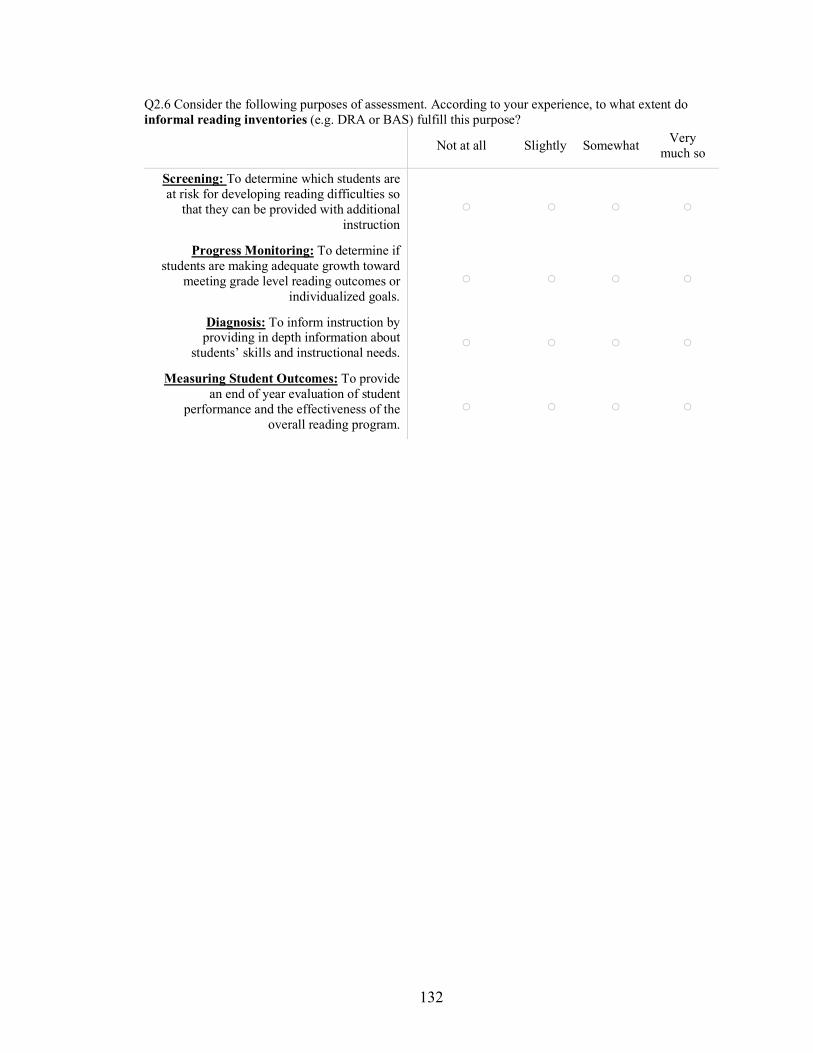
132
Q2.6 Consider the following purposes of assessment. According to your experience, to what extent do informal reading inventories (e.g. DRA or BAS) fulfill this purpose?
Not at all Slightly Somewhat Very much so
Screening: To determine which students are at risk for developing reading difficulties so
that they can be provided with additional instruction
o o o o
Progress Monitoring: To determine if students are making adequate growth toward
meeting grade level reading outcomes or individualized goals.
o o o o
Diagnosis: To inform instruction by providing in depth information about
students’ skills and instructional needs. o o o o
Measuring Student Outcomes: To provide an end of year evaluation of student
performance and the effectiveness of the overall reading program.
o o o o

133
Q2.7 Assessment practices lead to improved student reading achievement when they help teachers and schools answer important questions, and support data-based decision making (Coyne & Harn, 2006). Please consider the following questions related to your school’s reading programming. To what extent do informal reading inventories (e.g. the DRA or BAS) help teachers and schools answer each question?
Not at all Slightly Somewhat Very
much so
Which children are at risk for experiencing reading difficulties now and in the future? o o o o
Is our reading program meeting the needs of students? o o o o
Which specific beginning reading skills has a student mastered or not mastered? o o o o
Did our students improve from last year? o o o o
How can we make our reading program better? o o o o
Which students have similar instructional needs and will form an appropriate group for instruction? o o o o
Are we making progress towards our goals? o o o o
As a school have we accomplished our literacy goals? o o o o
Is intervention enabling children to make sufficient progress? o o o o
Are individual students on track for meeting end of year reading goals? o o o o
Is instruction working? o o o o
Which intervention programs are most likely to be effective based on a student’s skill profile? o o o o
Which children will need additional intervention to meet reading goals? o o o o
Q2.8 Universal screening assessments are administered to all students in a classroom, school or district to identify children who are at risk of reading difficulties and who could potentially benefit from intervention. The following statements (adapted from Glover & Albers (2007)) represent considerations of evaluating universal screening assessments. Please indicate the degree to which you agree with each statement with respect to informal reading inventories (e.g. DRA or BAS) administered according to district guidelines to first-grade students for the purpose of universal screening. Please use the comments box to elaborate on responses if desired.

134
Strongly Agree Agree
Neither Agree
nor Disagree
Disagree Strongly Disagree Unsure
The timing and frequency of administration is appropriate o o o o o o
The identification outcomes are relevant to the service delivery needs
of students o o o o o o
The constructs that are being measured are relevant for
determining first-graders’ risk of later reading difficulties
o o o o o o
The format and content have been validated in previous research o o o o o o
The assessment is contextually and developmentally appropriate for your
school’s population of first-graders o o o o o o
Alternate forms of this assessment lead to comparable results o o o o o o
Measurement is consistent over time o o o o o o
Scoring is consistent across scorers o o o o o o
The assessment correctly identifies most students at risk for later reading
difficulty o o o o o o
The assessment does not falsely identify students who are not actually
at risk o o o o o o
The assessment measures important first-grade reading skills that are
indicative of later reading achievement
o o o o o o
The assessment format and items are appropriate o o o o o o
The costs associated with the assessment are reasonable o o o o o o
The time commitment associated with the assessment is reasonable o o o o o o
School personnel are able to administer the assessment o o o o o o
Teachers appreciate the benefits associated with the assessment o o o o o o
135
Parents appreciate the benefits associated with the assessment o o o o o o
Students appreciate the benefits associated with the assessment o o o o o o
Resources are available to collect, manage, and interpret assessment
data o o o o o o
Teachers understand the implications associated with assessment outcomes o o o o o o
Parents understand the implications associated with assessment outcomes o o o o o o
Outcomes are useful for guiding instruction/intervention o o o o o o
The assessment improves student outcomes o o o o o o
Q2.9 Please use the box below to note any additional comments regarding the use of informal reading inventories (e.g. DRA or BAS) in your district.
________________________________________________________________
________________________________________________________________
________________________________________________________________
________________________________________________________________
________________________________________________________________

136
Q4.1 The following questions relate to the use of early literacy curriculum based measurement. Early literacy CBM tools include brief, individually administered assessments in which students demonstrate foundational reading skills, and the number of correct responses in one minute is recorded. Examples of early literacy CBM include Aimsweb and DIBELS. First grade subtests include Letter Naming Fluency, Letter Sound Fluency Phoneme Segmentation Fluency, Nonsense Word Fluency and Oral Reading Fluency. Please consider these assessment tools as you respond to the following questions. Q4.2 Have you participated in professional development related to the administration of interpretation of early literacy curriculum based measurement (such as Aimsweb or DIBELS)? If yes, please briefly describe this training.
o Yes (please describe below) ________________________________________________
o No Q4.3 Have you personally administered early literacy curriculum based measurement (e.g. Aimsweb or DIBELS) to first-graders?
o Yes
o No
o Unsure Q4.4 We are interested in understanding why teachers and schools administer early literacy curriculum based measurement (e.g. Aimsweb or DIBELS). Please answer the following:
o What information does early literacy based measurement provide to you as a teacher?
o What information does early literacy based measurement provide to the school or district?
o Other purposes? Q4.5 Does early literacy curriculum based measurement (e. g. Aimsweb or DIBELS) provide you with information beyond what you already know from everyday observation of and interaction with your students?
o Not at all
o Slightly
o Somewhat
o Very much so

137
Q4.6 Consider the following purposes of assessment. According to your experience, to what extent does early literacy curriculum based measurement (e.g. Aimsweb or DIBELS) fulfill this purpose?
Not at all Slightly Somewhat Very much
so
Screening: To determine which students are at risk for developing reading difficulties so that they can be
provided with additional instruction o o o o
Progress monitoring: To determine if students are making adequate growth toward meeting grade level
reading outcomes or individualized goals. o o o o
Diagnosis: To inform instruction by providing in depth information about students’ skills and instructional
needs. o o o o
Measuring student outcomes: To provide an end of year evaluation of student performance and the
effectiveness of the overall reading program. o o o o

138
Q4.7 Assessment practices lead to improved student reading achievement when they help teachers and schools answer important questions, and support data-based decision making (Coyne & Harn, 2006). Please consider the following questions related to your school’s reading programming. To what extent does early literacy curriculum based measurement (e. g. Aimsweb or DIBELS) help teachers and schools answer each question?
Not at all Slightly Somewhat Very much
so
Which children are at risk for experiencing reading difficulties now and in the future? o o o o
Is our reading program meeting the needs of students? o o o o
Which specific beginning reading skills has a student mastered or not mastered? o o o o
Did our students improve from last year? o o o o
How can we make our reading program better? o o o o
Which students have similar instructional needs and will form an appropriate group for instruction? o o o o
Are we making progress towards our goals? o o o o
As a school have we accomplished our literacy goals? o o o o
Is intervention enabling children to make sufficient progress? o o o o
Are individual students on track for meeting end of year reading goals? o o o o
Is instruction working? o o o o
Which intervention programs are most likely to be effective based on a student’s skill profile? o o o o
Which children will need additional intervention to meet reading goals? o o o o
Q4.8 Universal screening assessments are administered to all students in a classroom, school or district to identify children who are at risk of reading difficulties and who could potentially benefit from intervention. The following statements (adapted from Glover & Albers (2007)) represent considerations of evaluating universal screening assessments. Please indicate the degree to which you agree with each statement with respect to Early Literacy Curriculum Based Measurement (e.g. Aimsweb or DIBELS) administered according to district guidelines to first-grade students for the purpose of universal screening. Please use the comments box to elaborate on responses if desired.
139
Strongly Agree Agree
Neither Agree
nor Disagree
Disagree Strongly Disagree Unsure
The timing and frequency of administration is appropriate o o o o o o
The identification outcomes are relevant to the service delivery needs
of students o o o o o o
The constructs that are being measured are relevant for
determining first-graders’ risk of later reading difficulties
o o o o o o
The format and content have been validated in previous research o o o o o o
The assessment is contextually and developmentally appropriate for your
school’s population of first-graders o o o o o o
Alternate forms of this assessment lead to comparable results o o o o o o
Measurement is consistent over time o o o o o o
Scoring is consistent across scorers o o o o o o
The assessment correctly identifies most students at risk for later reading
difficulty o o o o o o
The assessment does not falsely identify students who are not actually
at risk o o o o o o
The assessment measures important first-grade reading skills that are
indicative of later reading achievement
o o o o o o
The assessment format and items are appropriate o o o o o o
The costs associated with the assessment are reasonable o o o o o o
The time commitment associated with the assessment is reasonable o o o o o o
School personnel are able to administer the assessment o o o o o o
Teachers appreciate the benefits associated with the assessment o o o o o o

140
Parents appreciate the benefits associated with the assessment o o o o o o
Students appreciate the benefits associated with the assessment o o o o o o
Resources are available to collect, manage, and interpret assessment
data o o o o o o
Teachers understand the implications associated with assessment outcomes o o o o o o
Parents understand the implications associated with assessment outcomes o o o o o o
Outcomes are useful for guiding instruction/intervention o o o o o o
The assessment improves student outcomes o o o o o o
Q4.9 Please use the box below to note any additional comments regarding the use of early literacy curriculum based measurement (e. g. Aimsweb or DIBELS) in your district.
________________________________________________________________
________________________________________________________________
________________________________________________________________
________________________________________________________________
________________________________________________________________

141
Q56 For the purpose of screening (determining which students are at risk for developing reading difficulties so that they can be provided with additional instruction), how valuable is each of the following sources of fall 1st grade data?
Very valuable
Somewhat valuable
Slightly valuable
Not at all valuable Unsure
Fall Letter Naming Fluency o o o o o
Fall Letter Sound Fluency o o o o o
Fall Phoneme Segmentation Fluency o o o o o
Fall Nonsense Word Fluency o o o o o
Fall BAS or DRA level o o o o o
Fall Teacher Judgement o o o o o
Q57 For the purpose of screening (determining which students are at risk for developing reading difficulties so that they can be provided with additional instruction), how valuable is each of the following sources of winter 1st grade data?
Very valuable
Somewhat valuable
Slightly valuable
Not at all valuable Unsure
Winter Phoneme Segmentation Fluency o o o o o
Winter Nonsense Word Fluency o o o o o
Winter Oral Reading Fluency o o o o o
Winter BAS or DRA level o o o o o
Winter Teacher Judgement o o o o o

142
APPENDIX D
QUESTIONNAIRE RESULTS
Which of the following best describes your role as a first-grade educator?
Answer % Count Classroom teacher 16.7% 2 Special education teacher 25.0% 3 Reading specialist 16.7% 2 Reading intervention teacher 33.3% 4 Administrator 0.0% 0 Other (Specialized Instructional Coach) 8.3% 1 Total 100% 12
How long have you worked in your current position? Average = 9.75 years How many total years of teaching experience do you have? Average = 19.5 years When considering which first-grade students are at risk of later reading failure, how much do you rely on the following sources of information?
Other sources of information that educators rely on somewhat or very much so: “Phonological Awareness” “Oral Reading by mid-year, not in Sept. on the Aimsweb” “rapid naming” “Data from daily lessons such as reading word lists, etc.” “Phonemic Awareness Diagnostic: PAST” “prior preparation for literacy” “Individual reading conferences” “peer consultation” “Multisensory” “QPS to screen phonics” “reading specialist”
Sources of information Not at all Slightly Somewhat Very
much so Agreement
Your professional judgment 0.0% 0.0% 25.0% 75.0% 2.75 Results of Informal Reading Inventories 0.0% 8.3% 33.3% 58.3% 2.5
Results of Aimsweb Tests of Early Literacy 0.0% 0.0% 50.0% 50.0% 2.5
Oral reading fluency on grade level texts 0.0% 8.3% 75.0% 16.7% 2.1
Reading curriculum assessments 8.3% 41.7% 41.7% 8.3% 1.5

143
The following list includes indicators that are said to be predictive of later reading proficiency. With first semester (September 1-February 1) first-grade students in mind, please indicate the extent to which you feel each indicator is predictive of later reading success.
Indicator not at all predictive
slightly predictive
somewhat predictive
highly predictive Agreement
knowledge of letter/sound correspondences 0.0% 0.0% 8.3% 91.7% 2.9 decoding skills 0.0% 0.0% 33.3% 66.7% 2.7 phonological awareness 0.0% 0.0% 33.3% 66.7% 2.7 oral language proficiency 0.0% 0.0% 50.0% 50.0% 2.5 knowledge of letter names 8.3% 0.0% 25.0% 66.7% 2.5 comprehension of texts read aloud to student 0.0% 8.3% 41.7% 50.0% 2.4 vocabulary 0.0% 8.3% 58.3% 33.3% 2.3 self monitoring and correction 0.0% 16.7% 33.3% 50.0% 2.3 reading engagement 0.0% 8.3% 50.0% 41.7% 2.3 oral reading fluency of grade level passages 0.0% 25.0% 50.0% 25.0% 2.0 sight word knowledge 8.3% 25.0% 50.0% 16.7% 1.8 spelling 0.0% 25.0% 75.0% 0.0% 1.8 ability to use illustrations to confirm text 8.3% 25.0% 58.3% 8.3% 1.7 self regulation of behavior 16.7% 25.0% 50.0% 8.3% 1.5
Additional indicators that are somewhat or highly predictive: “Students must feel they are in a safe environment to make mistakes. If a student had trauma in life, they may not be available for learning” “Students who don't have the opportunity to explore books, book handling skills” “Ability to write 10 or more sight words correctly” “working memory” “The student’s ability to retell stories in their own words without prompts or pictures is highly indicative of reading success” “Home support is very important. Being read to and being able to read to a parent/caretaker. Access to books and writing materials.” “Knowledge of story structure, experience being read aloud to “ “Ability to convert language to mental imagery.”
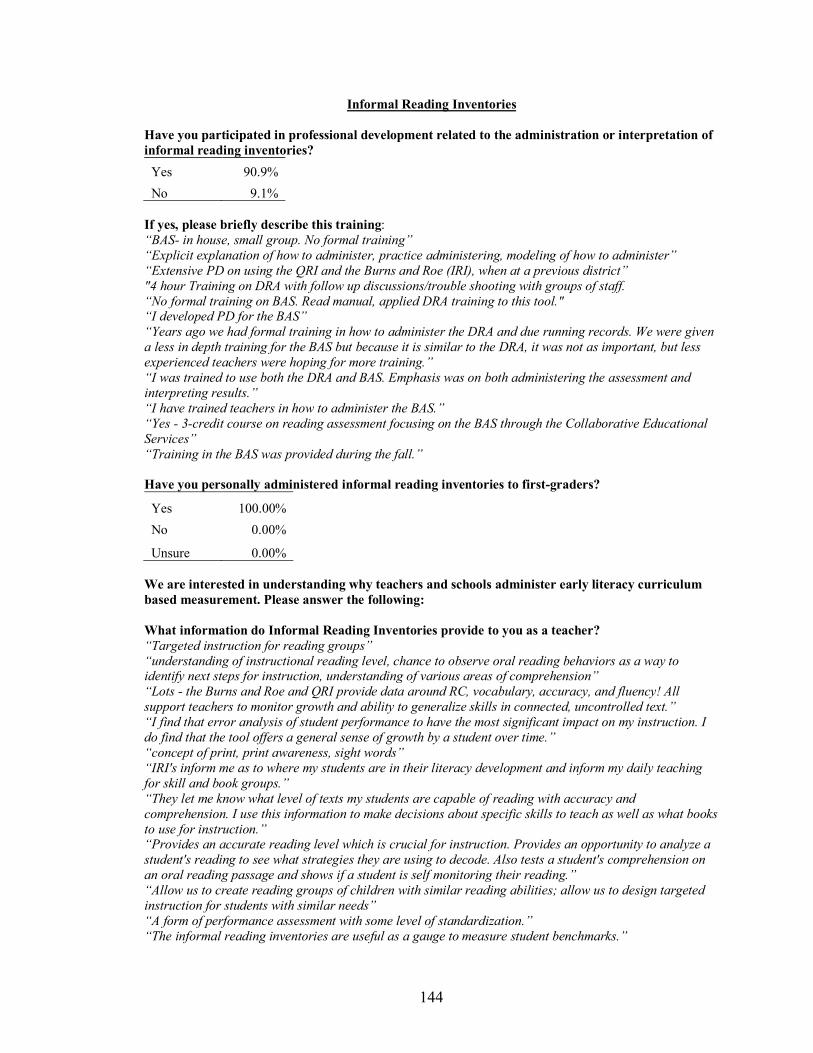
144
Informal Reading Inventories
Have you participated in professional development related to the administration or interpretation of informal reading inventories?
Yes 90.9% No 9.1%
If yes, please briefly describe this training: “BAS- in house, small group. No formal training” “Explicit explanation of how to administer, practice administering, modeling of how to administer” “Extensive PD on using the QRI and the Burns and Roe (IRI), when at a previous district” "4 hour Training on DRA with follow up discussions/trouble shooting with groups of staff. “No formal training on BAS. Read manual, applied DRA training to this tool." “I developed PD for the BAS” “Years ago we had formal training in how to administer the DRA and due running records. We were given a less in depth training for the BAS but because it is similar to the DRA, it was not as important, but less experienced teachers were hoping for more training.” “I was trained to use both the DRA and BAS. Emphasis was on both administering the assessment and interpreting results.” “I have trained teachers in how to administer the BAS.” “Yes - 3-credit course on reading assessment focusing on the BAS through the Collaborative Educational Services” “Training in the BAS was provided during the fall.” Have you personally administered informal reading inventories to first-graders?
Yes 100.00% No 0.00%
Unsure 0.00% We are interested in understanding why teachers and schools administer early literacy curriculum based measurement. Please answer the following: What information do Informal Reading Inventories provide to you as a teacher? “Targeted instruction for reading groups” “understanding of instructional reading level, chance to observe oral reading behaviors as a way to identify next steps for instruction, understanding of various areas of comprehension” “Lots - the Burns and Roe and QRI provide data around RC, vocabulary, accuracy, and fluency! All support teachers to monitor growth and ability to generalize skills in connected, uncontrolled text.” “I find that error analysis of student performance to have the most significant impact on my instruction. I do find that the tool offers a general sense of growth by a student over time.” “concept of print, print awareness, sight words” “IRI's inform me as to where my students are in their literacy development and inform my daily teaching for skill and book groups.” “They let me know what level of texts my students are capable of reading with accuracy and comprehension. I use this information to make decisions about specific skills to teach as well as what books to use for instruction.” “Provides an accurate reading level which is crucial for instruction. Provides an opportunity to analyze a student's reading to see what strategies they are using to decode. Also tests a student's comprehension on an oral reading passage and shows if a student is self monitoring their reading.” “Allow us to create reading groups of children with similar reading abilities; allow us to design targeted instruction for students with similar needs” “A form of performance assessment with some level of standardization.” “The informal reading inventories are useful as a gauge to measure student benchmarks.”

145
What information do Informal Reading Inventories provide to the school or district “Support that is needed in the classroom environment” “instructional reading levels of texts, way to monitor progress that aligns with the actual classroom instruction” “It's depends on how they are used. In ARPS, they are used as F/W/S assessments, and in some cases in between to probe.” “General information about whether a child is progressing in their ability to read increasingly complex words and sentences. On a large scale this can be used as a screening tool to help us determine students who require a more in depth assessment and intervention.” “According to F & P, which students are "Below Grade level" “IRI's provide us with information in parent conferences and evaluative meetings about benchmarks that each student may have, or not have achieved. I give my BAS scores to the literacy coach three times a year and that data is recorded, so that student achievement can be monitored.” “Not sure” “Shows progress that students are making reading authentic books/texts instead of just looking at decodable words or just fluency. Gives a bigger picture of where students are in terms of literacy learning.” “Allows data analysis of how students meet grade-level standards across the building and/or district” “How students perform according to a certain standard.” “BAS and AIMSWEB assessments.” Other purposes? “State results” “Ability to interact with authentic text” “Allows for measurement of an individual reader's progress over time” “Ongoing assessment of ability and growth.” Do informal reading inventories provide you with information beyond what you already know from everyday observation of and interaction with your students?
Not at all 0.00%
Slightly 36.4% Somewhat 54.6% Very much so 9.1%
Consider the following purposes of assessment. According to your experience, to what extent do informal reading inventories fulfill this purpose?
Purpose Not at all Slightly Somewhat Very much so Agreement
Screening 0.0% 27.3% 18.2% 54.6% 2.3 Progress Monitoring 0.00% 27.3% 27.3% 45.5% 2.2 Measuring Student Outcomes 0.00% 27.3% 27.3% 45.5% 2.2
Diagnosis 0.0% 45.5% 18.2% 36.4% 1.9

146
Please consider the following questions related to your school’s reading programming. To what extent do informal reading inventories help teachers and schools answer each question?
Question Not at all Slightly Somewhat Very
much so Agreement
Which children are at risk for experiencing reading difficulties now and in the future?
0.0% 27.3% 36.4% 36.4% 2.1 Screening
2.1 Which children will need additional intervention to meet reading goals
0.0% 36.4% 18.2% 45.5% 2.1
Is intervention enabling children to make sufficient progress?
9.1% 27.3% 18.2% 45.5% 2.0 Progress
Monitoring 2.1
Are individual students on track for meeting end of year reading goals?
0.0% 18.2% 45.5% 36.4% 2.2
Is instruction working? 0.0% 27.3% 36.4% 36.4% 2.1 Is our reading program meeting the needs of students? 0.0% 36.4% 45.5% 18.2% 1.8
Measuring Outcomes
1.9
Did our students improve from last year? 0.0% 18.2% 45.5% 36.4% 2.2
How can we make our reading program better? 0.0% 54.6% 27.3% 18.2% 1.6
Are we making progress towards our goals? 0.0% 27.3% 45.5% 27.3% 2.0
As a school have we accomplished our literacy goals?
0.0% 27.3% 72.7% 0.0% 1.7
Which specific beginning reading skills has a student mastered or not mastered?
0.0% 45.5% 18.2% 36.4% 1.9
Which students have similar instructional needs and will form an appropriate group for instruction?
0.0% 36.4% 9.1% 54.6% 2.2 Diagnosis 1.8
Which intervention programs are most likely to be effective based on a student's skill profile?
9.1% 54.6% 18.2% 18.2% 1.5

147
Please indicate the degree to which you agree with each statement with respect to informal reading inventories administered according to district guidelines to first-grade students for the purpose of universal screening.
Question Strongly Agree Agree
Neither Agree nor Disagree
Disagree Strongly Disagree Unsure Agree-
ment
Timing and frequency is appropriate 18.2% 27.3% 27.3% 18.2% 0.0% 9.1% 2.5
Appropriateness for intended use
2.6
Constructs measured are relevant 9.1% 63.6% 0.0% 27.3% 0.0% 0.0% 2.5
Format and content have been validated by research 9.1% 63.6% 9.1% 9.1% 0.0% 9.1% 2.7 Contextually and developmentally appropriate 18.2% 36.4% 9.1% 36.4% 0.0% 0.0% 2.4 Measures skills indicative of later reading success 9.1% 54.6% 18.2% 18.2% 0.0% 0.0% 2.6
Format and items are appropriate 18.2% 36.4% 27.3% 18.2% 0.0% 0.0% 2.6
Alternate forms lead to comparable results 9.1% 36.4% 18.2% 9.1% 0.0% 27.3% 2.7
Technical Adequacy
2.3
Measurement is consistent over time 9.1% 45.5% 9.1% 27.3% 0.0% 9.1% 2.4
Scoring consistent across scorers 0.0% 27.3% 9.1% 54.6% 0.0% 9.1% 1.7
Correctly identifies most students at risk 10.0% 40.0% 40.0% 10.0% 0.0% 0.0% 2.5
Does not falsely identify students not at risk 9.1% 45.5% 18.2% 27.3% 0.0% 0.0% 2.4
Identification outcomes relevant to service delivery 27.3% 36.4% 18.2% 9.1% 0.0% 9.1% 3.1
Usability 2.4
Costs associated with the assessment are reasonable 9.1% 36.4% 27.3% 9.1% 0.0% 18.2% 2.2
Time commitment is reasonable 9.1% 36.4% 27.3% 18.2% 9.1% 0.0% 2.2
School personnel are able to administer 9.1% 63.6% 18.2% 9.1% 0.0% 0.0% 2.7
Teachers appreciate the benefits 9.1% 63.6% 0.0% 9.1% 9.1% 9.1% 2.6
Parents appreciate the benefits 0.0% 36.4% 27.3% 9.1% 9.1% 18.2% 2.1
Students appreciate the benefits 0.0% 18.2% 36.4% 0.0% 18.2% 27.3% 1.8
Resources available to collect/manage/interpret data 0.0% 63.6% 18.2% 9.1% 0.0% 9.1% 2.6
Teachers understand the implications of outcomes 9.1% 54.6% 9.1% 27.3% 0.0% 0.0% 2.5
Parents understand the implications of outcomes 0.0% 18.2% 27.3% 18.2% 9.1% 27.3% 1.8
Outcomes guide instruction/intervention 27.3% 45.5% 27.3% 0.0% 0.0% 0.0% 3.0
Improves student outcomes 10.0% 50.0% 30.0% 10.0% 0.0% 0.0% 2.6

148
Additional Comments: The timing and frequency of administration is appropriate “I feel BAS should be administered 2x a year (fall & winter) vs. 3x yr. (including spring)” "It's 3 times a year, with some probes given in between for students receiving intervention. They drive placement for intervention groups” “Given the tools - with not a lot of text options at each level - it can only be used a few times a year to really be reliable" “With some students, I assess more frequently” “Not sure that it makes sense to assess students at end of year and then again at beginning of year. Higher achieving students are usually at the same level if not higher and lower achieving and intervention students typically lose ground over the summer so much of BOY assessments is predictable if student has been in the district the previous year” The identification outcomes are relevant to the service delivery needs of students “Helps to plan for targeted skill instruction” “Sometimes - it depends on the practitioner” “Many students cannot demonstrate growth because they cannot access the earliest passage contain a wide variety of phonetic concepts” The constructs that are being measured are relevant for determining first-graders’ risk of later reading difficulties “Not necessarily...” “The beginning passages assume knowledge of a variety of syllable types and a variety of long and short vowel sounds. They also contain some multisyllabic words. Many students are unable to access these reading passages and would be better served monitoring growth on passages that contain decoding skills that are typically taught” The format and content have been validated in previous research Just the authors' research.... The assessment is contextually and developmentally appropriate for your school’s population of first-graders “Not for all bilingual learners or students with limited opportunities” Alternate forms of this assessment lead to comparable results “Fiction v. non-fiction?” “alternative forms of text are few for each level" Measurement is consistent over time “This tool allows for some level of subjectivity by assessors” Scoring is consistent across scorers “It can be highly subjective” “Not sure this is the case” The assessment does not incorrectly identify students who are not at risk “At early levels it may” The assessment measures important first-grade reading skills that are indicative of later reading achievement “Does not include decodable text, which is the backbone of the first-grade curriculum at this school. Sometimes” The assessment format and items are appropriate “Text structures do not always match what's been taught in the classroom”

149
“Reading connected text and demonstrating comprehension is one part of analyzing a child's skills” The costs associated with the assessment are reasonable “The assessment takes a long time to administer. However, I do think it is important that reading of connected text is part of an assessment menu to allow for analysis of generalization of discrete skills and a student's use of context cues” The time commitment associated with the assessment is reasonable “The time spent is necessary but takes a huge amount of time each year” School personnel are able to administer the assessment “We would like to see the classroom teachers receive more help with this” Teachers appreciate the benefits associated with the assessment “Teachers across the district rely heavily on these scores” Parents appreciate the benefits associated with the assessment “When given a chart that explains what the levels mean” Resources are available to collect, manage, and interpret assessment data “Literacy specialists in all buildings" Teachers understand the implications associated with assessment outcomes “I am not sure but my guess is that teachers have a wide continuum of ability in understanding the implications of the data and how to use the data gathered to instruct” Outcomes are useful for guiding instruction/intervention “They can be - depends on the practitioner” “Data is more useful to more skilled teachers is my guess” Additional comments regarding the use of informal reading inventories: “A more formal training should be had with New Hires” “I answered these questions with respect to the DRA/BAS, not the Burns and Roe/QRI. From my perspective, there are notable differences between the two sets of tools” “My understanding from coursework is that the BAS is meant to be used no more than twice a year (beginning/end) to assess progress over a year. This is due to the limited number of titles available at each reading level (2). I'm concerned that we use the BAS three times a year, diluting the quantity of books available. It also requires a large time commitment mid-year when little instruction can take place. I think it would be beneficial to find a less time-consuming method of determining students' reading progress mid-year”

150
Early Literacy Curriculum Based Measurement
Have you participated in professional development related to the administration of interpretation of early literacy curriculum based measurement?
Yes 72.73% No 27.27%
If yes, please briefly describe this training." “In-house, informal training” “Training of Aimsweb from district reading specialist “ “I participated in explicit instruction on administration of DIBELS. Follow up work was done by trainers to check in on our administration practices and questions” “PD one day” “We were trained in Aimsweb administration when the district began using it about 5 years ago” “Yes - AIMSweb training offered by the company to district employees” “Aimsweb training took place this fall” Have you personally administered early literacy curriculum based measurement to first-graders?
Yes 81.82% No 18.18% Unsure 0.00%
We are interested in understanding why teachers and schools administer early literacy curriculum based measurement. Please answer the following: What information does early literacy based measurement provide to you as a teacher? “Instruction” “normed results” “Diagnostic information to drive instruction” “These CBM's provide information that allows for identification of students who are at risk of reading difficulties due to phonological processing. The screeners provide information on phonological awareness, RAN, blending and segmenting, and connected text reading skills.” “students at risk, student growth towards norms, overall outcomes of literacy instruction on student growth” “We can see how the students perform on particular individual reading skills, as opposed to whole reading tasks” “As I understand it, Aimsweb is a screener used to sort out students who might need intervention” “Shows how quickly a student can process which does not aide in early literacy instruction” “students' ability to name letters and letter sounds in a timed setting” “performance assessment” What information does early literacy based measurement provide to the school or district? “Support” “normed results” “same (diagnostic information to drive instruction); and allows for data to drive intervention groupings” “Critical information allowing us to identify kids at risk early and plan for effective intervention to address phonological awareness and decoding/encoding skill development” “trends in data; growth, skill deficits of population, ELL norms” “Student performance percentiles and comparisons from month to month within a grade level and year to year as class groups change” “I believe they may use it to measure if the phonetic programs are working” “rank ordering of students based on ability to complete subtests” “school district performance”

151
Other purposes? “State Results” “Title 1 funding :)” “Helps guide instruction and provides progress monitoring data” “used to determine students who qualify for intervention, for progress monitoring of students in intervention (sometimes SE as well)” “way to measure student progress/growth” Does early literacy curriculum based measurement provide you with information beyond what you already know from everyday observation of and interaction with your students?
Not at all 18.18% Slightly 0.00% Somewhat 54.55% Very much so 27.27%
Consider the following purposes of assessment. According to your experience, to what extent does early literacy curriculum based measurement fulfill this purpose?
Purpose Not at all Slightly Somewhat Very much so Agreement
Screening 0.0% 18.2% 27.3% 54.6% 2.4 Progress Monitoring 0.0% 9.1% 63.6% 27.3% 2.2 Measuring Student Outcomes 0.0% 45.5% 45.5% 9.1% 1.6 Diagnosis 18.2% 45.5% 27.3% 9.1% 1.3

152
Please consider the following questions related to your school’s reading programming. To what extent does early literacy curriculum based measurement help teachers and schools answer each question?"
Question Not at all Slightly Somewhat Very
much so Agreement
Which children are at risk for experiencing reading difficulties now and in the future?
0.0% 27.3% 36.4% 36.4% 2.1 Screening
2.2 Which children will need additional intervention to meet reading goals
0.0% 9.1% 54.6% 36.4% 2.3
Is intervention enabling children to make sufficient progress?
0.0% 36.4% 54.6% 9.1% 2.1 Progress
Monitoring 1.9
Are individual students on track for meeting end of year reading goals?
0.0% 18.2% 54.6% 27.3% 1.9
Is instruction working? 0.0% 27.3% 54.6% 18.2% 1.7 Is our reading program meeting the needs of students? 0.0% 54.6% 36.4% 9.1% 1.8
Measuring Outcomes
1.7
Did our students improve from last year? 0.0% 27.3% 54.6% 18.2% 2.2
How can we make our reading program better? 18.2% 45.5% 18.2% 18.2% 1.6
Are we making progress towards our goals? 9.1% 18.2% 45.5% 27.3% 2.0
As a school have we accomplished our literacy goals?
9.1% 36.4% 45.5% 9.1% 1.7
Which specific beginning reading skills has a student mastered or not mastered?
0.0% 36.4% 54.6% 9.1% 1.9
Which students have similar instructional needs and will form an appropriate group for instruction?
9.1% 27.3% 36.4% 27.3% 2.2 Diagnosis 1.7
Which intervention programs are most likely to be effective based on a student's skill profile?
9.1% 18.2% 72.7% 0.0% 1.5

153
Please indicate the degree to which you agree with each statement with respect to early literacy CBM administered according to district guidelines to first-grade students for the purpose of universal screening.
Question Strongly Agree Agree
Neither Agree nor Disagree
Disagree Strongly Disagree Unsure Agreement
Timing and frequency is appropriate 18.2% 54.6% 18.2% 9.1% 0.0% 0.0% 3.0
Appropriateness for intended use
2.7
Constructs measured are relevant 20.0% 50.0% 30.0% 0.0% 0.0% 0.0% 2.9 Format and content have been validated by research 18.2% 36.4% 18.2% 0.0% 0.0% 27.3% 3.0 Contextually and developmentally appropriate 18.2% 27.3% 27.3% 18.2% 9.1% 0.0% 2.3 Measures skills indicative of later reading success 18.2% 54.6% 9.1% 18.2% 0.0% 0.0% 2.7 Format and items are appropriate 18.2% 36.4% 18.2% 27.3% 0.0% 0.0% 2.5 Alternate forms lead to comparable results 18.2% 27.3% 18.2% 0.0% 0.0% 36.4% 3.0
Technical Adequacy
2.5
Measurement is consistent over time 18.2% 54.6% 9.1% 18.2% 0.0% 0.0% 2.7 Scoring consistent across scorers 9.1% 72.7% 18.2% 0.0% 0.0% 0.0% 2.8 Correctly identifies most students at risk 0.0% 63.6% 18.2% 18.2% 0.0% 0.0% 2.4 Does not falsely identify students not at risk 0.0% 9.1% 27.3% 54.6% 9.1% 0.0% 1.4
Identification outcomes relevant to service delivery 9.1% 63.6% 9.1% 9.1% 0.0% 9.1% 2.8
Usability 2.2
Costs associated with the assessment are reasonable 18.2% 18.2% 9.1% 9.1% 0.0% 45.5% 2.8 Time commitment is reasonable 27.3% 36.4% 0.0% 18.2% 18.2% 0.0% 2.4 School personnel are able to administer 27.3% 45.5% 9.1% 18.2% 0.0% 0.0% 2.8 Teachers appreciate the benefits 9.1% 18.2% 18.2% 27.3% 9.1% 18.2% 1.9 Parents appreciate the benefits 0.0% 9.1% 27.3% 27.3% 9.1% 27.3% 1.5 Students appreciate the benefits 0.0% 0.0% 9.1% 45.5% 18.2% 27.3% 0.9 Resources available to collect/manage/interpret data 9.1% 72.7% 9.1% 0.0% 0.0% 9.1% 3.0 Teachers understand the implications of outcomes 9.1% 63.6% 9.1% 18.2% 0.0% 0.0% 2.6 Parents understand the implications of outcomes 0.0% 9.1% 27.3% 27.3% 9.1% 27.3% 1.5 Outcomes guide instruction/intervention 18.2% 36.4% 18.2% 18.2% 9.1% 0.0% 2.4 Improves student outcomes 18.2% 18.2% 27.3% 18.2% 9.1% 9.1% 2.2

154
Additional Comments: The timing and frequency of administration is appropriate “Benchmarking is appropriate. Monitoring every two weeks does not seems as informative as other monitoring measures that directly align to the specific targeted reading skill for each student” “I think the data is useful for identifying at risk students, but the data meetings hinder our actual start date of skill and book groups” The identification outcomes are relevant to the service delivery needs of students “They can be” “I use this data in my own instruction and progress monitoring but I am not clear on how it is used by others in the district” The constructs that are being measured are relevant for determining first-graders’ risk of later reading difficulties “Yes - NWF probes are quite helpful when predicting future decoding skills” “Some of the skill tests are helpful while others are not” The format and content have been validated in previous research “By the authors' research...” The assessment is contextually and developmentally appropriate for your school’s population of first-graders “No real context given” Measurement is consistent over time “Depends on the practitioners” Scoring is consistent across scorers “I believe this to be true when explicit instruction on the tool has been provided to all teachers” The assessment does not incorrectly identify students who are not at risk “Some students may not perform consistent with their skills. Given that this tool is a screener or progress monitoring tool, other data is always available to analyze when a child's performance is a surprise” The assessment measures important first-grade reading skills that are indicative of later reading achievement “It does, but the assessment measures that are used at this school only measure a small part of a student's reading profile (nonsense word reading). It does not seem to closely align with guided reading at a student’s instructional level” “These CBM tools provide critical information about the most basic building blocks of reading” The costs associated with the assessment are reasonable “District-level adoption” “The testing time interrupts direct services to students several times a year for a significant period of time” School personnel are able to administer the assessment “Aims web- Reading interventionist; Bas- all teachers and RI” “The Intervention team is responsible for testing the entire school. Very time consuming and intervention groups have to be cancelled for at least a week if not more” Teachers appreciate the benefits associated with the assessment “Not always – “ “I get the sense that some people either do not believe these measures are valid or they are unclear about the connection between these skills and student outcomes (not clear about research on development of basic reading skills)”

155
Parents appreciate the benefits associated with the assessment “I am not sure parents generally understand these measures” Students appreciate the benefits associated with the assessment “Depends on how this information is used and shared. My students graph their performance on ORF every 2 weeks to assess and celebrate growth” Resources are available to collect, manage, and interpret assessment data “There is a literacy specialist in each building” Teachers understand the implications associated with assessment outcomes “I do not think enough people understand the implications” Outcomes are useful for guiding instruction/intervention “Useful for grouping and PM” Please use the box below to note any additional comments regarding the use of early literacy curriculum based measurement) in your district. “The timed nature of these tests distorts the ability to measure a student's ability vs. ability to do timed tests. Oral reading passages are not written to grade-level standards (much harder.) ELL students are not accommodated in any way”

156
For the purpose of screening (determining which students are at risk for developing reading difficulties so that they can be provided with additional instruction), how valuable is each of the following sources of fall 1st grade data?
Question Very valuable
Somewhat valuable
Slightly valuable
Not at all valuable Unsure Agreement
Fall LNF 72.7% 18.2% 0.0% 9.1% 0.0% 2.5
Fall LSF 63.6% 36.4% 0.0% 0.0% 0.0% 2.6
Fall PSF 63.6% 18.2% 0.0% 9.1% 9.1% 2.5
Fall NWF 27.3% 36.4% 18.2% 9.1% 9.1% 1.9
Fall BAS or DRA level 45.5% 27.3% 27.3% 0.0% 0.0% 2.2
Fall Teacher Judgement 36.4% 36.4% 18.2% 0.0% 9.1% 2.2 For the purpose of screening (determining which students are at risk for developing reading difficulties so that they can be provided with additional instruction), how valuable is each of the following sources of winter 1st grade data?
Question Very valuable
Somewhat valuable
Slightly valuable
Not at all valuable Unsure Agreement
Winter PSF 72.7% 18.2% 0.0% 9.1% 0.0% 2.5 Winter NWF 54.6% 36.4% 9.1% 0.0% 0.0% 2.5 Winter ORF 36.4% 54.6% 9.1% 0.0% 0.0% 2.3 Winter BAS or DRA level 54.6% 18.2% 27.3% 0.0% 0.0% 2.3 Winter Teacher Judgement 63.6% 27.3% 0.0% 0.0% 9.1% 2.7

157
APPENDIX E
HISTOGRAMS OF VARIABLES
Histograms of First-Grade Screeners and Third-Grade Outcomes (Cohort 1)
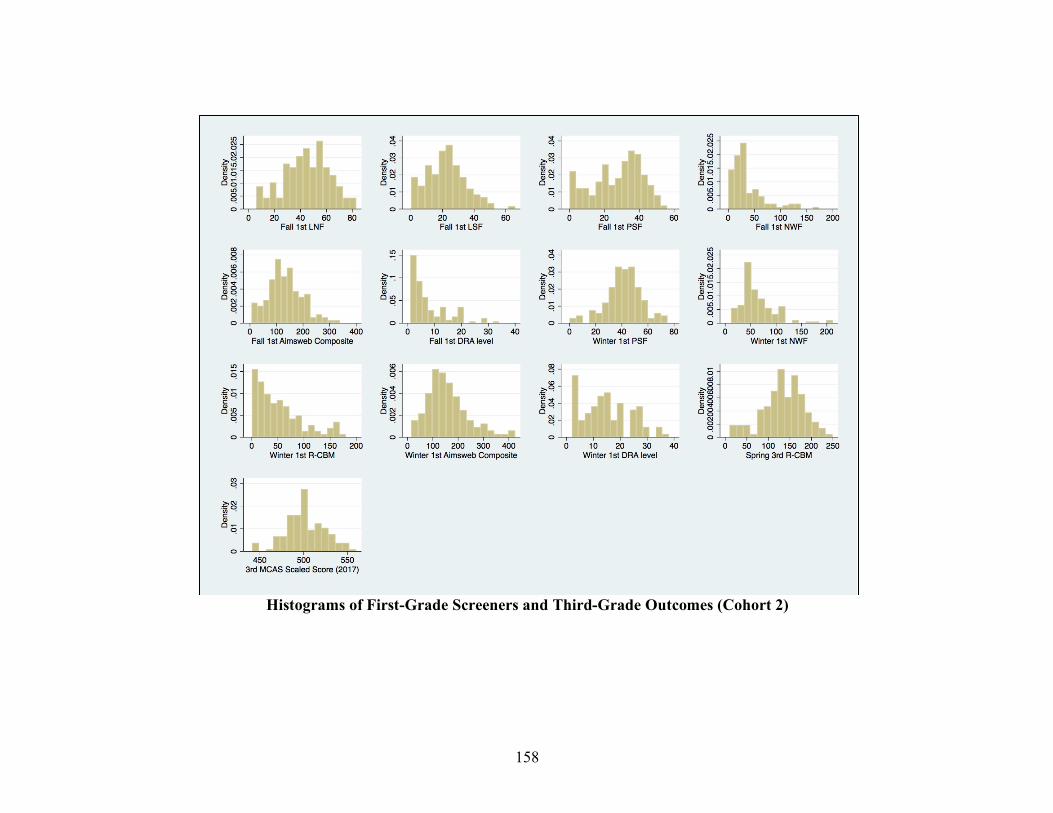
158
Histograms of First-Grade Screeners and Third-Grade Outcomes (Cohort 2)

159
APPENDIX F
SCATTERPLOTS OF VARIABLES
Scatterplots of Fall First-Grade Screeners and Third-Grade Outcomes (Cohort 1)

160
Scatterplots of Fall First-Grade Screeners and Third-Grade Outcomes (Cohort 2)

161
Scatterplots of Winter First-Grade Screeners and Third-Grade Outcomes (Cohort 1)

162
Scatterplots of Winter First-Grade Screeners and Third-Grade Outcomes (Cohort 2)

163
REFERENCES
Adams, M. J. (1998). The three-cueing system. In J. Osborn & F. Lehr (Eds.), Literacy for all: Issues in teaching and learning (pp. 73-99). New York, NY, US: Guilford Press.
AERA, APA, & NCME (2014). Standards for educational and psychological testing.
Washington, D.C.: Author. Annie E. Casey Foundation. (2010). EARLY WARNING! Why reading by the end of third-
grade matters. A KIDS COUNT Special Report. Baltimore, MD. Annie E. Casey Foundation.
Arthaud, T. J., Vasa, S. F., & Steckelberg, A. L. (2000). Reading assessment and
instructional practices in special education. Diagnostique, 25, 205–228. Ball, C. R. and Christ, T. J. (2012), Supporting valid decision making: Uses and misuses
of assessment data within the context of RTI. Psychology in the Schools, 49, 231-244. doi:10.1002/pits.21592
Ball, C. R., & O’Connor, E. (2016). Predictive utility and classification accuracy of oral
reading fluency and the measures of academic progress for the Wisconsin Knowledge and Concepts Exam. Assessment for Effective Intervention, 41(4), 195–208. doi:10.1177/1534508415620107
Betts, E. A. (1946). Foundations of reading instruction, with emphasis on differentiated
guidance. New York: American Book Company. Burns, M. K., Haegele, K., Petersen-Brown, S. (2014). Screening for early reading skills:
Using data to guide resources and instruction. In Kettler R. J., Glover T. A., Albers C. A., Feeney-Kettler K. A. (Eds.), Universal screening in educational settings: Evidence-based decision making for schools (pp. 171–197). Washington, DC: American Psychological Association. http://dx.doi.org/10.1037/14316-007
Cambourne, B., & Turbill, J. (1990). Assessment in whole language classrooms: Theory
into practice. Elementary School Journal, 90, 337-349. https://doi.org/10.1086/461622
Cartledge, G., Yurick, A., Singh, A. H., Keyes, S. E., & Kourea, L. (2011). Follow-up
study of the effects of a supplemental early reading intervention on the reading/disability risk of urban primary learners. Exceptionality, 19(3), 140-159. https://doi.org/10.1080/09362835.2011.562095

164
Catts, H. W., Petscher, Y., Schatschneider, C., Bridges, M. S., Mendoza, K. (2009). Floor effects associated with universal screening and their impact on the early identification of reading disabilities. Journal of Learning Disabilities, 42(2), 163-176. https://doi.org/10.1177/0022219408326219
Chall, J. S. (1967). Learning to read: The great debate. New York: McGraw-Hill. Chall, J. S. (1996). Stages of reading development (2nd ed.). Fort Worth: Harcourt Brace
Jovanovic College Publishers. Christ, T. J., Nelson, P. M. (2014). Developing and evaluating screening systems:
Practical and psychometric considerations. In Kettler, R. J., Glover, T. A., Albers, C. A., Feeney-Kettler, K. A. (Eds.), Universal screening in educational settings: Evidence-based decision making for schools (79-110). Washington, DC: American Psychological Association. doi:10.1037/14316-004
Clemens, N. H., Shapiro, E. S., & Thoemmes, F. (2011). Improving the efficacy of first-
grade reading screening: An investigation of word identification fluency with other early literacy indicators. School Psychology Quarterly, 26(3), 231-244. doi: 10.1037/a0025173
Compton, D. L., Fuchs, D., Fuchs, L. S., & Bryant, J. D. (2006). Selecting at-risk readers
in first-grade for early intervention: a two-year longitudinal study of decision rules and procedures. Journal of Educational Psychology, 98(2), 394–409. doi:10.1037/0022-0663.98.2.394
Compton, D. L., Fuchs, D., Fuchs, L. S., Bouton, B., Gilbert, J. K., Barquero, L. A., . . .
Crouch, R. C. (2010). Selecting at-risk first-grade readers for early intervention: Eliminating false positives and exploring the promise of a two-stage gated screening process. Journal of Educational Psychology, 102(2), 327-340. doi: 10.1037/a0018448
Coyne, M. D. and Harn, B. A. (2006), Promoting beginning reading success through
meaningful assessment of early literacy skills. Psychology in the Schools., 43, 33–43. doi:10.1002/pits.20127
Coyne, M. D., Kame'enui, E. J., Simmons, D. C., & Harn, B. A. (2004). Beginning
reading intervention as inoculation or insulin: First-grade reading performance of strong responders to kindergarten intervention. Journal of Learning Disabilities, 37(2), 90-104. doi: 10.1177/00222194040370020101
Creswell, J. W., Plano Clark, V. L., Gutmann, M. L. & Hanson, W. E. (2003). Advanced
mixed methods research designs. In A. Tashakkori and C. Teddlie (Eds.), Handbook on mixed methods in the behavioral and social sciences (209-240). Thousand Oaks, CA: Sage Publications

165
Deno, S. L. (2003). Developments in curriculum-based measurement. Journal of Special Education, 37, 184-192. doi:10.1177/00224669030370030801
Deno S.L., & Mirkin, P.K. (1977). Data-based program modification: A manual. Reston,
VA: Council for Exceptional Children. Dewey, E. N., Powell-Smith, K. A., Good, R. H., Kaminski, R. A. (2015) DIBELS Next
technical adequacy brief. Eugene, OR: Dynamic Measurement Group, Inc. Dynamic Measurement Group (2010) DIBELS® Next benchmark goals and composite
score. Retrieved from: https://dibels.uoregon.edu/docs/DIBELSNextFormerBenchmarkGoals.pdf
Edelsky, C., Altwerger, B. & Flores, B. (1991). Whole language: What's the difference?
Portsmouth, NH: Heinemann. Elliott, J., Lee, S. W., & Tollefson, N. (2001). A reliability and validity study of the
Dynamic Indicators of Basic Early Literacy Skills Modified. School Psychology Review, 30, 33–49.
Ehri, L.C. (1987) Learning to read and spell words. Journal of Reading Behavior, 19, 5-
31. Ehri L. C. (2005). Development of sight word reading: Phases and findings, in Snowling
M. J. 7 Hulme, C., (Eds.), The science of reading: A handbook (135-154). Malden, MA: Blackwell
Farrall, M. L. (2012). Reading assessment: Linking language, literacy, and cognition.
Hoboken, NJ: John Wiley & Sons. doi: 10.1002/9781118092668 Flesch, R. F. (1955). Why Johnny can’t read? And what you can do about it. New York,
NY: Harper Collins. Fletcher, J. M., & Vaughn, S. (2009). Response to intervention: Preventing and
remediating academic difficulties. Child Development Perspectives, 3(1), 30-37. doi: 10.1111/j.1750-8606.2008.00072.x
Ford, M. P., & Opitz, M. F. (2008). A national survey of guided reading practices: What
we can learn from primary teachers. Literacy Research and Instruction, 47(4), 309-331. doi: 10.1080/19388070802332895
Foorman, B. R., Francis, D. J., Fletcher, J. M., Schatschneider, C., & Mehta, P. (1998).
The role of instruction in learning to read: Preventing reading failure in at-risk children. Journal of Educational Psychology, 90(1), 37-55. doi:10.1037//0022-0663.90.1.37

166
Fountas, I. C., & Pinnell, G. S. (2010). Benchmark Assessment System (2nd ed.) Portsmouth, NY: Heinemann.
Fountas, I. C., & Pinnell, G. S. (2012). Guided reading: The romance and the reality. The
Reading Teacher, 66(4), 268-284. doi: 10.1002/TRTR.01123 Fuchs, D., Mock, D., Morgan, P. L., & Young, C. L. (2003). Responsiveness-to-
intervention: Definitions, evidence, and implications for the learning disabilities construct. Learning Disabilities Research and Practice, 18, 157–171. doi: 10.1111/1540-5826.00072
Fuchs, D., Fuchs, L, Compton, D. (2012) SMART RTI: Next generation approach to
multilevel prevention. Exceptional Children, 78(3), 23-279. doi: 10.1177/001440291207800301
Fuchs, L. S., Fuchs, D., Hosp, M. K., & Jenkins, J. R. (2001). Oral reading fluency as an
indicator of reading competence: A theoretical, empirical, and historical analysis. Scientific Studies of Reading, 5, 239-256. doi: 10.1207/S1532799XSSR0503_3
Glover, T. A., & Albers, C. A. (2007). Considerations for evaluating universal screening
assessments. Journal of School Psychology, 45(2), 117-135 doi: 10.1016/j.jsp.2006.05.005
Goffreda, C., Diperna, J, & Pedersen, J. (2009). Preventive screening for early readers:
predictive validity of the Dynamic Indicators of Basic Early Literacy Skills (DIBELS). Psychology in the Schools, 46(6), 539-552. doi: 10.1002/pits.20396
Good, R. H., Simmons, D. C., & Kame’enui, E. J. (2001). The importance and decision-
making utility of a continuum of fluency-based indicators of foundational reading skills for third-grade high-stakes outcomes. Scientific Studies of Reading 5(3), 257-288. doi: 10.1207/S1532799XSSR0503_4
Goodman, K. (1967). Reading: A psycholinguistic guessing game. Journal of the
Reading Specialist, May, 126-135. Goodman, K.S. (1969). Analysis of oral reading miscues: Applied psycholinguistics.
Reading Research Quarterly, 5, 9-30. Goodman, K. S. (1986). What's whole in whole language? Portsmouth, NH: Heinemann
Educational Books. Goodman, K. (2006). The truth about DIBELS: What it is, what it does. Portsmouth, NH:
Heinemann. Gough, P. B., & Tunmer, W. E. (1986). Decoding, reading, and reading disability.
Remedial and Special Education, 7, 6-10.

167
Hintze, J. M., Ryan, A. L., & Stoner, G. (2003) Concurrent validity and diagnostic
accuracy of the DIBELS and the CTOPP. School Psychology Review, 32(4). Hintze, J. M., & Silberglitt, B. (2005). A longitudinal examination of the diagnostic
accuracy and predictive validity of R-CBM and high-stakes testing. School Psychology Review, 34, 372-386.
Hosp, J. L., Hosp, M. K., & Dole, J. A. (2011). Potential bias in predictive validity of
universal screening measures across disaggregation subgroups. School Psychology Review, 40(1), 108-131.
Hsieh, H. F., & Shannon, S.E. (2005). Three approaches to qualitative content analysis.
Qualitative Health Research, 15(9), 1277-1288. doi: 10.1177/1049732305276687 Individuals with Disabilities Education Act, 20 U.S.C. § 1400 (2004) Jenkins, J. R., Hudson, R. F., & Johnson, E. S. (2007). Screening for at-risk readers in a
response to intervention framework. School Psychology Review, 36(4), 582-600. Johnson, E. S., Jenkins, J. R., Petscher, Y., & Catts, H. W. (2009). How can we improve
the accuracy of screening instruments? Learning Disabilities Research & Practice, 24, 174–185. doi:10.1111/j.1540-5826.2009.00291.x
Johnson, M. S., Kress, R. A., & Pikulski, J. J. (1987). Informal Reading Inventories
(Second Edition). Newark, DE: International Reading Association. Johnson, R. B., & Turner, L. A. (2003). Data collection strategies in mixed methods
research. In A. Tashakkori, and C. Teddlie (Eds.), Handbook of mixed methods in social and behavioral research (297-319). Thousand Oaks, CA: Sage.
Juel, C. (1988). Learning to read and write: A longitudinal study of fifty-four children
from first through fourth grade. Journal of Educational Psychology, 80, 437-447. Kame’enui, E. J. (2000). Final report on the analysis of reading assessment instruments
for K-3. Retrieved from http://preview.pittsdrivered.org/files/exec_summary%20evals.pdf
Kaminski, R. A., & Good, R. H. (1998). Assessing early literacy skills in a problem
solving model: Dynamic Indicators of Basic Early Literacy Skills. In M. R. Shinn (Ed.), Advanced applications of Curriculum-Based Measurement (113-142). New York: Guilford
Kaminski, R. A., Good, R. H., Baker, D., Cummings, K., Dufour-Martel, C. Petersen K.,
… Wallin, J. (2007). Position Paper on “The Truth About DIBELS”. Eugene, OR: Dynamic Measurement Group.

168
Kane, M. T. (2013). Validating the interpretations and uses of test scores. Journal of
Educational Measurement, 50(1), 1-73. doi:10.1111/jedm.12000 Keller-Margulis, M. A., Shapiro E. S., Hintze J. M. (2008). Long term diagnostic
accuracy of curriculum-based measures in reading and mathematics. School Psychology Review, 37(3), 374–390.
Kettler, R. J., Glover, T. A., Albers C. A., Feeney-Kettler, K. A. (Eds.) (2014). Universal
screening in educational settings: Evidence-based decision making for schools Washington, D.C.: American Psychological Association.
Klingbeil, D. A., McComas, J. J., Burns, M. K., & Helman, L. (2015). Comparison of
predictive validity and diagnostic accuracy of screening measures in reading skills. Psychology in the Schools, 52, 500-514. doi: 10.1002/pits.21839
Krippendorff, K. (2013). Content analysis (3rd ed.). Thousand Oaks, CA: Sage
Publications. LaBerge, D., & Samuels, S.J. (1974). Toward a theory of automatic information
processing in reading. Cognitive Psychology, 6, 293-323 Lembke, E. S., McMaster, K. L., & Stecker, P. M. (2010). The prevention science of
reading research within a response-to-intervention model. Psychology in the Schools, 47(1), 22-35. doi: 10.1002/pits.20449
Marcotte, A. M., Clemens, N. H., Parker, C., & Whitcomb, S. A. (2016). Examining the
classification accuracy of a vocabulary screening measure with preschool children. Assessment for Effective Intervention, 41(4), 230-242. doi:10.1177/1534508416632236
Massachusetts Department of Elementary and Secondary Education. (2015). 2015 MCAS
and MCAS-Alt Technical Report. Retrieved from: http://www.mcasservicecenter.com/documents/MA/Technical%20Report/2015/2015%20MCAS%20%20MCAS%20Alt%20Tech%20Report.pdf
Massachusetts Department of Elementary and Secondary Education. (2017a). 2017
English Language Arts and Literacy Framework. Retrieved from: http://www.doe.mass.edu/frameworks/ela/2017-06.pdf
Massachusetts Department of Elementary and Secondary Education. (2017b).
Understanding the Next Generation MCAS. [PowerPoint Slides]. Retrieved from http://www.doe.mass.edu/mcas/parents/understand-nextgen.pptx.
McCarthy, A. M. & Christ, T. J. (2010) The Developmental Reading Assessment-Second
Edition (DRA2). Assessment for Effective Intervention, 35(3) 182-185.

169
McGlinchey, M. T., & Hixon, M. D. (2004). Using curriculum-based measurement to
predict performance on state assessments in reading. School Psychology Review, 33, 193-203.�
McKenna, M. C., & Stahl, K. A. D. (2009). Assessment for reading instruction. New
York: Guilford Press. Mellard, D., McKnight, M., & Woods, K. (2009). Response to intervention screening and
progress-monitoring practices in 41 local schools. Learning Disabilities Research and Practice, 24, 186–195.�
Moats, L. (2000). Whole language lives on: The illusion of “balanced” reading
instruction. New York: Thomas B. Fordham Foundation. National Association of School Psychologists. (2009). School psychologists’ involvement
in assessment (Position Statement). Bethesda, MD: Author. National Center on Intensive Intervention (2014). Academic screening tools chart.
Washington, DC: U.S. Department of Education, Office of Special Education Programs, National Center on Intensive Intervention. Retrieved from http://www.rti4success.org/resources/tools-charts/screening-tools-chart
National Center on Response to Intervention. (2010). Essential components of RTI: A
closer look at Response to Intervention. Retrieved from http://www.rti4success.org/sites/default/files/rtiessentialcomponents_042710.pdf
National Institute of Child Health and Human Development. (2000). Report of the
National Reading Panel. Teaching children to read: an evidence-based assessment of the scientific research literature on reading and its implications for reading instruction: Reports of the subgroups (NIH Publication No. 00-4754). Washington, DC: U.S. Government Printing Office.
Nelson, J. M. (2008). Beyond correlational analysis of the Dynamic Indicators of Basic
Early Literacy Skills (DIBELS): A classification validity study. School Psychology Quarterly, 23, 542–552. doi:10.1037/a0013245
No Child Left Behind Act of 2001, P.L. 107-110 Nilsson, N. L. (2013a). Introduction to using informal reading inventories in research and
practice. Reading & Writing Quarterly, 29(3), 203-207. doi:10.1080/10573569.2013.789778
Nilsson, N. L. (2013b). The reliability of informal reading inventories: What has
changed? Reading and Writing Quarterly, 29(3), 208–230.

170
Paris, S. G. (2002). Measuring children’s reading development using leveled texts. The Reading Teacher, 56, 168–170.
Paris, S. G., & Carpenter, R. D. (2003). FAQs about IRIs. The Reading Teacher, 56(6),
578–580. Parisi, D. M., Ihlo, T., Glover, T. A. (2014). Screening within a multi-tiered early
prevention model: Using assessment to inform instruction and promote students’ response to intervention. In Kettler, R. J., Glover, T. A., Albers, C. A., & Feeney-Kettler, K. (Eds.). Universal screening in educational settings: Evidence-based decision making for schools. Washington, DC: American Psychological Association.
Parker, D. C., Zaslofsky, A. F., Burns, M. K., Kanive, R., Hodgson, J., Scholin, S. E., &
Klingbeil, D. A. (2015). A brief report of the diagnostic accuracy of oral reading fluency and reading inventory levels for reading failure risk among second- and third-grade students. Reading & Writing Quarterly, 31(1), 56-67. doi:10.1080/10573569.2013.857970
Pearson, D. (1976). A psycholinguistic model of reading. Language Arts, 53, 309–314. Pearson (2011a). The Developmental Reading Assessment–Second Edition (DRA2). Pearson (2011b) AIMSweb Default Cut Scores Explained. Retrieved from
http://www.aimsweb.com/wpcontent/uploads/AIMSweb_Default_Cut_Score_Guide.pdf
Pearson (2011c) Developmental Reading Assessment-Second Edition K-8 Technical
Manual. Retrieved from http://assets.pearsonschool.com/asset_mgr/current/20139/DRA2_Technical_Manual_2012.pdf
Pearson (2012a). Aimsweb Test of Early Literacy Administration and Scoring Guide.
Retrieved from http://www.aimsweb.com/wp-content/uploads/tel_admin_scoring-guide_2.0.pdf
Pearson (2012b) Aimsweb ELL Profile Reports and Norms Development Guide
Retrieved from https://www.aimsweb.com/wp-content/uploads/ELL_Profile_Reports_and_Norms_Development_Guide.pdf
Pearson (2012c). Aimsweb Technical Manual. Retrieved from
https://www.aimsweb.com/wp-content/uploads/aimsweb-technical-manual.pdf Pearson (2014). Aimsweb: http://www.aimsweb.com.

171
Pearson (2015) Aimsweb Plus Technical Manual Retrieved from https://cdn2.hubspot.net/hubfs/559254/Pearson%20CAP/aimswebTechResources/aimswebPlus-TechnicalManual.pdf?t=1508260912467
Pikulski, J. J. (1974). A critical review: Informal reading inventories. The Reading
Teacher, 28, 141–151. Pinnell, G. S. and Fountas, I. C. (2010). Research Base for Guided Reading as an
Instructional Approach Scholastic. Retrieved from http://emea.scholastic.com/sites/default/files/GR_Research_Paper_2010_3.pdf
Powell, H., Mihalas, S., Onwuegbuzie, A. J., Suldo, S., & Daley, C. E. (2008). Mixed
methods research in school psychology: A mixed methods investigation of trends in the literature. Psychology in the Schools, 45(4), 291-309. doi:10.1002/pits.20296
Riedel, B. W. (2007). The relation between DIBELS, reading comprehension, and
vocabulary in urban first-grade students. Reading Research Quarterly, 42, 546– 567.
Ritchey, K. D., & Speece, D. L. (2004). Early identification of reading disabilities:
Current status and new directions. Assessment for Effective Intervention, 29(4), 13-24. doi:10.1177/073724770402900404
Roth, F. P., Speece, D. L., & Cooper, D. H. (2002). A longitudinal analysis of the
connection between oral language and reading. Journal of Educational Research, 95, 259–272.
Salvia, J., & Ysseldyke, J. E. (2004). Assessment (9th ed.). Boston: Houghton-Mifflin. Scarborough, H. S. (2001). Connecting early language and literacy to later reading (dis)
abilities: Evidence, theory, and practice. In S. Neuman & D. Dickinson (Eds.), Handbook for research in early literacy (97-110). New York: Guilford Press.
Shapiro, E. S., Keller, M. A., Lutz, J. G., Santoro, L. E., & Hintze, J. M. (2006).
Curriculum- based measures and performance on state assessment and standardized tests. Journal of Psychoeducational Assessment, 24, 9–35.
Shaw, R., & Shaw, D. (2002). DIBELS oral reading fluency-based indicators of third-
grade reading skills for Colorado State Assessment Program (CSAP) (Technical Report). Eugene: University of Oregon Press.
Shinn, M. R. (Ed.) (1989). Curriculum-based measurement: Assessing special children.
New York: Guilford.

172
Silberglitt, B., & Hintze, J. M. (2005). Formative assessment using CBM-R cut scores to track progress toward success on state-mandated achievement tests: A comparison of methods. Journal of Psychoeducational Assessment, 23(4), 304-325.
Snow, C. E., Burns, M. S., & Griffin, P. (Eds.). (1998). Preventing reading difficulties in
young children. Washington, DC: National Academy Press Spector, J. E. (2005). How reliable are informal reading inventories? Psychology in the
Schools, 42, 593–603. doi: 10.1002/pits.20104 Speece, D. L., Mills, C., Ritchey, K. D., & Hillman, E. (2003). Initial evidence that letter
fluency tasks are valid indicators of early reading skill. Journal of Special Education, 36(4), 223.
Stage, S. A., Jacobsen M. D. (2001). Predicting student success on a state-mandated
performance-based assessment using oral reading fluency. School Psychology Review, 30, 407–419
Swets, J. A. (1996). Signal detection theory and ROC analysis in psychology and
diagnostics. Hillsdale, NJ: Lawrence Erlbaum Associates. Stanovich, Keith E. (1986). Matthew effects in reading: Some consequences of individual
differences in the acquisition of literacy. Reading Research Quarterly, 22, 360-407.
Tashakkori, A., & Creswell, J. W. (2007). Editorial: Exploring the nature of research
questions in mixed methods research. Journal of Mixed Methods Research, 1(3), 207-211. doi:10.1177/1558689807302814
Thorndike, R. M., & Thorndike-Christ, T. (2010). Measurement and evaluation in
psychology & education (8th ed.). Boston: Pearson. Torgesen, J. K. (1998). Catch them before they fall: Identification and assessment to
prevent reading failure in young children. American Educator, 22(1&2) 32—39. U.S. Department of Education (2015) Institute of Education Sciences, National Center for
Education Statistics. VanDerHeyden, A. M. (2011). Technical adequacy of RTI decisions. Exceptional
Children, 77, 335-350. Walczyk, J. J., Tcholakian, T., Igou, F., Dixon, A. P. (2014). One hundred years of
reading research: Successes and missteps of Edmund Burke Huey and other pioneers. Reading Psychology, 35, 601–621. https://doi.org/10.1080/02702711.2013.790326