an executive’s handbook for understanding and risk
TRANSCRIPT

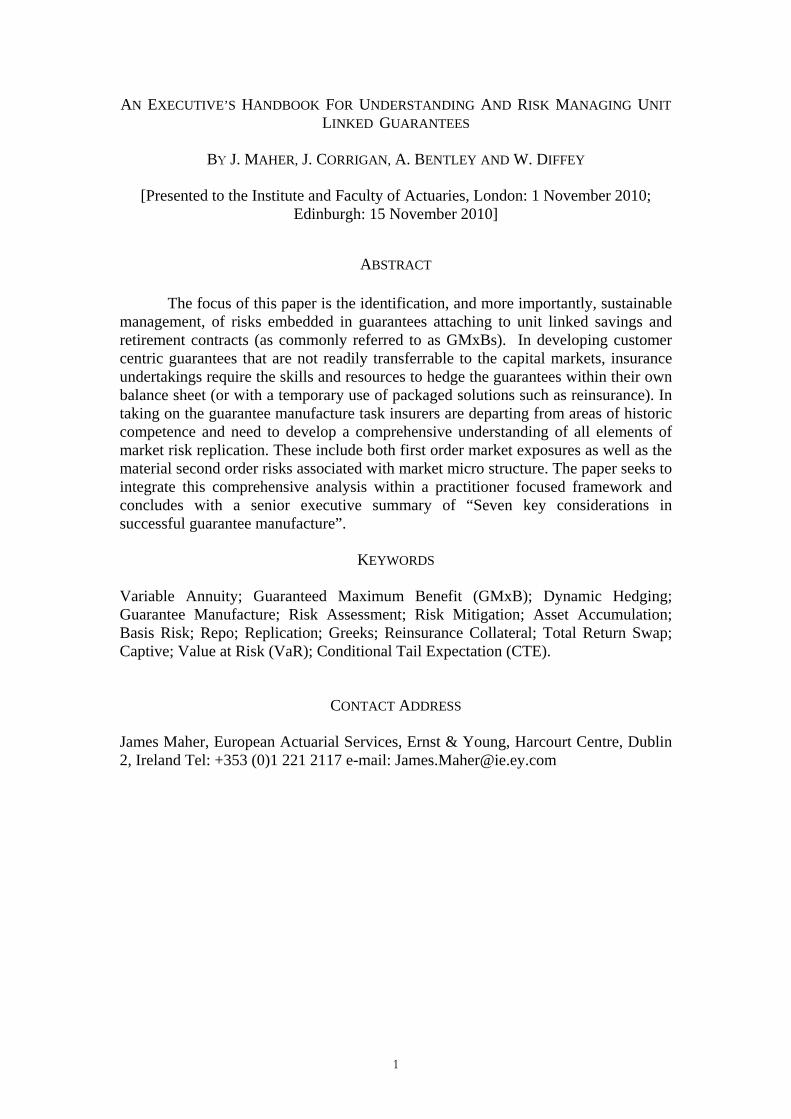
An executive’s handbook for understanding and risk managing unit linked guarantees A discussion paper
By J. Maher, J. Corrigan, A. Bentley and W. Diffey
Presented to the Institute and Faculty of Actuaries
1 November 2010 (London)
15 November 2010 (Edinburgh)
1
AN EXECUTIVE’S HANDBOOK FOR UNDERSTANDING AND RISK MANAGING UNIT LINKED GUARANTEES
BY J. MAHER, J. CORRIGAN, A. BENTLEY AND W. DIFFEY
[Presented to the Institute and Faculty of Actuaries, London: 1 November 2010;
Edinburgh: 15 November 2010]
ABSTRACT
The focus of this paper is the identification, and more importantly, sustainable management, of risks embedded in guarantees attaching to unit linked savings and retirement contracts (as commonly referred to as GMxBs). In developing customer centric guarantees that are not readily transferrable to the capital markets, insurance undertakings require the skills and resources to hedge the guarantees within their own balance sheet (or with a temporary use of packaged solutions such as reinsurance). In taking on the guarantee manufacture task insurers are departing from areas of historic competence and need to develop a comprehensive understanding of all elements of market risk replication. These include both first order market exposures as well as the material second order risks associated with market micro structure. The paper seeks to integrate this comprehensive analysis within a practitioner focused framework and concludes with a senior executive summary of “Seven key considerations in successful guarantee manufacture”.
KEYWORDS
Variable Annuity; Guaranteed Maximum Benefit (GMxB); Dynamic Hedging; Guarantee Manufacture; Risk Assessment; Risk Mitigation; Asset Accumulation; Basis Risk; Repo; Replication; Greeks; Reinsurance Collateral; Total Return Swap; Captive; Value at Risk (VaR); Conditional Tail Expectation (CTE).
CONTACT ADDRESS
James Maher, European Actuarial Services, Ernst & Young, Harcourt Centre, Dublin 2, Ireland Tel: +353 (0)1 221 2117 e-mail: [email protected]

2
AN EXECUTIVE’S HANDBOOK FOR UNDERSTANDING AND RISK MANAGING UNIT LINKED GUARANTEES
CONTENTS
1. OVERVIEW……………………………………………………………………..4 1.1 PURPOSE………………………………………………………………………………….….4 1.2 TARGET AUDIENCE…………………………………………………………………….....4 1.3 IS COMPLEXITY THE DEFINING FEATURE OF GMXB?....................................5 1.4 FORMAT OF THE PAPER…………………………………………………………….5 2. A GOOD START IS HALF THE
CHALLENGE……………..……………………………………………...……..6 2.1 STARTING WITH THE END IN SIGHT………………………………………….6 2.2 COMPARATIVE ANALYSIS OF GUARANTEE ALTERNATIVES….……………..9 2.3 PRE-LAUNCH PRODUCT DEVELOPMENT…………………………..…… …14 2.4 PRE-LAUNCH HEDGE DESIGN………………………………………...…..…15 2.5 INTEGRATED THINKING……………………………………………...……...15 3. UNDERSTANDING GUARANTEES AND DECOMPOSING THE
RISKS…………………………………………………………………………...16 3.1 GUARANTEE STRUCTURE……………………………………………...…….16 3.2 RISK DECOMPOSITION……………………………………………………....17 3.3 RISK MITIGATION…………………………………………………...…..…...26 4. DYNAMIC HEDGING – INSTRUMENTS, MARKETS AND CHALLENGES…………………………………………………………...……29 4.1 INSTANTANEOUS NEUTRALITY………………………………………..……29 4.2 WHY DO WE NEED TO UNDERSTAND DYNAMIC HEDGING?...............................29 4.3 CHOICE OF VALUATION BASIS…………………………………………...…30 4.4 HEDGING CHALLENGES………………………………………………...…...31 5. DYNAMIC HEDGING – MANUFACTURING PROCESS AND OPERATIONS………………………………………………………….….…..36 5.1 MANUFACTURING………………………………………………………..….36 5.2 INDIRECT CALCULATION/REPLICATING PORTFOLIOS………………….......40 5.3 A FINAL WORD ON THE RISK MANUFACTURE CHALLENGE…………...….42 6. STATIC RISK TRANSFER
SOLUTIONS…………………………………………………………….….….43 6.1 MOST COMMON STATIC RISK TRANSFER SOLUTIONS…………….….……43 6.2 PRIMARY CONSIDERATIONS FOR STATIC SOLUTIONS………………..….…44 7. GROUP STRUCTURES, CAPTIVE ARRANGEMENTS AND OUTSOURCING……………………………………………………………….48 7.1 CENTRALISED PROCESSES, POLICIES AND PERSONNEL…………………….48 7.2 BRANCH STRUCTURE………………………………………………..………49 7.3 CAPTIVE (RE)INSURER…………………………………………..…………..49 7.4 THIRD PARTY SERVICE OUTSOURCING………………………………...…...50
3
8. REGULATORY & ECONOMIC CAPITAL CONSIDERATIONS……………………………………………………..……52
8.1 ECONOMIC AND/OR REGULATORY CAPITAL……………………………..…52 8.2 NORTH AMERICAN CTE…………………………………………………….53 8.3 EUROPEAN VAR APPROACH……………………………………………………..……53 8.4 CONTRASTING POLICIES AND IMPLICATIONS………………………….…...54 8.5 FOCUS ON VAR/STRESS TEST…………………………………………....….54 8.6 MODULAR CONSTRUCTION OF A STRESS TEST…………………………….54 8.7 RISK MITIGATION…………………………………………………….….…..55 8.8 PRO-FORMA IMPACT OF DYNAMIC HEDGING ON CAPITAL…………….......57 8.9 OPERATIONAL AND LIQUIDITY CONSIDERATIONS……………………..…..59 8.10 EVOLUTIONS IN PORTFOLIO CAPITAL……………………………….…….59 9. STRATEGIC RISK MANAGEMENT
CONSIDERATIONS……………………………………………………..……62 9.1 GETTING STARTED………………………………………………………..…62 9.2 EXTENDING OR ADAPTING EXISTING PLATFORMS……………………..…..62 9.3 SUSTAINABLE CAPACITY……………………………………………………63 9.4 REPUTATION RISKS……………………………………………..…………...63 9.5 REGULATORY RISKS………………………………………………………...64 10. KEY PRINCIPLES AND CONSIDERATIONS FOR SUCCESSFUL GUARANTEE
MANUFACTURE………………………………………………………….…..66 REFERENCES………………………………………………………………...........67 APPENDIX A: ABOUT THE VARIABLE ANNUITIES INTEREST GROUP………………………………………………………………………….….68

4
1. OVERVIEW
1.1 Purpose 1.1.1 The purpose of this paper is to deliver a practical and enduring reference paper that identifies many primary and secondary risks and risk management considerations associated with the design and manufacture of GMxBs. Within this comprehensive assessment the paper devotes significant attention to the requirements of managing the derivative obligations embedded within the product. 1.1.2 The paper does not seek to introduce complex mathematical formula as each element is capable of description or decomposition within the framework of existing financial and actuarial know how. 1.1.3 Furthermore, the paper focuses on economic capital and economic risk management and to a lesser extent, current regulatory requirements. In particular, noting that regulatory requirements vary significantly between jurisdictions (which in many territories are undergoing considerable change) such analysis could be redundant in short order.
1.2 Target Audience 1.2.1 This paper is directed to senior management and executives of life insurance companies who are either active in or considering offering policyholder guarantees of either income or performance arising from investments in unit linked investments. 1.2.2 This paper should also be of interest to non executive members of the boards of directors of those same institutions, whether to aid in the assessment of business proposal and strategies as presented by the executive team or in their oversight of the operational and risk management. 1.2.3 The need for non executive directors to keep abreast of developments in products and risk management are a pre requisite of effective Corporate Governance and short comings in these areas were in part a contributor to the financial crisis of 2008 to 2009. (For a complete discussion in this regard we refer readers to the findings and recommendations of the Walker Review of Corporate Governance in the UK Banking Industry, as extended to encompass life insurance institutions.(HMT, 2009) 1.2.4 This paper is a practitioner focused paper rather than an academic research paper and assumes a reasonable degree of familiarity with wealth and protection products commonly available within life insurance and retirement planning 1.2.5 We will use the term ’Variable Annuity’ (VA) to describe the general class of products making specific reference to the “underlying” when discussing the investment component and the ’rider’ or ’GMxB’ (Guaranteed Minimum Benefit) to reference the accompanying guarantee.

5
1.2.6 As a comprehensive introduction to VAs in general, we would direct readers to Ledlie, et al. and their prize winning paper Variable Annuities as presented to the Faculty and Institute of Actuaries during 2008.
1.3 Is Complexity the Defining Feature of GMxB? 1.3.1 There is nothing particularly new about offering policyholder guarantees. As a sector, life insurers have been offering wealth and income protections for more than a hundred years. 1.3.2 What is different or defining for these contracts is their complexity resulting from the integration of many disparate components within an ’open architecture’. This in turn has significant implications for how the resulting risks are to be managed. 1.3.3 These complexities are not complexity for the sake of complexity but reflect the aim and aspirations to deliver policyholder centric solutions that can provide meaningful wealth and income protection under a generalised product framework. 1.3.4 The result of this complexity is an onerous requirement for individuals and organisations to acquire and develop a range of multidisciplinary skills that reflect the underlying risks. These must also be applied diligently and continuously to ensure a safe and sustainable return for the shareholders or members of the insurance company.
1.4 Format of the Paper 1.4.1 In section 2, we have urged decision makers to start with the end in mind, advocating a need for clarity of vision when participating in this business class. We identify that a reactive ‘me too’ strategy, in either product design or risk management, is unlikely to be successful for either the company or the policyholder. 1.4.2 In section 3, we seek to unbundle the risk components embedded in the guarantee. From this it is readily apparent that there are a host of primary and secondary risks. Although identifiable these risks do present challenges that require both a granular response at the level of the risk and a holistic response at the level of the contract and the undertaking. 1.4.3 Section 4 is the first part of our introduction to risk manufacture and focuses on identification of the direct and indirect costs and limitations of risk replication that are critical to making informed cost benefit analysis decisions over product design and hedge strategy. 1.4.4 In section 5 we cover the manufacturing process and operational requirements to manufacture the guarantee. In particular, we outline the valuation and modelling considerations associated with manufacturing guarantees through dynamic hedging and outline these in the context of an operational and governance framework. 1.4.5 Section 6 introduces the more common packaged risk management solutions such as reinsurance and quasi reinsurance solutions (as structured by investment banks). The section identifies the general features of these solutions but focuses on the primary considerations faced by an insurance company in choosing a static solution.

6
1.4.6 Section 7 analyses alternative group infrastructures having regard to choices of either centralising management while maintaining risks in local balance sheets or directly consolidating risks into specific balance sheets. Additionally, this section looks at the implications and requirements for outsourcing some of the key operational activities such as the valuation of liabilities, management of hedge assets and financial reporting. 1.4.7 Section 8 outlines capital considerations with a primary focus on economic capital. The choice of economic capital is due to it being a more resilient measure of exposure as regulatory capital measurement is prone to considerable geographic variation and evolution over time. 1.4.8 Section 9 rounds out the technical discussion with a brief review of the key strategic risks that need to be countenanced. 1.4.9 Finally, section 10 seeks to integrate the prior analysis and summarise the key considerations under a list of seven key principles for the successful manufacture of guarantees
2. A GOOD START IS HALF THE CHALLENGE
In this section, we raise a number of preliminary considerations for decisions makers in their decision to participate in the Variable Annuity and GMxB space having regard to:
- the shareholder value proposition; - alternative and competing solutions; and - preparatory analysis in product and risk management design.
Time well spent in preparation will be well rewarded owing to the considerable
direct and indirect costs of mistakes.
2.1 Starting with the end in sight 2.1.1 Business strategy by necessity needs to be treated as a vector, which in maths and physics is defined as having both magnitude and direction. There are many instances of business strategies being built around magnitude (size, speed etc.), with limited clarity or vision as to direction (strategic purpose), with the early years of the internet and dot.com mania springing to mind. 2.1.2 Slightly closer to home, there has similarly been some frenzy in the early to mid 2000’s with an international clamour for Variable Annuities off the back of success in the US and Japan and a proliferation in guarantee availability and variety. This was the heady period when VA’s were the ‘next big thing’. 2.1.3 This headlong rush to operate in the VA space has been halted in its tracks, largely due to the direct and indirect impacts of the financial crisis of 2008 to 2009. The urgency has been replaced with a more considered approach to determining the

7
why and wherefore of VA and in this opening section we look to offer some thoughts on how a VA strategy may align with the strategic aims of a business. 2.1.4 As a summary, the main ways in which guarantees can create shareholder value are:
(1) Generate and enhance the value of new business of the base product The clearest benefit seen by many providers is the catalyst and promotion to
increase assets under management whether through unlocking policyholder assets that may have been held more defensively (e.g. cash deposits) or through competition against other providers. In a highly competitive marketplace, such as the US, this is the most common strategic purpose of the GMxB rider.
Implications for the business model:
Where the primary strategic reason is to increase assets under management, then use of in-house funds will be central to the product design. This leads to the need to resolve competing considerations for the sale of the more popular in house funds (which may rely on demonstrable ‘alpha’ or out performance) against the needs of a risk management strategy that can readily hedge or mitigate the risk associated with the guarantee. The resolution of these competing interests will look to optimise the entire embedded value of the contract (rider + underlying) as compared to the total risk measured through the companies risk management framework.
Reconciliation of these competing needs may also lead to the creation of hybrid structures where elements of risk management are embedded within the asset offering such as target volatility or volatility control. Furthermore, the risk management of the guarantee may require or benefit from the use of fund based derivatives such as total return swaps (which are discussed in 2.5.)
(2) The GMxB rider as a direct source of Profit The rider itself can and should be seen as a source of risk profits. The amount,
timing and variability of these margins will be a function of the product design, risk appetite and risk management of those guarantees. Discussion on these items will comprise a significant share of this paper, in particular, sections 3- 6.
Implications for the business model:
Historically, asset accumulation strategies have dominated the Variable Annuity business model for insurers, with the guarantee often being a secondary consideration. This asset led conversation has perhaps led to some of the problems in the past. This secondary consideration is perhaps evident in the development of guarantees with limited hedgeability or in a skew in the balance of remuneration between the risk bearing guarantee and the value adding but lower risk asset management and policy manufacturing components of the value chain.
Focusing on the importance of the guarantee can lead to a redesign of strategy as well as products. Thus, for example, a guarantee centric business model

8
may lead to a ‘protection’ mindset and model with a focus on lower cost (passive) index based fund returns and richer guarantee offerings such as accumulation benefits. This is the case in Japan today where the most assets under management adhere to passive/index based funds and where competition is on guarantees and costs.
Thus, whether through a combination of experiences arising from the financial crisis of 2008 to 2009 or the development of more integrated hedging solutions as identified in 2.5 below, the scope to move to protection centric products is an increasingly relevant business strategy.
(3) Protect the embedded value of in-force business The first item on our list is to attract new monies to the undertaking; however
for real value to be generated the undertaking will need to retain those monies. The design and application of guarantees can prove to be a valuable tool for increasing persistency, and thus increasing the embedded value, of hard won new business.
Implications for the business model:
Whether viewing persistency management as an offensive or defensive strategy, the key consideration is the need to improve persistency to maximize the aggregate policy embedded value. Thus in making the overall assessment as to whither a guarantee, the impact for the total policy profitability will need to be taken into account.
When designing the guarantees it is important to have regard to the rational
choices that policyholders may make in the future, as such it is not sufficient to identify solely whether or not a guarantee should be included but also to consider the impact and consequences of various guarantees. Thus the choice to include a ratchet benefit may initially be contrary to risk management’s appetite of a guarantee. However its benefit in retaining business in a rising market may, on balance, make such a choice appropriate.
(4) Develop and leverage risk management manufacturing capability There is an element of circularity in many strategic decisions and this happens
to be one of them. Where (market) risk management capabilities already exist within in an undertaking, there is a clear opportunity to seek to extend or expand these capabilities to proactively seek to add value in new business in addition to mitigating risks already acquired. Similarly, decisions on investment in risk management infrastructure can incorporate existing firm wide market risk management in addition to new product risk when considering the cost-benefit of developing a risk management program.
Implications for the business model:
The existence of comprehensive (market) risk management capabilities will either have led to or lead to an increasing utilisation of that capability not just in managing in force risks but in developing new products underpinned by these capabilities.

9
(5) Reduce economic capital through favourable risk diversification Having taken the decision to invest resources in actively managing market
risk, the payback can be realised in part through optimisation of regulatory and economic risk capital.
Implications for the business model:
Under most modern (and evolving) regulatory capital regimes the possibility of writing significant amounts of unhedged market risks is virtually impossible. Even where the economic position is effectively managed it will be essential to achieve a commensurate reduction in regulatory capital so that these measurements are to some extent aligned. This may require some (re)packaging of solutions whether through choice of hedge solution (reinsurance) or group structure (use of a captive). Thus with an economic risk management view as a priority it is also essential to develop solutions in the context of the regulatory capital requirement.
(6) Additional considerations
- Obtain, increase and/or protect distribution Invariably the market gets what the market wants. In this life insurance is no different from any other business. The degree to which a market requires access to guarantees will dictate the entry level requirement for all insurers looking to tap into a market. Thus for example markets such as US and Japan require that providers make guarantees available to complement unit linked funds sales irrespective of whether such guarantees are taken up at point of sale.
- Defensive measure to protect market share As GMxB products increase their market penetration over time, it will
eventually force some companies into offering them to protect their overall market share. This is a particularly common consideration for the retirement income market where a generalised movement towards greater personal responsibility for retirement provisions together with a need for more flexible retirement structures.
2.2 Comparative Analysis of Guarantee Alternatives 2.2.1 The previous section sought to outline the case for guarantees without being overly prescriptive as to the form or functionality of those guarantees. In this section, we will outline the major families of benefit structure and guarantees with the aim to comparing and contrasting them to identify how our target class of guarantee, the GMxB, stacks up against the alternatives under a range of headings. 2.2.2 This section will focus on the discussion from a shareholder perspective. For a broader policyholder view of alternative or competing retirement combination we recommend readers review Shallis et al. (2009) 2.2.3 To illustrate the issues we will look solely at the single premium market for retirement solutions and, in particular, focus on wealth/principal protection solutions and income protection solutions.

10
2.2.4 For the purpose of presentation we will look to align each form of guarantee under a common description of the form of market risk protection underlying the product asset out in table 1. Table 1: Descriptors for Various Products
Wealth Protection Income Protection Descriptor Cash Saving Cash Drawdown Cash
Unit Linked Risky Asset Saving Unit Linked Risky Asset Drawdown
UL
With-profit Saving With Profits Annuity WP*
Constant Proportion Portfolio Insurance
CPPI
Equity indexed annuities (General Account Obligation)
EIA
(Whole of Life) Fixed annuities: level, inflation
linked, escalating
FA*
(Term/Temporary) Fixed annuities: level, inflation
linked, escalating
FA*
Structured Accumulation Products
(Purchased Call + Cash)
Structured Income Products (Sold Put + Cash)
SP
(*For a useful guide as to the general hedging considerations for traditional life insurer based products such as with profits and fixed annuities please refer to the recent paper by Eason et al,(2010).. In particular, this paper provides useful insight as to some of the current regulatory and accounting considerations associated with hedging in the UK.)
2.2.5 If we take as the base case for each an unprotected unit linked offering we can then compare each solution set in terms of:
a) Risk Transfer/Degree of Protection. b) Transparency of Charging and Benefits. c) Strategic Synergy.
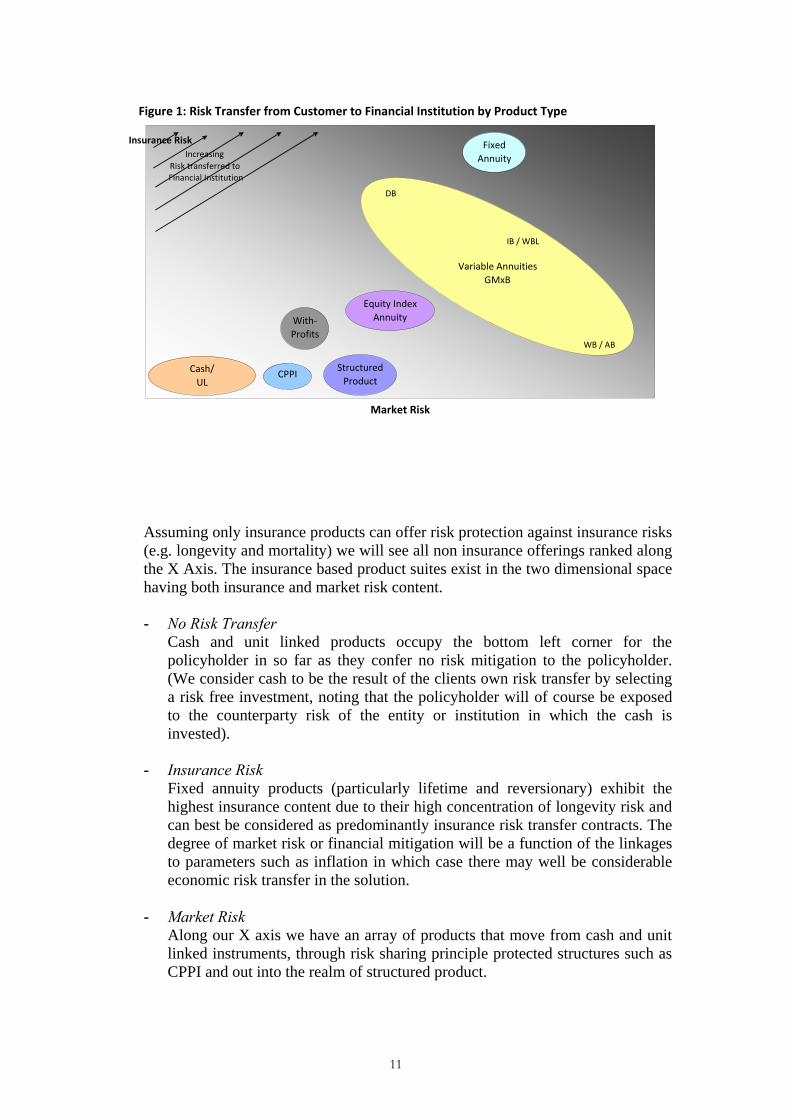
(a) Risk Transfer Figure 1 outlines the relative concentration of insurance risk and market risk
within each of our headline guarantee types in Table1.
11
Assuming only insurance products can offer risk protection against insurance risks (e.g. longevity and mortality) we will see all non insurance offerings ranked along the X Axis. The insurance based product suites exist in the two dimensional space having both insurance and market risk content. - No Risk Transfer
Cash and unit linked products occupy the bottom left corner for the policyholder in so far as they confer no risk mitigation to the policyholder. (We consider cash to be the result of the clients own risk transfer by selecting a risk free investment, noting that the policyholder will of course be exposed to the counterparty risk of the entity or institution in which the cash is invested).
- Insurance Risk
Fixed annuity products (particularly lifetime and reversionary) exhibit the highest insurance content due to their high concentration of longevity risk and can best be considered as predominantly insurance risk transfer contracts. The degree of market risk or financial mitigation will be a function of the linkages to parameters such as inflation in which case there may well be considerable economic risk transfer in the solution.
- Market Risk
Along our X axis we have an array of products that move from cash and unit linked instruments, through risk sharing principle protected structures such as CPPI and out into the realm of structured product.
Figure 1: Risk Transfer from Customer to Financial Institution by Product Type
Market Risk
Insurance Risk
Cash/ UL
CPPI
With‐Profits
Structured Product
Equity Index Annuity
Fixed Annuity
Variable Annuities
GMxB
WB / AB
DB
IB / WBL
IncreasingRisk transferred to Financial Institution

12
Through the inclusion of, often modest, amounts of insurance risk these products evolve into our insurance solutions of with profits and equity indexed annuities. The with profits product set is in some ways an informal derivation of CPPI risk management. The difference being the informality of dynamic rebalancing between risky and risk free assets. Furthermore, with profits involves a higher degree of intergenerational smoothing. This discretion is waning due to a combination of greater market demand for transparency and regulatory pressure (for example as included within UK “Treating Customers Fairly” (TCF) requirements).
Equity indexed annuities are general account insurance products that are predominantly sold in the US market and are similar in nature to structured products.
- Hybrid Risks
Our GMxB grouping refers to a framework rather than a product and is illustrated as occupying a large area across both risk spectrums.
Within our spectrum we have identified death benefit (DB) only riders as providing a high degree of insurance risk while our accumulation (AB) and term based income protection products (WB) are closer to pure market risk products with lifetime income protection policies (IB/WBL) inhabiting the middle space.
Due to the modular construction of the GMxB suite the total product may have a different location in our chart as compared to an individual rider benefit. For example, a common combination of Death and Accumulation benefits would tend toward a market risk only product etc.
(b) Transparency
Another way to compare these products is in terms of the transparency of the benefits and charges as viewed by the customer. This can have a big impact upon the product proposition. (See Figure 2).

13
With-profits, CPPI and structured products have relatively opaque charge structures as the cost of guarantees and other charges are indirectly embedded in the structure of the payoff. In contrast, benefit transparency increases respectively for these products as the guarantee becomes better defined. Benefit transparency is a little higher again for EIA and fixed annuity products. However, these products have significantly greater benefit transparency relative to the former products. This is because the customer is told exactly what the benefit is, even though charges are still not quite fully explicit. At the other end of the spectrum, managed funds, income drawdown and GMxB products are all fully transparent in terms of both benefits and charges.
(c) Strategic Synergy
There is an old saw that says “when you have a hammer everything starts to look like a nail”. In order to counteract the force of such tendency it is useful to compare the strategic aims developed by the shareholder analysis as outlined in section 2.1 against the coherence or synergy of those aims with the selected or potential product suites outlined in this sub section. As an illustration, the Table 2 outlines the profit opportunities by strategy for each of these products.
Figure 2: Benefit vs. Cost Transparency
EIA
CPPI
With Profits
FixedAnnuity
Structured Product
GMxB
Cash UL
Charge Transparency
Benefit Transparency
Increasing Transparency

14
Table 2: Profit Opportunities by Strategy Product Class
VNB Base
VNB Rider
VIF Base
Risk Mgmt
Economic Capital Distribution Defence
Strategy 1 2 3 4 5 6a 6b FA High None High Medium Medium Medium Low SP High None High Low Low Medium Low EIA High None High High High Medium MediumCPPI High None High Medium Low Medium Low WP High None High Medium Medium Low Low GMxB High High High Medium High High High ID High None High None Low Medium Low
VNB = Value of New Business, VIF = Value of In-force Business High Level Implications of Analysis
- Most products have only two main sources of shareholder value: new business value (VNB) and the value of inforce (VIF).
- EIA products also provide an opportunity to leverage a risk management manufacturing capability as these products are dynamically hedged.
- Fixed annuities and with-profits may also provide similar risk management and economic capital profit opportunities, although these may be relatively less given the reduced number of risk factors involved.
2.3 Pre-Launch Product Development 2.3.1 Risk management starts with product design. Given a high level concept of the types of guarantees that are desired, it is necessary to investigate the feasibility of various guarantee levels, asset mixes, and product features such as ratchets. This is done through the pricing process which calculates the market consistent cost of hedging particular combinations for the central model points. Comparison of the cost of hedging versus the acceptable price that can be charged in the market, puts important constraints on the design features that can be offered in a given market environment. Given the wide array of potential features and combinations thereof mean that this process is naturally iterative in nature. The creative tension between the desire to offer attractive benefits for a price that reflects their true market consistent cost is what drives this process towards an indicative feasible solution. 2.3.2 As well as the market consistent cost of hedgeable risks, careful consideration also needs to be given to the risks that cannot be hedged. These can often produce considerable creative tension because features that produce such risks can be ‘expected’ by customers (for example, the option to switch funds) without the expectation that they need to be paid for. Such risks either need to be minimised through appropriate product design or have a cost of capital allocated (by reference to the market consistent cost of the hedgeable risks). 2.3.3 Asset management decisions will need to be made to specify:
- the allowable asset allocation (range or fixed); - asset allocation rebalancing strategy (frequency and rules); - fund structure (single balanced fund or multiple individual funds);

15
- fund provider (internal or external); - fund exposure limits (diversified or concentrated); - basis risk (active or passive / index funds); and - fund style biases (value versus growth), and country / currency exposures.
2.3.4 Additionally, in order to help determine which funds are good candidates for a GMXB product, fund mapping is undertaken in order to assess how well the funds can be mapped to hedgeable indices. Since these decisions will affect the cost of the guarantees (whether from hedging or not), they will need to be considered alongside the product design iteration. Of key concern here is the fund management charge, since more expensive funds have implications for the cost of guarantees.
2.4 Pre-Launch Hedge Design 2.4.1 In addition to the design and pricing of the product, the risk management/hedging strategy that will be used to manufacture the guarantee also needs to be designed. Where multiple strategies are available, such as dynamic hedging versus reinsurance, residual risks can be evaluated and the pros/cons of each weighed up. This analysis can be undertaken through either sensitivity analysis or via economic capital type calculations. The latter would likely involve analysing the impact of stresses on an economic balance sheet or through financial projections, which would involve nested stochastic simulations. 2.4.2 Although more complex to undertake, the use of nested stochastic simulations is considered to be appropriate as it enables dynamic hedging strategies to be more accurately modelled and residual risks to be assessed. As these investigations are computationally very intensive, they do require the use of distributed grid computing resources in order to keep run times down to manageable levels. 2.4.3 Finally, the usual considerations for any life insurance product are required, such as: administration; distribution; and sales expenses. For the most part, these are not specific to the manufacture of a guarantee and thus we do not consider them further. However, the total charges to cover these expenses do affect the cost of the guarantee and needs to be allowed for in pricing. 2.4.4 Once the product design, risk management strategy, profitability and capital cost of the product have been finalised, implementation of the various systems and processes for managing the business post-launch can then be undertaken. This involves establishing data interfaces between the various systems (policy administration, asset management, valuation model, hedge management model, reporting model), setting up the liability valuation, hedge asset valuation, risk monitoring, trade management, and financial control/reporting models, implementing an adequate computing environment, and back office processes for trade and cash flow management. Each of these activities is closely related to those that are necessary on a post-launch basis, which we explore in section 6.
2.5 Integrated Thinking There are leverage opportunities across product sets and components that need
specific consideration in terms of managing overall hedge efficiency and portfolio

16
management costs. We will not deliver an expansive treatise on these opportunities within this paper; however, the subsequent paragraphs provide some indications of areas for further consideration.
2.5.1 Volatility Controlled Funds The crisis of 2008 to 2009 realised significant exposure for market consistent
values of embedded derivatives owing to the increase, and ultimate breakdown, of the long term option market. Whether as a direct result of this breakdown or a natural evolution of product development the creation of funds that include an element of dynamic asset allocation so as to preserve a constant risk profile (according to volatility) can lead to more effective and sustainable management of guarantees over the long term.
2.5.2 Macro Hedging One way of looking at the difference between GMxBs and structured products is
through the lens of put call parity. In general, structured products are created through the holding of cash and the purchase of a call option. The call option is dynamically created through the purchase of exposure to the underlying using delta management. Conversely, GMxBs can be considered to be the achievement of the same position through holding the underlying and a put option. The risk management of this put option will involve dynamic hedging through the use of short positions in the underlying exposure. Thus where the insurer is buying exposure to replicate the call option and selling exposure to replicate the put option there are potential offsetting trades. This becomes all the more important where the cost of borrowing funds for delta management increases or restrictions are placed on hedging activity.
2.5.3 Net Delta Management One of the key distinguishing factors for GMxBs is the existence of a guarantee
separate from the unit linked investment. This separation in the eyes and in the hands of the policyholder does embed inefficiency within the structure in that the process of delta management involves the sale of exposure to the unit linked investments made on behalf of the policyholder. A clearly more efficient solution would allow for a close integration of the asset and liability management by the insurance company, behind the scenes without impacting on the policyholder solution to deliver a cost effective solution. The scope and scale for such solutions will become more prevalent as borrowing costs increase and the need for better basis risk management emerges. A retail banking analogy is perhaps the operation of Offset accounts wherein the customers’ deposits and borrowings are offset to arrive at a client’s net position.
3. UNDERSTANDING GUARANTEES AND DECOMPOSING THE RISKS
3.1 Guarantee Structure 3.1.1 The central purpose of the GMxB is to ensure that the customer will receive benefits which are contingent upon the greater of the future value of one or more unit-linked funds or a guaranteed payout function. The guarantee may be provided as an optional rider contract to a unit-linked policy, or it may form part of a single product. This distinguishes the product from fixed annuities, whose benefits are independent of

17
market returns and from unit-linked / drawdown products which do not provide guarantees. 3.1.2 VA product guarantees may be applied to a wide range of contingent events, such as:
- Survival for a fixed term (final or regular payments). - Regular payments provided the policyholder is alive, in-force and not paid-up. - Death during a fixed term or whole life. - Illness (e.g. CI) or injury (e.g. TPD) during a fixed term or whole life. - At the policyholder's option at any time (e.g. on surrender) or only at defined
points (e.g. for annuitisation at maturity). 3.1.3 A particular GMxB product may also combine several guarantee benefits, each of which can be defined in various ways, such as:
- A fixed monetary amount. - A fixed monetary amount with specified increases or interest. - An amount that depends on age or term in force. - An amount that depends on fund performance at defined times prior to the
occurrence of the contingent event. 3.1.4 Once a GMxB has been sold, it creates a liability on the underwriters’ balance sheet. This liability is typically valued stochastically on a per policy seriatim basis as the present value of guarantee claims less the present value of guarantee charges. In this paper we focus on the economic balance sheet, under which the valuation is undertaken on a market consistent basis. Alternative non-market consistent bases may be required for reporting on a statutory (e.g. Solvency I) or accounting (e.g. US GAAP, IFRS) basis. Consequently when we discuss risk, it is in the context of the risks influencing the value of the economic liability, the assets used to hedge it, and the associated cash flows.
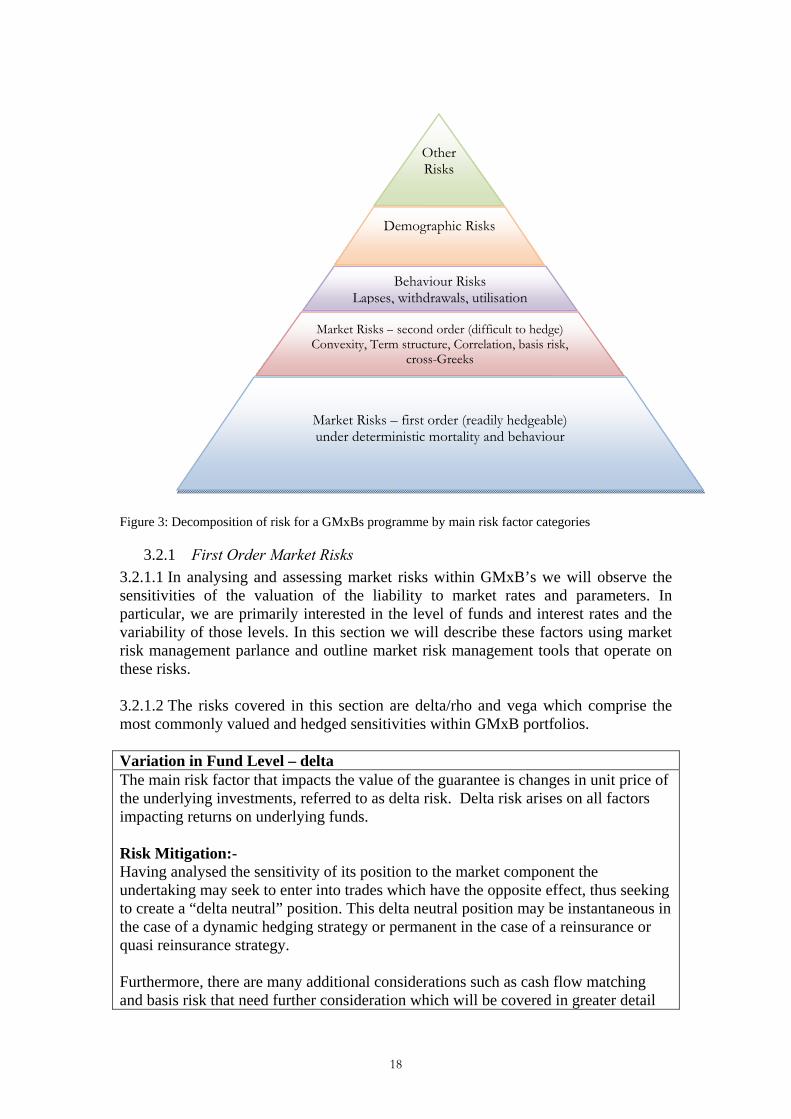
3.2 Risk Decomposition The value of a GMxB guarantee is linked to the value of a policyholder's unit balance and the proportion of policyholders that exercise the guarantee. Consequently, anything which impacts these variables such as the number of units held or unit price of the underlying funds will impact the value of the guarantee and introduce risk. It is then a question of what the appropriate price is to bear each of these risks, with consideration to both the degree to which they can be retained and mitigated, or passed on to another entity. Figure 3 illustrates the decomposition of risk for a GMxBs program into the main risk factor categories. We discuss each one in further detail in the paragraphs below.
18
Figure 3: Decomposition of risk for a GMxBs programme by main risk factor categories
3.2.1 First Order Market Risks 3.2.1.1 In analysing and assessing market risks within GMxB’s we will observe the sensitivities of the valuation of the liability to market rates and parameters. In particular, we are primarily interested in the level of funds and interest rates and the variability of those levels. In this section we will describe these factors using market risk management parlance and outline market risk management tools that operate on these risks. 3.2.1.2 The risks covered in this section are delta/rho and vega which comprise the most commonly valued and hedged sensitivities within GMxB portfolios. Variation in Fund Level – delta The main risk factor that impacts the value of the guarantee is changes in unit price of the underlying investments, referred to as delta risk. Delta risk arises on all factors impacting returns on underlying funds. Risk Mitigation:- Having analysed the sensitivity of its position to the market component the undertaking may seek to enter into trades which have the opposite effect, thus seeking to create a “delta neutral” position. This delta neutral position may be instantaneous in the case of a dynamic hedging strategy or permanent in the case of a reinsurance or quasi reinsurance strategy. Furthermore, there are many additional considerations such as cash flow matching and basis risk that need further consideration which will be covered in greater detail
Other Risks
Demographic Risks
Behaviour Risks Lapses, withdrawals, utilisation
Market Risks – second order (difficult to hedge) Convexity, Term structure, Correlation, basis risk,
cross-Greeks
Market Risks – first order (readily hedgeable) under deterministic mortality and behaviour

19
under replication challenges in 4.4. Variation in (Risk Free) Rate Curve - rho The liabilities for our GMxB’s will be determined by projecting forward a future set of obligations and discounting the results to the present date. The projection and discounting rates are likely to be related to each other, whether through the model or parameterisation. In general, we can identify that the underlying rates will adhere to some market observable parameters being either a variant on a treasury curve or an interbank curve with company specific approaches for dealing with extrapolated rates in the unobservable space, we will refer to the discount rate as our ‘risk free’ rate from time to time. Thus noting that there is a risk free curve at the core of most valuations, and that this curve is in the main observable, the valuation will thus be subject to movement in this market referenced curve. It is this sensitivity to this reference rate movement that we term ‘rho risk’. Given that our reference rate has a range of different forward components and that forward rates do not necessarily move in unison, it is recommended that sensitivity to changes in future segments of the reference curve are considered independently. Thus rho risk can be analysed at the level of various duration buckets of the yield curve (known as key rate rho). As a further consideration, noting that variation in the discount curve will likely have implications for the level of bond assets that may sit within the unit funds it may be appropriate in some circumstance to consider the fund delta for bond risks together with the rho risk for the discount rate. Risk Mitigation: Given that yield curves move in non-parallel ways, constructing hedges that mitigate the various parts of the term structure are becoming increasingly important and prevalent. Interest rate swaps are the main instrument used to hedge rho risk, as they are highly liquid and have relatively immaterial credit risk due to the collateralisation process. Variation in Cost or Expectation of Future Volatility - vega All valuation models require both a process and a parameterisation to replicate the variation in future paths for underlying funds and the (risk free) rate. In an ideal world as perhaps exists in undergraduate text books (e.g. Hull, 2008,) the volatility parameter has a single measure across term, funds and strike levels and is stable as we advance through time. In reality, the volatility process will include a wider data set that incorporates differing measurements across underlying funds, strikes and durations and additionally will move as we advance through time. The sources of these movements will include efficient market changes in expectations of the most liquid instruments as well as changes in parameterisation reflecting changes in both expectation and market liquidity for other instruments. Irrespective of the source of the change, if the parameters are observable and reliable,
20
the impact of these changes will need to be taken into the valuation for market consistent valuations. For longer term (through the cycle) valuations such market noise is less relevant. However, any change to the volatility parameter will manifest itself in the valuation irrespective of source, cause or frequency. Thus all valuations (whether market consistent or not) will be prone to a change in the volatility parameters and thus are vega exposed. There are many sources of volatility or vega risk that need to be countenanced in calibration of models and risk management with the dominant sources being :
- underlying equity fund/index – equity vega; - volatility of interest rates – rate vega; - volatility of bond funds – typically rate vega, (may also be termed bond vega).
Furthermore, the volatility model itself may further give rise to further parameterisation such as the rate of mean reversion which is best contemplated under higher order Greeks. Risk Mitigation: Risk Mitigation for vega risk requires the transfer of the volatility risk in isolation through:
- the use of bespoke over the counter derivatives such as volatility or variance swaps;
- the purchase of options and swaptions (from which the vega impact will be extracted);
- or the purchase of Reinsurance and Quasi Reinsurance solutions which look to emulate all the sensitivities of the underlying exposure.
3.2.2 Second Order Market Risks 3.2.1 above outlined the first order risks and identified the primary risk mitigation approaches available. In this section, we will identify the key second order risks noting that many of the risks are interrelated and many of the risks are in effect unhedgeable and thus residual pricing, risk capital and risk appetites need to be established in respect of these components.
Higher Sensitivities
The valuation of sensitivities discussed in 3.2.1 outline the sensitivity to either first order risks or to the calibration of those sensitivities within a reasonably tight set of circumstances. Here we consider those higher order risks that contribute to the skewed and long tailed out turn of many financial markets when compared against simplified Gaussian (bell curve) models. They result from a high degree of interdependence among valuation parameters whose level of correlation is market dependent (and in most cases this correlation increases as markets fall). The following outlines some of the residual sensitivities: Gamma Risk - Gamma risk can be considered in two discrete circumstances. In the first instance it describes the non linearity or curvature of the liability valuation for large changes in the

21
underlying parameter. In our first analysis, we identified the delta of our liability portfolio to be a linear approximation of the movement in our reserves for movement in the index. Where our obligation is convex, the use of a delta neutral strategy will lead to realised losses over time if movements are more volatile than expected. The actual turn out of the realised results are path dependent as such care needs to be taken in selecting an appropriate gamma management strategy. (For further discussion on the topic of Gamma Risk or Convexity of GMxBs, see James Maher (2009) Volga/Vanna- The level of our volatility surface is prone to shifts in skew (according to moneyness) and slope (according to term). Changes in slope may be precipitated by near term variations in expected volatility and a consequent impact on its slope as it seeks to revert to some long term mean, which itself may vary. Additionally changing views of the speed of mean reversion from the near term level to the longer term level will have a second order impact on this term structure. The level of skew of the volatility surface may shift depending on market equilibrium, in particular, imbalance between buyers and sellers, an effect which will likely exacerbate during a crisis exacting proportionately more significant impacts on guarantees that are deeply in or out of the money. Cross-Greek Risk - The decomposition of our underlying valuation above has been based on the contribution of each risk factor independently as integrated into an entire evaluation with allowance for correlation as to the likelihood of occurrence. In this case we are interested in determining the interaction of the risk factors, in addition to their probability of occurrence. In general, the impact from two simultaneous adverse risk factor movements is greater than the sum of the two risk factor movements individually. Cross Greeks are difficult to mitigate using dynamic hedging and residual results will manifest themselves in the net retained result. Understanding these higher sensitivities is essential to appreciating that, while delta/rho/vega risk management (also known as 3 greek hedging) is effective as a risk mitigation strategy, it cannot lead to a risk free replication strategy even under idealised trading scenarios.
Correlation Many of the factors underlying the ultimate cost and outturn of a GMxB are correlated. As above, many of the market risk factors are interrelated and many of the risk mitigation tools identified illustrate a high degree of correlation to the market in respect of either their cost or availability. Similar to the identified departure of realised volatility from expected volatility there is a similar consideration for correlation in that realised correlation is not stationary and correlation itself is correlated to market condition with an increasing tendency for risks to increase in correlation as market come under pressure. Such valuations are covered under GARCH models (generalised
22
autoregressive models with conditional heteroscedasticity), which allow for both time series and market state considerations in determining the volatility calibration for models and lead to greater density of tail valuations. Notwithstanding the ability to evaluate this risk, the scope to replicate the risk is limited. In practice the result is either to hold or transfer the risks where transfer occurs using basket based hedges and quanto options such as foreign equity indices denominated in local currency terms and hybrid equity rate instruments. Such instruments have varying liquidity and in particular, can become difficult to acquire in a crisis as such to the extent correlation is hedged within GMxB it is through the use of static risk management solutions using either reinsurance or quasi reinsurance solutions.
Basis Risk Basis risk relates to the risk that the return on the underlying managed fund differs from that of the underlying return used in the hedge. Thus, where the delta hedge uses index based instruments the hedge is described as beta hedging and to the extent that there is an alpha component in the underlying fund then this source of deviation will be realised by the hedging program. The source of this deviation needs to be appreciated in order to identify a remedy. In particular, we are concerned with three broad sources as follows: Tracking Error: - The first is the tracking error risk that the asset manager controls relating to the volatility of fund returns less the benchmark return (active return or alpha). This tracking error itself may not be stationary and as identified during the crisis of 2008 to 2009 many asset managers, even those with passive strategies, were slower to sell risky assets and slower to buy back risky assets than benchmark indices. Mapping Error: - The second is the risk that the benchmark return differs from the index return used in the hedge due to either the limitations of the mapping process or mistakes in the application of the mapping process. Proxy Risk: - In the limit, the fund on which the guarantee is sold may demonstrate goodness of fit within the region of the data (through the rear-view mirror). The predictive power of the model (through the windscreen) may be unacceptably low. This is likely the case where there is no structural basis for the underlying fund to adhere to the limited basket of hedging indices. As such a clear understanding of the sources of basis risks is critical to its resolution and mitigation. For example consideration of the basis risk of the overall portfolio is also influenced by the correlation of tracking errors between the various funds used in the portfolios such that a portfolio of independent basis risks may

23
exhibit material internal diversification. Risk mitigation options for basis risk include using passive index tracking funds, ensuring sufficient style diversification across funds, retaining the ability to remove/replace an underperforming fund, and analysing real time risk information based upon the security level holdings of a fund. Finally integrated solutions such as fund based derivative (such as total return swaps) that incorporate the basis risk may be suitable in certain circumstances.
Asset Allocation
Risk
Asset allocation risk manifests itself if the actual asset allocation mix varies from that originally assumed as may occur in discretionary managed funds. In rising markets, equity allocations will tend to drift up causing total portfolio volatility to increase above what was originally assumed. The best way to mitigate this risk is by implementing asset allocation rebalancing rules at the product design stage. These have an influence on how asset class exposures evolve over time, and it is therefore common for rebalancing to be required on a relatively frequent basis such as monthly or quarterly.
Credit and Counterparty Default Risks
Credit and counterparty default risk may manifest itself in many ways for this product class.
- The dominant exposure to counterparty default will arise under risk mitigation of the GMxB. Through risk mitigation the undertaking will transfer event or market risk and assume counterparty risks.
- The key dimensions of this counterparty risk under mitigation are:
a) the settlement or collateralisation of the fair value of the position;
b) the contingent or add on risk for recoveries in extremis; and c) the ability to rebuild a hedge or cost of re-hedging in a
distressed market. - The delta exposure of a bond fund will include variation in
the market price of the credit component of the underlying asset. We deem this to be covered under delta risk and risk mitigated using OTC swaps or short CDS positions.
- Interbank credit risk manifests itself in valuation differences between reference rates linked to short term bank borrowing such as swap curves. The impact of variability between treasury and swap curves will in most cases be a function of valuation bases. For example prudential regulation may require treasury curves whereas statutory reporting for IFRS and hedging may require the use of SWAP curves.
Inflation Although not common in GMxB products to date, it is possible that inflation risk could also be a source of risk if either the guarantee is a direct function of inflation or if the underlying assets contain inflation-linked securities. Inflation risk can be hedged using inflation swaps, and risk sensitivities to real interest rates as well as
24
nominal interest rates will also need to be considered. New business pricing risk
Pricing risk arises due to the fact that whilst capital market conditions change on a daily basis, the price for the guarantee offered to the customer cannot change as frequently to reflect the constantly changing hedge costs. During the global financial crisis, many companies were slow to react to rapidly changing market conditions and consequently sold business at unprofitable levels for at least a few months. Hedging of this risk is possible, although it relies heavily on the accuracy of predicted new business volumes.
3.2.3 Policyholder Behaviour Risks 3.2.3.1 The main forms of policyholder behaviour risks relate to lapse risk, withdrawal risk, benefit utilisation risk, fund switching risk and business mix risk. These risks are all functions of decisions policyholders can make that influence their guarantee benefit. As there are currently no hedging instruments available to hedge these risks, in order to mitigate them a combination of product design, conservative pricing assumptions, policyholder management, and economic capital is required. 3.2.3.2 A key consideration in the assessment and pricing of these risk factors is the degree to which policyholders are expected to behave rationally. In general, most policyholders behave reasonably rationally most of the time; however, there will always be a proportion of policyholders that behave both perfectly rationally and irrationally. This is a key area of variability in pricing between insurers.
Lapse In general, increased persistency is a beneficial outturn for insurers selling investment based solutions not least due to the need to recover up front acquisition costs. In considering the aggregate impact of higher or lower persistency the insurer needs to consider the fair value of the rider together with the fair value of the underlying policy. Fair Value of Underlying: - In the case of the underlying policy the fair value in nearly every case will be positive. This fair value may be presented as either an excess over a deferred acquisition cost (DAC) or as an amount which includes an allowance for all future charges. The exposure to Lapses will be the loss of those future margins as limited by the application of a surrender charge or penalty. Fair Value of GMxB :- The fair value of the guarantee will however be heavily geared to the level of the market. As such the guarantee may be either a large asset or a large liability to the insurer and the impact of lapses will in general be situation dependent. Where the decision to lapse or retain the guarantee is considered to be a random or independent event, with perhaps a central assumption linked to duration in force then the fair value of the guarantee will include a fair value either higher or lower than the

25
median scenario based on the skew of the fair value to market conditions. In the case where policyholder decisions to either lapse or retain policies are made in whole or in part based on a rational determination of the fair value of the guarantee then the implications for valuation, product design, persistency management and hedging are significant. In particular, anti selective lapse behaviour manifests itself in a reduced propensity for lapsing when the fair value of the guarantee is positive to the policyholder (negative to the insurer) and, conversely where the guarantee has a negative fair value to the policyholder (positive to the insurer) there is an increased propensity for policyholders to lapse their guarantees. The impact of this rational behaviour is to significantly reduce the fair value of the GMxB as compared to the case of independent lapsing. In most markets some degree of rationality is assumed in the valuation of statutory, management and prudential reporting. That said, the empiric evidence of materially rational behaviour by policyholders is still under developed.
Withdrawal Most products provide some degree of flexibility for the policyholder to make withdrawals outside of the normal application of the guarantee. When this occurs, an adjustment needs to be made to guarantee balances in order to keep the moneyness of the guarantee unchanged so that the policyholder cannot adversely select against the company.
Benefit Utilisation
Benefit utilisation risk is the risk that the proportion of policyholders exercising their guarantee when it is in-the-money is different from that originally assumed. Benefit utilisation risk can vary significantly by market and market segment, depending upon the future market conditions and competing / substitute products.
Fund Switching
Most, but not all, GMxB products enable policyholders to choose the underlying managed funds to invest in, which may also vary over time. To the extent that a policyholder wishes to switch funds, then depending upon the relative volatility of the funds involved, this may have an impact on the moneyness, value and risks of the liability. Controlling this risk through product design is critical. The use of fund switching limits, pricing based upon funds allocated to risk categories, and the use of a restricted fund universe are important ways to control these risks.
Business mix Business mix risk relates to the risk that the mix of business assumed in the pricing basis does not eventuate. Given that it is not practical to have a pricing structure that is a function of all the relevant risk factors such as age, gender, asset allocation, fund selection, withdrawal levels etc., then it is necessary to aggregate these risk factors into larger risk factor buckets to make the product simpler to understand. This then creates some potential anti-

26
selection risk due to the fact that there will be some, hopefully minor, degree of cross-subsidisation going on.
3.2.4 Demographic Risks Demographic risks in GMxB products include mortality, longevity and potentially
morbidity. Traditionally, these risk factors were only able to be hedged via reinsurance, or retained and managed through the use of conservative pricing assumptions. However in recent years the mortality-linked securities market has started to develop, and although relatively embryonic (in 2009), this market may provide a capital market driven price and hedging solution for these risks. Mortality Risk Mortality risk relates to the risk of policyholders dying earlier than assumed. It is a particularly important risk for GMDB products, but is insignificant for living benefit guarantees. Longevity Risk In contrast to mortality risk, longevity risk relates to the risk of policyholders dying later than assumed. This is a significant risk factor for living benefits such as GMWB and GMIB products. There is currently significant uncertainty around this risk due to the modelling of future mortality improvement trends. Morbidity Risk Some GMxB products in some markets may have benefits that payout in the event of an ill-health or long-term care. For these products there will be a morbidity risk factor that relates to the risk of policyholders falling ill or requiring long-term care at a greater rate than that assumed in the pricing basis.
3.2.5 Other Risks Other risks relating mainly to the operation of the risk management solution for
GMxB products include expense risk, collateral/liquidity risk, financing risk, and operational risk. These risk factors are mitigated in different ways depending upon the nature of the risk management solution. Expense Risk Expense risk manifests itself in a few ways for a GMxB program. These include:
- Overheads Expenses relating to the human and technology resources are incurred in the management of a dynamic hedging program. Achieving economies of scale is important in helping to reduce the unit cost of these to achieve profitability.
- Asset Management Expenses are incurred by a fund in managing its investments, which are deducted from fund net asset values before deriving unit prices. Examples of such expenses include brokerage fees, taxes, duties, and transaction costs. As a consequence of this, returns calculated off unit prices will be slightly less than pure gross market returns less management fees. It is important to include these costs in the pricing of the product and to monitor their evolution over time. An additional consideration is the extent to which some of these fund expenses can be mitigated through stock lending programs.
Hedging and Funding Costs & Risks The replication costs of using a reinsurance program provide a simplified

27
measurement of the total cost of replicating the risks assumed by reference to the cost of transferring the risks. Such a strategy, were it available, would be a wholesale to retail strategy with some de minimis economies of scale available. Assuming a dynamic hedging strategy is to be utilised, it is important to countenance the cost of current hedge instruments comprising the option cost for option strategies and the funding cost for futures and swaps based strategies. The cost of rebalancing these instruments needs to countenance the bid/ask and brokerage costs for the roll over or rebalancing of the instruments as well as the future roll over risks wherein the costs of the hedge instruments has varied in the future according to market liquidity. In general, the cost of hedge instruments and the cost of rebalancing or trading them will increase when a market dislocates or comes under stress.
The cost of these solutions may also vary according to collateral and settlement frequency and counter party security as such care needs to be taken in assessing the true cost of hedges both currently and for future dates (see 4.4.2.2) Collateral and Liquidity Risk It is essential that the undertaking has regard to their liquidity and collateral positions having regard to both the policyholder obligations and the risk mitigation strategy entered into. The liquidity profile of the liability without regard to the risk mitigation will be a function of the portfolio of risks sold and the relative maturity of the portfolio. In general, guarantees are sold with no surrender value. As such, the realisation of cash claims is coincident with the insured events. The preponderance of liquidity management considerations arise through counterparty risk management associated with market risk management. In particular, where the fair value of hedge instruments is settled or is the basis of a variation in the amount of collateral, then there is an obligation to pay or receive amounts. Investment of Collateral Amounts which are received whether as collateral or settlement will need to be invested to match the implied risk free rate in the hedging or collateral program so as to ensure that the rolled up cash position together with variation in hedge instruments matches the required settlement obligations. This places a degree of pressure on the undertaking to source appropriately secure and liquid investment opportunities to match the return requirement. Return or Payment of Collateral The dominant liquidity concerns that arise for undertakings occur in the case of rapidly rising markets and markets where the fair value of provisions is negative.
- Where markets are rising after a fall there may be an obligation to settle amounts to risk mitigation partners representing a return of previously settled amounts. This may lead to costs associated with unwinding investments where proceeds are invested in other than cash deposits.

28
- Where the situation arises that the fair value of the guarantee is negative and the future profit is represented by an excess of future premiums over future expected claims a genuine liquidity strain can arise. This situation requires short term credit or funding facilities to be available to the undertaking.
Operational risk Operational risks cover issues such as mis-selling, governance failures, technology failures, hedge management and execution failures, key person risk, data management risks, third party risks, and fraud. Many of these risks will be dependent upon the risk management solution adopted.
3.3 Risk Mitigation Sections 4 to 8 will delve more deeply into the mitigation of the risks outlined
above. We will introduce the analysis here pointing to the relevant chapters for further detail. A key point to keep in mind, however, is that there are variants and combinations of strategies and legal forms that could be considered thus no list can ever be considered as complete.
Remain Unhedged Although it is uncommon to remain unhedged on the largest risk factors such as equity delta and interest rates, other risk factors such as long term key rate vega can be very difficult and expensive to hedge directly. Thus leaving some market risk factors unhedged and using economic capital as the ultimate mitigant might be the only effective solution available. Economic capital is a very useful tool in helping make such decisions and is covered in more detail in section 8. Dynamic Hedging Dynamic hedging the above market risk factors using liquid derivative instruments is the ultimate form of risk management. It is ‘ultimate’ in the sense that all other risk management solutions ultimately depend upon dynamic hedging to pass on the risks to the capital markets. Dynamic hedging programs are heavily resource and expertise intensive, and can be undertaken using internal resources or use outsourced solutions. This covered in significant detail in sections 4 and 5. Internal Reinsurance via Captives Internal reinsurance involves passing on some or all of the risks (market and other), to an internal group reinsurance company (i.e. a captive). This is a common solution for multinationals as it enables them to consolidate GMxB (and other) risk exposures in order to achieve economies of scale in their risk management programs. We review this option in section 7. External Reinsurance External reinsurance involves passing on some or all of the risks (market and other), to an external third party. This is introduced in section 6. Quasi Reinsurance and Hybrid Solution Third party structured derivative solutions sold by banks are an alternative way of mitigating at least some of the above market risks. Such solutions typically involve the structuring of a highly exotic derivative that meets the specific risk characteristics of a particular block of business. In most cases the investment bank will be unlikely to accept the demographic and policyholder behaviour risks. This is introduced in section 6.

29
4. DYNAMIC HEDGING - INSTRUMENTS, MARKETS AND CHALLENGES
In this section, we briefly introduce the theory of dynamic hedging. We do not dwell on it too long directing the reader to established texts on the topic. The primary aim of this chapter is to introduce the real world considerations in terms of instruments, market micro structure and costs. Additionally, we identify areas where residual risks are likely to arise whether due to the risks being unhedgeable or uneconomic to hedge. The key message from this section is that there are considerable frictional costs that need to be taken into account in appreciating the true cost of risk manufacture.
4.1 Instantaneous Neutrality 4.1.1 In respect of the market risks outlined in 3.2.1 and 3.2.2, we describe them in terms of their ‘sensitivities’, namely, delta, rho, vega etc., which are commonly referred to as greeks. Furthermore we establish a risk mitigation strategy, based on identifying, and, purchasing financial instruments with equivalent but opposite signed greeks. For a detailed and technical introduction to this topic we refer the interested reader to Taleb, (1997). 4.1.2 Under a dynamic hedging strategy, the aim is to offset movements over the next short period only, using the concept of risk neutrality as developed in the late 1970’s and as perhaps practised for many decades before by practitioners. A background to the evolution of hedging and the robustness of alternative methods of pricing and hedging under various frameworks may be found in the interesting thought piece by Haug & Taleb (2009). 4.1.3 The effectiveness of this instantaneous hedge position wanes with the passage of time, the movement in the levels of markets and change of business volumes. As such the hedge program needs to be monitored and updated frequently. The frequency and extent of the rebalancing will be company specific and will have regard to a range of factors including the costs associated with rebalancing, the degree or tolerance to market risk, the form of hedge instruments used, and the condition of the market. The balance of this section will address these considerations in significant detail.
4.2 Why do we need to understand dynamic hedging? Irrespective of how an undertaking will look, to manage its GMxB it is essential
to understand the process of dynamic hedging. Even when the risk is transferred the counterparty, an undertaking transacts with will be reliant on such a policy and thus the requirements of this approach will find their way into the cost, availability, or structure of all risk mitigation solutions.

30
Capital Markets
Instruments
Insurance Company
(White Labeller)
Re-Insurance Company
Third Party Service Provider
Investment Bank / Asset
Manager
(Sem
i) Sta
tic
Service Provision
Reinsurance
Dynamic
Dynamic
Dynam
ic
Dynamic
Cus
tom
ers
Gua
rant
ees
Service Provision
All roads lead to dynamic hedging (or no hedging!)
Figure 4: Risk Management Options The bottom line is there is no magic bullet in market risk mitigation just higher and lower degrees of competency, risk appetite or access to markets.
4.3 Choice of valuation basis 4.3.1 In order to determine the hedge portfolio, it is first required to develop a valuation of the liability which is to be hedged; in this regard the first step in the process is to determine the model and calibration for the liability valuation. The model and calibration selection will to some degree be a function of the purpose of the valuation. Thus it may well be that different valuations are performed for prudential and statutory reporting valuation purposes. 4.3.2 For the purpose of this analysis we will assume that a significant portion of the liability will be classified as an Embedded Derivative and thus would be subject to a fair value assessment in accordance with IAS39/IFRS9 and FAS 133, respectively according to jurisdiction. 4.3.3 Furthermore, market consistent valuation is implemented wherein the financial parameters underlying the valuation will be a combination of observable and unobservable parameters requiring expert judgement. 4.3.4 Finally the aggregate valuation itself will reflect an unobservable price of the underlying guarantee and would in most cases be classified as a Level 3 fair value measurement under International Financial Reporting Standards. 4.3.5 The expectation of the valuation is that the undertaking holds sufficient balance sheet resources to either replicate the cost of manufacturing the guarantee on its own books or have the financial wherewithal to transfer the obligation to a willing and knowledgeable buyer under the assumption that an orderly market existed.

31
4.3.6 This further suggests that the valuation represents an offer price basis in an orderly market where there are two way prices for bid and offer. In practice these liabilities are illiquid and unobservable as such it is not possible to reliably estimate at each point in time whether a price represents a bid, mid or offer price. In practice the movement of the valuation will be a function of the movement of the underlying parameters which will in most cases have higher liquidity as such the inclusion of a margin over the observable prices in most cases would appear to be a reasonable expectation in respect of the more illiquid risk combination. 4.3.7 For a more complete discussion on market consistent valuations and economic scenario generators we direct readers to Varnell, (2009), in particular, an examination of “Why Market Consistent”.
4.4 Hedging Challenges The opening sections of this chapter introduce the valuation and the concept of a
replicating portfolio and we have identified that there are challenges in determining the valuation parameters. In this section we will look to focus on some of the key challenges in valuation and replication and in particular, identify the following as key challenges:
1) Liquidity Requirements and Risks. 2) Funding and Collateral Costs. 3) Volatility Calibration and Hedging. 4) Basis Risk. 5) Behavioural Risk and Uncertainty. 6) Taxation.
4.4.1 Liquidity Requirements and Risks 4.4.1.1 Regardless of what risk transfer model is adopted, (e.g. reinsurance, dynamic hedging, and static hedging), the institution that is ultimately left with the risk will need to replicate the guarantee through use of dynamic hedging techniques for each of the risk factors identified. For each risk factor, hedging instruments are identified whose market value is sensitive to changes in the risk factor. Table 3 summarises the majority of derivative instruments that are typically used to hedge the main market risk factors of delta (market levels), rho (interest rates) and vega (volatility), and whether they are traded on an exchange or over the counter (OTC) via an investment bank. Table 3 contains is a non exhaustive list of instruments.
Table 3: Liquid
Instrument Exchange or OTC Delta Rho Vega Other Equity Index Futures Exchange Currency Futures Exchange Currency Forwards OTC Interest Rate swaps OTC Bond Futures Exchange Vanilla Equity Options < 5yrs
Mainly OTC withsome exchange
Gamma, Gap
Volatility Futures Exchange Interest Rate Swaptions OTC Gamma, Gap 4.4.1.2 Most of the above instruments are available on the main developed market equity indices and interest rates. The use of equity futures, currency futures &

32
forwards, interest rate swaps and vanilla options have been the most popular hedging instruments for GMXB dynamic hedging programs. Exchange traded instruments have been particularly popular as they are very liquid and not subject to credit risk as they are marked-to-market on a daily basis. Note that some of the instruments in Table 3 provide risk protection against more than one risk factor: interest rate swaps can be used to hedge both the discount factor interest rate risk (rho), as well as bond fund value risk (delta). Vanilla equity options provide exposure to all three of the main risk factors, in addition to convexity or gamma risk, as well as the risk of sudden large falls in market levels (gap risk). 4.4.1.3 Table 4 highlights hedge instruments that are less liquid but can also be used to construct suitable hedges.
Table 4: Less Liquid
Instrument Exchange or OTC Delta Rho Vega Other Vanilla Equity Options > 5years
OTC Gamma, Gap
Variance swaps OTC Gamma Inflation & Credit swaps OTC Total Return swaps OTC Equity Rate Hybrids OTC Correlation
4.4.2 Funding and Collateral Costs Text book illustrations assume that borrowing and lending occur at no cost and that no counterparty exposures exist between the parties to a trade, the real world is somewhat different from that and, in particular, there are two general areas where we need to consider adjustments to our models to allow for this. For a technical analysis of this issue an interesting research article by Piterbarg, (2010) is recommended.
4.4.2.1 Implied Forwards and Repurchase (Repo) Rates 4.4.2.1.1 Under a no arbitrage framework the future price of a (dividend free) share is equal to the current price rolled up at the risk free rate under the assumption that one could borrow cash and buy the shares or alternatively sell the shares, buy the future and lend the cash. This same principle underpins the principle of put call parity which is the option equivalent no arbitrage constraint. 4.4.2.1.2 When we observe the price of futures and options we realise that the conditions do not hold in the real world and this is primarily due to:
- the existence of costs associated with the borrowing and lending of cash and shares, and/or
- Disequilibrium between buyers and sellers of shares and futures representing a higher proportion of hedgers over speculators.
4.4.2.1.3 The level of repurchase rates will be a function of the relative depth and liquidity of the underlying markets thus exchange traded futures will exhibit lower repo rates than over the counter total return swaps. Within total return swaps, those based on more liquid underlying funds and indices will have lower replication costs that less liquid ones etc.

33
4.4.2.1.4 Furthermore, these costs are not stable over time and in particular, are reflective of supply and demand equilibrium which can be effected from either side. For example
- Supply side: reduced availability of short positions can arise where restrictions are placed on short sales due to either regulatory or economic considerations (such as credit concerns).
- Demand side: increased demand can arise due to an increase in the number of risks to be hedged or the quantum of hedge required to maintain existing positions. In particular, where markets have fallen the quantum of short positions increases as the volume of aggregate market delta increases (as underlying exposures are more in the money and thus more sensitive to market movements).
4.4.2.1.5 This supply-demand equilibrium indicates the existence of feedback loops and point to the need to consider future repo costs as having a relationship to market levels. 4.4.2.1.6 In terms of how we allow for this pricing in our fair value modelling the market consistent price of our embedded derivative should have regard to the no arbitrage principle thus make an allowance for current and expected future hedge borrowing costs. 4.4.2.1.7 The impact of these costs can be material given the ultra long nature of the obligations and the impact of variation in the repo rate. This is analogous to a realisation of variation in the risk free rate or rho Risk.
4.4.2.2 Collateral Costs 4.4.2.2.1 By collateral costs we refer to the cost associated with the provision or receipt of collateral to back variations in hedging instruments. Thus, for example, where an option price is fully collateralised at outset the contract is (credit) risk free to the buyer and seller. However the ability to receive that collateral will come at a price, either explicitly or implicitly. 4.4.2.2.2 An explicit price would arise through the offer of two alternative bases for the instrument being prices with or without collateral. 4.4.2.2.3 An implicit basis would be through the reference rate at which the collateral rate is deemed to roll up or accrue. Thus, for example, where collateral is deemed to accrue at a high interest rate the counterparty has in effect lent the undertaking money at a high rate the excess margin on which will support the obligation to pay for the discounted obligation under the option contract. 4.4.2.2.4 In the case of an OTC agreement the basis for collateral is covered in most cases under a collateral support agreement (CSA) that conforms to an International Settlement and Derivatives Association (ISDA) standard. 4.4.2.2.5 Where the instrument is exchange traded the requirements of the exchange will govern the settlement process and in particular, the deemed rate will be an overnight interest rate basis in most cases.

34
4.4.2.2.6 The cost of collateral will also be sensitive to market conditions where for example variations between interbank rates such as LIBOR and deemed risk free rates such as Overnight Swap curves and Treasury rates can move significantly in times of distress.
4.4.3 Volatility 4.4.3.1 Volatility is a term that can generate a lot of debate. However much of that can be due to a lack of clarity of definition and an inappropriate interchange of two distinct measurements, namely statistical volatility and implied volatility. For those with a keen interest or requirement to understand volatility at a deeper level we refer you to Gatheral (2006). 4.4.3.2 Statistical volatility describes the entirety of the model for the diffusion process underlying the returns or paths of a particular unit. In contrast implied volatility describes the parameter which when used to represent the standard deviation parameter of a closed form Black Scholes pricing model will replicate the observed market price of an option. Thus these are two very different quantities with related but distinct application. 4.4.3.3 As a rule of thumb then what can we contemplate when we look to move from statistical volatility to implied volatility? As a generalised concept it is perhaps useful to link them through a relationship as follows:
Implied Volatility ≈ Statistical Volatility + Frictional Cost + Liquidity + Model Adjustment
- Where statistical volatility represents the diffusion process of the unit price
under observation. - Frictional cost relates to the cost of peak risk or gamma risk as mitigated
through any and all of: • Frequent rebalancing (thus incurring bid/ask margins on delta hedge); • Purchase of out of the money options for gamma management; and • Insurance cost of unhedged exposure.
- Liquidity is the time-to-time and market-to-market adjustment reflecting the deviation from equilibrium costs.
- Model adjustment reflects the adjustments for term and moneyness required to calibrate the volatility surface.
4.4.3.4 To the extent that our fair value is referenced to (market) implied volatility then variations in any or all of the components of implied volatility above will lead to variations in the liability valuation. 4.4.3.5 The dominant impact on the valuation will be variation in the level of volatility with variations in the term structure and skew of volatility being of secondary consideration. 4.4.3.6 Furthermore the reliability of estimation of implied volatility is restricted to a limited number of indices and interest rates and a finite number of durations. In looking to estimate implied volatility in these unobservable spaces expert judgement
35
is required and will need to have regard to both the inherent statistical attributes for volatility such as mean reversion but critically will need to have regard to the add on components (liquidity, frictional cost etc) to ensure a prudent quasi market consistent parameter is established.
4.4.4 Basis Risk 4.4.4.1 A key challenge in successful replication is to appreciate how well our hedging instrument replicates the performance of the item to be hedged. This is a critical consideration and in particular, an area that requires an element of discipline in its definition. In 3.2.2 we sought to disaggregate observed basis risk into three distinct categories namely:
- Tacking Error. - Mapping Error. - Proxy Risk.
4.4.4.2 In determining our response to observed basis risk or in anticipation of future basis risk, it is thus critical to understand the causative factors that can and will give rise to basis risk and to make appropriate risk management choices accordingly.
4.4.5 Behaviour Risk 4.4.5.1 Behaviour Risk primarily frustrates the replication regime in so far as it interrupts the ability to pre plan the path of behaviour and reduces the scope to implement static hedging solutions as we have significant uncertainty as to the quantum of hedge to purchase for each future path and point. 4.4.5.2 This becomes all the more challenging where feedback or correlation exists between future behaviour and the state of the various market risk parameters. 4.4.5.3 The cost/benefit of this variability has a consequence for hedge design in so far as the rebalancing of illiquid instruments is more costly than the rebalance cost of liquid instruments thus leading to perhaps a bias towards liquid instruments in the presence of significant behavioural uncertainty. 4.4.5.4 Conversely the greater the determinism of behaviour and/or the greater the insensitivity of the liability profile to varying behaviour the greater the scope to utilise compressed hedge solutions such as semi static or long dated options. 4.4.5.6 As above, the final decision will require an optimised decision incorporating the demands of the product, distribution, price, and cost of hedging.
4.4.6 Taxation within the Fund 4.4.6.1 Finally, it is worth a specific comment that in certain jurisdictions (UK) policyholder taxation may occur within the unit fund backing the liability. The inclusion of a tax calculation within the unit fund introduces a fund drag that is akin to a dividend stream whose quantification will be a function of the taxation basis. 4.4.6.2 Variants or constituents that will impact on the complexity and precision of the valuation exercise include:

36
- Differing tax rates and allowances applying to capital gains and income. - Differing treatment for different assets. - Existence of thresholds and Inflation linking or other variation in thresholds. - Tax rules for carry forward or backward of reliefs.
4.4.6.3 These factors not only impact on the valuation but also impact on hedging and in general militate against a successful transfer of the obligation on a full reinsurance basis.
5. DYNAMIC HEDGING – MANUFACTURING PROCESS AND OPERATIONS This section outlines the considerable resource requirements to manufacture the
guarantee. From the analysis it should be apparent that there is a substantial overhead in terms of people, technology and operational infrastructure all requiring expertise. These demands have implications for the viability of an own risk manufacture approach noting that there are opportunities to outsource many of the resource intensive components.
5.1 Manufacturing Once a product has been launched, various activities are required in order to replicate the Guarantee. Figure 5 shows the inter-relationships between these activities. These activities broadly fall within four main areas:
1) Administration. 2) Liability Management. 3) Risk Management and Hedging. 4) Operational Governance.
5.1.1 Administration The first task relates to properly capturing the status of in force policyholder
balances and other state variables. Of particular importance is capturing and maintaining guarantee balances. In addition to this, regular policy data extracts are needed to feed into the liability valuation system. Automation routines are generally set up for this process. Periodically, fund mapping results are also updated based upon the latest returns.
5.1.2 Liability Management In this section, we will provide a high level overview of the valuation
considerations. The key observation from this section is that liability management is a critical component that is skill, resource and time intensive.
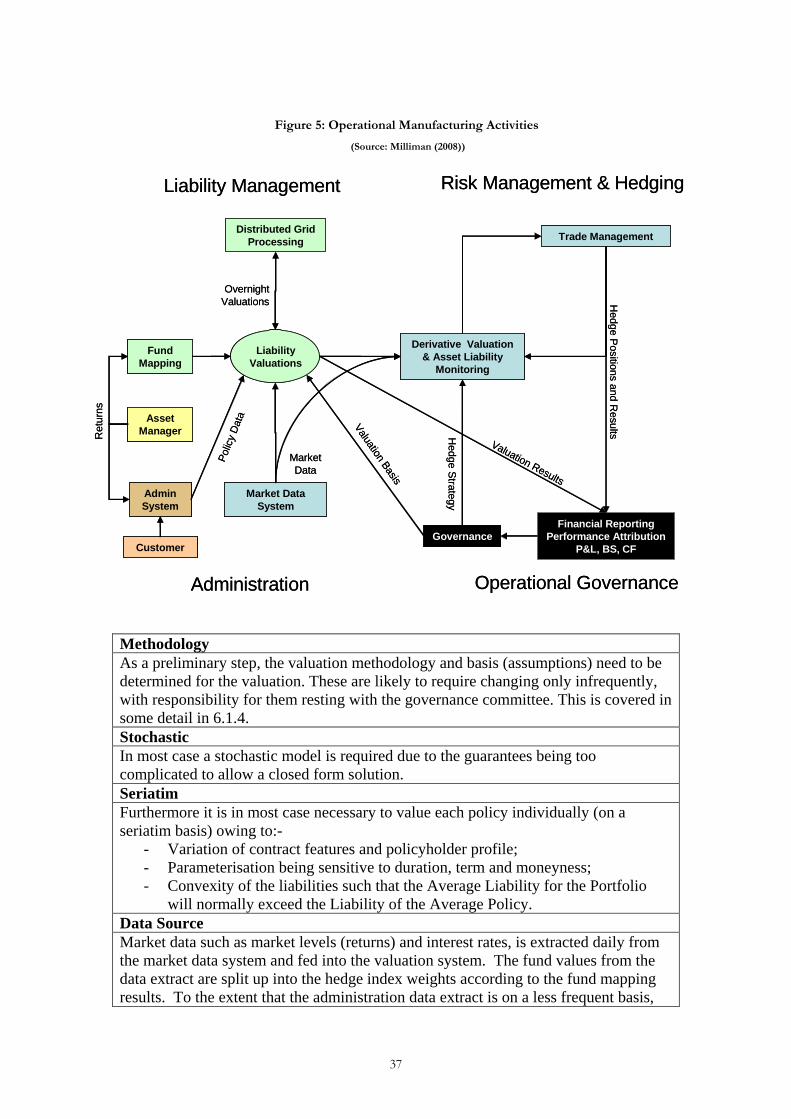
37
Methodology As a preliminary step, the valuation methodology and basis (assumptions) need to be determined for the valuation. These are likely to require changing only infrequently, with responsibility for them resting with the governance committee. This is covered in some detail in 6.1.4. Stochastic In most case a stochastic model is required due to the guarantees being too complicated to allow a closed form solution. Seriatim Furthermore it is in most case necessary to value each policy individually (on a seriatim basis) owing to:-
- Variation of contract features and policyholder profile; - Parameterisation being sensitive to duration, term and moneyness; - Convexity of the liabilities such that the Average Liability for the Portfolio
will normally exceed the Liability of the Average Policy. Data Source Market data such as market levels (returns) and interest rates, is extracted daily from the market data system and fed into the valuation system. The fund values from the data extract are split up into the hedge index weights according to the fund mapping results. To the extent that the administration data extract is on a less frequent basis,
Figure 5: Operational Manufacturing Activities
(Source: Milliman (2008))
Liability Management
Distributed Grid Processing
Liability Valuations
Admin System
Market Data System
Derivative Valuation & Asset Liability
Monitoring
Hedge S
trategy
Financial Reporting Performance Attribution
P&L, BS, CFGovernance
Risk Management & Hedging
Valuation Basis
Trade Management
Valuation Results
Overnight Valuations
Polic
y D
ata
Operational GovernanceAdministration
Market Data
Customer
Asset Manager
Fund Mapping
Ret
urns
Hedge Positions and R
esultsLiability Management
Distributed Grid Processing
Liability Valuations
Admin System
Market Data System
Derivative Valuation & Asset Liability
Monitoring
Hedge S
trategy
Financial Reporting Performance Attribution
P&L, BS, CFGovernance
Risk Management & Hedging
Valuation Basis
Trade Management
Valuation Results
Overnight Valuations
Polic
y D
ata
Operational GovernanceAdministration
Market Data
Customer
Asset Manager
Fund Mapping
Ret
urns
Hedge Positions and R
esults

38
fund values may need to be rolled-forward in line with index returns. From time to time (say monthly or quarterly), fund returns will be sourced from the asset manager, administration system or market data system, which will be used to update the fund. mapping analysis results, to ensure that they are still valid. Valuation Once all of the inputs have been sourced, the valuation routine can then be set off. Computational Intensity/Resources Due to the computationally intensive nature of this process, it is necessary to perform these valuations on a high capacity system, such as distributed grid computing platform. A grid computing platform enables the computational load to be distributed across a large number of processing engines which work in parallel to perform the valuation. Output The output of the valuation process is a valuation table that summarises the baseline valuation result, plus a multitude of additional valuations where the various risk factors have been shocked. This trading grid enables the Greek risk sensitivities to be estimated for developing market conditions over the following day.
5.1.3 Risk Management and Hedging 5.1.3.1 The risk management and hedging process involves “continuously” comparing the liability risk sensitivities (i.e. the Greeks) to the hedge asset risk sensitivities. Therefore, the hedge management system requires a live link to a market data system such as Bloomberg, in order to keep track of all active derivative positions. Where price information is available (e.g. for exchange traded contracts) the information can be used directly. Where price information is not available (e.g. for OTC derivatives such as swaps and options), derivative valuation logic is required to undertake market consistent valuations of the instruments. 5.1.3.2 The trade management process involves setting risk thresholds which, if breached, trigger rebalancing trade recommendations which are then executed. 5.1.3.3 Various back-office activities are then undertaken to complete the trade including trade notification, contract settlement, margin and collateral management, and cash management. Once the trade is confirmed, the hedge positions are updated in the hedge management system. 5.1.3.4 The choice of actual hedge strategy to use is somewhat independent of the above process. Whether it involves the use of exchange traded derivatives such as futures and swaps to manage delta and rho, or options to provide vega (and other) protection, does not affect the need to value and monitor the asset liability positions on a regular (i.e. daily or live) basis.
5.1.4 Operational Governance 5.1.4.1 The final stage involves the holistic monitoring and governance of the entire process. This may be the responsibility of a governance committee which typically includes senior representatives from each of the main function areas (IT, liability management, hedge management, reporting, and governance) as well as more independent senior executives. The committee is responsible for setting liability valuation strategy, hedge strategy, managing operational risk by the setting of

39
guidelines, responsibilities, authorisations and procedures, and stakeholder management including both internal and external stakeholders. 5.1.4.2 In some cases, the hedge strategy guidelines are codified; that is, they are signed off by both the Board and the regulator, and thus require a significant amount of effort to be changed. The benefit of doing this is that it provides both internal management and external parties such as rating agencies and the investor community with a strong and clear message that a proper governance process is in place and that the risks are under control. The downside is that depending upon how it is framed; it may inhibit flexibility in rapidly changing conditions. 5.1.4.3 A critical part of the management information that this committee relies upon to do this job is financial reporting, risk reporting and performance attribution. Performance attribution is essential to measuring and understanding the sources of profit (loss) and thus how well the hedge is performing relative to the overall objectives of the program. 5.1.4.4 Alongside governance of the hedging programme, it is also important that the exposure to risks that are not hedged is managed. This involves monitoring of the aggregate exposure to such risks and understanding their nature, for example if they are systematic or diversifiable. As a hedging programme develops and as new instruments become available consideration may also be given to adding such risks into the programme.
5.1.5 Infrastructure and Resource Requirements 5.1.5.1 Table summarises the broad resource requirements in terms of software, hardware and the human expertise and experience required in order to undertake the above activities. Table 5: Infrastructure and resource requirements Area Software Hardware Expertise & ExpertiseProduct development
Pricing / valuation model, Financial projection model, Market Data, Profit testing
model, Capital model
Single pc for most, high capacity computing system for nested
stochastic financial projections
Marketing, Actuarial / Risk Management, IT
Administration Admin system, Data extracts, automation and validation
routines
Admin system IT, Actuarial
Valuation Valuation model, Market data system automation routines
Grid computing system IT, Actuarial
Hedge maintenance
Asset-liability / derivative valuation / hedge management
model, Market data system
Single pc(s) Capital Markets, Quantitative
Developers, Back-office admin
Performance Reporting
Databases, Reporting and performance attribution models
Single pc(s) Actuarial
Operational governance
N/a N/a Actuarial / Risk Management, Capital Markets, Executives
5.1.5.2 The computational capacity and people required are dependent upon the size of the in force block under management, and the scope of pre-launch product

40
development work required. At a minimum, at least a couple of specialist people are required each for the liability management, risk management/hedging, and financial reporting activities. 5.1.5.3 It is important to note that significant expertise and experience is required by the people involved in each activity. Using an automobile analogy, the software and hardware is the chassis of the manufacturing programme, but alone are not sufficient make the car drive or run the programme. For that an expert and experienced driver is still required to operate and navigate it safely towards its long term destination. 5.1.5.4 There is also a separation between the production environment, and the product and quantitative development environment. The models, hardware, data transfer processes and automation routines required for the production environment necessitate a very high degree of robustness, validation and control. Given that large sums of real money are actively managed off the output of this system, it will need to be subject to disaster recovery procedures for which best practice dictates having access to either a second or backup grid computing system. Validation testing and auditing of the whole system is of the highest importance. With growing scale, the consequences of errors become more material and the systems need to be refined in order to ensure that they still adequate. In contrast, the environment for product design and quantitative development is significantly more relaxed and open.
5.2 Indirect Calculation/Replicating Portfolios 5.2.1 The valuation basis in 5.1.5 utilised a direct calculation approach with all the resource intensity required to support the stochastic and nested stochastic valuations. Such a direct calculation basis is the preferred route in most circumstances and is the method most commonly employed by leading GMxB providers today. 5.2.2 An alternative or complimentary approach is to use a combination of the direct calculation basis as identified above together with a directly observable set of prices to deliver real time market prices for the portfolio, as the cost of some precision. This indirect measurement approach is commonly referred to as a replicating portfolio approach wherein a pool of financial instruments are identified (much as our hedging exercise) which, when combined together, deliver a sensitivity profile matching the liability. This pool of instruments are then considered as a proxy or surrogate for the direct liability valuation and are used as a reference for measuring changes in the liability with respect to the market. For the avoidance of doubt this replicating portfolio is not the liability it is a proxy measurement for the liability.

41
Models are only Models A key point to keep in mind at all times is that models are by definition an abstract representation of the real world. In the case of the use of a replicating portfolio approach, the liability is replicated with closed-form formulae assets. Thus:
- The valuation is a proxy of the “price” of the future cash flow. - The replication is a proxy for the movement in the valuation.
Thus errors and deviations in the valuation and errors and deviations in the use of replicating portfolios can and will compound with respect to the real world outcome.
5.2.3 How is the replicating portfolio determined? 5.2.3.1 Our dynamic hedging portfolio has regard to the movement in the balance sheet over a short space of time without regard to the future cash flows that may arise. 5.2.3.2 A replicating portfolio will have greater regard to the timing and variability of future cash flows if it is to deliver a durable or robust match to the liability over any reasonable period of time. If not the replication matching exercise would need to occur with an increasing frequency so as to perhaps obviate the need for it in the first place. 5.2.3.3 The universe of assets available to include in the replication is richer than is perhaps available for the dynamic hedging strategy as trading cost considerations are lower (this is a notional asset portfolio), and in particular, may include more option based instruments. 5.2.3.4 The process of fitting a replicating portfolio involves an iterative process of fitting combinations of financial instruments to achieve an acceptable level of statistical fit, where the iterations are automated and solved using computational optimisation models. 5.2.3.5 For a deeper introduction to replicating portfolios, see Boekel et al. (2009).
5.2.4 The replicating portfolio is not necessarily the hedging portfolio The replicating portfolio exercise discussed in 5.2.3 represents the valuation exercise to produce a reference liability valuation that has been boot strapped to a finite universe of asset instruments that can be priced on a market consistent basis using closed form formulae. This provides information and insight as to the nature of the liability. However, it does not necessarily determine the hedging portfolio owing to the following:-
- The goodness of fit of the replicating portfolio under the valuation may not be sufficiently high for risk management purposes.
- Hedge universe may include assets and combinations of assets not included within the reference asset pool, in particular, illiquid instruments.

42
- Hedging policy may not require £ (or $,€ as the case may be) for £ ($/€) replication thus decisions on what, when and how to hedge may not be determined under the replicating model.
5.2.5 When or why use replicating portfolios? 5.2.5.1 Replicating portfolios are of significant benefit in providing speedy and computationally light valuation information and are of significant benefit to life insurance companies in valuing a range of liabilities. In particular, there are considerable benefits in using this information for producing interim management and financial reporting information with acceptable levels of valuation error or approximation so that the information is fit for purpose. 5.2.5.2 When we come to GMxBs, the need for precision does however start to militate against the wide spread use of replicating portfolios for the reasons outlined above. There are however a number of specific areas where they are of use or can add value:-
- Depending on the scale of the portfolio the overhead of the direct computational approach may lead to a trade off between cost and precision.
- Where the guarantees are of low complexity such as simplified return of premium benefits then a simplified approach of replication may be appropriate.
- The use of speedy, proxy information can be valuable during periods of volatility so as to give some information as to the evolution of liabilities over short periods. This is a best of both approach however and not and either/or.
5.3 A final word on the risk manufacture challenge 5.3.1 In providing market risk guarantees, insurance companies in many ways are seeking to deliver investment bank solutions to the retail market. This has significant implications in terms of the ability of the undertaking s and regulators to satisfy themselves and their stakeholders that they have the requisite competence to do so safely and profitably. This becomes all the more challenging where the insurance sector seeks to out do investment banks in terms of duration, complexity, liquidity and directional exposure to market risks with potentially a much weaker toolkit. This perhaps illustrates either the differing stakeholder focus of the two communities where the insurance sector is stretching to deliver meaningful, customer centric solutions or some fundamental differences in opinion as to risk management. 5.3.2 Without judging the source of the different approaches it is perhaps useful to identify that the insurance sector can learn from the investments banks how to competitively and sustainably develop its sources of risk transfers capability, using all market outlets whether through exchanges, OTC markets, with banks, reinsurers, hedge funds and pension funds. 5.3.3 Additionally perhaps the insurance sector needs to contemplate the creation of products for sale back into the retail market through for example the sale of volatility and other flows in the form of packaged investments. Thus the lines between the many pillars of the financial markets will likely continue to or need to develop and merge with skills and capital following suit.

43
6. STATIC RISK TRANSFER SOLUTIONS In this section, we will briefly introduce static hedging solutions as delivered
through reinsurance or investment bank ‘quasi’ reinsurance solutions. We will then look to analyse the additional risks and considerations introduced by use of such solutions, in particular, we will look at the following factors:
- cost ; - availability and liquidity; - coverage limitations; - reliance or dependence on third party; and - counterparty risk.
6.1 Most Common Static Risk Transfer Solutions
6.1.1 Reinsurance 6.1.1.1 Reinsurance is a familiar enough tool such that it does not require significant explanation. In general, we are referring to indemnity contracts of insurance between the undertaking (the cedant) and another insurance entity (the reinsurer) whereby specified risks are transferred under a contract of reinsurance for a specified price. 6.1.1.2 Under a fully comprehensive quota share agreement the reinsurer would indemnify the cedant for a proportionate share of the obligations in return for a (modified) participation in the rider fee charged to policyholders. 6.1.1.3 Owing to the diversity of underlying policyholder profiles and underlying policies it is not usual to assume and underwrite risks on a bulk basis as such a seriatim basis of reinsurance will normally apply where each policy is individually reinsured under the contract of reinsurance and individual policyholder and policy information is required to be exchanged between the parties with a high degree of frequency to enable adequate risk management. 6.1.1.4 Variations to this quota share may include:
- Inclusion of underlying contract within the reinsurance to aid in persistency management;
- Inclusion of origination costs and financing margins to mitigate the effects of new business strain; and
- Cover the cedants exposures on an excess of loss basis only such that only claims for significantly adverse outcomes are transferred.
6.1.1.5 Furthermore, the reinsurer may apply certain restrictions or limitations on the cedant to ensure an appropriate alignment of interest or to allow for effective risk management of the underlying risks by the reinsurer. In particular, the following are common features:
Limitation to the extent or degree of behavioural risk assumed and/or the cedants policy for managing behavioural risk.
- Limitation to the extent or degree of freedom the cedant has in the selection or performance of asset managers against benchmarks.
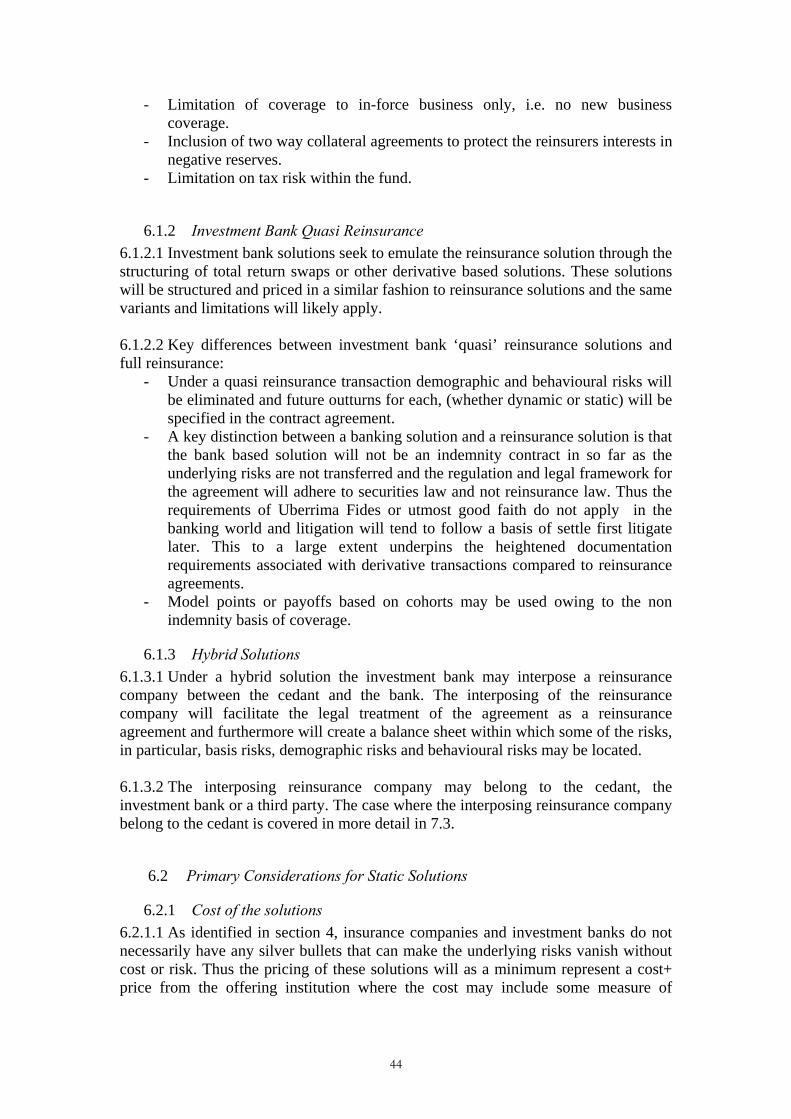
44
- Limitation of coverage to in-force business only, i.e. no new business coverage.
- Inclusion of two way collateral agreements to protect the reinsurers interests in negative reserves.
- Limitation on tax risk within the fund.
6.1.2 Investment Bank Quasi Reinsurance 6.1.2.1 Investment bank solutions seek to emulate the reinsurance solution through the structuring of total return swaps or other derivative based solutions. These solutions will be structured and priced in a similar fashion to reinsurance solutions and the same variants and limitations will likely apply. 6.1.2.2 Key differences between investment bank ‘quasi’ reinsurance solutions and full reinsurance:
- Under a quasi reinsurance transaction demographic and behavioural risks will be eliminated and future outturns for each, (whether dynamic or static) will be specified in the contract agreement.
- A key distinction between a banking solution and a reinsurance solution is that the bank based solution will not be an indemnity contract in so far as the underlying risks are not transferred and the regulation and legal framework for the agreement will adhere to securities law and not reinsurance law. Thus the requirements of Uberrima Fides or utmost good faith do not apply in the banking world and litigation will tend to follow a basis of settle first litigate later. This to a large extent underpins the heightened documentation requirements associated with derivative transactions compared to reinsurance agreements.
- Model points or payoffs based on cohorts may be used owing to the non indemnity basis of coverage.
6.1.3 Hybrid Solutions 6.1.3.1 Under a hybrid solution the investment bank may interpose a reinsurance company between the cedant and the bank. The interposing of the reinsurance company will facilitate the legal treatment of the agreement as a reinsurance agreement and furthermore will create a balance sheet within which some of the risks, in particular, basis risks, demographic risks and behavioural risks may be located. 6.1.3.2 The interposing reinsurance company may belong to the cedant, the investment bank or a third party. The case where the interposing reinsurance company belong to the cedant is covered in more detail in 7.3.
6.2 Primary Considerations for Static Solutions
6.2.1 Cost of the solutions 6.2.1.1 As identified in section 4, insurance companies and investment banks do not necessarily have any silver bullets that can make the underlying risks vanish without cost or risk. Thus the pricing of these solutions will as a minimum represent a cost+ price from the offering institution where the cost may include some measure of

45
efficiency of funding or risk management and the plus component will be a function of the alternative uses that the capital may be applied to. 6.2.1.2 It is fair to say that there continues to be a gulf between many wholesale prices and the replication prices as estimated by insurance companies and/or the price limit tolerated by the market. It is important that in reconciling the differences between these that the insurance company is not necessarily blind to the impact of the various future market protections embedded in a comprehensive solution. In particular, such solutions will likely provide comprehensive coverage against:-
- Higher Sensitivities. - Cross Greeks. - Correlation. - Funding Costs (variation in implied forward and repo rates). - Long Term Volatility.
6.2.1.3 Thus for a true price comparison it is essential that these important components (which can easily represent 10% or more of the total cost of liabilities, i.e. before deduction of future premiums) are fully considered.
6.2.2 Availability and liquidity 6.2.2.1 This is possibly the biggest concern and criticism of static solution (next to price) and to some extent echoes the quote from the movie, Annie Hall (MGM 1977), where the Woody Allen character Alvey Singers tells the joke of two ladies in a restaurant where the first lady claims “the food at this place is really terrible” and the second replies “yeah and such small portions”. 6.2.2.2 In this we have the situation where static solutions are criticised for their cost and coverage but are equally criticised for their lack of availability. There is an element of market convergence required to close this gap in so far as if there were more volumes traded there would likely be more volume available, etc. That said the investment banking world is to some extent fickle in its attitude to taking a ’position’ in risk and will in most instances be wholly reliant on its ability to distribute risk in order to sell capacity. The financial crisis of 2008 to 2009 led to an almost complete shut down in the availability of long term options due to a combination of factors including the closure of hedge funds and other supplier of variance or volatility capacity and the impairment of bank balance sheets which impacted the ability and willingness to take risks. 6.2.2.3 Thus the market in third part solutions can and will develop further; however, there will be a need for greater convergence of pricing perspective between markets for volumes to materially increase.
6.2.3 Reliance on Third Party 6.2.3.1 This is a key consideration and will be raised further on in the paper under strategic considerations. The bottom line is: an insurance undertaking who has committed resources to developing and selling GMxB product into a market will require a stable supply of capital and capacity to deliver the guarantee. Owing to the

46
uncertain supply and pricing of static/wholesale solutions and the constraints on coverage it is likely in appropriate for an insurance company to be wholly reliant on third party supply of capacity. 6.2.3.2 Thus the use of static solutions is perhaps appropriate:
- as a pre cursor; - as a complement or extension; - as a tactical addition to an own manufacture capacity; - as an exit strategy.
6.2.3.3 It is, however, unlikely to be a suitable strategy as the sole form of support to a long term business strategy.
6.2.4 Coverage limitations 6.2.4.1 Coverage limitations are an often cited criticism of static solutions in particular, the usual limitations as to behaviour risk, basis risk and new business risk. From our analysis of risks in section 4 we have identified that these are some of the thornier residual risks and furthermore that they are often best managed by the insurance undertaking (or at least are most capable of being effected by the insurance undertaking). 6.2 4.2 A further consideration is to identify whether or not there is an asymmetry of interest between the risk management of the rider and other elements of the value proposition in respect of these residual risks. In particular:-
- Lower lapses are positive for the embedded value of the underlying policy but negative for the Rider.
- Increased basis risk can lead to greater volumes being sold and/or higher management fees off the back of selling more proprietary /active funds.
- New business risk is offset by increased stability in sales origination and costs of re-pricing and reissue of documentation.
6.2.4.3 In each of these cases the benefit will fall outside of the rider. However, the risk is primarily borne by the rider. Thus it is likely that these asymmetries are in most cases irreconcilable, even through pricing, and reflect underlying risk decisions the insurance company would need to take were it to replicate the guarantee itself.
6.2.5 Counterparty risk The final consideration and arguably most important consideration is counter
party risk. In this we are concerned not just with the recovery of the fair value of the obligation as is most likely covered in whole or in part by a collateral mechanism but more significantly the contingent risk that may arise.
6.2.5.1 First Order Protection There are a number of mechanisms to ameliorate these first order counterparty
risks.
- Selection of Counterparty The first level of protection will arise through the choice of an appropriate counterparty having regard to their ability to make good on their commitments under the agreement having regard to the circumstances when the contract will
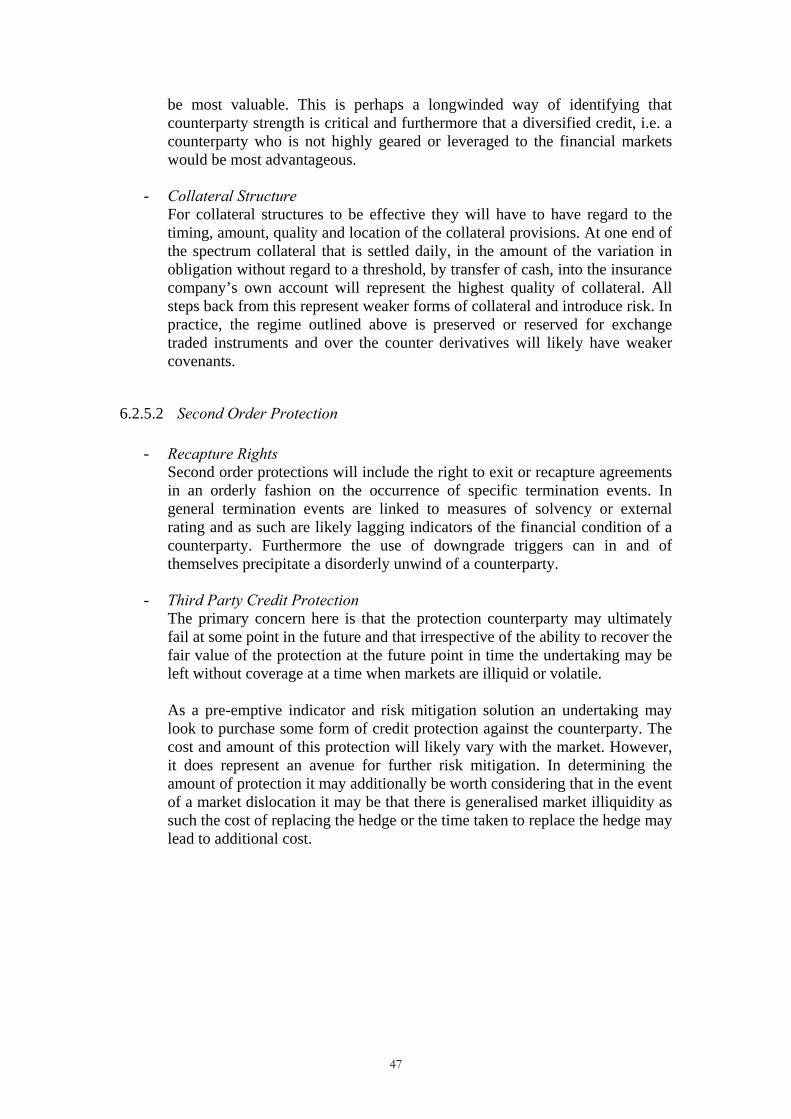
47
be most valuable. This is perhaps a longwinded way of identifying that counterparty strength is critical and furthermore that a diversified credit, i.e. a counterparty who is not highly geared or leveraged to the financial markets would be most advantageous.
- Collateral Structure
For collateral structures to be effective they will have to have regard to the timing, amount, quality and location of the collateral provisions. At one end of the spectrum collateral that is settled daily, in the amount of the variation in obligation without regard to a threshold, by transfer of cash, into the insurance company’s own account will represent the highest quality of collateral. All steps back from this represent weaker forms of collateral and introduce risk. In practice, the regime outlined above is preserved or reserved for exchange traded instruments and over the counter derivatives will likely have weaker covenants.
6.2.5.2 Second Order Protection
- Recapture Rights Second order protections will include the right to exit or recapture agreements in an orderly fashion on the occurrence of specific termination events. In general termination events are linked to measures of solvency or external rating and as such are likely lagging indicators of the financial condition of a counterparty. Furthermore the use of downgrade triggers can in and of themselves precipitate a disorderly unwind of a counterparty.
- Third Party Credit Protection
The primary concern here is that the protection counterparty may ultimately fail at some point in the future and that irrespective of the ability to recover the fair value of the protection at the future point in time the undertaking may be left without coverage at a time when markets are illiquid or volatile. As a pre-emptive indicator and risk mitigation solution an undertaking may look to purchase some form of credit protection against the counterparty. The cost and amount of this protection will likely vary with the market. However, it does represent an avenue for further risk mitigation. In determining the amount of protection it may additionally be worth considering that in the event of a market dislocation it may be that there is generalised market illiquidity as such the cost of replacing the hedge or the time taken to replace the hedge may lead to additional cost.

48
7. GROUP STRUCTURES, CAPTIVE ARRANGEMENTS AND OUTSOURCING For companies who are attracted to dynamically manufacturing guarantees by
retaining the guarantee liability on their balance sheet there are a range of alternatives to undertake the associated activities. These range from centralisation of skills and resources into pools and centres of expertise through to the consolidation of those risks into a single group entity. Furthermore there is scope for an undertaking to access resources and expertise from third party providers as a compliment to the group organisation and infrastructure. This chapter introduces these elements and alternatives with a particular focus on group operation and structure, expense management, governance framework and intellectual capital.
7.1 Centralised Processes, Policies and Personnel As a first consideration it is important to separate out the centralisation of
policies, processes, controls and personnel from the act of physically centralising risks. The following sections will focus on elements of group structure and process that may be centralised without necessarily requiring centralisation of risks.
7.1.1 Valuation, Reporting, Risk Limits Pricing, modelling and hedging policies can all be developed centrally relying on
distributed sites to manage their balance sheets within policy. This approach provides diverse groups the ability to know minimum standards are adhered to, but flexibility is afforded for local operations to manage their business in the most appropriate way. This is in effect the ‘Think Global Act Local’ motto in operation.
7.1.2 Risk Mitigation (Structuring and Hedging) 7.1.2.1 Given the requirement for centralisation of skills and resource it may well make sense for an internal service centre or asset manager to implement hedging on behalf of subsidiary undertakings. 7.1.2.2 In this arrangement a single team manages the hedging arrangements for a number of portfolios under service agreements with execution, capital and financial management being carried out by distributed teams on original balance sheets. 7.1.2.3 There is little disruption to the business and is not subject to restrictions on capital flows around the insurance group. Hedges may be managed efficiently on an economic basis, but efficient management of potentially varying regulatory and accounting bases will be less straightforward. 7.1.2.4 This hedge team may additionally include bespoke structuring for static or hybrid risk transfer solutions. The skills and requirements here are distinct from hedging but need to be compared to and with the hedging alternative.

49
7.1.3 Product Development The development of a centralised product team adjacent to the hedging team
expertise can lead to an efficient build out of products from a risk management perspective. In this regard there will need to be close cooperation with local market participants to ensure that the products developed are tailored or modified so that they are fit for purpose.
7.2 Branch Structure 7.2.1 The centralisation of group policy can be reinforced where the group operates from a single balance sheet with local business being distributed through a series of branches or directly using pass porting or other freedom of services legislation (as apply for example within the EU). 7.2.2 The increased distance between the financial management of the business and the customers/environment may give greater prominence of strategic risks.
7.3 Captive (Re)insurer 7.3.1 A more integrated approach may lead to the centralisation of group risks directly onto a single balance sheet using a captive insurance or reinsurance entity where the captive references that the risks written come from within the groups own businesses. 7.3.2 Key purposes for using a captive may be driven by some or all of the following:
- Retention of margins. - Centralising expertise. - Efficient capital management. - Protecting proprietary information. - Retaining control and risk oversight. - Meeting customer engagement strategy. - Exploitation of natural hedges. - Amalgamation of risks for future disposal.
7.3.3 The relative prominence of these objectives will influence how the captive is structured and the choice of jurisdiction for the captive. 7.3.4 This latter element of jurisdiction is critical in order to allow for an alignment of economic and regulatory capital treatments and to avail of a consistent statutory reporting of assets and liabilities on a fair value basis. 7.3.5 There will inevitably be some specific requirements related to the local markets in which a business operates, which will also shape the eventual structure depending on how viable it is to centralise them. 7.3.6 Other considerations affecting the effectiveness of the arrangement are the ability of the captive team to amalgamate risks from separate sources; the level of communication between hedge managers, product designers and sales force; and the flexibility afforded to the policyholder to manage their underlying investments.

50
7.3.7 The captive will be responsible for the financial management of all the risks it accepts and there is transparency in how this manifests within the financials. Irrespective of the commercial imperative it needs to be remembered that in most case a captive will need to adhere to arms length pricing policies. These policies ensure there is no abuse of tax law and furthermore ensures that the captive generates and retains sufficient internal capital resources to meet its current and future obligations. 7.3.8 Variations in structure could arise as for third party outsourcing depending on the extent of risks to be transferred to the captive or retained within the originating business.
7.4 Third Party Service Outsourcing 7.4.1 This solution relieves the company from the resource burden of having to undertake many of the activities outlined in 7.1, whilst still enabling them to maintain control and flexibility over their hedging and guarantee product manufacturing capability. 7.4.2 The costs incurred in such an arrangement need to be weighed against the benefits in order to determine whether this is an attractive solution. 7.4.3 Outsourcing these activities to a specialist third party involves specifying the terms of a service level agreement, which covers all aspects of the arrangement such as the scope of services included (and excluded), service level standards, costs and the usual terms and conditions. 7.4.4 The scope of services could include all or just part of the activities required to manage the program, which may also vary over time if the goal is to ultimately bring the activities in-house. 7.4.5 The costs associated with an outsourcing arrangement relate to the fixed and/or variable fees charged for the outsourcing services, and the additional management time required to manage the relationship with the service provider (relative to opportunity cost of managing larger internal resources). 7.4.6 Table 6 summarises the benefits of outsourcing, each of which may vary in importance for companies facing different strategic priorities and resource capabilities and constraints. 7.4.7 From an operational perspective, it will be necessary to clearly define the processes involved in operating the program and in particular, those surrounding interactions between the company and the outsourcer. These areas of particular note include:
- Policy administration interfaces and data transfers. - Valuation assumption change control processes. - Calibration and valuation methodologies employed. - Hedge strategy and allowable universe of instruments. - Hedge rebalancing trades: trade validation, authorisation and execution.
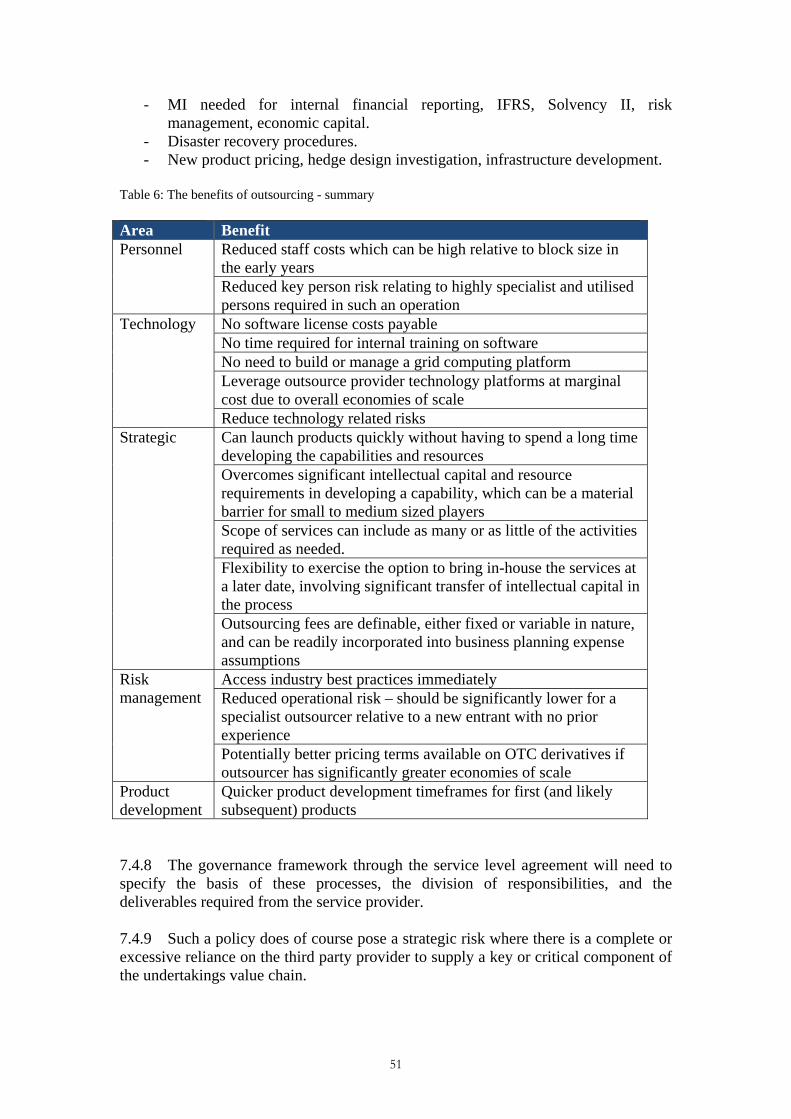
51
- MI needed for internal financial reporting, IFRS, Solvency II, risk management, economic capital.
- Disaster recovery procedures. - New product pricing, hedge design investigation, infrastructure development.
Table 6: The benefits of outsourcing - summary Area Benefit Personnel Reduced staff costs which can be high relative to block size in
the early years Reduced key person risk relating to highly specialist and utilised persons required in such an operation
Technology No software license costs payable No time required for internal training on software No need to build or manage a grid computing platform Leverage outsource provider technology platforms at marginal cost due to overall economies of scale Reduce technology related risks
Strategic Can launch products quickly without having to spend a long time developing the capabilities and resources Overcomes significant intellectual capital and resource requirements in developing a capability, which can be a material barrier for small to medium sized players Scope of services can include as many or as little of the activities required as needed. Flexibility to exercise the option to bring in-house the services at a later date, involving significant transfer of intellectual capital in the process Outsourcing fees are definable, either fixed or variable in nature, and can be readily incorporated into business planning expense assumptions
Risk management
Access industry best practices immediately Reduced operational risk – should be significantly lower for a specialist outsourcer relative to a new entrant with no prior experience Potentially better pricing terms available on OTC derivatives if outsourcer has significantly greater economies of scale
Product development
Quicker product development timeframes for first (and likely subsequent) products
7.4.8 The governance framework through the service level agreement will need to specify the basis of these processes, the division of responsibilities, and the deliverables required from the service provider. 7.4.9 Such a policy does of course pose a strategic risk where there is a complete or excessive reliance on the third party provider to supply a key or critical component of the undertakings value chain.

52
8. REGULATORY AND ECONOMIC CAPITAL CONSIDERATIONS
Since the mid 2000s, there has been a significant evolution in the way in which capital is determined and measured by life insurance undertakings. At its heart, it is driven by the need and desire for undertakings to understand the level of risk being assumed by their operations and activities to allow better informed risk decisions and capital allocation decisions. This need for what we will generically call economic capital management is self evident and will likely only increase into the future. The need for such granular understanding and appreciation of risk is wholly endorsed by regulators and quasi regulators (such as rating agencies) whether through promotion of internal models, requirements for own risk assessments or the application of merits or demerits in their assessment of near and long term security assessments.
This section seeks to communicate issues as they pertain to economic capital requirements and will look to set illustrate the issues using a sample policy, a sample capital regime and a range of risk mitigation strategies. For the avoidance of doubt these are illustrative only and no inference or reliance should be made on the analysis outside of the context of this chapter.
8.1 Economic and/Or Regulatory Capital 8.1.1 Before moving to the examples it is worth spending some time identifying the main approaches that are in application today and to perhaps isolate the biases or purpose of the valuations that underpin these methodologies. 8.1.2 In particular, we will identify the two broad families being:
- Lifetime Conditional Tail Expectation (CTE)- This methodology projects the lifetime payout obligations under a large number of simulations and looks to discount these claims back to the valuation date. The capital requirement is then set to the average of the worst outcomes where ‘worst’ is calibrated to a percentile beyond which the scenarios are selected. For example, in the case of a 90th percentile the CTE valuation comprises the average value of the worst 10% percent of these discounted simulations.
- Short Term Value at Risk (VaR)- The short term value at risk looks at the
evolution in the balance sheet obligation over a shorter period, for example 12 months. Again we rely on a statistical distribution of outcomes and in this case the methodology selects a specific percentile. Thus a 1 in 200 VaR measurement would select the 99.5th percentile for selecting the capital resource requirements.
8.1.3 8.2 and 8.3 put these generalised approaches into a regulatory capital context relying on current North American regulations and emergent European regulations. For those interested in a more detailed analysis of the alternative approaches refer to the Society of Actuaries in Ireland submission to the (Irish) Financial Regulator (2009) which compared and contrasted these approaches from a prudential regulatory perspective.
53
8.2 North American CTE- 8.2.1 The CTE approach exists in US regulation both in reserving and capital through Actuarial Guidance note 43 and the requirements of C3 Phase II respectively as promulgated by the Society of Actuaries and the NAIC (North American Insurance Commissioners). For a comprehensive overview of the treatment of VA within a US regulatory context refer to Junus et al. (2009). In each approach the 8.2.2 underlying economic scenarios generated are set on a real world basis as calibrated by the undertaking or through use of a set of scenarios developed centrally by the American Academy of Actuaries. In this context the reference to real world encompassed projection bases that seek to emulate the range and likelihood of future paths that the financial parameters may pursue thus allowances are made for elements such as equity risk premia and variability patterns that represent fatter tails than would be expected by a log normal model. 8.2.2 The philosophical framework behind this approach is to ensure that the undertaking has sufficient resources set aside to manage or meet its policyholder obligations on a run off basis.
8.3 European VaR Approach 8.3.1 As embedded in European legislation (as per the text of the Solvency II (Directive 2009/138/EC)), the balance sheet for a European undertaking is set using a market consistent value for assets and liabilities together with a capital requirement to allow for a 1 in 200 movement in these amounts. 8.3.2 Theoretically this indicates the use of a statistical VaR methodology where the entire balance sheet is modelled stochastically and the requisite percentile is selected from the output data set. 8.3.3 Noting the difficulty of establishing a standard modelling framework to generate an explicit Value at Risk analysis an analytical approximation using a series of stress tests on the dominant risk factors can serve to emulate the effect of the directly modelled approach. In particular, the stress tests are integrated into a single measurement using an appropriate aggregation methodology that allows for correlation effects between the factors. 8.3.4 This latter methodology of a VaR approximation using a series of calibrated stress tests is the default or standard approach being implemented under the new Solvency II regime in Europe. 8.3.5 Thus the policy decision behind the European VaR approach is to enable undertakings to disassemble their balance sheet and transfer the underlying risks to going concern operations to enable the undertaking to be wound up. 8.3.6 For a comprehensive review of the implications of Solvency II on capital requirements and product design please refer to paper written by Corrigan & Finkelstein (2009).

54
8.4 Contrasting Policies and Implications 8.4.1 These two approaches are significantly different and incorporate two different responses to a crisis or pending insolvency (run off or wind up). 8.4.2 This has a considerable implication for the treatment and consideration of market liquidity, in particular, the liquidity of the markets for transfer of complex insurance obligations. This single factor is the primary distinguishing feature between the approaches and leads perhaps to the greatest deviation in capital risk parameters and calibration. 8.4.3 A further consideration of the alternative bases is the allowance for risk mitigation. In particular, where a dynamic hedging approach is utilised some allowance needs to be made (permitted) to allow for evolution in the hedge program into future periods. This approach has considerable challenges from a regulatory perspective as the allowance to be credited for these future offsets is a function of the operational capacity of the undertaking together with the availability, liquidity and future correlation of hedge instruments, not to mention the operational challenge of credibly modelling these future states and offsets. The North American approach applies significant hurdles and limitations to the attainment of significant offset for such future trading offsets to capital. 8.4.5 On the other hand the use of a series of instantaneous stress tests such as to emulate possible shifts in the policyholder obligation and the risk mitigation strategy leads to a more transparent and simpler set of calculations. 8.4.6 In terms of reconciling the valuations from either source there is a need to reconcile a number of moving points whether in the calibration of the underlying economic scenario generator or in the selection of the corresponding percentiles as such it is not possible to infer directly from one to the other. That said it is possible to decompose the sources of difference between valuations through a process of incremental analysis of variation thus quantifying the impact of the calibration and the impact of the estimator. Such an analysis may be of supplementary use or benefit in regulatory reporting.
8.5 Focus on VaR/ Stress Test 8.5.1 For the remainder of this section, we will propose an economic capital requirement as established within the European Framework, being one that looks to the variation in the market consistent or fair value of the insurance obligation over a short horizon. 8.5.2 We select this basis for further analysis as it has the highest degree of international harmonisation due to it reflecting the IFRS and US GAAP basis of evaluation of embedded derivatives, with the important proviso that we will not be including any allowances for “own credit risk” as may be included in these valuation for statutory account reporting purposes.
8.6 Modular Construction of a Stress Test 8.6.1 It is for each undertaking to determine the components and location of its risk components and additionally to design and calibrate the appropriate stress tests.

55
Figure 6 outlines a hypothetical construct for the modular risk components with the requirement for an appropriate risk aggregation protocol to assemble sub module capital estimation into the higher up nodes in the framework.
Figure 6: Modular risk components 8.6.2 Allowance for risk mitigation is included at the level of the stress test in the construction of the above tests. The use of a modular approach allows capture of data at a particular risk level or granularity which can inform management as to sources of risk. This is vital information to feed into the product, capital and risk management cycle. 8.6.3 There is potential for add backs of capital to allow for limitations or shortfalls in risk mitigation whether through counterparty risks or other operational or liquidity risks. 8.6.4 These elements are covered in 8.7.
8.7 Risk Mitigation 8.7.1 We have outlined above the benefit and requirement for active risk management of the guarantee without being prescriptive as to the conditions or form of the risk management. 8.7.2 We have also identified that there are operational and other considerations to be taken into account in the ability to rely on or take credit for risks mitigations whether for economic risk management or regulatory capital purposes. 8.7.3 In particular, it is essential to realise that there will be a significant correlation effect between the circumstance in which an undertaking may need to rely on its hedging or risk mitigation program and the occurrence of stress or dislocation in those markets. Furthermore, this knowledge needs to be taken into account in the design of the risk mitigation strategy but additionally it needs to be taken into account in the
Aggregate Economic Capital
Operational & Liquidity Risk Capital
Counter Party Default Risk Capital
Market Risk Capital
Equity Risk Delta/Vega
Underwriting Risk Capital
Interest Rate Risk Delta/Vega
Bond Spread Risk
Mortality
Longevity
Behaviour Risk
Expense Risk
Tax Risk
Basis Risk
Bid/Ask risk
Operational Risk

56
reliance placed on the strategy as the company leverages its exposure or capital against such mitigants. 8.7.4 Table 7 has been informed by emerging European standards for insurance undertakings under Solvency II. However it has been modified to present the generality of the issue being raised. These elements are outlined as headline guidance for consideration of risk mitigation without being proscriptive as to the generality of its application. Table 7: Emerging European Standards for Insurance Undertakings under Solvency II
Principle Summary Consideration
1. Economic Effect over Legal Form
Recognition of the substance of mitigation irrespective of legal form including allowances for risk created through the mitigation and additionally ensuring no double counting for mitigation Comment: - The determination of economic effect over legal form requires an independent assessment of risk mitigation whether through a risk control function or internal audit process. Additionally the critical consideration here is the creation of liquidity or operational risks to secure the risk mitigation and to ensure there are properly countenanced.
2. Legal Certainty and Enforceability,
Legal certainty and enforceability are focused on the ability to recover amounts due under the mitigation having regard to any threats to the legal position of the contract or other features that may inhibit recoveries. Comment: - In the first instance this points to the need for documentation to be complete, unambiguous and entered into by the appropriate approved personnel. There are a host of other considerations such as jurisdiction of counterparties, form of mitigation, recourse to collaterals and arbitration that all need specific professional consideration in determination of certainty and enforceability.
3. Hedge Effectiveness
Effectiveness primarily concerns itself with satisfying a requirement that the mitigation is not exposed to significant basis risk or future rebalancing risks. Comment :- The critical consideration here is to understand the behaviour of the mitigant or the availability and costs of mitigants in the future noting the risk of market dislocations at time of market stress
4. Liquidity and Ascertainability of Value
The mitigation should be evaluated on a fair-value basis. Undertakings need to consider the liquidity of the mitigation vis a vis the liquidity of the obligation being mitigated and the liquidity management policy of the undertaking Comment: - This is a slightly different bias from 3 above in so far as the risk here is on the ability to realise value from hedge assets at a required time thus the “bid ask” spread.

57
This is a critical issue for illiquid over the counter derivatives and static solutions.
5. Credit Quality of the Provider
The provider of mitigation must be adequately rated in order to allow for mitigation of the capital requirement. The assessment can take into account collateral structures in the overall assessment. Comment: - The requirement for counterparty strength is self evident from a risk management perspective, and is furthermore amplified through haircuts within regulatory capital regimes that are rating dependent. It is also worth noting that under a severe dislocation that while collateral is a key protection there is an exposure or requirement to reset hedges or mitigants during a crisis which is not risk less thus collateral alone is not a complete mitigant to credit risk.
6. Direct, Explicit and Irrevocable Features
The condition of Direct and Explicit features requires that the Undertaking knows who is providing the protection and how it is to be measured. The feature of irrevocability is to ensure there are not structured solutions whose performance is interrupted through actions or circumstances outside of the Undertakings control. Comment: - This is to an extent a variant of item 1 above with a focus on clarity over counterparties and familiarity with covenants that may interrupt the recovery such as downgrade triggers.
8.8 Pro Forma Impact of Dynamic hedging on Capital 8.8.1 In this f section we will seek to illustrate the effect of differing risk mitigation techniques on an idealised stress test capital requirement. In this we will look at the economic capital arising under the market risk scenario and its response to differing risk mitigation strategies and in particular, look to isolate or identify the implications of counterparty rating on more structure or static risk mitigation solutions. 8.8.2 Table 8 summarises the product, the valuation basis and the stress tests to be performed. Table 8: Product, valuation basis and stress tests to be performed Policy :- 20 Year Term GMWB with 5 year deferral, annual ratchet, with return of premium GMDB Biometric Parameters :- Term and Moneyness dependent lapse Intensity Underlying :- Two asset portfolio 50% Equity – 25% Vol, 50% Bond 5% Vol, Correlation 30% Stress Test Calibration :- Equity Shock -45%, Equity vega +50%, Interest rate shock – Term dependent (average – 100bps), Rate vega +25% 8.8.3 The product structure has been selected to concentrate risk on the market risk components as the product has limited mortality/longevity risk and the ratchet is designed to limit anti-selective lapsing.
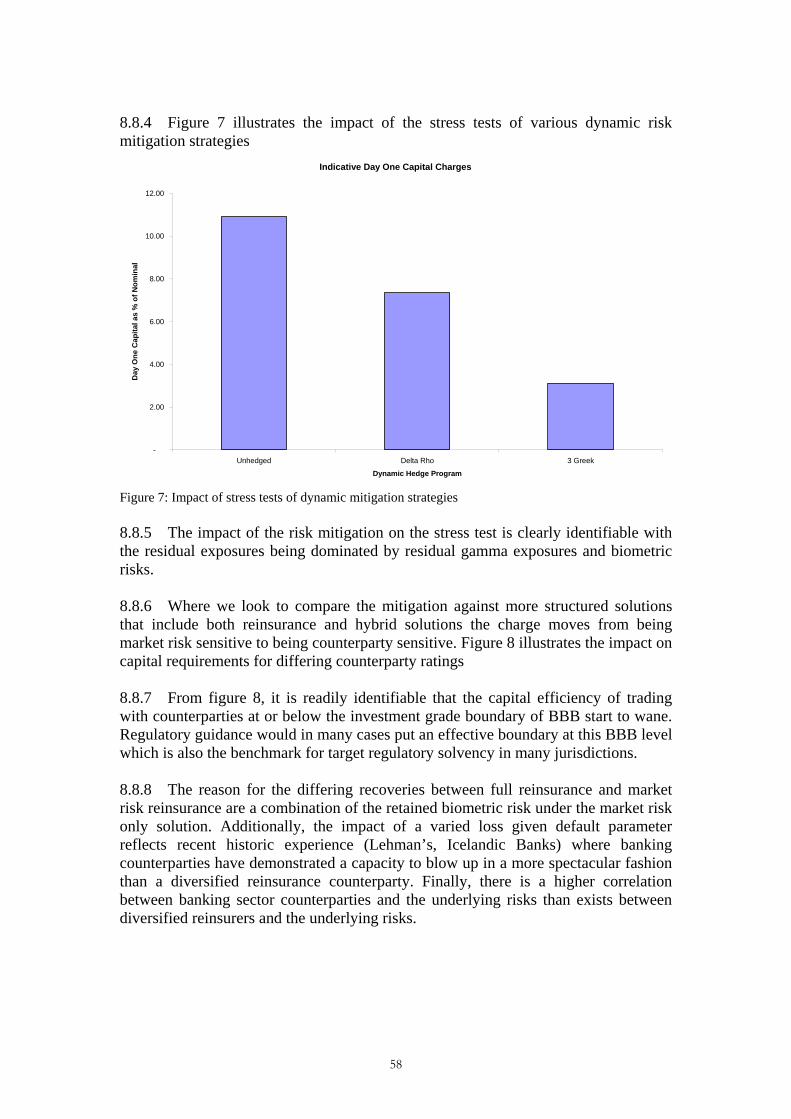
58
8.8.4 Figure 7 illustrates the impact of the stress tests of various dynamic risk mitigation strategies
Indicative Day One Capital Charges
-
2.00
4.00
6.00
8.00
10.00
12.00
Unhedged Delta Rho 3 Greek
Dynamic Hedge Program
Day
One
Cap
ital a
s %
of N
omin
al
Figure 7: Impact of stress tests of dynamic mitigation strategies 8.8.5 The impact of the risk mitigation on the stress test is clearly identifiable with the residual exposures being dominated by residual gamma exposures and biometric risks. 8.8.6 Where we look to compare the mitigation against more structured solutions that include both reinsurance and hybrid solutions the charge moves from being market risk sensitive to being counterparty sensitive. Figure 8 illustrates the impact on capital requirements for differing counterparty ratings 8.8.7 From figure 8, it is readily identifiable that the capital efficiency of trading with counterparties at or below the investment grade boundary of BBB start to wane. Regulatory guidance would in many cases put an effective boundary at this BBB level which is also the benchmark for target regulatory solvency in many jurisdictions. 8.8.8 The reason for the differing recoveries between full reinsurance and market risk reinsurance are a combination of the retained biometric risk under the market risk only solution. Additionally, the impact of a varied loss given default parameter reflects recent historic experience (Lehman’s, Icelandic Banks) where banking counterparties have demonstrated a capacity to blow up in a more spectacular fashion than a diversified reinsurance counterparty. Finally, there is a higher correlation between banking sector counterparties and the underlying risks than exists between diversified reinsurers and the underlying risks.

59
Comparative Static Solutions
-
2.00
4.00
6.00
8.00
10.00
12.00
AAA AA A BBB BB B
Counter Party Rating
Cap
ital
Full Reinsurance Market Risk Reinsurance 3 Greek Dynamic Unhedged Basis Figure 8: Capital requirements for various counterparty ratings 8.8.9 Such a distinction will be in practice be a function of regulatory requirements and/or internal model estimation.
8.9 Operational and Liquidity Considerations It is also important to note that the above capital charges exclude consideration of
operational and liquidity Risk. These forces will move in opposite directions for the alternatives of dynamic and static solutions with dynamic solutions incurring greater operational risk and exposure to future market liquidity whereas static solutions will exhibit less reliability of valuation for disposal or restructure. A detailed cost benefit of this analysis is beyond the scope of our simplified quantitative analysis.
8.10 Evolutions in Portfolio Capital The analysis in 8.8 sought to identify the day one capital requirements for our
sample policy. This isolated example is insufficient to give use a feel for the overall capital requirements for a portfolio noting that the portfolio will evolve through time and will additionally evolve with respect to the moneyness or market level of the underlying funds. Without seeking to deliver a complete assessment as to the consequence of such evolutions the following will or can provide some guidance or context.
8.10.1 GMWB decay/evolution with respect to time 8.10.1.1 Given the range of product structures it is not possible to prescribe the evolution in capital over time for the generalised class of GMxB. As a general comment we can however identify that the market risk sensitivities will tend to decay as we advance through time where the nominal exposure reduces as is the case for income and withdrawal benefits.

60
8.10.1.2 In particular, equity based market risk being the quickest to decay and interest rate and biometric risks decaying the most slowly. 8.10.1.3 Figure 9 illustrates the impact of time decay on the capital charge for a term withdrawal benefit together with the impact of time on the hedge portion of the risk. For the avoidance of doubt this is the impact of risk mitigation without allowance for counterparty risk, basis risk etc.
Impact of 3 Greek Hedging on Capital
0%
2%
4%
6%
8%
10%
12%
0 1 2 3 4 5 6 7 8 9 10 11 12 13 14 15 16 17 18 19 20
Term
As
% o
f Nom
inal
/Initi
al P
rem
ium
Unhedged Hedged
Figure 9: Impact of Greek hedging on capital. 8.10.1.4 Figure 9 shows that one can observe a rapid decline in capital consumption with respect to time in this idealised scenario.
8.10.2 Implications for GMAB/GMDB As a critical health warning it should be identified that the decay in capital
consumption above is a function of the underlying benefits being provided. In particular, the equity and interest rate components wane over time as the term benefit (thus outstanding obligations) are paid out to the client. Where the benefit has a concentration of risk at some future date, such as the maturity benefit under a Guaranteed Minimum Accumulation Benefit the sensitivity to equity shocks and volatility will not amortise with respect to time and in some cases will amplify as the contract reaches maturity depending on the closeness of the account value to the guarantee amount.
8.10.2.1 Need for (Projected) Capital Planning Noting the time signatures of capital consumption this brings to the fore the need
for portfolio capital planning and in particular, the impact of rapidly increasing exposure to risk as the take on level of capital will be high and the decay may not be fast enough to recycle capital for new business.
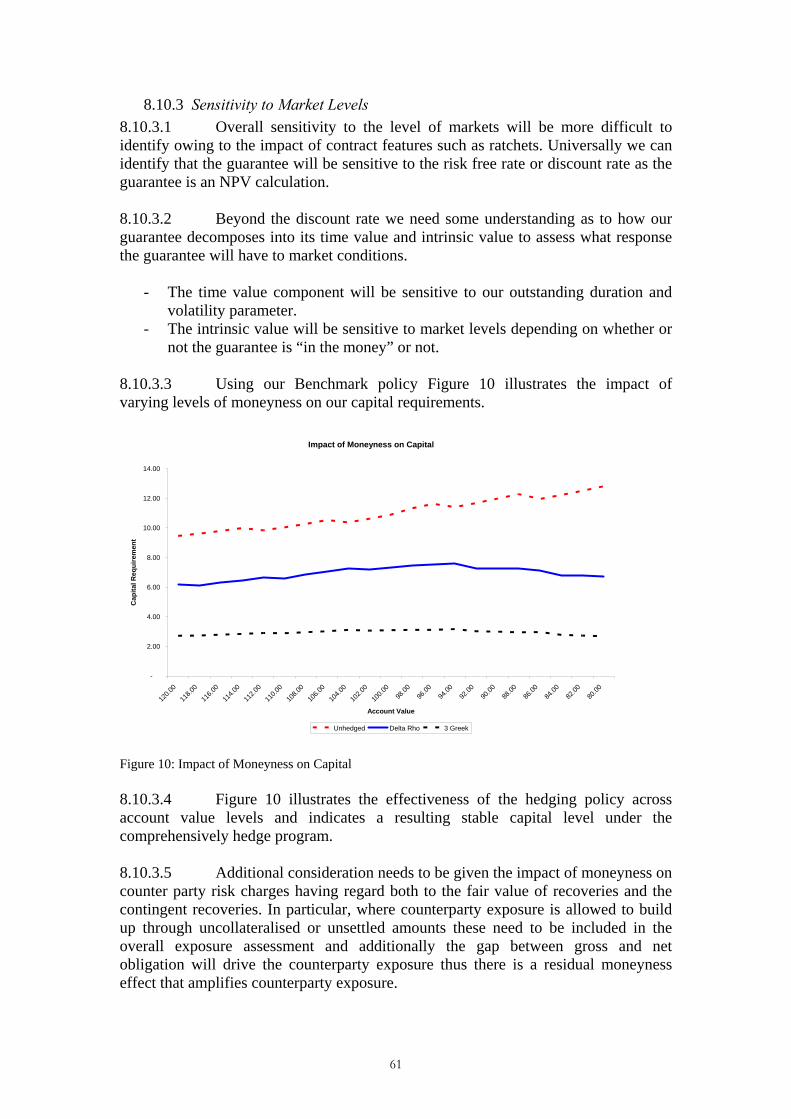
61
8.10.3 Sensitivity to Market Levels 8.10.3.1 Overall sensitivity to the level of markets will be more difficult to identify owing to the impact of contract features such as ratchets. Universally we can identify that the guarantee will be sensitive to the risk free rate or discount rate as the guarantee is an NPV calculation. 8.10.3.2 Beyond the discount rate we need some understanding as to how our guarantee decomposes into its time value and intrinsic value to assess what response the guarantee will have to market conditions.
- The time value component will be sensitive to our outstanding duration and volatility parameter.
- The intrinsic value will be sensitive to market levels depending on whether or not the guarantee is “in the money” or not.
8.10.3.3 Using our Benchmark policy Figure 10 illustrates the impact of varying levels of moneyness on our capital requirements.
Impact of Moneyness on Capital
-
2.00
4.00
6.00
8.00
10.00
12.00
14.00
120.0
0
118.0
0
116.0
0
114.0
0
112.0
0
110.0
0
108.0
0
106.0
0
104.0
0
102.0
0
100.0
0
98.00
96.00
94.00
92.00
90.00
88.00
86.00
84.00
82.00
80.00
Account Value
Cap
ital R
equi
rem
ent
Unhedged Delta Rho 3 Greek Figure 10: Impact of Moneyness on Capital 8.10.3.4 Figure 10 illustrates the effectiveness of the hedging policy across account value levels and indicates a resulting stable capital level under the comprehensively hedge program. 8.10.3.5 Additional consideration needs to be given the impact of moneyness on counter party risk charges having regard both to the fair value of recoveries and the contingent recoveries. In particular, where counterparty exposure is allowed to build up through uncollateralised or unsettled amounts these need to be included in the overall exposure assessment and additionally the gap between gross and net obligation will drive the counterparty exposure thus there is a residual moneyness effect that amplifies counterparty exposure.
62
9. STRATEGIC RISK MANAGEMENT CONSIDERATIONS
The technical and financial considerations of running a GMXB portfolio will
have a large degree of commonality between different providers. As introduced in section 2 strategic risks will, however, be much more company specific and in this chapter we will aim to highlight some of the key considerations and exposures.
9.1 Getting Started 9.1.1 For a new entrant, there is a substantial upfront financial and strategic commitment to developing the infrastructure and investing in people with the necessary expertise and experience. Thus in making a commitment to pursue a GMxB strategy there will need to be a comprehensive and realistic assessment of the flow of business and ultimate expected volumes to be managed before a decision can be taken on whether to proceed and how to risk manage the business. 9.1.2 Part of this initial analysis will also require an evaluation of existing infrastructure and resources with a view to determining what can be adapted or used and what requires a green field investment. 9.1.3 Having established the need for additional resource and infrastructure the challenge of implementation needs to be considered and can affect the time to market. 9.1.4 Key delays can result from:
- Locating and hiring the skilled people necessary. - Establishing (and gaining authorisation for) new captive (re)insurance
subsidiaries. - Educating existing staff, executives, (non executive) directors and critically.
distribution partners and agents.
9.2 Extending or Adapting Existing Platforms As part of the preparation or decision making process to enter into a new business space such as variable annuities, it behoves the management of the organisation to inventory the existing capabilities of the undertaking in order to map out additional requirements and adaptations to existing resources. These reviews will be both general as is the case with Expertise, Data and Technology capabilities but also bespoke when it comes to higher end infrastructure such as Administrative and hedging platforms. The following is a non exhaustive discussion of these items.
- Expertise It is possible that some adequate resources will already be available. Such resources may include hedging, pricing, transactional, risk management and senior management. Recruitment or training may be required to fill any resource gaps. - Data and Experience The company may be able to rely on existing available internal data on insurance risks, policyholder behaviour, economic and market statistics. - Technology, systems, modelling capabilities

63
This analysis will cover existing trading platforms and modelling system, whether current risk management practices will be able to monitor the new risks undertaken. - Administrative Systems :- Even if an existing pension policy administration system is available, then it is likely that very significant development effort will still be required to develop the functionality required to manage GMXB products. The development of a GMXB program could affect any existing outsourced master service agreements (MSAs), and existing MSAs may need to be renegotiated as part of the implementation program for a GMXB project. A number of other operational issues are likely to be considered as part of the GMXB project, including: the development of appropriate “reinsurance quota share” support to support any reinsurance or white labelling arrangements; sales and underwriting systems (if applicable); appropriate operational processes; payment control systems; process for handling sales incentives or commission arrangements; appropriate reserving modules; and systems for defining pro-forma financials. - Existing hedging and Treasury Platforms Where a new entrant is an established with profit provider with for example guaranteed annuity option (GAO) exposure: then it is possible that it will have developed an asset matching and hedging program to cover the GAOs. This hedging program is likely to combine a range of swaptions and equity put options. It is possible that such an existing program could be adapted in order to develop the functionality to support a GMXB hedging program such as that described in earlier chapters.
9.3 Sustainable Capacity 9.3.1 The sustainability of a variable annuity solution over time, and the risk of withdrawal of capacity arise principally when either a reinsurance solution or a white labelled product solution is utilised. A variable annuity product launch that is dependent on external third parties or outsourced agreements is exposed to the potential termination of any third party agreements. 9.3.2 Companies will need to carry out a cost/benefit analysis to review the cost of reinsurance versus expertise received from a third party. Companies may decide to use quota share treaty programs to develop exposure within strict control and underwriting limits. 9.3.2 Alternatively, companies will need to analyse the impact on the company of the potential loss of a white label agreement. White label agreements can be used to underpin initial volume growth built on the back of a combination of third party product and expertise. The risks associated with the loss of a white label agreement mainly relate to the potential impairment or even total loss of market access and potential loss of access to key expertise. Although it may be possible over time to replace a white label agreement with alternative routes to market, or alternative sources of expertise this will require a significant investment of time, and may result in a significant delay in a company’s business plan.
9.4 Reputation Risks A number of reputational issues need to be considered under the heading of
reputational risk. These issues relate principally to issues involved with customer

64
interactions in the context of variable annuity products. Such products are not universally understood as such gaps in understanding could lead to reputational issues for providers. The following questions and issues will need to be managed and mitigated.
1) Who ‘owns’ the customer? Whose branding is on the customer literature? How clear to policyholder where the guarantee is met? Where and how are funds invested?
2) The implications in the event of counterparty failure and media/IFA fallout will need to be considered. How will risks be mitigated through transfers to third parties? What level of due diligence is appropriate before transferring risks to a third party?
3) The company will need to consider the broad issue of the treating customers fairly debate and analyse the relevant interactions with the regulatory authorities and consumer bodies.
9.5 Regulatory Risks Insurance is a regulated activity in nearly all jurisdictions with both market
regulation covering the interaction between the insurance company and the policyholder and prudential regulation concerning itself with the resources of the company to fulfil its promises to policyholders. As an additional consideration GMxB needs to concern itself with regulation of the derivatives market given its requirement to access this market to manage the assumed risks. In this section we will highlight some of the key issues to illustrate the point rather than to exhaustively address all concerns and considerations. (See Ledlie et al. (2010). and Eason et al. (2010) for greater detail on the UK regulatory perspective).
- Prudential Regulation Whether as a result of the financial crisis or a general evolution in prudential regulatory requirements the range of financial, operational and reporting requirements being placed on insurance undertakings is generally increasing.
In respect of complex risk classes such as GMxB the requirements to build proprietary risk and capital risk management systems and evidence them to a high degree is a significant burden. Furthermore, to the extent that prudential reporting requirements depart materially from economic risk measurement (and statutory reporting requirements) this can challenge the development of coherent risk management strategies with consequent implications for hedging policies and choice of domicile.
- Insurance Market Regulation Market regulations can have impacts at any point in the life cycle of a policy whether at point of sale, through the life of a transaction or at decision points and claims stages. We can illustrate a number of examples of these risks below, however, a comprehensive analysis needs by necessity to be market specific.
65
Point of Sale: - Evolutions in requirements for the classification and sale of products can and will have an impact on the sale and saleability of these products. Whether its through bans on commission based sales as is evolving in the UK or the classification of products as securities as may potentially occur with Equity Indexed Annuities it needs to be kept in mind. Decision Point: - Market regulation as to the obligations of insurance companies to their policy holders as to the decisions they may make, such as decisions to lapse, could be impacted dependent on the obligations of insurance companies to notify policyholders of the relative benefits or retaining or lapsing protections. Thus any obligations on insurance companies to encourage rational decision making by policyholders will mitigate or undermine any assumptions or cross subsidies that can arise due to irrational policyholder decisions. Administrative - Developments and changes in market regulation whether through the provision of information, retention of policyholder information of other process and procedural requirements can all add cost and complexity to business operations.
- Derivative Market Regulation
Evolution in derivative market regulation and requirements can, and will, have implications for the cost and availability of hedge solutions. In particular, limitations on short sales or requirements to move over the counter derivatives to exchange platforms all have negative cost implications which ultimately need to be borne by the undertaking or passed on to the policyholder.
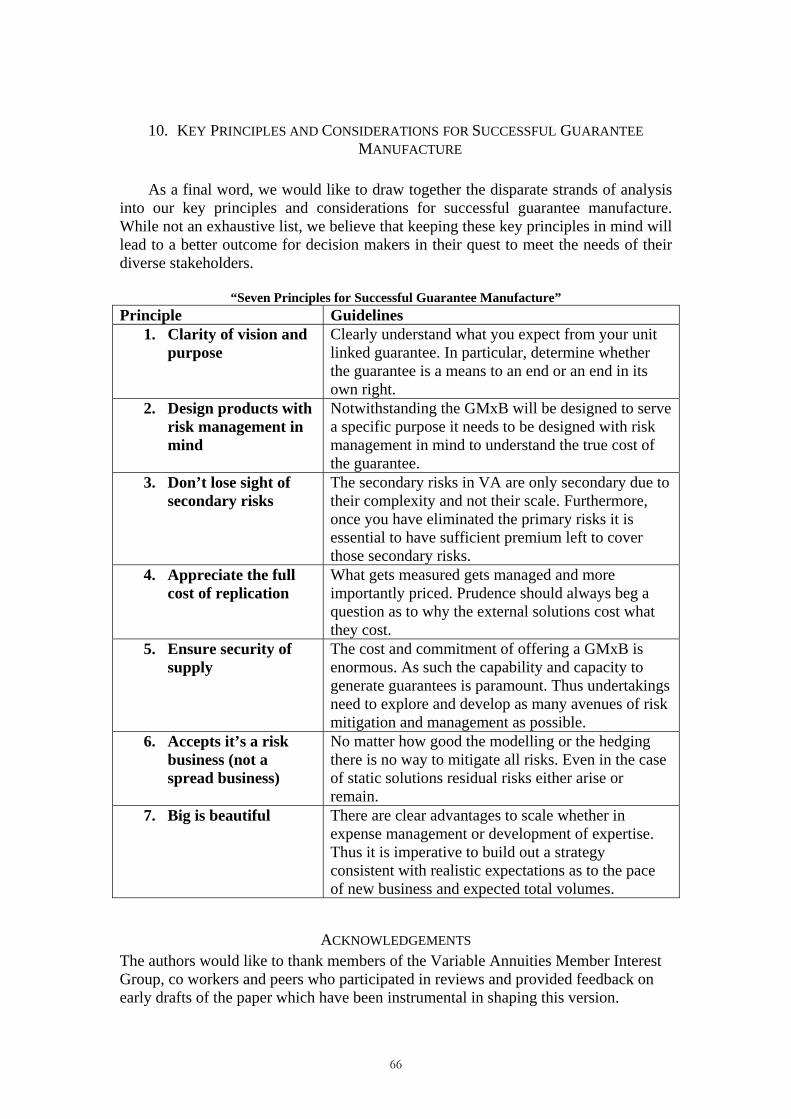
66
10. KEY PRINCIPLES AND CONSIDERATIONS FOR SUCCESSFUL GUARANTEE MANUFACTURE
As a final word, we would like to draw together the disparate strands of analysis
into our key principles and considerations for successful guarantee manufacture. While not an exhaustive list, we believe that keeping these key principles in mind will lead to a better outcome for decision makers in their quest to meet the needs of their diverse stakeholders.
“Seven Principles for Successful Guarantee Manufacture” Principle Guidelines
1. Clarity of vision and purpose
Clearly understand what you expect from your unit linked guarantee. In particular, determine whether the guarantee is a means to an end or an end in its own right.
2. Design products with risk management in mind
Notwithstanding the GMxB will be designed to serve a specific purpose it needs to be designed with risk management in mind to understand the true cost of the guarantee.
3. Don’t lose sight of secondary risks
The secondary risks in VA are only secondary due to their complexity and not their scale. Furthermore, once you have eliminated the primary risks it is essential to have sufficient premium left to cover those secondary risks.
4. Appreciate the full cost of replication
What gets measured gets managed and more importantly priced. Prudence should always beg a question as to why the external solutions cost what they cost.
5. Ensure security of supply
The cost and commitment of offering a GMxB is enormous. As such the capability and capacity to generate guarantees is paramount. Thus undertakings need to explore and develop as many avenues of risk mitigation and management as possible.
6. Accepts it’s a risk business (not a spread business)
No matter how good the modelling or the hedging there is no way to mitigate all risks. Even in the case of static solutions residual risks either arise or remain.
7. Big is beautiful There are clear advantages to scale whether in expense management or development of expertise. Thus it is imperative to build out a strategy consistent with realistic expectations as to the pace of new business and expected total volumes.
ACKNOWLEDGEMENTS The authors would like to thank members of the Variable Annuities Member Interest Group, co workers and peers who participated in reviews and provided feedback on early drafts of the paper which have been instrumental in shaping this version.

67
REFERENCES
BOEKEL, P., VAN DELFT, L., HOSHINO, T., INO, R., REYNOLDS, C. & VERHEUGEN, H. (2009) Replicating portfolios. An introduction: Analysis and illustrations. Milliman Publications. Available at: http://publications.milliman.com/research/life-rr/pdfs/replicating-portfolios-rr.pdf
CORRIGAN, J. & FINKELSTEIN, G. (2008). Operational Manufacturing Activities. Milliman publications.
CORRIGAN, J. & FINKELSTEIN, G. (2009). Implications of Solvency II for Product Development. Milliman publications. Available at: http://publications.milliman.com/research/life-rr/pdfs/implications-solvency-II-product.pdf
EASON, S., DIFFEY, W., EVANS, R., FULCHER, P. & WILKINS, T. (2010) Does your hedge do exactly what it says on the tin? Hedging Strategies for Insurers: effectiveness in recent conditions and regulatory treatment. Paper presented to the Staple Inn Actuarial Society, available at: http://www.sias.org.uk/siaspapers/listofpapers/view_paper?id=April2010talk
EUROPEAN PARLIAMENT AND THE COUNCIL OF THE EUROPEAN UNION (2009) Directive 2009/138/EC of the European Parliament and of the Council of 25 November 2009 on the taking up and the pursuit of the business of Insurance and Reinsurance (Solvency II). Official Journal of the European Union. Available at: http://eur-lex.europa.eu/LexUriServ/LexUriServ.do?uri=OJ:L:2009:335:0001:0155:EN:PDF
GATHERAL, J. (2006) The volatility surface: A practitioner’s guide. Wiley Finance. John Wiley & Sons, New Jersey.
HAUG, E.G., TALEB, N.N. (2009) Why we have never used the Black-Scholes-Merton option pricing formula Social Science Research Network Working Paper Series available at: http://papers.ssrn.com/sol3/papers.cfm?abstract_id=1012075
HMT (2009). The Walker Review of Corporate Governance in UK Banks and other Financial Industry Entities. HMT available at:
http://www.hm-treasury.gov.uk/d/walker_review_261109.pdf HULL, J.C. (2008). Options, futures and other derivatives (Seventh edition). Prentice Hall, Upper
Saddle River. JUNUS, N., MOTIWALLA, Z. (2009). A Discussion of Actuarial Guideline 43 for Variable Annuities.
Milliman Publications. Available at: http://publications.milliman.com/research/life-rr/pdfs/discussion-actuarial-guideline-43-RR04-01-09.pdf
LEDLIE, M.C., CORRY, D.P., FINKELSTEIN, G.S., RITCHIE, A.J., SU & WILSON D.C.E. (2010) Variable Annuities British Actuarial Journal, 14(2) MAHER, J. (2009) The Vexed Question of Convexity available at: http://www.box.net/shared/v097d48ljy
MAHER, J. (2010) OTC OPTION Prices for Insurers. Paper presented to the Society of Actuaries in Ireland. Available at: http://web.actuaries.ie/sites/default/files/event/2010/10/OTC%20Option%20Prices%20For%20Insurers.pdf
PITERBARG, V. (2010) Funding beyond discounting: collateral agreements and derivatives pricing. Risk Magazine 3 February 2010. Available at: http://www.risk.net/risk-magazine/technical-paper/1589992/funding-discounting-collateral-agreements-derivatives-pricing
SHALLIS, P., JONES, G., BUCKLE, I. & HILLS, M. (2009) Variable Annuities: Past, Present and Perfect? Paper presented to the Staple Inn Actuarial Society available at:
http://www.sias.org.uk/view_paper?id=VAPastPresentandPerfect SOCIETY OF ACTUARIES IN IRELAND (2009). Response to the discussion paper produced by the
Financial Regulator on Capital Requirements for Variable Annuities Available at: http://web.actuaries.ie/Press%20Office/Submissions/091215%20SAI_VA_Submission_Final.pdf
TALEB, N. (1997) Dynamic hedging: Managing vanilla and exotic options. Wiley Finance. VARNELL, E.M. (2009) Economic Scenario Generators and Solvency II British Actuarial Journal
(to appear). Available at: http://www.actuaries.org.uk/sites/all/files/documents/pdf/sm20091123.pdf
68
APPENDIX A
ABOUT THE VARIABLE ANNUITY MEMBER INTEREST GROUP This paper has been prepared on the initiative and interest of the authors within the framework of the Variable Annuities Member Interest Group of the UK Actuarial Profession. The Variable Annuities Member Interest Group is a group of professional members who share a common interest in the general topic of Variable Annuities. Regular bulletins, research and information regarding upcoming and past events can be accessed through the UK Actuarial Profession’s website at: http://www.actuaries.org.uk/members/migs/topical_migs/variable_annuities_members_interest_group
DISCLAIMER The views expressed in this publication are those of invited contributors and not necessarily those of the Institute and Faculty of Actuaries. The Institute and Faculty of Actuaries do not endorse any of the views stated, nor any claims or representations made in this publication and accept no responsibility or liability to any person for loss or damage suffered as a consequence of their placing reliance upon any view, claim or representation made in this publication. The information and expressions of opinion contained in this publication are not intended to be a comprehensive study, nor to provide actuarial advice or advice of any nature and should not be treated as a substitute for specific advice concerning individual situations. On no account may any part of this publication be reproduced without the written permission of the Institute and Faculty of Actuaries.

Institute and Faculty of Actuaries
Maclaurin House Staple Inn Hall Napier House
18 Dublin Street Edinburgh EH1 3PP T +44 (0)131 240 1300 F +44 (0)131 240 1313
High Holborn London WC1V 7QJ T +44 (0)20 7632 2100 F +44 (0)20 7632 2111
4 Worcester Street Oxford OX1 2AW T +44 (0)1865 268 200 F +44 (0)1865 268 211
www.actuaries.org.uk
© 2010 Institute and Faculty of Actuaries