an experimental investigation and modelling · pdf fileviii abstrak tesis ini berkaitan dengan...
TRANSCRIPT

AN EXPERIMENTAL INVESTIGATION AND MODELLING OF THE
ELECTRICAL DISCHARGE MACHINING PERFORMANCE
ON TITANIUM ALLOY Ti-5Al-2.5Sn
MOHAMMAD ASHIKUR RAHMAN KHAN
Thesis submitted in fulfillment of the requirements
for the award of the degree of
Doctor of Philosophy in Mechanical Engineering
Faculty of Mechanical Engineering
UNIVERSITI MALAYSIA PAHANG
AUGUST 2012
vii
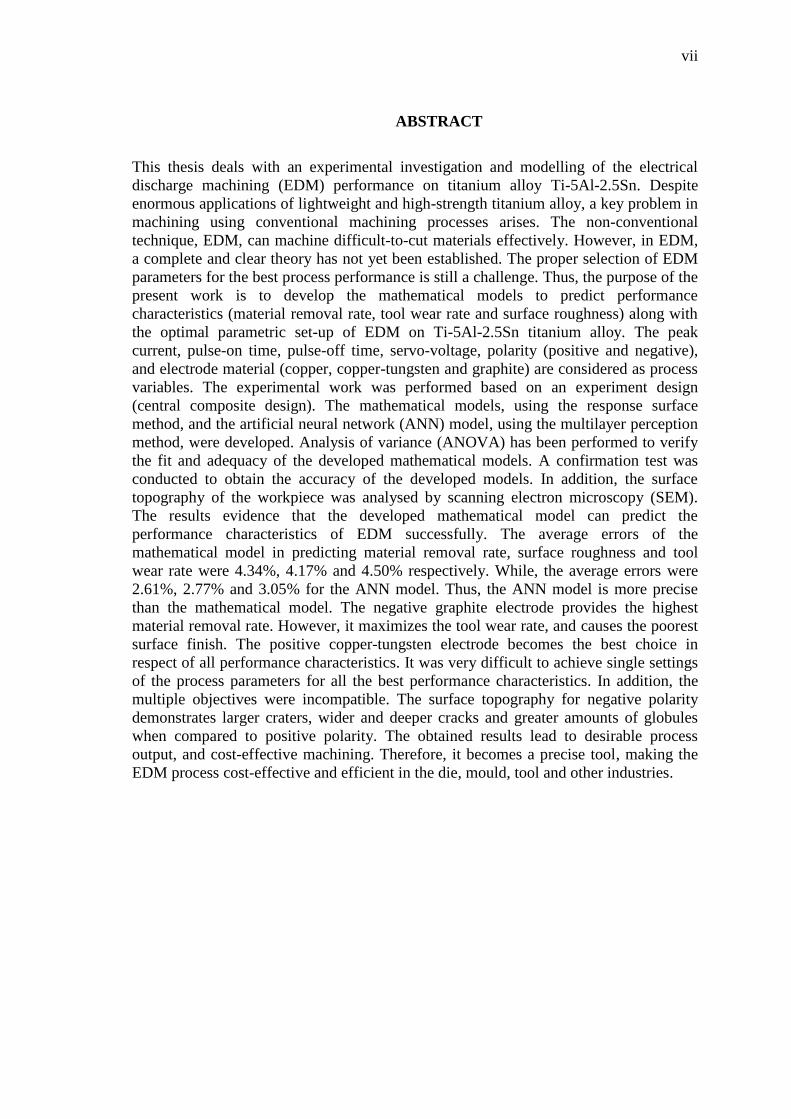
ABSTRACT
This thesis deals with an experimental investigation and modelling of the electrical
discharge machining (EDM) performance on titanium alloy Ti-5Al-2.5Sn. Despite
enormous applications of lightweight and high-strength titanium alloy, a key problem in
machining using conventional machining processes arises. The non-conventional
technique, EDM, can machine difficult-to-cut materials effectively. However, in EDM,
a complete and clear theory has not yet been established. The proper selection of EDM
parameters for the best process performance is still a challenge. Thus, the purpose of the
present work is to develop the mathematical models to predict performance
characteristics (material removal rate, tool wear rate and surface roughness) along with
the optimal parametric set-up of EDM on Ti-5Al-2.5Sn titanium alloy. The peak
current, pulse-on time, pulse-off time, servo-voltage, polarity (positive and negative),
and electrode material (copper, copper-tungsten and graphite) are considered as process
variables. The experimental work was performed based on an experiment design
(central composite design). The mathematical models, using the response surface
method, and the artificial neural network (ANN) model, using the multilayer perception
method, were developed. Analysis of variance (ANOVA) has been performed to verify
the fit and adequacy of the developed mathematical models. A confirmation test was
conducted to obtain the accuracy of the developed models. In addition, the surface
topography of the workpiece was analysed by scanning electron microscopy (SEM).
The results evidence that the developed mathematical model can predict the
performance characteristics of EDM successfully. The average errors of the
mathematical model in predicting material removal rate, surface roughness and tool
wear rate were 4.34%, 4.17% and 4.50% respectively. While, the average errors were
2.61%, 2.77% and 3.05% for the ANN model. Thus, the ANN model is more precise
than the mathematical model. The negative graphite electrode provides the highest
material removal rate. However, it maximizes the tool wear rate, and causes the poorest
surface finish. The positive copper-tungsten electrode becomes the best choice in
respect of all performance characteristics. It was very difficult to achieve single settings
of the process parameters for all the best performance characteristics. In addition, the
multiple objectives were incompatible. The surface topography for negative polarity
demonstrates larger craters, wider and deeper cracks and greater amounts of globules
when compared to positive polarity. The obtained results lead to desirable process
output, and cost-effective machining. Therefore, it becomes a precise tool, making the
EDM process cost-effective and efficient in the die, mould, tool and other industries.

viii
ABSTRAK
Tesis ini berkaitan dengan penyiasatan eksperimen dan permodelan prestasi pemesinan
pelepasan elektrik (EDM) pada aloi Ti-5Al-2.5Sn titanium. Walaupun aplikasi yang
meluas dalam penggunaan titanium, tetapi masalah utama dalam pemesinan
menggunakan proses pemesinan konvensional wujud. Teknik yang bukan tradisional,
EDM, boleh mesin aloi yang sukar dimesin.Walau bagaimanapun, EDM, teori yang
lengkap dan jelas masih belum ada. Pemilihan parameter EDM untuk proses prestasi
terbaik merupakan satu cabaran. Oleh itu, tujuan kerja ini adalah untuk membangunkan
model-model matematik untuk meramalkan ciri-ciri prestasi (kadar penyinkiran bahan,
kadar kehausan alat dan kekasaran permukaan) bersama-sama dengan set up optimum
parametrik-EDM pada aloi Ti-5Al-2.5Sn titanium. Electrik memuncak, nadi pada masa
yang ditetapkan, bahan-denyut masa, servo-voltan, kekutuban (positif dan negatif), dan
elektrod (tembaga, tembaga tungsten dan grafit) dianggap sebagai pembolehubah
proses. Kerja-kerja eksperimen telah dilakukan berdasarkan reka bentuk eksperimen
(reka bentuk komposit berpusat). Model matematik, menggunakan kaedah respon
permukaan, dan model rangkaian neural tiruan (ANN), menggunakan kaedah persepsi
berbilang, telah digunakan. Analisis varians (ANOVA) telah dijalankan untuk
mengesahkan kesesuaian dan kecukupan model matematik yang dibangunkan. Satu
ujian pengesahan telah dijalankan untuk mendapatkan ketepatan model yang
dibangunkan. Di samping itu, topografi permukaan bahan kerja telah dianalisis dengan
menggunakan mikroskopi pengimbasan elektron (SEM). Keputusan terbukti bahawa
model matematik yang maju boleh meramal ciri-ciri prestasi daripada EDM berjaya.
Kesilapan-kesilapan purata model matematik dalam meramalkan kadar penyinkiran
bahan, kekasaran permukaan dan kadar kehausan alat 4.34%, 4.17% dan 4.50% masing-
masing.Sementara itu, kesilapan purata adalah 2.61%, 2.77% dan 3.05% untuk model
ANN. Oleh itu, model ANN adalah lebih tepat daripada model matematik. Elektrod
grafit negatif menyediakan kadar penyinkiran bahan yang tertinggi. Walau
bagaimanapun, ia memaksimumkan kadar kehausan alat, dan menyebabkan permukaan
kemasan tidak memuaskan. Elektrod tungsten tembaga positif menjadi pilihan terbaik
berkenaan dengan semua ciri prestasi. Ia adalah sangat sukar untuk mencapai tetapan
tunggal parameter proses bagi semua ciri-ciri prestasi terbaik. Di samping itu juga,
objektif berganda adalah tidak sesuai. Topografi permukaan untuk polariti negatif
menunjukkan kawah yang lebih besar, retak yang lebih luas dan lebih mendalam dan
lebih banyak daripada dua lapisan apabila dibandingkan dengan kekutuban positif.
Keputusan yang diperolehi membawa kepada output proses wajar, dan pemesinan kos
efektif. Oleh itu, ia menjadi satu alat yang tepat, menjadikan proses EDM kos lebih
efektif dan cekap dalam industri acuan, alatan dan lain-lain.

ix
TABLE OF CONTENTS
Page
THESIS CONFIDENTIAL STATUS i
TITLE PAGE ii
SUPERVISOR’S DECLARATION iii
STUDENT’S DECLARATION iv
DEDICATION v
ACKNOWLEDGEMENTS vi
ABSTRACT vii
ABSTRAK viii
TABLE OF CONTENTS ix
LIST OF TABLES xiii
LIST OF FIGURES xvi
LIST OF SYMBOLS xviii
LIST OF ABBREVIATIONS xxi
CHAPTER 1 INTRODUCTION
1.1 Background 1
1.2 Motivation of the Study 3
1.3 Research Objectives 5
1.4 Scope of the Study 6
1.5 Organization of Thesis 7
CHAPTER 2 LITERATURE SURVEY
2.1 Introduction 8
2.2 Titanium and Titanium Alloys 9
2.2.1 Background 9
2.2.2 Classification and Applications 10
2.2.3 Applications 13
2.2.4 Machining 14

x
2.3 Electrical Discharge Machining 16
2.3.1 Introduction 16
2.3.2 Applications of EDM 21
2.4 EDM Parameters 22
2.5 EDM Performance Characteristics 24
2.5.1 Material Removal Rate 25
2.5.2 Electrode Wear Rate 26
2.5.3 Surface Roughness 28
2.6 Tool Materials on EDM Characteristics 29
2.7 Performance modelling 32
2.7.1 Theoretical Modelling 32
2.7.2 Dimensional Analysis 37
2.7.3 Regression Modelling 37
2.7.4 Artificial Neural Network Modelling 40
2.8 Previous Studies of EDM on Titanium Alloys 42
2.9 Summary 43
CHAPTER 3 RESEARCH METHODOLOGY
3.1 Introduction 45
3.2 Materials 45
3.2.1 Workpiece Materials 46
3.2.2 Electrode Materials 47
3.3 Machining Parameters 48
3.3.1 Performance Characteristics 48
3.3.2 Process Parameters 53
3.4 Experimental Details 56
3.4.1 Parameter Selection 56
3.4.2 Design of Experiments 58
3.4.3 Workpiece Preparation 63
3.4.4 Experimental Set-up 64
3.4.5 Surface Topography 68
3.5 Mathematical Modelling 69
3.5.1 Model Development 70
3.5.2 First-order Model 71
3.5.3 Second-order Model 73
3.5.4 Analysis of Variance 75
3.6 Artificial Neural Network Modelling 77
1 × ENTER (1.5 line spacing)

xi
3.6.1 Artificial Neural Network 77
3.6.2 Model Development 78
3.6.3 Neural Network Model with One Hidden Layer 80
3.6.4 Neural Network Model with Two Hidden Layers 85
3.6.5 Training and Testing 88
3.7 Confirmation Test 91
3.8 Summary 92
CHAPTER 4 RESULTS AND DISCUSSION
4.1 Introduction 93
4.2 Mathematical Model 94
4.2.1 Copper Electrode and Positive Polarity 95
4.2.2 Copper Electrode and Negative Polarity 100
4.2.3 Copper-tungsten and Graphite Electrode 106
4.2.4 Accuracy of the Model 112
4.3 Neural Network Model 114
4.3.1 Configuration 114
4.3.2 Training 117
4.3.3 Testing 119
4.4 Model Validation 124
4.5 Impact of the Parameters on Responses 127
4.5.1 Sensitivity Analysis 127
4.5.2 Effect of Electrical Parameters 130
4.5.3 Electrode and Polarity 137
4.6 Optimal Settings of the Parameters 150
4.7 Surface Topography 152
4.7.1 Cooper Electrode 152
4.7.2 Cooper-Tungsten Electrode 158
4.7.3 Graphite Electrode 161
4.7.4 Effect of Electrode 163
4.8 Summary 167
CHAPTER 5 CONCLUSION AND RECOMMENDATIONS
5.1 Introduction 169
5.2 Conclusions 169
5.2.1 Mathematical Model 170

xii
5.2.2 Optimization 171
5.2.3 Performance Characteristics 172
5.2.4 Characteristics of the Surface Topography 175
5.3 Recommendations for Future Research 176
REFERENCES 177
APPENDICES
A1 Experimental data obtained with positive copper electrode 196
A2 Experimental data obtained with negative copper electrode 197
A3 Experimental data obtained with positive copper-tungsten
electrode
198
A4 Experimental data obtained with negative copper-tungsten
electrode
199
A5 Experimental data obtained with positive graphite electrode 200
A6 Experimental data obtained with negative graphite electrode 201
B List of publications 202
xiii
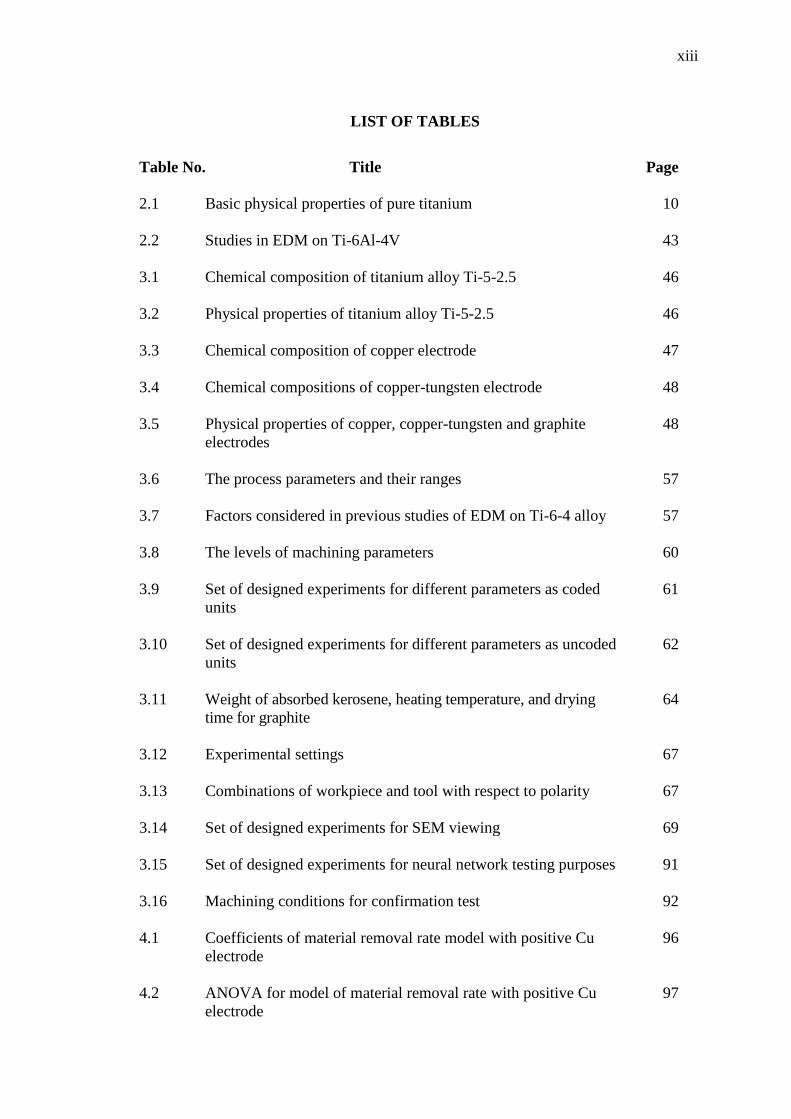
LIST OF TABLES
Table No. Title Page
2.1 Basic physical properties of pure titanium 10
2.2 Studies in EDM on Ti-6Al-4V 43
3.1 Chemical composition of titanium alloy Ti-5-2.5 46
3.2 Physical properties of titanium alloy Ti-5-2.5 46
3.3 Chemical composition of copper electrode 47
3.4 Chemical compositions of copper-tungsten electrode 48
3.5 Physical properties of copper, copper-tungsten and graphite
electrodes
48
3.6 The process parameters and their ranges 57
3.7 Factors considered in previous studies of EDM on Ti-6-4 alloy 57
3.8 The levels of machining parameters 60
3.9 Set of designed experiments for different parameters as coded
units
61
3.10 Set of designed experiments for different parameters as uncoded
units
62
3.11 Weight of absorbed kerosene, heating temperature, and drying
time for graphite
64
3.12 Experimental settings 67
3.13 Combinations of workpiece and tool with respect to polarity 67
3.14 Set of designed experiments for SEM viewing 69
3.15 Set of designed experiments for neural network testing purposes 91
3.16 Machining conditions for confirmation test 92
4.1 Coefficients of material removal rate model with positive Cu
electrode
96
4.2 ANOVA for model of material removal rate with positive Cu
electrode
97

xiv
4.3 Coefficients of surface roughness model with positive Cu
electrode
98
4.4 ANOVA for model of surface roughness with positive Cu
electrode
99
4.5 Coefficients of tool wear rate model with positive Cu electrode 100
4.6 ANOVA for model of tool wear rate with positive Cu electrode 101
4.7 Coefficients of material removal rate model with negative Cu
electrode
102
4.8 ANOVA for material removal rate model with negative Cu
electrode
102
4.9 Coefficients of surface roughness model with negative Cu
electrode
103
4.10 ANOVA for model of surface roughness with negative Cu
electrode
104
4.11 Coefficients of tool wear rate model with negative Cu electrode 105
4.12 ANOVA for model of tool wear rate with negative Cu electrode 106
4.13 ANOVA for model of material removal rate with Cu-W and Gr 108
4.14 ANOVA for model of surface roughness with Cu-W and Gr 109
4.15 ANOVA for second-order model of SR with positive Cu-W
electrode (After elimination of some terms)
110
4.16 ANOVA for model of tool wear rate with Cu-W and Gr 112
4.17 Error of the developed mathematical models of material removal
rate
113
4.18 Error of the developed mathematical models of surface
roughness
113
4.19 Error of the developed mathematical models of tool wear rate 114
4.20 Performance of neural network with different architectures 115
4.21 Best configurations of neural network models 116
4.22 Error analysis for the neural network models in training 119

xv
4.23 Best network and MSE 119
4.24 The values of MSE and linear correlation coefficient during
testing
123
4.25 Error analysis for the RSM and NN models of material removal
rate
125
4.26 Error analysis for the RSM and NN models of surface roughness 125
4.27 Error analysis for the RSM and NN models of tool wear rate 126
4.28 Sensitivity analysis values for EDM performance characteristics 129
4.29 Optimum settings of the machining parameters for MRR 151
4.30 Optimum settings of the machining parameters for SR 151
4.31 Optimum settings of the machining parameters for TWR 152

xvi
LIST OF FIGURES
Figure No. Title Page
2.1 Titanium crystal structures: (a) Hexagonal close-packed (hcp)
structure of α-titanium; (b) Body-centred cubic (bcc) structure of
β-titanium
11
2.2 Phase diagram for titanium alloys 12
3.1 Measured and nominal surface profiles 51
3.2 CLA method of surface roughness measurement 51
3.3 Rz and Rmax surface roughness measurement 52
3.4 EDM pulse current, pulse-on time and pulse-off time 53
3.5 Central composite design 60
3.6 Facing operation on an electrode’s end faces in an engine lathe 63
3.7 Experimental setup of electrical discharge machining 66
3.8 Weight measurement of workpiece and electrode 68
3.9 Surface roughness (Ra) measurement using Perthometer S2 68
3.10 A multiple input neuron model 79
3.11 Multilayer perceptron neural network architecture with one hidden
layer
81
3.12 Sigmoid function 82
3.13 Multilayer perceptron neural network model architecture with two
hidden layers
86
4.1 Convergence of training error (MSE) for copper electrode 118
4.2 Comparison between predicted and experimental value for positive
copper
120
4.3 Comparison between predicted and experimental value for negative
copper
121
4.4 Predicted versus experimental output for positive copper electrode
(a, c, and e) and for negative copper electrode (b, d, and f)
122

xvii
4.5 Sensitivity analysis for EDM performance with copper electrode 128
4.6 EDM outputs for varied input peak current 131
4.7 EDM outputs for varied pulse-on time 133
4.8 EDM outputs for varied pulse-off time 135
4.9 EDM outputs for varied servo-voltage 137
4.10 MRR for different electrodes (Cu, Cu-W, and Gr) and polarity 139
4.11 SR for different electrodes (Cu, Cu-W, and Gr) and polarity 142
4.12 TWR for different electrodes (Cu, Cu-W, and Gr) and polarity 146
4.13 EDM performance against various machining parameters for
different polarities of graphite electrode
149
4.14 SEM micrographs of the machined surface with Cu electrode and
positive and negative polarity for different discharge energies
156
4.15 SEM micrographs of the machined surface with Cu-W electrode
and positive and negative polarity for different discharge energy
159
4.16 SEM micrographs of the machined surface with Gr electrode and
positive and negative polarity for different discharge energy
162
4.17 SEM micrographs of the machined surface with positive polarity
of different electrodes for altered discharge energy
165
4.18 SEM micrographs of the machined surface with negative polarity
of different electrodes for altered discharge energy
166

xviii
LIST OF SYMBOLS
A0 Constant
Ai, Aii, Aij Regression coefficient
b Bias
Bi, Bii, Bij Regression coefficient
bj Bias on the first hidden layer
bk Bias on the second hidden layer
bo Bias on the output layer
B0 Constant
β0, βi, βij, βii Regression coefficient
C Capacitance
eC Cohesive energy
Ci, Cii, Cij Regression coefficient
sC Specific heat
C0 Constant
ε Experimental error
f Function
hj Output for first hidden layer
I Average current
Ip Peak current
j Nodes in the first hidden layer
k Thermal conductivity
lm Total measuring length

xix
M Molecular weight
P Resistance to erosion
Density
ρe Density of the electrode material
ρw Density of the workpiece material
Ra Roughness average
Rq Roughness quadratic average
Rz Average peak to valley height
Rmax Maximum profile valley depth
R2 Coefficient of determination
S Standard error of the regression
t Machining time
T Steady temperature of remote points
Tb Boiling temperature
Tf Heating temperature of the graphite inside the furnace
th Time of heating the graphite inside the furnace
Tm Melting point of the metal
tT Target value
Sv Servo-voltage
Toff Pulse-off time
Ton Pulse-on time
ts Time of submersion in kerosene
U Applied voltage
V Volume of metal removed

xx
We Weight loss of the electrode
WGN Weight of standard graphite before submersion in kerosene
WGD Weight of the dry graphite after heating
WGW Weight of wet graphite before heating in the furnace
wi Synaptic weight
wi,j Weight between the input neurons and first hidden neurons
wj,k Weight between first hidden neurons and second hidden neurons
wj,o Weight between the hidden and output neurons
WK Weight of absorbed kerosene by graphite
wk,o Weight between the last hidden neurons and output neurons
Wm Weight of moisture in the graphite
Ww Amount of metal removed from the workpiece
xmax Maximum value of the real variable
xmin Minimum value of the real variable
xN Normalized value of the real variable
Y Response
yo ANN predicted output
Zi Single roughness depths
zk Output for the second hidden layer
Zmax Maximum profile depth

xxi
LIST OF ABBREVIATIONS
AA Arithmetic average
ANFIS Adaptive-network-based fuzzy inference system
ANN Artificial neural network
ANOVA Analysis of variance
bcc Body-centred cubic
CCD Central composite design
CBN Cubic boron nitride
CLA Centre line average
CNC Computer numerical controlled
DF Degree of freedom
DOE Design of experiment
E Error measure
EDM Electrical discharge machining
EW Electrode wear
FEM Finite element method
GA Genetic algorithm
hcp Hexagonal close-packed
ITER International Thermonuclear Experimental Reactor
LOGMLP Logistic sigmoid multilayer perceptron
MAE Mean absolute error
MAPE Mean absolute percentage error
MMC Metal matrix composite
MLP Multilayer perceptron

xxii
MRR Material removal rate
MS Mean square
MSE Mean square error
PCD Polycrystalline diamond
PRESS Prediction sum of squares
RBFN Radial basis functions network
RMSE Root mean square error
R2 Coefficient of determination
RSM Response surface methodology
R&D Research and development
S Standard error of the regression
SEM Scanning electron microscopy
SR Surface roughness
SS Sum of squares
SSE Sum of squares of residuals
SSR Regression sum of squares
TWR Tool wear rate
TANMLP Hyperbolic tangent sigmoid multilayer perceptron

CHAPTER 1
INTRODUCTION
1.1 BACKGROUND
Titanium alloys are comprehensively used in many industries and commercial
applications, including those concerning aerospace, nuclear energy and biomedical
devices and components due to their high strength-weight ratio and excellent corrosion
resistance. In spite of the increased utility of titanium alloys, the capability to produce
parts products with high productivity and superior quality becomes challenging. It is
extremely difficult to machine titanium alloys with the traditional machining process
owing to their poor machinability (Rahman et al., 2006). Titanium is difficult-to-cut
material can be machined effectively by a non-conventional technique, that of electrical
discharge machining (EDM) (Rahman et al., 2006; Yan et al., 2005). However, it seems
that a large number of parameters significantly affect the EDM performance. On the
other hand, complicated mechanisms to the process result in a lag of established theory
(Su et al., 2004). It is exceedingly hard to set up a mathematical formula correlating the
input and output parameters, even though it is feasible. The results are far away from the
reality because of inevitable assumptions and simplified approaches (Wang and Tsai,
2001).
Electrical discharge machining applies successive discharges in a liquid
dielectric to perform machining on the workpiece surface. For more than fifty years, this
has been a well-known machining technique. Nowadays, EDM is a most widely used

2
non-conventional process and has become an essential machining technique in
manufacturing industries such as aerospace, automotive, nuclear, medical, mold and die
industries (Kiyak and Cakir, 2007). This process is non-conventional and does not apply
the traditional tools for metal removal, instead directly using electro-thermal energy. In
this process, the material is removed electro thermally by a series of successive discrete
discharges between electrode and the workpiece (Rajurkar, 1994). This is not restricted
by the physical and mechanical properties of work material and is able to machine any
electrical conductive material, regardless of how hard it is. The materials that are
difficult-to-cut and which introduce considerable challenges in machining operation,
such as high-strength alloys, high-temperature resistant alloys and hardened alloy steel,
can be machined straightforwardly by EDM (Assarzadeh and Ghoreishi, 2008).
In EDM, parameter selection is subject to experience and is time consuming.
Often, it is accomplished on a trial basis which incorporates the necessity of
supplementary materials and repetition of work. Many experimental runs are not
economically justified. In the competitive world of modern manufacturing, it is essential
to save time and to avoid the costs of scrap and reworking in combination with
competitive price (Higuerey, 1998). The selection of appropriate machining conditions
is also carried out by conservative technological data provided by the EDM equipment
manufacturers, which produced inconsistent machining performance (Rao et al., 2009).
In addition, the parameter settings provided by the manufacturers are only applicable for
the common steel grades. The settings for new materials such as titanium alloys,
aluminium alloys, special steels, advanced ceramics, and metal matrix composites
(MMCs) have to be further optimized experimentally.
The problem appeared owing to selection of parameters increases the process
deficiency. Ultimately, the use of electrical discharge machining process becomes
restriction. Hence, it becomes crucial to select an appropriate parameter set at different
machining stages in order to promote efficiency, enhance machining productivity, and
process reliability. Proper combination of the processing parameters can result in
precise and cost-effective machining by minimizing electrode wear and maximizing the
material removal.

3
Modelling the process is an effective way of solving the critical problem of
relating the process parameters to the performance measures. In EDM, modelling can
facilitate the acquisition of a better understanding of a complex process, save the
machining time and make the process economic (Karthikeyan et al., 1999). Although
prior researchers tried to develop a statistical model, it is difficult to develop the
universal mathematical model for predicting the performance measures (Garg et al.,
2010). Hence, it is impossible to use existing models when new and advanced material
has appeared in this field. From this perspective, the development of an efficient
approach has been attempted in order to correlate the EDM machining parameters as
peak current, pulse-on time, pulse-off time, polarity of electrode, servo-voltage and
certain responses. These responses are material removal rate (MRR), surface roughness
(SR) and tool wear rate (TWR). Moreover, determining appropriate machining
parameters that yield optimal output are also an aim. First, the discharge machining on a
titanium alloy is performed in accordance with the design of an experiment obtained
through statistical approach. Henceforth, the response surface methodology (RSM) and
artificial neural network (ANN) approaches are implemented throughout the
experimental data. A back-propagation, multilayer perceptron neural network has been
adopted in this study. The surface topography of the machined surface has been
analysed through scanning electron microscope (SEM).
1.2 MOTIVATION OF THE STUDY
The electrical discharge machining process comprises of the simultaneous
interaction of the thermal, mechanical, chemical and electrical phenomena (Izquierdo et
al., 2009). The growth of the plasma channel, the process of melting and vaporization,
re-solidification and formation of recast layer, the plasma-flushing efficiency, and the
temperature sensitivity of thermal properties of the work and electrode material, all
consolidate the machining process as highly complex and stochastic. The complicated
machining phenomenon, coupled with the interaction between two successive
discharges and the presence of debris particles within the machining gap, made the
process too complex. The complexity and non-linear nature of electrical discharge
machining are serious problems (Mahdavinejad, 2009). EDM process involves a
number of machining parameters, including electrical and non-electrical. A single
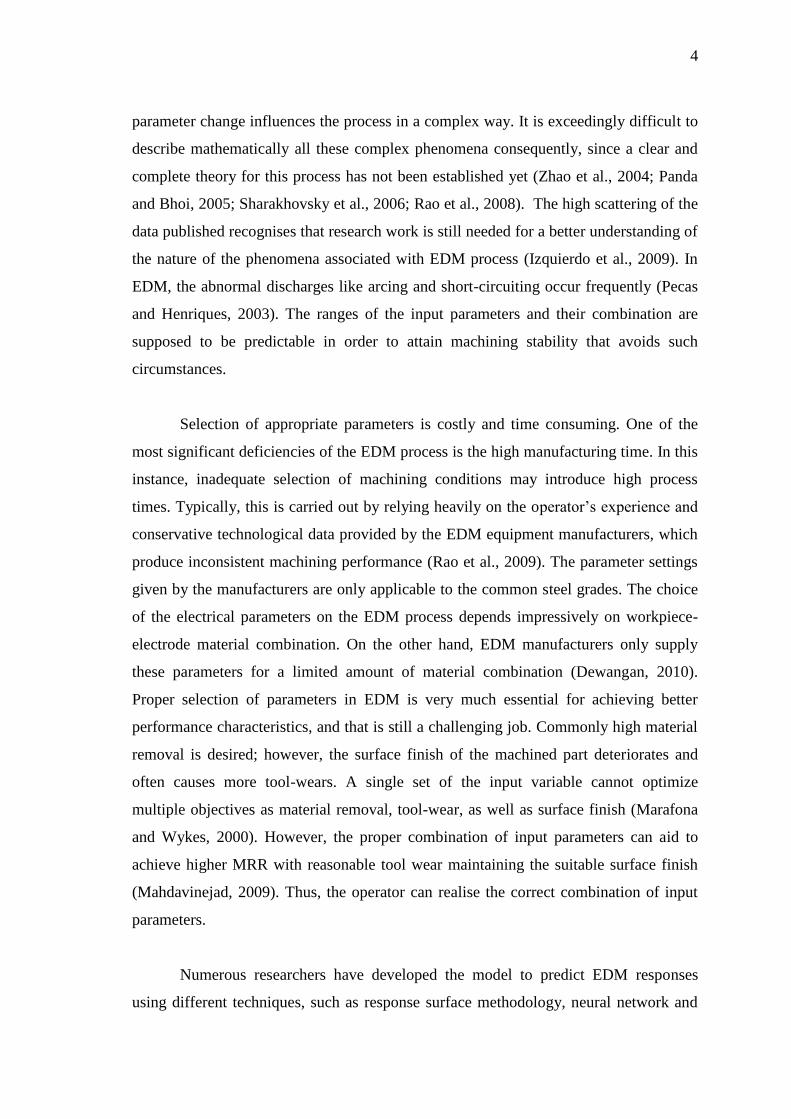
4
parameter change influences the process in a complex way. It is exceedingly difficult to
describe mathematically all these complex phenomena consequently, since a clear and
complete theory for this process has not been established yet (Zhao et al., 2004; Panda
and Bhoi, 2005; Sharakhovsky et al., 2006; Rao et al., 2008). The high scattering of the
data published recognises that research work is still needed for a better understanding of
the nature of the phenomena associated with EDM process (Izquierdo et al., 2009). In
EDM, the abnormal discharges like arcing and short-circuiting occur frequently (Pecas
and Henriques, 2003). The ranges of the input parameters and their combination are
supposed to be predictable in order to attain machining stability that avoids such
circumstances.
Selection of appropriate parameters is costly and time consuming. One of the
most significant deficiencies of the EDM process is the high manufacturing time. In this
instance, inadequate selection of machining conditions may introduce high process
times. Typically, this is carried out by relying heavily on the operator’s experience and
conservative technological data provided by the EDM equipment manufacturers, which
produce inconsistent machining performance (Rao et al., 2009). The parameter settings
given by the manufacturers are only applicable to the common steel grades. The choice
of the electrical parameters on the EDM process depends impressively on workpiece-
electrode material combination. On the other hand, EDM manufacturers only supply
these parameters for a limited amount of material combination (Dewangan, 2010).
Proper selection of parameters in EDM is very much essential for achieving better
performance characteristics, and that is still a challenging job. Commonly high material
removal is desired; however, the surface finish of the machined part deteriorates and
often causes more tool-wears. A single set of the input variable cannot optimize
multiple objectives as material removal, tool-wear, as well as surface finish (Marafona
and Wykes, 2000). However, the proper combination of input parameters can aid to
achieve higher MRR with reasonable tool wear maintaining the suitable surface finish
(Mahdavinejad, 2009). Thus, the operator can realise the correct combination of input
parameters.
Numerous researchers have developed the model to predict EDM responses
using different techniques, such as response surface methodology, neural network and

5
so forth. However, the model is developed for the particular material; it cannot be used
for another material. It is proven that materials significantly influence the EDM
performance (Wang and Tsai, 2001). It is observed from previous studies that the
developed models are for silicon infiltrated silicon carbide (SiSiC), SiC/Al, AISI EK2
steel, AISI D2 steel, AISI H13 steel, soft steel (F-1110), copper–steel (EN-8), alumina-
based ceramic composite (Al2O3 / SiCw / TiC), DIN 1.2714 hot work tool steel, Ck60
steel plates, tungsten carbide and cobalt composites (70%WC/30%Co), AISI D2 tool
steel, Al2O3 + TiC mixed ceramic, FW4 steel, SKD11, HE15, 15CDV6, M250, mild
steel (St 37), alloyed steels (C45 and 100Cr6), high strength low alloyed (HSLA) steels
such as a micro-alloyed (Mic/Al 1) steel and dual-phase (DP1) steel, BD3 steel, C40
steel, beryllium-copper alloy, mold-aluminium, mold-steel, and so on. It is obvious that
the models are only valid for the selected work and tool materials with specific polarity.
The development of the model in support of Ti-5Al-2.5Sn work material in EDM
process is still lagging. In this context, an effort has been made to study the performance
characteristics and to correlate them with the process parameters in EDM on Ti-5Al-
2.5Sn titanium alloy.
1.3 RESEARCH OBJECTIVES
In order to achieve the good understanding of EDM process, to diminish the
process weakness and enhance the feasibility of its application, specifically for titanium
alloy the objectives of the present work are as follows:
i. To investigate the effect of machining parameters on the performance
characteristics in terms of material removal rate, surface roughness and tool
wear rate of EDM of titanium alloy Ti-5Al-2.5Sn.
ii. To develop a regression equation and the artificial neural network model for
predicting EDM performance characteristics.
iii. To determine the optimal parametric settings that furnish the best machining
performance as higher material removal, superior surface finish and lowest
tool wear rate at distinct circumstances.

6
iv. To study the surface topography of the machined surface under different
machining conditions by performing scanning electron microscope analysis.
1.4 SCOPE OF THE STUDY
The experimental work is carried out by using an AQ55L model Sodick Die-
sinking EDM, and commercial kerosene is utilized as dielectric fluid. The voltage and
flushing pressures are maintained as 120 V and 0.15 MPa respectively. In the present
study, the electrical discharge machining is conducted for a limited period of 40
minutes. A type-KM225/13 furnace with a maximum temperature of 1280 0C is used in
order to dry up the graphite electrode. High precision digital single panned balance,
model GR-200, AND is used to measure the weight of the workpiece and electrode. It is
limited in measurement to 10 mg - 210 g with a readability of 0.1 mg. Surface
roughness is determined with Perthometer S2, Mahr.
Titanium alloy, Ti-5Al-2.5Sn, is used as the work-piece material, and copper,
copper-tungsten and graphite are utilized as an electrode. The machining parameters as
peak current, pulse-on time, pulse-off time, and servo-voltage are varied during
machining. The ranges are picked as 1-29 A, 10-350 μs, 60-300 μs and 75-115 V
correspondingly for peak current, pulse-on time, pulse-off time and servo-voltage. The
polarity of the electrode is retained as positive and negative. The material removal rate,
surface roughness, and tool (electrode) wear rate are considered as the performance
characteristics. The surface topography is also taken into consideration for investigation.
In the present study, response surface methodology (RSM) is carried out through design
of experiment (DOE) in order to attain the design settings. The techniques, namely
response surface methodology and multilayer perceptron neural network, are
implemented for analysis and modelling purposes. The equipment used for viewing the
surface topography is limited to a scanning electron microscope (SEM), model EVO 50,
Zeiss.

7
1.5 ORGANIZATION OF THESIS
The rest of this dissertation is comprised of four chapters: the literature review,
research methodology, results and discussion, and conclusions. Chapter 2 discusses the
appliances of the titanium alloys along with their machining status. This chapter reviews
past research conducted with regards to searching for important parameters and the
effect of the parameters on EDM performance characteristics. Several attempts adopted
by the prior research for modelling the EDM parameters for different materials, based
on distinct methods, are discussed. Chapter 3 describes the details of EDM parameters
following properties of selected work-piece and electrode materials. This chapter also
deals with the procedure to carry out the experiments, measurements and computation
of the process output. Eventually, Chapter 3 delivers the details of model development
through response surface methodology and artificial neural network technique. Chapter
4 presents the results obtained in favor of RSM model and ANN model, as well as the
impact of the machining parameters on EDM performance. In addition, this chapter
provides the results of model validation, optimal parametric settings and, finally, the
investigation through scanning electronic microscopic analysis. Chapter 5 reports the
conclusions and recommendations for future work.