an experimental investigation on droplet impact on soft
TRANSCRIPT

American Institute of Aeronautics and Astronautics
1
An Experimental Investigation on Droplet Impact on Soft Surfaces
Liqun Ma1, Yang Liu2, Hui Hu3()
Department of Aerospace Engineering, Iowa State University, Ames, Iowa, 50011
and
Wei Wang4, and Arun Kotta5
Department of Mechanical Engineering, Colorado State University, Fort Collins, Colorado, 80523
Soft materials have been considered as a potential candidate for durable icephobic surface,
which has extremely low ice adhesion strength and high surface elasticity. In this study, we
demonstrated the impact physics of the soft surfaces during high-speed impingement of water
droplet. Soft surfaces made from PDMS gels with different shear modulus were used to
investigate the influence of impact velocity and surface elasticity. With a constant diameter of
3.1 mm, the droplets were accelerated in a vertical wind tunnel with impact velocity ranging
from 4.5 m/s to 9.5 m/s. The corresponding Weber number ranges from 9×10² to 3.6×10³ and
the Reynolds number ranges from 1.5×10⁴ to 3.3×10⁴. Two high-speed cameras were
synchronized to record the impact phenomena in both side view and top view. It was observed
that the droplets with higher impact velocity would rebound from the elastic soft surface when
the surface shear modulus was small. A dramatically large water film was generated in the air
which finally broke up into multiple tiny secondary droplets. This newly observed rebound-
splash process significantly decreased the maximum contact area during the dynamic
interaction between the droplet and the soft surface. Visualizations of detailed impact
processes under different Weber numbers and surface shear modulus were presented in this
paper. The anti-icing performance of the soft surface was also demonstrated in this paper,
which highlighted the unique benefit of the soft surfaces in switching the dynamic physics of
droplet impingement.
Nomenclature
D = Droplet diameter
LWC = Liquid water content
Re = Reynolds number
T = Temperature
t = Thickness
U = Flow velocity
V = Droplet velocity
Wadh = Work of adhesion between the ice and the material
We = Weber number
μ = Shear modulus
θ = Contact angle
ρ = Density of water
σ = Surface tension
τice = Ice adhesion strength
ν = Kinetic viscosity of water
1 Graduate Student, Department of Aerospace Engineering. 2 Post-Doctoral Research Associate, Department of Aerospace Engineering. 3 Martin C. Jischke Professor, Dept. of Aerospace Engineering, AIAA Associate Fellow, Email: [email protected] 4 Post-Doctoral Research Associate, Department of Mechanical Engineering. 5 Assistant Professor, Department of Mechanical Engineering.
Dow
nloa
ded
by H
ui H
u on
Jan
uary
31,
201
8 | h
ttp://
arc.
aiaa
.org
| D
OI:
10.
2514
/6.2
018-
0502
2018 AIAA Aerospace Sciences Meeting
8–12 January 2018, Kissimmee, Florida
10.2514/6.2018-0502
Copyright © 2018 by Liqun Ma, Yang Liu, Wei Wang, Arun Kotta and Hui Hu.
Published by the American Institute of Aeronautics and Astronautics, Inc., with permission.
AIAA SciTech Forum

American Institute of Aeronautics and Astronautics
2
I. Introduction
TRATEGIES to design surface/materials which can withstand environmental challenges has always been
attracting researchers in the aerospace community. Nowadays, development of anti-icing surfaces, or icephobic
surfaces, are one of the hottest research topics due to its great potentials for aircraft icing mitigation.1,2 Soft materials
are materials that can be deformed or structurally altered by mechanical or thermal stress. Most biological materials
are soft, and more and more engineering biomimetic products have introduced soft material to replace the commonly
used rigid materials to achieve favorable characteristics. Soft materials can be made both as hydrophobic3 and
icephobic4. Most of the bio-inspired anti-icing materials are soft material. They prevent their surface from icing either
use textured or slippery surfaces1. A recent study demonstrated that ultra-low ice adhesion could be achieved with soft
polydimethylsiloxane (PDMS) materials with smooth surfaces5. It evokes our interests to conduct the present study to
evaluate the anti-icing performance and reliability of soft PDMS materials for aircraft inflight icing mitigation, where
dynamic impingement of water droplets at high Weber numbers should be taken into consideration.
Dynamics of water droplet impingement onto a surface has been a fundamental topic for fluid mechanics for
centuries. For scenario of water droplet impact on solid surfaces, a vast of previous works have been conducted in
regarding liquid properties6,7, surface wettability 8–11 and ambient environmental conditions12,13. In general, the impact
dynamics were majorly characterized by the Reynolds number and the Weber number, defined with the liquid
properties as Re = DV/ν and We = ρDV2/σ, which balance the inertia with the viscous forces and the capillary forces,
respectively. 11 Most of the previous works consider a relatively small Weber number compared with aircraft inflight
condition. Although some studies were conducted to consider the impact dynamics of water droplet at relatively high
Weber numbers14,15, the target solid surfaces were always rigid. Alizadeh et al.16 and Andreotti et al. 17 concluded that
the mechanical property of the solid surface will also influence the surface wettability. It is because the capillary force
and even the surface tension would deform the soft surface, which could generate different impact dynamics due to
the changed interfacial conditions. Ma et al.18 reported some experimental results about the impact of water droplets
onto bio-inspired surfaces at high Weber numbers pertinent to aircraft icing phenomena, however, the softness of the
studied surfaces was not well controlled and the textures of the studied surfaces were also not smooth.
Although an extensive investigations regarding dynamics of water droplet impingement have been conducted and
many fruitful theoretical and empirical models have been established, it is until very recently that studies focusing on
drop collisions with soft materials are emerged19–21. Chen and Bertola19 investigated the drop impacting on spherical
soft surfaces and the Weber number they tested is ranging from 10 to 200. Chen et al. 20 investigated the droplet impact
on soft viscoelastic surfaces when the Weber number is lower than 200, and they observed partial rebounding of the
droplet on the most rigid surface under higher Weber numbers. Howland et al. 21 concluded that droplet is harder to
splash due to the energy loss caused by surface deformation and the Weber number they tested is lower than 300. High
Weber number droplet impingement is always accompanied with splash phenomena and droplet impacting on smooth
soft surfaces with Weber number higher than 1000 has not been investigated. To fill that gap, the following facts need
to be considered. Firstly, a soft material with controllable low shear modulus need to be developed. Quantification of
the softness is essential when theoretically study this topic. Secondly, droplet in suitable sizes need to be accelerated
before impingement. To achieve high Weber number impingement, large droplets with high impact velocity, like
raindrops22, are more suitable to collide with soft surfaces instead of micro droplets with extremely high velocity
considering the erosion effect and the capability of the current image acquisition systems. It is a match between the
material and the impingement parameters that can make more progress.
With this in mind, the main objective of the present study is to experimentally investigate the effects of the stiffness
of soft PDMS materials on the impact dynamics of water drops at high weber numbers pertinent to aircraft icing
phenomena. During the experiments, both the shear modulus of the soft PDMS surface and the Weber numbers of the
impinging droplets were controlled for a comparative study. While the shear modulus of the soft PDMS surface was
changed by tuning the recipes to make the PDMS material, the Weber number of the impinging water droplets was
altered by adjusting the airflow speed in a vertical wind tunnel. In this study, the Weber number was in the range of
9003600 and the shear modulus of the soft surfaces was varied from 970 kPa. Two high speed camera with sampling
rate of 5000 Hz were synchronized to visualize the droplet impact dynamics from both the side view and the top view.
We demonstrated that droplet impingement onto soft surface with higher Weber number could generate a newly
observed rebound-splash phenomena, where an extensively expanded water film would be generated in the air. A
parametric study was conducted to investigate the influence from the shear modulus and the Weber number,
respectively. The anti-icing performance of the soft surface was also demonstrated in this paper and the anti-icing
mechanism of the soft surface in terms of the droplet impact dynamics was presented.
S
Dow
nloa
ded
by H
ui H
u on
Jan
uary
31,
201
8 | h
ttp://
arc.
aiaa
.org
| D
OI:
10.
2514
/6.2
018-
0502

American Institute of Aeronautics and Astronautics
3
II. Experimental methods
A. Experimental setup for the droplet impact test
Fig. 1 shows the schematic of the experimental setup used in this study. To achieve high impact velocities, a
vertical droplet wind tunnel was designed where the test section locates at the bottom. As shown in Fig. 1(a), the
droplet wind tunnel included an air conditioner, a droplet generator, a contraction section, a test section, pipe systems
and a metal ducted fan. The contraction ratio was 9 and the test section had an inlet of 3 in ×2 in and two outlets of 1
in×2 in as their sectional areas. A metal ducted fan (JP 70EDF 4s~6s Lipo) was used to suck the firstly diverged then
converged flow inside the wind tunnel. The ducted fan was equipped with a constant voltage power supply unit (Volteq
HY30100EX), and a rotational speed controller (Platinum Pro v3 100A). Water droplets with diameter 3.1 ± 0.1mm
could be accelerated to 9.5 m/s before inflight breakup due to drastic aerodynamic acceleration. As shown in Fig. 1(b),
the substrate was mounted at the bottom of the test section, subjecting to the accelerated droplets. Two high speed
cameras (Fastcam Mini WX100, PCO) with two 50 mm macrolens (50 mm Nikkor 1.8D, Nikon) were synchronized
by a pulse generator (Model 565, BNC) to visualize the droplet impact dynamics from both the side view and the top
view. Two LED spotlights, one under the substrate for the top view illumination and the other one behind the test
section for the side view illumination, were used to provide the shadowgraph of the impact process. The gap between
the glass substrate and the bottom acrylic plate was filled by water, so that the image of the substrate in the top view
is clean. The sampling rate was 5000 Hz and 2000 frames at minimum were recorded for each case.
Figure 1. (a) Schematic of vertical wind tunnel. (b) Schematic of the experimental setup for droplet
impingement measurements.
B. Surface preparation
In this study, the soft surface with different shear modulus were fabricated from PDMS gels provided by Dr. Kota’s
research group in Colorado State University. PDMS is a hydrophobic material which is commercially available,
inexpensive and environmentally benign.5 The PDMS gels were fabricated via hydrosilylation of vinyl-terminated
PDMS (v-PDMS) with hydride-terminated PDMS (h-PDMS). The shear modulus was tuned by adding different
amounts and different molecular weights of non-reactive trimethyl-terminated PDMS (t-PDMS) to the hydrosilylation
mixture. The shear modulus of the PDMS gels monotonically decreased with the increasing concentration of t-PDMS
in the hydrosilylation mixture. More detailed information for the fabrication of the soft surfaces in this paper can be
referred to Beemer, Wang and Kota5. In this study, the thickness of the PDMS surfaces was t = 200 μm. The constant
Dow
nloa
ded
by H
ui H
u on
Jan
uary
31,
201
8 | h
ttp://
arc.
aiaa
.org
| D
OI:
10.
2514
/6.2
018-
0502

American Institute of Aeronautics and Astronautics
4
thickness was achieved by tailoring the spin coating speed for the hydrosilylation mixture. The soft surfaces were stick
on 2 in × 2 in flat glass plates, which were able to be mounted at the bottom of the test section for the droplet wind
tunnel. Unless otherwise noted, the softness of the surface is indicated by the t-PDMS concentration, and the 80%
concentration of t-PDMS corresponds to the surface with the smallest shear modulus. The shear modulus μ of the soft
surfaces is 9 kPa (80% t-PDMS), 22 kPa (70% t-PDMS), 40 kPa (70% t-PDMS) and 67 kPa (50% t-PDMS).
C. Measurement of surface wettability
Measurement of contact angle (CA) was conducted using a custom-built apparatus. Measurement of the static
contact angles θstatic was performed by taking imaged of the sessile deionized water droplet over the test surfaces. The
advancing contact angle θadv. and receding contact angle θrec. were measured by expanding and contracting a sessile
droplet using a syringe with its needle close to the test surface. The hysteresis Δθ is defined as the difference between
θadv. and θrec. The images were recorded by a high-speed camera (Fastcam Mini WX100, PCO) with a high 12x zoom
lens system (LaVision). We randomly selected three different locations on the test surface to measure the contact
angles and the averaged value was used as the final results.
As shown in Table. 1, we compared the wettability of the soft surfaces with the baseline case, aluminum surface.
The aluminum surface was hand polished using sand papers with 2000 grit. We used the hydrophilic aluminum surface
as the baseline case because of its wide application in aircraft engineering. The receding contact angle of the aluminum
surface was too small to measure because the water droplet will stick on its surface and the contact line would not
move when shrinking the droplet by the syringe. As a contrast, the PDMS gels were hydrophobic since their static
contact angle is larger than 90°. Considering that the standard deviation of the measurement is comparable to the
differences from different cases, it was found that the wettability of the PDMS surface is almost not influenced by the
t-PDMS concentration. In other words, the wettability of the PDMS surface could be regarded as independent of the
surface shear modulus in this study.
Table 1. Measurement of contact angle
Surface Static CA
θstatic (°)
Advancing CA
θadv (°)
Receding CA
θrec (°)
Hysteresis
Δθ = θadv - θrec (°)
Aluminum (Baseline) 26 40 - -
50% t-PDMS 110 120 85 35
60% t-PDMS 110 118 89 29
70% t-PDMS 106 118 85 33
80% t-PDMS 111 119 88 31
D. Measurement of Ice adhesion strength
Figure 2 (a) Image of the apparatus for the measurement of ice adhesion strength. (b) Schematic of the ice
adhesion strength test.
Dow
nloa
ded
by H
ui H
u on
Jan
uary
31,
201
8 | h
ttp://
arc.
aiaa
.org
| D
OI:
10.
2514
/6.2
018-
0502

American Institute of Aeronautics and Astronautics
5
Measurement of ice adhesion strength was conducted through a shear force adhesion strength facility available in
the Aerospace Engineering Department of Iowa State University (ISU), which was reported by Beeram et al23. As
shown in Fig. 2(a), a force gauge (Mark-10, series 4) was mounted over a motorized translation stage, with its probe
inserted into an environmental chamber. A cold plate over the Peltier cooler from TETech (CP- 061) was embedded
in environmental chamber. Another insulated chamber filled with dry ice was connected to the chamber which helps
to flush out the moisture inside the air with subliming CO2 vapors. As shown in Fig. 2(b), the cylindrical ice samples
with diameter of 10 mm were frozen on the PDMS gel. A probe connected to the force gauge applied a lateral force
to the sample when it was in a linear motion toward the cylinder with a speed of 0.5 mm/s. The tests were conducted
with substrate temperature of -5 °C and -10 °C, respectively. Five trials were conducted for each condition. As shown
in Fig. 3, the regression analysis indicates that τice ∝ μ0.5, which is in good agreement with the adhesion mechanics
given as: τice ∝ /adhW t , as suggested by Kendall and Chaudhury24. Lower temperature has higher ice adhesion
strength since the Wadh has increased due to the increased binding force under lower solidification temperature.
Figure 3. Ice adhesion strength as a function of the shear modulus when the surface thickness is 200 μm.
E. Measurements of anti-icing performance
The anti-icing performance using the soft surfaces were tested in the Icing Research Tunnel available at Aerospace
Department of Iowa State University. Detailed information about the Icing research tunnel can be referred to Liu
et al. 25 The 3D printed NACA 0012 airfoil model has a chord length of 152.4 mm and the span length is 406.4 mm.
During the anti-icing test, the PDMS gel surfaces with different shear modulus was wrapped around the airfoil surface.
The thickness of the PDMS gel was kept the same when testing the droplet impact dynamics. 1/3 of the span was
wrapped with the 50% t-PDMS gel; another 1/3 of the span was wrapped with the 80% t-PDMS gel; and the rest of
the span was left untreated with the Enamel coated surface. In such manner, the ice mitigation process on different
surfaces could be compared simultaneously. The transient ice accretion process was recorded with a high-speed camera
(dimax S4, PCO) with a 50 mm macrolens (50 mm Nikkor 1.8D, Nikon). The camera was positioned normal to the
freestream direction of airflow and the pixel resolution is 11.56 pixels/mm.
Dow
nloa
ded
by H
ui H
u on
Jan
uary
31,
201
8 | h
ttp://
arc.
aiaa
.org
| D
OI:
10.
2514
/6.2
018-
0502

American Institute of Aeronautics and Astronautics
6
III. Results and discussion
A. Anti-icing performance
Figure 4. Ice accretion process over the suction-side surfaces of NACA 0012 test model where AoA = 5.0 °,
U∞ = 40 m/s, LWC = 1.0 g∕m3, and T∞= −5 °C.
Figure 5. Ice accretion process over the pressure-side surfaces of NACA 0012 test model where AoA = 5.0 °,
U∞ = 40 m/s, LWC = 1.0 g∕m3, and T∞= −5 °C.
Ice accretion process over the suction-side and the pressure-side surfaces of the airfoil are presented in Fig. 4 and
Fig. 5, respectively. The initial ice accretion process is presented for the hydrophilic enamel painted surface and
hydrophobic PDMS gel surfaces with t-PDMS concentration of 50% and 80%. The wind speed U∞ was 40 m/s with a
direction normal to the leading edge (LE) and the trailing edge (TE), and the angle of attack (AoA) was 5.0°. The
liquid water content (LWC) was 1.0 g/m3 and the temperature was -5 °C, which simulates a condition where the glaze
ice would be generated. Ice was formed on the baseline surface near the leading edge with non-uniform frozen rivulets.
However, for the soft surfaces, the leading edge icing is more uniform and less severe compared to the baseline case.
It is rather obvious for the 80% t-PDMS surface on the suction-side, since the icing process is hard to be recognized.
Dow
nloa
ded
by H
ui H
u on
Jan
uary
31,
201
8 | h
ttp://
arc.
aiaa
.org
| D
OI:
10.
2514
/6.2
018-
0502

American Institute of Aeronautics and Astronautics
7
Ice also distributed on the rest of the airfoil surface for the baseline case due to water runback icing, However, for the
soft surfaces, icing due to water runback phenomena was much less dominant and even disappeared for the 80% t-
PDMS surface. It is indicated that the soft surfaces have promising anti-icing features under current test conditions.
B. General impact phenomena
Figure 6. Evolution of the droplet impact process on the aluminum surface (top view) where We =3000
(droplet diameter D = 3.1 mm and the impact velocity V = 8.3 m/s).
Figure 7. Evolution of the droplet impact process on the 80% t-PDMS gel surface (top view) where We =3800
(droplet diameter D = 3.1 mm and the impact velocity V = 9.4 m/s).
Dow
nloa
ded
by H
ui H
u on
Jan
uary
31,
201
8 | h
ttp://
arc.
aiaa
.org
| D
OI:
10.
2514
/6.2
018-
0502

American Institute of Aeronautics and Astronautics
8
In order to explain the anti-icing mechanism for the soft surfaces, we present the general impact process on the
aluminum surface and the 80% t-PDMS gel surface. As shown in Fig. 6, the droplet impacting on the aluminum
surface will spread on the surface until the maximum diameter is achieved. Even though water would flow back from
the rim to the center, the expanded water film would stay on the aluminum surface with the maximum diameter without
receding back to the center This result agrees with the contact angle measurement, where the receding contact angle
could not be achieved.
Figure 8. Evolution of the droplet impact process on the 80% t-PDMS gel surface (top view) where We =3800
(droplet diameter D = 3.1 mm and the impact velocity V is 9.4 m/s).
Fig. 7 and Fig. 8 presents the top and side view results for droplet impact process on the 80% t-PDMS gel surface.
A total rebound-splash phenomena was observed. A bowl-like water film was generated in the air and finally breakup
into many tiny secondary droplets. These secondary droplets will either rest on the soft surface and the wall of the test
section or fly away with the upcoming wind. A big difference has been made on the impact location since the wetting
area of the droplet on the PDMS gel has been significantly decreased (manifested at the instant of 10 ms in Fig. 7).
C. Parametric studies
1. Phase diagram
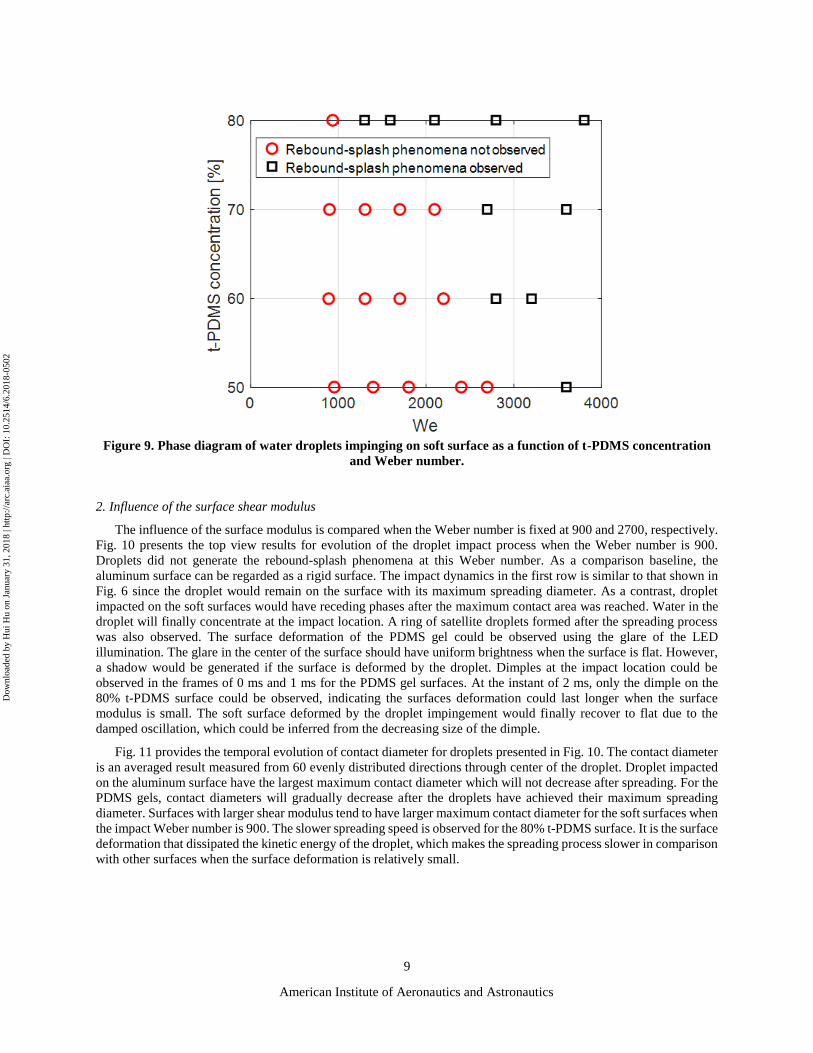
A phase diagram is presented in Fig. 9 showing whether the droplet generated the rebound-splash phenomena.
PDMS gel surfaces with four different t-PDMS concentrations were used and the six Weber numbers were tested on
each surfaces. Since the droplet size was kept as 3.1 mm, Weber numbers ranging from 900 to 3600 are corresponding
to the impact velocities ranging from 4.5 to 9.5 m/s. The rebound-splash phenomena are easier to be generated when
the impact Weber number is high and when the surface modulus is small. The rebound-splash phenomena could not
be observed when the Weber number is lower than 1000 if the surface modulus is larger than 9 kPa. It should be noted
that we define the rebound-splash phenomena using the criteria that the droplet splashes with more than 50% of its
rim bouncing away from the surface. It indicates that both of the surface shear modulus and the impact Weber number
will affect the impact dynamics, and their individual influences will be discussed based on this phase diagram.
Dow
nloa
ded
by H
ui H
u on
Jan
uary
31,
201
8 | h
ttp://
arc.
aiaa
.org
| D
OI:
10.
2514
/6.2
018-
0502
American Institute of Aeronautics and Astronautics
9
Figure 9. Phase diagram of water droplets impinging on soft surface as a function of t-PDMS concentration
and Weber number.
2. Influence of the surface shear modulus
The influence of the surface modulus is compared when the Weber number is fixed at 900 and 2700, respectively.
Fig. 10 presents the top view results for evolution of the droplet impact process when the Weber number is 900.
Droplets did not generate the rebound-splash phenomena at this Weber number. As a comparison baseline, the
aluminum surface can be regarded as a rigid surface. The impact dynamics in the first row is similar to that shown in
Fig. 6 since the droplet would remain on the surface with its maximum spreading diameter. As a contrast, droplet
impacted on the soft surfaces would have receding phases after the maximum contact area was reached. Water in the
droplet will finally concentrate at the impact location. A ring of satellite droplets formed after the spreading process
was also observed. The surface deformation of the PDMS gel could be observed using the glare of the LED
illumination. The glare in the center of the surface should have uniform brightness when the surface is flat. However,
a shadow would be generated if the surface is deformed by the droplet. Dimples at the impact location could be
observed in the frames of 0 ms and 1 ms for the PDMS gel surfaces. At the instant of 2 ms, only the dimple on the
80% t-PDMS surface could be observed, indicating the surfaces deformation could last longer when the surface
modulus is small. The soft surface deformed by the droplet impingement would finally recover to flat due to the
damped oscillation, which could be inferred from the decreasing size of the dimple.
Fig. 11 provides the temporal evolution of contact diameter for droplets presented in Fig. 10. The contact diameter
is an averaged result measured from 60 evenly distributed directions through center of the droplet. Droplet impacted
on the aluminum surface have the largest maximum contact diameter which will not decrease after spreading. For the
PDMS gels, contact diameters will gradually decrease after the droplets have achieved their maximum spreading
diameter. Surfaces with larger shear modulus tend to have larger maximum contact diameter for the soft surfaces when
the impact Weber number is 900. The slower spreading speed is observed for the 80% t-PDMS surface. It is the surface
deformation that dissipated the kinetic energy of the droplet, which makes the spreading process slower in comparison
with other surfaces when the surface deformation is relatively small.
Dow
nloa
ded
by H
ui H
u on
Jan
uary
31,
201
8 | h
ttp://
arc.
aiaa
.org
| D
OI:
10.
2514
/6.2
018-
0502

American Institute of Aeronautics and Astronautics
10
Figure 10. Comparison of droplet impact dynamics on surfaces with different shear modulus when the Weber
number is 900.
Figure 11. Comparison of the normalized contact diameter evolution on different surfaces when the Weber
number is 900
Dow
nloa
ded
by H
ui H
u on
Jan
uary
31,
201
8 | h
ttp://
arc.
aiaa
.org
| D
OI:
10.
2514
/6.2
018-
0502
American Institute of Aeronautics and Astronautics
11
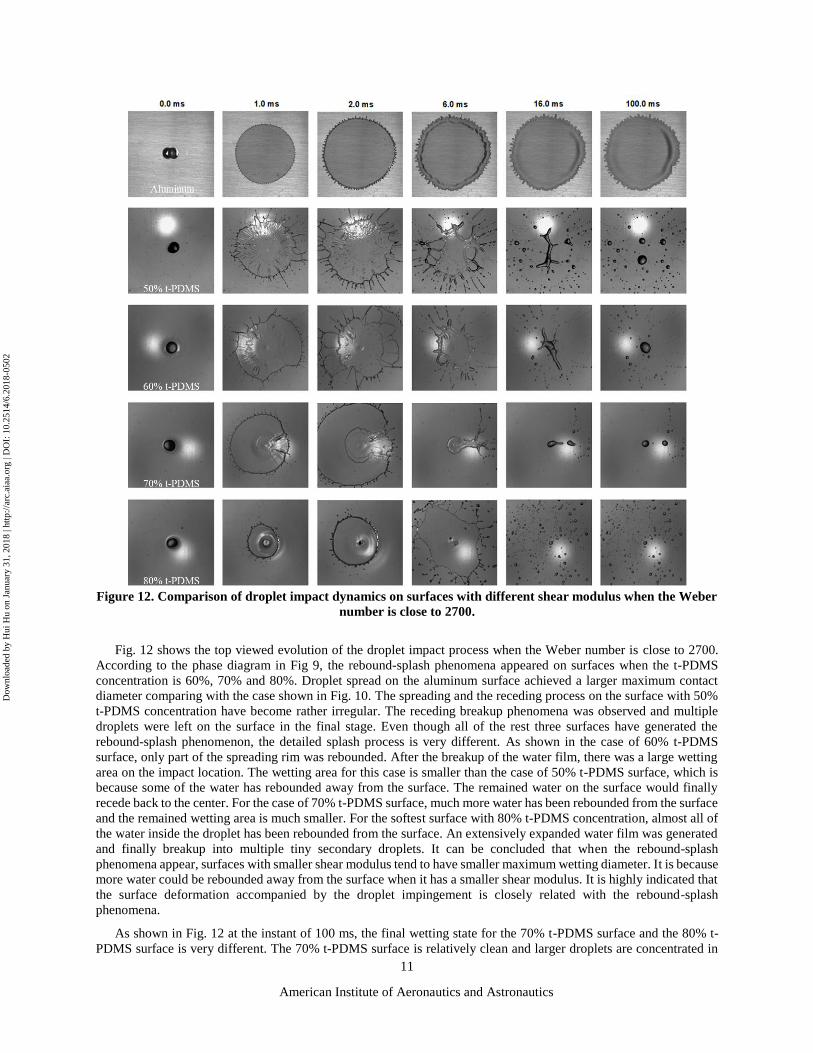
Figure 12. Comparison of droplet impact dynamics on surfaces with different shear modulus when the Weber
number is close to 2700.
Fig. 12 shows the top viewed evolution of the droplet impact process when the Weber number is close to 2700.
According to the phase diagram in Fig 9, the rebound-splash phenomena appeared on surfaces when the t-PDMS
concentration is 60%, 70% and 80%. Droplet spread on the aluminum surface achieved a larger maximum contact
diameter comparing with the case shown in Fig. 10. The spreading and the receding process on the surface with 50%
t-PDMS concentration have become rather irregular. The receding breakup phenomena was observed and multiple
droplets were left on the surface in the final stage. Even though all of the rest three surfaces have generated the
rebound-splash phenomenon, the detailed splash process is very different. As shown in the case of 60% t-PDMS
surface, only part of the spreading rim was rebounded. After the breakup of the water film, there was a large wetting
area on the impact location. The wetting area for this case is smaller than the case of 50% t-PDMS surface, which is
because some of the water has rebounded away from the surface. The remained water on the surface would finally
recede back to the center. For the case of 70% t-PDMS surface, much more water has been rebounded from the surface
and the remained wetting area is much smaller. For the softest surface with 80% t-PDMS concentration, almost all of
the water inside the droplet has been rebounded from the surface. An extensively expanded water film was generated
and finally breakup into multiple tiny secondary droplets. It can be concluded that when the rebound-splash
phenomena appear, surfaces with smaller shear modulus tend to have smaller maximum wetting diameter. It is because
more water could be rebounded away from the surface when it has a smaller shear modulus. It is highly indicated that
the surface deformation accompanied by the droplet impingement is closely related with the rebound-splash
phenomena.
As shown in Fig. 12 at the instant of 100 ms, the final wetting state for the 70% t-PDMS surface and the 80% t-
PDMS surface is very different. The 70% t-PDMS surface is relatively clean and larger droplets are concentrated in
Dow
nloa
ded
by H
ui H
u on
Jan
uary
31,
201
8 | h
ttp://
arc.
aiaa
.org
| D
OI:
10.
2514
/6.2
018-
0502

American Institute of Aeronautics and Astronautics
12
the center. However, the 80% t-PDMS surface is densely covered by multiple tiny droplets. We noticed that the
breakup direction of the rebound-splashing water film was different. The detailed information is manifested in Fig. 13
and Fig 14, where both of the top and side views are provided.
Figure 13. Evolution of the droplet impact process when the water film breaks from the center to the edge.
The test surface is 70% t-PDMS gel surface and We = 3000 (droplet diameter D = 3.1 mm and the impact
velocity V = 8.4 m/s).
Fig. 13 presents the droplet impact process with the water film breaking from the center to the edge. After the
impingement, the rim of the droplet is rebound away from the surface. As the water film expanded larger and larger,
water contacting with the surface could not supply the water film with more liquid, so that the water film become
thinner and thinner. Water film finally breaks from the contact line between the liquid and the soft surface. The surface
tension then drives the breakup from the center to the edge. The secondary droplets achieved an extra momentum
from the surface tension, making them fly away from the center of the impact location. As shown in Fig 13 at the
instant of 10 ms, most of the droplets were attached on the wall of the wind tunnel. A smaller droplet was remained
at the impact location and it is a result of the receded water remained on the surface.
Fig. 14 presents the droplet impact process where the water film breakup from the edge to the center. The droplet
totally rebounds from the surface and the maximum wetting diameter is rather small. Since there are no interferences
from the contact line between the droplet and the soft surface, the breakup of the sufficiently expanded water film is
initialized from the edge and then propagated to the center. Secondary droplets could be supplied with extra
Dow
nloa
ded
by H
ui H
u on
Jan
uary
31,
201
8 | h
ttp://
arc.
aiaa
.org
| D
OI:
10.
2514
/6.2
018-
0502

American Institute of Aeronautics and Astronautics
13
momentum, which follows the direction of the breakup propagation. From the side view of the water film, we know
that the breakup propagation direction should have a component facing downward. As a result, the secondary droplets
will fly back to the surface, which makes the final wetting state different from that shown in Fig. 13. The impact
process shown in Fig. 7 and Fig. 8 is also a total rebound-splash process. However, the breakup of the water film is
not initialized from the edge, showing the complexity and the randomness of the breakup process. We conclude that
the total rebound-splashing phenomena is more easily generated on surfaces with smaller shear modulus. In addition,
total rebound-splashing phenomena tend to have a final wetting state with multiple tiny droplets around the impact
location. This might be an evidence which could explain why the 80% t-PDMS surface wrapped airfoil has more
uniform ice accretion. The reason is that larger droplets could not remain on the surface. Instead, small secondary
droplets will be generated after the impingement, which formed a uniform icing layer and the non-uniform icing due
to the formation of rivulet or water runback has been avoided.
Figure 14. Evolution of the droplet impact process when the water film breaks from the edge to the center.
The test surface is 80% t-PDMS gel surface and We =2800 (droplet diameter D = 3.1 mm and the impact
velocity V = 8.1 m/s).
3. Influence of the Weber number
Dow
nloa
ded
by H
ui H
u on
Jan
uary
31,
201
8 | h
ttp://
arc.
aiaa
.org
| D
OI:
10.
2514
/6.2
018-
0502

American Institute of Aeronautics and Astronautics
14
Fig. 15 presents the relation between the normalized maximum contact diameter and the Weber number. We
distinguished the cases with rebound-splash phenomena by applying a smaller marker since this phenomenon would
significantly influence the distribution of the maximum contact diameter. The results indicate that without the
rebound-splash phenomena, higher weber number would have larger maximum contact area. The indices of the power
fitting lines for different surfaces are close to 0.2. In comparison with the rigid aluminum surface, soft surfaces have
smaller maximum contact area. For cases when the rebound-splash phenomena appear, the maximum contact area
would be significantly decreased. The maximum contact area will be smaller if the Weber number is higher or the
surface modulus is smaller. The maximum contact area can be decreased to the zero, which means that a total rebound
has occurred.
Figure 15 Normalized maximum contact diameter (Dmax/D0) as a function of Weber number for the
aluminum surface and the PDMS gel surfaces with different t-PDMS concentrations. (RS indicates the
corresponding case has the rebound-splash phenomena)
IV. Conclusion
In this study, the anti-icing performance of the soft surfaces made from PDMS gels was presented. A
comprehensive experimental study was conducted to explore the water droplet impact dynamics on the soft surface.
To simulate the inflight icing condition for aircraft, a vertical wind tunnel was used to accelerate the droplet. The
Weber number in this study is one order larger than previous studies tested on soft surfaces. The rebound-splash
phenomenon was observed during the experiment. It suggests that the maximum contact diameter could be
significantly decreased when the rebound-splash phenomenon appears.
The soft surfaces could effectively prevent the water runback icing in the initial ice accretion stage. We found that
under high weber number, droplet impingement would have much smaller maximum contact area on surfaces with
small shear modulus. The surface deformation could rebound the droplet away from the surface, generating an in air
splashing process which allows the upcoming wind to take the resultant tiny secondary droplets away from the surface.
However, the corresponding rebound-splash phenomena could not appear if the Weber number is smaller than 1000
when the surface shear modulus is larger than 9 kPa.
By systematically conducting a parametric study for the impact dynamics, we concluded that without the rebound-
splash phenomena, the rigid and the soft surface share the similar tendency: higher weber number would have larger
maximum contact area. However, the softer the surface is, the smaller the maximum contact area would be. When the
rebound-splash phenomenon appears, the maximum contact area would become smaller if the Weber number is higher
or the surface modulus is smaller.
Dow
nloa
ded
by H
ui H
u on
Jan
uary
31,
201
8 | h
ttp://
arc.
aiaa
.org
| D
OI:
10.
2514
/6.2
018-
0502

American Institute of Aeronautics and Astronautics
15
Acknowledgments
The research work is jointly supported by NASA grant number NNX12AC21A, National Science Foundation
under award numbers CBET-1064196 and CBET-1435590, and Iowa Space Grant Consortium Base Program for
Aircraft Icing Studies.
References
1 Kreder, M. J., Alvarenga, J., Kim, P., and Aizenberg, J., “Design of anti-icing surfaces: smooth, textured or slippery?,”
Nature Reviews Materials, vol. 1, Jan. 2016, p. 15003.
2 Xia, F., and Jiang, L., “Bio-Inspired, Smart, Multiscale Interfacial Materials,” Advanced Materials, vol. 20, Aug. 2008,
pp. 2842–2858.
3 Ma, M., and Hill, R. M., “Superhydrophobic surfaces,” Current Opinion in Colloid & Interface Science, vol. 11, Oct.
2006, pp. 193–202.
4 Lv, J., Song, Y., Jiang, L., and Wang, J., “Bio-Inspired Strategies for Anti-Icing,” ACS Nano, vol. 8, Apr. 2014, pp. 3152–
3169.
5 Beemer, D. L., Wang, W., and Kota, A. K., “Durable gels with ultra-low adhesion to ice,” J. Mater. Chem. A, vol. 4, 2016,
pp. 18253–18258.
6 Izbassarov, D., and Muradoglu, M., “Effects of viscoelasticity on drop impact and spreading on a solid surface,” Physical
Review Fluids, vol. 1, Jun. 2016, p. 23302.
7 Bartolo, D., Boudaoud, A., Narcy, G., and Bonn, D., “Dynamics of Non-Newtonian Droplets,” Physical Review Letters,
vol. 99, Oct. 2007, p. 174502.
8 Hao, C., Li, J., Liu, Y., Zhou, X., Liu, Y., Liu, R., Che, L., Zhou, W., Sun, D., Li, L., Xu, L., and Wang, Z.,
“Superhydrophobic-like tunable droplet bouncing on slippery liquid interfaces,” Nature Communications, vol. 6, Aug.
2015, p. 7986.
9 Bird, J. C., Dhiman, R., Kwon, H.-M., and Varanasi, K. K., “Reducing the contact time of a bouncing drop,” Nature, vol.
503, Nov. 2013, pp. 385–388.
10 Xu, L., “Liquid drop splashing on smooth, rough, and textured surfaces,” Physical Review E, vol. 75, May 2007, p. 56316.
11 Josserand, C., and Thoroddsen, S. T., “Drop Impact on a Solid Surface,” Annual Review of Fluid Mechanics, vol. 48, Jan.
2016, pp. 365–391.
12 Antonini, C., Bernagozzi, I., Jung, S., Poulikakos, D., and Marengo, M., “Water Drops Dancing on Ice: How Sublimation
Leads to Drop Rebound,” Physical Review Letters, vol. 111, Jul. 2013, p. 14501.
13 Hao, J., and Green, S. I., “Splash threshold of a droplet impacting a moving substrate,” Physics of Fluids, vol. 29, Jan.
2017, p. 12103.
14 Zhang, C., and Liu, H., “Effect of drop size on the impact thermodynamics for supercooled large droplet in aircraft icing,”
Physics of Fluids, vol. 28, Jun. 2016, p. 62107.
15 Visser, W. C., Tagawa, Y., Sun, C., and Lohse, D., “Microdroplet impact at very high velocity,” Soft Matter, vol. 8, 2012,
pp. 10732–10737.
16 Alizadeh, A., Bahadur, V., Shang, W., Zhu, Y., Buckley, D., Dhinojwala, A., and Sohal, M., “Influence of Substrate
Elasticity on Droplet Impact Dynamics,” Langmuir, vol. 29, 2013, pp. 4520–4524.
17 Andreotti, B., Bäumchen, O., Boulogne, F., Daniels, K. E., Dufresne, E. R., Perrin, H., Salez, T., Snoeijer, J. H., and Style,
R. W., “Solid capillarity: when and how does surface tension deform soft solids?,” Soft Matter, vol. 12, Mar. 2016, pp.
2993–2996.
18 Ma, L., Li, H., and Hu, H., “An Experimental Study on the Dynamics of Water Droplet Impingement onto Bio-inspired
Surfaces with Different Wettabilities,” 55th AIAA Aerospace Sciences Meeting, Grapevine, Texas: 2017, p. AIAA 2017-
0442.
19 Mangili, S., “Drop Impact on Soft Surfaces,” MSc Thesis, vol. 82106, 2010, p. 97.
20 Chen, L., Bonaccurso, E., Deng, P., and Zhang, H., “Droplet impact on soft viscoelastic surfaces,” Physical Review E,
vol. 94, Dec. 2016, p. 63117.
Dow
nloa
ded
by H
ui H
u on
Jan
uary
31,
201
8 | h
ttp://
arc.
aiaa
.org
| D
OI:
10.
2514
/6.2
018-
0502

American Institute of Aeronautics and Astronautics
16
21 Howland, C. J., Antkowiak, A., Castrejón-Pita, J. R., Howison, S. D., Oliver, J. M., Style, R. W., and Castrejón-Pita, A.
A., “It’s Harder to Splash on Soft Solids,” Physical Review Letters, vol. 117, Oct. 2016, p. 184502.
22 Soto, D., De Lariviere, A. B., Boutillon, X., Clanet, C., and Quere, D., “The force of impacting rain,” Soft Matter, vol. 10,
2014, p. 4929.
23 Beeram, P., Waldman, R., and Hu, H., “Ice Adhesion Measurements of Ice Mitigation Coatings Pertinent to Aircraft
Icing,” 9th AIAA Atmospheric and Space Environments Conference, Denver, Colorado: 2017, p. AIAA 2017-3928.
24 Chaudhury, M. K., and Kim, K. H., “Shear-induced adhesive failure of a rigid slab in contact with a thin confined film,”
The European Physical Journal E, vol. 23, Jun. 2007, pp. 175–183.
25 Liu, Y., Li, L., and Hu, H., “An Experimental Study on the Effects of Surface Wettability on the Ice Accretion over a
Rotating UAS Propeller,” 9th AIAA Atmospheric and Space Environments Conference, Denver, Colorado: 2017, p. AIAA
2017-4474.
Dow
nloa
ded
by H
ui H
u on
Jan
uary
31,
201
8 | h
ttp://
arc.
aiaa
.org
| D
OI:
10.
2514
/6.2
018-
0502