an experimental study of water oil relative permeability ... · pdf filean experimental study...
TRANSCRIPT

AN EXPERIMENTAL STUDY OF WATER OIL
RELATIVE PERMEABILITY OF FRACTURED
ROCK AT VARIABLE CONDITIONS OF
HYDROSTATIC EFFECTIVE STRESS AND
CAPILLARY NUMBER
ALEJANDRO RESTREPO MORALES
Universidad Nacional de Colombia
Faculty of Mines – School of Processes and Energy
Medellín, Colombia
2017


AN EXPERIMENTAL STUDY OF WATER OIL
RELATIVE PERMEABILITY OF FRACTURED
ROCK AT VARIABLE CONDITIONS OF
HYDROSTATIC EFFECTIVE STRESS AND
CAPILLARY NUMBER
ALEJANDRO RESTREPO MORALES
Research Thesis Project presented as requisite to obtain the title of:
MSc in Petroleum Engineering
Director:
Ph.D. Sergio Hernando Lopera Castro
Advanced Petrophysics
Hydrocarbon Reservoirs Research Group
Universidad Nacional de Colombia
Faculty of Mines - School of Processes and Energy
Medellín, Colombia
2017


NekawAwakeNekawAwakeNek
NekawAwakeNekawAw
NekawAwakeNe
NekawA


Acknowledgements
I wish to thank to my thesis Director, PhD Sergio Lopera, for his big humanity and ideas.
To the Laboratory of Hydrocarbon Reservoirs of the Mines Faculty - Universidad Nacional
de Colombia, for providing the resources to pursue this work and Kelly Diez, Laboratory
Coordinator, for her support during experimental testing.
To Universidad Nacional de Colombia, for being the space for inspiration, knowledge and
growth.
To my family and friends for all their love.

8 AN EXPERIMENTAL STUDY OF WATER OIL RELATIVE PERMEABILITY OF FRACTURED
ROCK AT VARIABLE CONDITIONS OF HYDROSTATIC EFFECTIVE STRESS AND
CAPILLARY NUMBER
Abstract
In the study of fractured systems petrophysics, the concept of relative permeability is of
primary importance as it integrates into a characteristic curve, the net effect of complex
interactions between matrix, fracture and fluids as a function of saturation. In most
practical applications, this curve is assumed independent of the state of stresses and / or
to the relative magnitude of viscous and capillary forces, normally represented by the
capillary number concept Nc. In the existing coupled simulation schemes, some
approaches incorporate geomechanical effects on the petrophysical attributes such as
absolute permeability, porosity, fracture width and fracture permeability. There are others
that incorporate the effect of capillary number on the relative permeability functions. In a
practical sense, the assumption of invariant Kr with the stress and / or the capillary
number actually simplifies computational requirements but can underestimate known
physical effects that variable stress regime and variable viscous-capillary forces field
induce on the multiphase flow. This has special relevance in the context of naturally
fractured reservoirs subject to fluids injection and production.
In this work, results of core flood experiments performed on a single fractured Berea core
were used to obtain water-oil relative permeability curves by the unsteady state JBN
method, at variable hydrostatic effective stress and capillary numbers. The aim of the
present study is to advance towards a better prediction of complex dynamics in systems
where matrix-fracture deformation occur due to stress changes, and variable flow regime
exist as a function of relative variations of viscous-capillary forces across the reservoir.
The methodology is based on the exploration of the variations of Corey relative
permeability parameters with both hydrostatic effective stress and capillary number noting
that studies found in the literature report the independent effect of these two variables but
not of their combined effects.
Results to date indicate that the features of relative permeability curves of fractured rocks
(e.g. ranges of mobile saturation, curvature, endpoints) are modified when changes on
the effective hydrostatic stress, the capillary number or both are induced. It is herein
proposed, that the degree and configuration of the variation of the curves with respect to a
reference curve is a function of the level of flow transfer between the matrix and fracture
which in turn is determined by the relative importance of the capillary, viscous and
deformation effects on both domains. For the set of tested conditions, an empirical
correlation for Kr prediction has been developed but future phases of the investigation can
include additional variables related to the anisotropic stress regime, other types of
fractures and wettability conditions to broaden the applicability of predictive models.
Keywords: Relative permeability, matrix-fracture, corey functions, stress sensitive
permeability, capillary number dependent permeability.
9
Resumen
En petrofísica de sistemas fracturados, el concepto de permeabilidad relativa resulta
determinante, al integrar en una curva característica, el efecto neto de complejas
dinámicas de interacción entre la matriz, la fractura y los fluidos ante cambios en los
estados de saturación. En simulación convencional de yacimientos, esta curva se asume
invariante ante cambios en el estado de esfuerzos y/o en la magnitud relativa de fuerzas
visco-capilares, normalmente representada bajo el concepto de número capilar Nc. En
simulación acoplada, algunos desarrollos incorporan los efectos geomecánicos sobre
propiedades petrofísicas como la permeabilidad absoluta y la porosidad o atributos como
el espesor y la permeabilidad de fractura y en otros esquemas, se incluye el efecto de
número capilar variable a las funciones de permeabilidad relativa. En un sentido práctico,
la suposición de curvas Kr invariantes ante cambios en el régimen de esfuerzos o el
número capilar bien simplifica las rutinas de cálculo computacional pero desestima el
efecto físico que sobre el flujo multifásico inducen los cambios en el estado de esfuerzos
y el campo de fuerzas visco-capilares, especialmente relevantes en el ámbito de
reservorios fracturados sometidos a operaciones de producción e inyección de fluidos.
En el presente trabajo, se muestran resultados de curvas de permeabilidad relativa agua-
aceite de un núcleo Berea fracturado, medidas por el método JBN de estado no estable,
bajo condiciones variables de esfuerzo efectivo hidrostático y número capilar. El estudio
busca avanzar hacia la predicción de dinámicas de flujo que resultan variables debido a
las deformaciones del sistema matriz-fractura generadas por cambios en el estado de
esfuerzos y a variaciones del régimen de flujo en función de la magnitud relativa del
campo de fuerzas visco-capilares a lo largo del yacimiento. La metodología explora la
variación de los parámetros de la correlación de permeabilidad relativa propuesta por
Corey, ante variaciones del esfuerzo efectivo hidrostático y el número capilar, anotando
así mismo que la literatura relaciona estudios independientes de ambas variables pero no
de su efecto combinado.
Los resultados a la fecha, indican que las curvas de permeabilidad relativa de una roca
fracturada modifican su aspecto (p.ej. rangos de saturación móvil, curvatura, puntos
extremos ó “end-points”) cuando se inducen sobre el sistema cambios en el esfuerzo
efectivo hidrostático, el número capilar o ambos. Se plantea que el grado y configuración
de la variación respecto a una curva de referencia es función del nivel de transferencia de
flujo entre la matriz y la fractura que a su vez es determinado por la incidencia relativa de
los efectos capilares, viscosos y de deformación sobre uno y otro dominio. Aunque se
presenta una correlación para la predicción de curvas Kr en sistemas del tipo probado, se
propone que fases ulteriores de la investigación incluyan otras condiciones de prueba,
como régimen anisotrópico de esfuerzos, u otros tipos de fractura y humectabilidad que
permitan ampliar el rango de aplicación de los modelos de predicción.
Palabras clave: Permeabilidad relativa, sistema matriz-fractura, exponentes de Corey,
número capilar, esfuerzo-deformación, apertura de fractura.

10 AN EXPERIMENTAL STUDY OF WATER OIL RELATIVE PERMEABILITY OF FRACTURED
ROCK AT VARIABLE CONDITIONS OF HYDROSTATIC EFFECTIVE STRESS AND
CAPILLARY NUMBER
Index
Pág.
Summary ......................................................................................................................... 8
List of figures .................................................................................................................12
List of tables ...................................................................................................................16
Nomenclature ................................................................................................................18
Introduction ....................................................................................................................21
1. Chapter One: Relative Permeability of Fractured Rocks…………………………….25
1.2 Geomechanics Stress Dependent Relative Permeability………………………30
1.3 Capillary Number Dependent Relative Permeability……….......………………33
2. Chapter Two: JBN Water Oil Relative Permeabilities of Fractured Rock at Variable
Hydrostatic Effective Stress ´ and Capillary Number Nc.. ........................................38
2.1 Hypothesis of the Stydy…..………………..………....…………………………...40
2.2 Equipment and Procedures…..………………..………....……………………….44
3. Chapter Three: Results and Discussion ...................................................................44
3.1 Basic petrophysical characterization of core matrix and fracture …………….47
3.2 JBN Water Oil Relative Permeability Measurements at varying Hydrostatic
Effective Stress and Capillary Number ………………………………………….57

11
3.3 An Empirical Correlation to predict Stress and Nc Dependent Water Oil Krs in
Fractured Rocks ……………………………...……………………………………69
4. Conclusions and Recommendations ……………………………………………………81
References……………………………………………………………………………………… 84
A. ANNEX …….…..……………………………………….…………………….………………87
A.1 Description of unsteady state JBN method for water oil Kr calculation……….87
A.2 Summary of laboratory testing protocols and experimental data.....………….88

12 AN EXPERIMENTAL STUDY OF WATER OIL RELATIVE PERMEABILITY OF FRACTURED
ROCK AT VARIABLE CONDITIONS OF HYDROSTATIC EFFECTIVE STRESS AND
CAPILLARY NUMBER
List of figures
Figure i-1: Comparison between uncoupled, conventional geomechanics coupling, i.e,
stress dependent K (coupled_1) and stress dependent Kr (coupled_2) [3].
Figure i-2: Schematics of combined effects of effective stress and capillary number in
near wellbore region [6, 7].
Figure I-1: Flow visualization cell in synthetic fracture [11].
Figure I-2: Schematics of artificially fractured core and miscible Kr [12].
Figure I-3: Schematic of fracture classification: a) Macro fractures with natural or
artificial proppants; b) Naturally closed mated fractures; c) Self-supporting
unmated fracture [13].
Figure I-4: Fluid distribution on the fracture at fixed capillary pressure. The upper field
shows the full aperture field, the lower left field is the nonwetting-phase-
filled apertures and the lower field is the wetting-phase-filled apertures. The
critical aperture at the fixed capillary pressure is 0.15mm [16].
Figure I-5: Fracture aperture distribution at variable confining stress [16].
Figure I-6: Capillary pressure at variable confining stress [16].
Figure I-7: JBN water oil relative permeability at 1000 psi and 3000 psi hydrostatic
effective stress [7].
Figure I-8a: Variation of end-point oil relative permeability Kro* and residual oil
saturation Sor with hydrostatic effective stress normalized porosity.
Figure I-8b: Variation of end-point water relative permeability Krw* and residual water
saturation Swr with hydrostatic effective stress normalized porosity [3].
Figure I-9: Schematics of tri-axial cell and differences between hydrostatic and tri-axial
closure stress curves [28].

13
Figure I-10: Measured (discrete points) and history matched (continuous lines) water-oil
relative permeability obtained during coreflood experiments [6].
Figure I-11: Sor reduction with increasing Nc measured during water-oil core
displacements [6].
Figure I-12: Schematics of Nc dependent Kr in a typical Colombian sandstone of a gas-
condensate reservoir [33].
Figure II-0: Schematics of hydrostatic effective stress. Red arrows represent the
confining pressure exerted radially on the core.
Figure II-1: W-O IFT measured by the ring method.
Figure II-2a: Schematics of Nc scaling from laboratory to a virtual producing well. Red
label refers to maximum Nc attained, yellow to medium Nc and green to the
lower Nc. The bigger red circle corresponds to the well face.
Figure II-2b: Schematics of ´scaling from laboratory to a virtual well. Red refers to
maximum ´attained and green to the lower ´ in the stress closure curve.
Figure II-3a: Coreflood schematics.
Figure II-3b: Core-holder schematics.
Figure III-1: Schematics of the Brazilian test performed to fracture the core.
Figure III-2a: Absolute Closure Curve ACC (blue line) and Oil Closure curve at Swirr (red
line) of Berea 47 core.
Figure III-2b: Normalized Absolute Closure Curve ACC (blue line) and Normalized Oil
Closure curve at Swr (red line) of Berea 47 core.
Figure III-3: Conventional dual porosity / permeability reservoir simulation approaches.
Akin [7].
Figure III-4: Estimation of fracture aperture as a function of hydrostatic effective stress.

14 AN EXPERIMENTAL STUDY OF WATER OIL RELATIVE PERMEABILITY OF FRACTURED
ROCK AT VARIABLE CONDITIONS OF HYDROSTATIC EFFECTIVE STRESS AND
CAPILLARY NUMBER
Figure III-5: Capillary pressure by porous plate at confined (3200 psi hydrostatic stress)
and unconfined (400 psi hydrostatic stress) regimes. Pe at confined regime
is 4 psi and 2 psi at unconfined regime.
Figure III-6: Surfactant rupture curve at unconfined and confined stress regimes.
Figure III-7: End-point Kr attributes and Corey exponents as a function of capillary
number Nc. Bold red label corresponds to Exp22.
Figure III-8: End-point Kr attributes and Corey exponents as a function of effective
stress ´. Bold yellow label corresponds to Exp22.
Figure III-9: Summary of measured W-O Kr (discrete points, oil: circles; water: squares)
and best Corey approximation (dashed lines) for the 6 base experiments.
Blue shade indicates the Mobile Saturation Window, MSW.
Figure III-10: Variation of Kw and Ko as a function of Nc for different effective stresses.
Red label corresponds to Exp22.
Figure III-11: Mobile Saturation Window MSW for the 6 base experiments. Exp22 (´ =
1800 psi and Nc = 2.4E-6) is outlined in each chart.
Figure III-12: Oil recovery curves for all the experiments.
Figure III-13: Water fractional flow curves for all the experiments.
Figure III-14: Schematics of the mobility ratio effect on water fractional flow curves.
Figure III-15: Normalized Kw vs ´ functions at various Nc values. Primary regression
follows the monophasic Kabs form shown in figure II-2b, i.e., Kw =
COEFF*´EXPON
Figure III-16: Normalized secondary regression functions COEFF(Nc) and EXPON(Nc) for
Kw prediction.
Figure III-17: Sor secondary regression approximations for COEFF and EXPON.
Figure III-18: Ko secondary regression approximation for COEFF and EXPON.

15
Figure III-19: Overall prediction error chart for the 6 Corey Kr parameters evaluated.
Figure III-20: Comparison between correlation prediction (derived from 6 experiments)
and measured Kr at intermediate effective stress (´= 1800 psi) and Nc
(2.4E-5) corresponding to Exp22 in table II-1.
Figure III-21: Normalized Absolute Closure Curves for different core samples.
Figure III-22: Nct correlation prediction as a function of power-law monophasic COEFF.
Figure III-23: Predicted Kw closure curves at varying normalized capillary numbers.
NOTE: normalization value is the Nct .
Figure III-24: Predicted Ko closure curves at varying normalized capillary numbers for
Berea 47. NOTE: normalization value is the Nct estimated at 6.6E-4.

16 AN EXPERIMENTAL STUDY OF WATER OIL RELATIVE PERMEABILITY OF FRACTURED
ROCK AT VARIABLE CONDITIONS OF HYDROSTATIC EFFECTIVE STRESS AND
CAPILLARY NUMBER
List of tables
Table I-1: Summary of the incidence of increased effective stress in end-point relative
permeability parameters [3].
Table I-2: Summary of reported incidence of increased capillary number in end-point
relative permeability parameters. Conventions: Ncc critical capillary number,
i.e., Nc value above which Sor starts decreasing. Nct total desaturation
capillary number, i.e., Nc value at which Sor equals zero [3].
Table II-1: Matrix of experimental design for JBN W-O Kr determination at variable
hydrostatic effective stress and Nc. In Expij terminology, i refers to the
range of effective stress ´ and j to the range of Nc tested. For example,
Exp23 means, experiment run at intermediate ´ and maximum Nc.
Table II-2a: Experimental datasheet.
Table II-2b: Typical output charts from experiments. JBN functions, differential pressure
across the core, effective permeabilities and relative permeabilities for a
typical experiment (Exp11).
Table III-1: Basic properties of Berea 47 core sample.
Table III-2: Estimation of fracture attributes such as fracture width and fracture
permeability as a function of hydrostatic effective stress. Core plug: Berea
No. 47.
Table III-4: Summary of W-O end-points and Corey exponents that best fits measured
data. Green values are taken as base conditions. Yellow values
correspond to Exp22 run at intermediate ´ and Nc to verify correlation
prediction.
Table III-5: Corey exponents that best fit measured Kr data (columns 4 and 5) and
least square difference between measured and Corey approximated Kr
(columns 6 and 7).

17
Table III-6: Correlation parameters for W-O Kr prediction at variable Nc and ´
Restrepo, 2016.
Table III-7: Comparison between measured Kr parameters in Exp22 and predicted
values by correlation. Red labeled values correspond to those reporting an
error above 20%.
Table III-8: Comparison between measured Kr values in Exp22 and predicted values
by correlation.
Table iv-1: Schematics of experimental matrix toward more generalized correlations
for stress and capillary number dependent Kr prediction.

18 AN EXPERIMENTAL STUDY OF WATER OIL RELATIVE PERMEABILITY OF FRACTURED
ROCK AT VARIABLE CONDITIONS OF HYDROSTATIC EFFECTIVE STRESS AND
CAPILLARY NUMBER
Nomenclature
Symbol Term Units Definition
Nc Capillary Number
1
(Ratio of
hydrodynamic to
capillary forces)
Viscosity
V Flow Velocity
Interfacial tension
Total stress psi
Biot constant 1
´ Effective stress psi
b´ Base or reference effective stress psi
Kabs Absolute permeability md
Ko Effective permeability to oil md
Kw Effective permeability to water md
kro Relative permeability to oil 1
krw Relative permeability to water 1
Sor Residual oil saturation 1
Swr Residual water saturation 1
Oil Corey Exponent 1
Water Corey Exponent 1
D Core diameter cm
L Core length cm
Fracture width microns
Total porosity 1
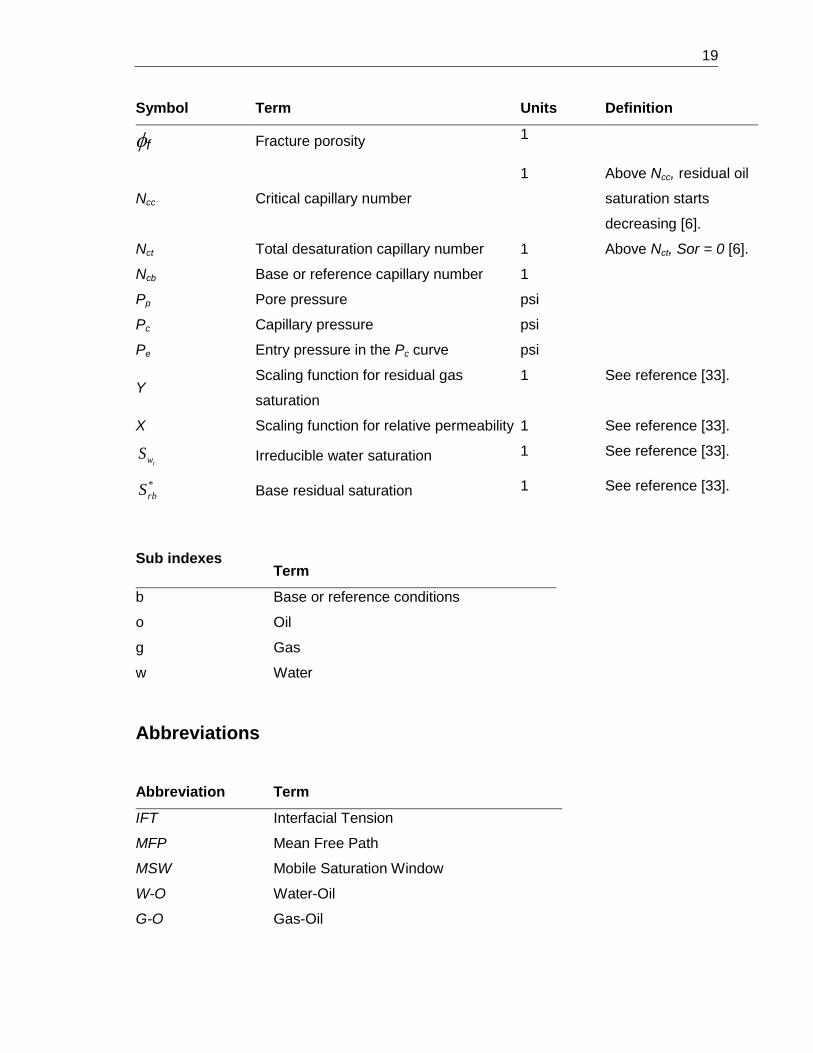
19
Symbol Term Units Definition
f Fracture porosity 1
Ncc Critical capillary number
1 Above Ncc, residual oil
saturation starts
decreasing [6].
Nct Total desaturation capillary number 1 Above Nct, Sor = 0 [6].
Ncb Base or reference capillary number 1
Pp Pore pressure psi
Pc Capillary pressure psi
Pe Entry pressure in the Pc curve psi
Y Scaling function for residual gas
saturation
1 See reference [33].
X Scaling function for relative permeability 1 See reference [33].
iwS Irreducible water saturation 1 See reference [33].
*
rbS Base residual saturation 1 See reference [33].
Sub indexes
Term
b Base or reference conditions
o Oil
g Gas
w Water
Abbreviations
Abbreviation Term
IFT Interfacial Tension
MFP Mean Free Path
MSW Mobile Saturation Window
W-O Water-Oil
G-O Gas-Oil

20 AN EXPERIMENTAL STUDY OF WATER OIL RELATIVE PERMEABILITY OF FRACTURED
ROCK AT VARIABLE CONDITIONS OF HYDROSTATIC EFFECTIVE STRESS AND
CAPILLARY NUMBER
Abbreviation Term
ACC Absolute Closure Curve
Kr Relative Permeability
Expij
W-O Relative Experiment at ith ´
and jth Nc.
i=1:´=3200 psi; i=2:´=1800 psi;
i=3:´=400 psi; j=1:Nc= 1.6E-6;
j=2:Nc= 2.5E-5; j=3:Nc= 4.13E-4.
CT Computarized Tomography

21
Introduction
The study of naturally fractured systems has been of primary interest for different
industries such as the oil and gas, hydrogeology and waste management. In all these
areas, applications exist in which the understanding of multiphase flow through fractures
is the key for proper assets management and risk dimensioning. For this reason,
important efforts and resources have been invested towards a better modeling and
prediction of complex rock-fluid interactions taking place in different environments. Some
examples include the work of Detwiler [1,2] who reported that the seal capacity of
fractured storage rocks can be greatly affected by mechanical and chemical alterations
induced by the injection of external fluids such as high dense contaminated fluids or CO2.
In his study, aspects such as two phase flow processes involving mass transfer between
phases and dissolution of minerals along fractures surfaces with varying effective stress
´ were documented. Computational models were also developed through the concept of
coupled reactive flow and mechanical deformation aiming at better predictions of the
system response to different injection schemes. Ojagbohunmi [3], presented
geomechanics coupled reservoir simulation results through conventional coupling, in
which absolute permeability varies with the state of stresses, and also by using the
modified coupling method in which both absolute and relative permeabilities are affected
by the stresses field. As noted in figure i-1, the main observation of this study is that
reservoir simulations differ, suggesting stress sensitive Kr may be relevant for proper
physics representation. In this approach, simple Corey based empirical correlations are
calculated to modify the end-points of a fixed shape Kr as no modifications are exerted to
the Corey exponents. Some recent studies include the investigations done by
22 AN EXPERIMENTAL STUDY OF WATER OIL RELATIVE PERMEABILITY OF FRACTURED
ROCK AT VARIABLE CONDITIONS OF HYDROSTATIC EFFECTIVE STRESS AND
CAPILLARY NUMBER
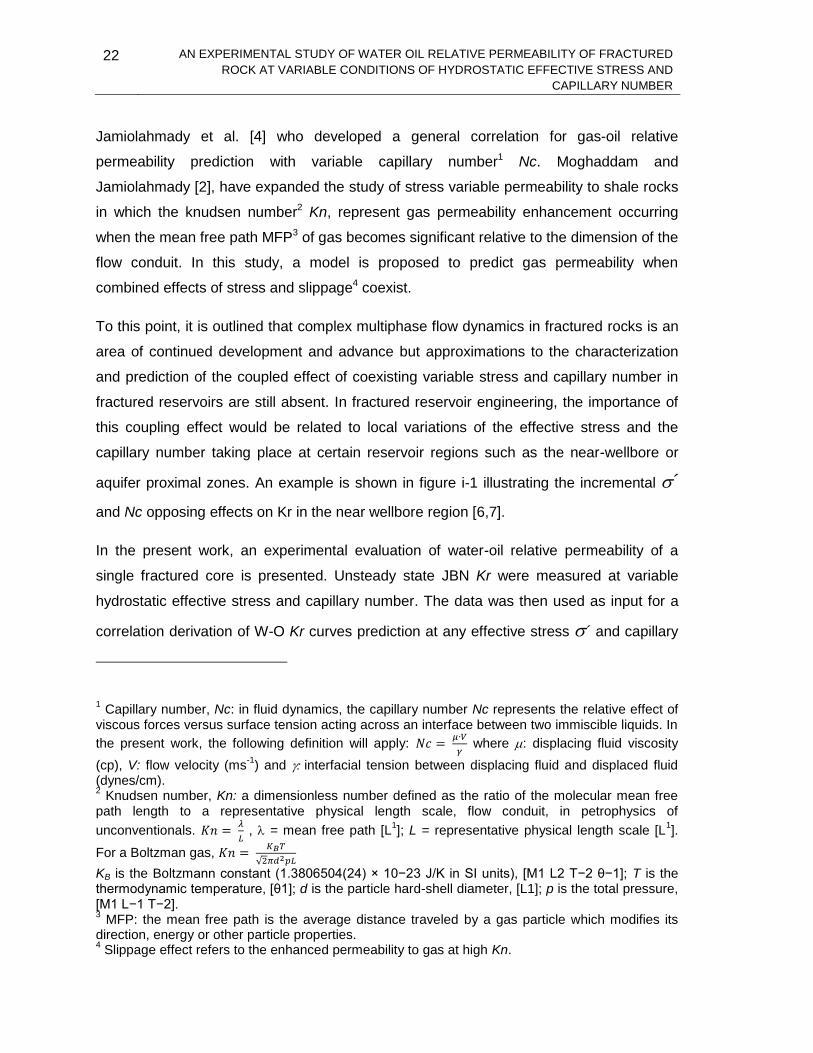
Jamiolahmady et al. [4] who developed a general correlation for gas-oil relative
permeability prediction with variable capillary number1 Nc. Moghaddam and
Jamiolahmady [2], have expanded the study of stress variable permeability to shale rocks
in which the knudsen number2 Kn, represent gas permeability enhancement occurring
when the mean free path MFP3 of gas becomes significant relative to the dimension of the
flow conduit. In this study, a model is proposed to predict gas permeability when
combined effects of stress and slippage4 coexist.
To this point, it is outlined that complex multiphase flow dynamics in fractured rocks is an
area of continued development and advance but approximations to the characterization
and prediction of the coupled effect of coexisting variable stress and capillary number in
fractured reservoirs are still absent. In fractured reservoir engineering, the importance of
this coupling effect would be related to local variations of the effective stress and the
capillary number taking place at certain reservoir regions such as the near-wellbore or
aquifer proximal zones. An example is shown in figure i-1 illustrating the incremental ´
and Nc opposing effects on Kr in the near wellbore region [6,7].
In the present work, an experimental evaluation of water-oil relative permeability of a
single fractured core is presented. Unsteady state JBN Kr were measured at variable
hydrostatic effective stress and capillary number. The data was then used as input for a
correlation derivation of W-O Kr curves prediction at any effective stress ´ and capillary
1 Capillary number, Nc: in fluid dynamics, the capillary number Nc represents the relative effect of
viscous forces versus surface tension acting across an interface between two immiscible liquids. In
the present work, the following definition will apply:
where : displacing fluid viscosity
(cp), V: flow velocity (ms-1
) and interfacial tension between displacing fluid and displaced fluid (dynes/cm). 2 Knudsen number, Kn: a dimensionless number defined as the ratio of the molecular mean free
path length to a representative physical length scale, flow conduit, in petrophysics of
unconventionals.
, = mean free path [L
1]; L = representative physical length scale [L
1].
For a Boltzman gas,
√
KB is the Boltzmann constant (1.3806504(24) × 10−23 J/K in SI units), [M1 L2 T−2 θ−1]; T is the thermodynamic temperature, [θ1]; d is the particle hard-shell diameter, [L1]; p is the total pressure, [M1 L−1 T−2]. 3 MFP: the mean free path is the average distance traveled by a gas particle which modifies its
direction, energy or other particle properties. 4 Slippage effect refers to the enhanced permeability to gas at high Kn.

23
number Nc. Developed correlation is fed by a base Krb set, conventionally measured at
low capillary number denoted by Ncb. Main limitations of the calculations would be related
to the hydrostatic stress regime that may differ from actual anisotropic conditions and the
fact that only a single plane fracture configuration is tested in a Berea core. Even though,
it is hypothesized that empirical constants of the correlation are linked to the Absolute
Closure Curve (ACC), ACC refers to the absolute permeability variation with hydrostatic
effective stress. Measured W-O relative permeabilities are approximated by the Corey
equations and plotted versus the stress and Nc to propose a correlation that allow the
estimation of W-O Kr at any ´- Nc combination. In the majority of cases, the best fit of
data (Corey-based Kr vs ´and Nc plots) is reached through power-law functions for
stress and semi-logarithmic functions for Nc. Petro-physical characterization included un-
fractured core absolute permeability measurement along with capillary pressure, fracture
width, surfactant dynamic adsorption and recovery factor measurements at unconfined
and confined stress regimes5.
Results of the present study confirm that W-O relative permeabilities are modified when
changes on effective stress ´, capillary number Nc or both are induced on a fractured
core and suggest that the relative effect of each variable upon Kr depends on the
absolute value of the other. In general, it is noted that Kr is more affected by ´ at low Nc
while stress sensitivity tends to be diminished by the enhanced flow capacity promoted at
high Nc. The new correlation proposed to capture this coupled behavior can be
incorporated into reservoir simulations. Applications in fractured systems may include but
are not limited to:
- Better representation of water encroachment phenomena.
- Support IOR/EOR design and monitoring.
- Support reservoir and well management decisions.
5 The differential extrusion volume technique was used for fracture width estimation while the
surfactant rupture curve method was used for dynamic adsorption characterization.

24 AN EXPERIMENTAL STUDY OF WATER OIL RELATIVE PERMEABILITY OF FRACTURED
ROCK AT VARIABLE CONDITIONS OF HYDROSTATIC EFFECTIVE STRESS AND
CAPILLARY NUMBER
- Translation of available correlations for predictions of Nc-Kr and ´-Kr to ´:Nc-Kr
predictions.
Further studies are proposed to broaden the predictability of the correlation by including
other types of rocks, fluids, wettability condition, fractures and stress regimes (e.g.
anisotropic).
Figure i-1: Comparison between uncoupled, conventional geomechanics coupling, i.e,
stress dependent K (coupled_1) and stress dependent Kr (coupled_2) [3].
Figure i-2: Schematics of combining the effects of effective stress and capillary
number for the near wellbore region [6, 7].

25
Chapter 1
Relative Permeability of Fractured Rocks
In this chapter, concepts related to the study of relative permeability in fractured rocks are
presented. A state of the art literature review on petrophysical characterization of
fractured systems, followed by a summary of specialized studies aimed on Kr
determination under variable stress and variable capillary number are presented. These
provide the theoretical basis for the discussion proposed in next chapters, where
experimental results of JBN-based relative permeability measured at different stress and
capillary number are presented and analyzed.
1.1 Petrophysical Characterization of Fractured Rocks
Fractured systems petro physics has been an area of study over the years. In particular,
the understanding of multiphase flow has led to diverse approximations for static and
dynamic description of different rock type systems. Corey [8] and Honarpour [9] reported
that oil-gas O-G and W-O relative permeability of stratified rocks is governed by flow
direction and capillary continuity between fine layers and the matrix, and proposed
models to calculate inter-bedding rocks Kr when flow direction occurs parallel and

26 AN EXPERIMENTAL STUDY OF WATER OIL RELATIVE PERMEABILITY OF FRACTURED
ROCK AT VARIABLE CONDITIONS OF HYDROSTATIC EFFECTIVE STRESS AND
CAPILLARY NUMBER
perpendicular to the bedding plane showing that the latter case exhibited less Kr to both
phases. Sigmund [9], proposed a numerical model with inclusion of capillary pressure to
better characterize Kr in heterogeneous carbonate cores. History match of measured
coreflood data allowed correcting for capillary end-effects6 normally present in steady-
state drainage coreflood experiments [10]. Flow visualization in fractures has also been
addressed alluding to parallel plates physical models and computarized tomography CT
aimed at the characterization of fracture morphology and saturation distribution. Persoff
and Pruess [11] measured Kr of synthetic fractures, which were replicated with silicone
rubber molds and epoxy. The apparatus, shown in Figure I-1, allowed the visualization of
interfering dual phase flow accountable for Kr data that moved away from the miscible
regime (Kr sum equal to one). The same result was observed by Akin [12] who
incorporated simulation to history match coreflood pressure data in artificially fractured
Berea sandstones shown schematically in Figure I-2. Fracture Kr diverting from the
miscible type regime (figure I-2) confirm that different parameters such as failure
mechanism (shear, tensile), fracture roughness, degree and type of mineralization, and
fracture dimension (macro-micro) all account for non-linear fracture Kr. An illustration of
factors affecting fracture conductivity is shown in figure I-3 [13]. Jamiolahmady [39] also
reported that Kr within fractures are not linear and are functions of fractional flow with
inertia being very significant within it.
CT has been used by several authors [14, 15, 16, 17] for the study of fracture geometry.
Walters [14], applied coreflood simulation to predict Kr on variable aperture fractures
generated through the Brazilian tensile test. By using CT, the aperture distribution was
indirectly measured and fracture capillary pressure derived to feed into the simulation
model. In this study, unstable multiphase flow related to phase interference was reported
due to highly heterogeneous fracture geometry leading to capillary effects preventing the
smaller apertures to allow the flow trough. Bertels [15], extended the CT application to the
determination of in-situ saturations confirming that smaller apertures relate to higher
residual saturations due to the capillary forces present. Finally, Huo [16] measured
6 In coreflooding, capillary end effects arise from the discontinuity of capillarity in the wetting phase
at the outlet face of the core.Capillary end effects appear in situations of oil displacing water in water wet cores, and gas displacing oil cases.

27
fracture aperture distributions and capillary pressures at different confining stresses
noting changes in the aperture distributions and capillary pressure curve with respect to
stress as shown in figures I-4, I-5 and I-6.
Figure I-1: Flow visualization cell in synthetic fracture [11].
Figure I-2: Schematics of artificially fractured core and miscible Kr [12].

28 AN EXPERIMENTAL STUDY OF WATER OIL RELATIVE PERMEABILITY OF FRACTURED
ROCK AT VARIABLE CONDITIONS OF HYDROSTATIC EFFECTIVE STRESS AND
CAPILLARY NUMBER
Figure I-3: Schematic of fracture classification: a) Macro fractures with natural or
artificial proppants; b) Naturally closed mated fractures; c) Self-supporting
unmated7 fracture [13].
Figure I-4: Fluid distribution in the fracture at a fixed capillary pressure. The upper
image shows the full aperture field, the lower left image is the nonwetting-
phase-filled apertures and the lower right image is the wetting-phase-filled
apertures. The critical aperture at the fixed capillary pressure is 0.15mm
[16].
7 Unmated fracture refers to fractures that have incongruent opposing faces, which do not fit
together perfectly.

29
Figure I-5: Fracture aperture distribution at variable confining stress [16].
Figure I-6: Capillary pressure at variable confining stress [16].
In general, proper incorporation of the above mentioned petrophysical attributes have led
to better prediction tools of fluid-rock dynamics in fractured systems. In particular,
reservoir simulation approaches have evolved from homogeneous three phase 1D-3D
models incorporating capillary effects [17], through fine-grid simulation of 2-phase flow in
fractured porous media [21] and Kr generation by network modeling [22] and momentum
30 AN EXPERIMENTAL STUDY OF WATER OIL RELATIVE PERMEABILITY OF FRACTURED
ROCK AT VARIABLE CONDITIONS OF HYDROSTATIC EFFECTIVE STRESS AND
CAPILLARY NUMBER
balance methods as Laticce-Boltzman8 [23], to geomechanics coupled simulations [18-20]
and rate-IFT dependent Kr simulations [4,6], all aimed at better predictability of
multiphase flow through fractures. Recent applications include the usage of un-structured
grids for discrete fractures representation that provide numerical solutions in a wide
variety of fracture network configurations [24, 25]. Next section of this chapter will provide
details on the concepts of stress-strain dependent permeability and capillary number
dependent permeability, which are the subject of the present work.
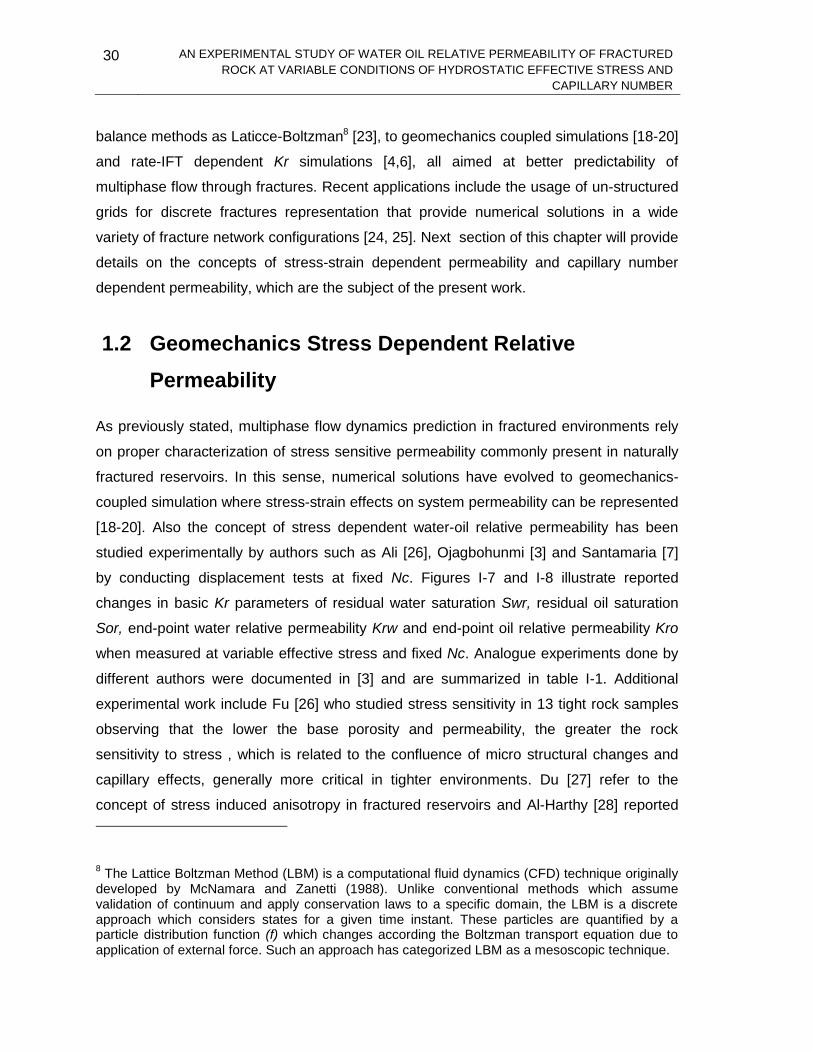
1.2 Geomechanics Stress Dependent Relative
Permeability
As previously stated, multiphase flow dynamics prediction in fractured environments rely
on proper characterization of stress sensitive permeability commonly present in naturally
fractured reservoirs. In this sense, numerical solutions have evolved to geomechanics-
coupled simulation where stress-strain effects on system permeability can be represented
[18-20]. Also the concept of stress dependent water-oil relative permeability has been
studied experimentally by authors such as Ali [26], Ojagbohunmi [3] and Santamaria [7]
by conducting displacement tests at fixed Nc. Figures I-7 and I-8 illustrate reported
changes in basic Kr parameters of residual water saturation Swr, residual oil saturation
Sor, end-point water relative permeability Krw and end-point oil relative permeability Kro
when measured at variable effective stress and fixed Nc. Analogue experiments done by
different authors were documented in [3] and are summarized in table I-1. Additional
experimental work include Fu [26] who studied stress sensitivity in 13 tight rock samples
observing that the lower the base porosity and permeability, the greater the rock
sensitivity to stress , which is related to the confluence of micro structural changes and
capillary effects, generally more critical in tighter environments. Du [27] refer to the
concept of stress induced anisotropy in fractured reservoirs and Al-Harthy [28] reported
8 The Lattice Boltzman Method (LBM) is a computational fluid dynamics (CFD) technique originally
developed by McNamara and Zanetti (1988). Unlike conventional methods which assume validation of continuum and apply conservation laws to a specific domain, the LBM is a discrete approach which considers states for a given time instant. These particles are quantified by a particle distribution function (f) which changes according the Boltzman transport equation due to application of external force. Such an approach has categorized LBM as a mesoscopic technique.

31
that closure stress curves, i.e. permeability vs effective stress relationships are different
between hydrostatic and anisotropic regimes. This result is illustrated in figure I-9.
Figure I-7: JBN-based water oil relative permeability at 1000 psi and 3000 psi
hydrostatic effective stress [7].
Figure I-8a: Variation of end-point oil relative permeability Kro* and residual oil
saturation Sor with hydrostatic effective stress normalized porosity.
Krw
Kro
Sw
Water Oil Krs of Fractured Berea Core Santamaria [7]
Kro (σ'=3000psi) Kro (σ'=1000psi)
Krw (σ'=3000psi) Krw (σ'=1000psi)

32 AN EXPERIMENTAL STUDY OF WATER OIL RELATIVE PERMEABILITY OF FRACTURED
ROCK AT VARIABLE CONDITIONS OF HYDROSTATIC EFFECTIVE STRESS AND
CAPILLARY NUMBER
Figure I-8b: Variation of end-point water relative permeability Krw* and residual water
saturation Swr with hydrostatic effective stress normalized porosity [3].
Summary of references – Variation of water-oil Kr parameters with effective stress
Variable Wilson (1956)
Ali et al (1987)
Oldakowski (1994)
Jones et al. (2001)
Khan (2009)
Anisotropic stress regime
Hamoud et al. (2012)
Anisotropic stress regime
Santamaria (2014)
Kro Decrease Decrease Decrease Decrease Decrease
Sor Increase Increase Increase Variable with shear stress
Increase
Krw Decrease No change Decrease Decrease Decrease Decrease
Swirr Increase Increase
At low
´increases then decreases.
Always decrease
at high´
Increase No change
Table I-1: Summary of the incidence of increased effective stress in end-point relative
permeability parameters [3].
Figure I-9: Schematics of tri-axial cell and differences between hydrostatic and tri-axial
closure stress curves [28].

33
The above mentioned studies provide the base tendencies of the variation of Kr
parameters with effective stress that will be compared to those obtained in the present
investigation and also constitute a base towards more generalized correlations where
other factors such as anisotropy, wettability and fracture features should play a role.
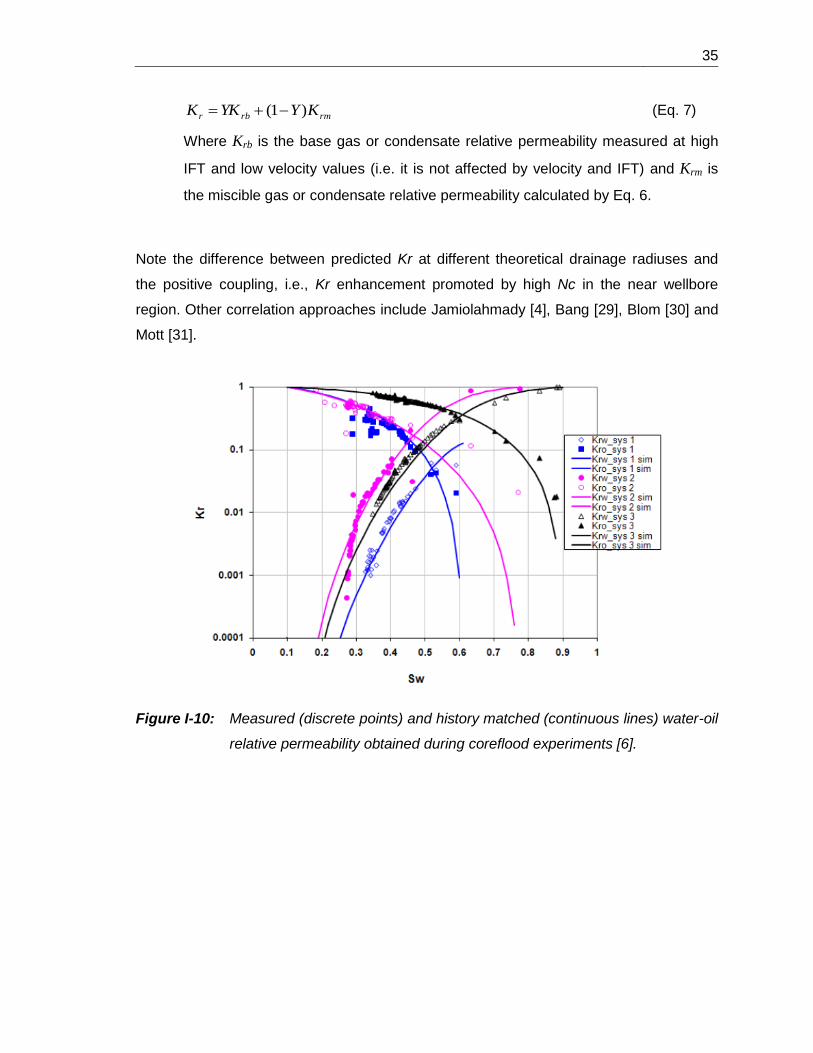
1.3 Capillary Number Dependent Relative Permeability
A summary of several studies on Nc dependent Kr was presented by Chukwudeme [6]
and is presented in table I-2. W-O relative permeability parameters9 are Nc dependent in
homogeneous systems tested at a reference effective stress ´b. Typical W-O relative
permeability curves are shown in figure I-10. Figure I-11 shows Sor reduction with Nc
illustrating also the concepts of critical capillary number Ncc, or the Nc value at which Sor
starts decreasing and total desaturation capillary number Nct, equivalent to the Nc value
at which Sor equals zero.
In gas-condensate systems, the inclusion of Nc dependent Kr is becoming standard
practice for reservoir simulations. Henderson et al. [33] developed correlations to express
Nc-Kr dependency based on coreflooding experiments at variable magnitude of Nc
controlled by rate and IFT during gas-condensate steady state Kr measurements at
constant effective stress. An example of modified Kr upon the application of Henderson´s
et al. correlation to a typical Colombian reservoir sandstone is shown in figure I-12. The
following is the general procedure to apply the correlation at each capillary number of
interest:
1. Calculate gas velocity:
)1( w
g
gSA
qV
(Eq. 1)
where gV is gas velocity in ms-1, gq is gas rate in m3, A is cylindrical flowing area
at the drainage radius of interest (2πrh) in m2, is porosity and wS is irreducible
water saturation at base conditions10.
9 Herein referred as end-points residual saturations and relative permeabilities.
10 Base conditions correspond to a set of Kr measured at low Nc or more generally at a base Nc.

34 AN EXPERIMENTAL STUDY OF WATER OIL RELATIVE PERMEABILITY OF FRACTURED
ROCK AT VARIABLE CONDITIONS OF HYDROSTATIC EFFECTIVE STRESS AND
CAPILLARY NUMBER
2. Calculate the equivalent capillary number:
IFT
VNc
gg (Eq. 2)
where g is gas viscosity in cp and IFT is the interfacial tension between gas and
condensate in mN/m at the pressure of interest11.
3. Calculate the scaling function for relative permeability to gas and condensate:
n
c
cb
N
NY
(Eq. 3)
where Ncb is the reference or base capillary number, Nc is the capillary number of
interest (i.e, calculated by Eq.2) and n is an empirical constant assuming one
value for gas and another value for condensate12.
4. Calculate the scaling function for residual gas saturation:
c
cb
N
Nm
eX 1 (Eq. 4)
where m is an empirical constant assuming one value for gas13.
5. Calculate normalized gas saturation S*:
iwS
SS
1
* (Eq. 5)
where iwS is irreducible water saturation and S is gas saturation.
6. Calculate the miscible relative permeabilities to gas and condensate:
*
**
1 rb
rb
rmSX
SXSK
(Eq. 6)
where *
rbS is the base or reference residual gas and condensate saturation taken
from the base gas-condensate Kr.
7. Calculate relative permeabilities at the interested Nc:
11 Viscosity and interfacial tension values are derived from PVT data (gas viscosity vs pressure
and IFT vs pressure functions). 12
n = 0.25 for gas phase and n = 0.1 for condensate phase in Mirador sandstone formation according to Salino, 2014. 13
m = 51 for gas phase and m = 1000 for condensate phase in Mirador sandstone formation according to Salino, 2014.
35
rmrbr KYYKK )1( (Eq. 7)
Where Krb is the base gas or condensate relative permeability measured at high
IFT and low velocity values (i.e. it is not affected by velocity and IFT) and Krm is
the miscible gas or condensate relative permeability calculated by Eq. 6.
Note the difference between predicted Kr at different theoretical drainage radiuses and
the positive coupling, i.e., Kr enhancement promoted by high Nc in the near wellbore
region. Other correlation approaches include Jamiolahmady [4], Bang [29], Blom [30] and
Mott [31].
Figure I-10: Measured (discrete points) and history matched (continuous lines) water-oil
relative permeability obtained during coreflood experiments [6].

36 AN EXPERIMENTAL STUDY OF WATER OIL RELATIVE PERMEABILITY OF FRACTURED
ROCK AT VARIABLE CONDITIONS OF HYDROSTATIC EFFECTIVE STRESS AND
CAPILLARY NUMBER
Figure I-11: Sor reduction with increasing Nc measured during water-oil core
displacements [6].
Table I-2: Summary of reported incidence of increased capillary number in end-point
relative permeability parameters. Conventions: Ncc critical capillary number,
i.e., Nc value above which Sor starts decreasing. Nct total desaturation
capillary number, i.e., Nc value at which Sor equals zero [3].

37
Figure I-12: Schematics of Nc dependent Kr in a typical Colombian sandstone of a gas-
condensate reservoir [33].

38 AN EXPERIMENTAL STUDY OF WATER OIL RELATIVE PERMEABILITY OF FRACTURED
ROCK AT VARIABLE CONDITIONS OF HYDROSTATIC EFFECTIVE STRESS AND
CAPILLARY NUMBER
Chapter 2
JBN-based Water Oil Relative Permeabilities
of Fractured Rock at Variable Hydrostatic
Effective Stress ´ and Capillary Number Nc
In the previous chapter, studies were discussed that reported Kr changes due to
independent effect of ´ and Nc variations. The present chapter describes the hypothesis
and methodology followed to study Kr changes when a fractured core is subject to
simultaneous ´ and Nc variations. For this, JBN-based water oil relative permeability
data have been obtained based on the conducted coreflood measurements on a Berea
sandstone fractured core at variable hydrostatic effective stress and capillary numbers.
The following basic definitions can be used to express the test conditions:
(Eq. 8)

39
(Eq. 9)
Where ´ is the effective stress (psi), is the total stress (psi), is the Biot constant, Pp
is the pore pressure (psi), is displacing fluid viscosity (cp), V is the flow velocity (m.s-1)
and is the interfacial tension IFT between water and oil (dynes.cm-1).
Without lack of generality, ´ will be treated as the effective stress represented in a
hydrostatic regime as shown in figure II-0 and will be equivalent to the confinement
pressure as and Pp will be set to one14 and atmospheric pressure Patm respectively. Nc
will be set to that of water displacing oil15.
Figure II-0: Schematics of hydrostatic effective stress. Red arrows represent the
confining pressure exerted radially on the core.
14 Biot constant of 1.0 approximates system behavior to that of a highly deformable fracture of no
cohesion between fracture faces. 15
This clarity is done because capillary number of oil-displacing water differs from that of water displacing oil according to Eq.2. In a practical sense, Kr parameters will all be referred to water displacing oil Nc although Nc to reach end-point Kro* is higher due to higher oil viscosity in the present study.

40 AN EXPERIMENTAL STUDY OF WATER OIL RELATIVE PERMEABILITY OF FRACTURED
ROCK AT VARIABLE CONDITIONS OF HYDROSTATIC EFFECTIVE STRESS AND
CAPILLARY NUMBER
2.1 Hypothesis of the Study
General hypothesis of the study is stated as follows:
Parameters of water oil relative permeability W-O Kr, measured by the JBN method in a
fractured core will change as hydrostatic effective stress and capillary number conditions
vary. Results should follow reported tendencies of either ´- Kr variation at constant Nc
(table I-1) or Nc-Kr variation at constant ´ (table I-2) and reveal some interdependence
between Nc and ´ when acting simultaneously over a fractured rock specimen.
With the purpose of testing the hypothesis, the experimental design shown in table II-1
was proposed to measure JBN-based W-O Kr at variable ´ and Nc. By convention,
hydrostatic stress No.1 corresponds to the maximum, No.2 to the intermediate and No.3
to the minimum, all values in the tested range. In table II-1, experiments outlined in yellow
correspond to those incorporated in the correlation derivation. Exp22* refers to an
additional experiment performed to test correlation predictability. Values of ´ were
based on the Absolute Closure Curve (ACC) reported in the next section. Extreme high
and low ´ values were chosen to resemble uncompressed and compressed state of
stress or more generally, confined and unconfined regimes. The lower Nc corresponds to
1 cc/min rate and highest Nc to 16 cc/min rate plus the incorporation of a non-ionic
commercial surfactant to the injected water to reduce IFT. W-O IFT was measured by the
ring method and results are shown in figure II-1. Surfactant dosage of 1000 ppm was
used to reach an IFT of 2.3 mN/m allowing to reach the highest Nc according to Eq. 2.
Figure II-2a and II-2b illustrates the output of a basic scaling exercise16 to estimate the
16 Nc at virtual well is calculated according to Equation 9 assuming the following properties: water
viscosity 1 cp, water-oil IFT 30 mN/m, Qo = 100 bb/d, Qw = 9000 bbl/d, Net pay H = 20 ft, rw = 0.35
ft, re = 800 ft, Sor = 0.05. The velocity V is calculated as
where A(r) is total area open to
flow equivalent to that of a cylinder of radius r and discounting for residual oil saturation, . Conversion factor of 2.02E-5 is applied to express velocity in m/s in order to
calculate Nc by Eq. 9. Effective stress ´ at virtual well is calculated for both production and

41
drainage radii around a virtual well that represents the Nc and ´ values tested at the
laboratory. As it can be seen, in the production mode, higher Nc (4.1E-4, red label) would
represent a drainage radius of 0.55 ft, medium Nc (2.5E-5, yellow label) a radius of 8.8 ft
and the lowest Nc (1.6E-6, green label) a drainage radius of 98 ft. Regarding the effective
stress ´, the maximum effective stress tested at the laboratory (´ = 4800 psi, red
label) would correspond to near wellbore conditions or a drainage radius of 0.60 ft in the
virtual producer. Medium effective stress (´ = 1800 psi, yellow label), would be reached
at 350 ft of a virtual producer well and finally, the minimum effective stress tested at the
laboratory (´ = 400 psi, green label) would be equivalent to a radius of 5.6 ft in a virtual
well injecting 42300 bbl/d of water. In this particular case, the increase in the pore
pressure caused by the high rate water injected would theoretically reduce the effective
stress calculated by Eq. 8 to this value.
´ Nc Nc1 = 1.6E-6 Nc2 = 2.5E-5 Nc3 = 4.1E-4
´1 = 4800 Exp11 Exp12 Exp13
´2 = 1800 Exp21 Exp22* Exp23
´3 = 400 Exp31 Exp32 Exp33
injection conditions assuming Qo = 100 bb/d, Qw = 9000 bbl/d in production mode and Qwi = 42300
bbl/d in injection mode. The following properties apply: 1 = v = 1.0 psi/ft, 2 = H = 0.85 psi/ft, 3
= h = 0.55 psi/ft. The predominant stress for fracture closure or opening is assumed as that acting
normal to the fracture face. According to this and assuming fractures are sub-parallel to H, i.e.,
= the maximum stress direction +/- 30 deg. The following formula is applied to calculate the total
normal stress :
(Eq. A)
Finally and setting the Biot constant = 0.8, the effective stress acting on the fracture face is
calculated as ´ = - Pp. Pore pressure Pp, is calculated as a function of drainage radius with
the following equation:
2
5.02.141
re
r
rw
rLn
kH
qPwfP www
r
(Eq. B)
Pwf in production mode is 400 psi and 7500 psi in injection mode and flow rates are positive producing and negative injecting. K during the production period is 200 md and becomes 490 md during the injection period assuming rock dilation enhanced permeability.

42 AN EXPERIMENTAL STUDY OF WATER OIL RELATIVE PERMEABILITY OF FRACTURED
ROCK AT VARIABLE CONDITIONS OF HYDROSTATIC EFFECTIVE STRESS AND
CAPILLARY NUMBER
Table II-1: Matrix of experimental design for JBN W-O Kr determination at variable
hydrostatic effective stress and Nc. In Expij terminology, i refers to the
range of effective stress ´ and j to the range of Nc tested. For example,
Exp23 means, experiment run at intermediate ´ and maximum Nc.
NOTE: In table II-1, ´1 = 3200 psi, ´2 = 1800 psi and ´3 = 400 psi and Nc1 = 1.6E-6,
Nc2 = 2.5E-5 and Nc3 = 4.1E-4.
Figure II-1: W-O IFT measured by the ring method.

43
.
Figure II-2a: Schematics of Nc scaling from laboratory to a virtual producing well. Red
label refers to maximum Nc attained, yellow to medium Nc and green to the
lower Nc. The bigger red circle corresponds to the well face.

44 AN EXPERIMENTAL STUDY OF WATER OIL RELATIVE PERMEABILITY OF FRACTURED
ROCK AT VARIABLE CONDITIONS OF HYDROSTATIC EFFECTIVE STRESS AND
CAPILLARY NUMBER
Figure II-2b: Schematics of ´scaling from laboratory to a virtual well. Red refers to
maximum ´attained and green to the lower ´ in the stress closure curve.
45
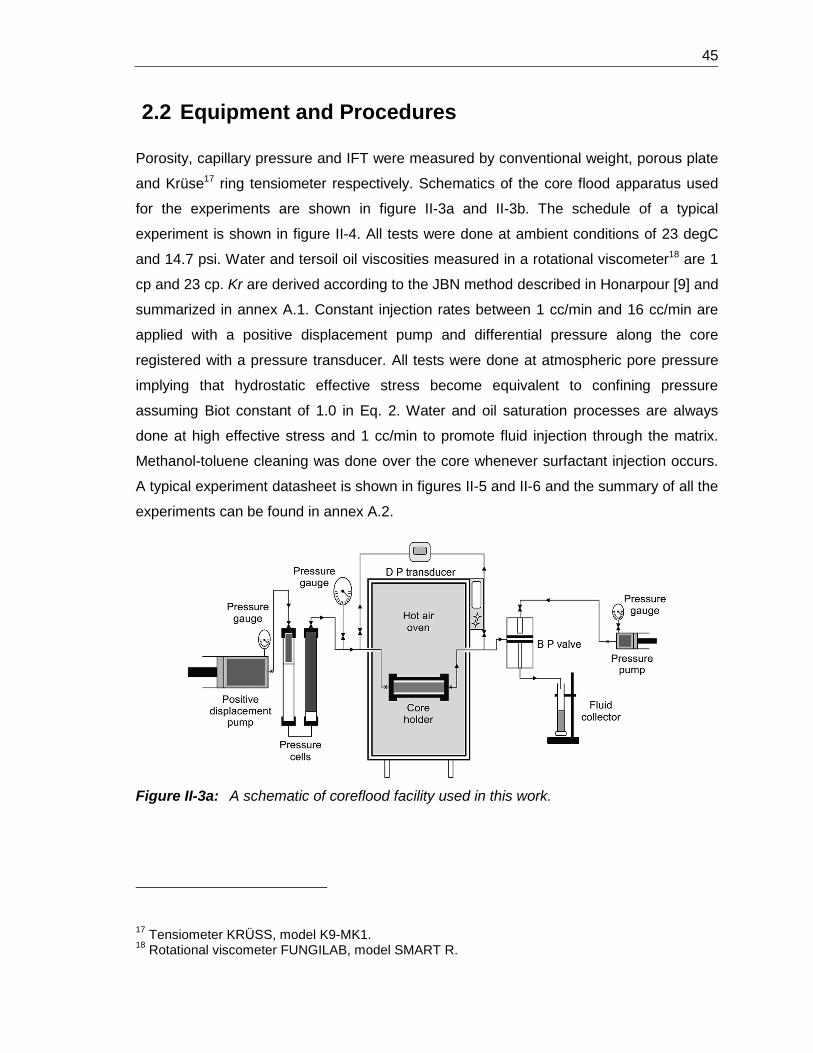
2.2 Equipment and Procedures
Porosity, capillary pressure and IFT were measured by conventional weight, porous plate
and Krüse17 ring tensiometer respectively. Schematics of the core flood apparatus used
for the experiments are shown in figure II-3a and II-3b. The schedule of a typical
experiment is shown in figure II-4. All tests were done at ambient conditions of 23 degC
and 14.7 psi. Water and tersoil oil viscosities measured in a rotational viscometer18 are 1
cp and 23 cp. Kr are derived according to the JBN method described in Honarpour [9] and
summarized in annex A.1. Constant injection rates between 1 cc/min and 16 cc/min are
applied with a positive displacement pump and differential pressure along the core
registered with a pressure transducer. All tests were done at atmospheric pore pressure
implying that hydrostatic effective stress become equivalent to confining pressure
assuming Biot constant of 1.0 in Eq. 2. Water and oil saturation processes are always
done at high effective stress and 1 cc/min to promote fluid injection through the matrix.
Methanol-toluene cleaning was done over the core whenever surfactant injection occurs.
A typical experiment datasheet is shown in figures II-5 and II-6 and the summary of all the
experiments can be found in annex A.2.
Figure II-3a: A schematic of coreflood facility used in this work.
17 Tensiometer KRÜSS, model K9-MK1.
18 Rotational viscometer FUNGILAB, model SMART R.

46 AN EXPERIMENTAL STUDY OF WATER OIL RELATIVE PERMEABILITY OF FRACTURED
ROCK AT VARIABLE CONDITIONS OF HYDROSTATIC EFFECTIVE STRESS AND
CAPILLARY NUMBER
Figure II-3b: A schematic of the core-holder used in the tests conducted in this study.
Figure II-4: Typical experimental sequence (Exp 32).

47
Figure II-5: A sample of experimental datasheet for tests conducted in this work.
Figure II-6: Output charts of a typical experiment (Exp 11). Upper left: 1/Qi vs 1/(IR*Qi)
function19; upper right: differential pressure measured across the core;
lower left: effective permeabilities; lower right: water-oil relative
permeabilities indicating the MSW in shaded blue.
19 1/Qi vs (1/IR*Qi) chart is used to calculate the derivative of the denominator in Eq. A1.5
according to the JBN method described in annex A.1.
DATE: 1-Apr-16
HYDROSTATIC EFFECTIVE STRESS: 3200 psi
CAPILLARY NUMBER: 1.60E-06
W-O INTERFACIAL TENSION: 38.5 mN/m
CONFINING PRESSURE: 3200 psi INJECTION RATE: 1.0 cc/min
PORE PRESSURE: 14.7 psi ATMOSFERIC PRESSURE: 14.7 psi
TEMPERATURE: 27 degCSurfactant Concentration in
Water:1000 ppm
Length: 5.36 cm
Diameter: 3.81 cm
Area: 11.4 cm2
Porous Volume: 15.96 cc
Rock Volume: 61 cc
Porosidad: 0.2611 Fraction
Viscosity @ Testing °T: 1 cp
NaCl 2.31 (mg /L)
KCl 0.06000 (mg /L)
MgCl2 - (mg /L)
CaCl2 0.20000 (mg /L)
Type of Fluid:
Oil Viscosity @ Testing °T: 23 cp
TEST IDENTIFICATION
TESTING CONDITIONS
Exp11_´1_Nc1
CORE DATA
TERSOL OIL
REMARKS
FLUIDS DATA
BRINE
OIL
Composition
1
10
100
0.1 1 10 100 1000 10000
IFT
(mN/
m)
Surfactant Concentration in Water (ppm)
Water - Oil Interfacial Tension
Kw = 2950 -0.366
R² = 0.9672
Ko = 331.86 -0.039
R² = 0.9805
0
50
100
150
200
250
300
350
400
0 500 1000 1500 2000 2500 3000 3500 4000 4500 5000
K (m
d)
(psi)
Berea Sample No. 47 - Effective Stress Closure Curves
Unfractured core Kabs = 42 md

48 AN EXPERIMENTAL STUDY OF WATER OIL RELATIVE PERMEABILITY OF FRACTURED
ROCK AT VARIABLE CONDITIONS OF HYDROSTATIC EFFECTIVE STRESS AND
CAPILLARY NUMBER
Chapter 3
Results and Discussion
Three sets of results are discussed. First, basic petrophysical characterization of the
matrix-fracture system is presented covering basic properties of un-fractured core, stress
closure curves to water and oil, fracture width and fracture permeability estimation by
extruded volume method and capillary pressure at confined and unconfined regimes.
Second, results from JBN water oil relative permeability curves measured at different
hydrostatic stress and capillary number are presented and third, a correlation approach is
proposed for´ - Nc Kr prediction in water oil fractured systems.
3.1 Petrophysical characterization of core matrix and
fracture
Petro physical analysis covers basic core characterization summarized in table III-1. After
measuring un-fractured permeability and porosity (Kabs = 42.5 md, = 25.5 %), the core

49
was fractured following an induced failure protocol in which localized axial stress20 is
exerted over the uppermost face of the core as shown in figure III-1. This test promoted
the single – plane axial fracture shown in table III-1. Stress closure curves referring to K
vs´ measurements under hydrostatic regime were performed by increasing confining
pressure while maintaining atmospheric pore pressure. Two closure curves were
determined; one at 100% Sw, referred as Kabs closure curve, and the other to oil at
residual water saturation Swr, expressed as Ko closure curve. Nc was set to 1.56E-6 during
this procedure. Fracture aperture was estimated by the extruded volume technique, which
is described after. Finally, capillary pressures and surfactant rupture curves21 were
measured at un-confined and confined stress regimes.
Figure III-1: Schematics of the induced failure test performed to fracture the core.
20 A nail is located across the upper face of the core to distribute the strength of the press along a
single fracturing line. 21
Rupture curve refers to the measurement of the inflow and outflow surfactant concentration during water + surfactant mixture injection into the core. This tests is useful to estimate the dynamic adsorption properties of a given solution in contact with a rock. Surfactant concentrations are measured by colorimetric technique. For this, a calibration chart is pre-built by measuring the absorbance of different water-surfactant solutions of known surfactant concentration.

50 AN EXPERIMENTAL STUDY OF WATER OIL RELATIVE PERMEABILITY OF FRACTURED
ROCK AT VARIABLE CONDITIONS OF HYDROSTATIC EFFECTIVE STRESS AND
CAPILLARY NUMBER
Table III-1: Basic properties of Berea 47 core sample.
3.1.1 Hydrostatic stress closure curves to oil and water
Measured closure curves to water and oil are shown in figure III-2. The main observation
from this curve is that the closure behavior varies with the number of phases present. For
the set of tested conditions, a hypothesis emerge and is that the matrix-fracture system
have some characteristic monophasic closure curve which in general will reveal up to 10
times more stress sensitivity than the same system but with presence of multiple phases.
As will be shown later, this interrelation between stress sensitivity and multiphase flow
become strongly dependent on the capillary number value. It is noted that a two-phases
system will approach the behavior of a single-phase system in terms of the stress
sensitivity completely resembling it at the theoretical total desaturation capillary number,
Nct. At low capillary numbers instead, the non-wetting phase tend to exhibit apparent low
stress sensitivity behavior. This effect could be interpreted as non-wetting phase (oil)
flowing through the matrix (where sensitivity is minimal) or through an internal channel
between the wetting phase (water) and fracture faces. Note in figure III-2, that both
Pore pressure (psi) 14.7
Hydrostatic Confinement pressure (psi) Variable
Temperature (°C) 27
Injection Rate (cc/min) Variable
Lenght (cm) 5.360
Diameter (cm) 3.810
AREA (cm2) 11.401
Dry weight (gr) 137.712
Brine saturated weight (gr) 153.557
Total Porous Volume (cm3) 15.957
Total Rock Volume (cm3) 61.109
Total Porosity (%) 26.11%
Total Fracture Volume (cm3) 0.360
Total Matrix Volume (cm3) 15.597
Matrix Porosity (%) 25.52%
Fracture Porosity (%) 0.59%
Testing Conditions
BEREA 47 - Properties

51
monophasic water and effective oil closure curves follow a power law function with an
exponent of -0.36 for the monopashic case and -0.039 for the non-wetting phase (oil).
This reflects a marked difference of stress sensitivity depending on the number of phases
present. For the experiments, the presence of two phases diminishes the level of stress
sensitivity of the rock ~10 times as compared to a monophasic scheme where 100% Sw
exists. This result suggests that the wettability and capillary pressure of the fracture are
crucial in fractured flow dynamics and should be included in testing protocols aimed at
matrix-fracture system characterization.
Figure III-2a: Absolute Closure Curve ACC (blue line) and Oil Closure curve at Swirr (red
line) of Berea 47 core.

52 AN EXPERIMENTAL STUDY OF WATER OIL RELATIVE PERMEABILITY OF FRACTURED
ROCK AT VARIABLE CONDITIONS OF HYDROSTATIC EFFECTIVE STRESS AND
CAPILLARY NUMBER
Figure III-2b: Normalized Absolute Closure Curve ACC (blue line) and Normalized Oil
Closure curve at Swr (red line) of Berea 47 core.
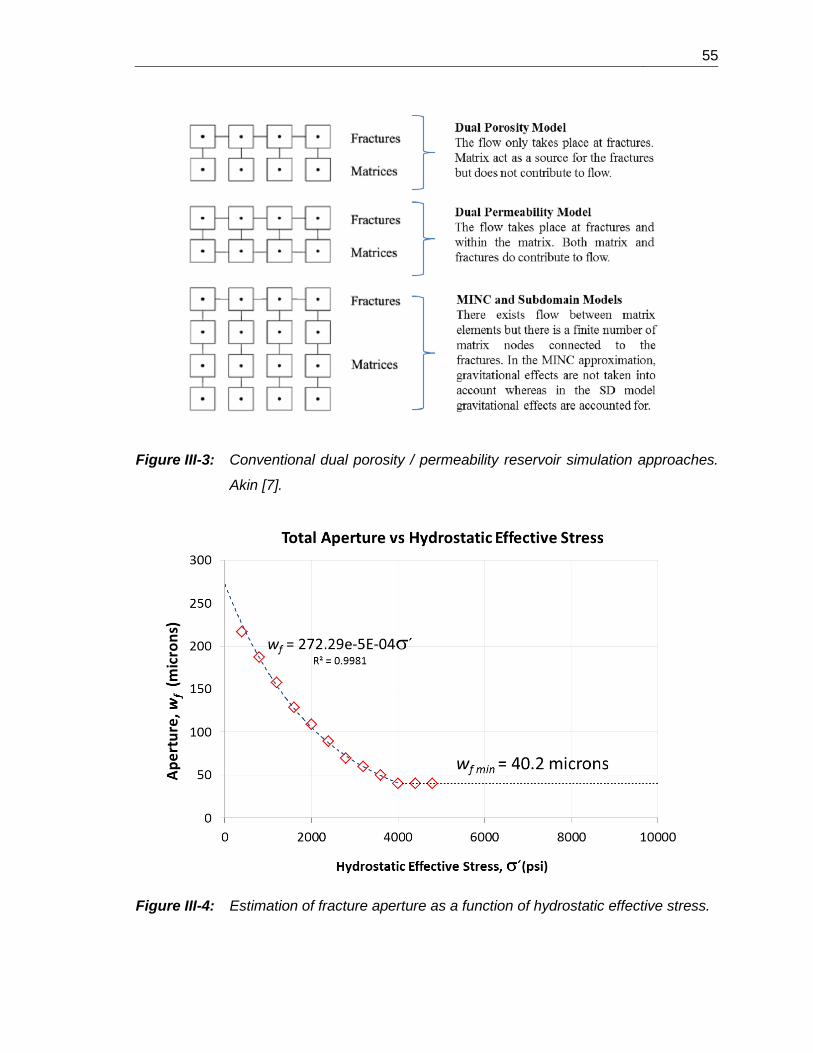
3.1.2 Indirect measurement of fracture width and fracture permeability
Fracture attributes such as width and permeability are common input variables for dual
porosity and/or dual permeability reservoir simulation approaches. As shown in figure III-
3, the net behavior of a fractured rock can be modeled in terms of the relative mass
transfer between matrix and fracture and vice versa; in a practical sense, almost any dual
porosity or dual porosity-dual permeability model requires certain known distribution of
fracture aperture which implies complex static modeling exercises aimed at discrete
representation of fracture network. On the other side, geomechanics coupled simulation is
normally fed by relationships between matrix and fracture permeability as a function of
effective stress (compaction curves) or relationships between permeability and strain, this
last being the most common output from coupled geomechanical simulation. Some
approaches can include the calculation of normal stresses to the fracture face given some
predetermined configuration of the fractures (dip, azimuth, internal friction angle), state of
stresses (magnitude and direction of principal stresses, geomechanical properties) and
operative conditions (reservoir pressures and rates); this, to finally relate fracture

53
permeability measured at the lab to this calculated normal stress component. In order to
have an estimation of fracture width and permeability, useful for certain simulation
approaches, the extruded volume technique was used. In this method, water is injected to
the core at ´closed´ fracture regime to saturate the matrix and then at ´open´ fracture
condition to saturate the fracture. At this point, progressive stress increments will expel
the water contained inside the fracture (assuming no matrix deformation will occur) and
the incremental volume registered (table III-2, column 2). The cumulative extruded volume
is calculated (table III-2, column 3) and is useful to estimate the total aperture reduction
that takes place from the minimum to the maximum hydrostatic stress evaluated. At each
stress level, the differential aperture (table III-2, column 4) is calculated assuming a
simple fracture geometry as the one illustrated in figure I-2, where the measured
differential extruded volume, equivalent to the differential fracture volume, is:
Vf = D*L*Wf (Eq. 10)
where,
Vf: fracture volume (cm3). Taken as the extruded liquid volume registered during
closure curve construction.
Wf: fracture width (cm). Derived from Eq. 10.
D: core diameter (cm). Measured, table III-1.
L: core length (cm). Measured, table III-1.
The base aperture, i.e, the aperture at the maximum stress (4800 psi), is calculated using
Golf-Ratch´s empirical equation [34] and solving for Wf :
(Eq. 11)
Where height H is equal to core diameter D, Nf is the number of fractures and equal to
one in this particular case. C1 is an empirical constant equal to 3.3 E6 for Wf in mm and H
in ft. For Kf, equivalent to the value of permeability that the fracture provides to the total
permeability, it is assumed that:
Kf = Ktot – Km (Eq. 12)

54 AN EXPERIMENTAL STUDY OF WATER OIL RELATIVE PERMEABILITY OF FRACTURED
ROCK AT VARIABLE CONDITIONS OF HYDROSTATIC EFFECTIVE STRESS AND
CAPILLARY NUMBER
where,
Ktot: Absolute permeability, Kabs (md). Measured in the fractured core at different
effective stresses (table III-2, column 7).
Km: permeability provided by the matrix (md). Measured in the un-fractured core =
42.45 md.
Kf: conventional (not intrinsic) fracture permeability defined according to Van Golf-
Ratch22 [34]. This value is equivalent to the permeability provided by the fracture to
the bulk Kabs (md). This variable is Calculated from Eq. 12 (table III-2, column 8).
Table III-2 and figure III-4 summarizes fracture attributes as they would be introduced in
dual porosity / dual permeability or geomechanics coupled simulators.
Table III-2: Estimation of fracture attributes such as fracture width and fracture
permeability as a function of hydrostatic effective stress. Core plug: Berea
No. 47.
22 Fundamentals of Fractured Reservoir Engineering, Equation 4.17, Pag 177. ELSEVIER, 1982.
Confining
Pressure (psi)
Differenttial
extruded volume,
V f (cm3)
Cummulative
extruded
volume (cm3)
Differential
Aperture
(microns)
W f = V f /(D*L )
Estimated Total
Aperture
(microns)
Porosity (%)
Measured
Total Kabs
(md)
Estimated Effective
Fracture
Permeability (md)
K f = Kabs - Km
400 0 0 0.00 216.48 26.17% 333.52 291.07
800 0.06 0.06 29.38 187.10 26.07% 274.23 231.78
1200 0.06 0.12 29.38 157.72 25.97% 212.08 169.63
1600 0.06 0.18 29.38 128.34 25.87%
2000 0.04 0.22 19.59 108.75 25.81%
2400 0.04 0.26 19.59 89.16 25.74% 156.33 113.88
2800 0.04 0.3 19.59 69.58 25.68%
3200 0.02 0.32 9.79 59.78 25.64% 150.78 108.33
3600 0.02 0.34 9.79 49.99 25.61%
4000 0.02 0.36 9.79 40.20 25.58% 145.20 102.75
4400 0 0.36 0.00 40.20 25.58% 145.20 102.75
4800 0 0.36 176.28 40.20 25.58% 143.94 101.49
Total Extruded
Volume (cm3)
Total Aperture
(microns)
Base Aperture
(microns)
Estimation of Fracture Attributes, width and permeability, by the extruded volume technique.
55
Figure III-3: Conventional dual porosity / permeability reservoir simulation approaches.
Akin [7].
Figure III-4: Estimation of fracture aperture as a function of hydrostatic effective stress.

56 AN EXPERIMENTAL STUDY OF WATER OIL RELATIVE PERMEABILITY OF FRACTURED
ROCK AT VARIABLE CONDITIONS OF HYDROSTATIC EFFECTIVE STRESS AND
CAPILLARY NUMBER
Two main observations came out from this stage of the experiments. First, a created
fracture increases the system permeability by a factor of 3.3 when the matrix + fracture
permeability is measured at high effective stress or in general, at a stress level where no
further increment in permeability is noted. This means that original matrix permeability can
get significantly increased by the discontinuity. Second, there exists a stress range in
which fracture width decrease with stress and another in which fracture width tends to be
constant according to figure III-4. For the core analyzed, the maximum closure regime is
attained at ~ 4000 psi after which an apparent constant width of ~ 40 microns is reached.
At this high stress, the measured absolute permeability is 143.94 md which is 101 md
higher than that of the un-fractured core. This last value, approximated to the fracture
permeability would be related to the fracture roughness or the level of mismatching
between parallel faces of the fracture. On the other side, high Kf are noted at low effective
stress and this is the reason for pursuing, e.g., the injection of proppant at high
bottomhole pressures as a way to maintain higher conductivities in fractured rocks.
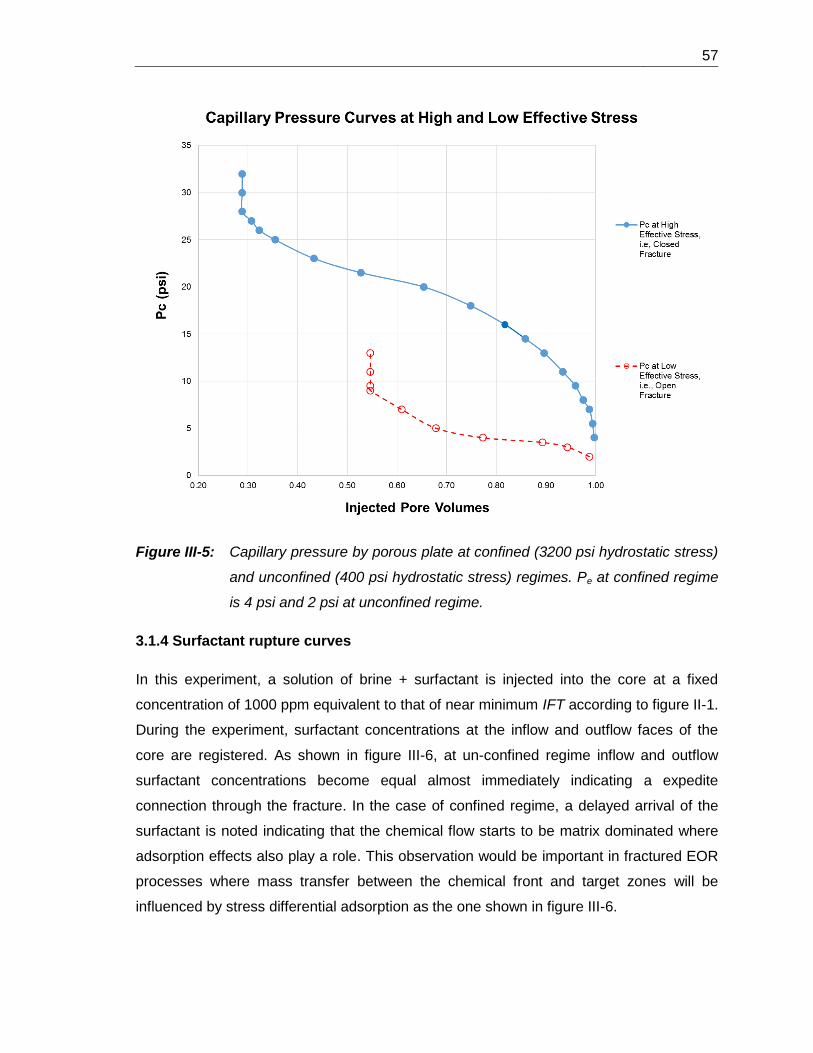
3.1.3 Capillary pressure curves
According to the capillary pressure curves shown in figure III-5, differential entry
pressures Pe and residual water saturations Swr exists between unconfined and confined
regimes. In the confined regime, a more relational behavior to that of the system matrix
would be represented by a more progressive desaturation curve, a higher Pe and lower
Swr while at unconfined regime, desaturation occur in at relatively low Pc window
indicating a strongly fracture dominated behavior. In this last regime, lower Pe would
indicate preferential flow through fracture and consequently a higher Swr that will remain in
the matrix.
57
Figure III-5: Capillary pressure by porous plate at confined (3200 psi hydrostatic stress)
and unconfined (400 psi hydrostatic stress) regimes. Pe at confined regime
is 4 psi and 2 psi at unconfined regime.
3.1.4 Surfactant rupture curves
In this experiment, a solution of brine + surfactant is injected into the core at a fixed
concentration of 1000 ppm equivalent to that of near minimum IFT according to figure II-1.
During the experiment, surfactant concentrations at the inflow and outflow faces of the
core are registered. As shown in figure III-6, at un-confined regime inflow and outflow
surfactant concentrations become equal almost immediately indicating a expedite
connection through the fracture. In the case of confined regime, a delayed arrival of the
surfactant is noted indicating that the chemical flow starts to be matrix dominated where
adsorption effects also play a role. This observation would be important in fractured EOR
processes where mass transfer between the chemical front and target zones will be
influenced by stress differential adsorption as the one shown in figure III-6.

58 AN EXPERIMENTAL STUDY OF WATER OIL RELATIVE PERMEABILITY OF FRACTURED
ROCK AT VARIABLE CONDITIONS OF HYDROSTATIC EFFECTIVE STRESS AND
CAPILLARY NUMBER
Figure III-6: Surfactant rupture curve at unconfined and confined stress regimes.
3.2 JBN-Based Water Oil Relative Permeability at varying
Hydrostatic Effective Stress ´ and Capillary Number Nc
In this chapter, measurements of JBN-based W-O relative permeabilities along with oil
recovery and water fractional flow curves are presented. The tests were done at varying
conditions of hydrostatic effective stress ´ and capillary number Nc in order to evaluate
the effect of these two variables on the features of the Kr curves that can act
simultaneously in certain reservoir regions as noted in figure II-2. The first section
presents the JBN-based W-O Kr of 7 experiments done at un-confined and confined
regime at three different values of capillary number (i.e. 6 experiments used for the

59
development of the correlation to predict kr=f(´,Nc) and 1 experiment run to test
correlation predictability). Second, oil recovery curves at tested conditions are presented
and discussed and finally, some observations over the water-oil fractional flow curves are
included.
3.2.1 JBN W-O Relative Permeabilities in Fractured Rock with Effective Stress and
Capillary Number Variations
The results of the Kr experiments performed according to table II-1 are presented in table
III-4 which summarizes the results of the 7 Kr experiments run at varying conditions of ´
and Nc specified in columns 2 and 3. Measured residual saturations, best fit corey
exponents and effective permeabilities to water and oil are shown in columns 4 to 9. In
table III-4, Experiment ID corresponds to the following basic convention: Expij refers to a
relative permeability measured at the i effective stress and j capillary number condition.
Effective stress i = 1 is equivalent to 3200 psi corresponding to the maximum stress
tested. This condition can also be referred as confined regime. Effective stress i = 3 is
400 psi corresponding to an un-confined condition (refer to closure curve in figure III-2).
Analogically and for capillary numbers, Nc, j = 1 is equivalent to 1.56E-6 corresponding to
1 cc/min flow rate and IFT of 38.5 dynes/cm. j = 2 is equivalent to 2.46E-5 corresponding
to 16 cc/min flow rate and IFT of 38.5 dynes/cm and j = 3 is 4.08E-4 attained by 16 cc/min
flow rate and IFT of 2.3 dynes/cm by surfactant addition at 1000 ppm to the injected
water. Figures III-7 and III-8 summarize recorded variations of Kr end-points (Ko, Kw, Swr
and Sor) and Corey exponents (no and nw) as a function of capillary number Nc and
hydrostatic effective stress ´ respectively. Figure III-9 summarizes JBN-based W-O Kr
for the 6 experiments labeled in yellow in table II-1 corresponding to the set of tests used
as the base for the development of the correlation. In this figure, Nc increases from top to
bottom and ´ decreases from left to right. In each case, Corey exponents that best fit
measured data are determined by finding the value of the the corresponding exponents,

60 AN EXPERIMENTAL STUDY OF WATER OIL RELATIVE PERMEABILITY OF FRACTURED
ROCK AT VARIABLE CONDITIONS OF HYDROSTATIC EFFECTIVE STRESS AND
CAPILLARY NUMBER
i.e. nw and no in Eqs. 13 and 14, that minimize the absolute error23 when compared to
measured data of water and oil Kr respectively. Corey equations are expressed as
follows:
(
)
(Eq. 13)
(
)
(Eq. 14)
Kro,max and Krw,max refer to the end-point relative permeabilities and residual Swr and Sor
to residual water and oil saturations at current experiment conditions. Detailed protocols
and experimental data are summarized in annex A.2 for the 7 experiments: 6 experiments
used for the development of the correlation and 1 experiment run at intermediate
conditions of ´ and Nc (Exp22) in order to test correlation predictability.
In the present subsection of this chapter, the general observations of water-oil Kr end-
points and Corey exponents24 variations over the range of ´ and Nc tested will be
presented.
3.2.1.1 Effect of Nc and´ variations on residual saturations, Swr and Sor
The results reported in the literature (as shown in figure I-11 and table I-2) reveal the
tendency of residual oil and water saturation reduction with an increase in Nc. This effect,
has also been observed here especially at very high capillary numbers (Exp13 and Exp33
in table III-4). It is related to the enhanced water flow capacity, an increase in viscous
forces, which is able to overcome capillary effects dominant in the smaller flow paths.. An
additional observation, referring to figure III-7 (Sor vs Nc and Swr vs Nc charts), is that oil
23 The error is calculated by the least squares method according to the following general formula
√∑
Where corresponds to i to n measurements of Kro or Krw and
are i to n Kro or Krw
predictions at each oil or water Corey exponent. The error is calculated to each of the phases independently. 24
In general, Corey exponents variation can be related to changes in the Kr shape over the stress and capillary number range tested.

61
residual saturations Sor always decrease with the Nc increase but the effect is more sever
at the confined flow regime condition (´ = 3200 psi). In line with this, it is noted that the
slope of the variation becomes almost flat at unconfined flow regime condition (´ = 400
psi). The reason for this observation would be related to the presence of a preferential
flow through the fracture almost swept even at low Nc with no sweep tendency through
the matrix. Regarding residual water saturation, Nc increase causes Swr decrease through
similar trajectories for unconfined and confined regimes. It is hypothesized though, that at
low Nc the flow of oil occur preferentially at the matrix scale, while at high Nc the fracture
aperture determines oil flow capacity as can also be noted in figure III-8 (Ko_Swr Chart)
where the closure curve becomes stress dependant at high values of Nc.. Exp11 seems to
get apart from this tendency probably due to the capillary effects present during the oil-
displacing water process at very low Nc where pressure differential, DP, is less than 6 psi
throughout the Ko measurement (see annex A.2, Table A2.1). This value is not enough to
overcome the required capillary pressure to drain the smaller pores, which require an
estimated DP of ~28 psi equivalent to the Pc required to reach Swr in confined regime and
according to the capillary pressure curve shown in blue in figure III-5.
Water and oil residual saturation variations with effective stress ´ are presented in figure
III-8 (Swr vs ´ and Sor vs ´ charts). Main observation is that Sor follow the literature
reported tendency of an increase in Sor with an incremental increase in ´ implying
higher residual oil saturation retained at smaller pores created at higher ´. In general, ´
increase approximates the system to a matrix dominated regime. It is also worth noting
that the slope of Sor increase with ´ is higher at the lowest Nc (Nc = 1.5 to 1.6E-6)
indicating that capillary entrapment prevail as viscous forces are not strong enough to
overcome the capillary forces, which increasingly becomes more dominant as the
effective stress increases. In this case, Sor experienced a 1.9 fold of increase in the stress
range tested. At high Nc (Nc = 4.02 to 4.13E-4) the system becomes less sensitive to the
stress change which can be noted in the 1.2 fold of increase in the Sor between the lowest
and the highest effective stress. This result confirms that viscous forces are now able to
promote flow through the system almost regardless of the stress regime condition. The
water residual saturation, Swr does not show a clear tendency regarding its variation as a
function of effective stress ´. In general, it is noted that Swr remain almost constant with

62 AN EXPERIMENTAL STUDY OF WATER OIL RELATIVE PERMEABILITY OF FRACTURED
ROCK AT VARIABLE CONDITIONS OF HYDROSTATIC EFFECTIVE STRESS AND
CAPILLARY NUMBER
the ´ increase at medium to high capillary number25 and gets decreased with ´
increase at low Nc. This last result would be related to a higher chance of the oil to reach
the matrix when the system is confined thus being able to reduce Swr.
Table III-4: Summary of W-O end-points and Corey exponents that best fits measured
data. Green values are taken as base conditions. Yellow values
correspond to Exp22 run at intermediate ´ and Nc to verify correlation
prediction.
25 Negligible Swr variation with hydrostatic effective stress was also reported by Santamaria [7].
´ Ko) Swr Kw) Sor
(psi) (md) (md)
Exp_11 3200 1.60E-06 42.97% 7.21% 1.10 0.81 134.7 88.4
Exp_12 3200 2.53E-05 56.13% 5.95% 1.50 0.35 374.5 132.8
Exp_31 400 1.51E-06 65.53% 3.76% 2.75 0.35 141.5 53.0
Exp_32 400 2.40E-05 58.01% 3.13% 1.88 0.35 390.8 134.7
Exp_13 3200 4.13E-04 37.33% 3.76% 1.0 1.3 572.4 147.6
Exp_33 400 4.02E-04 36.08% 3.13% 1.0 0.95 702.8 286.1
Exp_22 1800 2.46E-05 44.00% 7.56% 1.1 0.58 352 141
SUMMARY OF WATER-OIL RELATIVE PERMEABILITY EXPERIMENTS BY JBN METHOD
Experiment
IDS wr S or n o n wNc

63
Figure III-7: End-point Kr attributes and Corey exponents as a function of capillary
number Nc. Bold red label corresponds to Exp22.

64 AN EXPERIMENTAL STUDY OF WATER OIL RELATIVE PERMEABILITY OF FRACTURED
ROCK AT VARIABLE CONDITIONS OF HYDROSTATIC EFFECTIVE STRESS AND
CAPILLARY NUMBER
Figure III-8: End-point Kr attributes and Corey exponents as a function of effective
stress ´. Bold yellow label corresponds to Exp22.
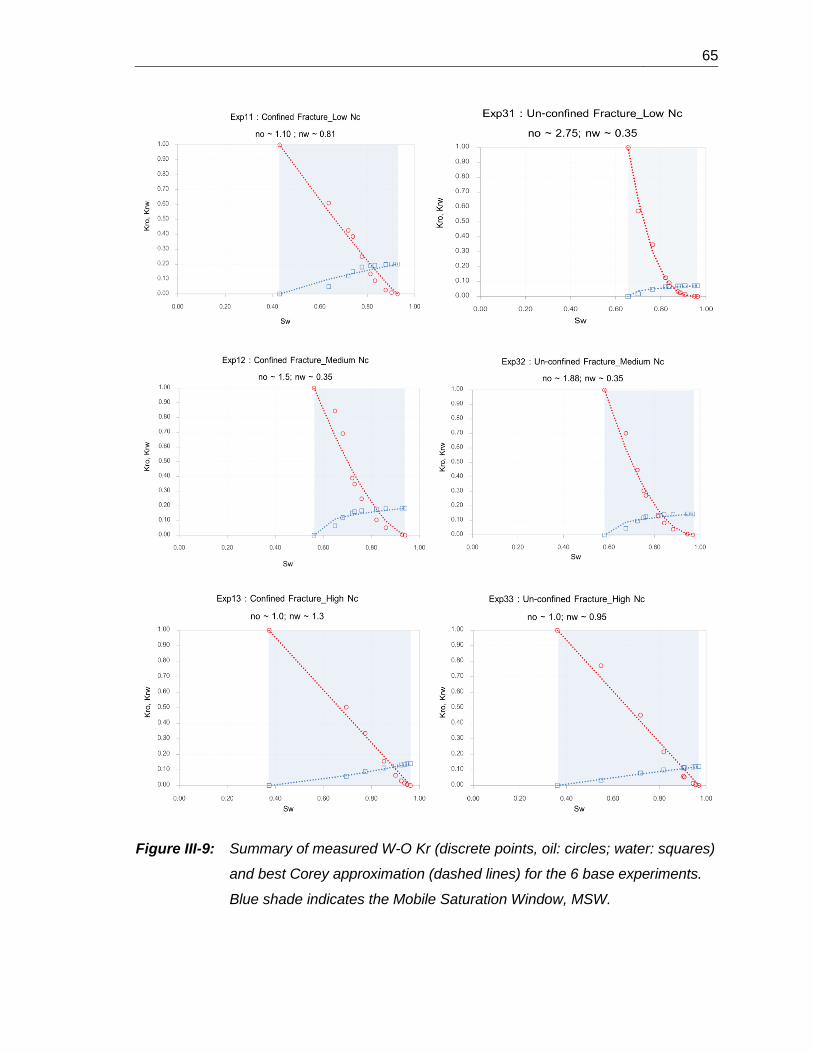
65
Figure III-9: Summary of measured W-O Kr (discrete points, oil: circles; water: squares)
and best Corey approximation (dashed lines) for the 6 base experiments.
Blue shade indicates the Mobile Saturation Window, MSW.

66 AN EXPERIMENTAL STUDY OF WATER OIL RELATIVE PERMEABILITY OF FRACTURED
ROCK AT VARIABLE CONDITIONS OF HYDROSTATIC EFFECTIVE STRESS AND
CAPILLARY NUMBER
3.2.1.2 Effect of Nc and´ variations on effective permeabilities, Kw and Ko
According to figure III-7, a clear increase in both Kw and Ko is noted upon an increase in
Nc as a result of viscous forces overcoming capillary ones. In both cases, the slope of a
semi-logarithmic regression function is higher in the case of unconfined stress regime as
indicated in figure III-10. This means that the increase in effective permeability promoted
by an effective stress decrease (or fracture opening) becomes exacerbated at high Nc
where flow takes place at both matrix and fracture. It is worth noting that at low Nc, Kw is
lower at unconfined regime as compared to confined regime (see figure III-8, Krw_Sor vs
´ chart) probably due to restricted flow through a considerable amount of matrix pores
where capillary effects prevail. This fact would be confirmed by the low differential
pressure recorded during water displacing oil in Exp11 (see figure II-6, right uppermost
chart) which does not overcome the entry pressure of ~ 4.0 psi (measured at confined
regime in the capillary pressure curve, figure III-5) at late times. This is not noted for Ko
where the effect of stress is minimum at low and medium Nc but appears at high capillary
number (see figure III-8, Kro_Swr vs ´ and Krw_Sor vs ´ charts, red labels
corresponding to Nc ~ 4E-4), where´ decrease stimulates effective permeability to both
water and oil. This result confirms that the fracture is predominantly water wet and will not
admit much oil until capillary forces inside the fracture are disrupted by velocity
increments, IFT reductions or both.
Figure III-10: Variation of Kw and Ko as a function of Nc for different effective stresses.
Red label corresponds to Exp22.

67
3.2.1.3 Effect of Nc and ´ variations on water and oil Corey exponents no and nw
As noted in figure III-9, the shape of the W-O Kr curves varies throughout all the
experiments. In this figure, Nc increases from top to bottom and ´ decreases from left to
right. In each case, measured curves were approximated by Corey curves according to
Equations 13 and 14 and the least squares difference calculated until reaching a
minimum. The Corey exponents that best approximate measured curves and the least
squares differences are presented in table III-5. Regarding the shape of the curves, it is
noted that at high capillary numbers, Corey exponents of both water and oil approaches
to 1.0 and the mobile saturation window (shade blue, Exp13 and Exp33) are expanded.
This means that the system approaches miscible conditions at high Nc and this effect
becomes almost independent of the effective stress regime although effective
permeabilities do depend on ´. In other words, high capillary number forces the Kr to the
miscible regime or x-type curves affecting its shape while stress affects the absolute value
of the end-points Kr, Ko and Kw. In the next chapter, it will be proposed that complete
miscibility is attained at the capillary number of total desaturation Nct, characteristic of
each matrix-fracture system, at which the closure curve to Kw and Ko becomes equivalent
to monophasic water and oil closure curves respectively.
In the low Nc flow regime, on the other hand, the stress variations in the range tested (400
to 3200 psi) greatly affects the Kr shape as noted when comparing Exp11 and Exp31. At
this low value of Nc and unconfined regime, the flow is highly dominated by the fracture, a
condition clearly noticeable in a narrow MSW of Exp31 (´ = 400 psi, Nc = 1.5E-6). In this
experiment, the highest value of the oil Corey exponent no was attained indicating a very
restricted path for the oil to flow throughout the system probably dominated by the
fracture.
Experiments run at medium Nc (Exp12 and Exp32) suggest a transitional behavior
between the one related to a low Nc where ´ greatly affects the Kr shapes and the one
related to high Nc where ´ is no longer affecting Kr shapes as miscible conditions
prevail. Finally and referring to table III-5, columns 6 and 7, it has to be pointed out that
Krw behavior is much better approximated by the Corey correlation (Eq. 13) whereas Kro
exhibit a more polynomial type of behavior preventing the Corey correlation (Eq. 14) to

68 AN EXPERIMENTAL STUDY OF WATER OIL RELATIVE PERMEABILITY OF FRACTURED
ROCK AT VARIABLE CONDITIONS OF HYDROSTATIC EFFECTIVE STRESS AND
CAPILLARY NUMBER
have a good fit. The average error for kw is 3.88% while that for Ko is 13.83% when
comparing measured data with Corey approximated Kr in each case.
Table III-5: Corey exponents that best fit measured Kr data (columns 4 and 5) and
least square difference between measured and Corey approximated Kr
(columns 6 and 7).
3.2.1.4 Effect of Nc and ´ variations on Mobile Saturation Window, MSW26
Referring to figure III-9, the main observations is that a wider Mobile Saturation Window
MSW (blue shaded area) is attained at the highest Nc tested. Under these conditions, an
enhanced ability of the phases to flow through the matrix seems to dominate. Corey
exponents of oil and water are similar and close to one indicating also a good flow
capacity of both. The narrowest MSW are noted when unconfined regime and low Nc
prevail. This is an indication of channeled flow or in general low sweep of the matrix. The
lower MSW is obtained in experiment 31 (open fracture, low Nc) which could be related to
the flow of phases mainly through the fracture. Figure III-10 shows the MSW variation with
26 Mobile Saturation Window MSW is defined as the total range of saturation in which phases are
both mobile. This window is equivalent to [1-Sor-Swr].
´Diff Corey vs
Measured Krw
Diff Corey vs
Measured Kro
(psi) (%) (%)
Exp_11 3200 1.60E-06 1.10 0.81 2.28% 4.52%
Exp_12 3200 2.53E-05 1.50 0.35 1.96% 8.15%
Exp_31 400 1.51E-06 2.75 0.35 0.74% 2.70%
Exp_32 400 2.40E-05 1.88 0.35 1.63% 4.22%
Exp_13 3200 4.13E-04 1.0 1.3 0.31% 2.76%
Exp_33 400 4.02E-04 1.0 0.95 0.43% 3.89%
COREY EXPONENTS THAT BEST APPROXIMATE WATER-OIL RELATIVE PERMEABILITY
MEASUREMENTS
Experiment
IDn o n wNc

69
Nc and ´ respectively. In general it is noted that MSW is more affected by Nc than by ´
changes.
Figure III-11: Mobile Saturation Window MSW for the 6 base experiments. Exp22 (´ =
1800 psi and Nc = 2.4E-6) is outlined in each chart.
3.2.2 Oil recovery curves
Oil recovery curves measured during the experiments are summarized in figure III-12. In
general, higher final recoveries are attained at high Nc regardless of the ´ range. Lower
recoveries are noted at low ´ or unconfined regime and low Nc; in this case, the flow of
water through the fracture prevails with a consequent poor oil sweeping through the
matrix. Early recoveries are also enhanced at higher Nc whereas ´ changes do not seem
to greatly affect either early or final recoveries.
3.2.3 Water fractional flow curves
Water fractional flow curves measured during the experiments are summarized in figure
III-13. From this figure it can be noted that high Nc promotes a piston-like displacement
whereas low Nc and/or low stress regimes move the system away from this desired
displacement process. This can be compared in an analogue way to the unfavorable
mobility ratio shown in figure III-14 due to viscosity variation.

70 AN EXPERIMENTAL STUDY OF WATER OIL RELATIVE PERMEABILITY OF FRACTURED
ROCK AT VARIABLE CONDITIONS OF HYDROSTATIC EFFECTIVE STRESS AND
CAPILLARY NUMBER
Figure III-12: Oil recovery curves for all the experiments.
Figure III-13: Water fractional flow curves for all the experiments.
Figure III-14: Schematics of the mobility ratio effect on water fractional flow curves.
71
3.3 An Empirical Correlation to predict Stress and Nc
Dependent Water Oil Kr in Fractured Rocks
In this chapter, a correlation is presented to predict Kr in naturally fractured rocks
capturing the test results and according to the Corey Equations. The basis for the
calculation is presented for the Kw variable and an analogue procedure is applied for the
other 6 Corey parameters contained in Equations 13 and 14. The form of the correlation is
presented in table III-6 where the general regression formulas are described for each of
the 6 Corey parameters. Following the correlation derivation, the overall error is presented
comparing the predicted values of the Corey parameters with those measured
experimentally in the 6 base experiments. Additionally, data from the experiment
performed at intermediate conditions of ´ and Nc (Exp22) was used to test correlation
predictability. Finally, some predictions of Kw and Ko closure curves are done in order to
propose a universal correlation that could be applied to any fractured system whenever a
monophasic closure curve is available.
3.3.1 Derivation of a correlation for W-O Kr prediction in fractured rock at variable
effectives stress ´ and capillary number Nc
As it was shown in figures II-2a and II-2b, local variations of effective stress, capillary
number or both can occur during production and injection operations, particularly in
fractured reservoirs. In 3.2.1 section, the general variations of the Corey parameters (Eq.
13 and 14) and Kr shapes upon ´ and Nc variations were presented (figures III-7 to III-9)
and discussed. Following this and for the development of the correlation, the data were
analyzed and general regression functions were proposed to fit the measured Corey
parameters in the 6 base experiments. An example of the workflow is illustrated in the
following steps for the Kw parameter:
1. Explore Kw variation with ´ and Nc at fixed value of the other variable, figures III-7
and III-8.
2. For Kw, it is hypothesized that its variation with ´ should follow the monophasic
trend in which a power-law function relates Kabs with ´ according to the function
shown in figure II-2b.

72 AN EXPERIMENTAL STUDY OF WATER OIL RELATIVE PERMEABILITY OF FRACTURED
ROCK AT VARIABLE CONDITIONS OF HYDROSTATIC EFFECTIVE STRESS AND
CAPILLARY NUMBER
3. Propose normalized primary regression functions27 of the same form as that
identified in 2. and for the various Nc values tested as shown in figure III-15. NOTE:
normalization in this case is done against a base permeability Kb equivalent to the
absolute permeability to water, measured at low Nc (1.5E-6) and at confined stress
regime. Kb in the present study is 144 md according to the point at which no further
Kabs variation is noted in figure II-2a. This condition is chosen because most of Kr
measurements are done at this low Nc values (q ~ 1 cc/min) and conventionally high
effective stress (> 4500 psi).
Figure III-15: Normalized Kw vs ´ functions at various Nc values. Primary
regression follows the monophasic Kabs form shown in figure II-2b,
i.e., Kw = COEFF*´EXPON
4. The primary regression function for this particular case is therefore of the form
(Eq. 15)
or more generally,
(Eq. 16)
27 Primary regression function refers to that related to the Corey parameter variation with ´ and/or
Nc.
73
where Kw_norm = Kw / Kb is normalized water effective permeability, COEFF(Nc) is a
coefficient that depends on the capillary number Nc and EXPON(Nc) is an exponent
also dependent on Nc. NOTE: parenthesis denotes a function.
5. Plot primary correlation parameters, COEFF(Nc) and EXPON(Nc) as a function of their
dependent variable (Nc in this case) and find a secondary regression function28 as
shown in figure III-16. NOTE: in this figure, the COEFF and the EXPON values have
been normalized based on the monophasic curve values of 20.495 and -0.366,
respectively. These values are attained at the theoretical Nct corresponding to the
total desaturation capillary number, or the Nc value at which COEFF and EXPON
acquire the monophasic values indicated in figure II-2b. For this particular case, Nct =
6.6E-4.
6. The secondary regression functions for Kw prediction are hence of the form
( ) (Eq. 17)
(Eq. 18)
where c1, c2, c3 and c4 are correlation constants for Kw prediction.
7. Merge secondary regression functions into primary regression functions to find a
single one equation as those indicated in table III-6 for each of the Corey parameters.
8. Replace merged regression functions for each of the Corey parameters in Equations
13 and 14 to predict W-O Kr at any ´and Nc provided a base set of Kr parameters
(outlined in green in table III-4) are avilable.
28 Secondary regression function refers to that related to COEFF and EXPON variations with ´
and/or Nc.

74 AN EXPERIMENTAL STUDY OF WATER OIL RELATIVE PERMEABILITY OF FRACTURED
ROCK AT VARIABLE CONDITIONS OF HYDROSTATIC EFFECTIVE STRESS AND
CAPILLARY NUMBER
Figure III-16: Normalized secondary regression functions COEFF(Nc) and EXPON(Nc) for
Kw prediction.
Additional examples of secondary regression approximations for Sor and Ko parameters
are shown in figures III-17 and III-18. The general form of the primary and secondary
regression functions for all 6 Corey parameters are shown in table III-6. These functions
were used to predict Exp22 and the results are presented in the next session.
Figure III-17: Sor secondary regression approximations for COEFF and EXPON.

75
Figure III-18: Ko secondary regression approximation for COEFF and EXPON.

76 AN EXPERIMENTAL STUDY OF WATER OIL RELATIVE PERMEABILITY OF FRACTURED
ROCK AT VARIABLE CONDITIONS OF HYDROSTATIC EFFECTIVE STRESS AND
CAPILLARY NUMBER
Table III-6: Correlation parameters for W-O Kr prediction at variable Nc and ´.
Restrepo, 2016.
Kw,max = coeff( ´) e expon( ´)Nc 0.1736 Ko,max = 1 1.00
coeff = c1 ´ + c2 1.76E-01
c1 0.00002 Ko_norm = coeff(Nc) ´ expon(Nc) 2.47
c2 0.14040 coeff(Nc) = c1Nc c2 3.09
expon = c3 ´+ c4 -6.41E+02 c1 134.94
c3 -0.1117 c2 0.36
c4 -439.73 expon = c3Nc 2 + c4Nc + c5 -0.03
c3 215161.00
Kw_norm = coeff(Nc)* ´ expon(Nc) 0.84 c4 -272.45
coeff(Nc) = c5Nc c6 1.01 c5 -0.02
c5 16854.00
c6 0.92 Sor=coeff(Nc) ´ expon(Nc) 0.78
expon(Nc) = c5LN(Nc)+c6 -0.02 coeff(Nc) = c6e Nc c7 0.08
c7 -0.10 c6 0.07
c8 -1.11 c7 3131.00
expon = c8Nc 2 + c9Nc + c10 0.31
Swirr = coeff(Nc) ´ expon(Nc) 1.07 c8 -972728.00
coeff(Nc) = c9Nc c10 1.78 c9 -156.44
c9 0.05 c10 0.31
c10 -0.34
expon(Nc) = c11LN(Nc) + c12 -0.07 no = coeff(Nc) ´ expon(Nc) 1.59
c11 0.04 coeff(Nc) = c11Nc c12 3.92
c12 0.35 c11 0.00
c12 -0.87
nw = coeff( ´) e expon( ´)Nc 0.45 expon = c13LN(Nc) + c14 -0.12
coeff( ´) = c12 ´+ c13 0.4248 c13 0.11
c12 -0.00007 c14 1.0918
c13 0.55
expon( ´) = c14 ´+ c15 2346
c14 0.15
c15 2073.30
CORRELATION PARAMETERS (Restrepo, 2016)
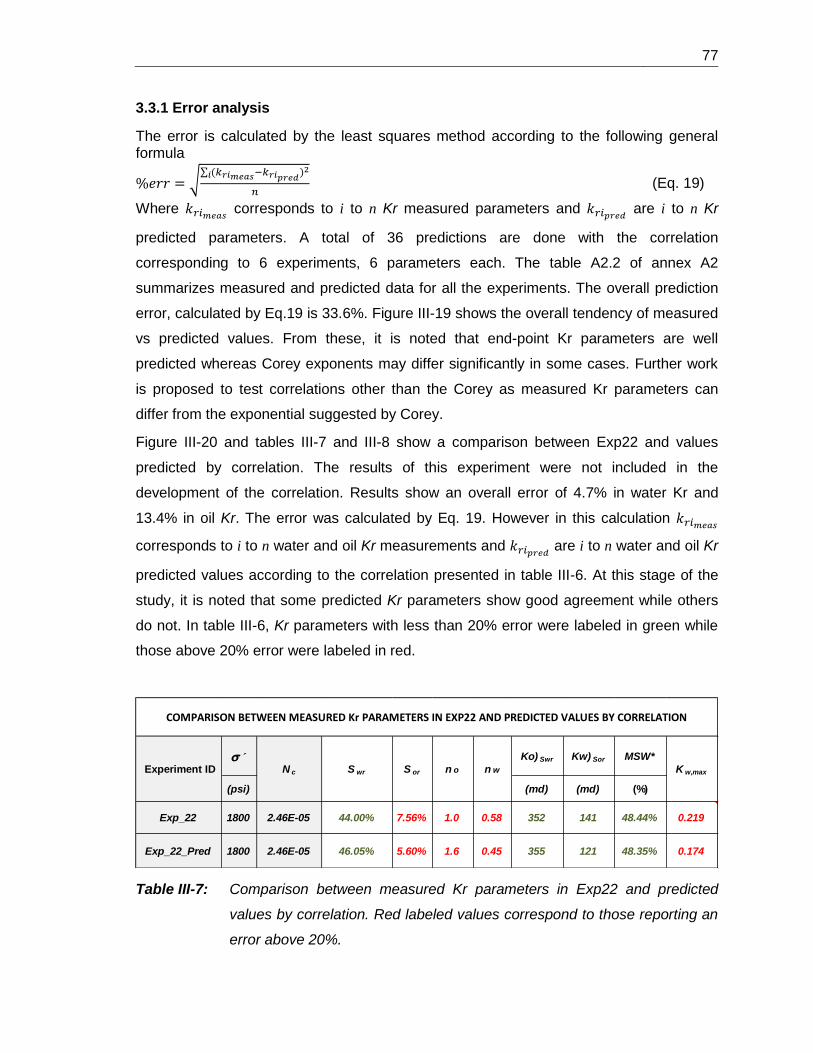
77
3.3.1 Error analysis
The error is calculated by the least squares method according to the following general formula
√∑
(Eq. 19)
Where corresponds to i to n Kr measured parameters and
are i to n Kr
predicted parameters. A total of 36 predictions are done with the correlation
corresponding to 6 experiments, 6 parameters each. The table A2.2 of annex A2
summarizes measured and predicted data for all the experiments. The overall prediction
error, calculated by Eq.19 is 33.6%. Figure III-19 shows the overall tendency of measured
vs predicted values. From these, it is noted that end-point Kr parameters are well
predicted whereas Corey exponents may differ significantly in some cases. Further work
is proposed to test correlations other than the Corey as measured Kr parameters can
differ from the exponential suggested by Corey.
Figure III-20 and tables III-7 and III-8 show a comparison between Exp22 and values
predicted by correlation. The results of this experiment were not included in the
development of the correlation. Results show an overall error of 4.7% in water Kr and
13.4% in oil Kr. The error was calculated by Eq. 19. However in this calculation
corresponds to i to n water and oil Kr measurements and are i to n water and oil Kr
predicted values according to the correlation presented in table III-6. At this stage of the
study, it is noted that some predicted Kr parameters show good agreement while others
do not. In table III-6, Kr parameters with less than 20% error were labeled in green while
those above 20% error were labeled in red.
Table III-7: Comparison between measured Kr parameters in Exp22 and predicted
values by correlation. Red labeled values correspond to those reporting an
error above 20%.
´ Ko) Swr Kw) Sor MSW*
(psi) (md) (md) (%)
Exp_22 1800 2.46E-05 44.00% 7.56% 1.0 0.58 352 141 48.44% 0.219
Exp_22_Pred 1800 2.46E-05 46.05% 5.60% 1.6 0.45 355 121 48.35% 0.174
K w,max Experiment ID S wr S or n o n wN c
COMPARISON BETWEEN MEASURED Kr PARAMETERS IN EXP22 AND PREDICTED VALUES BY CORRELATION

78 AN EXPERIMENTAL STUDY OF WATER OIL RELATIVE PERMEABILITY OF FRACTURED
ROCK AT VARIABLE CONDITIONS OF HYDROSTATIC EFFECTIVE STRESS AND
CAPILLARY NUMBER
Table III-8: Comparison between measured Kr values in Exp22 and predicted values
by correlation.
Figure III-19: Overall prediction error chart for the 6 Corey Kr parameters evaluated.
Predicted n o : 1.59
Predicted n w: 0.45
Total error_water Kr: 4.65%
Total error_oil Kr: 13.45%
swl Krw_Exp22 Kro_Exp22 Krw_Pred Kro_Pred
0.439 0.000 1.000 0.000 1.000
0.591 0.053 0.820 0.096 0.607
0.654 0.132 0.760 0.115 0.444
0.694 0.166 0.520 0.125 0.350
0.734 0.187 0.330 0.134 0.265
0.761 0.198 0.239 0.140 0.213
0.817 0.209 0.098 0.151 0.118
0.855 0.215 0.040 0.158 0.067
0.887 0.218 0.015 0.164 0.033
0.924 0.219 0.000 0.170 0.006
Exp22 Predicted by CorrelationExp22 Measurement
SUMMARY OF MEASURED KR AND PREDICTED KR FOR EXP22
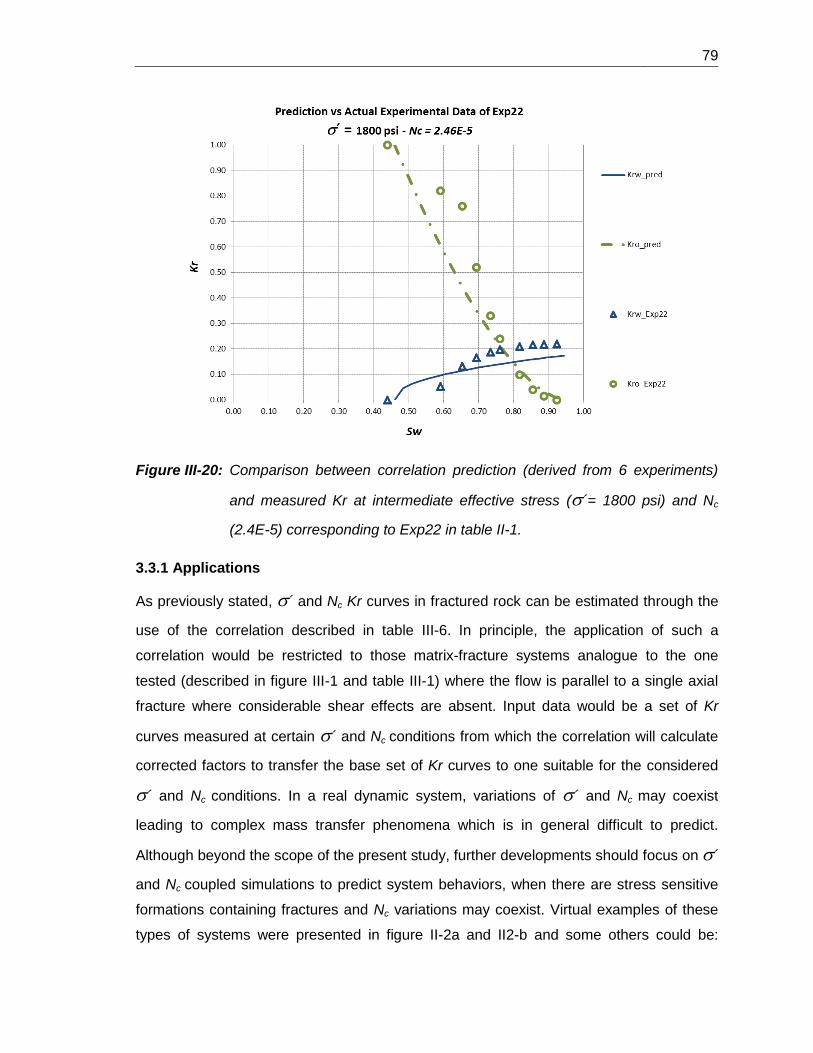
79
Figure III-20: Comparison between correlation prediction (derived from 6 experiments)
and measured Kr at intermediate effective stress (´= 1800 psi) and Nc
(2.4E-5) corresponding to Exp22 in table II-1.
3.3.1 Applications
As previously stated, ´ and Nc Kr curves in fractured rock can be estimated through the
use of the correlation described in table III-6. In principle, the application of such a
correlation would be restricted to those matrix-fracture systems analogue to the one
tested (described in figure III-1 and table III-1) where the flow is parallel to a single axial
fracture where considerable shear effects are absent. Input data would be a set of Kr
curves measured at certain ´ and Nc conditions from which the correlation will calculate
corrected factors to transfer the base set of Kr curves to one suitable for the considered
´ and Nc conditions. In a real dynamic system, variations of ´ and Nc may coexist
leading to complex mass transfer phenomena which is in general difficult to predict.
Although beyond the scope of the present study, further developments should focus on ´
and Nc coupled simulations to predict system behaviors, when there are stress sensitive
formations containing fractures and Nc variations may coexist. Virtual examples of these
types of systems were presented in figure II-2a and II2-b and some others could be:
80 AN EXPERIMENTAL STUDY OF WATER OIL RELATIVE PERMEABILITY OF FRACTURED
ROCK AT VARIABLE CONDITIONS OF HYDROSTATIC EFFECTIVE STRESS AND
CAPILLARY NUMBER
Enhanced Water-flooding processes (where Nc variations can be induced by chemical
injection such as polymers or surfactants, both with the capacity to increase the Nc either
by water viscosity increase or IFT decrease), water intrusion prediction in naturally
fractured formations specially in aquifer proximal zones where apparent preferential water
flow through fractures has been reported and IOR predictions related to stimulation jobs in
naturally fractured systems where Kr are normally assumed invariant to both ´ and Nc.
As a very preliminary approach towards a more generalized correlation and in order to
overcome some intrinsic limitations29, the correlation could include other practical ranges
of tested variables. Even tough, it is herein hypothesized that Kr parameters and its
variation with ´ and Nc are intrinsically related to the monophasic closure curve or
Absolute Closure Curve ACC. However this closure curve shape also can change
depending on the stress regime as was reported by Du [28] and shown in figure I-9. As
stated in section 3.3.1, in the present correlation derivation there exist a theoretical value
of Nc denoted by Nct (capillary number of total desaturation) which corresponds to total
desaturation conditions whereby the power-law correlation resembles the monophasic
curve. This means that at this capillary number the coefficient and exponent of the power-
law function become equal to those of the monophasic curve. To illustrate this, figure III-
21 shows three monophasic closure curves (including the one of Berea 47 herein tested)
with the corresponding power-law coefficients (COEFF) and exponents (EXPON).
Assuming an invariant relationship between COEFF and EXPON and ´and Nc as the
one shown in Equations 15-18, Nct for each core can be estimated and used as a
normalization parameter of Nc. Figure III-22 shows a proposed general correlation to
derive Nct as a function of power-law monophasic COEFF. Note that the more
pronounced the monophasic closure curve is, the higher the Nct as would be expected in
tighter rocks as the one corresponding to the Pauto Sur CP10´s quartz-arenite micro-
fractured sample. As previously stated, Nct and monophasic COEFF and EXPON will act
as normalization parameters for a more generalized correlation (see figure III-16).
29 Limitations that would be related to the specificity of the rock, fluids, stress regime and type of
fracture tested.

81
Figure III-21: Normalized Absolute Closure Curves for different core samples.
Figure III-22: Nct correlation prediction as a function of power-law monophasic COEFF.
Finally, figures III-23 and III-24 show an additional application of the correlation, this time
to predict Kw and Ko closure curves. Note that in the case of Kw, closure curve
approximates the measured monophasic as Nc increases reaching it at the theoretical Nct.

82 AN EXPERIMENTAL STUDY OF WATER OIL RELATIVE PERMEABILITY OF FRACTURED
ROCK AT VARIABLE CONDITIONS OF HYDROSTATIC EFFECTIVE STRESS AND
CAPILLARY NUMBER
For the oil, although no experimental data is available for oil monophasic conditions,
orange dots would be an approximation of this condition.
Figure III-23: Predicted Kw closure curves at varying normalized capillary numbers.
NOTE: normalization value is the Nct
Figure III-24: Predicted Ko closure curves at varying normalized capillary numbers for
Berea 47. NOTE: normalization value is the Nct estimated at 6.6E-4.

83
Conclusions and Recommendations
4.1 Conclusions
In this study series of core-flood tests were performed and W-O relative permeabilities
calculated by the JBN method were analyzed for a fractured core. The results of 6 base
experiments were used to develop a correlation to predict kr dependency to capillary
number (Nc) and stress (´), with an additional experiment performed to test
itspredictability. In general, Kr parameters as contained in the Corey correlation follow the
literature trends when independent variations of ´ or Nc are induced. In this sense, it is
noted that residual saturations, Swr and Sor, increase with an increase in´ and
decrease with an increase in Nc while end-point relative permeabilities, Ko and Kw,
decrease with the ´ increase and increase with the Nc increase30. In general, it is noted
that that the relative importance of a given variable, say ´ or Nc over Corey equation
parameters depend on the absolute value of the other. In general, ´ effects on residual
saturations dominate at low Nc and can become almost negligible at very high Nc.
Regarding Kr shapes, traceable through water and oil Corey exponents, approach near
miscible conditions, nw and no values approach 1.0, and become independent of the ´ at
high Nc. The concept of Mobile Saturation Window MSW is introduced referring to the
30 No literature reference exists regarding Corey exponents variations with neither´or Nc.

84 AN EXPERIMENTAL STUDY OF WATER OIL RELATIVE PERMEABILITY OF FRACTURED
ROCK AT VARIABLE CONDITIONS OF HYDROSTATIC EFFECTIVE STRESS AND
CAPILLARY NUMBER
total flow capacity of the system or the saturation range in which both, water and oil are
mobile. It is noted that this MSW is highly dependent on stress regime at low Nc and is
maximized at high Nc.
Based on the results, a correlation for W-O Kr prediction at variable effective stress and
capillary number is presented with an overall error calculation of ~ 33% for all the
predicted Corey Kr parameters of the six base experiments. The corresponding errors for
experiment 6 performed to test the correlation predictions and not used for its
development was 5% for water Kr measurements and ~ 13% for oil Kr measurements. It
is noted that end-point Kr parameters are better predicted than shape Kr parameters
(Corey exponents) indicating a different approach can be suggested to approximate Kr
curves.
A preliminary approach for a more generalized correlation was proposed, which is based
on the concept of the total desaturation capillary number denoted by Nct. At this value, the
regression function of a given closure curve will resemble that of a monophasic system
which allows to translate monophasic to biphasic Kw, Ko closure curves.
4.2 Recommendations
In stress and capillary number dependent environments, the use of ´and Nc dependent
Kr curves is recommended to better predict complex mass transfer effects taking place
between matrix and fractures. This approach would probably enhanced prediction
capabilities in cases such as water influx diagnosis, chemically enhanced water flood and
nodal analysis.
An extension of the experimental design herein developed is proposed in table iv-1 to
capture additional effects that can be present in environments such as microfractured
rock or anisotropy stress regimes. Broader correlations should become available to
represent complex mass transfer flow behavior of naturally fractured systems as more
experimental data become available.
Finally, it is recommended to incorporate the present study findings to ´: Nc coupled
simulation exercises in order to test the predictability of the method and reach new
horizons in flow prediction of stress sensitive fractured reservoirs.

85
Table iv-1: Schematics of experimental matrix toward more generalized correlations
for stress and capillary number dependent Kr prediction.
Generalized Experimental Matrix to
Derive Stress and Nc dependent Kr
Hydrostatic Stress ´ Nc Nc1 Nc2 Nc3 Nc Nc1 Nc2 Nc3
´ 1 Exp1 Exp2 Exp3 1 Exp1 Exp2 Exp3
h ´ 2 Exp4 Exp5 Exp6 2 Exp4 Exp5 Exp6
´ 3 Exp7 Exp8 Exp9 3 Exp7 Exp8 Exp9
Anisotropic Stress N Nc Nc1 Nc2 Nc3 Nc Nc1 Nc2 Nc3
rN, aN 1 Exp1 Exp2 Exp3 1 Exp1 Exp2 Exp3
2 Exp4 Exp5 Exp6 2 Exp4 Exp5 Exp6
3 Exp7 Exp8 Exp9 3 Exp7 Exp8 Exp9
Type 1 Fracture Type N Fracture

86 AN EXPERIMENTAL STUDY OF WATER OIL RELATIVE PERMEABILITY OF FRACTURED
ROCK AT VARIABLE CONDITIONS OF HYDROSTATIC EFFECTIVE STRESS AND
CAPILLARY NUMBER
References
[1]. R.L. Detwiler. Multiphase Flow in Deformable Variable-Aperture Fractures. JIP Final
Report, Feb1,2009 – Jan 31, 2014. Prepared for US Department of Energy, Office of
Basic Energy Sciences.
[2]. R.L. Detwiler, H. Rajaran and R.J. Glass. Interphase mass transfer in variable
aperture fractures: Controlling parameters and proposed constitutive relationships. Water
Resources Reseach, Vol 45, W08436, 2009.
[3]. S. Ojagbohunmi, R. Chalatumyk and J. Leung. Coupling of Stress Dependent Relative
Permeability and Reservoir Simulation. SPE 154083, 2012.
[4]. M. Jamiolahmady, A Danesh, G. Henderson and G.D. Tehrani. Variations of Gas-
Condensate Relative Permeability with Production Rate at Near Wellbore Conditions: A
General Correlation. SPE 83960, September 2003.
[5]. R.N. Moghaddam and M. Jamiolahmady. Fluid transport in shale gas reservoirs:
Simultaneous effects of stress and slippage on matrix permeability. International Journal
of Coal Geology 163 (2016) 87-89.
[6]. E.A. Chukwudeme, F. ingebret and L. Arild. Effect of Interfacial Tension on Water/Oil
Permeability and Remaining Saturation with Consideration of Capillary Pressure. SPE
143028, 2011.
[7]. O. Santamaria. Variación de Curvas de Permeabilidad Relativa Asociada a Cambios
del Esfuerzo Efectivo. Trabajo de investigación de la asignatura de geomecánica de
yacimientos. Universidad Nacional, Junio 2014.
[8]. A.T. Corey and C.H. Rathjens. Effect of stratification on relative permeability. SPE
744-G. Nov 1956.
[9]. M.M Honarpour et al. Influence of small-scale laminations on core plug oil/water
relative permeability and capillary pressure. SPE 27968, August 1994.
[10] D.D. Huang. Capillary End Effects in Coreflood Calculations. Elsevier, Journal of
Petroleum Science and Engineering 19 (1998) 103-117.
[11]. P.Persoff and K. Pruess. Flow visualization and relative permeability measurements
in rough-walled fractures. Presented at 4th international high-level radioactive waste
management conference, Las Vegas, April 26-30, 1993.

87
[12] S. Akin. Estimation of Fracture Relative Permeabilities from Unsteady State
Corefloods. Elsevier, Journal of Petroleum Science and Engineering 30 (2001) 1-14.
[13]. Y. Tian. Experimental Study on Stress Sensitivity of Naturally Fractured Reservoirs.
SPE 173463, 2014.
[14]. D.A. Walters and R.C.K Wong. The effect of variable aperture system on the two-
phase flow response in an oil sand fracture. JCPT, Volume 38, No.13, 1999.
[15] S.P. Bertels and D.A. DiCarlo. Measurement of aperture distribution, capillary
pressure, relative permeability, and in situ saturation in a rock fracture using computed
tomography scanning.Water Resources Research, Vol 37, No3, Pags 649-662, March
2001.
[16] D. Huo, B. Li, M. Benson. Investigating Aperture Based Stress Dependant. SPE
170819, 2014.
[17]. M. Sheffield. Three-phase fuid flow including gravitational, viscous and capillary
forces. SPE 2012. 1969.
[18]. L.Y. Chin et al. Fully coupled geomechanics and fluid-flow analysis of wells with
stress-dependent permeability. SPE 58968, 2012.
[19]. M. Bagheri and A.Settari. Modeling geomechanics in naturally fractured reservoirs.
SPE 93083, 2005.
[20] Y. Benavides, G.A. Maya and J.G Osorio. Compositional Simulation of Fluid Flow
Coupled Stress Sensitive Reservoirs . SPE 94929, 2005.
[21]. R. Guzman and K. Aziz. Fine grid simulation of two-phase flow on fractured porous
media. SPE 24916, 1992.
[22]. J.P. Morris, L.J Pyrak-Nolte. Fracture Network Geometry and Relative Permeability.
Rock Mechanics for Industry, Amadei, Kranz, Scott & Smeallie. (eds), 1999, Balkema,
Rotterdam. ISBN 905809523.
[23]. A. Gunde, T. Babadagli, S.K. Mitra. Lattice Boltzman Method to Estimate Relative
Permeabilities for Matrix-Fracture Interaction in Naturally Fractured Reservoirs. SPE
138255.
[24]. C. Maier and S. Geier. Combining unstructrured grids, discrete fracture
representation and dual-porosity for improved simulation of naturally fractured reservoirs.
SPE 166049, 2013.
[25]. Y. Wang and S. Aryana. Numerical investigation of stress-dependent fracture
apertures and their spatial variations on production from unconventional gas reservoirs
with complex fracture geometries. SPE 180244, 2016.

88 AN EXPERIMENTAL STUDY OF WATER OIL RELATIVE PERMEABILITY OF FRACTURED
ROCK AT VARIABLE CONDITIONS OF HYDROSTATIC EFFECTIVE STRESS AND
CAPILLARY NUMBER
[26]. H.S.Ali et al. The Effect of Overburden Pressure on Relative Permeability. SPE
15730, 1987.
[27]. FU, X. et al. Experimental study of the stress dependence of the absolute and
relative permeabilities of some tight gas sandstones. International Journal of Rock
Mechanics & Mining Sciences. 77 (2015) 36-43. 2015.
[28]. J. Du, R.C. Wong. Stress Induced Anisotropy in Fractured Reservoir. SPE 79019,
2002.
[29]. S.S. Al Harthy et al. Hysteresis, true-triaxial stress-path and pore pressure effects on
permeability. SPE 47269, 1998.
[30]. V. Bang, V. Kumar, P.S. Ayyalasomayajula, G.A. Pope, M.M. Sharma. Relative
Permeability of Gas-Condensate Fluids: A General Correlation. SPE 102741, 2006.
[31]. S.M.P Blom, J. Hagoort. How to include the capilary number in gas condensate
Relative Permeability Functions. SPE 49268, 1998.
[32]. R. Mott. Measurements and simulation of inertial and high capillary number flow
phenomena in gas condensate relative permeability. SPE 62932, 2000.
[33]. G.D. Henderson et al. The Relative Significance of Positive Coupling and Inertial
Effects on Gas Condensate Relative Permeabilities at High Velocity. SPE 62933, 2000.
[34]. V. GOLF-RACHT. Fundamentals of Fractured Reservoir Engineering. Amsterdam:
Elsevier Scientific. Amsterdan – Oxford – New York. 1982.
[35]. Buckley, S.E. and Leverett, M.C. Mechanism of fluid displacement in sands. Trans
AIME, 146, 107, 1942.
[36]. Welge, H.J. A simplified method for computing recovery by gas or water drive. Trans.
AIME, 195, 91, 1952.
[37]. Leverett, M.C. Capillary behavior in porous solids. Trans. AIME, 142, 152, 1941.
[38]. Johnson, E.F. et al. Calculation of relative permeability from displacement
experiments.
[39] Jamiolahmady M., Sohrabi M. and Ireland S., Gas-condensate relative permeabilities
in propped fracture porous media: coupling vs. inertia, SPE Journal March 2010, 15 (1),
pp. 208-222.
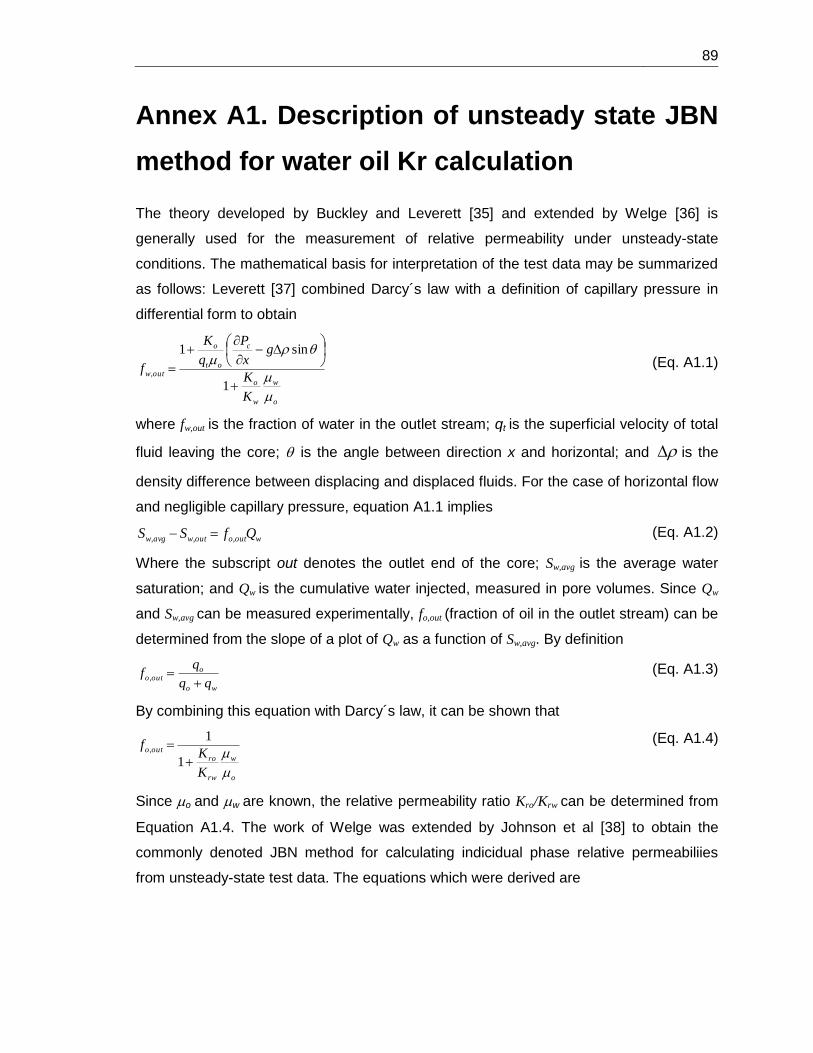
89
Annex A1. Description of unsteady state JBN
method for water oil Kr calculation
The theory developed by Buckley and Leverett [35] and extended by Welge [36] is
generally used for the measurement of relative permeability under unsteady-state
conditions. The mathematical basis for interpretation of the test data may be summarized
as follows: Leverett [37] combined Darcy´s law with a definition of capillary pressure in
differential form to obtain
o
w
w
o
c
ot
o
outw
K
K
gx
P
q
K
f
1
sin1
,
(Eq. A1.1)
where fw,out is the fraction of water in the outlet stream; qt is the superficial velocity of total
fluid leaving the core; is the angle between direction x and horizontal; and is the
density difference between displacing and displaced fluids. For the case of horizontal flow
and negligible capillary pressure, equation A1.1 implies
woutooutwavgw QfSS ,,, (Eq. A1.2)
Where the subscript out denotes the outlet end of the core; Sw,avg is the average water
saturation; and Qw is the cumulative water injected, measured in pore volumes. Since Qw
and Sw,avg can be measured experimentally, fo,out (fraction of oil in the outlet stream) can be
determined from the slope of a plot of Qw as a function of Sw,avg. By definition
wo
oouto
qf
,
(Eq. A1.3)
By combining this equation with Darcy´s law, it can be shown that
o
w
rw
roouto
K
Kf
1
1,
(Eq. A1.4)
Since o and w are known, the relative permeability ratio Kro/Krw can be determined from
Equation A1.4. The work of Welge was extended by Johnson et al [38] to obtain the
commonly denoted JBN method for calculating indicidual phase relative permeabiliies
from unsteady-state test data. The equations which were derived are

90 AN EXPERIMENTAL STUDY OF WATER OIL RELATIVE PERMEABILITY OF FRACTURED
ROCK AT VARIABLE CONDITIONS OF HYDROSTATIC EFFECTIVE STRESS AND
CAPILLARY NUMBER
w
rw
outo
ro
Qd
IQd
fk
1
1
,
(Eq. A1.5)
and
ro
o
w
outo
outw
rw kf
fk
,
, (Eq. A1.6)
Where Ir, the relative injectivity, is defined as
injectionofstartatpq
pq
yinjectivitinitial
yinjectivitI
wt
wtr
___/
/
_
(Eq. A1.7)
Annex A2. Summary of laboratory testing
protocol and experimental data
Table A2.1 summarizes the 6 base experiments input and calculated data according to
JBN method described in annex A1. The general procedure implies water and oil volumes
recording as well as delta pressure through the core for each testing condition. Initial
saturation of the core is always done at confined stress regime to promote fluids invasion
through fracture and matrix. End point residual saturations and effective permeabilities
are measured at specified conditions of Nc and ´ summarized in table II-1. Table A2.2
summarizes the measured and predicted Kr parameters based on the correlation
presented in table III-6.

91
Table A2.1 Summary of 6 base experiments of W-O Kr measurements in fractured
core.
Delta P (psi) Vw (cc)Cumm Vw
(cc)Vo (cc)
Cumm Vo
(cc)Vtotal (cc)
Cumm Vtotal
(cc)Qi FWL Sw SWL FOL Kro/Krw IR 1/IR*QI 1/Qi d(1/Qi)/d(1/Ir*Qi) swl Krw Kro
6.387 0 0 5.1 5.1 5.1 5.1 0.321 0.000 0.748 0.427 1.000 0.000 3.087 1.008 3.113 0.987 0.427 0.000 1.000
6.053 0.65 0.65 0.35 5.45 1 6.1 0.384 0.650 0.770 0.636 0.350 12.385 3.258 0.799 2.603 1.749 0.636 0.049 0.612
4.488 2.6 3.25 0.4 5.85 3 9.1 0.573 0.867 0.795 0.719 0.133 3.538 4.394 0.397 1.745 3.211 0.719 0.121 0.428
3.756 4.5 7.75 0.5 6.35 5 14.1 0.888 0.900 0.827 0.738 0.100 2.556 5.250 0.214 1.126 3.876 0.738 0.152 0.388
1.745 6.6 14.35 0.4 6.75 7 21.1 1.329 0.943 0.852 0.776 0.057 1.394 11.298 0.067 0.752 4.414 0.776 0.181 0.252
1.451 9.7 24.05 0.3 7.05 10 31.1 1.959 0.970 0.871 0.812 0.030 0.711 13.594 0.038 0.511 4.520 0.812 0.191 0.136
2.237 19.6 43.65 0.4 7.45 20 51.1 3.219 0.980 0.896 0.832 0.020 0.469 8.815 0.035 0.311 4.528 0.832 0.193 0.091
1.745 49.7 93.35 0.3 7.75 50 101.1 6.368 0.994 0.915 0.877 0.006 0.139 11.298 0.014 0.157 4.606 0.877 0.199 0.028
1.451 99.8 193.15 0.2 7.95 100 201.1 12.666 0.998 0.928 0.902 0.002 0.046 13.594 0.006 0.079 4.635 0.902 0.201 0.009
1.325 50 243.15 0 7.95 50 251.1 15.815 1 0.928 0.928 0 0.000 14.887 0.004 0.063 4.641 0.928 0.202 0.000
Delta P (psi) Vw (cc)Cumm Vw
(cc)Vo (cc)
Cumm Vo
(cc)Vtotal (cc)
Cumm Vtotal
(cc)Qi FWL Sw SWL FOL Kro/Krw IR 1/IR*QI 1/Qi d(1/Qi)/d(1/Ir*Qi) swl Krw Kro
54.475 0 0 2.2 2.2 2.2 2.2 0.139 0.000 0.698 0.559 1.000 0.000 2.083 3.464 7.217 -0.136 0.559 0.000 1.000
34.565 0.60 0.6 0.35 2.55 0.95 3.15 0.198 0.632 0.720 0.647 0.368 13.417 3.283 1.535 5.040 2.283 0.647 0.063 0.841
27.160 2.4 3 0.6 3.15 3 6.15 0.387 0.800 0.758 0.680 0.200 5.750 4.178 0.618 2.582 3.433 0.680 0.119 0.687
22.923 4.5 7.5 0.5 3.65 5 11.15 0.702 0.900 0.789 0.719 0.100 2.556 4.950 0.288 1.424 3.847 0.719 0.151 0.385
19.990 6.4 13.9 0.6 4.25 7 18.15 1.143 0.914 0.827 0.729 0.086 2.156 5.677 0.154 0.875 4.015 0.729 0.160 0.344
19.207 9.4 23.3 0.6 4.85 10 28.15 1.773 0.940 0.865 0.758 0.060 1.468 5.908 0.095 0.564 4.088 0.758 0.167 0.245
17.436 19.5 42.8 0.5 5.35 20 48.15 3.033 0.975 0.896 0.820 0.025 0.590 6.508 0.051 0.330 4.145 0.820 0.176 0.104
15.290 49.5 92.3 0.6 5.95 50.1 98.25 6.188 0.988 0.934 0.860 0.011976048 0.279 7.422 0.022 0.162 4.181 0.860 0.180 0.050
15.036 99.9 192.2 0.1 6.05 100 198.25 12.487 0.999 0.940 0.928 0.001 0.023 7.547 0.011 0.080 4.195 0.928 0.182 0.004
14.247 50 242.2 0 6.05 50 248.25 15.636 1 0.940 0.940 0 0.000 7.965 0.008 0.064 4.198 0.940 0.183 0.000
Delta P (psi) Vw (cc)Cumm Vw
(cc)Vo (cc)
Cumm Vo
(cc)Vtotal (cc)
Cumm Vtotal
(cc)Qi FWL Sw SWL FOL Kro/Krw IR 1/IR*QI 1/Qi d(1/Qi)/d(1/Ir*Qi) swl Krw Kro
19.395 0 0 1.8 1.8 1.8 1.8 0.113 0.000 0.767 0.654 1.000 0.000 0.968 9.116 8.820 0.210 0.654 0.000 1.000
14.266 0.4 0.4 0.6 2.4 1 2.8 0.176 0.400 0.805 0.699 0.600 34.500 1.315 4.310 5.670 0.957 0.699 0.017 0.574
8.613 2.2 2.6 0.7 3.1 2.9 5.7 0.359 0.759 0.849 0.762 0.241 7.318 2.179 1.278 2.785 1.428 0.762 0.047 0.345
5.335 4.6 7.2 0.4 3.5 5 10.7 0.674 0.920 0.874 0.820 0.080 2.000 3.518 0.422 1.484 1.561 0.820 0.062 0.125
4.638 6.6 13.8 0.4 3.9 7 17.7 1.115 0.943 0.899 0.836 0.057 1.394 4.046 0.222 0.897 1.592 0.836 0.065 0.091
3.926 9.7 23.5 0.2 4.1 9.9 27.6 1.738 0.980 0.912 0.877 0.020 0.474 4.780 0.120 0.575 1.608 0.877 0.068 0.032
3.281 19.7 43.2 0.3 4.4 20 47.6 2.998 0.985 0.931 0.886 0.015 0.350 5.720 0.058 0.334 1.618 0.886 0.069 0.024
2.668 49.6 92.8 0.4 4.8 50 97.6 6.147 0.992 0.956 0.907 0.008 0.185 7.035 0.023 0.163 1.623 0.907 0.070 0.013
2.292 99.8 192.6 0.1 4.9 99.9 197.5 12.439 0.998998999 0.962 0.950 0.001001001 0.023 8.189 0.010 0.080 1.625 0.950 0.071 0.002
2.216 50 242.6 0 4.9 50 247.5 15.589 1 0.962 0.962 0 0.000 8.469 0.008 0.064 1.625 0.962 0.071 0.000
Delta P (psi) Vw (cc)Cumm Vw
(cc)Vo (cc)
Cumm Vo
(cc)Vtotal (cc)
Cumm Vtotal
(cc)Qi FWL Sw SWL FOL Kro/Krw IR 1/IR*QI 1/Qi d(1/Qi)/d(1/Ir*Qi) swl Krw Kro
65.724 0 0 2.5 2.5 2.5 2.5 0.157 0.000 0.735 0.578 1.000 0.000 1.654 3.838 6.351 -0.116 0.578 0.000 1.000
42.184 0.6 0.6 0.4 2.9 1 3.5 0.220 0.600 0.761 0.672 0.400 15.333 2.578 1.760 4.536 1.746 0.672 0.046 0.698
32.747 2.5 3.1 0.5 3.4 3 6.5 0.409 0.833 0.792 0.724 0.167 4.600 3.321 0.736 2.443 2.663 0.724 0.096 0.444
26.136 4.5 7.6 0.5 3.9 5 11.5 0.724 0.900 0.824 0.751 0.100 2.556 4.161 0.332 1.381 3.025 0.751 0.118 0.302
22.973 6.4 14 0.6 4.5 7 18.5 1.165 0.914 0.861 0.762 0.086 2.156 4.733 0.181 0.858 3.160 0.762 0.126 0.271
20.011 9.6 23.6 0.4 4.9 10 28.5 1.795 0.960 0.887 0.815 0.040 0.958 5.434 0.103 0.557 3.230 0.815 0.135 0.129
17.998 19.5 43.1 0.5 5.4 20 48.5 3.055 0.975 0.918 0.842 0.025 0.590 6.042 0.054 0.327 3.274 0.842 0.139 0.082
16.472 49.4 92.5 0.6 6 50 98.5 6.204 0.988 0.956 0.881 0.012 0.279 6.601 0.024 0.161 3.300 0.881 0.142 0.040
14.289 99.8 192.3 0.2 6.2 100 198.5 12.502 0.998 0.969 0.944 0.002 0.046 7.610 0.011 0.080 3.313 0.944 0.144 0.007
13.582 50 242.3 0 6.2 50 248.5 15.652 1 0.969 0.969 0 0.000 8.006 0.008 0.064 3.315 0.969 0.144 0.000
Delta P (psi) Vw (cc)Cumm Vw
(cc)Vo (cc)
Cumm Vo
(cc)Vtotal (cc)
Cumm Vtotal
(cc)Qi FWL Sw SWL FOL Kro/Krw IR 1/IR*QI 1/Qi d(1/Qi)/d(1/Ir*Qi) swl Krw Kro
37.999 0 0 7 7 7 7 0.441 0.000 0.811 0.370 1.000 0.000 1.954 1.161 2.268 0.531 0.370 0.000 1.000
27.213 2.2 2.2 0.8 7.8 3 10 0.630 0.733 0.861 0.693 0.267 8.364 2.728 0.582 1.588 1.892 0.693 0.060 0.504
25.429 4.3 6.5 0.7 8.5 5 15 0.945 0.860 0.906 0.773 0.140 3.744 2.919 0.363 1.058 2.407 0.773 0.090 0.337
22.834 6.6 13.1 0.4 8.9 7 22 1.386 0.943 0.931 0.852 0.057 1.394 3.251 0.222 0.722 2.738 0.852 0.112 0.156
19.551 8.8 21.9 0.2 9.1 9 31 1.953 0.978 0.943 0.900 0.022 0.523 3.797 0.135 0.512 2.942 0.900 0.125 0.065
17.250 9.9 31.8 0.1 9.2 10 41 2.582 0.990 0.950 0.924 0.010 0.232 4.304 0.090 0.387 3.048 0.924 0.131 0.030
15.019 19.9 51.7 0.1 9.3 20 61 3.842 0.995 0.956 0.937 0.005 0.116 4.943 0.053 0.260 3.135 0.937 0.136 0.016
13.929 49.9 101.6 0.1 9.4 50 111 6.991 0.998 0.962 0.948 0.002 0.046 5.330 0.027 0.143 3.196 0.948 0.139 0.006
12.795 100 201.6 0 9.4 100 211 13.290 1 0.962 0.962 0 0.000 5.802 0.013 0.075 3.229 0.962 0.140 0.000
Delta P (psi) Vw (cc)Cumm Vw
(cc)Vo (cc)
Cumm Vo
(cc)Vtotal (cc)
Cumm Vtotal
(cc)Qi FWL Sw SWL FOL Kro/Krw IR 1/IR*QI 1/Qi d(1/Qi)/d(1/Ir*Qi) swl Krw Kro
40.146 0 0 6 6 6 6 0.378 0.000 0.735 0.358 1.000 0.000 1.506 1.757 2.646 -0.015 0.358 0.000 1.000
26.907 1.5 1.5 1.5 7.5 3 9 0.567 0.500 0.830 0.547 0.500 23.000 2.247 0.785 1.764 1.543 0.547 0.034 0.771
17.951 4 5.5 1 8.5 5 14 0.882 0.800 0.893 0.717 0.200 5.750 3.368 0.337 1.134 2.261 0.717 0.079 0.452
13.722 6.4 11.9 0.6 9.1 7 21 1.323 0.914 0.931 0.817 0.086 2.156 4.406 0.172 0.756 2.526 0.817 0.100 0.217
11.597 8.8 20.7 0.2 9.3 9 30 1.890 0.978 0.943 0.901 0.022 0.523 5.213 0.102 0.529 2.638 0.901 0.112 0.059
9.830 9.8 30.5 0.2 9.5 10 40 2.519 0.980 0.956 0.906 0.020 0.469 6.150 0.065 0.397 2.698 0.906 0.115 0.054
8.484 19.9 50.4 0.1 9.6 20 60 3.779 0.995 0.962 0.943 0.005 0.116 7.126 0.037 0.265 2.741 0.943 0.119 0.014
7.709 49.9 100.3 0.1 9.7 50 110 6.928 0.998 0.969 0.955 0.002 0.046 7.843 0.018 0.144 2.772 0.955 0.120 0.006
6.852 100 200.3 0 9.7 100 210 13.227 1 0.969 0.969 0 0.000 8.823 0.009 0.076 2.787 0.969 0.121 0.000
9
10
20
50
100
Bottle
Ruptura
3
5
7
50
100
Exp33
5
7
9
10
20
Exp13
Bottle
Rupture
3
50
50
100
Exp32
Bottle
Rupture
1
3
5
7
10
20
50
50
100
5
7
10
20
50
Exp31
Bottle
Rupture
1
3
Exp12
Bottle
Rupture
1
10
20
50
1
Exp11
Bottle
Rupture
50
3
100
5
7
10
20
50
100
3
5
7
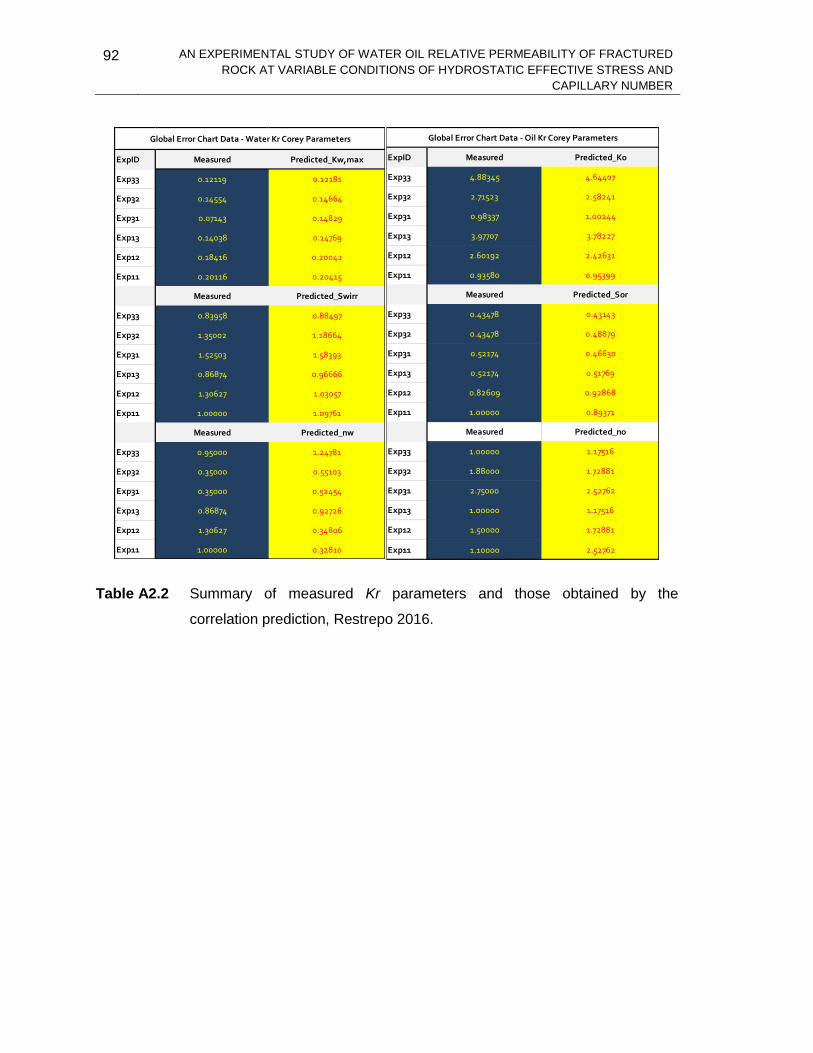
92 AN EXPERIMENTAL STUDY OF WATER OIL RELATIVE PERMEABILITY OF FRACTURED
ROCK AT VARIABLE CONDITIONS OF HYDROSTATIC EFFECTIVE STRESS AND
CAPILLARY NUMBER
Table A2.2 Summary of measured Kr parameters and those obtained by the
correlation prediction, Restrepo 2016.
ExpID Measured Predicted_Kw,max
Exp33 0.12119 0.12181
Exp32 0.14554 0.14664
Exp31 0.07143 0.14829
Exp13 0.14038 0.14769
Exp12 0.18416 0.20042
Exp11 0.20116 0.20415
Measured Predicted_Swirr
Exp33 0.83958 0.88497
Exp32 1.35002 1.18664
Exp31 1.52503 1.58393
Exp13 0.86874 0.96666
Exp12 1.30627 1.03057
Exp11 1.00000 1.09761
Measured Predicted_nw
Exp33 0.95000 1.24781
Exp32 0.35000 0.55103
Exp31 0.35000 0.52454
Exp13 0.86874 0.92726
Exp12 1.30627 0.34806
Exp11 1.00000 0.32810
Global Error Chart Data - Water Kr Corey Parameters
ExpID Measured Predicted_Ko
Exp33 4.88345 4.64407
Exp32 2.71523 2.58241
Exp31 0.98337 1.00244
Exp13 3.97707 3.78227
Exp12 2.60192 2.42631
Exp11 0.93580 0.95399
Measured Predicted_Sor
Exp33 0.43478 0.43143
Exp32 0.43478 0.48879
Exp31 0.52174 0.46630
Exp13 0.52174 0.51769
Exp12 0.82609 0.92868
Exp11 1.00000 0.89371
Measured Predicted_no
Exp33 1.00000 1.17516
Exp32 1.88000 1.72881
Exp31 2.75000 2.52762
Exp13 1.00000 1.17516
Exp12 1.50000 1.72881
Exp11 1.10000 2.52762
Global Error Chart Data - Oil Kr Corey Parameters