an explorative event study of listed private equity vehicles
DESCRIPTION
The last decade has seen a remarkable development within private equity. Private equity funds have become a key player in the market for corporate control and now accounts for a major share of the global M&A activity. However, private equity itself has changed. Listed private equity has emerged and approximately 350 private equity vehi-cles are now listed worldwide. Despite the relatively small number of vehicles, the de-velopment is striking since some of the largest and most renowned private equity vehi-cles, such as Blackstone and KKR, have chosen to go public. From an academic point of view, the emergence of listed private equity vehicles significantly expands the oppor-tunities for investigating an industry that is known for being notoriously private.TRANSCRIPT

AN EXPLORATIVE EVENT STUDY OF LISTED PRIVATE
EQUITY VEHICLES
- AND THEIR RETURN TO ANNOUNCEMENTS OF ACQUISITIONS
JULY 2012
BUSINESS AND SOCIAL SCIENCES, AARHUS UNIVERSITY
AUTHOR: MATHIAS LETH NIELSEN (287766)
LINE OF STUDY: MSC. FINANCE AND INTERNATIONAL BUSINESS
ADVISOR: PALLE NIERHOFF
DEPARTMENT: DEPARTMENT OF BUSINESS STUDIES

AN EXPLORATIVE EVENT STUDY OF LISTED PRIVATE EQUITY VEHICLES
JULY 2012 MATHIAS LETH NIELSEN I
EXECUTIVE SUMMARY
The last decade has seen a remarkable development within private equity. Private equity
funds have become a key player in the market for corporate control and now accounts
for a major share of the global M&A activity. However, private equity itself has
changed. Listed private equity has emerged and approximately 350 private equity vehi-
cles are now listed worldwide. Despite the relatively small number of vehicles, the de-
velopment is striking since some of the largest and most renowned private equity vehi-
cles, such as Blackstone and KKR, have chosen to go public. From an academic point
of view, the emergence of listed private equity vehicles significantly expands the oppor-
tunities for investigating an industry that is known for being notoriously private.
The aim of this thesis is to fill a gap in the understanding of private equity; namely how
listed private equity vehicles perform during acquisitions. Numerous researchers have
investigated how listed companies perform when they announce acquisitions, but de-
spite the fact that several authors have suggested that much of the value generation in
private equity is determined during the acquisition phase, no studies have yet investigat-
ed the abnormal return to announcements of acquisitions by listed private equity vehi-
cles. In addition to this, only a handful of studies have investigated the field of listed
private equity. This presents a unique opportunity to influence the research.
Based on an explorative review of the literature within M&A, private equity and listed
private equity, the thesis develops 22 hypotheses. Nine of these hypotheses are selected
for further analysis and tested in an event study, which consists of a battery of tests incl.
parametric, nonparametric and event-induced variance tests. The sample is based on
information from LPX Group and consists of 129 carefully selected deals conducted by
18 listed private equity vehicles in the period 2001-2012. The study finds an insignifi-
cant CAAR of 0.26% to the announcement of acquisitions by listed private equity vehi-
cles. In addition to this, the study finds that the announcement returns depend on the
structure and the experience of the listed private equity vehicle as well as on the period
in which the deal is conducted. These results are in line with former studies within
M&A and private equity.
The fact that listed private equity vehicles earn non-negative abnormal returns from the
announcement of acquisitions suggests that managers of listed private equity vehicles
have a shareholder wealth maximizing motive in acquisitions.

AN EXPLORATIVE EVENT STUDY OF LISTED PRIVATE EQUITY VEHICLES
JULY 2012 MATHIAS LETH NIELSEN II
TABLE OF CONTENTS
1. Introduction .............................................................................................................. 1
1.1. Problem Statement ............................................................................................. 1
1.2. Delimitations ...................................................................................................... 2
1.3. Philosophy of Science ........................................................................................ 3
1.4. Methodology ...................................................................................................... 3
1.5. Structure ............................................................................................................. 4
1.6. Technical Issues ................................................................................................. 5
2. The Market for Corporate Control............................................................................ 6
2.1. Introduction ........................................................................................................ 6
2.2. The Neoclassical Finance Theory ...................................................................... 6
2.3. Agency Theory .................................................................................................. 7
2.4. The Behavioural Finance Theory ...................................................................... 8
3. Private Equity ........................................................................................................... 9
3.1. The Structure of a Private Equity Fund ........................................................... 10
3.2. The Lifecycle of a Private Equity Fund ........................................................... 10
3.3. Current Trends in Private Equity ..................................................................... 11
4. Listed Private Equity .............................................................................................. 12
4.1. Definition of Listed Private Equity .................................................................. 12
4.2. The Diversity of Listed Private Equity Vehicles ............................................. 13
4.3. Comparison of Private Equity and Listed Private Equity ................................ 14
5. Value Generation in Listed Private Equity ............................................................. 16
5.1. A Three-Dimensional Framework of Value Generation ................................. 16
5.2. Levers of Value Generation ............................................................................. 17
5.2.1. Financial Improvements ........................................................................... 17
5.2.2. Operational Improvements ....................................................................... 18
5.2.3. Corporate Governance Improvements ...................................................... 19
AN EXPLORATIVE EVENT STUDY OF LISTED PRIVATE EQUITY VEHICLES
JULY 2012 MATHIAS LETH NIELSEN III
5.3. Implications ..................................................................................................... 20
6. Literature Review ................................................................................................... 20
6.1. Introduction ...................................................................................................... 20
6.2. Abnormal Returns to Listed Private Equity Vehicles ...................................... 21
6.2.1. Abnormal Returns to Listed Acquirers in General ................................... 22
6.2.2. Abnormal Returns to Acquirers in PE-Related Deals .............................. 22
6.2.3. Complicating Issues .................................................................................. 24
6.2.4. Expected Abnormal Return to Listed Private Equity Vehicles ................ 24
6.3. Determinants of Abnormal Returns to Listed Private Equity Vehicles ........... 25
6.3.1. Deal Characteristics .................................................................................. 25
6.3.2. Target Characteristics ............................................................................... 29
6.3.3. Acquirer Characteristics ........................................................................... 32
6.4. Sub Conclusion ................................................................................................ 36
7. Hypotheses ............................................................................................................. 36
7.1. Presentation and Selection of Hypotheses ....................................................... 36
7.2. Specification of Hypotheses ............................................................................ 37
7.3. Sub Conclusion ................................................................................................ 40
8. Data and Sample ..................................................................................................... 41
8.1. Sample Selection .............................................................................................. 41
8.2. Descriptive Statistics ........................................................................................ 42
9. Methodology ........................................................................................................... 43
9.1. Introduction ...................................................................................................... 43
9.2. Definition of the Event .................................................................................... 43
9.3. Estimation of Abnormal Return ....................................................................... 44
9.4. General Testing Procedure ............................................................................... 47
9.5. Testing Procedure for Tests of Differences ..................................................... 50
9.6. Performance of Test Statistics ......................................................................... 51

AN EXPLORATIVE EVENT STUDY OF LISTED PRIVATE EQUITY VEHICLES
JULY 2012 MATHIAS LETH NIELSEN IV
10. Empirical Findings .............................................................................................. 52
10.1. Discussion of the Results ............................................................................. 52
10.1.1. Overall CAAR ...................................................................................... 52
10.1.2. Deal Period ........................................................................................... 53
10.1.3. Deal Size ............................................................................................... 54
10.1.4. The Industry of the Target .................................................................... 55
10.1.5. The Legal Origin of the Target ............................................................. 55
10.1.6. The Former Ownership of the Target ................................................... 56
10.1.7. The Structure of the LPEV ................................................................... 56
10.1.8. The Experience of the LPEV ................................................................ 57
10.1.9. The Investment Strategy of the LPEV .................................................. 58
10.2. Value Generating Levers .............................................................................. 58
10.3. Reliability and Validity ................................................................................ 59
11. Conclusion ........................................................................................................... 60
12. Future Research ................................................................................................... 61
13. List of Literature
14. Appendices

AN EXPLORATIVE EVENT STUDY OF LISTED PRIVATE EQUITY VEHICLES
JULY 2012 MATHIAS LETH NIELSEN V
LIST OF EXHIBITS
Exhibit 1.1 – Methodological Approach 3
Exhibit 1.2 – Structure of the Thesis 4
Exhibit 3.1 – The Structure of a Private Equity Fund 10
Exhibit 4.1 – Four Types of Listed Private Equity Vehicles 13
Exhibit 7.1 – Prioritization of Hypotheses 37
Exhibit 10.1 – CAAR to Announcements of Acquisitions by LPEVs 53

AN EXPLORATIVE EVENT STUDY OF LISTED PRIVATE EQUITY VEHICLES
JULY 2012 MATHIAS LETH NIELSEN 1
1. INTRODUCTION
The last decade has seen a remarkable development within private equity. Private equity
funds have become a key player in the market for corporate control and now accounts
for 12.9% of the global M&A activity measured by deal value (Mergermarket 2012).
However, private equity itself has changed. Listed private equity, a contradiction in
terms, has emerged and approximately 350 private equity vehicles are now listed
worldwide (Talmor & Vasvari 2012). Despite the relatively small number of vehicles,
the development is striking since some of the largest and most renowned private equity
vehicles, such as Blackstone and KKR, have chosen to go public (Talmor & Vasvari
2012). From an academic point of view, the emergence of listed private equity vehicles
significantly expands the opportunities for investigating an industry that is known for
being notoriously private.
The aim of this thesis is to fill a gap in the understanding of private equity; namely how
listed private equity vehicles perform during acquisitions. Numerous researchers have
investigated how listed companies perform when they announce acquisitions, but de-
spite the fact that several authors (e.g. Berg & Gottschalg 2005) have suggested that
much of the value generation in private equity is determined during the acquisition
phase, no studies have yet investigated the abnormal return to announcements of acqui-
sitions by listed private equity vehicles. In addition to this, only a handful of studies
have investigated the field of listed private equity. This presents a unique opportunity to
influence the research while contributing to a better understanding of listed private equi-
ty. This leads us to the problem statement of the thesis.
1.1. Problem Statement
The purpose of the thesis is to investigate the performance of listed private equity vehi-
cles in connection with their announcement of acquisitions. Through an explorative
review of the literature within M&A, private equity and listed private equity, a number
of hypotheses about the short run abnormal return to announcements of acquisitions by
listed private equity vehicles will be developed. The most relevant of these hypotheses
will be analysed using an event study and the results will be compared to previous em-
pirical evidence. This will yield an improved understanding of listed private equity ve-
hicles’ performance in acquisitions and what this performance depends on.

AN EXPLORATIVE EVENT STUDY OF LISTED PRIVATE EQUITY VEHICLES
JULY 2012 MATHIAS LETH NIELSEN 2
In conclusion, the main research question is the following:
R.Q. 1: Does announcements of acquisitions by listed private equity vehicles gen-
erate short run abnormal returns to their shareholders?
Since buyout performance is likely to be context specific (Wood & Wright 2009) and
depend on characteristics of the deal, the target, and the acquirer (Martynova &
Renneboog 2011), a second research question is:
R.Q. 2: Does the short run abnormal return to the announcement of acquisitions
by listed private equity vehicles depend on certain deal, target, or acquir-
er characteristics?
The research questions will guide the thesis and give rise to a number of hypotheses
which will be tested throughout the thesis1.
1.2. Delimitations
First of all, the term vehicle will be used to describe all of the following entities: private
equity firms, private equity funds, investment companies committed to the private equi-
ty model, and private equity funds-of-funds. The focus of this thesis will be the short
run abnormal return earned by the acquiring listed private equity vehicles’ shareholders
in connection with the announcement of acquisitions. This implies that only listed pri-
vate equity vehicles (LPEVs) will be studied. Secondly, the LPEVs must adhere to the
traditional private equity (PE) model and be classified as buyout vehicles. Hence, as we
shall see in chapter 4, the subjects of study are LPE funds, LPE firms, and listed in-
vestment companies. Consequently, venture capital funds, funds-of-funds and LPE
mezzanine providers are not included in the study. Furthermore, the study will only fo-
cus on Europe and the U.S. since these areas have the most mature takeover markets
and the most developed LPEVs (Talmor & Vasvari 2012). Due to the fact that the study
will focus on the short run abnormal return, neither the long-run performance of PE
vehicles (PEVs) nor the returns to shareholders of LPEVs in connection with the an-
nouncement of sales of portfolio companies will be examined. Since this is a master
thesis, the audience is expected to be familiar with M&A and the basics of PE. Relevant
definitions and further delimitations will be made throughout the thesis when deemed
appropriate.
1 See chapter 6 and 7 for more information about the hypotheses.

AN EXPLORATIVE EVENT STUDY OF LISTED PRIVATE EQUITY VEHICLES
JULY 2012 MATHIAS LETH NIELSEN 3
1.3. Philosophy of Science
All scientific research is likely to be influenced by the view of the researcher. Therefore
it is important to describe the methodological approach, incl. the philosophy of science,
which the research is based on. This can be described by its ontology and epistemology.
Exhibit 1.1 – Methodological Approach
Source: Adapted from Abnor & Bjerke (1997)
Ontology concerns how the researcher perceives reality, while epistemology concerns
what knowledge is and how it is created. The thesis is based on the assumption that real-
ity is objective and that the whole is the sum of its parts. Hence it is assumed that
knowledge is independent of the researcher. Knowledge is created by verifying
/falsifying hypotheses about causal relationships in the real world. Based on this, the
paradigm of the study is the analytical approach. This approach is rooted in positivism,
which implies that knowledge comes from experience. The purpose of the analytical
approach is to explain the objective reality. How this is done, is explained below.
1.4. Methodology
Given the analytical approach, the operative paradigm can now be described. The opera-
tive paradigm aims to bridge the philosophy of science with the research area in order to
produce a picture of the objective reality. The operative paradigm consists of the meth-
ods and procedures used for creating knowledge (Abnor & Bjerke, 1997). In the sec-
tions above, the problem has been identified and defined, the scope of the study has
been outlined and the area of study has been presented. Therefore, what remains is to
explain how the study aims to answer the research questions.
First, the study will present a number of theories within the area of study. Secondly, an
explorative review of the existing empirical evidence within M&A, PE, and LPE will be
conducted. Based on this, hypotheses will be deducted. Third, a number of experiments
will be carried out in order to test the hypotheses. The experiments will be conducted as
an empirical, quantitative study using a classical event study framework as outlined by
Campbell et al. (1997). The hypotheses relating to each research question will be tested
Underlying Assumptions
Paradigm Methodological
Approach Operative Paradigm
Study Area
Philosophy of Science Methodology

AN EXPLORATIVE EVENT STUDY OF LISTED PRIVATE EQUITY VEHICLES
JULY 2012 MATHIAS LETH NIELSEN 4
in two parts. First, a battery of nine test statistics will be used for the analysis of the hy-
pothesis relating to research question 1. Afterwards, the hypotheses relating to research
question 2 will be tested by means of two tests for differences. In addition to this, the
underlying assumptions will be tested using various statistical techniques. The experi-
ments will lead to verification or falsification of the hypotheses. Based on this, one will
be able to answer the research questions and propose areas for future research.
1.5. Structure
The first part of the thesis consists of chapter 2-4 and will establish the theoretical
framework. Chapter 2 will outline the major theories behind takeovers incl. the neoclas-
sical finance theory, agency theory, and behavioural finance theory. Chapter 3 will then
give an introduction to PE in general, while chapter 4 will go into depth with the specif-
ic characteristics of LPE. Based on this, the reader should have a solid basis for under-
standing LPEVs.
Exhibit 1.2 – Structure of the Thesis
The aim of the second part of the thesis is to explore the current state of the research and
develop hypotheses about the abnormal return to LPEVs. First, chapter 5 will explain
how LPEVs generate value. Then chapter 6 will explore the existing empirical evidence
within M&A, PE, and LPE. This will lead to the development of 22 different hypothe-
ses. Afterwards, chapter 7 will evaluate the proposed hypotheses and select nine of them
for further analysis.

AN EXPLORATIVE EVENT STUDY OF LISTED PRIVATE EQUITY VEHICLES
JULY 2012 MATHIAS LETH NIELSEN 5
The third part of the thesis will be the analysis, which will consist of chapter 8-10. The
objectives of these chapters are to choose the proper subjects of analysis, outline the
methodology and present the empirical results. First, chapter 8 will explain how the
sample is selected and present various descriptive statistics. Then chapter 9 will provide
an explanation of the event study methodology including the test statistics and their per-
formance. Finally, chapter 10 will discuss the empirical findings and the reliability and
the validity of the study.
The fourth and final part of the thesis will provide an answer to the research questions,
relate the results to the fundamental theories governing the market for corporate control,
and outline future research areas. Chapter 11 will summarize the findings and provide
an answer to the research questions while chapter 12 will outline future research areas.
1.6. Technical Issues
The literature has been gathered from Aarhus University’s article databases, incl. Busi-
ness Source Complete, JSTOR, Science Direct and Wiley Online Library. The data has
been gathered from Zephyr and Datastream based on information from LPX Group. The
analyses have been conducted using MS Excel 2007, while the assumptions have been
tested in EViews 5.0. MS Excel 2007 has been used for preparing the data for EViews
5.0. Datasets can be found on the enclosed CDROM.
AN EXPLORATIVE EVENT STUDY OF LISTED PRIVATE EQUITY VEHICLES
JULY 2012 MATHIAS LETH NIELSEN 6
2. THE MARKET FOR CORPORATE CONTROL
The following chapter will provide an introduction to the market for corporate control,
outline three of the main theories within this area, and explain their predictions about
the abnormal returns to acquirers announcing acquisitions.
2.1. Introduction
According to Jensen and Ruback (1983), corporate control can be defined as the rights
to decide the management of corporate resources. Thus, the market for corporate control
can be defined as: “... an arena where managerial teams compete for the rights to man-
age corporate resources.” (Jensen & Ruback 1983, p.1). The managerial team that ac-
quires the rights to manage the corporate resources is called the acquirer, while the sell-
er of the rights to manage the corporate resources is called the target. An acquisition can
therefore be defined as a transaction where money flows from an acquirer to a target in
exchange for the rights to control the target’s corporate resources2.
In order to understand acquisitions it is important to understand their corporate context.
Essentially, an acquisition is an investment decision. Other corporate investments like
JVs and R&D have abnormal returns of less than 1% (Andrade et al. 2001). An abnor-
mal return of zero implies that an investment has the same risk-adjusted rate of return as
the acquirer earns on the existing assets. Thus, an acquisition which yields an abnormal
return of zero will have a fair rate of return from the acquiring firm’s point of view.
The causes and consequences of acquisitions have been widely studied by academics.
The empirical results have differed quite substantially and hence several theoretical ex-
planations of acquisitions have been proposed. Yet, three main bodies of theory stand
out; the neoclassical finance theory, agency theory, and the behavioural finance theory.
2.2. The Neoclassical Finance Theory
The neoclassical finance theory is based on the efficient market hypothesis (EMH) and
the law of one price (Ross 2002) and relies on the assumptions of rational expectations.
Rational expectations imply that investors know the true economic model that generate
future returns and incorporate all relevant information in their forecast of expected re-
turns (Fama 1970; Cuthbertson & Nitzsche 2004). Further assumptions are that forecast
errors are mean zero and unpredictable from information available at the time of the
2 As an acquisition implies that the acquirer takes control over the target, the term “takeover” is often used instead.

AN EXPLORATIVE EVENT STUDY OF LISTED PRIVATE EQUITY VEHICLES
JULY 2012 MATHIAS LETH NIELSEN 7
forecast. Hence, the neoclassical finance theory implies that it is impossible to earn ab-
normal returns in the long run in an efficient market.
According to the neoclassical finance theory the price of a security equals the present
value of the expected future cash flows, given the investors’ information set. Further-
more, following the law of one price, the security will only have one price namely the
market price. Security prices will therefore only change when new information, that
changes the expected future cash flows, is available.
Generally, one distinguishes between three forms of market efficiency depending on the
information that is incorporated in the investors’ information set and hence in the secu-
rity price. If the information set only incorporates information contained in past prices
and returns, the market is efficient in its weak form. If security prices reflect all publicly
available information, the market is efficient in its semi-strong form. If security prices
reflect all information that can possibly be known, incl. insider information, the market
is efficient in its strong form. In the remained of the thesis, the EMH will be referred to
in its semi-strong form.
The neoclassical finance theory predicts that acquisitions will occur because efficient
markets will ensure that poorly performing managers are replaced. In addition to this,
managers of a company will only engage in an acquisition if it maximizes shareholder
value, i.e. increases the risk-adjusted expected future cash flows. Thus, the neoclassic
finance theory argues that the announcement of acquisitions should lead to zero or posi-
tive abnormal returns to both the acquirer and the target.
2.3. Agency Theory
The second main body of theory is agency theory. It is often associated with Jensen and
Meckling (1976), who defined an agency relationship as:
“… a contract under which one or more persons (the principal(s)) engage another per-
son (the agent) to perform some service on their behalf which involves delegating some
decision making authority to the agent.” (Jensen & Meckling 1976, p. 308)
Inherent in an agency relationship are certain incentive problems. The separation of
ownership and control implies that there is asymmetric information since managers
(agents) have better (private) information about the actual performance of the company
than the owners (principals). If incentives differ between agents and principals, a prob-

AN EXPLORATIVE EVENT STUDY OF LISTED PRIVATE EQUITY VEHICLES
JULY 2012 MATHIAS LETH NIELSEN 8
lem might arise; namely that managers associate less utility with the maximization of
profits than the shareholders. The reason is that managers derive their utility from perks
such as access to a corporate jet. On the other hand, shareholders derive their utility
from the profits the company generates. Since corporate jets are expensive to operate,
they will, ceteris paribus, have a negative impact on the profits. However, the invest-
ment in a corporate jet could be partly disguised by the management, by e.g. not report-
ing the total expenses to the company’s owners. When managers act in their own inter-
est instead of in the interest of the shareholders, it is described as moral hazard.
According to agency theory acquisitions can occur for two reasons. First, managements’
rewards often take the form of pay and recognition. Since both rewards are likely to
increase with the size of the company, managers might engage in acquisitions which
increase the size of the company, but do not maximize the value for the shareholders.
Consequently, there should be negative abnormal returns to the announcement of acqui-
sitions. Secondly, the motive of an acquisition might be to decrease the agency costs by
taking over the company and aligning the interests between management and sharehold-
ers, as PEVs do. Such acquisitions are value maximizing and should hence result in
non-negative abnormal returns3.
2.4. The Behavioural Finance Theory
The behavioural finance theory emerged because scholars found an increasing amount
of anomalies in stock prices while psychologists and sociologists argued that investors
were not rational (Cuthbertson & Nitzsche 2005). Thus, they partly abandoned the
EMH. The theory has mainly focused on explaining anomalies in stock returns and asset
bubbles, but at least one behavioural finance theory regarding takeovers has been pro-
posed; namely the hubris hypothesis. It was proposed by Roll (1986) and relies on the
strong form of market efficiency. This means that security prices reflect all information
about individual firms (incl. insider information) and that product and labour markets
are efficient, i.e. there are no synergies and management talent is efficiently employed.
Hence, the hubris hypothesis argues that there are no gains from takeovers. Since it is
costly to perform a takeover, the hubris hypothesis suggests that the abnormal return to
acquirers is negative. Since targets will only accept an offer that is above the current
market price, the abnormal returns to the targets should be positive.
3 For more information about agency theory and private equity see chapter 5.

AN EXPLORATIVE EVENT STUDY OF LISTED PRIVATE EQUITY VEHICLES
JULY 2012 MATHIAS LETH NIELSEN 9
If the abnormal return to takeovers is negative and financial, labour, and product mar-
kets are efficient, why do takeovers occur? The hubris hypothesis argues that the valua-
tion of a company can be considered a random variable with a mean equal to the market
price. Offers are made when the random variable is larger than the mean; otherwise they
are abandoned. Hence, the takeover premium is a random error which managers of ac-
quiring firms have failed to account for. The hubris hypothesis therefore argues that
takeovers occur because managers of acquiring firms assume their valuations are correct
even when they are not, i.e. managers are overconfident about their own abilities and
hence ‘infected’ by hubris. It is worth noting that this does not mean that managers do
not intend to be wealth maximizing on the behalf of their shareholders; they might
simply be unaware that their actions do not comply with this objective.
Based on the main bodies of theory within the market for corporate control, the motives
for engaging in acquisitions vary from shareholder wealth maximization to maximiza-
tion of management’s utility and management hubris. If the analysis shows non-
negative abnormal returns it will provide support for the shareholder wealth maximiza-
tion motive, while negative abnormal returns will support the latter two motives.
Having outlined the theories governing takeovers, the next chapter will give an intro-
duction to PE and place it in the context of the market for corporate control.
3. PRIVATE EQUITY
Private equity (PE) belongs to the asset management industry. Essentially, PE is a vehi-
cle which enables investors to invest in unlisted companies that are not covered by the
public equity markets. Investment occurs through PE funds (also known as buyout
funds). According to Spliid (2007), Vinten and Thomsen (2008) and Talmor and Vasva-
ri (2012) the characteristics of these funds are that they;
buy, own and sell controlling positions in mature companies,
finance a substantial part of their investments by debt
ensure that management teams of the portfolio companies have a significant
amount of equity invested in the company,
pay their managers based on performance and the amount of assets under man-
agement, and
have a finite life time.

AN EXPLORATIVE EVENT STUDY OF LISTED PRIVATE EQUITY VEHICLES
JULY 2012 MATHIAS LETH NIELSEN 10
It is therefore clear that PE funds differ from other long-term investment funds as well
as from venture capital funds and hedge funds. Venture capital funds invest in the early
stages of a company’s life cycle and tend to concentrate their investments in high-tech
companies; hedge funds are short-term investors that acquire non-controlling ownership
stakes and earn their profits from speculative investments (Talmor & Vasvari 2012).
3.1. The Structure of a Private Equity Fund
In order to understand how a PE fund works and how it creates value, it is essential to
understand its structure. The typical structure of a PE fund is depicted in exhibit 3.1.
Exhibit 3.1 – The Structure of a Private Equity Fund
Source: Adapted from Talmor and Vasvari (2012)
Generally, a PE fund is controlled by a PE firm (a management company) which man-
ages one or more funds. Each fund consists of a number of portfolio companies. The PE
funds are organized as partnerships with general partners (GPs) and limited partners
(LPs). The GPs own and run the PE firm and invest personally in the funds as minority
investors. The majority investors in the PE funds are the LPs which commit a certain
amount of capital. The committed capital is drawn upon as the PE firm finds attractive
companies to acquire. As the portfolio companies are exited, capital flows back to the
investors. This will be explained in further details below.
3.2. The Lifecycle of a Private Equity Fund
The major tasks of the PE firm are closely related to the lifecycle of a PE fund. The first
period of a PE fund’s lifecycle is the fundraising period, which can take up to 18

AN EXPLORATIVE EVENT STUDY OF LISTED PRIVATE EQUITY VEHICLES
JULY 2012 MATHIAS LETH NIELSEN 11
months (Talmor & Vasvari 2012). Here, the PE firm negotiates with potential investors
in order to raise capital for their fund. When a fund has been raised, the next step is to
invest the capital in portfolio companies.
The second period is therefore called the investment period. Here, investment managers
of the PE firm screen and identify potential targets. When they find an interesting target
they initiate a bidding process. If the PE firm and the target’s owners can agree on a
price, the PE firm establishes an acquisition company. The new management team of
the target is then asked to invest a considerable amount of their personal wealth in the
acquisition company as LPs, in order to ensure that they have the same interests as the
owners. Occasionally, LPs are invited to join a deal as co-investors which imply that
they can invest directly in the target and hence avoid the management fees. Subsequent-
ly, the deal is announced and the acquisition company buys the target. The acquisition
company is financed with debt from banks and credit institutions and equity from the
PE fund and co-investors such as LPs and the new management team. The process in
repeated until all the committed capital is invested. When this is the case, the PE firm
earns a yearly fee of 2% of the assets under management4 (Talmor & Vasvari 2012).
After having invested the capital, the PE firm cooperates closely with the management
teams of the portfolio companies to improve the performance.
Due a PE fund’s limited life time of approximately 10 years (Kaplan & Strömberg
2009), the expected holding period for portfolio companies is between three and seven
years (Talmor & Vasvari 2012). After the holding period, the portfolio companies are
exited (sold) through either an IPO, a sale to a strategic buyer (an industrial sale), or a
sale to another PE fund (a secondary sale). This is known as the harvesting period.
When portfolio companies are exited, proceeds flow back to the LPs. The LPs receive
their invested capital plus any return up to a hurdle rate of typically 8% (Talmor &
Vasvari 2012). For the return above the hurdle rate, the LPs pay 20% to the GPs in car-
ried interest5 and receive the remaining 80% (Talmor & Vasvari 2012).
3.3. Current Trends in Private Equity
The credit crisis had a major impact on the PE business. This is reflected in the current
trends among PE funds. First of all, tough market conditions, lower degrees of leverage
4 The management fee is 2% of the committed capital during the investment period. 5 Hence, the fee structure in PE is normally referred to as 2/20.
AN EXPLORATIVE EVENT STUDY OF LISTED PRIVATE EQUITY VEHICLES
JULY 2012 MATHIAS LETH NIELSEN 12
and increased competition have led PEVs to focus on operational improvements (BCG
2008; Kaplan 2009; Bain & Co. 2012; Talmor & Vasvari 2012). Since operational im-
provements often require industry specific knowledge PE funds are specializing within
specific industries or niches.
Finally, as mentioned in the introduction, an increasing number of PEVs have been
listed during the last couple of years. This has raised serious concerns among scholars
who fear that the interests of managers and investors in LPEVs can diverge (Jensen
2007; Sloan & Benner 2008). Jensen (2007) argues that since LPEVs receive permanent
capital, they do not need to show superior performance to the same extent as PEVs,
which have to raise capital for new funds on a frequent basis. In addition to this, Lerner
(in Sloan & Benner 2008) argues that managers become more short-termed as they aim
to please the stock market, whereas investors bought the stock in order to benefit from
the long term perspective PE have on their investments.
Based on the information provided in this chapter, it is clear that PEVs are a key player
in the market for corporate control. Their performance has, however, been difficult to
evaluate due to their private nature.
4. LISTED PRIVATE EQUITY
PEVs have historically been privately held entities. Interestingly, an increasing number
of LPEVs have emerged during the last two decades, going from around 75 vehicles in
1990 to approximately 350 vehicles by the end of 2009 (Talmor & Vasvari 2012). De-
spite the fact that LPEVs have been around since the early 1960s, LPE is therefore a
relatively new asset class (Lahr & Herschke 2009).
4.1. Definition of Listed Private Equity
The term listed private equity is the most common name for the asset class and will be
used throughout the study, although it is also known as publicly traded private equity
and quoted private equity. The asset class consists of various LPEVs which are defined
as PEVs that are listed on a stock exchange and offer investors the opportunity to partic-
ipate either directly or indirectly in PE investments. Furthermore, the vehicles pursue a
clear PE strategy, commit to the PE investment process, and primarily invest in private
companies (Bilo et al., 2005; Lahr & Herschke, 2009; Talmor & Vasvari, 2012).

AN EXPLORATIVE EVENT STUDY OF LISTED PRIVATE EQUITY VEHICLES
JULY 2012 MATHIAS LETH NIELSEN 13
4.2. The Diversity of Listed Private Equity Vehicles
LPEVs are more diverse than traditional PEVs and can be divided into four different
types as shown in exhibit 4.16.
Exhibit 4.1 – Four Types of Listed Private Equity Vehicles
Sources: Adapted from Lahr and Herschke (2009), Talmor and Vasvari (2012) and LPX Group (2012c)
Investment companies are managed by internal investment professionals and invest di-
rectly in portfolio companies. Thus, they offer diversification at portfolio company lev-
el, but not at fund level. Besides the fact that they are committed to the PE business
model, they look like ordinary holding companies.
LPE funds receive investment management from an external management company and
invest directly in portfolio companies. Thus, they offer diversification at portfolio com-
pany level. Investors in LPE funds essentially invest in the limited partnership stake.
Therefore LPE funds are very similar to traditional PE funds. However, LPE funds are
often allowed to invest in other assets.
LPE firms are essentially listed management firms. This implies that they are internally
managed and that they invest in the general partner’s funds. LPE firms therefore offer
6 Section 4.2 is inspired by Talmor and Vasvari (2012).
AN EXPLORATIVE EVENT STUDY OF LISTED PRIVATE EQUITY VEHICLES
JULY 2012 MATHIAS LETH NIELSEN 14
investors diversification at both fund and portfolio company level. In addition to this,
investors in LPE firms get a share of the management fees and the carried interests.
LPE funds of funds are externally managed and invest in PE funds. This implies that
LPE funds of funds act as limited partners in several PE funds. Investors are therefore
only indirectly exposed to PE, but in return they get diversification at both fund and
portfolio level. Since LPE funds of funds differ significantly from traditional PE firms,
they will be excluded from the remainder of the study.
The majority of the LPEVs are LPE funds and investment companies, whereas LPE
firms account for a minor share (LPX Group 2012d). However, LPE firms are relevant
to include in the study since they represent a significant proportion when measured by
their market capitalization7 (Talmor & Vasvari, 2012). Geographically, the LPEVs are
concentrated in the U.S. and Europe, which account for 94% of all LPEVs (LPX Group
2012b). Therefore, these will be the geographical focus areas of the study.
4.3. Comparison of Private Equity and Listed Private Equity
Listed private equity differs from unlisted private equity in a number of ways8. First of
all, shares in LPEVs are listed and hence more liquid. This makes it easy to trade shares
in LPEVs. A sale of shares in a PEV is difficult and time consuming since secondary
transactions between limited partners have to be approved by the general partner. Fur-
thermore, the transaction costs are high due to illiquidity. The only transaction cost in
LPE is the bid-ask spread (Bergmann et al. 2009; Talmor & Vasvari 2012).
Secondly, PE funds have high minimum investment requirements whereas there is no
minimum investment requirement in LPE. Hence LPE provides better access for retail
investors. The combination of no minimum investment and liquidity implies that it is
easier for investors to diversify their investments in LPE than in PE. Furthermore, PE
requires investors to have a fixed investment horizon of 7-10 years, whereas LPE allows
for a flexible investment horizon (Bergmann et al., 2009; Talmor & Vasvari, 2012).
Third, PE and LPE differ on a number of structural parameters. PEVs are often large,
have a limited life, return realized proceeds to investors and raise capital for each new
fund. LPEVs, on the other hand, are typically small, have an unlimited life, often retain
7 The Blackstone Group, Partners Group, Onex Corp., American Capital, and Intermediate Capital Corp. 8 See appendix 1 for a tabular overview of the differences
AN EXPLORATIVE EVENT STUDY OF LISTED PRIVATE EQUITY VEHICLES
JULY 2012 MATHIAS LETH NIELSEN 15
and reinvest realized proceeds, and have a fixed pool of capital (Brown & Kräussl 2010;
Jegadeesh et al. 2010; Goldman 2011). Therefore, LPEVs do not have to raise new
funds to the same extent as unlisted PEVs. Some scholars have argued that this causes
LPEVs to care less about their returns (Sloan & Benner 2008). However, investors in
LPE avoid the J-curve effect, which is predominant in PE. Thus, they gain immediate
exposure to PE and the underlying portfolio companies (Cumming et al. 2011; Talmor
& Vasvari 2012). However, LPEVs often invest in other assets than PE, while PEVs
typically stick to PE-related assets (Goldman 2011; Talmor & Vasvari 2012). Further
structural differences include that LPEVs do not offer co-investments to their investors
and trade at a discount relative to their net asset value (NAV) (Brown & Kräussl 2010).
Finally, LPE is easier and more transparent than PE, since LPEVs handle cash man-
agement, charge lower fees and allow for easy performance evaluation due to the fact
that prices are quoted (Brown & Kräussl 2010; LPEQ 2012; Talmor & Vasvari 2012)
The differences between LPEVs and PEVs complicate direct comparison. However,
Bergmann et al. (2009) finds that listed and unlisted PEVs behave similar with respect
to their risk and return patterns. This limits the problem of comparability.
To summarize, part 1 has given a number of valuable insights. Chapter 2 showed that
the market for corporate control can be explained by the neoclassical finance theory, the
agency theory and the behavioural finance theory, while Chapter 3 gave an introduction
to PE and explained how a PE fund works. Furthermore, it argued that the current trends
in PE are an increasing focus on operational improvements, specialization within specif-
ic industries or niches, and a movement towards listed private equity. Finally, chapter 4
showed that LPEVs are more diverse than PEVs and can be structured as: investment
companies, LPE funds, LPE firms or LPE funds of funds. The major differences be-
tween PE and LPE are that LPE is more liquid, provide better access for retail investors,
and is easier and more transparent. In addition to this, PE and LPE differ on a number of
structural parameters such as lifetime and size.

AN EXPLORATIVE EVENT STUDY OF LISTED PRIVATE EQUITY VEHICLES
JULY 2012 MATHIAS LETH NIELSEN 16
5. VALUE GENERATION IN LISTED PRIVATE EQUITY
Having explained what LPE is, the next step is to outline how LPEVs generate value at
the portfolio company level. This will provide a solid basis for developing hypotheses
and explaining the empirical results.
5.1. A Three-Dimensional Framework of Value Generation
Berg and Gottschalg (2005) argue that value generation in PE depends on a number of
levers and can be analysed along three dimensions; phases, causes, and sources. The
phases of value generation can be divided into the acquisition phase, the holding phase,
and the divestment phase9. Value generation in the acquisition phase is determined by
the acquisition price. In addition to this, the initial business plan and the structure of the
buyout are determined. The value generation in the holding phase is determined by the
success of implementing and continuously adjusting the business plan. This includes
implementing the necessary strategic, operational, and organizational changes. The di-
vestment price determines the value generated in the divestment phase. In addition to
this, the mode of divestment is determined in this phase.
The second dimension is the causes of value generation. Essentially, value is generated
by increasing the equity value of the portfolio company. The equity value of a company
can be described by the following equation:
(5.1)
One can therefore distinguish between two causes of value generation; value capturing
and value creation. Value capturing is value generation caused by increasing the valua-
tion multiple while value creation is value generation caused by increasing revenues,
improving margins, or decreasing net debt. Value capturing occurs without changing the
underlying financial performance of the company and is therefore also known as finan-
cial arbitrage. It is achieved by selling a company at a higher valuation multiple than it
was bought at and is thus determined during the acquisition and divestment phase. Val-
ue creation occurs when the underlying financial performance of the company is im-
proved. This can be achieved through both direct and indirect means. Direct value crea-
tion arises through improved financial engineering, operational effectiveness and/or
strategic distinctiveness, i.e. things that directly impact the bottom line. Such levers are
9 The first two phases relate to the investment period in the PE fund lifecycle while the last phase relates to the har-
vesting period.

AN EXPLORATIVE EVENT STUDY OF LISTED PRIVATE EQUITY VEHICLES
JULY 2012 MATHIAS LETH NIELSEN 17
called primary levers. The primary levers are influenced by secondary levers such as
agency costs, which only have indirect bottom line impact.
The third dimension is the sources of value generation, which can be either intrinsic or
extrinsic (Berg & Gottschalg 2005). Intrinsic value generation occurs without any form
of knowledge transfer from the LPEV to the portfolio company, while extrinsic value
generation occurs due to knowledge transfer from the LPEV.
5.2. Levers of Value Generation
The levers of value generation are usually split into three groups; financial improve-
ments, operational improvements, and governance improvements (Jensen et al. 2006;
Kaplan & Strömberg 2009).
5.2.1. Financial Improvements
Financial improvements can stem from financial arbitrage and financial engineering.
Financial arbitrage is widely recognized by practitioners, but has received surprisingly
little attention by academics (Berg & Gottschalg 2005; Loos 2005). It is also known as
“multiple riding” and concerns the value generated from selling at a higher valuation
multiple than the portfolio company was acquired at. Financial arbitrage can be based
on the following five factors; changing market valuation multiples, private information
about the portfolio company (MBO), superior market information (proprietary deal
flows and industry expertise), superior deal making capabilities, and conglomerate dis-
counts (Kaplan 1989; Palepu 1990; Singh 1990; Baker & Smith 1998; Berg &
Gottschalg 2005; Kaplan & Strömberg 2009)10
. It is a case of value capturing, which
occurs during the acquisition and the divestment phases. In addition to this, it is extrin-
sic, since it depends on characteristics of the LPEV.
Financial engineering includes levers such as improved capital structure and lower tax-
es (Berg & Gottschalg 2005). Several authors have argued that an improved capital
structure in the form of increased leverage is one of the key levers of value generation in
PE, e.g. Kaplan and Strömberg (2009). Since LPEVs are repeat borrowers they have a
good reputation with lenders. Thus, they face less strict covenants, higher availability of
debt financing and lower interest rates (Berg & Gottschalg 2005; Kaplan & Strömberg
2009). A high level of debt leads to higher interest payments, but due to tax deductibil-
10 One should, however, be aware that the EMH in its semi-strong form implies that it is impossible to consistently
generate value through financial arbitrage (Talmor & Vasvari 2012).

AN EXPLORATIVE EVENT STUDY OF LISTED PRIVATE EQUITY VEHICLES
JULY 2012 MATHIAS LETH NIELSEN 18
ity of interests it can also result in significant corporate tax savings (Berg & Gottschalg
2005). In addition to lower taxes, increased debt has disciplining effects on managers.
This will be explained in more detail in section 5.2.3. An improved capital structure and
a reduction of taxes are primary levers of value creation since they directly affect the
bottom line. In addition to this, they depend on the equity investors and are hence ex-
trinsic sources of value generation. Finally, the capital structure is usually determined
during the acquisition phase and continually adjusted during the holding phase.
5.2.2. Operational Improvements
Operational improvements include both increased operational effectiveness and im-
proved strategic distinctiveness. Increased operational effectiveness can stem from three
levers: cost cutting and margin improvements, lower capital requirements, and removal
of managerial inefficiencies (Berg & Gottschalg 2005). Cost cutting and margin im-
provements occur by means of initiating cost reduction programmes and improving
productivity through outsourcing activities and decreasing overhead costs (Berg &
Gottschalg 2005). Capital requirements are decreased by improving the management of
working capital and introducing investment practices that ensure divestment of unnec-
essary assets and rejection of projects with negative NPVs (Magowan 1989). Finally,
the market of corporate control will remove managerial inefficiencies by replacing
poorly performing management teams with better and more efficient ones as explained
in section 2.2. The three levers of increased operational effectiveness are all primary
levers of value creation, since they directly influence the bottom line. They mainly oc-
cur during the holding phase and are to a large extent intrinsic as they can occur without
interaction with the equity investor. However, removal of managerial inefficiencies re-
quires interaction by the equity investor and can thus be categorized as extrinsic.
Increased strategic distinctiveness is a result of refocusing the business. This is done by
making a clear prioritization of strategic issues such as markets and products, and out-
sourcing non-core activities (Muscarella & Vetsuypens 1990). The portfolio company
therefore determines which markets and customers to serve, what products and service
level to offer, and which distribution channels to use (Berg & Gottschalg 2005). By up-
dating and prioritising key strategic variables, the company is able to refocus its busi-
ness and leverage its core competencies. This leads to higher profits due to higher reve-
nues, lower costs, or a combination of the two. Since the lever has direct bottom line
impact it qualifies as a primary lever of value creation. The lever is partly dependent on

AN EXPLORATIVE EVENT STUDY OF LISTED PRIVATE EQUITY VEHICLES
JULY 2012 MATHIAS LETH NIELSEN 19
the equity investors and partly dependent on the portfolio company. Therefore, it is part-
ly extrinsic and partly intrinsic. Finally, the plan for increasing the strategic distinctive-
ness is created during the acquisition phase, while the implementation of it occurs dur-
ing the holding phase.
From the discussion above, it is clear that LPE ownership has the potential to create
value through a number of levers. It is, however, unclear why the portfolio companies
have not been able to create this value under other types of ownership. This leads us to
the secondary levers of value creation, which emphasise the importance of the active
ownership pursued by the LPEVs.
5.2.3. Corporate Governance Improvements
LPEVs pursue active ownership through various levers, which all improve the corporate
governance of the portfolio companies. None of the levers have any direct bottom line
impact; instead they reduce the agency costs and thereby ensure that management takes
the necessary actions to improve the financial performance11
.
Agency costs can be reduced through three levers; reducing the agency costs of free
cash flows, aligning incentives, and improving monitoring and control (Berg &
Gottschalg 2005). The agency costs of free cash flows are reduced since management
has to run the company very efficiently in order to be able to service the increased level
of debt (Jensen 1986). Furthermore, the increased debt implies that some of the govern-
ance is outsourced from the equity investors to the lenders (Berg & Gottschalg 2005).
Due to the high level of debt lenders have a large incentive to monitor management’s
behaviour. Therefore, they impose strict debt covenants which limit management’s non-
value maximizing behaviour (Lichtenberg & Siegel 1990).
The second way in which LPE ownership reduces agency costs is by means of increas-
ing the alignment between shareholders and managers (Jensen 1989). PEVs usually
make management’s pay more performance based and require the management team to
invest a significant amount of their wealth in the company (Fox & Marcus 1992). Man-
agers thereby become co-owners of the company and enjoy incentives similar to those
of the other investors. This significantly reduces the agency conflict (Bull 1989; Jensen
1989). However, while LPEVs have diversified their investments, management’s finan-
11 Some have proposed that PE funds also improve the corporate governance by mentoring the portfolio companies.
However, no compelling empirical evidence has yet been presented cf. Berg and Gottschalg (2005) and Vinten and
Thomsen (2008).

AN EXPLORATIVE EVENT STUDY OF LISTED PRIVATE EQUITY VEHICLES
JULY 2012 MATHIAS LETH NIELSEN 20
cial and human capital is tied up in the company. Therefore, managers are likely to be
more risk averse than the LPEV. This might have a negative effect on financial perfor-
mance, but it might also imply that managers avoid taking unnecessary risks.
A third way in which LPE ownership reduces agency costs is by means of improving
monitoring and control. LPEVs place their own people at the boards of the portfolio
companies and are more experienced in monitoring management than other investors.
Finally, the concentrated ownership eliminates the free-rider problem. Hence, LPEVs
have a strong incentive to monitor and control management (Mishkin & Eakins 2003).
The three levers of corporate governance improvements are strongly dependent upon
the PE funds and are thus extrinsic sources of value generation. They are determined
during the acquisition phase and implemented during the holding phase.
5.3. Implications
From the discussions of this chapter it is evident that value generation in LPE can stem
from numerous levers. The three-dimensional framework proposed by Berg and
Gottschalg (2005) provides a basis for analysing the levers and hence improves the un-
derstanding of value generation in LPE. Going forward, the levers of value generation
will serve as a theoretical basis for developing hypotheses and explaining the results.
6. LITERATURE REVIEW
Having outlined the basics about LPEVs and how they generate value, this chapter will
review the existing literature about the abnormal returns to acquirers in M&A, as well
as the long-run abnormal performance of PE funds and their portfolio firms. This is
done in order to develop a number of hypotheses about the abnormal return to LPEVs
when they announce acquisitions. The first part of the literature review will investigate
whether we can expect LPEVs to generate positive abnormal returns to their sharehold-
ers when they announce acquisitions, while the second part will identify and discuss 21
hypotheses about the determinants of the abnormal return to LPEVs. The review of ex-
isting literature will primarily focus on previous studies within M&A, PE and LPE. In
addition to this, the chapter will rely on the information presented in chapter 2-5.
6.1. Introduction
The abnormal return to the announcement of an acquisition by a LPEV should equal the
change in expected future profits cf. the EMH. The expected future profits depend on

AN EXPLORATIVE EVENT STUDY OF LISTED PRIVATE EQUITY VEHICLES
JULY 2012 MATHIAS LETH NIELSEN 21
the value that the LPEV is able to generate from the acquisition. Hence, the abnormal
return to LPEVs can be explained by the factors influencing the value generation in
their portfolio companies. This will prove useful in section 6.2.
Before proceeding, it is necessary to clarify a couple of issues about PE returns. First of
all, some authors (e.g. Gottschalg et al. 2010) have suggested that PE acquirers have
higher returns because they are exposed to significantly more risk than other acquirers.
Therefore, several PE studies have investigated the beta of PE funds. The beta ranges
from 0.66 (Kaplan & Schoar 2005) to 1.12 (Ljungqvist & Richardson 2003), with most
studies finding a beta around 1 (e.g. Phalippou 2010). Hence, PE acquirers do not seem
to be exposed to more undiversifiable risk than the market in general12
.
Secondly, some scholars argue that PE targets are more risky and have a higher post-
deal risk of bankruptcy due to the increased leverage cf. e.g. Kaplan and Schoar (2005).
However, Bargeron et al. (2008) and Kaplan and Strömberg (2009) find that targets of
PE acquirers have a bankruptcy rate that is lower than or equal to that of other targets.
In addition to this, Officer et al. (2010) show that PE targets are less risky than the
overall stock market. Thus, targets of PE acquirers do not seem to exhibit higher risk
than other targets, neither before nor after the deal.
Besides risk, a number of potential problems regarding the measurement of PE perfor-
mance exist. First of all, since poor PE investments have longer duration than good PE
investments, the use of average IRRs imposes an upwards bias on performance (Phalip-
pou & Gottschalg 2009). Secondly, it is unknown what the current return is, as all in-
vestments have to be exited in order to calculate the return to a PE fund, (Phalippou
2010). Third, it is difficult to compare the performance of PE funds to market indices as
there are differences in e.g. liquidity and investment horizons (Gottschalg et al. 2010).
6.2. Abnormal Returns to Listed Private Equity Vehicles
In order to draw a reasonable inference about the expected abnormal return to LPEVs, a
three-step approach is applied. First, the abnormal returns to listed acquirers are investi-
gated in order to establish a baseline. Secondly, the performance of acquirers in PE-
related deals is investigated. Third, a couple of complicating issues are discussed. Based
on this, we can state a hypothesis about the expected abnormal return to LPEVs.
12 Besides this, the issue is irrelevant wrt. abnormal retunrs because the expected returns are risk-adjusted.

AN EXPLORATIVE EVENT STUDY OF LISTED PRIVATE EQUITY VEHICLES
JULY 2012 MATHIAS LETH NIELSEN 22
6.2.1. Abnormal Returns to Listed Acquirers in General
The total abnormal return to an acquisition consists of two parts: the return to the target
and the return to the acquirer. The general consensus is that targets get most of the ab-
normal return. In European takeovers, the abnormal returns to targets have been 9%-
16% (Andrade et al. 2001; Martynova & Renneboog 2006, 2011). This is considerably
lower than in U.S. takeovers, where the abnormal returns to targets have been 16%-27%
(Andrade et al. 2001; Bargeron et al. 2008). When investigating PE-related deals, such
as public-to-private LBOs, in the U.S. from 1973 to 1996, Renneboog and Simons
(2005) find abnormal returns to targets between 13% and 22%. In a comparable U.K.
study, Renneboog et al. (2007) find abnormal returns to targets of approximately 23%.
It is thus clear that targets’ shareholders gain considerably from being involved in take-
overs, incl. PE-related deals. With respect to acquirers, results do not seem to differ be-
tween Europe and the U.K. Scholars disagree about the sign of the abnormal return, but
agree that it is fairly low, ranging from negative (-0.7%) and insignificant (Andrade et
al. 2001) to positive (0.7%) and significant (Martynova & Renneboog 2011) in Europe.
These results are in line with findings in U.S. studies, where reported abnormal returns
range from insignificant -0.7% to significant 1.2% (Andrade et al. 2001; Moeller et al.
2005). It can therefore be concluded that the gain to acquiring firm’s shareholders seems
to be small.
6.2.2. Abnormal Returns to Acquirers in PE-Related Deals
Naturally, the abnormal returns to shareholders of target firms in PE buyouts have been
of great interest (DeAngelo et al. 1984; Kaplan 1989; Lee et al. 1992; Renneboog et al.
2007). However, due to PEVs’ unlisted nature, it has historically been impossible to
directly study their abnormal returns to acquisitions. Furthermore, despite the develop-
ment within LPE, no studies have yet investigated the abnormal returns to announce-
ment of acquisitions by LPEVs13
. Fortunately, the abnormal return to PEVs can be stud-
ied indirectly due to the factors it is dependent upon.
Essentially, the abnormal return to an acquirer depends on the value which the acquirer
is able to generate from the acquisition. The value generation depends on two things: 1)
the combined gain from the takeover and 2) the share of the combined gain, which the
acquirer is able to capture.
13 A working paper by Gianfrate (2009) investigates the abnormal return to announcement of acquisitions by LPEVs
and finds a CAAR of 1.09%. However, the working paper’s academic quality is questionable due to e.g. a limited
number of tests and a large amount of typos and grammatical errors.

AN EXPLORATIVE EVENT STUDY OF LISTED PRIVATE EQUITY VEHICLES
JULY 2012 MATHIAS LETH NIELSEN 23
The combined gain depends on the value which the acquisition is expected to create.
This is proved by Stotz (2011) who finds that improvements in operating performance
are signalled by higher announcement CAARs to the target’s shareholders. Berg and
Gottschalg (2005) review the empirical literature and find that all studies uniformly
agree that PE ownership increases the efficiency of the target. Loos (2005), Achleitner
et al. (2009, 2010) and Gottschalg et al. (2010) support this by finding that PE portfolio
companies have a significantly better operating performance than their peers. Even Gou
et al. (2011), although critical to PE, find that the operating performance of PE portfolio
firms is higher than or on par with benchmark firms. Based on these findings, it seems
that PE acquirers create more value in acquisitions than other acquirers. Consequently,
the combined gain to PE takeovers is most likely larger than that of other takeovers.
The share of the combined gain which the acquirer is able to capture depends on the
bargaining power of the acquirer vis-a-vis the target. PE acquirers are experienced,
tough and excellent negotiators (Berg & Gottschalg 2005). This decreases the bargain-
ing power of the target’s shareholders. Thus, more of the combined gain will accrue to
the PE acquirer. Kaplan and Strömberg (2009) support this by showing that PEVs are
able to acquire targets cheaper than other acquirers. Furthermore, Renneboog et al.
(2007) find that PEVs try to avoid hostile takeovers due to the loss of information and
skills if management leaves. Since hostile bids result in higher premiums to the targets
(Sudarsanam 2003), the lower percentage of hostile takeovers suggests that PE acquir-
ers are able to capture more of the combined gain than acquirers in general. This is sup-
ported by previous empirical evidence. Bargeron et al. (2008) find that PEVs pay signif-
icantly lower premiums than other private and public acquirers. Assuming that the com-
bined gain is constant, a lower target gain will be offset by a higher acquirer gain. Since
the combined gain is expected to be larger in PE takeovers, it is interesting to see how
target gains differ between PE takeovers and other takeovers. Interestingly, Bargeron et
al. (2008) and Officer et al. (2010) find that PE targets experience significantly lower
CAARs than targets of other types of acquirers. Hence, the gains to PEVs must be larg-
er than the gains to other acquirers. Stotz (2011) supports this by finding that targets in
PE takeover have CAARs of only 1.57%. This is very low compared to the 9%-27%
found for targets in general. Based on the discussion above, it is thus fair to conclude
that PEVs seem to capture a larger share of the combined gain than other acquirers.

AN EXPLORATIVE EVENT STUDY OF LISTED PRIVATE EQUITY VEHICLES
JULY 2012 MATHIAS LETH NIELSEN 24
6.2.3. Complicating Issues
Several complications exist with respect to calculating LPEVs’ announcement return.
First and foremost, LPEVs’ announcement returns are influenced by partial anticipation,
as they are expected to conduct acquisitions on a frequent basis due to their business
model. Thus, the expected future profits from engaging in acquisitions should be incor-
porated in the stock price (Schipper & Thompson 1983; Malatesta & Thompson 1985;
Montgomery 1994). An abnormal return will therefore be triggered whenever the ex-
pected future profits from an acquisition differ from that of the average acquisition
(Montgomery 1994). Consequently, the abnormal return to LPEVs will not perfectly
reflect the value generated in acquisitions; it will only reflect the deviation from the
average expected value generation (Schipper & Thompson 1983). This implies that the
stock price reaction to the announcement of acquisitions by LPEVs is likely to underes-
timate the actual value generated from these acquisitions. Secondly, Phalippou (2010)
argues that large investors invest in unlisted PE, whereas small investors invest in LPE.
Small investors are not necessarily able to come up with reasonable market prices due to
their limited knowledge of this quite complex asset class. Thus, LPEVs might not be
efficiently priced14
. Based on these complications, the abnormal return to LPEVs is
likely to be smaller than that of other listed acquirers and more uncertain.
6.2.4. Expected Abnormal Return to Listed Private Equity Vehicles
Based on the three sections above, one is able to draw an inference about the expected
abnormal return to LPEVs. First of all, previous studies found that listed acquirers in
general earn insignificant or small positive abnormal announcement returns. Secondly,
they showed that the combined gains are not only larger in PE takeovers; PEVs are also
able to capture a larger share of the combined gains than other acquirers. This suggests
that LPEVs should earn higher abnormal returns than other acquirers. On the other
hand, announcements by LPEVs are partially anticipated. This suggests that the abnor-
mal returns are likely to be lower than that of other acquirers. Consequently, LPEVs are
expected to earn abnormal returns to the announcement of acquisitions which are larger
than or similar to those of other acquirers, i.e. larger than or equal to zero.
H1: CAAR to the announcement of acquisitions by LPEVs ≥ 0
14 This is not an issue in this study since LPEVs must fulfill strict requirements about e.g. trading volume and market
value to be included. For more information about the selection criteria please see section 8.1 and appendix 3.
AN EXPLORATIVE EVENT STUDY OF LISTED PRIVATE EQUITY VEHICLES
JULY 2012 MATHIAS LETH NIELSEN 25
6.3. Determinants of Abnormal Returns to LPEVs
Since Wood and Wright (2009) find that buyout performance is context specific, it
makes sense to investigate which contexts that are the most favourable for buyout per-
formance. According to Martynova and Renneboog (2011), the context can be described
by characteristics of the deal, the target, and the acquirer. Hence, the hypotheses will be
divided into these three categories in following sections.
6.3.1. Deal Characteristics
6.3.1.1. Deal Period
Several authors have highlighted the importance of the timing of deals (Andrade et al.
2001; Gottschalg et al. 2010; Acharya et al. 2011). The reasoning behind the im-
portance of timing is that abnormal PE returns and combined abnormal returns in
M&As have been declining over time (Martynova & Renneboog 2008; Acharya et al.
2011). In addition to this, booms result in increasing prices of targets (Gou et al. 2011)
and increasing risk of managerial hubris for acquirers (Martynova & Renneboog 2006,
2008). The empirical evidence of a timing effect is quite conclusive. Several authors
find that PE funds are good at timing their investments (Vinten & Thomsen 2008;
Kaplan & Strömberg 2009) and Gottschalg et al. (2010) show that 7% of the value gen-
eration in PE can be attributed to market timing. Besides the fact that returns decrease
over time, academics find mixed results of an economic cycle effect. A number of stud-
ies find that PEVs and their portfolio firms perform better during busts than during
booms (Kaplan & Schoar 2005; Achleitner et al. 2009, 2010), whereas other studies
find the opposite effect (Acharya et al. 2011; Martynova & Renneboog 2011). Only one
study (Gou et al. 2011) finds that the year has no impact on returns. Based on the dis-
cussion above, LPEVs are expected to experience declining announcement returns over
time, but the announcement returns are not expected to depend on the economic cycle.
H2: CAAR to LPE acquirers in 2001-2003 > CAAR to LPE acquirers in 2004-2008 >
CAAR to LPE acquirers in 2009-2012
6.3.1.2. Deal Size
The deal size has been increasing over time (Wright et al. 2006; Kaplan & Strömberg
2009; Gou et al. 2011) and has been suggested to influence the return to PE acquirers
(Cumming et al. 2007; Wood & Wright 2009). The reason is that large targets provide a
larger potential for corporate governance improvements since they have a more dis-
persed ownership structure (Faccio & Lang 2002), more complex management struc-
AN EXPLORATIVE EVENT STUDY OF LISTED PRIVATE EQUITY VEHICLES
JULY 2012 MATHIAS LETH NIELSEN 26
tures (Martynova & Renneboog 2011) and can bear more debt due to lower risk
(Achleitner et al. 2009). Furthermore, large portfolio firms are likely to receive more
attention from investment managers since they make up a larger share of the portfolio.
In addition to this, more information is available about large targets (Feito-Ruiz &
Menéndez-Requejo 2011). Thus valuation errors are smaller. The empirical evidence
provides significant support; large deals lead to lower abnormal returns to targets
(Bargeron et al. 2008; Officer et al. 2010), better operating performance (Martynova et
al. 2006), and higher PE returns (Loos 2005; Wright et al. 2006). Several studies find
that deal size does not matter or have a negative impact on announcement returns to
non-PE acquirers (Goergen & Renneboog 2004; Martynova et al. 2006; Feito-Ruiz &
Menéndez-Requejo 2011). However, this can most likely be attributed to their lower
ability to create corporate governance improvements. Only one PE study finds that val-
ue generation is independent of the deal size (Achleitner et al. 2009). Therefore, the
LPEVs are expected to earn higher abnormal returns in large deals than in small deals.
H3: CAAR to large acquisitions by LPEVs > CAAR to small acquisitions by LPEVs
6.3.1.3. Geographical Scope
With regards to the geographical scope we distinguish between domestic and cross-
border deals, where the former accounts for approximately 70% (Martynova &
Renneboog 2006, 2011; Humphery-Jenner et al. 2012), The geographical scope of a
deal can influence the abnormal return to the acquirer because it is easier to monitor and
control the target if the acquirer is located close to it and knows the local legislation
(Stotz 2011). In addition to this, the acquiring firm is likely to have a better domestic
network and have more information about domestic targets. This can lead to more pre-
cise valuations. The empirical evidence of the effect of geographical scope is ambigu-
ous. Some studies find that it has no impact on operating performance and abnormal
return to acquirers (Martynova et al. 2006; Martynova & Renneboog 2006; Feito-Ruiz
& Menéndez-Requejo 2011). Other studies find significantly higher returns to both ac-
quirers and targets in domestic deals (Conn et al. 2005; Francis et al. 2008; Martynova
& Renneboog 2011; Stotz 2011). Finally, Humphery-Jenner et al. (2012) study more
recent data and find that returns to acquirers are significantly higher in cross-border
deals. Based on this, the geographical scope is expected to have an impact of the ab-
normal return to LPEVs, although the direction is hard to predict.
H4: CAAR to LPEVs in domestic deals ≠ CAAR to LPEVs in cross-border deals
AN EXPLORATIVE EVENT STUDY OF LISTED PRIVATE EQUITY VEHICLES
JULY 2012 MATHIAS LETH NIELSEN 27
6.3.1.4. Type of Buyout
A buyout can be either insider driven (management buyouts) or outsider driven (man-
agement buy-ins and institutional buyouts). According to Wood and Wright (2009) the
return to PEVs differs significantly between different types of buyouts. The reason is
that insider driven buyouts might be able to exploit private information about the target
(Renneboog & Simons 2005). The empirical evidence is, however, mixed. Renneboog
and Simons (2005) find that acquirers pay lower premiums in insider driven buyouts.
This is supported by Loos (2005) who finds higher return to PEVs involved in insider
driven buyouts. In contrast, Berg and Gottschalg (2005) find no evidence of value gen-
eration from having inside information about the target and Renneboog et al. (2007)
find an insignificant difference in premiums across buyout structures. Based on this,
LPEVs involved in insider driven buyouts are expected to earn abnormal returns which
are larger than or equal to LPEVs involved in outsider driven buyouts.
H5: CAAR to insider driven LPEV buyouts ≥ CAAR to outsider driven LPEV buyouts
6.3.1.5. Degree of Control
The degree of control acquired in a deal determines the potential influence the acquirer
can exercise over the target. In order to exercise active ownership the LPEV needs a
certain control over the target. This can be accomplished by either acquiring the majori-
ty control alone or by teaming up with other PEVs in a club deal and acquiring a mi-
nority share. The issue has received little attention in literature since minority and par-
tial majority acquisitions are very uncommon in the U.K. and in the U.S. (Martynova &
Renneboog 2011). However, there has been a trend towards more club deals recently
(Officer et al. 2010). Empirical evidence shows that large majority investments (+75%)
and small minority investments (up to 25%) yield higher returns than partial majority
investments (Loos 2005; Martynova & Renneboog 2011). This is most likely caused by
a positive effect of club deals; Gou et al. (2011) find that club deals have higher returns
than other PE deals while Officer et al. (2010) find that targets earn lower abnormal
returns in club deals. Based on this discussion, LPEVs are expected to earn the same
average abnormal return to announcement of majority investments in targets as they are
to announcement of minority investments in targets.
H6: CAAR to majority investments by LPEVs = CAAR to minority investments by LPEVs

AN EXPLORATIVE EVENT STUDY OF LISTED PRIVATE EQUITY VEHICLES
JULY 2012 MATHIAS LETH NIELSEN 28
6.3.1.6. Type of Bid
A bid can either be made to the target’s management or board of directors or directly to
the shareholders of the target. The former is known as a friendly bid whereas the latter
is known as a hostile bid. Since friendly bids are perceived positively by the target, they
are likely to result in higher abnormal returns to acquirers than hostile bids (Feito-Ruiz
& Menéndez-Requejo 2011; Martynova & Renneboog 2011). Interestingly, Bargeron et
al. (2008) find that PE firms avoid hostile bids and argue that this could explain their
good performance. The empirical evidence about the type of bid is unambiguous.
Friendly bids result in significant positive abnormal returns to acquirers (Goergen &
Renneboog 2004; Feito-Ruiz & Menéndez-Requejo 2011), whereas hostile bids result in
either insignificant or significantly negative abnormal returns to acquirers (Goergen &
Renneboog 2004; Martynova & Renneboog 2011; Feito-Ruiz & Menéndez-Requejo
2011). Consequently, LPEVs are expected to earn higher abnormal returns when they
use friendly bids than when they use hostile bids.
H7: CAAR to friendly bids by LPEVs > CAAR to hostile bids by LPEVs
6.3.1.7. Means of Payment
Broadly speaking, a deal can either be paid with cash or equity. The means of payment
is likely to have an impact on the abnormal return due to signalling. Paying with equity
sends a negative signal to investors, since management will only pay with equity if it
believes that the company’s shares are overvalued (Martynova & Renneboog 2011).
The abnormal return to acquirers in an all-equity bid is therefore a mix of two adjust-
ments: one based on the negative signal of paying with equity and one based on the an-
nouncement of the acquisition. All-cash deals send the opposite signal and are thus ex-
pected to yield higher abnormal returns to acquirers than all-equity deals. This is sup-
ported by empirical evidence, which finds that all-cash deals yield positive abnormal
returns to acquirers, which are significantly higher than all-equity deals (Andrade et al.
2001; Martynova & Renneboog 2006, 2008, 2011). However, PEVs usually pay with
cash15
. Nonetheless, all-cash deals by LPEVs are expected to have higher abnormal re-
turns than all-equity deals.
H8: CAAR to all-cash deals by LPEVs > CAAR all-equity deals by LPEVs
15 Although LPEVs have the opportunity to pay with equity none has done so yet (Cheffins & Armour 2007).

AN EXPLORATIVE EVENT STUDY OF LISTED PRIVATE EQUITY VEHICLES
JULY 2012 MATHIAS LETH NIELSEN 29
6.3.2. Target Characteristics
6.3.2.1. Industry
According to Andrade et al. (2001) and Vinten and Thomsen (2008) M&As and PE
activity tend to cluster in different industries in different periods. This suggests that ab-
normal returns to acquirers might depend on the industry of the target. In addition to
this, leverage and ownership concentration differ across industries (Faccio & Lang
2002). This implies that the potential for corporate governance improvements differs
across industries. The empirical evidence provides significant support for the im-
portance of the target’s industry. Loos (2005) finds large variations in PE returns across
industries, while Cumming et al. (2007) show that PEVs perform better when targets
belong to industries with low operating risk. Furthermore, Gottschalg et al. (2010) find
that 31% of the return to PEVs stem from industry selection. Based on this, LPEVs are
expected to earn different abnormal returns depending on the industry of the target.
H9: The CAAR to LPE acquirers depends on the industry of the target
6.3.2.2. Legal Origin
The legal origin of the target refers to the legal system of the country of the target and
can be seen as a proxy for the corporate governance structure of the target. Legal sys-
tems originating in the U.K. are known as common law systems, whereas those origi-
nating in the Roman Empire are known as civil law systems (La Porta et al. 1998). The
U.K. and the U.S. have common law systems while Continental European countries
have civil law systems. Common law countries are characterized by more mature and
competitive takeover markets (Feito-Ruiz & Menéndez-Requejo 2011), more developed
capital markets (Wright et al. 2006) and a stronger legal protection of shareholders (La
Porta et al. 1998, 2008). Therefore, targets from common law countries are likely to be
more expensive. On the other hand, firms in common law countries are widely held,
whereas firms in civil law countries are usually family held (Faccio & Lang 2002).
Thus, the potential for corporate governance improvements is larger for targets in com-
mon law countries. However, the differences are likely to be decreasing due to the
emergence of pan-European merger laws (Renneboog & Simons 2005). The empirical
evidence is scarce. Martynova and Renneboog (2006) find that acquirers pay lower
premiums for Continental European targets than for U.S. and U.K. targets. Furthermore,
Humphery-Jenner et al. (2012) find that PE-related acquirers earn higher returns if the
target is located in a country with poor corporate governance. In contrast, Phalippou and

AN EXPLORATIVE EVENT STUDY OF LISTED PRIVATE EQUITY VEHICLES
JULY 2012 MATHIAS LETH NIELSEN 30
Gottschalg (2009) find that U.S.-focused PEVs show significantly higher performance
than EU-focused PEVs. Due to the ambiguity, emphasis is placed on the results from
Humphery-Jenner et al. (2012) as it comes closest to a study of LPE acquirers. Thus,
acquisitions of targets located in civil law countries are expected to yield higher abnor-
mal returns to LPEVs than acquisitions of targets located in common law countries.
H10: CAAR to acquisitions of targets from civil law countries by LPEVs > CAAR to ac-
quisitions of targets from common law countries by LPEVs
6.3.2.3. Former Ownership
The former ownership of the target is likely to have an impact on the abnormal return
since public and private targets differ on a number of parameters. Due to their more
concentrated ownership structure private targets provide less potential for corporate
governance improvements than public targets (Martynova & Renneboog 2005; Vinten
& Thomsen 2008). On the other hand, shares in private targets are illiquid and trade at a
liquidity discount (Martynova & Renneboog 2011). Furthermore, public targets are like-
ly to be more expensive since they receive more bids than private targets .The empirical
evidence uniformly favours private targets, although it suffers from a lack of PE studies.
Acquirers of private targets earn significant positive abnormal returns in the range 0.8%
to 1.48% (Martynova & Renneboog 2006; Faccio & Masulis 2006; Masulis, Wang &
Xie 2007), while acquisitions of public targets lead to insignificant returns (Faccio &
Lang 2002; Martynova & Renneboog 2006; Faccio & Masulis, 2005; Feito-Ruiz &
Menéndez-Requejo 2011). The difference is found to be statistically significant by all
reviewed studies. Therefore, LPEVs are expected to earn higher abnormal returns in
acquisitions of private targets than in acquisitions of public targets.
H11: CAAR to acquisitions of private targets by LPEVs > CAAR to acquisitions of pub-
lic targets by LPEVs
6.3.2.4. Leverage
As explained in chapter 5, leverage reduces agency costs and corporate taxes and is a
cornerstone in the PE model accounting for approximately 39% of the value generation
(Gottschalg et al. 2010). Since leverage increases to 60%-90% after the takeover (Fox
& Marcus 1992; Kaplan & Strömberg 2009; Talmor & Vasvari 2012), the pre-deal lev-
erage of the target is likely to affect the value that an LPE acquirer is able to generate.
However, the level of leverage used by PEVs has decreased since the 1980s (Gou et al.
2011). The empirical evidence of the leverage effect is mixed. Several studies find no

AN EXPLORATIVE EVENT STUDY OF LISTED PRIVATE EQUITY VEHICLES
JULY 2012 MATHIAS LETH NIELSEN 31
effect of pre-deal leverage on abnormal returns to targets (Marais et al. 1989; Bargeron
et al. 2008; Officer et al. 2010). On the other hand, Carow and Roden (1997) find that
highly leveraged targets earn lower abnormal returns in takeovers, while Gou et al.
(2011) find that targets with large increases in leverage after the takeover exhibit signif-
icantly better cash flow performance. However, PE acquirers seem to be paying a pre-
mium for less leveraged targets (Renneboog et al. 2007). Based on this, LPEVs are ex-
pected to earn abnormal returns in acquisitions of moderately leveraged targets that are
larger than or similar to those for acquisitions of highly leveraged targets.
H12: CAAR to acquisitions of moderately leveraged targets by LPEVs ≥ CAAR to acqui-
sitions of highly leveraged targets by LPEVs
6.3.2.5. Ownership Concentration
LPEVs improve monitoring and control of their portfolio companies through increasing
the concentration of ownership. Therefore, a low pre-deal ownership concentration will
imply a higher potential for value generation. Thus, targets with a dispersed ownership
structure are expected to yield higher returns to acquirers than targets with a concentrat-
ed ownership structure. The empirical evidence is rather limited. Wruck (1989) finds
that the value of the target increases with the concentration of ownership, given a cer-
tain threshold level, whereas Loos (2005) rejects that the pre-deal ownership concentra-
tion has any impact on returns. Therefore, the level of pre-deal ownership concentration
is not expected to have an impact on the abnormal return to LPEVs.
H13: The level of pre-deal ownership concentration does not affect the CAAR to LPEVs
6.3.2.6. Management’s Ownership
As explained in chapter 5, LPEVs generate value by e.g. improving the alignment of
interests between managers and owners. This is, among others, done by increasing man-
agements’ share of ownership in the firm. A low pre-deal management ownership will
therefore imply a higher potential for improving the alignment of incentives. The empir-
ical evidence is very unambiguous. Carow and Roden (1997) find that premiums in-
crease with pre-deal management ownership, while Renneboog et al. (2007) find that
PEVs pay higher premiums for targets with lower levels of management ownership and
Bargeron et al. (2008) find that premiums do not depend on pre-deal management own-
ership. To complete the ambiguity, Martynova and Renneboog (2006) find that acquir-
ers earn higher abnormal returns when target’s management has a high level of owner-
AN EXPLORATIVE EVENT STUDY OF LISTED PRIVATE EQUITY VEHICLES
JULY 2012 MATHIAS LETH NIELSEN 32
ship. To summarize, it seems like the level of management’s ownership in the target has
an effect on the abnormal return to LPEVs, but the direction is unclear.
H14: The level of management’s ownership in the target has an effect on the CAAR to
LPE acquirers
6.3.2.7. Type of Firm
The market-to-book ratio of the target is an indicator of whether the firm is a growth
firm or a value firm. Growth firms have market-to-book ratios above one, while value
firms have market-to-book ratios below one. The ratio might be an indicator of whether
a stock is overvalued. Since LPEVs generate value from e.g. financial arbitrage and
operational improvements, they are likely to perform better when they acquire value
firms. This is supported by the empirical evidence. PEVs seem to favour value firms,
since LBO targets have low market-to-book ratios (Renneboog & Simons 2005). Be-
sides this, acquisitions of value firms result in positive and significantly higher abnor-
mal returns to acquirers than acquisitions of growth firms (Goergen & Renneboog 2004;
Martynova & Renneboog 2006). Finally, Andrade et al. (2001) show that acquirers of
value firms perform significantly better in the three years following the announcement.
Therefore, LPEVs are expected to earn higher abnormal returns from acquisitions of
value firms than from acquisitions of growth firms.
H15: CAAR to LPE acquirers of value firms > CAAR to LPE acquirers of growth firms
6.3.3. Acquirer Characteristics
6.3.3.1. Structure
The structure of LPEVs was described in chapter 4. The structure determines how the
LPEVs are managed, how they invest, and what their cash flow structure looks like.
Therefore, the structure of the LPEVs is likely to have an impact on the abnormal re-
turns they earn to announcements of acquisitions. Unfortunately, the effect of the LPEV
structure on announcement returns has not been investigated yet. Thus, the hypothesis
will rely on information from chapter 3 and 4 along with empirical evidence about the
performance of PEVs.
Empirical evidence suggests that the value generated in PE goes to the management
firm and not to the LPs (Kaplan & Schoar 2005; Phalippou & Gottschalg 2009; Phalip-
pou 2010). Hence, the abnormal returns are likely to be larger for internally managed
LPEVs. In addition to this, abnormal returns only occur when acquisitions are signifi-
AN EXPLORATIVE EVENT STUDY OF LISTED PRIVATE EQUITY VEHICLES
JULY 2012 MATHIAS LETH NIELSEN 33
cantly better or worse than the average acquisition. Due to the fee structure, LPE firms
will gain from acquisitions which are significantly better than average, while they will
not suffer that much when the acquisitions are significantly worse than average, since
they would not get a share of the first 8% of the return16
. On the other hand, the effect of
an announcement of an acquisition is likely to be larger for directly exposed LPEVs
than for indirectly exposed LPEVs, since the performance of directly exposed LPEVs
depends more on the performance of the portfolio companies. Based on the discussion
above, it is therefore clear that the abnormal returns are expected to differ depending on
the LPEV structure, but it is unclear which structure that is superior.
H16: The structure of the LPEV has an effect on the CAAR to announcements of
acquisitions
6.3.3.2. Experience
As argued earlier, LPEVs are likely to outperform other types of acquirers due to their
experience in conducting acquisitions17
. Berg and Gottschalg (2005) suggest that value
generation in PE could stem from superior deal making capabilities and proprietary deal
flows due to their extensive networks. This is supported by Kaplan and Schoar (2005)
who find that established GPs have access to proprietary deal flows. The empirical evi-
dence uniformly supports experienced PEVs. Kaplan and Schoar (2005) show that older
and larger PEVs are less affected than young PEVs by new entrants, while other studies
find that older and experienced PEVs have higher returns than younger and inexperi-
enced PEVs (Gottschalg & Wright 2008; Phalippou & Gottschalg 2009; Acharya et al.
2011). Furthermore, PEVs raised in the 1980s have higher returns than PEVs raised in
the 1990s (Wood & Wright 2009). Finally, access to a proprietary deal flow and the
number of deals conducted has a positive impact on PE performance (Loos 2005).
Based on this, experienced LPEVs are expected to earn higher abnormal returns to the
announcement of acquisitions than inexperienced LPEVs.
H17: CAAR to experienced LPE acquirers > CAAR to inexperienced LPE acquirers
6.3.3.3. Investment Strategy
The investment strategy of a LPEV can either be specialization or diversification. Since
a LPEV can specialize within several areas, e.g. industry, size of the target, geography,
and buyout structure, and all of these areas are covered elsewhere, the investment strat-
16 See chapter 3 for more information about the fee structure in PE. 17 See chapter 5 for more information about how LPEVs generate value in acquisitions.

AN EXPLORATIVE EVENT STUDY OF LISTED PRIVATE EQUITY VEHICLES
JULY 2012 MATHIAS LETH NIELSEN 34
egy will only be examined on an overall level. The reasoning behind the effect of the
investment strategy is that specialization should enable the LPEV to generate more val-
ue, especially from operational improvements18
. Previous empirical M&A studies find
mixed results (Martynova et al. 2006; Martynova & Renneboog 2006, 2008, 2011;
Feito-Ruiz & Menéndez-Requejo 2011), while PE studies are relatively conclusive.
Loos (2005) and Pe’er and Gottschalg (2011) find that geographical specialization
yields higher returns to PEVs, while industry specialization has a negative impact on
returns (Loos 2005). Furthermore, both Cressy et al. (2007) and Kaplan and Strömberg
(2009) find that specialization increases operational performance and profitability of
LPEVs’ targets. Hence, specialized LPEVs are expected to earn higher abnormal returns
in acquisitions than diversified LPEVs.
H18: CAAR to acquisitions by specialized LPEVs > CAAR to acquisitions by diversified
LPEVs
6.3.3.4. Size
The size of the LPEV at the time of the acquisition can be a proxy for skills and hence
have an impact on the abnormal returns (Phalippou & Gottschalg 2009). In addition to
this, Martynova and Renneboog (2011) argue that size can be a proxy for the risk of
management hubris. It is, however, unlikely that LPEVs are exposed to the risk of man-
agerial hubris since their managers essentially own of the management firm. The empir-
ical evidence of the effect of size is inconclusive. Lerner (2007) and Gottschalg et al.
(2010) find that smaller funds outperform larger funds. However, a number of studies
find that PE performance increases with fund size (until a certain point) and that larger
PEVs have better returns than smaller PEVs (Kaplan & Schoar 2005; Loos 2005;
Phalippou & Gottschalg 2009; Acharya et al. 2011). Consequently, the size of the
LPEV at the time of the announcement of an acquisition is expected to have an impact
on the abnormal return, although the direction of the impact is unclear.
H19: The size of the LPEV at the time of the acquisition has an effect on the CAAR
6.3.3.5. Geographical Origin
The geographical origin of the LPEV might have an impact on its announcement return
due to differences in terms of e.g. legal origin19
, industries, taxation, M&A activity or
PE maturity. Especially the PE maturity is interesting, as more experienced LPEVs are
18 See section 5.2.2 for more information about operational improvements. 19 Due to the similarities in the governance structures of LPEVs, the literature regarding the legal origin of acquirers
has not been reviewed.

AN EXPLORATIVE EVENT STUDY OF LISTED PRIVATE EQUITY VEHICLES
JULY 2012 MATHIAS LETH NIELSEN 35
expected to earn higher abnormal returns. It is reasonable to expect that LPEVs in ma-
ture PE markets have been established earlier than LPEVs in immature PE markets.
Hence, we expect LPE acquirers in countries with mature PE markets, such as the U.S.
and the U.K., to earn higher CAARs than LPE acquirers in countries with less mature
PE markets, such as Continental European countries. The empirical evidence is fairly
inconclusive. Early studies find that U.S. PEVs outperform U.K. PEVs (Cumming &
Walz 2004) or that there are insignificant differences in returns to PEVs in different
regions (Loos 2005; Martynova & Renneboog 2006). More recent studies find that
Scandinavian acquirers earn CAARs which are significantly higher than that of acquir-
ers from other regions (Martynova & Renneboog 2011; Humphery-Jenner et al. 2012).
Based on the mixed empirical evidence, it is expected that the geographical location of
the LPEV has an effect on the abnormal return it earns in acquisitions, and that Scandi-
navian LPE acquirers earn higher CAARs than LPE acquirers from other regions.
H20: CAAR to Scandinavian LPEVs > CAAR to non-Scandinavian LPEVs
6.3.3.6. Management’s Background
As mentioned in chapter 4 one of the trends in PE is that PEVs are adding former ex-
ecutives and management consultants to their teams (Kehoe & Palter 2009; Bain & Co.
2012). Furthermore, both Loos (2005) and Acharya et al. (2011) suggest that the back-
ground of management has an impact on PE returns. The empirical evidence reveals
several interesting findings. First of all, Loos (2005) finds that investment managers
with a background in PE, banking, or corporate management perform well on an indi-
vidual basis, and that a higher share of PE and corporate management backgrounds in a
team also has a positive impact. Secondly, Acharya et al. (2011) find that partners with
operational backgrounds outperform partners with financial backgrounds in organic
deals and vice versa in inorganic deals. Thus, the background of management is ex-
pected to have an effect on the abnormal return to acquisitions by the LPEVs.
H21: The professional background of the management of a LPEV has an effect on the
CAAR it earns in acquisitions
6.3.3.7. Management’s Experience
Since the experience of the LPEV is expected to have a positive impact on abnormal
returns, the experience of the LPEV’s management is likely to have a similar impact.
More experienced managers have larger networks and more deal experience, but none
of these factors has an impact on PE returns (Loos 2005). In addition to this, Loos

AN EXPLORATIVE EVENT STUDY OF LISTED PRIVATE EQUITY VEHICLES
JULY 2012 MATHIAS LETH NIELSEN 36
(2005) finds that more experience20
in general leads to lower returns. Likewise, Acharya
et al. (2011) find no difference in PE returns between experienced and inexperienced
partners. Based on this, the experience of a LPEV’s management is not expected to have
an impact on the abnormal return it earns to the announcement of acquisitions.
H22: The experience of the LPEV’s management has no effect on the CAAR it earns in
acquisitions
6.4. Sub Conclusion
Summing up, this chapter has developed 22 hypotheses about the abnormal return to
announcement of acquisitions by LPEVs. Based on this, we expect that LPEVs generate
non-negative abnormal returns to their shareholders upon the announcement of acquisi-
tions, and that these returns depend on certain deal, target, and acquirer characteristics.
7. HYPOTHESES
Since it is outside the scope of the thesis to test all of the 22 hypotheses, this chapter
will prioritize them, in order to end up with a limited number of highly relevant hypoth-
eses. In addition to this, the measurement of the selected hypotheses will be discussed in
order to ensure their validity.
7.1. Presentation and Selection of Hypotheses
The hypotheses have been evaluated against three criteria. The first criterion is that the
hypothesis is relevant in an LPE perspective (C1). Secondly, previous studies need to
provide fairly conclusive results (C2). Third, it is a requirement that the hypotheses can
be tested based on the available dataset (C3). If a hypothesis satisfies all three require-
ments it is selected for further analysis (S). The evaluation can be seen from exhibit 7.1.
From the literature review it was evident that LPEVs avoid hostile bids and primarily
use cash as the means of payment. H7: Type of Bid and H8: Means of payment are there-
fore eliminated based on the first criterion. The second criterion is evaluated based on
the findings in the literature review. Previous empirical evidence provides fairly conclu-
sive results for 11 of the 20 remaining hypotheses. Thus, nine of the hypotheses are
eliminated based on the second criterion. Next, the 11 hypotheses are evaluated against
the third criterion, i.e. that they are testable based on the available dataset. The dataset is
described in detail in chapter 8, so for now we will only focus on the information con-
20 Measured by the average of age, tenure and PE experience.

AN EXPLORATIVE EVENT STUDY OF LISTED PRIVATE EQUITY VEHICLES
JULY 2012 MATHIAS LETH NIELSEN 37
tained in the dataset. From the dataset information about the necessary inputs is availa-
ble for nine of the 11 hypotheses. Unfortunately, there is no information about the in-
puts for H15: Type of Firm and H22: Management’s Experience. Based on the three-step
procedure nine hypotheses are therefore selected for further research.
Exhibit 7.1 - Prioritization of Hypotheses
No. Type Name Hypothesis about CAAR C1 C2 C3 S
H1 Overall Overall CAAR ≥ 0 Yes Yes Yes Yes
H2 Deal Period 2001-2003 > 2004-2008 > 2009-2012 Yes Yes Yes Yes
H3 Deal Size Large acquisitions > Small acquisitions Yes Yes Yes Yes
H4 Deal Geographical Scope Domestic deals ≠ Cross-border deals Yes No Yes No
H5 Deal Type of Buyout Insider driven buyouts ≥ Outsider driven buyouts
Yes No No No
H6 Deal Degree of Control Majority investments = Minority investments Yes No Yes No
H7 Deal Type of Bid Friendly bids > Hostile bids No Yes No No
H8 Deal Means of Payment All-cash deals > All-equity deals No Yes No No
H9 Target Industry The industry of the target has an effect Yes Yes Yes Yes
H10 Target Legal Origin Civil law targets > Common law targets Yes Yes Yes Yes
H11 Target Former Ownership Private targets > Public targets Yes Yes Yes Yes
H12 Target Leverage Moderately leveraged targets ≥ Highly lever-
aged targets
Yes No No No
H13 Target Ownership Concentration The level of pre-deal ownership concentration
does not have an effect
Yes No No No
H14 Target Management’s Ownership The level of management’s ownership in the
target has an effect
Yes No No No
H15 Target Type of Firm Value firms > Growth firms Yes Yes No No
H16 Acquirer Structure* The LPEV structure has an effect Yes - Yes Yes
H17 Acquirer Experience Experienced LPEVs > Inexperienced LPEVs Yes Yes Yes Yes
H18 Acquirer Investment Strategy Specialized LPEVs > Diversified LPEVs Yes Yes Yes Yes
H19 Acquirer Size The size of LPEVs has an effect Yes No Yes No
H20 Acquirer Geographical Origin Scandinavian LPEVs > Non-Scandinavian
LPEVs
Yes No Yes No
H21 Acquirer Management’s Back-
ground
The background of the LPEV’s management
has an effect
Yes No No No
H22 Acquirer Management’s Experience The experience of the LPEV’s management
has no effect
Yes Yes No No
Notes: CAAR is the CAAR to LPE acquirers. “C1” means criterion 1 (the hypothesis is relevant in an LPE perspective), “C2” means criterion 2 (previous literature provides clear results), and “C3” means criterion 3 (the hypothesis is testable based on the
dataset). “S.” means that the hypothesis is selected for further analysis. *No studies have been conducted within the impact of
LPEV structure on the CAAR. Hypotheses in italics are the ones chosen for further analysis.
7.2. Specification of Hypotheses
In order to test the selected hypotheses, one needs to specify how they will be measured
and assess whether the measures are valid, i.e. whether they measure what they are sup-
posed to measure. To simplify the notation, the hypotheses have been renumbered as
H1-H9.
AN EXPLORATIVE EVENT STUDY OF LISTED PRIVATE EQUITY VEHICLES
JULY 2012 MATHIAS LETH NIELSEN 38
H1: Overall CAAR is measured as the cumulative average abnormal return (CAAR),
which is the predominant measure of abnormal returns to announcement of acquisitions
in literature. CAAR is a measure of the announcement return and hence a measure of
the change in investors’ expectations regarding the LPEV’s future profits21
. As ex-
plained in section 6.2.3., the CAAR of LPEVs is not directly comparable to that of other
listed acquirers, mainly due to partial anticipation. Furthermore, for other listed acquir-
ers, the means of payment in an acquisition provides a signal about their view of their
stock price. Since LPEVs almost always pay with cash, and never with shares, their
CAARs are not biased by signalling. Based on the above, CAAR seems to measure
what it is supposed to measure; namely the change in investors’ expectations about the
LPEVs’ profits as a result of announcements of acquisitions.
H2: Deal Period is measured by the year in which the deal is announced. The years are
divided into three periods: 2001-2003, 2004-2008, and 2009-2012. The periods are di-
vided in this way due to the fact that there was a boom in PE buyouts from 2004 to 2008
(Talmor & Vasvari 2012)22
. The aim of this measure is to measure whether CAAR is
declining over time. However, some studies argue that the return depends on the eco-
nomic cycle. Thus, deal period is potentially not just a measure of time, but also of the
economic cycle. Fortunately, one will be able to get an idea about the impact of the eco-
nomic cycle due to the three-period division outlined above; 2004-2008 is a period of
economic boom, while the other two are periods with modest economic growth.
H3: Deal Size is measured as the ratio of deal value to the market value of the LPEV at
the announcement date. Usually the maximum of a PE fund’s committed capital that
can be invested in a single portfolio company is 15% (Talmor & Vasvari 2012). The
fund size is approximated by the market value (MV) of the LPEV. Therefore deals that
account for more than 10% of the LPEV’s MV are categorized as large deals, whereas
deals that account for 10% or less of the LPEV’s MV are categorized as small deals.
The MV of LPEVs is not a perfect approximation of the fund size, since a) LPEVs usu-
ally trade at a NAV discount (Phalippou 2010), b) sometimes only part of the underly-
ing PEV is listed (Cheffins & Armour 2007), and c) LPEVs can have investments in
several funds. Thus, the MV of a LPEV provides only a rough estimate of the fund size.
21 The measurement of CAAR is explained in detail in chapter 9. 22 See appendix 2 for an overview of the M&A activity from 2002 to 2012.

AN EXPLORATIVE EVENT STUDY OF LISTED PRIVATE EQUITY VEHICLES
JULY 2012 MATHIAS LETH NIELSEN 39
Alternatively, the LPEV’s assets under management could have been used, but such
information was unfortunately not available from the dataset.
H4: Target Industry is measured by the target’s two-digit U.S. SIC code. The two-digit
U.S. SIC code provides the most overall industry classification. Based on this, the sam-
ple is divided into the following categories: “Mining & Construction”, “Manufactur-
ing”, “Transportation, Communications, Electric, Gas and Sanitary Services”, “Whole-
sale & Retail Trade”, “Finance, Insurance & Real Estate”, and “Services”23
. Since U.S.
SIC codes are a common measure for industry in the reviewed studies (e.g. Gou et al.
2011), and since they are provided by the U.S. government, the measure is evaluated to
have a satisfactory validity.
H5: Target Legal Origin is measured by the country of the target. Following La Porta et
al. (1998), Continental European countries are classified as civil law countries, while
the U.S. and the U.K. are classified as common law countries. The legal origin is a
measure of the corporate governance system in the country of the target – common law
countries generally have a stronger corporate governance system than civil law coun-
tries (La Porta et al. 1998, 2008). However, countries might differ on other parameters
than the corporate governance system, e.g. the major industries might differ. Hence, the
country of the target might potentially be a measure of more than just the corporate
governance system.
H6: Target Former Ownership is measured by whether the target was listed or unlisted.
Listed targets are classified as public, while unlisted targets are classified private. It is
therefore an unbiased measure of former ownership. However, former ownership is a
proxy for the ownership concentration (Vinten & Thomsen 2008) and, hence, a proxy
for the governance structure. Thus, one cannot say whether a potential effect is due to
the pre-deal ownership concentration or due to the pre-deal governance structure.
H7: LPEV Structure is measured by the PE category. LPEVs categorized as ‘Direct
private equity’ are classified as direct, whereas LPEVs categorized as ‘Private equity
fund managers’ are classified as indirect. Thus, the LPEV structure is a measure of the
degree of diversification offered by the LPEV (cf. section 4.2). It is noteworthy that
scholars are not consistent in their classification of the LPEVs; e.g. Apollo Investment
23 The reader might notice that some of the industry categories differ slightly from the ones provided by the US Gov-
ernment. The reason is that some of the categories have been merged in order to obtain a meaningful sample size.
AN EXPLORATIVE EVENT STUDY OF LISTED PRIVATE EQUITY VEHICLES
JULY 2012 MATHIAS LETH NIELSEN 40
Corp. is classified as a LPE fund by Lahr and Herschke (2009), but as an investment
company by Talmor and Vasvari (2012). Therefore, the classification in this study is
based on LPX Group (2012c), which classifies the LPEVs based on a thorough and con-
tinuous review of their activities. This ensures a high validity of the measurement.
H8: LPEV Experience is measured by the date of incorporation of the vehicle underly-
ing the LPEV. These dates are provided by Zephyr. Based on Wood and Wright (2009),
vehicles incorporated before 1990 are classified as experienced, while vehicles incorpo-
rated from 1990 and onwards are classified as inexperienced. However, as older LPEVs
are more likely to have access to proprietary deal flows (Kaplan & Schoar 2005), the
date of incorporation is also a measure of the access to a proprietary deal flow. Alterna-
tively, the experience of the LPEVs could have been measured by the number of deals
they have conducted or by their age at the announcement date. However, the former
would be a biased measure of experience since larger LPEVs are likely to conduct more
acquisitions and the latter is complicated by wide dispersion of the age of the vehicles.
H9: LPEV Investment Strategy is measured by the industry focus. LPEVs are classified
as specialized if they focus on specific industries such as ‘IT’ or ‘Cleantech’. Otherwise
they are classified as diversified. The investment strategy is only measured on the in-
dustry dimension and not on other dimensions such as geography, deal size or the type
of firms. Thus, the industry focus is not a complete measure of the LPEV’s investment
strategy. It is, however, one of the most popular measures of investment strategy (see
e.g. Cressy et al. 2007). Hence, it has a satisfactory validity.
7.3. Sub Conclusion
To summarize, part 2 has investigated how LPEVs generate value in acquisitions and
reviewed the relevant literature within M&A, PE and LPE. On the basis of this, 22 hy-
potheses were developed, of which nine were selected for further analysis. The nine
hypotheses concern; 1) the overall abnormal return, 2) the deal period, 3) the deal size,
4) the industry of the target, 5) the legal origin of the target, 6) the former ownership of
the target, 7) the structure of the LPEV, 8) the experience of the LPEV and 9) the in-
vestment strategy of the LPEV. These hypotheses will be tested in part 3, which con-
sists of chapter 8-10. Chapter 8 will outline the sample selection and present descriptive
statistics, while chapter 9 will discuss the methodology used for testing the hypotheses.
Finally, chapter 10 will discuss the empirical findings.

AN EXPLORATIVE EVENT STUDY OF LISTED PRIVATE EQUITY VEHICLES
JULY 2012 MATHIAS LETH NIELSEN 41
8. DATA AND SAMPLE
The sample selection process is a vital part of the study, since the quality of the data is a
key determinant of the validity of the results. This chapter will therefore outline the se-
lection process and present descriptive statistics of the sample.
8.1. Sample Selection
The LPEVs are identified based on the LPX Composite as of May 20th
2012 (LPX
Group 2012c)24
. Only LPEVs which are based in Europe or the U.S., are categorized as
either ‘Direct private equity’ or ‘Private equity fund manager’, and have an investment
style categorized as either ‘Buyout’ or ‘Growth’ are included in the sample. This gives a
list of 41 LPEVs. Information about their announcement of deals is obtained from
Zephyr, while information about security prices and market indexes is obtained from
Datastream. This procedure yields an initial sample of 495 deals. The use of the LPX
Composite and Zephyr might bias the sample towards a higher share of European deals,
since both data providers (the LPX Group and Bureau van Dijk) are from Europe. In-
stead one could have used U.S.-based sources such as the S&P’s Listed Private Equity
Index, VentureXpert and Dealogic. However, both the LPX Composite and Zephyr are
widely used in LPE studies (see e.g. Bilo et al. (2005), Bergmann et al. (2009), and
Müller and Vasconcelos (2010)). Thus, it is not expected to impose a significant bias.
The next step in the selection process is to impose a number of requirements25
which the
deals have to satisfy in order to guarantee a high quality of the data. The focus of the
study is European and U.S. deals. Hence, targets and LPEVs must be located in Europe
or the U.S. Besides this, one must ensure that the effect of the announcement is not di-
luted. Therefore, only completed deals where the rumour date is the same as the an-
nouncement date, and where the LPEV is stated as the primary acquirer, are included.
Furthermore, deals must have an ISIN number and a deal value of more than USD 1
million. Finally, daily returns need to be available from Datastream for the market index
during the entire period – this excludes deals announced earlier than December 31 2001.
To ensure that the sample provides the necessary inputs for the hypotheses, we only
include deals where the target has a U.S. SIC code and where the former ownership of
the target is known. Secondly, deals are excluded when the LPEV’s date of incorpora-
24 LPX’s requirements for including a LPEV are that a) minimum 50% of the net assets are invested in PE and b) that
the LPEV must be listed. In addition to this, a number of liquidity requirements must be satisfied (LPX Group 2011). 25 See exhibit A.3 in appendix 3 for an overview of the sample selection process.

AN EXPLORATIVE EVENT STUDY OF LISTED PRIVATE EQUITY VEHICLES
JULY 2012 MATHIAS LETH NIELSEN 42
tion is unknown and when the vehicle was not listed at the time of the announcement.
Third, in order to ensure unbiased event windows, only one announcement is allowed in
the event window and the LPEVs are only allowed to invest in the target once.
To comply with other LPE studies, the liquidity requirements suggested by Bilo et al.
(2005) are imposed on the sample when they are relevant. Bilo et al. (2005) recommend
that LPEVs must have a minimum average trading volume26
of 0.1% per week. Howev-
er, this requirement is too strict as several of the LPEVs trade at small stock exchanges.
Instead, the trading volume requirement is based on Bartholdy et al. (2007), which re-
quire that a stock listed on a small stock exchange must be traded at least 80% of all
trading days. Following Bilo et al. (2005) only deals where the LPEV has an average
market value above USD 2 million and a relative bid-ask spread27
of maximum 20%
during the combined estimation and event period are included. Finally, the sample is
trimmed and the 1.25% most extreme observations in each tail are removed as recom-
mended by e.g. Campbell et al. (2010). Thus, the final sample contains 129 deals28
.
8.2. Descriptive Statistics
The 129 deals are conducted by 18 different LPEVs29
. The majority of the LPEVs are
European and organized as LPE funds. In addition to this, most of the LPEVs are
founded before 1990 and have a diversified investment strategy. Interestingly, 3i Group
PLC accounts for nearly 60% of the deals30
. Thus, the results in chapter 10 are reported
for two samples; the total sample and a sample excl. 3i Group. According to Kasper
Hansen (Associate Director from 3i Group interviewed May 16th
2012), 3i Group is a
LPE fund from 1973 with a diversified investment strategy. It is listed on the London
Stock Exchange and has the highest market value of the all the LPEVs. The average
market value of the LPEVs at the time of acquisition is USD 4.7 billion, but only USD
1.1 billion when 3i Group is excluded.
The targets in the sample are primarily private companies (96.7%) within services
(46.5%) or manufacturing (28.7%). These results are comparable to those found in e.g.
26
(Bilo et al. 2005).
27
(Bilo et al. 2005).
28 See appendix 4 for a list of the 129 deals. 29 See appendix 5 for an overview of the descriptive statistics of the sample. 30 Due to its age and size, 3i Group is dominating samples on LPE deals. Müller and Vasconcelos (2010) report that
3i Group accounts for 54% of the deals in their sample and hence choose to report separate results. The same is done
in this study.

AN EXPLORATIVE EVENT STUDY OF LISTED PRIVATE EQUITY VEHICLES
JULY 2012 MATHIAS LETH NIELSEN 43
Gottschalg et al. (2010). 38.8% of the targets are from common law countries, while
61.2% are from civil law countries. The most common countries of origin for the targets
are the U.K., the U.S., France, Spain, and Germany.
The deals span from 2001 to 2012, with about two thirds being conducted between 2004
and 2008. It thus seems that the sampled deals are fairly representative of the overall
M&A market31
. Furthermore, most of the deals employ cash as the means of payment.
The average deal size is USD 55 million, which is fairly small compared to an average
deal size of USD 126 million for the M&A market in general in the same period. In ad-
dition to this, only 10.9% of the deals have a size corresponding to more than 10% of
the LPEV’s market value at the time of the announcement. Compared to former studies
such as Humphery-Jenner et al. (2012), the sample includes a quite high share of cross-
border deals (58.1%). The reason is that most of the LPEVs are European, and Europe-
an acquirers tend to have a high share of cross-border deals. Finally, all the deals are
outsider-driven. Thus, there is no bias from insider-driven deals in the sample.
9. METHODOLOGY
Having outlined the sample and how it was selected, this chapter will explain the event
study methodology and discuss the different test statistics and their performance.
9.1. Introduction
Event studies are used to measure the effect of an economic event on the value of a
company (Campbell et al. 1997). The event study methodology as we know it today
was developed by Fama, Fisher, Jensen and Roll (1969) and has only been slightly up-
dated since32
. It consists of a seven step procedure where one must; define the event,
select the sample, determine the measurement of abnormal return, outline a procedure
for estimating the abnormal return, outline a procedure for testing the hypotheses, pre-
sent the empirical results, and interpret them (Campbell et al. 1997).
9.2. Definition of the Event
In order to investigate the effect of an event, it is necessary to clearly define what the
event is. In this study the event of interest is the announcement of an acquisition by a
LPEV. In order to measure the effect of the event, one must define the event window.
31 For a comparison, see exhibit A.2 in appendix 2 and exhibit A.5.1 in appendix 5. 32 E.g. by Brown and Warner (1980, 1985).
AN EXPLORATIVE EVENT STUDY OF LISTED PRIVATE EQUITY VEHICLES
JULY 2012 MATHIAS LETH NIELSEN 44
The event window must be as narrow as possible in order to avoid distortion from e.g.
releases of other news. On the other hand, it must be wide enough to capture the effect
of the event, even if it is announced after trading closes. Therefore, the study will use an
event window of ± one trading day around the event (i.e. a 3-day event window) as rec-
ommended by e.g. Park (2004), Bartholdy et al. (2007), and Campbell et al. (2010). We
will define the event day as = 0, the first day of the event window as = T1 + 1, and
the last day of the event window as = T2, where is a measure of event time. The
length of the event window can then be defined as L2 = T2-T1 (Campbell et al. 1997).
One could have used more than one event window in order to analyse whether the ab-
normal return is captured (Campbell et al. 2010; Kolari & Pynnonen 2011). That is,
however, outside the scope of this thesis.
9.3. Estimation of Abnormal Return
To enable measurement of the effect of an event one needs to define the dimension
along which the effect is measured. This includes a number of choices. First, the meas-
urement of return needs to be decided upon. In general, we distinguish between measur-
ing returns as simple returns (9.1) and log returns (9.2);
(
) , (9.1)
, (9.2)
where rit and Rit are the simple return and the log return from holding security i from
period t-1 to period t. Pit and Pit-1 are the closing prices for security i at time t and time t-
1 respectively. Log returns are also known as continually compounded returns and have
several advantages (Campbell et al. 1997). One of the main advantages is that the multi-
period log return is simply the sum of the one-period log returns. In addition to this, log-
transformation increases the normality of the returns and eliminates negative values
(Henderson 1990). This is very important in our case for two reasons. First, much of the
event study methodology relies on the assumption of normal distributed returns33
. Se-
cond, Brown and Warner (1985) show that daily abnormal returns tend to be right
skewed. Therefore, log returns will be used going forward.
33 See section 9.4 for more information about the assumptions and appendix 7 for a test of the assumptions.

AN EXPLORATIVE EVENT STUDY OF LISTED PRIVATE EQUITY VEHICLES
JULY 2012 MATHIAS LETH NIELSEN 45
Secondly, the abnormal return must be defined. The normal return is the return which
would be expected if the event did not occur. The abnormal return is the difference be-
tween the actual return and the expected normal return (MacKinlay 1997). It follows
that in order to estimate the abnormal returns one must estimate the expected returns.
This requires one to choose an estimation model. Here we distinguish between four dif-
ferent models: 1) the constant-mean-return model, 2) the market model, 3) factor mod-
els, and 4) the market-adjusted-return model. The constant-mean-return model assumes
that the expected return is constant through time whereas the market model assumes that
there is a linear relationship between market return and the return of security (MacKin-
lay 1997). The market model is defined as follows:
, (9.3)
where Rit and Rmt are the returns for period t for security i and the market index. εit is the
error term for security i for period t and is expected to be mean zero and have a variance
equal to . Compared to the constant-mean return model, the market model is better
since is removes the part of the return that is related to variation in the market’s return.
This decreases the variance of the abnormal returns (Campbell et al. 1997). The market
model is based on a single factor, namely the market return. Factor models include oth-
er factors than the market return as explanatory variables as well, such as exchange
rates. According to Campbell et al. (1997) the gains from employing multifactor models
are limited, since the marginal explanatory power is small. The market-adjusted-return
model is essentially a restricted form of the market model with αi=0 and βi=1. It is used
when we have no estimation period, or when we do not want to use the estimation peri-
od for estimating the expected returns (Campbell et al. 1997). However, Campbell et al.
(1997) argue that one should only use restricted models as a last resort. Based on this, as
well as the facts that the market model is better than the constant-mean-return model
and that the gains from employing multifactor models is limited, the market model is
chosen as the estimation model. Thus, we can define the expected return as:
| (9.4)
The abnormal return can therefore be defined as:
| (9.5)

AN EXPLORATIVE EVENT STUDY OF LISTED PRIVATE EQUITY VEHICLES
JULY 2012 MATHIAS LETH NIELSEN 46
Since the abnormal return is measured over an event window, which comprises several
days, we accumulate the returns and get a measure of the cumulative abnormal return
(CAR) for the individual security across time.
∑ (9.6)
When we investigate the effect of the announcement of acquisitions by LPEVs, we want
to investigate this effect not only across time, but also across securities. Thus, we calcu-
late the average of the CAR for the individual securities. This measure is called the cu-
mulative average abnormal return (CAAR) and is calculated as:
∑
(9.7)
Now, the only thing we lack in order to estimate the abnormal returns is a measure of
Rmt. The market return is measured by the return on a reference (market) index. If one
has securities from more than one country, as is the case for this study, one can choose
between global, regional, or national indices. Besides this, one must choose whether to
use value- or equal-weighted indices and whether to use local or global currency market
indices. Finally, one must choose which index provider to use. Several authors have
discussed which type of market indices to use in multi-country event studies (Park
2004; Campbell et al. 2010). Campbell et al. (2010, p. 3078) argue that “… local-
currency market-model abnormal returns using national market indexes are sufficient.”
In addition to this, value-weighted indices most appropriately reflect the total market
performance (Henderson 1990). For these reasons national MSCI local-currency, value-
weighted indices are used as reference indices for the market return.
In order to estimate the parameters of the market model we need to define an estimation
period. To avoid seasonality, an estimation period of 250 trading days is often recom-
mended since it approximately corresponds to the number of trading days in a calendar
year (see e.g. Campbell et al. (2010) and Corrado (2011)). Some authors argue that the
estimation period should end a number of days prior to the first day of the event win-
dow in order to avoid that information leaks prior to the event affects the estimation
period (Park 2004; Campbell et al. 2010; Corrado 2011). Due to the very private nature
of PE, information leaks prior to the announcement are not expected to occur, and there-
fore the estimation period will end the day before the first day of the event window.
AN EXPLORATIVE EVENT STUDY OF LISTED PRIVATE EQUITY VEHICLES
JULY 2012 MATHIAS LETH NIELSEN 47
Formally, we can therefore define the estimation period as the period from = T0+1 to
= T1 with a length of L1 = T1-T0.
In order to ensure that the estimation period is unbiased, one normally needs to exclude
events, where the same type of event occurred during the estimation period. In the case
where announcement of events lead to abnormal returns, inclusion of events in the esti-
mation period imply that the estimation period is contaminated. This will bias the ex-
pected returns upwards and hence bias the abnormal returns in the event window
downwards. The idea behind event studies is that the event is unexpected and hence
surprises investors. Thereby it makes them incorporate the new information into their
information set and adjust the value of the stock. However, as explained in section 6.2.3
LPE acquisitions are partially anticipated and thus only lead to minor adjustments of the
stock price of the LPEV. Based on this, the inclusion of announcements of acquisitions
in the estimation period is not expected to impose any significantly bias on the estimat-
ed expected returns.
9.4. General Testing Procedure
Step number five in the event study is to specify the testing procedure. This includes
defining the null hypotheses, specifying the test statistics and evaluating their perfor-
mance. The hypotheses which we want to test (the alternative hypotheses) were speci-
fied in chapter 7, while the null hypotheses are still to be specified. Here it is important
to distinguish between the two types of tests we run. First of all, it is analysed whether
CAAR is different from zero, corresponding to the following null hypothesis:
H0x: CAAR = 0 (9.8)
Secondly, it is analysed whether the CAAR differs depending on certain deal, target,
and acquirer characteristics. This is analysed by dividing the sample into smaller sub-
samples and then testing whether the CAAR differs between these groups. Based on the
literature review we know, for most of the groups, which of the two groups that is ex-
pected to have the highest CAAR. Hence, the null hypothesis is the following;
H0y: CAAR to group 1 ≤ CAAR to group 2, (9.9)
for all the hypotheses except for the hypotheses about the deal period, the industry of
the target and the structure of the LPEV. In these cases the null hypothesis is
AN EXPLORATIVE EVENT STUDY OF LISTED PRIVATE EQUITY VEHICLES
JULY 2012 MATHIAS LETH NIELSEN 48
H0z: CAAR to group 1 = CAAR to group 2 (9.10)
Having defined the hypotheses, it is now time to discuss the test statistics. Inspired by
Bartholdy et al. (2007) a battery of nine test statistics is used for the analysis of whether
CAAR is different from zero. Each test statistic will briefly be discussed below34
. The
battery includes both parametric and nonparametric tests, as well as tests that correct for
event-induced variance. This is done in order to increase the robustness of the conclu-
sions (Campbell et al. 1997).
Parametric tests usually take some form of a t-test for differences in means and rely on
three assumptions: the abnormal returns must be normally distributed, have a constant
variance and be uncorrelated across securities35
. When these assumptions are fulfilled,
parametric tests have more power than nonparametric tests. Three parametric tests will
be presented below. They differ by the way the correct for problems inherent in the data
and the degree to which certain assumptions have to be fulfilled in order for them to
obtain a decent performance.
T1 relies on the assumption that the abnormal returns are independent across all securi-
ties in the sample. The test statistic divides the CAAR by its standard deviation, which
is derived from the variance of the abnormal returns of the individual securities during
the estimation period (Bartholdy et al. 2007).
T1 adjusted with adjusted cross-sectional independence applies the so-called Patell ad-
justment (Patell 1976). The reason is that the abnormal returns are forecasts from the
market model. Therefore, one needs to adjust the standard deviation from T1 for the
variance of the forecast error. This is what the Patell adjustment does. The adjustment
factor depends on the number of observed returns during the estimation period; the larg-
er the number of observed returns, the lower the adjustment (Bartholdy et al. 2007).
Since quite strict liquidity requirements were imposed during the sample selection, the
adjustment factor will be relatively small for our sample.
T2 is a t-statistic which standardizes the abnormal returns by scaling them with their
standard deviation (Bartholdy et al. 2007). Thus, it reduces the bias from outliers and
ensures that high abnormal returns will have less weight if the security had a high
standard deviation.
34 See appendix 6 for a specification of the test statistics used in the event study. 35 See appendix 7 for a test of the assumptions.

AN EXPLORATIVE EVENT STUDY OF LISTED PRIVATE EQUITY VEHICLES
JULY 2012 MATHIAS LETH NIELSEN 49
T3 differs from T2 by including Patell’s adjustment. Thus, the standard deviation is
adjusted for the variance of the forecast errors. Besides this, it is equal to T2.
Nonparametric tests are used when the data is ordinal or when the assumption of nor-
mality is unsatisfied (Keller, 2005). Instead of analysing the difference in means, non-
parametric tests analyse whether the locations of the populations differ. The advantage
of nonparametric tests is that they are free of specific assumptions about the distribution
of the returns (Campbell et al. 1997)36
. This implies that they can be used to analyse
samples with quite few observations. Three nonparametric tests are used in this study.
T4 is a rank test. It converts the abnormal returns into a uniform distribution and assigns
a rank to each return. The rank is standardized, since we know that the security will not
be trading all trading days (Corrado & Zivney 1992). The expected rank (0.5) is then
subtracted from the rank of each security and the sum of these differences is divided by
the standard deviation of the ranks to get the test statistic (Bartholdy et al. 2007).
T5 is a sign test and works by converting the abnormal returns into nominal data. It re-
lies on the assumption that abnormal returns are independent across securities and that
the probability of observing either a positive or a negative abnormal return is 0.5 respec-
tively (Campbell et al. 1997). This implies that the sign test might be poorly specified
when the distribution of the abnormal returns is skewed, since the expected proportion
of positive abnormal returns in this case will be different from 0.5 (Campbell et al.
1997). If the probability of observing either a positive or a negative abnormal return is
0.5, then the expected sign of the abnormal return will be zero. The sign test therefore
analyses whether the average observed sign is different from zero.
T6 is a generalized sign test. Instead of assuming that the probability of observing either
a positive or negative abnormal return is 0.5 respectively, T6 estimates the probability
from the estimation period (Bartholdy et al. 2007). The test then compares the propor-
tion of positive abnormal returns during the event window with the proportion of posi-
tive abnormal returns during the estimation period (Renneboog et al. 2007).
Event-induced variance tests are employed in the case where the variance changes
around the event day. An increase in the variance will cause the expected standard devi-
ations based on the estimation period to underestimate the standard deviation in the
36 Therefore, nonparametric tests are also known as distribution-free tests (Keller 2005).

AN EXPLORATIVE EVENT STUDY OF LISTED PRIVATE EQUITY VEHICLES
JULY 2012 MATHIAS LETH NIELSEN 50
event window. Hence, the test statistics will be upward biased. Due to the fact that an
event gives investors new information, and investors react to new information cf. the
EMH, it is likely that the variance will increase around the event day. Therefore, two
event-induced variance tests are conducted.
T7 is a parametric test with adjusted variances and is also known as the BMP test37
. It
corrects for the problem of event-induced variance by using standardized abnormal re-
turns and a variance that is estimated from the event window rather than from the esti-
mation period (Boehmer et al. 1991).
T8 is a nonparametric rank test with adjusted variances. As opposed to T4, this test
standardizes the abnormal returns before they are ranked. For the abnormal returns in
the estimation period the test uses the same standardization procedure as T2, while it
uses standard deviations based on Patell’s adjustment for the standardization of the ab-
normal returns in the event window (Bartholdy et al. 2007). The abnormal returns on
the event date are then standardized by the standard deviation across all securities on the
event date. Afterwards, the ranking procedure from T4 is followed.
9.5. Testing Procedure for Tests of Differences
For the analysis of whether CAAR differs depending on certain deal, target and acquirer
characteristics, two types of tests are carried out. First, a t-test and a Wilcoxon rank sum
test are used to analyse whether there are differences in means and locations between
two groups (Keller 2005). The t-test is a parametric test and is adjusted whenever the
two groups have unequal variances. To shed light on this an F-test is employed. The
Wilcoxon rank sum test is a nonparametric test which analyses the differences in the
ranks between two groups (Keller 2005). Secondly, an ANOVA test and a Kruskal-
Wallis test are used to test for differences in means and locations between more than
two groups. The ANOVA test is a parametric test which simultaneously compares the
means of a number of groups (Keller 2005), while the Kruskal-Wallis test is a nonpara-
metric test which simultaneously compares the ranks of a number of groups.
In addition to the abovementioned tests, one could have made a multiple regression
analysis. However, the value added from conducting such an analysis would be limited
in our case. The interpretation would be complicated by the fact that most of the explan-
37 After Boehmer, Musumeci & Poulsen (1991)

AN EXPLORATIVE EVENT STUDY OF LISTED PRIVATE EQUITY VEHICLES
JULY 2012 MATHIAS LETH NIELSEN 51
atory power would be captured in the intercept since most of the variables are dummy
variables. Furthermore, some of the variables have a sample size as low as five. This
would imply that several of the underlying assumptions would be unsatisfied. For these
reasons, a multiple regression analysis has not been included in the test procedure38
.
9.6. Performance of Test Statistics
The performance of a test is measured by means of its size and power. The size of a test
is the probability of committing a type I error, i.e. rejecting the null hypothesis when it
is true. When the probability of committing a type I error is equal to the size of the test,
the test is well-specified (Kothari & Warner 2006). The power of a test is the probabil-
ity of finding abnormal returns when they are present (Kothari & Warner 2006), i.e. one
minus the probability of committing a type II error. Thus, the goal is well-specified tests
with high power.
In order to analyse the performance of the test statistics one could have conducted a
Monte Carlo simulation. This is however outside the scope of this thesis. Instead the
performance is evaluated based on former studies. In general, parametric tests have
higher power than nonparametric tests when their assumptions are fulfilled (Bartholdy
et al. 2007). However, nonparametric tests dominate parametric tests in terms of power
and size for multi-country studies with three-day event windows (Campbell et al. 2010).
Among the nonparametric tests, the rank test dominates the sign test in detecting small
abnormal returns (Corrado & Zivney 1992). Furthermore, it works well for small sam-
ples and has better performance than T7 (the BMP test) when the estimation period is
contaminated, i.e. includes other events (Aktas et al. 2007). In the case of event-induced
variance, T7 and T8 have higher power than the other tests, with T8 being the most
powerful in multi-country studies (Aktas et al. 2007; Campbell et al. 2010; Corrado
2011). The abnormal returns in our sample are approximately normally distributed39
,
but some of the subsamples suffer from small sample sizes40
. In addition to this, the
business model of LPEVs implies that the estimation periods are most likely contami-
nated41
. Finally, there are indications of event-induced variance in the data. In case of
doubt, emphasis will therefore be placed on the results of T8.
38 That being said, a multiple regression analysis would not have changed the results significantly. 39 See appendix 7 for a test of the assumptions. 40 See exhibit 10.1 in chapter 10. 41 See section 9.3 for a discussion of this.

AN EXPLORATIVE EVENT STUDY OF LISTED PRIVATE EQUITY VEHICLES
JULY 2012 MATHIAS LETH NIELSEN 52
10. EMPIRICAL FINDINGS
Having explained the event study methodology, this chapter will present the empirical
findings and discuss the validity and the reliability of the results.
10.1. Discussion of the Results
The results are presented in exhibit 10.1. A separate exhibit with results for the sample
excl. 3i Group can be found in appendix 8. These results are stated in brackets in the
following sections.
10.1.1. Overall CAAR
The study finds an overall 3-day CAAR of 0.26% (-0.10%)42
. The CAAR is insignifi-
cant across all tests for both samples. This result implies that announcement of acquisi-
tions by LPEVs does not generate significant short run abnormal returns to their share-
holders. Consequently, H1: CAAR to the announcement of acquisitions by LPEVs ≥ 0 is
confirmed. This result is in line with the literature presented in chapter 6. The CAAR to
acquirers in general is insignificant or positive up to 1.2% (Andrade et al. 2001; Moeller
et al. 2005). Thus, the CAAR to LPEV acquirers does not seem to differ from that of
other acquirers. In addition to this, the result is supported by Jegadeesh et al. (2010)
who find that the market expects long-run abnormal returns of -2% to 2% for LPEVs.
As explained in chapter 6, the CAAR is likely to be affected positively by the facts that
PEVs generate more value in acquisitions than other acquirers (Achleitner et al. 2009,
2010) and are able to capture a larger share of the value generated (Bargeron et al.
2008; Officer et al. 2010; Stotz 2011). On the other hand, the magnitude of the CAAR
is likely to be negatively affected by partial anticipation from investors (Schipper &
Thompson 1983; Malatesta & Thompson 1984; Montgomery 1994; Thompson 1995).
Furthermore, the estimation period might be contaminated by announcements of other
acquisitions. If these acquisitions have a positive CAAR then the expected return in the
event window will be higher and thus the CAAR will be lower. However, the CAAR is
insignificant both for deals with and without contaminated estimation periods. Thus,
contamination does not seem to affect the results.
Based on the discussion above, a possible interpretation of the result is that investors
expect LPEVs to conduct acquisitions on a frequent basis and generate more value in
acquisitions than other acquirers; thus, they expect LPEVs to deliver higher rates of
42 These results are not statistically different from each other cf. exhibit A.9.1 in appendix 9.

AN EXPLORATIVE EVENT STUDY OF LISTED PRIVATE EQUITY VEHICLES
JULY 2012 MATHIAS LETH NIELSEN 53
return from acquisitions. Consequently, an insignificant CAAR is most likely a result of
high expected returns and thus represents a decent rate of return from acquisitions com-
pared to that of other acquirers.
Exhibit 10.1 – CAAR to Announcements of Acquisitions by LPEVs
Parametric tests Nonparametric tests Var. adj. tests Differences
Sample N CAAR T1 T1 adj. T2 T3 T4 T5 T6 T7 T8 T-test W-test
All acquirers 129 0.26% 0.97 0.97 1.07 1.05 1.09 1.07 1.10 1.10 1.08
Deal Period* 6.23a 296.83a
2001 - 2003 20 1.70% 1.74c 1.73c 2.07b 2.05b 1.92c 2.21b 2.19b 1.99b 1.90c
2004 - 2008 86 0.00% -0.02 -0.02 0.35 0.33 0.45 0.38 0.46 0.35 0.43
2009 - 2012 23 0.02% 0.03 0.03 -0.06 -0.06 -0.16 -0.36 -0.33 -0.07 -0.16
Deal Size 0.62 0.55
Large 14 0.58% 0.47 0.47 0.35 0.35 0.26 -0.31 -0.26 0.38 0.25
Small 115 0.22% 0.85 0.85 1.01 0.99 1.03 1.23 1.25 1.04 1.02
Target Industry* 0.75 -3.71
Min. & Con. 4 1.18% 0.89 0.89 0.63 0.63 0.94 1.21 1.19 0.81 1.23
Manufacturing 37 -0.08% -0.17 -0.17 -0.43 -0.43 -0.27 0.00 -0.01 -0.55 -0.28
T., C., E., G. & S. S. 11 0.02% 0.02 0.02 0.44 0.43 0.51 0.98 1.01 0.50 0.53
W. & R. Trade 13 0.27% 0.36 0.36 0.01 0.01 -0.10 -0.46 -0.41 0.01 -0.07
F., I. & R. E. 4 1.59% 0.84 0.84 0.78 0.71 0.93 1.13 1.17 0.58 0.91
Services 60 0.37% 0.84 0.84 1.36 1.35 1.00 0.66 0.77 1.27 1.02
Target Legal Origin 0.16 0.62
Civil law 79 0.29% 0.85 0.85 1.33 1.30 0.90 1.06 1.15 1.35 0.90
Common law 50 0.22% 0.50 0.50 0.05 0.06 0.51 0.31 0.32 0.06 0.50
Target Former Ownership -1.23 -1.45c
Private 125 0.22% 0.81 0.81 0.89 0.87 0.83 0.74 0.81 0.91 0.81
Public 4 1.51% 1.12 1.11 1.15 1.14 1.38 1.77c 1.75c 1.20 1.37
LPEV Structure 2.04b 1.57b
Direct 124 0.34% 1.22 1.22 1.32 1.30 1.34 1.35 1.37 1.36 1.32
Indirect 5 -1.54% -1.06 -1.06 -1.14 -1.13 -1.16 -1.29 -1.26 -1.20 -1.03
LPEV Experience 1.73b 1.75b
Experienced 109 0.40% 1.57 1.57 1.49 1.48 1.54 1.84c 1.80c 1.56 1.52
Inexperienced 20 -0.46% -0.43 -0.43 -0.76 -0.79 -0.82 -1.54 -1.40 -0.82 -0.85
LPEV Investment Strategy -0.50 -0.48
Specialized 10 -0.05% -0.03 -0.03 -0.49 -0.49 -0.28 -1.09 -1.03 -0.46 -0.29
Diversified 119 0.29% 1.12 1.12 1.26 1.24 1.19 1.43 1.44 1.31 1.17
Notes: CAAR is defined as the sum of CAR [-1; 1] divided by N. The significance level is indicated by a = 10%, b = 5%, and c = 1%. * implies that the tests for differences are the ANOVA test and the Kruskal-Wallis test. W-test = the Wilcoxon Rank Sum test. The test
for differences which is relied upon is marked with bold; the t-test is relied upon when the observations of both groups are normally
distributed according to a Jarque-Bera test; when they are not, the Wilcoxon Rank Sum test is relied upon. The industries are as follows: ‘Min. & Con.” = Mining & Construction, “T., C., E., G. & S. S” = Transportation, Communication, Electric, Gas &
Sanitary Services, “W. & R. Trade” = Wholesale & Retail Trade, and “F., I. & R. E.” = Finance, Insurance & Real Estate”.
10.1.2. Deal Period
The study shows that deals conducted in the period 2001-2003 had a CAAR of 1.70%
(2.56%). For the total sample, this is statistically significant at a 10% significance level

AN EXPLORATIVE EVENT STUDY OF LISTED PRIVATE EQUITY VEHICLES
JULY 2012 MATHIAS LETH NIELSEN 54
according to all tests, but none of the tests show significance when 3i Group is exclud-
ed. However, the latter sample only consists of two deals. Deals conducted in the peri-
ods 2004-2008 and 2009-2012 had statistically insignificant CAARs of 0.00% (-0.29%)
and 0.02% (-0.04%) respectively. Comparing the three periods, 2001-2003 yields a sig-
nificantly higher CAAR (approx. 1.70%) than the other periods for the total sample, but
an insignificantly higher CAAR when 3i Group is excluded. This is most likely due to
the small sample size in the period 2001-2003 when 3i Group is excluded. The CAAR
decreases for both 2004-2008 and 2009-2012 when 3i Group is excluded, while it in-
creases for 2001-2003. This suggests that the difference between 2001-2003 and the
other periods increases after removing 3i Group. Based on the discussion above, the
CAAR can therefore be concluded to differ between 2001-2003 and the other periods.
Hence, H2: CAAR to LPE acquirers in 2001-2003 > CAAR to LPE acquirers in 2004-
2008 > CAAR to LPE acquirers in 2009-2012 is partly confirmed. This result is sup-
ported by previous empirical studies which find that abnormal returns have declined
over time in both M&A and PE (Martynova & Renneboog 2008; Acharya et al. 2011).
The decline in the CAAR from the first period to the latter periods can be explained by
three things. First, financial markets have most likely become more efficient in their
valuation of the LPEVs, since an increasing number of LPEVs have emerged along with
LPE indices - both of which have increased the transparency of performance. Secondly,
the increasing number of PEVs and LPEVs during the period has increased the competi-
tion in the market for corporate control (Wright et al. 2006; Bain & Co. 2012). Third,
premiums and hence prices have been driven up (Gou et al. 2011). The fact that CAAR
has not declined from the period 2004-2008 to the period 2009-2012 indicates that the
business cycle effect counteracts the overall decline in returns. If CAARs decline over
time, but LPEVs do better during busts (2009-2012) than during booms (2004-2008) as
suggested by (Kaplan & Schoar 2005; Achleitner et al. 2009, 2010), then one can ex-
pect approximately the same CAARs during a boom as during the following bust.
10.1.3. Deal Size
The CAAR to large deals is 0.58% (0.58%) while the CAAR to small deals is 0.22%
(-0.34%). The results are not significantly different from zero for any of the samples.
The difference in the CAAR between large and small deals is insignificant for the over-
all sample. Since 3i Group has a positive effect on CAAR and only conducts small
deals, the difference increases after removing 3i Group. Thus we find a difference that is
AN EXPLORATIVE EVENT STUDY OF LISTED PRIVATE EQUITY VEHICLES
JULY 2012 MATHIAS LETH NIELSEN 55
significant at the 10% level for the sample excl. 3i Group. It is, however, not enough to
conclude a difference across both samples and hence H3: CAAR to large acquisitions by
LPEVs > CAAR to small acquisitions by LPEVs is rejected. This result is supported by
Acharya et al. (2009) who find that value generation is independent of the deal size. It
does, however, contradict most of the other previous studies which suggest that larger
deals should lead to higher returns (Loos 2005; Wright et al. 2006; Martynova et al.
2006; Bargeron et al. 2008; Officer et al. 2010). A potential explanation is that the deal
size is measured on a relative basis in this study, while several of the other studies have
measured deal size on an absolute basis. As explained in chapter 6, one would expect
better performance of large deals, since larger targets e.g. can bear more debt (Achleit-
ner et al. 2009) and have more dispersed ownership (Faccio & Lang 2002). However,
the LPEVs are likely to have larger bargaining power when the targets are smaller. This
counteracts the positive effects of larger targets and can therefore explain why the deal
size does not have an effect on the CAAR.
10.1.4. The Industry of the Target
The study finds CAARs ranging from -0.08% to 1.59% (-0.60% to 1.20%) depending
on the industry of the target. The results are insignificantly different from zero across all
industries in the samples. Furthermore, the CAARs are not significantly different be-
tween the industries. Therefore, one can reject H4: The CAAR to LPE acquirers depends
on the industry of the target. This contradicts previous studies which find that PE re-
turns are industry dependent (Loos 2005; Cumming et al. 2007; Gottschalg et al. 2010).
There might be several reasons for these results. First of all, four of the six industry cat-
egories have sample sizes of 13 (6) or less. Thus, the results should be interpreted with
caution. Secondly, M&As and PE activity tend to cluster in different industries in dif-
ferent periods (Andrade et al. 2001; Vinten & Thomsen 2008). This is likely to drive up
prices and hence drive down returns. Third, due to the low sample sizes, high level in-
dustry categories have been used. Thus, one might find different results if a more de-
tailed industry categorization is applied.
10.1.5. The Legal Origin of the Target
The CAAR to deals involving civil law targets is 0.29% (0.03%) while the CAAR to
deals involving common law targets is 0.22% (-0.73%). None of these results are signif-
icantly different from zero, although T6 and T7 report significance at the 10% signifi-
cance level for common law targets in the sample excl. 3i Group. The CAAR does not

AN EXPLORATIVE EVENT STUDY OF LISTED PRIVATE EQUITY VEHICLES
JULY 2012 MATHIAS LETH NIELSEN 56
differ significantly between civil and common law targets for any of the samples. Thus,
H5: CAAR to acquisitions of targets from civil law countries by LPEVs > CAAR to ac-
quisitions of targets from civil law countries by LPEVs is rejected. This contradicts the
existing (but scarce) empirical evidence which finds that CAAR depends on the legal
origin of the target, although they disagree about which legal origin that is preferable
(Martynova & Renneboog 2006; Phalippou & Gottschalg 2009; Humphery-Jenner et al.
2012). Besides a low sample size of common law targets when 3i Group is excluded,
the result might be caused by increasing convergence in legal systems due to e.g. glob-
alization and pan-European merger laws (Renneboog & Simons 2005; La Porta et al.
2008).
10.1.6. The Former Ownership of the Target
The study finds a CAAR of 0.22% (-0.12%) for acquisitions of private targets and a
CAAR of 1.51% (1.20%) for acquisitions of public targets. These results are insignifi-
cantly different from zero across both samples, although the CAAR for public targets is
statistically significant at the 10% significance level for T5 and T6 for the sample incl.
3i Group. The CAAR is significantly higher for public targets than for private targets at
the 10% significance level for the total sample. The result is, however very uncertain
since there are only four observations of public targets. Furthermore, only one observa-
tion of a public target is left when 3i Group is excluded. Based on this, one cannot con-
firm H6: CAAR to acquisitions of private targets by LPEVs > CAAR to acquisitions of
public targets by LPEVs. This result contradicts previous studies which uniformly sug-
gest that acquirers in general earn higher CAARs in acquisitions of private targets than
in acquisitions of public targets (Faccio & Masulis, 2005; Martynova & Renneboog
2006; Masulis, Wang & Xie 2007; Feito-Ruiz & Menéndez-Requejo 2011). However,
the empirical literature within this area suffers from a lack of PE studies. In addition to
this, it is hard to draw any valid conclusions based on a sample of four observations.
10.1.7. The Structure of the LPEV
LPEVs organized as direct LPEVs (LPE funds or Investment Companies) earn CAARs
of 0.34% (0.05%) in the days surrounding their announcement of an acquisition while
indirect LPEVs (LPE firms) earn CAARs of -1.54% (-1.54%). None of these results are
significantly different from zero. Interestingly, direct LPEVs earn 1.87% (1.59%) higher
CAARs than indirect LPEVs. These differences are statistically significant for both

AN EXPLORATIVE EVENT STUDY OF LISTED PRIVATE EQUITY VEHICLES
JULY 2012 MATHIAS LETH NIELSEN 57
samples43
. Thus, one can confirm H7: The structure of the LPEV has an effect on the
CAAR to announcements of acquisitions. Lahr and Herschke (2009) find no significant
differences in risk-adjusted returns across different LPEV structures and are, so far, the
only ones to have studied the impact of LPEV structure on the share price performance
of LPEVs. As outlined in chapter 6, direct LPEVs are more exposed to the underlying
performance of the portfolio companies. This could explain why direct LPEVs outper-
form indirect LPEVs. However, the exposure is only one dimension of the LPEV struc-
ture. One could also investigate the other dimension, i.e. the impact of being internally
vs. externally managed, or even better: whether the CAAR differs between LPE firms,
LPE funds, and investment companies.
10.1.8. The Experience of the LPEV
The study finds that experienced acquirers earn CAARs of 0.40% (0.12%) while inex-
perienced acquirers earn CAARs of -0.46% (-0.46%). None of the CAARs are signifi-
cantly different from zero across neither the majority of the tests nor T8, although T5
and T6 report significance at the 10% level for experienced LPEVs in the total sample.
Therefore, the CAARs are not significantly different from zero. Interestingly, the
CAAR to experienced LPEVs is 0.86% higher than the CAAR to inexperienced LPEVs.
This difference is statistically significant at a 5% significance level. The significant dif-
ference persists even after removing 3i Group from the sample. Therefore, one can con-
firm H8: CAAR to experienced LPE acquirers > CAAR to inexperienced LPE acquirers.
This result is consistent with previous empirical findings. Wood and Wright (2009) find
lower returns to PE funds raised in the 1990s, while Gottschalg and Wright (2008) and
Phalippou and Gottschalg (2009) show that experienced PE funds add more value and
have higher returns than inexperienced PE funds.
The higher performance of experienced LPEVs can be explained by three things. First
of all, Loos (2005) finds that the number of deals conducted has a positive impact on PE
performance. In addition to this, only the best PEVs survive over time (Bauer et al.
2001), thus the experienced LPEVs are likely to be of a high quality44
. Third, experi-
enced LPEVs have access to proprietary deal flows (Berg & Gottschalg 2005; Kaplan &
Schoar 2005). According to Loos (2005), this leads to higher performance.
43 However, only five observations of indirect LPEVs were observed in our sample, so one must be cautious inter-
preting the results. Interestingly, the sample seems to be fairly representative. According to LPX Group (2012d), only
4% of all LPEVs are structured as indirect LPEVs. In our sample they account for 11% of the LPEVs and approxi-
mately 4% of the deals. 44 This is also known as the survivorship bias.

AN EXPLORATIVE EVENT STUDY OF LISTED PRIVATE EQUITY VEHICLES
JULY 2012 MATHIAS LETH NIELSEN 58
10.1.9. The Investment Strategy of the LPEV
LPEVs with a specialized investment strategy earn a CAAR of -0.05% (-0.05%) from
the announcement of acquisitions, while LPEVs with a diversified investment strategy
earn a CAAR of 0.29% (-0.11%). None of these CAARs are significantly different from
zero. Furthermore, LPEVs with a specialized investment strategy do not earn signifi-
cantly higher CAARs than LPEVs with a diversified investment strategy. Hence, one
can reject H9: CAAR to acquisitions by specialized LPEVs > CAAR to acquisitions by
diversified LPEVs. In this context, it is interesting to note that there is a trend towards
more specialization in PE. Based on the empirical evidence presented in this study, the
specialization trend does not seem to be value-maximizing for shareholders. This result
is consistent with former M&A studies which find mixed results with respect to special-
ization (Martynova et al. 2006; Martynova & Renneboog 2008; Feito-Ruiz & Menén-
dez-Requejo 2011). On the other hand, it is inconsistent with previous PE studies,
which find that specialization increases operational performance and profitability of the
portfolio firms (Cressy et al. 2007; Kaplan & Strömberg 2009) and that geographical
specialization yields higher returns to PEVs (Loos 2005; Pe’er & Gottschalg 2009).
The result might be due to several things. First of all, there are only 10 observations of
specialized deals; hence the sample size is quite low. However, the difference in CAAR
is only 0.34%, which is far below the required level of approximately 1%, where the
test statistics are able to find a difference (Kothari & Warner 2006). Secondly, CAAR
does not seem to depend on the industry of the target according to section 10.1.4. Third,
it might simply be due to the fact that (L)PEVs historically have focused primarily on
financial improvements and not focused on operational improvements, which is where
specialization has its advantage45
. Fourth and finally, this study only analyses industry
specialization. Since, specialization can occur along a number of other dimensions such
as deal size, geography and type of firms, one might find different results if one ana-
lysed the announcement returns to LPEVs which specialize along one these dimensions.
10.2. Value Generating Levers
Relating the results in sections 10.1.2-10.1.9 to the theories about value generation in
LPE, one can conclude that investors expect LPEVs to generate most of their value in
the acquisition and the holding phase through a mix of value capturing and secondary
levers of value generation. This includes financial arbitrage, in the form of superior deal
45 See section 5.2.2. for more information about operational improvements in private equity.

AN EXPLORATIVE EVENT STUDY OF LISTED PRIVATE EQUITY VEHICLES
JULY 2012 MATHIAS LETH NIELSEN 59
making capabilities and access to a proprietary deal flow, and corporate governance
improvements due to the fact that more experienced LPEVs are better at monitoring.
The sources of these value generating levers are all extrinsic, thereby underlining the
importance of the LPEVs in the value generation process.
10.3. Reliability and Validity
Since the study is one of the first in its area, it is important to assess the reliability and
the validity of the study. Reliability refers to the precision of the measurement instru-
ment while validity refers to whether a measurement measures what it is supposed to
measure (Abnor & Bjerke 1997). A measurement is reliable if it provides the same re-
sults under different tests. Since the results were found using a battery of test statistics,
incl. parametric, nonparametric and event-induced variance tests, the reliability of the
measurement instrument is assessed to be good. The validity depends on whether sys-
tematic biases were imposed during the research. Several potential biases have been
introduced during the study. First of all, the estimation periods are most likely contami-
nated by other announcements of acquisitions. However, as explained in section 9.3,
this is unlikely to bias the results. Secondly, outliers have been removed. This decreases
the variance of the results. However, the outliers were both positive and negative and of
approximately the same magnitude. Thus, the impact on the final results is likely to be
limited. Third, there is a considerable lack of U.S. targets and LPEVs in the sample
compared to other studies. This is most likely due to the fact that the major U.S. LPEVs
have not been listed until recently. However, it implies that the results might not be
generalizable to the U.S. Fourth, several structural factors relating to LPE implies that
the results differ from those of former M&A studies: LPEVs conduct smaller deals than
other acquirers, but on the other hand they mostly pay cash and usually avoid hostile
bids. Thus the biases are likely to cancel out. Fifth, it seems that LPEVs only acquire
few public targets. According to the evidence presented in the literature review, this
should impose a positive bias. Finally, the test suffers from survivorship bias, since it
relies on LPEVs which have survived through the observation period. This imposes a
positive bias, as inferior LPEVs tend to go out of business.
Based on the discussion above, only a limited number of biases have been imposed on
the results. However, they seem to even out and the validity is therefore assessed to be
good. The fact that both the reliability and the validity of the study are good implies that
the results are of a decent quality. This renders credibility to the findings.
AN EXPLORATIVE EVENT STUDY OF LISTED PRIVATE EQUITY VEHICLES
JULY 2012 MATHIAS LETH NIELSEN 60
11. CONCLUSION
The thesis has investigated the short run abnormal return to the announcement of acqui-
sitions by listed private equity vehicles. This has been done through three parts.
Part 1 provided the theoretical framework. First, Chapter 2 showed that the market for
corporate control could be explained by the neoclassical finance theory, the agency the-
ory, and the behavioural finance theory. The neoclassical finance theory argued that
managers are maximizing shareholders’ wealth and hence only make acquisitions which
have a non-negative CAAR. The agency theory provided two explanations; the first was
that since management’s rewards are likely to increase with the size of the company,
managers might engage in acquisitions which increase the size of the company, but do
not necessarily maximize the value for the shareholders. This should lead to negative
CAARs. Secondly, the motive of an acquisition might be to decrease the agency costs.
This should lead to positive CAARs. The behavioural finance theory argued that takeo-
vers occur due to management hubris and hence CAARs should be negative. Chapter 3
gave an introduction to PE and outlined some of the current trends. Afterwards, chapter
4 showed that LPEVs are more diverse than PEVs and that the major differences be-
tween PE and LPE are that LPE is more liquid, provide better access for retail investors,
and is easier and more transparent. In addition to this, PE and LPE differ on a number of
structural parameters such as lifetime and size.
Part 2 explored the existing literature and led to the development of 22 hypotheses.
Chapter 5 explained how LPEVs generate value, before chapter 6 build upon that, and
related empirical studies within M&A, PE and LPE, to develop a number of hypotheses.
These hypotheses were prioritized in chapter 7, where nine hypotheses were selected for
further analysis.
Part 3 analysed the hypotheses and provided the empirical results. First, a sample of 129
deals conducted by 18 LPEVs in the period 2001-2012 was identified based on the LPX
Composite. These deals were tested by means of an event study, which included a bat-
tery of parametric, nonparametric, and event-induced variance tests. Based on this, the
study found an insignificant overall CAAR of 0.26% using a 3-day event window. Fur-
thermore, the study found that the CAAR depends on the deal period, the LPEV struc-
ture and the experience of the LPEV. Finally, the study showed decent reliability and
validity.
AN EXPLORATIVE EVENT STUDY OF LISTED PRIVATE EQUITY VEHICLES
JULY 2012 MATHIAS LETH NIELSEN 61
Based on this, one can conclude that the announcement of acquisitions by listed private
equity vehicles does not generate short run abnormal returns to their shareholders. This
result provides support for the neoclassical theory’s explanation of acquisitions: effi-
cient markets will ensure that poorly performing management teams are replaced and
managers will only conduct acquisitions which maximize shareholder value. In addition
to this, the result supports the part of agency theory that argues that acquisitions are
profit maximizing because they decrease agency costs. Furthermore, the non-negative
CAAR implies that LPEV managers do not seem to suffer from managerial hubris.
Secondly, one can conclude that the short run abnormal return to the announcement of
acquisitions by listed private equity vehicles depends on certain deal and acquirer char-
acteristics, but does not depend on certain target characteristics. More specifically, the
return depends on the deal period, the LPEV structure and the experience of the LPEV.
As discussed above, the announcement return is approximately 1.70% higher for deals
conducted during 2001-2003 than for deals conducted during 2004-2008 and 2009-
2012. Furthermore, the announcement return is 1.87% higher for direct LPEVs than for
indirect LPEVs and 0.86% higher for experienced LPEVs than for inexperienced
LPEVs. These results are in line with Gottschalg et al. (2010) which find that there is
significant variance in PEVs’ return depending on fund specific characteristics and vin-
tage year.
Thus, the thesis has provided an improved understanding of listed private equity and
LPEVs’ performance when they announce acquisition. However, the research area is
largely unexplored and a number of interesting issues remain.
12. FUTURE RESEARCH
One of the major issues is whether the current trend of specializing within specific in-
dustries and niches is worthwhile. This study found that specialization along the indus-
try dimension did not lead to abnormal returns. Therefore, it would be interesting to
study whether specialization along other dimensions such as geography or deal size
leads to abnormal returns. Secondly, very little is known about the LPEVs. Hence, there
is a need build upon the work of Lahr and Herschke (2009) and Brown and Kräussl
(2010) to improve the understanding of the different structures of LPEVs and their in-
fluence on the risk and returns.
AN EXPLORATIVE EVENT STUDY OF LISTED PRIVATE EQUITY VEHICLES
JULY 2012 MATHIAS LETH NIELSEN 62
13. LIST OF LITERATURE
Abnor, I. & Bjerke, B. 1997, Methodology for Creating Business Knowledge, 2nd
edi-
tion, Sage Publications, Thousand Oaks, California
Acharya, V. A., Gottschalg, O., Hahn, M. & Kehoe, C. 2011, ‘Corporate Governance
and Value Creation: Evidence from Private Equity’, NUY Working Paper, no. FIN-08-
032.
Achleitner, A. K., Braun, R., Engel, N., Figge, C. & Tappeiner, F. 2010, ‘Value Crea-
tion Drivers in Private Equity Buyouts: Empirical Evidence from Europe’, The Journal
of Private Equity, vol. 13, no. 2, pp. 17-27.
Achleitner, A. K., Lichtner, K. & Diller, C. 2009, Value Creation in Private Equity,
Capital Dynamics and Centre for Entrepreneurial and Financial Studies, Switzerland.
Aktas, N., de Bodt, E. & Cousin, J. G. 2007, ’Event studies with a contaminated estima-
tion period’, Journal of Corporate Finance, vol. 23, pp. 129-145.
Andrade, G., Mitchell, M. & Stafford, E. 2001, ‘New evidence and perspectives on
mergers’, The Journal of Economic Perspectives, vol. 15, pp. 103-120.
Bain & Company 2012, Global Private Equity Report 2012, Bain & Company Inc.,
Boston, Massachusetts.
Baker, G. P. & Smith, G. D. 1998, The New Financial Capitalists: Kohlberg Kravis
Roberts and the Creation of Corporate Value, Cambridge University Press, Cambridge,
the United Kingdom.
Bargeron, L. L., Schlingemann, F. P., Stulz, R. M. & Zutter, C. J. 2008, ‘Why do pri-
vate acquirers pay so little compared to public acquirers?’, Journal of Financial Eco-
nomics, vol. 89, pp. 375-390.
Bartholdy, J., Olson, D. & Peare, P. 2007, ‘Event Studies on a Small Stock Exchange’,
European Journal of Finance, vol. 13, no. 3, pp. 227-252.
Bauer, M., Bilo, S. & Zimmermann, H. 2001, ‘Publicly Traded Private Equity: An Em-
pirical Investigation’, WWZ/Department of Finance, Working Paper no. 5/01.
AN EXPLORATIVE EVENT STUDY OF LISTED PRIVATE EQUITY VEHICLES
JULY 2012 MATHIAS LETH NIELSEN 63
Berg, A. & Gottschalg, O. 2005, ‘Understanding Value Generation in Buyouts’, IN-
SEAD Working Paper.
Bergmann, B., Christophers, H., Huss, M. & Zimmermann, H. 2009, ‘Listed Private
Equity’, University of Basel and LPX GmBH Zürich, Working Paper January 2009.
Bilo, S., Christophers, H., Degosciu, M. & Zimmermann, H. 2005, ‘Risk, returns, and
biases of listed private equity portfolios’, WWZ/Department of Finance, Working Paper
No. 1/05.
Boehmer, E., Musumeci, J. & Poulsen, A. 1991, ‘Event-study methodology under con-
ditions of event-induced variance'’ Journal of Financial Economics, vol. 30, pp. 253-
272.
Brown, C. & Kräussl, R. 2010, ‘Risk and Return Characteristics of Listed Private Equi-
ty’, in Cumming, D. (ed.), The Oxford Handbook of Private Equity, Oxford University
Press, New York, pp. 549-578.
Brown, S. J. & Warner, J. B. 1980, ‘Measuring Security Price Performance’, Journal of
Financial Economics, vol. 8, no. 3, pp. 205-258.
Brown, S. J. & Warner, J. B. 1985, ‘Using Daily Stock Returns: The Case of Event
Studies of Event-Induced Variance’, Journal of Financial Economics, vol. 14, no. 1, pp.
3-31.
Campbell, C. J., Cowan, A. R. & Salotti, V. 2010, ‘Multi-country event-study methods’,
Journal of Banking & Finance, vol. 34, pp. 3078-3090.
Campbell, J. Y., Lo, A. W. & MacKinlay, A. C. 1997, The Econometrics of Financial
Markets, Princeton University Press, Princeton, New Jersey.
Carow, D. M. & Roden, K. A. 1997, ‘Determinants of the Stock Price Reaction to Lev-
eraged Buyouts’, Journal of Economics and Finance, vol. 21, no. 3, pp. 49-59.
Cheffins, B. R. & Armour, J. 2007, ‘The Eclipse of Private Equity’, Centre for Business
Research, University of Cambridge, The CBR Research Programme on Corporate Gov-
ernance, Working paper no. 339.

AN EXPLORATIVE EVENT STUDY OF LISTED PRIVATE EQUITY VEHICLES
JULY 2012 MATHIAS LETH NIELSEN 64
Conn, R., Cosh, A., Guest, P. & Hughes, A. 2005 ‘The Impact on UK Acquirers of
Domestic, Cross-border, Public and Private Acquisitions’, Journal of Business Finance
and Accounting, vol. 32, no. 5.
Corrado, C. J. & Zivney, T. L. 1992, ‘The Specification and Power of the Sign Test in
Event Study Hypothesis Tests Using Daily Stock Returns’, Journal of Financial and
Quantitative Analysis, vol. 27, no. 3, pp. 465-478.
Corrado, C. J. 2011, ‘Event studies: A methodology review’, Accounting and Finance,
vol. 51, pp. 207-234.
Cressy, R., Munari, F. & Malipiero, A. 2007, ‘Playing to Their Strengths? Evidence that
Specialization in the Private Equity Industry Confers Competitive Advantage’, Journal
of Corporate Finance, vol. 13, pp. 647-669.
Cumming, D. & Walz, U. 2004, ‘Private Equity Returns and Disclosure Around the
World, paper presented at EFA 2004 Maastricht Meetings, 2004, Maastricht.
Cumming, D., Fleming, G. & Johan, S. A. 2011, ‘Institutional Investment In Listed Pri-
vate Equity’, European Financial Journal, vol. 17, no. 3, pp. 594-618.
Cumming, D., Siegel, D. S. & Wright, M. 2007, ‘Private Equity, Leveraged Buyouts
and Governance’, Journal of Corporate Finance, vol. 13, pp. 439-460.
Cuthbertson, K. & Nitzsche, D. 2004, Stocks, Bonds and Foreign Exchange, 2nd
edition,
John Wiley & Sons Ltd., West Sussex, the United Kingdom.
DeAngelo, H., DeAngelo, L. & Rice, E. 1984, ‘Going Private: Minority Freezeouts and
Stockholder Wealth’, Journal of Law and Economics, vol. 27, pp. 367-401.
Faccio, M. & Lang, L. 2002, ‘The Ultimate Ownership of Western European Corpora-
tions’, Journal of Financial Economics, vol. 65, pp. 365-395.
Faccio, M. & Masulis, R. W. 2005, ‘The Choice of Payment Method in European Mer-
gers and Acquisitions’, The Journal of Finance, vol. LX, no. 3, pp. 1345-1388.
Fama, E. 1970, ‘Efficient Capital Markets: A Review of Theory and Empirical Work’,
Journal of Finance, vol. 25, no. 2, pp. 383-417.

AN EXPLORATIVE EVENT STUDY OF LISTED PRIVATE EQUITY VEHICLES
JULY 2012 MATHIAS LETH NIELSEN 65
Fama, E., Fisher, L., Jensen, M. C. & Roll, R. 1969, ‘The adjustment of stock prices to
new information’, International Economic Review, vol. 10, no. 1, pp. 1-21.
Feito-Ruiz, I. & Menéndez-Requejo, S. 2011, ‘Cross-Border Mergers and Acquisitions
in different legal environments’, International Review of Law and Economics, vol. 31,
pp. 169-187.
Fox, I. & Marcus, A. 1992, ‘The Causes and Consequences of Leverage Management
Buyouts’, Academy of Management Review, vol. 17, no. 1, pp. 62-85.
Francis, B. B., Hasan, I. & Sun, X. 2008, ‘Financial Market Integration and the Value of
Global Diversification: Evidence for US Acquirers in Cross-Border Mergers and Acqui-
sitions’, Journal of Banking and Finance, vol. 32, no. 8, pp. 1522-1540.
Gianfrate, G. 2009, ‘Listed Private Equity Funds: IPO pricing, J-Curve and Learning
Effects’, CAREFIN Working Paper, no. 10/09.
Goergen, M. & Renneboog, L. 2004, ‘Shareholder Wealth Effects of European Domes-
tic and Cross-border Takeover Bids’, Journal of European Financial Management, vol.
10, no. 1, pp. 9-45.
Goldman, A. 2011, Publicly Traded Private Equity Vehicles: A Different Kind of Mod-
el, Red Rocks Capital LLC, Colorado, the United States of America.
Gottschalg, O. & Wright, M. 2008, ‘Understanding the buyers’ role in private equity
returns: the influence of skills, strategy and experience’, paper presented for the Strate-
gic Management Society, Cologne, 13th
October.
Gottschalg, O., Talmor, E. & Vasvari, F. 2010, Private Equity Fund Level Return At-
tribution: Evidence from U.K. Based Buyout Funds, London Business School and HEC
Paris, London and Jouy en Josas Cedex.
Gou, S., Hotchkiss, E. S. & Song, W. 2011, ‘Do Buyouts (Still) Create Value’, The
Journal of Finance, vol. LXVI, no. 2, pp. 479-517.
Henderson, G. V. 1990, ‘Problems and Solutions in Conducting Event Studies’, The
Journal of Risk and Insurance, vol. 57, no. 2, pp. 282-306.

AN EXPLORATIVE EVENT STUDY OF LISTED PRIVATE EQUITY VEHICLES
JULY 2012 MATHIAS LETH NIELSEN 66
Hillier, D., Grinblatt, M. & Titman, S. 2008, Financial Markets and Corporate Strate-
gy, European edition, McGraw-Hill Education, Berkshire, the United Kingdom.
Humphery-Jenner, M., Sautner, Z. & Suchard, J. A. 2012, ‘Cross-border Mergers and
Acquisitions: The Role of Private Equity Firms’, Working Paper, Accessed 20th
of April
2012, < http://ssrn.com/abstract=2010453>.
Jegadeesh, N., Kräussl, R. & Pollet, J. 2010, ‘Risk and Expected Returns on Private
Equity Investments: Evidence Based on Market Prices’, paper presented for The Ameri-
can Finance Association, Denver, 7th
-9th
of January 2011.
Jensen, M. C. & Meckling, W. H. 1976, ‘Theory of the Firm: Managerial Behavior,
Agency Costs and Ownership Structure’, Journal of Financial Economics, vol. 3, no. 4,
pp. 305-360.
Jensen, M. C. & Ruback, R. S. 1983, ‘The Market For Corporate Control: The Scientific
Evidence’, Journal of Financial Economics, vol. 11, pp. 5-50.
Jensen, M. C. 1986, ‘Agency Costs of Free Cash Flow, Corporate Finance and Takeo-
vers’, American Economic Review, vol. 76, no. 2, pp. 323-329.
Jensen, M. C. 1989, ‘Active Investors, LBOs and the Privatization of Bankruptcy’,
Journal of Applied Corporate Finance, vol. 2, no. 1, pp. 35-44.
Jensen, M. C. 2007, ‘The Economic Case for Private Equity (and Some Concerns)’
Harvard NOM Research Paper Series, no. 07-02.
Jensen, M. C., Kaplan, S. N., Ferenbach, C., Feldberg, M., Moon, J., Hosterey, B., Da-
vid, C. & Jones, A. 2006, ’Morgan Stanley Roundtable on Private Equity and Its Import
for Public Companies’, Journal of Applied Corporate Finance, vol. 18, no. 3, pp. 8-37.
Kaplan, S. N. & Schoar, A. 2005, ‘Private Equity Performance: Returns, Persistence
and Cash Flows’, The Journal of Finance, vol. LX, no. 4, pp. 1791-1823.
Kaplan, S. N. & Strömberg, P. 2009, ‘Leveraged Buyouts and Private Equity’, Journal
of Economic Perspectives, vol. 23, no. 1, pp. 121-146.
Kaplan, S. N. 1989, ‘The Effects of Management Buyouts on Operating Performance
and Value’, Journal of Financial Economics, vol. 24, pp. 217-254.

AN EXPLORATIVE EVENT STUDY OF LISTED PRIVATE EQUITY VEHICLES
JULY 2012 MATHIAS LETH NIELSEN 67
Kaplan, S. N. 2009, ‘The Future of Private Equity’, Journal of Applied Corporate Fi-
nance, vol. 21, no. 3, pp. 8-20.
Kehoe, C. & Palter, R. N. 2009, ‘The Future of Private Equity’, McKinsey Quarterly,
vol. 31, pp. 11-15.
Keller, G. 2005, Statistics for Management and Economics, 7th
edition, Thomson, Lon-
don.
Khotari, S. P. & Warner, J. B. 2006, ‘Econometrics of Event Studies’, in Eckbo, B. E.
(ed.), Handbook of Corporate Finance: Empirical Corporate Finance, North-Holland,
Amsterdam, pp. 3-32.
Kolari, J. W. & Pynnonen, S. 2011, ‘Nonparametric rank tests for event studies’, Jour-
nal of Empirical Finance, vol. 18, pp. 953-971.
La Porta, R., Lopez-de-Silanes, F., Shleifer, A. & Vishny, R. W. 1998, ‘Law and Fi-
nance’, Journal of Political Economy, vol. 106, no. 6, pp. 1113-1155.
La Porta, R, Lopez-de-Silanes, F & Shleifer, A. 2008, ‘The economic consequences of
legal origins’, Journal of Economic Literature vol. 46, no. 2, pp. 285-332.
Lahr, H. & Herschke, F. T. 2009, ‘Organizational Forms and Risk of Listed Private Eq-
uity’, The Journal of Private Equity, vol. 13, no. 1, pp. 89-99.
Lee, C. I., Rosenstein, S., Rangan, N. & Davidson, W. N. 1992, ‘Board Composition
and Shareholder Wealth: The Case of Management Buyouts’, Financial Management,
vol. 21, no. 1, pp. 58-72.
Lerner, J. 2007, ‘Private equity in a Time of Flux: Evolution and Revolution’, paper
presented to the Swedish Institute for Financial Research, Stockholm, 30th
-31st of Au-
gust 2007.
Lichtenberg, F. & Siegel, D. 1990, ‘The Effects of Leveraged Buyouts on Productivity
and Related Aspects of Firm Behavior’, Journal of Financial Economics, vol. 27, pp.
165-194.
Ljungqvist, A. & Richardson, M. 2003, ‘The Cash Flow, Return and Risk Characteris-
tics of Private Equity’, NYU Finance Working Paper, No. 03-001.

AN EXPLORATIVE EVENT STUDY OF LISTED PRIVATE EQUITY VEHICLES
JULY 2012 MATHIAS LETH NIELSEN 68
Loos, N. 2005, ‘Value Creation in Leveraged Buyouts’, University of St. Gallen, Ph. D.
Dissertation no. 3052.
LPEQ 2012, Advantages of Listed Private Equity, Accessed 18th
of March 2012,
<http://www.lpeq.com/Aboutlistedprivateequity/Advantagesoflistedprivateequity.aspx>
LPX Group 2011, Guide to the LPX Equity Indices – Version 2.9, LPX Group, Zürich.
LPX Group 2012a, Benefits of LPE, Accessed 15th
of May 2012, <http://www.lpx-
group.com/lpx/listed-private-equity/benefits-of-lpe.html>.
LPX Group 2012b, Listed Private Equity Geographical Allocation, Accessed 15th
of
May 2012, <http://www.lpx-group.com/lpx/listed-private-equity/allocation/lpe-
geographic-allocation.html>.
LPX Group 2012c, LPE Companies List, Accessed 20th
of May 2012, <http://www.lpx-
group.com/lpx/lpx-research/lpe-companies-list.html>.
LPX Group 2012d, Private Equity Investment Category, Accessed 15th
of May 2012,
<http://www.lpx-group.com/lpx/listed-private-equity/allocation/lpe-
categorization.html>.
MacKinlay, A. C. 1997, ‘Event Studies in Economics and Finance’, Journal of Econom-
ic Literature, vol. 35, no. 1, pp. 13-39.
Magowan, P. A. 1989, ‘The Case for LBOs: The Safeway Experience’, California
Management Review, vol. 32, no. 1, pp. 9-19.
Malatesta, P. H. & Thompson, R. 1985, ‘Partially Anticipated Events’, Journal of Fi-
nancial Economics, vol. 14, pp. 237-250.
Marais, L., Schipper, K. & Smith, A. 1989, ‘Wealth Effects of Going Private for Senior
Securities’, Journal of Financial Economics, vol. 23, pp. 155-191.
Martynova, M. & Renneboog, L. 2006, ‘Mergers and Acquisitions in Europe’, ECGI
Finance Working Paper Series, no. 114/2006.
Martynova, M. & Renneboog, L. 2008, ‘A century of corporate takeovers: What have
we learned and where do we stand?’, Journal of Banking and Finance, vol. 32, pp.
2148-2177.

AN EXPLORATIVE EVENT STUDY OF LISTED PRIVATE EQUITY VEHICLES
JULY 2012 MATHIAS LETH NIELSEN 69
Martynova, M., & Renneboog, L. 2011, ‘The Performance of the European Market for
Corporate Control: Evidence from the Fifth Takeover Wave’, European Financial
Management Journal, vol. 17, no. 2, pp. 208-259.
Masulis, R. W., Wang, C. & Xie, F. 2007, ‘Corporate Governance and Acquirer Re-
turns’, The Journal of Finance, vol. LXII, no. 4, pp. 1851-1889.
Meerkatt, H., Rose, J., Brigl, M., Liechtenstein, H., Julia Prats, M. & Herrera, A. 2008,
The Advantage of Persistence: How the Best Private-Equity Firms “Beat the Fade”,
The Boston Consulting Group and IESE Business School, University of Navarra.
Mergermarket 2012, mergermarket M&A Round-up for Year End 2012, The Merger-
market Group, London.
Mishkin, F. S. & Eakins, S. G. 2003, ‘Theory of Financial Structure’, in Mishkin, F. S.
& Eakins, S. G., Financial Markets + Institutions, 4th
edition, Addison-Wesley, Boston,
Massachusetts, pp. 371-400.
Moeller, S. B., Schlingemann, F. P. & Stulz, R. M. 2005, ‘Wealth Destruction on a
Massive Scale? A Study of Acquiring Firm Returns in the Recent Merger Wave’, Jour-
nal of Finance, vol. 60, no. 2, pp. 757-782.
Montgomery, C. A. 1994, ‘Corporate Diversification’, The Journal of Economic Per-
spectives, vol. 8, no. 3, pp. 163-178.
Müller, G. & Vasconcelos, M. 2010, ‘Listed Private Equity and the Case of Exits’, in
Cumming, D. (ed.), The Oxford Handbook of Private Equity, Oxford University Press,
New York, pp. 611-638.
Muscarella, C. J. & Vetsuypens, M. R. 1990, ‘Efficiency and Organizational Structure:
A Study of Reverse LBOs’, The Journal of Finance, vol. XLV, no. 5, pp. 1389-1413.
NAICS Association 2008, Free NAICS Look Up, Accessed 18th
of May 2012,
<http://www.naics.com/search.htm>.
Officer, M. S., Ozbas, O. & Sensoy, B. 2010, ’Club Deals in Leveraged Buyouts’,
Journal of Financial Economics, vol. 98, pp. 214-240.

AN EXPLORATIVE EVENT STUDY OF LISTED PRIVATE EQUITY VEHICLES
JULY 2012 MATHIAS LETH NIELSEN 70
Palepu 1990, ‘Consequences of Leveraged buyouts’, Journal of Financial Economics,
vol. 27, pp. 247-262.
Park, N. K. 2004, ‘A Guide to Using Event Study Methods in Multi-Country Settings’,
Strategic Management Journal, vol. 25, no. 7, pp. 655-668.
Patell, J. M. 1976, ‘Corporate forecasts of earnings per share and stock price behavior:
Empirical tests’, Journal of Accounting Research, vol. 14, no. 2, pp. 246-276.
Pe’er, A. & Gottschalg, O. 2011, ‘Red and Blue: The Relationship Between Institutional
Context and the Performance of LBO Investments’, Strategic Management Journal, vol.
32, pp. 1356-1367.
Phalippou, L. & Gottschalg, O. 2009, ‘The Performance of Private Equity Funds’, The
Review of Financial Studies, vol. 22, no. 4, pp. 1747-1776.
Phalippou, L. 2010, ‘Private equity Funds’ Performance, Risk and Selection’, in Atha-
nassiou, P. (ed.), Research Handbook on Hedge Funds, Private Equity and Alternative
Investments, Edward Elgar Publishing Limited, Cheltenham, the United Kingdom,
pp.113-140.
Renneboog & Simons 2005, ‘Public-to-Private Transactions: LBOs, MBOs, MBIs and
IBOs’, Working Paper, no. 94/2005, McKinsey & Co. Inc. and Tilburg University.
Renneboog, L., Simons, T. & Wright, M. 2007 ‘Why do Public Firms go Private in the
UK? The Impact of Private Equity Investors, Incentive Realignment and Valuation’,
Journal of Corporate Finance, vol. 31, no. 4, pp. 1795-1815.
Roll, R. 1986, ‘The Hubris Hypothesis of Corporate Takeovers’, Journal of Business,
vol. 59, no. 2, pp. 197-217
Ross, S. A. 2002, ‘Neoclassical Finance, Alternative Finance and the Closed End Fund
Puzzle’, European Financial Management, vol. 8, no. 2, pp. 129-137.
Salinger, M. 1992, ‘Standard Errors in Event Studies’, Journal of Financial and Quanti-
tative Analysis, vol. 27, no. 1, pp. 39-53.
Schipper, K. & Thompson, R. 1983, ’Evidence on the Capitalized Value of Merger Ac-
tivity for Acquiring Firms’, Journal of Financial Economics, vol. 1,, pp. 85-119.

AN EXPLORATIVE EVENT STUDY OF LISTED PRIVATE EQUITY VEHICLES
JULY 2012 MATHIAS LETH NIELSEN 71
Singh, H. 1990, ’Management Buyouts: Distinguishing Characteristics and Operating
Changes Prior to Public Offering’, Strategic Management Journal, vol. 11, no. 4, pp.
111-129.
Sloan, A. & Benner, K. 2008, ‘The Year of the Vulture’, Fortune, vol. 157, no. 11, pp.
62-70.
Spliid, R. 2007, Kapitalfonde – Rå pengemagt eller aktivt ejerskab, Børsens Forlag,
Copenhagen.
Stotz, O. 2011, ‘The Influence of Geography on the Success of Private Equity: Invest-
ments in Listed Equity’, Applied Financial Economics, vol. 21, pp. 1605-1615.
Sudarsanam, S. 2003, Creating Value from Mergers and Acquisitions, Prentice Hall,
Harlow, the United Kingdom.
Talmor, E. & Vasvari, F. 2012, International Private Equity, Wiley, West Sussex, the
United Kingdom.
Thompson, R. 1995, ‘Empirical Methods of Event Studies in Corporate Finance’, in
Jarrow, R., Maksimovic, V. & Ziemba, W. T. (ed.), Handbooks in Operations Research
& Management Science, vol. 9, Elsevier Science B. V., the Netherlands, pp. 963-992.
U.S. Securities and Exchange Commission 2011, Division of Corporate Finance:
Standard Industrial Classification (SIC) Code List, Accessed 18th
of May 2012,
<http://www.sec.gov/info/edgar/siccodes.htm>.
Vinten, F. & Thomsen, S. 2008, ‘A Review of Private Equity’, Copenhagen Business
School, Center for Corporate Governance Working Papers, no. 1.
Wood, G. & Wright, M. 2009, ‘Private Equity: A Review and Synthesis’, International
Journal of Management Reviews, vol. 11, no. 4, pp. 361-380.
Wright, M., Renneboog, L., Simons, T. & Scholes, L. 2006, ‘Leveraged Buyouts in the
U.K. and Continental Europe: Retrospect and Prospect’, Journal of Applied Corporate
Finance, vol. 18, no. 3, pp. 38-55.
Wruck, K. H. 1989, ‘Equity Ownership Concentration and Firm Value: Evidence from
Private Equity Financings’, Journal of Financial Economics, vol. 23, pp. 3-28.

AN EXPLORATIVE EVENT STUDY OF LISTED PRIVATE EQUITY VEHICLES
JULY 2012 MATHIAS LETH NIELSEN 72
14. APPENDICES
List of Appendices
Appendix 1 – Comparison of LPEVs and PEVs 73
Appendix 2 – Overview of M&A Activity, 2002-2012 74
Appendix 3 – Sample Selection Process 75
Appendix 4 – List of Deals 76
Appendix 5 – Descriptive Statistics 81
Appendix 6 – Presentation of Test Statistics 89
Appendix 7 – Test of Assumptions 94
Appendix 8 – Results for the Sample excl. 3i Group PLC 98
Appendix 9 – Test for Differences in CAAR 99
Appendices on the enclosed CDROM
1. Content of the CDROM
2. M&A Activity, 2002-2012
3. List of LPEVs
4. Final Sample
5. Descriptive Statistics
6. T1-T8
7. T1-T8 (excl. 3i Group)
8. Tests for Differences

AN EXPLORATIVE EVENT STUDY OF LISTED PRIVATE EQUITY VEHICLES
JULY 2012 MATHIAS LETH NIELSEN 73
Appendix 1 – Comparison of LPEVs and PEVs
Exhibit A.1 – Comparison of LPEVs and PEVs
Listed Private Equity Vehicles Unlisted Private Equity Vehicles
Trade at a stock exchange Trade in secondary markets
Liquid and easy to enter/exit Illiquid and hard to enter/exit
No transaction costs expect the bid-ask spread Significant transaction costs due to restrictions on
trade and illiquidity discount
Easy performance evaluation Complicated performance evaluation
No minimum investment requires, i.e. access for
retail investors
High minimum investment requirements, i.e. no
access for retail investors
Easy to diversify investments due to liquidity and
no minimum required investment
Hard to diversify due to limited liquidity and high
minimum required investment
Unlimited life (evergreen) Limited life
Capital is permanent Capital is raised for each new fund
Realization proceeds are often retained and rein-
vested
Realization proceeds are returned to investors
Mainly structured as LPE funds, but quite diverse Mainly structured as LPE funds
Investors buy shares at a NAV discount Investors buy shares at the asset value
Invest in other assets than private equity Do not invest in non-private equity assets
Allow for a flexible investment horizon Fixed investment horizon of 7-10 years
No J-curve effect J-curve effect
Transparent and decent disclosure Limited disclosure and transparency
Handle cash management Cash management is handled by the limited part-
nership
Lower fees 2% management fee and 20% carried interest
Do not offer co-investment opportunities Offer co-investment opportunities
Small Large
Note: *NAV = Net Asset Value
Sources: Bauer et al. 2001; Bilo et al. 2005; Bergmann et al. 2009; Lahr & Herschke 2009; Brown & Kräussl 2010; Jegadeesh,
Kräussl & Pollet 2010; Cumming et al. 2011; Goldman 2011; LPEQ 2012; LPX Group 2012a; Talmor & Vasvari 2012.
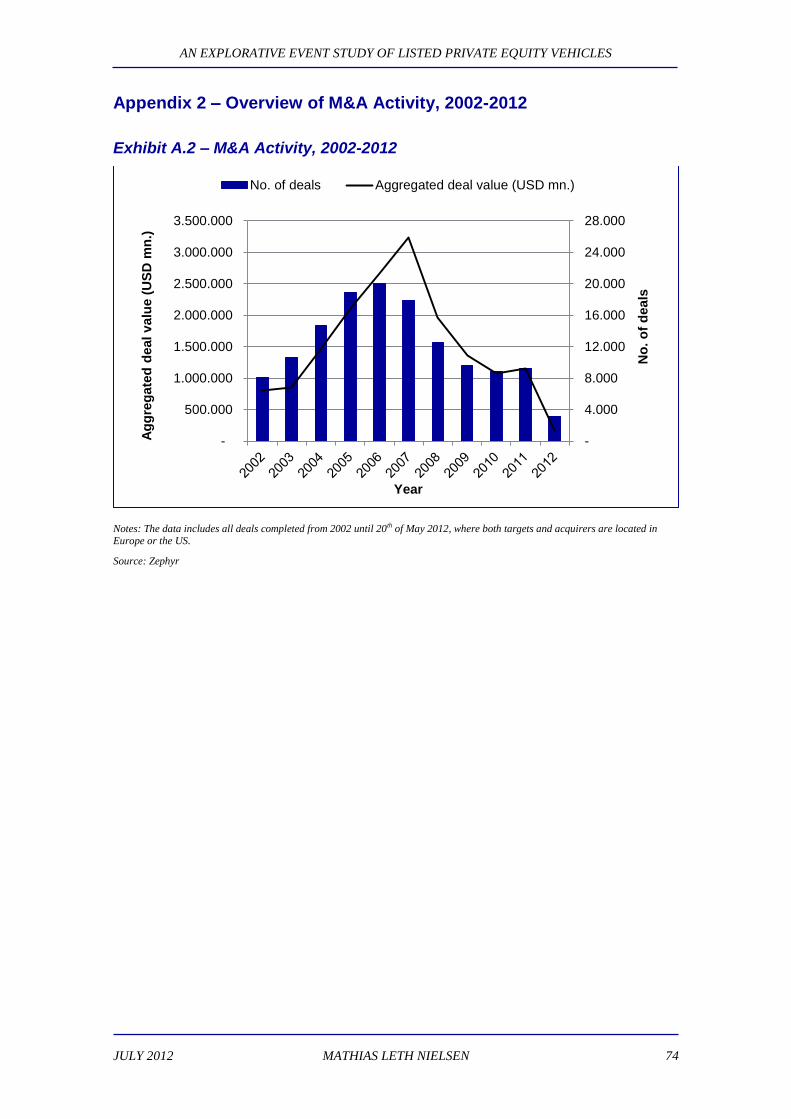
AN EXPLORATIVE EVENT STUDY OF LISTED PRIVATE EQUITY VEHICLES
JULY 2012 MATHIAS LETH NIELSEN 74
Appendix 2 – Overview of M&A Activity, 2002-2012
Exhibit A.2 – M&A Activity, 2002-2012
Notes: The data includes all deals completed from 2002 until 20th of May 2012, where both targets and acquirers are located in Europe or the US.
Source: Zephyr
-
4.000
8.000
12.000
16.000
20.000
24.000
28.000
-
500.000
1.000.000
1.500.000
2.000.000
2.500.000
3.000.000
3.500.000
No
. o
f d
eals
Ag
gre
gate
d d
eal
valu
e (
US
D m
n.)
Year
No. of deals Aggregated deal value (USD mn.)
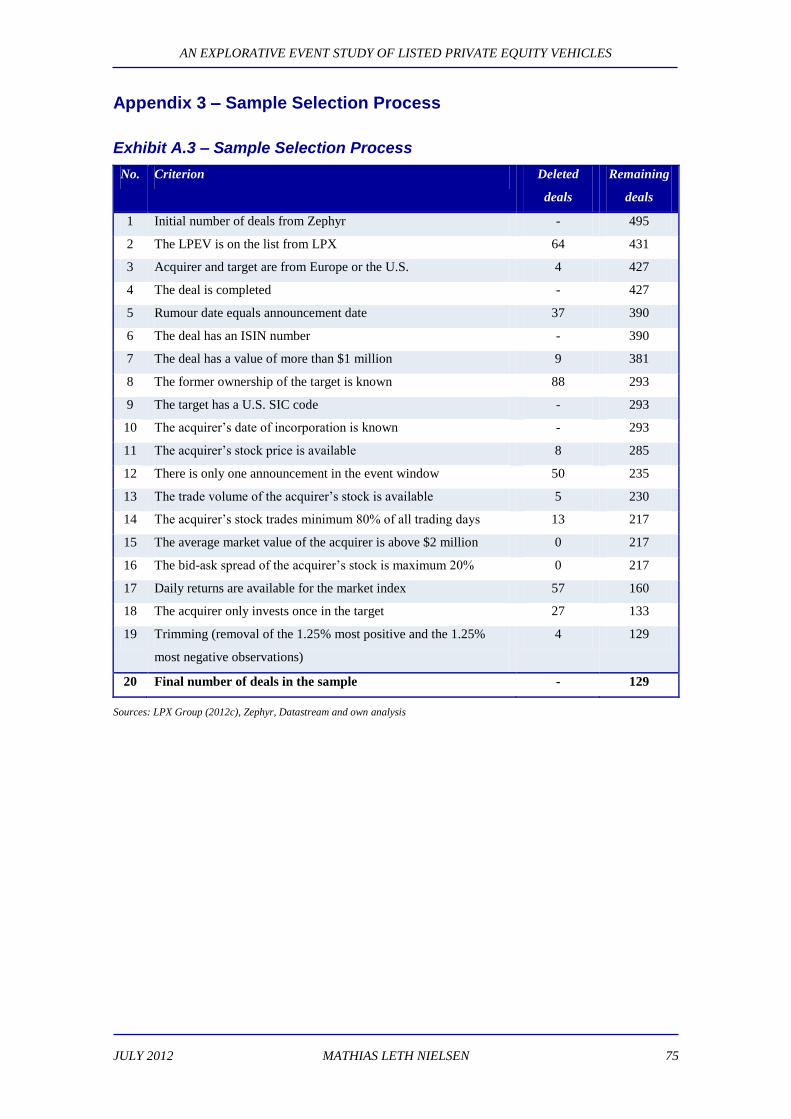
AN EXPLORATIVE EVENT STUDY OF LISTED PRIVATE EQUITY VEHICLES
JULY 2012 MATHIAS LETH NIELSEN 75
Appendix 3 – Sample Selection Process
Exhibit A.3 – Sample Selection Process
No. Criterion Deleted
deals
Remaining
deals
1 Initial number of deals from Zephyr - 495
2 The LPEV is on the list from LPX 64 431
3 Acquirer and target are from Europe or the U.S. 4 427
4 The deal is completed - 427
5 Rumour date equals announcement date 37 390
6 The deal has an ISIN number - 390
7 The deal has a value of more than $1 million 9 381
8 The former ownership of the target is known 88 293
9 The target has a U.S. SIC code - 293
10 The acquirer’s date of incorporation is known - 293
11 The acquirer’s stock price is available 8 285
12 There is only one announcement in the event window 50 235
13 The trade volume of the acquirer’s stock is available 5 230
14 The acquirer’s stock trades minimum 80% of all trading days 13 217
15 The average market value of the acquirer is above $2 million 0 217
16 The bid-ask spread of the acquirer’s stock is maximum 20% 0 217
17 Daily returns are available for the market index 57 160
18 The acquirer only invests once in the target 27 133
19 Trimming (removal of the 1.25% most positive and the 1.25%
most negative observations)
4 129
20 Final number of deals in the sample - 129
Sources: LPX Group (2012c), Zephyr, Datastream and own analysis

AN EXPLORATIVE EVENT STUDY OF LISTED PRIVATE EQUITY VEHICLES
JULY 2012 MATHIAS LETH NIELSEN 76
Appendix 4 – List of Deals
Exhibit A.4 – List of Deals
Acquirer name Acquirer
country
code
Target name Target
country
code
3I GROUP PLC GB CONSILIUM TECHNOLOGIES LTD GB
3I GROUP PLC GB LAMY SA FR
3I GROUP PLC GB PETROFAC LTD GB
3I GROUP PLC GB PROVIMAR SA ES
3I GROUP PLC GB PIXOLOGY GB
3I GROUP PLC GB ASPECTS SOFTWARE LTD GB
3I GROUP PLC GB LA CHEMIAL SPA IT
3I GROUP PLC GB DISPLAY PRODUCTS TECHNOLOGY
LTD
GB
3I GROUP PLC GB RICH XIBERTA SA ES
3I GROUP PLC GB PROSOL GESTION SA FR
3I GROUP PLC GB EPIGENOMICS AG DE
3I GROUP PLC GB TOP LAYER NETWORKS INC. US
3I GROUP PLC GB JDH HOLDINGS LTD GB
3I GROUP PLC GB JUTEL OY FI
3I GROUP PLC GB TRANSMOL LOGÍSTICA SL ES
3I GROUP PLC GB HUNTSWOOD PLC GB
3I GROUP PLC GB NEUROTECH SA FR
3I GROUP PLC GB LDV LTD GB
3I GROUP PLC GB VANYERA 3 SL ES
3I GROUP PLC GB REPUBLIC LTD GB
3I GROUP PLC GB WILLIAMS LEA GROUP LTD GB
3I GROUP PLC GB MACTIVE AB SE
3I GROUP PLC GB ROLLER STAR SA ES
3I GROUP PLC GB MICROSULIS LTD GB
3I GROUP PLC GB MICROEMISSIVE DISPLAYS LTD GB
3I GROUP PLC GB VIBRATION TECHNOLOGY LTD GB
3I GROUP PLC GB NOVEM CAR INTERIOR DESIGN
GMBH
DE

AN EXPLORATIVE EVENT STUDY OF LISTED PRIVATE EQUITY VEHICLES
JULY 2012 MATHIAS LETH NIELSEN 77
3I GROUP PLC GB ARCCURE TECHNOLOGIES GMBH DE
3I GROUP PLC GB STI SPA IT
3I GROUP PLC GB INFINITE DATA STORAGE LTD GB
3I GROUP PLC GB GRIES-DECO-COMPANY GMBH DE
3I GROUP PLC GB PHARMETRICS INC. US
3I GROUP PLC GB NOVEXEL SA FR
3I GROUP PLC GB INCLINE GLOBAL TECHNOLOGY
SERVICES LTD
GB
3I GROUP PLC GB VONAGE HOLDINGS CORPORATION US
3I GROUP PLC GB DAALDEROP BV NL
3I GROUP PLC GB BRAINSHARK INC. US
3I GROUP PLC GB FIOS INC. US
3I GROUP PLC GB SALAMANDER ENERGY (THAI-
LAND) LTD
GB
3I GROUP PLC GB TRANSPORTS ALLOIN SAS FR
3I GROUP PLC GB SCREENTONIC SA FR
3I GROUP PLC GB COMBINATURE BIOPHARM AG DE
3I GROUP PLC GB MERIDEA FINANCIAL SOFTWARE
OY
FI
3I GROUP PLC GB CHRONICLE SOLUTIONS (UK) LIM-
ITED
GB
3I GROUP PLC GB AMBERWAVE SYSTEMS CORPORA-
TION
US
3I GROUP PLC GB HTC SWEDEN AB SE
3I GROUP PLC GB SONIM TECHNOLOGIES INC. US
3I GROUP PLC GB FOTOLOG INC. US
3I GROUP PLC GB GIRAFFE CONCEPTS LTD GB
3I GROUP PLC GB NETRONOME SYSTEMS INC. US
3I GROUP PLC GB AZELIS SA LU
3I GROUP PLC GB CERENICIMO SAS FR
3I GROUP PLC GB KINETO WIRELESS INC. US
3I GROUP PLC GB VETTE CORPORATION US
3I GROUP PLC GB KNEIP COMMUNICATION SA LU
3I GROUP PLC GB ADVANCED POWER AG CH
3I GROUP PLC GB AOPTIX TECHNOLOGIES INC. US

AN EXPLORATIVE EVENT STUDY OF LISTED PRIVATE EQUITY VEHICLES
JULY 2012 MATHIAS LETH NIELSEN 78
3I GROUP PLC GB FINNET OY FI
3I GROUP PLC GB INTALIO INC. US
3I GROUP PLC GB METASTORM INC. US
3I GROUP PLC GB CAIR LGL SA FR
3I GROUP PLC GB CAMBRIDGE SEMICONDUCTOR LTD GB
3I GROUP PLC GB UNIÓN RADIO SA ES
3I GROUP PLC GB TSMARINE (CONTRACTING) LTD GB
3I GROUP PLC GB VELOCIX LTD GB
3I GROUP PLC GB DATANOMIC LTD GB
3I GROUP PLC GB COREMETRICS INC. US
3I GROUP PLC GB LABCO SAS FR
3I GROUP PLC GB WELLPARTNER INC. US
3I GROUP PLC GB ENOCEAN GMBH DE
3I GROUP PLC GB NUJIRA LTD GB
3I GROUP PLC GB GARLIK LTD GB
3I GROUP PLC GB VNU MEDIA BV NL
3I GROUP PLC GB REFRESCO HOLDING BV NL
3I GROUP PLC GB STORK MATERIALS TECHNOLOGY
BV
NL
3I GROUP PLC GB GO OUTDOORS LTD GB
ALTAMIR ET COMPAGNIE SCA FR FRANCE TÉLÉCOM MOBILE SATEL-
LITE COMMUNICATIONS SA
FR
ARQUES INDUSTRIES AG DE ACTEBIS COMPUTERS BV NL
ARQUES INDUSTRIES AG DE OXXYNOVA GMBH & CO. KG DE
BURE EQUITY AB SE RUSHRAIL AB SE
BURE EQUITY AB SE VITTRA AB SE
BURE EQUITY AB SE CYGATE AB SE
BURE EQUITY AB SE CARL BRO A/S DK
CANDOVER INVESTMENTS PLC GB THULE AB SE
CANDOVER INVESTMENTS PLC GB EXTRAPRISE GROUP INC. US
CAPMAN OYJ FI SCAN·JOUR A/S DK
CAPMAN OYJ FI NEOVENTA MEDICAL SE
CAPMAN OYJ FI VARESVUO PARTNERS OY FI

AN EXPLORATIVE EVENT STUDY OF LISTED PRIVATE EQUITY VEHICLES
JULY 2012 MATHIAS LETH NIELSEN 79
CAPMAN OYJ FI SILEX MICROSYSTEMS AB SE
DEA CAPITAL SPA IT FIRST ATLANTIC REAL ESTATE
HOLDING SPA
IT
DEA CAPITAL SPA IT LANIFICIO LUIGI BOTTO SPA IT
DEUTSCHE BETEILIGUNGS AG DE CLYDE BERGEMANN GMBH MAS-
CHINEN- UND APPARATEBAU
DE
DINAMIA CAPITAL PRIVADO SCR
SA
ES BESTIN SUPPLY CHAIN SL ES
DINAMIA CAPITAL PRIVADO SCR
SA
ES SOCIEDAD GESTORA DE TELE-
VISIÓN NET TV SA
ES
DINAMIA CAPITAL PRIVADO SCR
SA
ES SAFE 2000 SL ES
DINAMIA CAPITAL PRIVADO SCR
SA
ES ÉMFASIS BILLING & MARKETING
SERVICES SL
ES
DINAMIA CAPITAL PRIVADO SCR
SA
ES SAINT GERMAIN GRUPO DE INVER-
SIONES SL
ES
DINAMIA CAPITAL PRIVADO SCR
SA
ES ESTACIONAMIENTOS Y SERVICIOS
SA
ES
DINAMIA CAPITAL PRIVADO SCR
SA
ES SERVICIO DE VENTA AUTOMÁTICA
SA
ES
ELECTRA PRIVATE EQUITY PLC GB FORTHPANEL LTD GB
EURAZEO SA FR GALAXIE SA FR
EURAZEO SA FR AIR LIQUIDE SA FR
GIMV NV BE INTERWISE INC. US
GIMV NV BE OPENBRAVO SL ES
GIMV NV BE VANDEMOORTELE NV BE
GIMV NV BE UBIDYNE GMBH DE
GIMV NV BE EASYVOYAGE SA FR
GIMV NV BE RES HOLDING BV NL
GIMV NV BE MCPHY ENERGY SA FR
GIMV NV BE PRIVATE OUTLET SAS FR
GIMV NV BE EDEN CHOCOLATES BE
GIMV NV BE PE INTERNATIONAL GMBH DE
GIMV NV BE AMBIT BIOSCIENCES CORPORA-
TION
US
GIMV NV BE EBUZZING FR
GIMV NV BE TINUBU SQUARE FR
GIMV NV BE PRONOTA NV BE

AN EXPLORATIVE EVENT STUDY OF LISTED PRIVATE EQUITY VEHICLES
JULY 2012 MATHIAS LETH NIELSEN 80
GIMV NV BE PROSENSA HOLDING BV NL
HELIAD EQUITY PARTNERS GMBH
& CO. KGAA
DE VANGUARD AG DE
INTERNET CAPITAL GROUP INC. US VCOMMERCE CORPORATION US
INTERNET CAPITAL GROUP INC. US CHANNEL INTELLIGENCE INC. US
INTERNET CAPITAL GROUP INC. US STARCITE INC. US
INTERNET CAPITAL GROUP INC. US ICG COMMERCE INC. US
KOHLBERG KRAVIS ROBERTS &
COMPANY LP
US FOTOLIA LLC US
MARFIN INVESTMENT GROUP
HOLDINGS SA
GR SUNCE KONCERN DOO HR
MARFIN INVESTMENT GROUP
HOLDINGS SA
GR FAI RENT-A-JET AG DE
RATOS AB SE ARCORUS AB SE
RATOS AB SE ARCUS-GRUPPEN AS NO
RATOS AB SE INWIDO FINLAND OY FI
WENDEL SA FR STAHL GROUP BV NL
Source: Zephyr

AN EXPLORATIVE EVENT STUDY OF LISTED PRIVATE EQUITY VEHICLES
JULY 2012 MATHIAS LETH NIELSEN 81
Appendix 5 – Descriptive Statistics
Deal Characteristics
Exhibit A.5.1 – Deal Activity per Year
Notes: Pre-2003 includes 1 deal from 2001 and 9 deals from 2002. 2012 includes deals until 20.05.2012.
Source: Zephyr
Exhibit A.5.2 – Deal Period
Deal Period No. of deals Percentage
2001 – 2003* 20 15.5%
2004 - 2008 86 66.7%
2009 – 2012** 23 17.8%
Total 129 100.0%
Notes:*The period 2001-2003 includes only one deal from 2001, **the period 2009-2012 includes deals until 20.05.2012. This
includes 4 deals from 2012.
Source: Zephyr
-
4
8
12
16
20
24
28
-
250
500
750
1.000
1.250
1.500
1.750
No
. o
f d
eals
Ag
gre
gate
d d
eal
valu
e (
US
D m
n.)
Year
No. of deals Aggregated deal value (USD mn.)
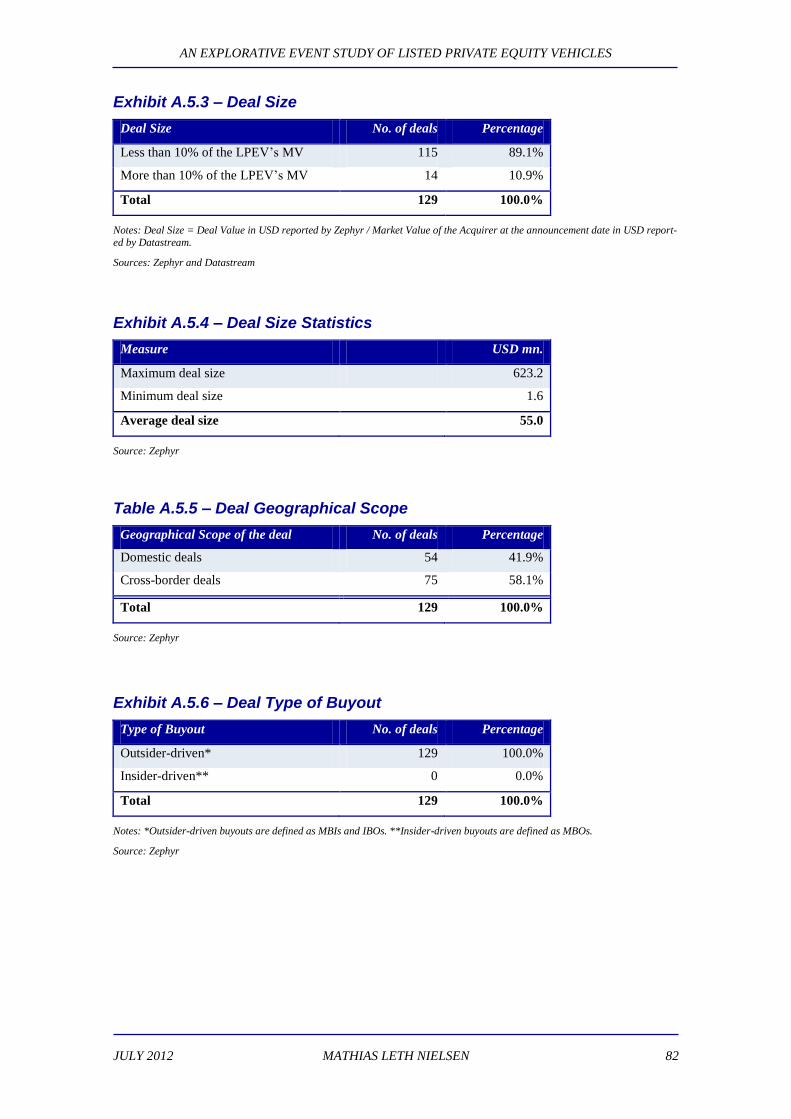
AN EXPLORATIVE EVENT STUDY OF LISTED PRIVATE EQUITY VEHICLES
JULY 2012 MATHIAS LETH NIELSEN 82
Exhibit A.5.3 – Deal Size
Deal Size No. of deals Percentage
Less than 10% of the LPEV’s MV 115 89.1%
More than 10% of the LPEV’s MV 14 10.9%
Total 129 100.0%
Notes: Deal Size = Deal Value in USD reported by Zephyr / Market Value of the Acquirer at the announcement date in USD report-
ed by Datastream.
Sources: Zephyr and Datastream
Exhibit A.5.4 – Deal Size Statistics
Measure USD mn.
Maximum deal size 623.2
Minimum deal size 1.6
Average deal size 55.0
Source: Zephyr
Table A.5.5 – Deal Geographical Scope
Geographical Scope of the deal No. of deals Percentage
Domestic deals 54 41.9%
Cross-border deals 75 58.1%
Total 129 100.0%
Source: Zephyr
Exhibit A.5.6 – Deal Type of Buyout
Type of Buyout No. of deals Percentage
Outsider-driven* 129 100.0%
Insider-driven** 0 0.0%
Total 129 100.0%
Notes: *Outsider-driven buyouts are defined as MBIs and IBOs. **Insider-driven buyouts are defined as MBOs.
Source: Zephyr
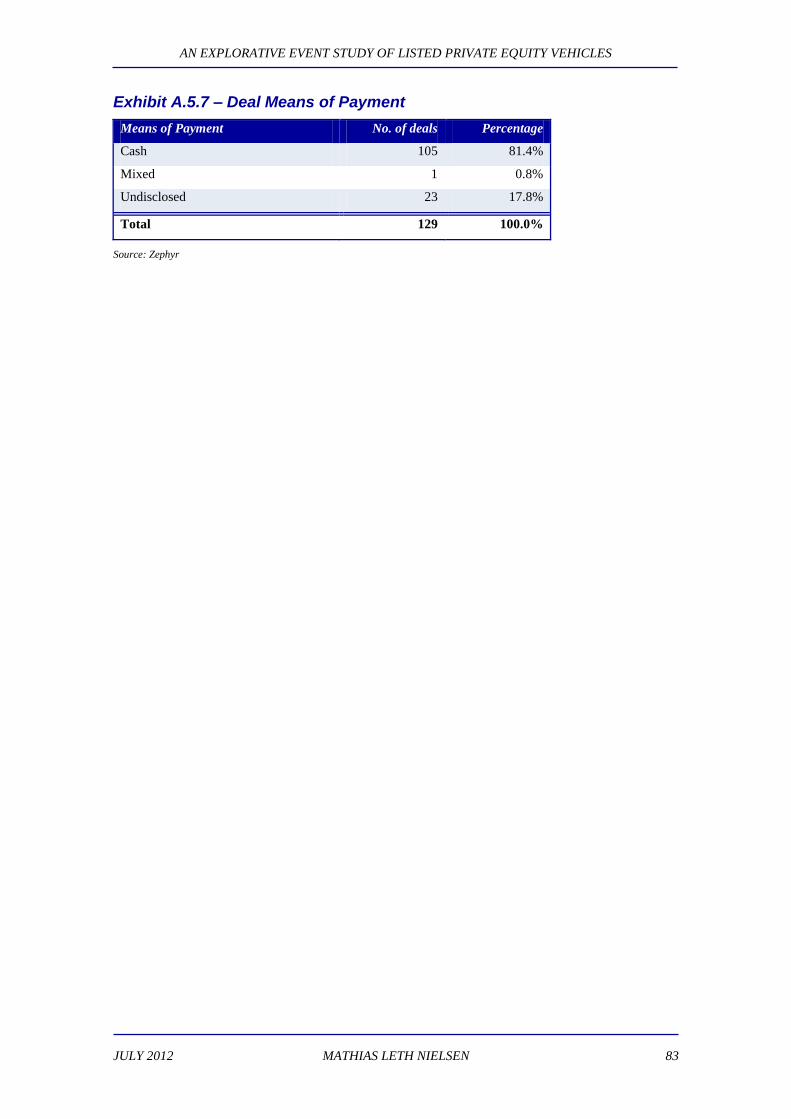
AN EXPLORATIVE EVENT STUDY OF LISTED PRIVATE EQUITY VEHICLES
JULY 2012 MATHIAS LETH NIELSEN 83
Exhibit A.5.7 – Deal Means of Payment
Means of Payment No. of deals Percentage
Cash 105 81.4%
Mixed 1 0.8%
Undisclosed 23 17.8%
Total 129 100.0%
Source: Zephyr

AN EXPLORATIVE EVENT STUDY OF LISTED PRIVATE EQUITY VEHICLES
JULY 2012 MATHIAS LETH NIELSEN 84
Target Characteristics
Exhibit A.5.8 – Target Industry
Note: Targets are classified according to their primary US SIC codes.
Sources: Zephyr, NAICS Association (2008), and U.S. Securities and Exchange Commission (2011).
Table A.5.9 – Target Legal Origin
Legal Origin of the Target No. of deals Percentage
Common law country 50 38.8%
Civil law country 79 61.2%
Total 129 100.0%
Source: Zephyr
Table A.5.10 – Target Former Ownership
Former Ownership of the Target No. of deals Percentage
Public ownership 4 3.1%
Private ownership 125 96.9%
Total 129 100.0%
Source: Zephyr
- 10 20 30 40 50 60 70
Construction & Mining
Finance, Insurance & Real Estate
Transportation, Communications,
Electric, Gas and Sanitary Services
Wholesale & Retail Trade
Manufacturing
Services
No. of targets

AN EXPLORATIVE EVENT STUDY OF LISTED PRIVATE EQUITY VEHICLES
JULY 2012 MATHIAS LETH NIELSEN 85
Exhibit A.5.11 – Target Geographical Origin
Country code (country) No. of deals Percentage
BE (Belgium) 3 2.3%
CH (Switzerland) 1 0.8%
DE (Germany) 12 9.3%
DK (Denmark) 2 1.6%
ES (Spain) 14 10.9%
FI (Finland) 5 3.9%
FR (France) 17 13.2%
GB (the U.K.) 26 20.2%
HR (Croatia) 1 0.8%
IT (Italy) 4 3.1%
LU (Luxembourg) 2 1.6%
NL (Netherlands) 8 6.2%
NO (Norway) 1 0.8%
SE (Sweden) 9 7.0%
US (the U.S.) 24 18.6%
Total 129 100.0%
Source: Zephyr
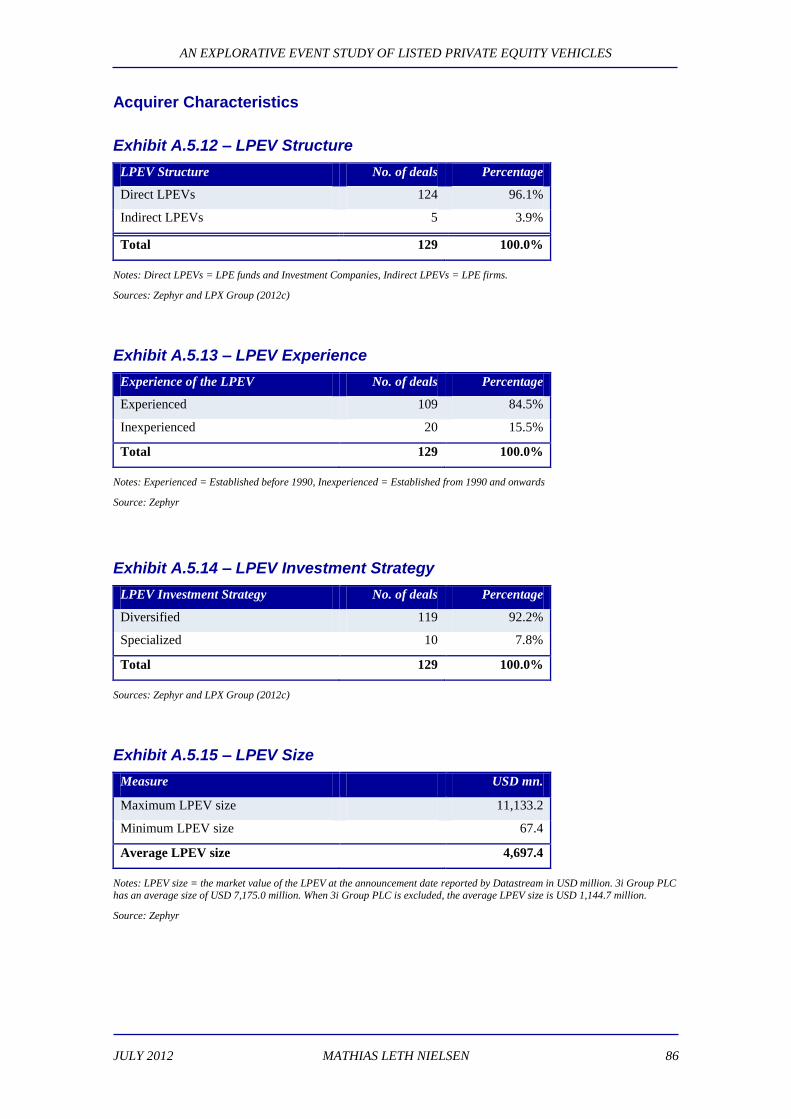
AN EXPLORATIVE EVENT STUDY OF LISTED PRIVATE EQUITY VEHICLES
JULY 2012 MATHIAS LETH NIELSEN 86
Acquirer Characteristics
Exhibit A.5.12 – LPEV Structure
LPEV Structure No. of deals Percentage
Direct LPEVs 124 96.1%
Indirect LPEVs 5 3.9%
Total 129 100.0%
Notes: Direct LPEVs = LPE funds and Investment Companies, Indirect LPEVs = LPE firms.
Sources: Zephyr and LPX Group (2012c)
Exhibit A.5.13 – LPEV Experience
Experience of the LPEV No. of deals Percentage
Experienced 109 84.5%
Inexperienced 20 15.5%
Total 129 100.0%
Notes: Experienced = Established before 1990, Inexperienced = Established from 1990 and onwards
Source: Zephyr
Exhibit A.5.14 – LPEV Investment Strategy
LPEV Investment Strategy No. of deals Percentage
Diversified 119 92.2%
Specialized 10 7.8%
Total 129 100.0%
Sources: Zephyr and LPX Group (2012c)
Exhibit A.5.15 – LPEV Size
Measure USD mn.
Maximum LPEV size 11,133.2
Minimum LPEV size 67.4
Average LPEV size 4,697.4
Notes: LPEV size = the market value of the LPEV at the announcement date reported by Datastream in USD million. 3i Group PLC has an average size of USD 7,175.0 million. When 3i Group PLC is excluded, the average LPEV size is USD 1,144.7 million.
Source: Zephyr
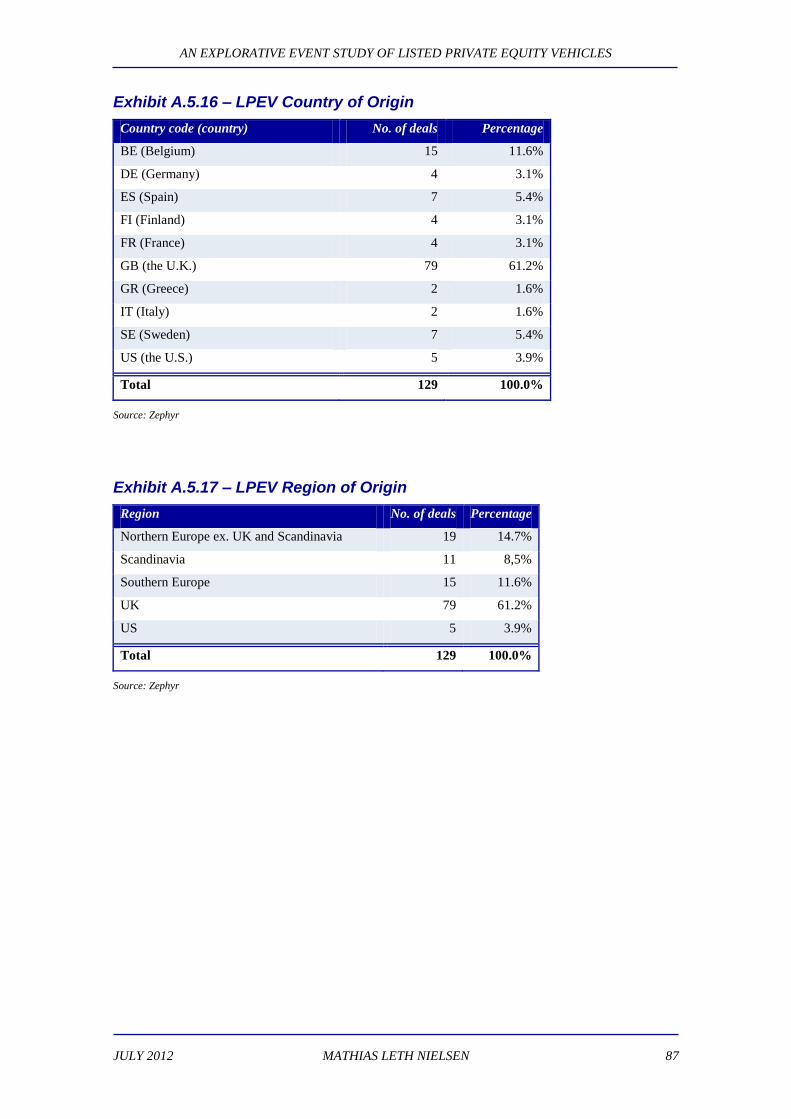
AN EXPLORATIVE EVENT STUDY OF LISTED PRIVATE EQUITY VEHICLES
JULY 2012 MATHIAS LETH NIELSEN 87
Exhibit A.5.16 – LPEV Country of Origin
Country code (country) No. of deals Percentage
BE (Belgium) 15 11.6%
DE (Germany) 4 3.1%
ES (Spain) 7 5.4%
FI (Finland) 4 3.1%
FR (France) 4 3.1%
GB (the U.K.) 79 61.2%
GR (Greece) 2 1.6%
IT (Italy) 2 1.6%
SE (Sweden) 7 5.4%
US (the U.S.) 5 3.9%
Total 129 100.0%
Source: Zephyr
Exhibit A.5.17 – LPEV Region of Origin
Region No. of deals Percentage
Northern Europe ex. UK and Scandinavia 19 14.7%
Scandinavia 11 8,5%
Southern Europe 15 11.6%
UK 79 61.2%
US 5 3.9%
Total 129 100.0%
Source: Zephyr
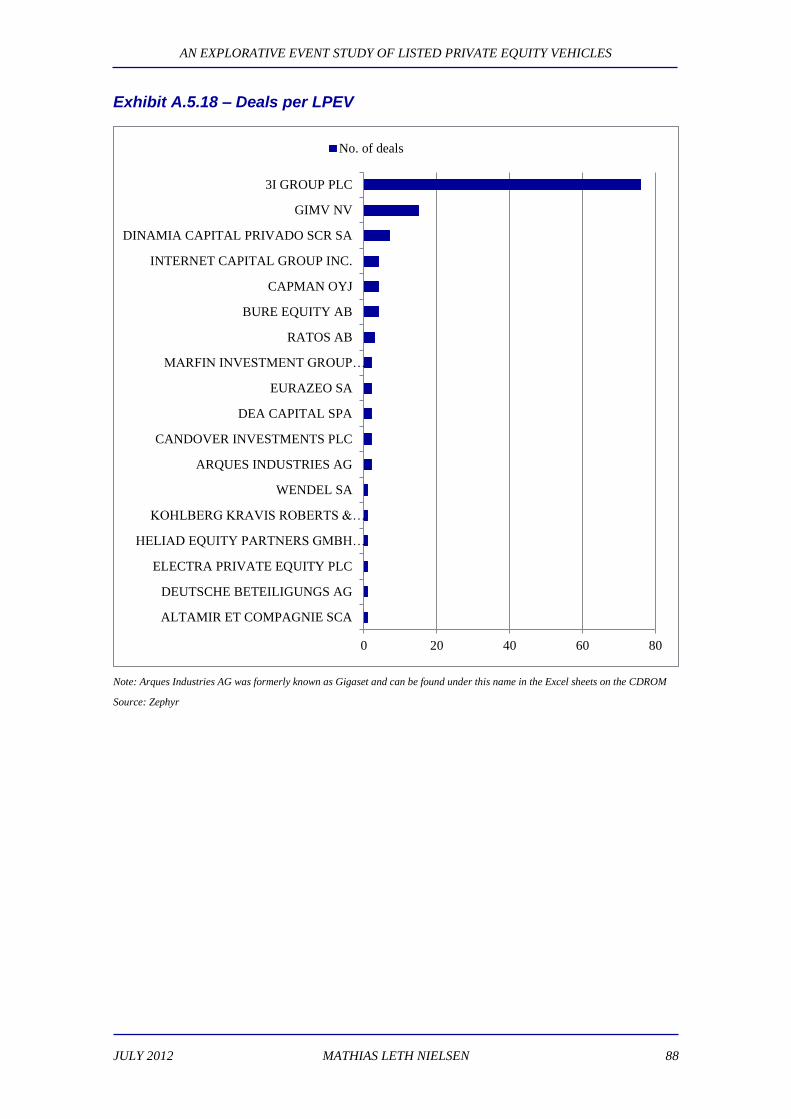
AN EXPLORATIVE EVENT STUDY OF LISTED PRIVATE EQUITY VEHICLES
JULY 2012 MATHIAS LETH NIELSEN 88
Exhibit A.5.18 – Deals per LPEV
Note: Arques Industries AG was formerly known as Gigaset and can be found under this name in the Excel sheets on the CDROM
Source: Zephyr
0 20 40 60 80
ALTAMIR ET COMPAGNIE SCA
DEUTSCHE BETEILIGUNGS AG
ELECTRA PRIVATE EQUITY PLC
HELIAD EQUITY PARTNERS GMBH…
KOHLBERG KRAVIS ROBERTS &…
WENDEL SA
ARQUES INDUSTRIES AG
CANDOVER INVESTMENTS PLC
DEA CAPITAL SPA
EURAZEO SA
MARFIN INVESTMENT GROUP…
RATOS AB
BURE EQUITY AB
CAPMAN OYJ
INTERNET CAPITAL GROUP INC.
DINAMIA CAPITAL PRIVADO SCR SA
GIMV NV
3I GROUP PLC
No. of deals

AN EXPLORATIVE EVENT STUDY OF LISTED PRIVATE EQUITY VEHICLES
JULY 2012 MATHIAS LETH NIELSEN 89
Appendix 6 – Presentation of Test Statistics
Test Statistics for the Analysis of H0: CAAR = 0
T1 – T-test with unadjusted variances (Bartholdy et al. 2007)
√ , (A.1)
where
√∑
∑ (A.2)
T1 adj. – T-test with Patell’s adjustment (Patell 1976; Bartholdy et al. 2007)
√ , (A.3)
where
√∑
∑
∑
(A.4)
T2 – T-test with standardized abnormal returns (Bartholdy et al. 2007)
∑
∑
∑
√ , (A.5)
where
(A.6)
and √
∑
(A.7)
T3 – T-test with standardized abnormal returns and Patell’s adjustment (Patell 1976;
Corrado 2011)
∑√
√
, (A.8)
46
where ∑ , (A.9)
with
(A.10)
and √
∑
∑
(A.11)
46 One could have used the adjustment for forecast errors suggested by Salinger (1992). The adjustment is, however,
only relevant if one uses longer event windows.

AN EXPLORATIVE EVENT STUDY OF LISTED PRIVATE EQUITY VEHICLES
JULY 2012 MATHIAS LETH NIELSEN 90
T4 – The Rank test (Corrado & Zivney 1992; Bartholdy et al. 2007)
∑
√ ∑
√ , (A.12)
where √
∑
√ ∑
, (A.13)
and
, (A.14)
where (A.15)
T5 – The Sign test (Campbell et al. 1997; Bartholdy et al. 2007)
∑
√ ∑
√ , (A.16)
where √
∑
√ ∑
(A.17)
and (A.18)
T6 – The Generalized Sign test (Bartholdy et al. 2007; Renneboog et al. 2007)
∑
√ , (A.19)
where ω is the number of positive CAARs in the event window for the sample
and SD √ , (A.20)
with
∑
∑
, (A.21)
and if and if (A.22)
T7 – The BMP test: A t-test with variance-adjusted standardized abnormal returns
(Boehmer et al. 1991; Bartholdy et al. 2007)
∑
√ , (A.23)
where √(
) ∑
∑
(A.24)

AN EXPLORATIVE EVENT STUDY OF LISTED PRIVATE EQUITY VEHICLES
JULY 2012 MATHIAS LETH NIELSEN 91
and ∑ (A.25)
with
, (A.26)
and √
∑
∑
(A.27)
T8 – The Rank test with variance-adjusted standardized abnormal returns (Patell
1976; Bartholdy et al. 2007)
∑
√ ∑
√ , (A.28)
where √
∑
√ ∑
(A.29)
and
, (A.30)
where (A.31)
When then is used in (A.31),
where
, (A.32)
with √
∑
for the estimation period (A.33)
and √
∑
∑
for the event window (A.34)
When then is used instead of in (A.31),
where
, (A.35)
with √
∑
∑
(A.36)

AN EXPLORATIVE EVENT STUDY OF LISTED PRIVATE EQUITY VEHICLES
JULY 2012 MATHIAS LETH NIELSEN 92
Test Statistics for the Analysis of Differences between Groups
T-test for differences between two means with equal variances (Keller 2005)
√
, (A.37)
where
(A.38)
The test statistic has degrees of freedom.
T-test for differences in between two means with unequal variances (Keller 2005)
√
, (A.39)
with (
)
(
)
(
)
degrees of freemdom.
F-test for differences in variances (Keller 2005)
To test whether there are unequal variances, an F-test is used:
, (A.40)
with and degrees of freedom.
Wilcoxon Rank Sum test for differences between two locations (Keller 2005)
, (A.41)
where ∑ , (A.42)
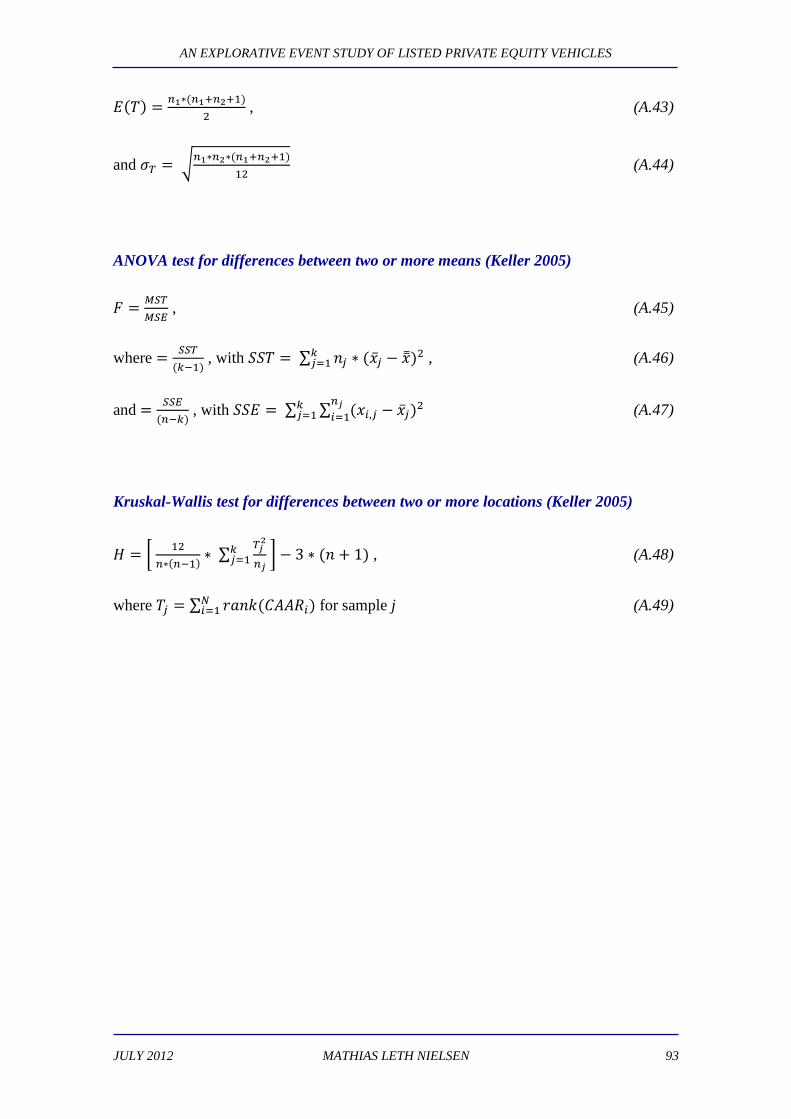
AN EXPLORATIVE EVENT STUDY OF LISTED PRIVATE EQUITY VEHICLES
JULY 2012 MATHIAS LETH NIELSEN 93
, (A.43)
and √
(A.44)
ANOVA test for differences between two or more means (Keller 2005)
, (A.45)
where
, with ∑
, (A.46)
and
, with ∑ ∑
(A.47)
Kruskal-Wallis test for differences between two or more locations (Keller 2005)
[
∑
] , (A.48)
where ∑ for sample j (A.49)
.
.
.
.
.
.

AN EXPLORATIVE EVENT STUDY OF LISTED PRIVATE EQUITY VEHICLES
JULY 2012 MATHIAS LETH NIELSEN 94
Appendix 7 – Test of Assumptions
According to Campbell et al. (1997) parametric tests in event studies rely on the as-
sumption of independent and identically distributed (i.i.d.) abnormal returns:
(A.50)
This assumption is evaluated, both for the total sample and for a sample excl. 3i Group
PLC, by making a histogram of the abnormal returns along with a P-P plot of the stand-
ardized abnormal returns. In addition to this, measures of kurtosis and skewness are
calculated and a Jarque-Bera test is performed. A sample is evaluated to follow the
normal distribution if it has a kurtosis close to three and a skewness of zero. Alterna-
tively, a sample is said to follow the normal distribution if the Jarque-Bera statistic is
insignificant.
From exhibit A.7.1 one can see that the skewness is approximately zero and that the
kurtosis is close to three. In addition to this, the Jarque-Bera statistic is insignificant,
since it has a p-value of 0.426. Thus, the assumption is evaluated to be fulfilled for the
total sample. This is confirmed by looking at the histogram and the P-P plot of the
standardized abnormal returns in exhibit A.7.2.
Exhibit A.7.1 – Histogram, Descriptive Statistics and Test of Normality
Sources: Own calculations in MS Excel 2007 and EViews 5.0
0
4
8
12
16
20
-0.0250 -0.0125 -0.0000 0.0125 0.0250
Series: CAR
Sample 1 129
Observations 129
Mean 0.001142
Median 0.000680
Maximum 0.024072
Minimum -0.024581
Std. Dev. 0.008890
Skewness -0.028432
Kurtosis 3.560549
Jarque-Bera 1.706285
Probability 0.426074

AN EXPLORATIVE EVENT STUDY OF LISTED PRIVATE EQUITY VEHICLES
JULY 2012 MATHIAS LETH NIELSEN 95
Exhibit A.7.2 – P-P plot of Standardized Abnormal Returns
Sources: Own calculations in MS Excel 2007 and EViews 5.0
From exhibit A.7.3 one can see that the skewness is -0.493 and that the kurtosis is
3.852. This is reasonably close to the required values of zero and three respectively. In
addition to this, the Jarque-Bera statistic is insignificant, since it has a p-value of 0.153.
Thus, the assumption of i.i.d. is evaluated to be fulfilled for the sample which excludes
3i Group PLC. This is confirmed by looking at the histogram and the P-P plot of the
standardized abnormal returns in exhibit A.7.4, although the confirmation is not as
strong as for the total sample.
Exhibit A.7.3 – Histogram, Descriptive statistics and Test of Normality (excl. 3i Group PLC)
Sources: Own calculations in MS Excel 2007 and EViews 5.0
0
2
4
6
8
10
12
14
-0.02 -0.01 -0.00 0.01 0.02
Series: CAR2
Sample 1 129
Observations 53
Mean -0.000428
Median -0.000651
Maximum 0.017984
Minimum -0.024581
Std. Dev. 0.008124
Skewness -0.493947
Kurtosis 3.852071
Jarque-Bera 3.758496
Probability 0.152705
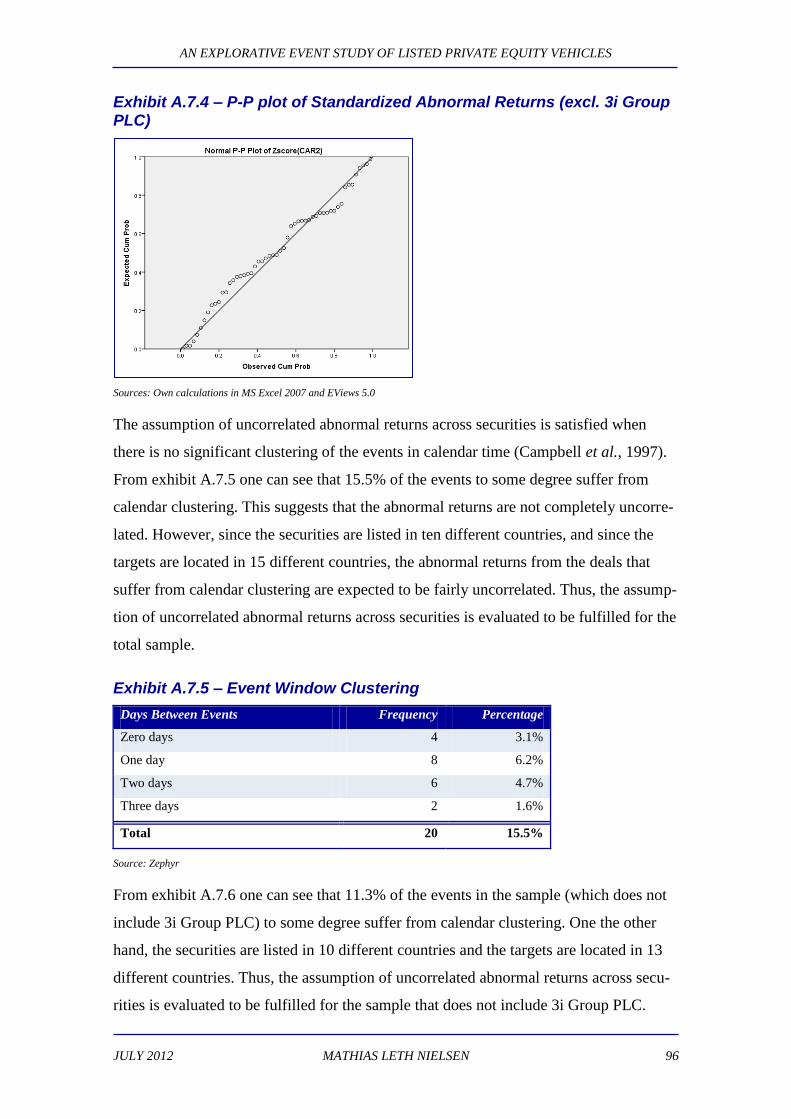
AN EXPLORATIVE EVENT STUDY OF LISTED PRIVATE EQUITY VEHICLES
JULY 2012 MATHIAS LETH NIELSEN 96
Exhibit A.7.4 – P-P plot of Standardized Abnormal Returns (excl. 3i Group PLC)
Sources: Own calculations in MS Excel 2007 and EViews 5.0
The assumption of uncorrelated abnormal returns across securities is satisfied when
there is no significant clustering of the events in calendar time (Campbell et al., 1997).
From exhibit A.7.5 one can see that 15.5% of the events to some degree suffer from
calendar clustering. This suggests that the abnormal returns are not completely uncorre-
lated. However, since the securities are listed in ten different countries, and since the
targets are located in 15 different countries, the abnormal returns from the deals that
suffer from calendar clustering are expected to be fairly uncorrelated. Thus, the assump-
tion of uncorrelated abnormal returns across securities is evaluated to be fulfilled for the
total sample.
Exhibit A.7.5 – Event Window Clustering
Days Between Events Frequency Percentage
Zero days 4 3.1%
One day 8 6.2%
Two days 6 4.7%
Three days 2 1.6%
Total 20 15.5%
Source: Zephyr
From exhibit A.7.6 one can see that 11.3% of the events in the sample (which does not
include 3i Group PLC) to some degree suffer from calendar clustering. One the other
hand, the securities are listed in 10 different countries and the targets are located in 13
different countries. Thus, the assumption of uncorrelated abnormal returns across secu-
rities is evaluated to be fulfilled for the sample that does not include 3i Group PLC.

AN EXPLORATIVE EVENT STUDY OF LISTED PRIVATE EQUITY VEHICLES
JULY 2012 MATHIAS LETH NIELSEN 97
Exhibit A.7.6 – Event Window Clustering (excl. 3i Group PLC)
Days Between Events Frequency Percentage
Zero days 2 3.8%
One day 2 3.8%
Two days 2 3.8%
Three days 0 0.0%
Total 6 11.3%
Source: Zephyr

AN EXPLORATIVE EVENT STUDY OF LISTED PRIVATE EQUITY VEHICLES
JULY 2012 MATHIAS LETH NIELSEN 98
Appendix 8 – Results for the Sample excl. 3i Group PLC
Exhibit A.8 – CAAR to Announcements of Acquisitions by LPEVs (excl. 3i
Group PLC)
Parametric tests Nonparametric tests Var. adj. tests Differences
Sample N CAAR T1 T1 adj. T2 T3 T4 T5 T6 T7 T8 T-test W-test
All acquirers(excl.3i) 53 -0.10% -0.20 -0.20 -0.41 -0.43 -0.33 -0.42 -0.26 -0.62 -0.34
Deal Period* 2.26 -4.17
2001 - 2003 2 2.56% 0.37 0.37 0.48 0.46 0.71 0.00 0.00 0.84 0.88
2004 - 2008 33 -0.29% -0.48 -0.48 -0.56 -0.58 -0.34 -0.31 -0.16 -0.67 -0.32
2009 - 2012 18 -0.04% -0.07 -0.07 -0.11 -0.11 -0.34 -0.27 -0.23 -0.13 -0.36
Deal Size 1.61c 0.97
Large 14 0.58% 0.47 0.47 0.35 0.35 0.26 -0.31 -0.26 0.38 0.25
Small 39 -0.34% -0.67 -0.66 -0.69 -0.71 -0.55 -0.29 -0.15 -0.85 -0.56
Target Industry* 0.66 -3.05
Min. & Con. 1 -0.60% -0.21 -0.21 -0.21 -0.21 -0.14 0.59 0.63 - -
Manufacturing 12 -0.02% -0.02 -0.02 -0.15 -0.16 0.05 0.00 0.01 -0.27 0.16
T., C., E., G. & S. S. 6 0.59% 0.44 0.44 0.95 0.94 1.06 1.39 1.48 1.38 1.12
W. & R. Trade 4 0.20% 0.12 0.12 -0.23 -0.23 -0.38 -0.59 -0.57 -0.40 -0.26
F., I. & R. E. 3 1.20% 0.56 0.56 0.49 0.41 0.44 0.33 0.34 0.36 0.45
Services 27 -0.45% -0.60 -0.59 -0.96 -0.95 -0.97 -1.22 -1.09 -1.10 -0.98
Target Legal Origin 0.83 1.11
Civil law 44 0.03% 0.06 0.06 0.14 0.11 0.27 0.36 0.46 0.13 0.24
Common law 9 -0.73% -0.43 -0.42 -1.30 -1.30 -1.22 -1.63 -1.66c -1.93c -1.22
Target Former Ownership - -1.18
Private 52 -0.12% -0.24 -0.24 -0.50 -0.52 -0.48 -0.50 -0.35 -0.60 -0.49
Public 1 1.20% 0.61 0.60 0.61 0.60 0.98 0.58 0.58 - -
LPEV Structure 1.87b 1.37c
Direct 48 0.05% 0.10 0.10 -0.07 -0.09 0.05 0.00 0.13 -0.10 0.07
Indirect 5 -1.54% -1.06 -1.06 -1.14 -1.13 -1.16 -1.29 -1.26 -1.20 -1.03
LPEV Experience 1.10 1.49c
Experienced 33 0.12% 0.26 0.25 0.07 0.07 0.26 0.74 0.77 0.08 0.31
Inexperienced 20 -0.46% -0.43 -0.43 -0.76 -0.79 -0.82 -1.54 -1.40 -0.82 -0.85
LPEV Investment Strategy 0.09 -0.11
Specialized 10 -0.05% -0.03 -0.03 -0.49 -0.49 -0.28 -1.09 -1.03 -0.46 -0.29
Diversified 43 -0.11% -0.23 -0.23 -0.22 -0.25 -0.21 0.09 0.20 -0.30 -0.22
Notes: CAAR is defined as the sum of CAR [-1; 1] divided by N. The significance level is indicated by a = 10%, b = 5%, and c = 1%. * implies that the tests for differences are the ANOVA test and the Kruskal-Wallis test. W-test = the Wilcoxon Rank Sum test. The test
for differences which is relied upon is marked with bold; the t-test is relied upon when the observations of both groups are normally
distributed according to a Jarque-Bera test; when they are not, the Wilcoxon Rank Sum test is relied upon. The industries are as
follows: ‘Min. & Con.” = Mining & Construction, “T., C., E., G. & S. S” = Transportation, Communication, Electric, Gas & Sanitary Services, “W. & R. Trade” = Wholesale & Retail Trade, and “F., I. & R. E.” = Finance, Insurance & Real Estate”.

AN EXPLORATIVE EVENT STUDY OF LISTED PRIVATE EQUITY VEHICLES
JULY 2012 MATHIAS LETH NIELSEN 99
Appendix 9 – Test for Differences in CAAR
Exhibit A.9.1 – Test for Differences in CAAR between the Overall Sample and the Sample excl. 3i Group
Notes: CAR = CAAR for the total sample, CAR2 = CAAR for the sample excl. 3i Group PLC.
Source: Analysis in EViews 5.0