an exploratory study blog visualization
TRANSCRIPT

The Japan Association for Educational Media Study
NII-Electronic Library Service
TheJapanAssociation for Educational Media Study
g -nit.N " utffptr'(7MX VoL19,Nol,35-46
An Exploratory Study
Learners' Reactions in an
on Blog
Online
Visualization and
Learning Community
Terumi Miyazee (Tokyo Denki University)
Terry Anderson (Athabasca University)
Shinichi Sato (Nihon Fukushi Uniyersity)
This exploratory study reports on studcnts' on]ine behavior within un cnvironment that
al]ows monitoring of their and others' work pcrformance in an ontine learning community,
Previous research showed that group dynamics can both foster and inhibit online participation. It
has also been suggested that visualization of the peri'ormance (such as a picture) of' all members
of a group works as an "externa]
feedback," which ean t'oster higher performance, Students in
this research could sec others' blog postings both in textual and N,isual formats, In this study, a
blog viewing tool was imp]emented in the middlc of the semester To observe changes in gtudents"
behavior as ref]ectcd in the frequency of theLr bleg posts. Two rnethods. quantitative blog text
analysis and post-course questionnaire administration, were used. The questionnaire was utilized
by the students to evaluate the usabiLity ef the blog viewing tool. Analysis revealed that students'
blog posting frequency remained t'airly high in the Lattcr half of the semester. The study suggests
the possibility that visuulization of on]ine performunce could function as a seLf-regulatory
mechanism to encourage regular online participation in a class community.
Key Words: blog; information visuulization; soclal diLemma; learning community
This study explored students' reactions in
an online learning cnvironment that allows
monitoring of their own and others' work
performance as a graphical image. While
efforts have been made to deye]op
visualization tools that track people's online
behavior, few studies have been conducted on
how these tools relate to and improve teuching
practices and ]earning outcomes. Therefore,
this study aims to investigate learners'
reactions at the individual and class group
levels to a learning environment accompanied
by u visua] representution of blog postsin an
English as a foreign language (EFL) class, in
which blog writing in English was an optiona)
UCtlVltY.
1. Literature Review
ln online learning environments, where
people can easily view others' works. several
studies provide thcoretical accounts on
partieipants' behavior. Sociul psychology and
-35-

The Japan Association for Educational Media Study
NII-Electronic Library Service
The JapanAssociationfor Educational Media Study
group dynarnics theories are oftenused
(Kimmerle & Cress, 2009) and it is likely that
people use the on-going participation level of
the rest of the group to gauge the lcvel of their
own participation. In other words, an active
andcooperative group is likcly to induce an
even highcr level ofparticipation, whereas an
inactive and uncooperative group could induce
the opposite. This means that visualizing
online activitics is a double-edgcd sword that
can inducc both positive and negativc group
mechanlsms in the online sphere. Online
learning is exploding in popularity around the
world (Ala-Mutka, 2009; Allen & Seaman,
2008; McKlin, Harmon, Evans, & Jones, 2004)
but much research rcmains to be done to
detcrmine optimal activities, evaluation and
motivational jnterventions.
This leads te the need fora more nuanccd
dimension of group dynamics called "social
dilemmas" (Dawes & Messick, 2000), whose
application has been extended to a broader
context of online information cxchange (Cress& Kimmerle, 2007). Social dilemmas are
defined as the "situations
in which each
member of a group has a clear and
unambiguous incentive to make a choice
that-when made by all mcmbers-provides
poorer outcomes for all than they would have
received if none had made the choice" (Dawes& Messick, 2000, p. 1 1 1), In online information
exchange, people may not contributc
information themselves but only try to retrieve
usefu1 information contributed by others
because making a contribution demands
individual costs (including time and effort) but
may notresult in dircct returns. Hcnce, the
information databasc will wither and become
useless for everyone (Cress & Kimmerle,
2007). This happens frequently in online
discussion forums in cducational contexts that
often ends with very few posts. Much posting
is inspircd only by the external motivation of
graded assessment for participation (Bures,
Abrami, & Amundscn, 2000), Apossible
solution to enhance motivation is to appeal to
"anchoring
effects" (Furnhama & Boob, 201 1)
where guidelines or dcscriptive norms for
participation are estab]ished to serve as
positive "anchors"
(psychological term to
mean the initjal standards that guide people
how to behave) for people's productive
contribution. Studies have shown that saliency
and higher standards (for example, eight
contribution requirements instead of three
contributions as a group) are in fact necessary
to induce a group's positive contribution as a
whole (Cress & Kimmerle, 2007).
From thc perspective of
computer-supported colLaborative learning
(CSCL), studies have been made to examine
the etTccts ofvisualizing students' participatiento a task-based collaborative activity (Janssen,Erkcns, & Kansclaar, 2007; Janssen, Erkens,
Kanselaar, & Jaspers, 2007). Thesestudies
have borrowed social psychological and
philosophical concepts, such as "social
loafing" (individual member who works less in
a group than when helshe works alone) or the`Lfree
rider effect" (individual member who
takes more than what hefshe provides),in
collaborative behavior and emphasizcd that a
high level ef and equal participation are keys
to producing high performance in collaborative
learning. To realize these conditions,
visualization of all members' performance
could work as an "external
feedback" for
individuals to monitor their performance in
comparison with the others so that the group
process would be able to work more effectively.
-36-
The Japan Association for Educational Media Study
NII-Electronic Library Service
The JapanAssociation for Educational Media Study
In other werds, when we visualize online
performance in a formal collaborative
environment, some preventive measures, such
as clcar high standards to avoid workload
inequality and moral stagnation, are necessary
in order to attain the common goal of better
and higher Learning ofall members.
In this research, a blog viewing tool was
implemcnted with the aim to '`mirror"
(Reimann & Kay. 2010) the posting rate at
individual and wholc class levels to previde the
abovementioned monitoring environment.
Using the visualization technique. each student
intuitively cva]uated the distance between the
class performance and hisfher own
perfonnancc. As a result, an adjustment wouLd
be made on the level of hisfhcr own
commitment te the assigncd task.
2. RcsearchQuestions
At this preliminary stage, the initial
research aim was to determine ho-' students
react to a learning cnv{ronment accompanicd
by a visual representation ot' blog posts.
Specitically, this research attempted to
answer the following three questions: 1) How
does students' online participation pattern
change before and after thc implementation of
visualization intervention? 2) How do students
react to thc implemented online performanee
monitoring environment? 3) Is the
implemented visualization tool usefu1 enough
to provide the targct learning environment?
We hypothcsize that the macro-level visual
information on the blog writing pcrl'ormance of
peer members will help increase the
selfawarencss of the students regarding their
own perfbrmance in a "nondirectivc"
rnanner,
and, therefbre, would help fostcr steady
partlclpatlon.
3. Methodology
3.1 B]ogintheCourseDesign
The study was conducted in two
undergraduate classes (hereafter, Classes A and
B) of cngineering majors. A total of 56 students
participated in thc data collcction and
consented to analysis and publication. Both
classes were classified by the English
placement test held at thc time of cntry to the
university. The English proficiency of Class A
was higher than Class B. The course objective
was to acquire the English language skills
nccessary for work in engineering, The course
was required to coverthe fbur skills of reading,
Listening, spcaking, and writing. Therefbre,
only one fburth of the course content was
assigned to online writing in English. which
was conducted out-oficlass through online
indepcndcntstudy.
The course was a blended dcsign with 15
face-to-face weekly meetings and out-oflclass
blog writing on Moodle. Therct'orc, students
could see the blogs both in textand visual
image fbrms (the text was shown on both the
Moodle blog page and the blog visualization
page, and the visual image was shown only on
the visualization page).
All sessiens were held in a school
computer room, and cach studcnt was assjgned
a computer with Internet capabilities. Since
students' areas of conccntration involved
information, media, tcchnology, and
communications, all of them had notebook PCs,
and nearly all had Internct connections at home.
With national and school holidays (including a
short fa11 break), the semester lasted 18 weeks
in this research.
With regard to blog topics, the students
could fireely choose their topics or select
among those that the teacher providedas
-37-

The Japan Association for Educational Media Study
NII-Electronic Library Service
The JapanAssociationfor Educational Media Study
opinion essay every week. Both frec topical
writings and essay writings were pested by
using the Moodle blog functions and were
shown on thc blog viewing webpage.
During thc second week of meeting, a
guidance session was provided so that all the
students could make blog posts. The students
wcre encouraged <not required) to write frcc or
topic-based blogs at least oncc pcr week, This
element was intcndcd to be the ambiguous
"anchor"
in this research, which was yct
exploratory. At this stage, precise evaluation
policy for blogs, such as frequency and lcngth,
was intentionally not c]aritled so as to
minimize their effects en students' natural
reactions. Thereforc. online writing did not
belong to the formal part of the final coursc
eva]uation.
The studcnts used user names consisting of
their students' identification numbcrs and their
preferred pseudonyms so as to reduce thc
influence of greup and individual dynamics
existing in the face-to-face classroom on their
online behaviors (Miyazoe & Anderson, 201 1 ).Those who wanted to keep their entries
invisible to others could choose the draft modc
setting, which is a revision mode invisible to
other class members.
32 ResearchDesign
This research was patterned as a
design-based r¢ scarch study (Anderson &
Shattuck, 2012; Brown, 1992; Collins, 1992)
that aims te develop and integrate theory and
practice in natural educational settings. In
comparing the effects ofblog visualization, the
tool was introduced in the middle of the course
to determine students' behavior withlwithout
the visualization technique within the same
class groups. This design was chosen because
the focus of this study includes how group
dynamics works in blended learning; therefore,
group composition was preferably homogenous,
During the second half of the sernester, the
instructor occasionally set up casual blog
visuali7atien imagc viewing sessions (taking a
few minutes each time) in class to draw the
students' attention to the utility of the tool,
3.3 Methods
Three data sources were used to triangulate
interpretation of the resultsi 1) a post-course
questionnaire, 2) the text ana]ysis ef students'
blog writing on the LMS. and 3) the visual
representation oCblog entries on PISION. The
post-course questionnaire included tool
usability as measurcd on the System Usability
Scale (SUS) (Brooke, 1996; Tullis & Albert,
2008). and specific qucstions about blog
viewing posed by the devcloper <see Appendixtbr the question statcments). The questionnaire
was anonymous, and the students were allowed
to decide whether or not to participate in it.
The SUS scorcs ranged from O to 100 with the
item score contribution at 2.5. 0ther questions
regarding the usability were provided by
aenrmative statements with five-point Likert
scale answers: 1-strongly disagree, 2-disagree,
3-neutral, 4-agree, and 5-strongly agree. Data
were analyzed using SPSS and EXCEL
software.
For text analysis of blogs on LMS, the
automatic word count function of the
word-processing software was used. A small
amount of language data written in the
students' first language were removed from the
total word count. The count result was further
adjusted when two words were collated (fbrexample,
"todayis" as
"today is") in order to
reflect the more accurate level ofparticipation.
-38-

The Japan Association for Educational Media Study
NII-Electronic Library Service
The JapanAssociation forEducational Media Study
Furthermore, when blog posts included essay
questions, the question statements were
excluded from the total word count,
3.4 BlogVisualization[Ibol
A blog viewing tool narned PISION was
used in the research, This tool was developed
by Dr. Sato (Sato & Kageto, 2010). The tool
enables the compilation of blog text content
produced on Moedle and creates a visual
representation of the blog on a separate
webpage. The primary infbrmation provided by
the tool includes 1) the chronological overview
ofblog entries and 2) readable, magnfied blog
texts, This tool allows the course instructor and
the students to track when a certain blog entry
was made and who made it.
The blog entry was represented as a
graphical image as shown in Figure 1. At this
exploratory stage, the system was configured
so the students had to log in to a separate Web
page where a link to Moodle was provided fbr
the image view. The teacher demonstrated the
blog view page intentionally but indirectly
every two weeks at the beginning of class in
the second half ofthe semester,
The teacher observed that the students in
the computer room Teferred to the visualization
page during classes and seemcd to check how
it looked.
:11/'
:tl/x・//vettww'm//pt.ttscttre.ttua'.y.t/v,"t.
I,llll.,l,X,.llg.ii・in・・,.y・.11・$,l#,.l\,#1/f,i,,g,,Ilile./I/X',,/I,X,,.lfi,・in,,/t, :,;:,/,/;,;/
'
i31i'1pt,・i/'11/l//.1't,"'.?ge,,,F',1.t・//le,,'/.ge..,/・/,,・{,"/xt///''
....i,i,l,ii-ll,i,illiiil・ii//g-l''1・,l・1iil//'1i'Silli,1/111/・llllilllliSlllllli.1...
s,ew#eee....ee..I・ aj,/,itl/3t;me. ・I.il.1ge...t/llt.aj,/l,;as-ltt'I...ig'li.lj;-,k' tee. iS,i /i・1,ll,:,EI,- ll;xl・i,11・l.
lilIii
I
Fig. 1. Blogvisualizationimage
4. Results
4.1 Bnogpost frequency over the semester
Figure 2 shows the number ofposts written
by both classes ever the semester, The rise in
posts in Week 3 was due to the blog guidance
session. The temporary declines around Weeks
7 and 8, and 15 and 16, correspond to the
national and school holidays. The decline in
posts in Week 12 fbr Class B was the test day,
The rise in posts in Week 17 coincided with the
final rush fbr ambiguous course requirements.
Fig.2, Blogpostfrequency
Overall, the left figure shows that, in both
classes, after the first bleg writing guidance
session in Week 3, the number of blog posts
rapidly decreased over the next two weeks.
However, the figure on the right shows that,
-39-

The Japan Association for Educational Media Study
NII-Electronic Library Service
The JapanAssociationfor Educational Media Study
from Week 9, when the system was
implementcd, to Week 15, when the core part
of the course session was over, the number of
blog posts maintained a moderate level, that is,
between 15 to 20 posts fbr both classes. In
onlinc course management, it is possible that
the post number drops after the initial
enthusiasm and stays at a low level of
participation (Shea, 2007). As well, when some
event, such as a short break, occurs, the postnumber rises momentarily (usually at lowcr
leve]s than that generated by initia]
enthusiasm) and thcn drops again, However, in
this study, the students' posts sccm to be
rcvived after the implcmentation of
visualization technique, maintaining a more or
less moderate lcvel of participation throughout
the second halfof the semester,
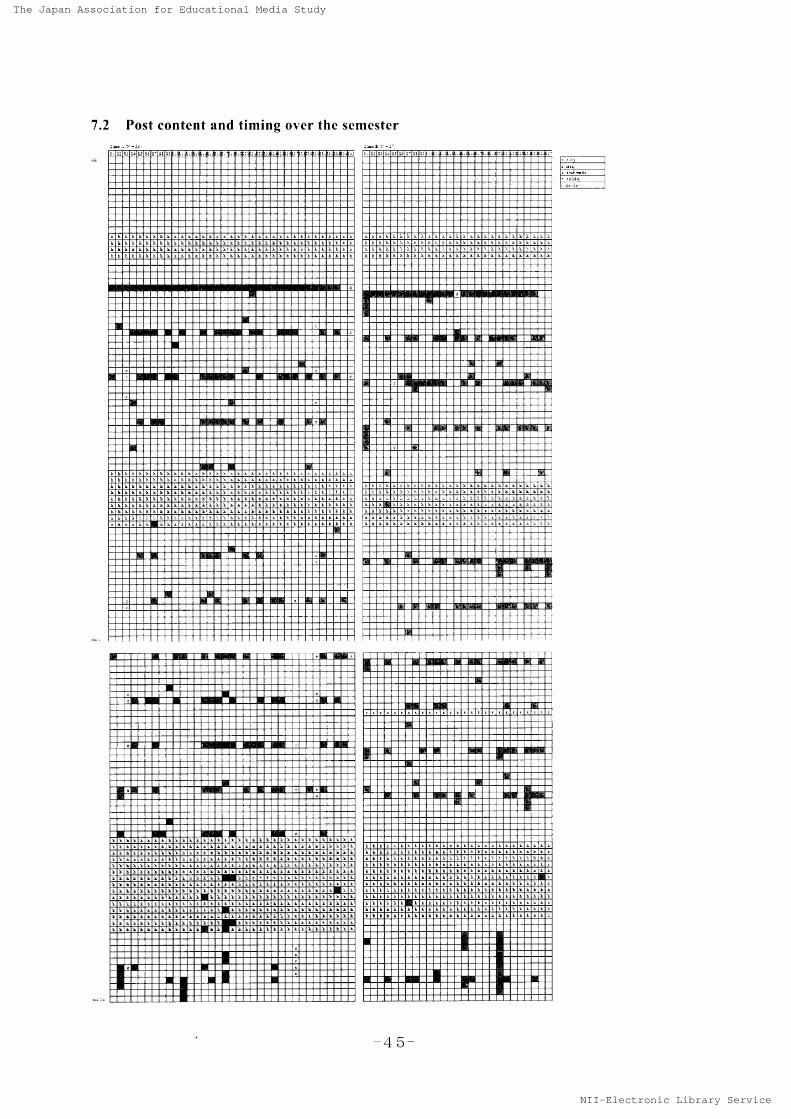
4.2 Post frequency, Timing, and Content
Appendix 2 summarizes thc time at which
each blog post was made for Classes A and B
over the course of the seniester. On the
uppermost vertical cells, the individual student
is identified as S-1, S-2, and so on in each class.
Each of the vertical cells corresponds to one
day in the semester. The cells in blue
correspond to the dayltime when a student
made a blog post. This figure is similar to the
yisual information that a student can see when
accessing PISION.
To give a precise interpretation, color
variation is added. There are two shades of
blue in terms of b]og content: p md k bl b
indicates that the blog post is for personalreflection, while !/igb!-bluh bl indicates that
the bleg post is for writing an opinion essay.
!Gg!4y-apg-g!gggd marks concern events on the
scheol calendar that could affect students'
posting behavior; g!gy-a!) corresponds to
national and school holidays when classes
were suspended, and one day in g!gg!LC!) refers
to the test day in the curriculum whcn normal
classes were not hcld. lrIgUl Qw-Cd)-1 d marks shows
the posts set in draft mode, that is, only the
author and the administrator of the systcm
could see his or her own blogs. These blogs in
draft mode, although they exist, do not appear
on the tool.
Because thc blog post guidance scssion was
conducted in the second week of class, most
students, except those who wcre absent on that
day, made a blog post at least oncc during the
semester. This is reflected by the herizontal
dark blue linc in both classes in the figure.
During national and school helidays (markcdin g!gy), the majority of the students stopped
posting, although the teacher enceuraged them
to keep writing blogs, Severa] students made
many posts toward the end of the semester, as
if to catch up on the total number of requircd
posts, which was vaguely prejccted to be at
least one per wcck.
The psychological and social thcories
overviewed in the literature review section are
identified in some of the students' online
behaviors in this study, There were two
students in Class A (marked in !/ighLblught bl )whose bLegs were on draft mode and who
wrote blogs at the same pace as thc others. For
these students, looking at other students'
regular perfbrmance may have helped them
write blogs more regularly. In other words,
they could be "free
riders," although probablyunintentionally, who took more than what they
contributed within the online class. Moreover,
their absence online, or invisibility, may have
given wrong perceptions to the other students
that fewer students were writing than they
actually were. In this sense, the liberty of
-40-

The Japan Association for Educational Media Study
NII-Electronic Library Service
The JapanAssociation for Educational Media Study
choosing the draft mode may have amplified
the "community
dilemrna" of
to-do-or-not-to-do in the current setting.
When focusing on students who chose
more challenging opinion essays, the two
classes showed somewhat opposing behavion
In Class A, three students were ab]e to keep up
with the suggested pace ef at least one blog per
week, More precisely, two of them (S-3 and
S-30) did the essays from the beginning, and
the third (S-27) joined right after the
implemcntation of the blog viewing tool, This
particular case can be an example of positive
class dynamics, that is, more chalicnging
"anchors"
tbstered higher perfbrmance. In
contrast. in Class B, one student {S-5) started
the essay optiQn but desistcd around the time
of the viewing tool implementation when
he/'shc may have seen nobody else in the class
did the same, that is, whcn "social
loafing" was
evidcnt. [n this casc, witnessing lo",er
performance fi'om othcr c]assmatcs
unfortunately may havc dissuaded this student
to do better.
The phenemenon of many postings in one
week towards the end of semester is
understandablc, as students may have rushed
final submissions to offset their laxncss during
the semester. This awareness ofnot kceping up
compared with others could have been a result
of the ii'isual tQol but only to"'ard thc end of
the course. However, the casc of one student
(S-20) in Class B, -'ho subinittcd nine blog
posts besides his regular work, calls attention,
In addition to short rcgular blogs al] submitted
more or less regularly during the semester, this
student submitted nine posts with a Longer
average length ot' 77 words <of good contcnt)
in the final week, as if hc had written all these
long blogs throughout the semestcr but did not
want to show them to others, shewing a case of
the '`to-do-or-not-to-do dilcmma" within one
person. Combined with the opinion essay case
whe desisted, these cases can bc interpreted as
representative of the negative effects of
visualization, which dissuades higher
performance within a learning community.
4.3 PISIONUsabilitv "
The SUS score distribution appears close to
normal, with the mean score at 51.35 (N = 48,
SD = 11,2). The perceived ease of use varied
t'rom 17.5 to 82.5, These rcsults reveal that the
tool is fairly easy to use but students'
pcrceptions varied considerably as to its
usability.
Table 1 shews the results for specific
abilities: wholcncss (Q.1). comparison (Q.2),
and cfficiency (Q.3) of viewing blog posts.
Students' rcsponsc levels were between 3.04
and 3.19 and the tool was perceived as being
i'airly hetpful for the students" viewing and
searching ofblog posts.
Table 1Rcsults
of uti]ity qucstions
NMinMax Mcan SD
Wholeness
Comparison
EfTiciency
4g
4g48
111 s)'
5
3.19 .g91
3,04 .922
3.15 .945
Each potential capacity of x,isualization,
such as wholeness, comparison, and efTiciency,
is considercd relevant to foster online
participation in the form of blog posting. The
regularity of the online participation pattern of
all members of the class could become a
positive trigger that fosters thc comparison
between the work performance ef the majority
-41-

The Japan Association for Educational Media Study
NII-Electronic Library Service
The JapanAssociation for Educational Media Study
and the individual, The visualization seems to
have successfu11y supported the intended
utility in this research, However, from the
obtained results, the dircct relation among
factors is not yet evident. Further research is
needed to identify which utility item is more
relevant to the observed stability in online
partlclpatlon.
5. Discussion
This study supports the possibility that
visibility as enforced by thc visualization
technique may help ensure high participation
within a given learning context. The students
acknowledged the merits of viewing other
posts at a glance. In each class, the student's
blog posting frequency rose and remained
fairly high in the latter half of the semcster,
Consistent with preyious research, this
research also observed a certain level of
'`social
dilemma," which explains people'sbehaviors in the online community fbrmation
process, Visualizing online perfbrmance could
function as a selflregulatory mechanism to
approximate the online participation of a class
communlty.
One of the limitations of this research is its
adoption of thc experimental research design
within the same course period with the same
participants. This format has advantages of
reducing the influence of group dynamics
during class meetings, which may affect the
leaming perfbrmance of online wr{ting. In this
research, the fact of re-gain in the number of
blog posts after implementatien of the
visualization tool can be interpreted as the
positive relation between visualization and
high participation. However, in an educational
setting, where many unseen variables intervene,
allotting only one semester for the experiment
is insuencient to allow any generalization to be
drawn.
Suggesting that students write blogs at least
once per week may have triggered students to
write more blogs, thus impacting the frequency
of each student's writing. Perfbrmance of some
fbrm of anchoring was necessary, and the
findings in this research reveal that all the
students did not write one per week, some
stopped, some continued, some worked more,
and some worked less. This finding suggests a
further avenue of research to examine the
effects of different level of anchors on
students'behavior.
From the perspective of course
management, the merits ofvisually acquiring a
complete picture of studentsT online
participation are numerous, Monitoring online
classes in a blcnded course design is different
from physical participation in that the teacher
could visually verify attendance by roll call, It
is more difficult and laborious to fo11ow online
classes. The visualization technique in this
research was conceived more for eencient
viewing or reading of blogs rather than
analytics; however, it could be further
developed to maintain more features, such as
automated word count and frequency analysis,
with which both the teacher and the students
can obtain a more detailed grasp of what each
member is doing within a specific online
educationa] sphere. Carefu1 observation of
visual information could work as an "early
warning system" to detect students at risk of
withdrawing (Macfadyen & Dawson, 2010),
and help the teacher become more analytical
and engaging in hislher own teaching and
learning perfbrmance online. This kind of
integration, in a sense, allows the online
learning sphere to more-closely resemble
-42

The Japan Association for Educational Media Study
NII-Electronic Library Service
The JapanAssociationfor Educational Media Study
face-to-face learning.
6. Conclusion
Although further research is necessary, this
work found that the visualization of students'
online behaviors has both positive and negative
impacts on students' overall Iearning
performance in a class leaming community.
Visualization also runs the risk oflosing merits
such as independence and selfiregulation in a
higher stakes and normative learning
enviTonment. Our next step, therefbre, is to
find a way to utilize thc highest merits of
visualization without influence from its
demerits, There is no doubt that the
visualization of online actiyities has opened a
new dimension to online learning, as well as
challenged our perceptions of how we learn.
References
Ala-Mutka, K. (2009). JRC scientific and
technical reports: Review of learning in
ICT-enabled networks and community,
Brussels: Joint Research Center (JRC)
European Commission.
Allen, l. E., & Seaman, J. (2008). Staying the
course: Online education in the united
states. Needham MA: Sloan Consortium.
Anderson, T., & Shattuck, J, (2012).
Design-based rcsearch: A decade of
progress in education research?
Educational Researcher, 41(1), 16-25.
Brooke, J. (1996). SUS: A quick and dirty
usability scale. In P. W. Jordan, B.Thomas,
B. A. Weerdmeester & I. L. McClelland
(Eds.), Usability evaluatien in industry (no
page numbcr). London: Taylor & Francis.
Brown, A, L. (1992). Design experiments:
Theoretical and methodological challenges
in creating complex interventions in
c]assroom settings, Journal ofthe Learning
S¢ iences, 2(2), 141-178.
Bures, E,, Abrami, P., & Amundsen, C. (2000).
Student motivation to learn viacomputer
conferencing. Research in Higher
Education, 4 1 (5), S93-62 1 .
Coltins, A. (1992). Towards a design science of
education. In E. Scanlon, & T. O'Shea
(Eds.), New directions in educational
technology (pp. 15-22). Berlin: Springer,
Cress, U., & Kimmerle, J, (2007). Guidelines
and feedback in infbrmation exchange: The
impact of behavioral anchors and
descriptive nerrns in a social dilemma,
Group Dynamics: Theory, Research,and
Practice, 11(1), 42-53,
Dawes, R. M,, & Messick, D. M. (2000). Social dilemmas. International Journal of
Psychology, 35(2), 111-116.
Furnhama, A., & Boob, H. C. (201 1). A
literature review of the anchoring effect,
The Journal of Socio-Economics, 40,
35-42,
Janssen, J., Erkens, G., & Kanselaar, G. (2007).
Visualization of agreement and discussion
processes during computer -s
upported
collaborative learning. Computersin
Human Behavior, 23, 1105-1125.
Janssen, J., Erkens, G., Kanselaar, G., &
Jaspersa, J. (2007). Visualization of
partieipation: Does it contributeto
successfui computer-supperted
collaborative learnjng? Computers and
Education, 49(4), 1037-1065.
Kimmerle, J., & Cress, U. (2009).
Visualization of gToup members'
participation: How
information-presentation formats support
information exchange. Social Science
CQmputer Review, 27, 243 -261.
-43-
The Japan Association for Educational Media Study
NII-Electronic Library Service
The JapanAssociationfor Educational Media Study
Mac fadyen, L., & Dawson, S. (2010). Mining
LMS data to develop an "carly
warning
system" for educatorsi A proof of concept.
Computers & Education, 54(2), 588-599.
McKlin, T,,Harmon, S. W., Evans, W. & Jones,
M. G. (2004). Cognitive presencein
web-based learning: A content ana]ysis of
students' online discussiens. Retrievcd
Mareh 13, 2011. from
http:lfit.coe.uga.edulitforum/papcr60,tpaper
60.htm
Miya7oe. T., & Anderson, T. C20H).
Anonymity in forum and blog: Writing
instruction in blcnded learning. Journa] ef
Educationa] Technology & Society, 14 (2), 175-187.
Reimann, P.,& Kay, J. (2010), Learningto
learn and work in net-bascd teams/
Supporting emergent collaboration with
visualization tools. In M. J. Jacobson. & P.
Reimann (Eds.),Designs for learning
cnvironments of the future (pp. 143-188)
SpringerLink.
Sato, S., & Kagcto, M. (2010). Practice of
promoting reflection in problem-based
learning by using social media and its
viewcr. Proceedings ofWorld Conference
on Educational Multimedia. Hypermedia
and Telecommunications 2010, Toronto.
3481-3489.
Shea, P. (2007). Towards A conceptual
framework for learning in blendcd
environments, In A. G. Picciano, & C. D.
Dziuban (Eds.), Blended lcarning:
Research perspectives (pp. 19-35). The
Sloan Consortium.
Tullis, T., & Albert. B, (2008). Measuring the
user experience. Amsterdam: Morgan
Kaufmann Publishers.
7. Appendices
7.1 Questions included in the post-course
survcye
1.
234
5.
6.7.
8,
9,10.
eL
2.
3.
System Usability Scale (SUS) questions
(Tullis & Albert, 2008, pp.138-139)
I think that I would like to use this systeni
frequently.
I found the system unnecessarily complex,
1 thought thc system was easy to use.
I think [ xvould need the support ofa
technical person to be able to use this
system.
I ft}und the varieus functions in this
system werewcll integrated.
[ found this system was too inconsistent.
[ would imaginc that most people would
lcarn to use this system very quickly.
I fbund the system very cunibersome to
use.[
felt very confident using the system.
I needed te learn a lot of things bcforc I
could get going with this system.
Questions from the PtSION developer
PISION, it was easy to grasp the whole
picture ofposts (yours and your friends').
With PISION, it was easy to compare and
cxamine the centents ef many posts,
With PISION, it was efficient to view
many posts.
-44-
The Japan Association for Educational Media Study
NII-Electronic Library Service
TheJapanAssociationforEducational Media Study
7.2 Post content and timing over the semester
t-t.t-tb 1=tEt-=
tl"l.UL・teS's;;t't.'''''tt''''''''''tt]:ti't/L-t-k1-L;1/' 'tt''''f'/
' '''' ',/
tt'tt'tttt
+''tt
/ /
' '/ 1'''-Lt!LLLttLLL}tinsLininl:-!!,LEt.!Ll't.!!!!!y1!I't.11!I!!'-Il!1t.1
t/IILUSLE!L!tILl}!leLLuyttttyvi!1i1u1xE!yEEit't'ITL1li1-zlt-Lt.EELEE1L''lLLLLL-LILL!!LLL-#zkLFLkI!Ltsi11LL1Ll-'LL11'1L"LLttF.I3'1t ±ltLLLLEL!1l1!kL
l}le1tlLiLtL-!Lek-=}ltL-inL!!4!E1t.Lkt-t-t;L}htt}11l,''Lsde#,t}ILETY!t.L'' '4 '
lt.'- ';/
'/ ' /
'' l 1'1'
l'' E /' '''.t.'ir' ' ''t+.'''''
t'
i; 'l' '' '' ' 't'
/' /' i/'
//'// '
' t
' /+/' .t..g''''' ''tt
±' '/' t. 'tt '± '
' /
'1,r'ld-・- ''
/'
/'1!1!tt-F!!!L',i1''I!IEtt't.!! '..t.'`'r'tt'
!tti,1;1h1LLLLL-='L7t'Ll
tt-.-[L}t '/l}L=M='E.-t.iLLLL-lliIILL11h.iniILtL!4l}!-LL1LLL''eL1,-LLL'bts'liu}''t/-!'t!st!L!EEt.t.t1!!LLsEk!t'!h1'LttLL-lt1i1tLi11Ll .-t.!Lt.!Lt-l/!1;1-.t'kL'T.'L1,iut.-!1tEt.11!LLL=tt=LEEILI
'Ettt.-!L-LL1'tt['zLinx:'t.s1tt't.t-t-LLLtt'!!It.LLLL;.-='t!1tEtEzhbeL NLi-11sL1zzzLL]=m;=LL==t-.LL!tt11LEL1thtL'')l
LEL!!LL'1・=1,-'t't・t・
1ilkt1LL!LL-ELtt'''-1li1vLI!.t'ILt1isLL121'!!'t.tt'"1I'±t-t-!ELt-'t'tL-'b-l-1Lhz11!t.LL,!ttEI!!''Et-t.t.'t-.-I.'L''tlLtt1'1-[''L' L-L;;'''L-''
liL ±LLLLLEslL}L11L1i,lIL#LE41L!L'''llt.tt11!t-Lt''=-':i:lt-.i];;;!lt''!1
' /

The Japan Association for Educational Media Study
NII-Electronic Library Service
The Japan Assooiation for Eduoational Media Study
オ ン ライ ン学習コ ミ ュ ニ テ ィ に おけ る プロ グの 情報
可視化 と学習者反応に 関す る予備研 究
ラ
ラ
ラ
学
学
学
大
大
大
力
機
ス
祉
電
バ
福
京
サ
本
東
げ
日
く
く
美
ル
一
一
輝
ダ
慎
添
万
藤
宮一
佐
リ
テ
本稿 は 、参 加 者 全 員 の プ ロ グ投 稿 状 況 が 画 像 と し て 可 視化 され モ ニ ター
可 能 な オ ン ラ
イ ン 学 習環 境 下 に 対 す る 学 習 者 の 反 応 に 関す る 予 備研 究 を報 告す る も の で あ る 。従 来 の
研究 に よ れ ば 、オ ン ライ ン学 習 コ ミ ュ ニ テ ィ に 働 く集 団 力学 が 学 習参 加 を促 進 す る 場 合
と 阻 害 す る 場 合 の 両者 が あ る こ と が 知 られ て い る。 ま た 、全 メ ン バ ーの 参 加 状 況 を (画
像 と し て ) 可 視 化 す る こ とが 「外 部 フ ィー ドバ ッ ク 」 と し て 機能 し、 よ り高 い 学 習 パ フ
ォー
マ ン ス を 育 む こ とが 知 られ て い る 。本研 究 で は 、学 生は プ ロ グ投 稿 の 様 子 を テ キ ス
トお よ び画像 の 両 形式 で 見 る こ とが で き た 。学期 半 ば に プ ロ グの 視 覚化 ツ ール を投 入 し 、プ ロ グ投稿 の 頻度 に 反 映 さ れ る 学 生 の 行 動 変 化 を 観察 し た e 分析 法 と して 、 プ ロ グ の 定
量 的テ キ ス ト分析 お よ び 学期 末 ア ン ケー
トの 二 種 を 採 用 した 。 ア ン ケー トで は ブ 囗 グ閲
覧 ツ ール の ユ ーザ ビ リテ ィ 評 価 を 行 っ た 。結果 、学生 の プロ グの 投稿 頻 度 は 学期 前半 に
比 べ 学 期後 半 に 高 い レ ベ ル を 維持 し て い る こ とが 判 明 し た 。本研 究 で は 、オ ン ラ イ ン 学
習 環 境 下 に お け る 学 習パ フ ォーマ ン ス の 可 視 化 が 、学 習 コ ミ ュ ニ テ ィ 全 体 の 定 期参 加 を
促 す 自己調 節 機構 と して 機 能 す る 可 能 性 が 示 唆 さ れ た 、ま た .「外 部 フ ィー
ドバ ッ ク 」 が
プ ラ ス ・マ イ ナ ス の 両 者 に 働 き 、 対 面授 業 に 類 似 す る コ ミ ュ ニ テ ィ 参 加 を 「な す べ き か
な さ ざる べ き か 」 の ジ レ ン マ (“to−do−or −not −to−do dilemma
”) が 学習者反応 と し て 認 め ら
れ た 。
キーワ
ー ド : プ ロ グ、情 報可視化 、社会的 ジ レ ン マ 、学習 コ ミ ュ ニ テ ィ
一46 一
N 工工一Eleotronio Library