an exploratory study on physical fitness policies among
TRANSCRIPT

Nova Southeastern UniversityNSUWorks
School of Criminal Justice Fischler College of Education: Theses andDissertations
1-1-2016
An Exploratory Study on Physical Fitness PoliciesAmong Police Departments in North CarolinaJay H. FortenberyNova Southeastern University, [email protected]
This document is a product of extensive research conducted at the Nova Southeastern University College ofArts, Humanities, and Social Sciences. For more information on research and degree programs at the NSUCollege of Arts, Humanities, and Social Sciences, please click here.
Follow this and additional works at: https://nsuworks.nova.edu/cahss_jhs_etd
Part of the Criminology and Criminal Justice Commons, Other Social and Behavioral SciencesCommons, and the Public Affairs, Public Policy and Public Administration Commons
Share Feedback About This Item
This Dissertation is brought to you by the Fischler College of Education: Theses and Dissertations at NSUWorks. It has been accepted for inclusion inSchool of Criminal Justice by an authorized administrator of NSUWorks. For more information, please contact [email protected].
NSUWorks CitationJay H. Fortenbery. 2016. An Exploratory Study on Physical Fitness Policies Among Police Departments in North Carolina. Doctoraldissertation. Nova Southeastern University. Retrieved from NSUWorks, College of Arts, Humanities and Social Sciences –Department of Justice and Human Services. (4)https://nsuworks.nova.edu/cahss_jhs_etd/4.
Nova Southeastern University
Institute for the Study of Human Service, Health, and Justice
“An Exploratory Study on Physical Fitness Policies Among
Police Departments in North Carolina.”
by
Jay Fortenbery
A Dissertation Presented to the
Institute for the Study of Human Service, Health, and Justice
of NOVA Southeastern University
In Partial Fulfillment of the Requirements for the Degree of
Doctor of Philosophy
Nova Southeastern University
2016


A Study on Physical Fitness Policies Among Police Departments in NC
ii

A Study on Physical Fitness Policies Among Police Departments in NC
iii
Acknowledgments
I would like to sincerely thank Dr. Marguerite Bryan for agreeing to serve as
committee chair for this project and her time spent reviewing material and providing
valuable input. Special thanks also to Dr. Dana Mills and Dr. Leslie Taylor for serving
on the committee and dedicating your time and thoughts that have greatly assisted me
along the way. Thanks also to Bryan Leaird, Director of Field Services for the North
Carolina League of Municipalities, for without his collaboration and assistance, this
study would not have occurred. I could not have completed this project and would be
remiss if I did not extend a great thanks to Mysi, my wife of over 28 years. She has
sacrificed many nights and weekends of my time and negligence of my “honey do’s”
over the past four years while I endeavored to complete this dissertation and the other
requirements of a Ph.D. from Nova Southeastern University.
A Study on Physical Fitness Policies Among Police Departments in NC
iv
Abstract
The purpose of this study was to examine the existing state of physical fitness
maintenance policies among police departments in North Carolina, and how those
policies impact reported injuries among police officers. The research identified a sample
of police departments with and without mandated physical fitness maintenance policies
(n = 145) for years 2013-2015 and through collaboration with the North Carolina League
of Municipalities, determined the number officer injuries per department for comparison.
This information also included the cause of injury, costs, lost work days and claims by
male and female for comparison. A cross-sectional analysis and purposive sampling
method were used to compare agencies who self-reported their level of physical fitness
maintenance. Agencies were classified as mandated fitness standards, mandated wellness
standards, and no standards. Police departments with mandatory physical fitness
standards (FS) were found to have significantly lower medical costs (X² (1) = 126.4, p =
.001, C = .541) and lost work days (X² (1) = 6.68, p = .009, C = .980) in several analysis
when compared to agencies without FS and agencies with WS alone. Police departments
with mixed standards (FS or WS or both) were compared to agencies without standards
and no statistical significance was found. Future studies are recommended to increase the
generalizability of the study and to determine causes of the increases in medical costs
observed in agencies that mandate wellness standards.

A Study on Physical Fitness Policies Among Police Departments in NC
v
TABLE OF CONTENTS
Chapter Page
I. INTRODUCTION .........................................................................................1
Background ....................................................................................................1
Problem Statement .........................................................................................3
What the Problem Is ..........................................................................3
Why this is a Problem .......................................................................3
How the Problem Evolved or Developed .........................................4
Issues and Events Leading to the Problem ........................................5
Dissertation Goal ...........................................................................................6
Research Questions and Hypotheses .............................................................7
Relevance and Significance ...........................................................................8
Explanation of the problem ................................................................8
How far-ranging is the problem .........................................................9
Attempts to correct the problem ........................................................10
How the research problem is addressed .............................................11
How the research will add to the knowledge base .............................12
The potential for generalization .........................................................13
The potential to demonstrate original work .......................................13
Barriers and Issues .........................................................................................14
Limitations and Delimitations ........................................................................16
Definition of Terms........................................................................................18
Summary ........................................................................................................19
II. LITERATURE REVIEW ..............................................................................20
Introduction ....................................................................................................20
Associations of Fitness with Injury................................................................21
Associations of Fitness and Sickness .............................................................25
The Links between Fitness and Absenteeism ................................................27
Summary of Literature ...................................................................................29
III. METHODOLOGY ........................................................................................31
Research Method ..........................................................................................31
Calculating Output Measures ........................................................................32
Rate of claims by department ............................................................32
Average medical costs per agency .....................................................32
Average lost work days by agency ...................................................33
Rate of claims by sex .........................................................................33

A Study on Physical Fitness Policies Among Police Departments in NC
vi
Participants .....................................................................................................33
Procedures and Instruments for Data Collection and Matching ....................34
Population, Age and Gender Data .....................................................36
Independent Variable Data ................................................................36
Survey Questions ...............................................................................37
Data Analysis .................................................................................................38
Formats for Presenting Results .....................................................................40
Resource Requirements .................................................................................40
Limitations ....................................................................................................42
Summary .......................................................................................................42
IV. RESULTS ......................................................................................................43
Data Analysis .................................................................................................50
Analysis of agencies with and without FS including WS ..................47
Analysis of agencies with and without FS only .................................52
Analysis of agencies FS vs. WS ........................................................55
Analysis of agencies with mixed FS & WS .......................................58
V. CONCLUSIONS, IMPLICATIONS, RECOMMENDATIONS,
and SUMMARY ............................................................................................62
Conclusions ....................................................................................................62
Implications....................................................................................................64
Recommendations ..........................................................................................66
Summary ........................................................................................................67
REFERENCES .........................................................................................................70

A Study on Physical Fitness Policies Among Police Departments in NC
vii
LIST OF TABLES
Table 1 Independent and Dependent Variables for use in the study .............37
Table 2 Example of data for Chi-Square goodness of fit test ......................40
Table 3 Total of agencies reporting level of physical fitness maintenance ...44
Table 4 Average Totals (Fitness Standards and wellness) ............................49
Table 5 Average Totals FS and WS < $100,000.00 .......................................50
Table 6 Average Totals FS and WS < 100k and non-fit ................................51
Table 7 Average Totals mandated FS only ....................................................53
Table 8 Average Totals, mandated FS only < 100k,......................................54
Table 9 Average Totals mandated FS redacted all non-fitness< 100k, .........55
Table 10 Average Totals mandated FS vs WS ...............................................56
Table 11 Average Totals mandated FS vs WS < 100k, ..................................57
Table 12 Average Totals mandated FS vs. WS <100k all non-fit ..................58
Table 13 Average Totals mixed FS and WS matched ....................................59
Table 14 Average Totals mixed FS and WS matched < 100k ........................60
Table 15 Average Totals mixed FS and WS < 100k, all non-fit ....................61
LIST OF FIGURES
Appendix 1 example of data sheet from League ............................................78
Appendix 2 example of agency list (n = 253) ................................................79
Appendix 3 Participation letter .....................................................................86
Appendix 4 Telephone survey form ...............................................................88
Appendix 5 Area code map ...........................................................................89
Appendix 6 matched agencies with and without FS ......................................90
Appendix 7 matched agencies with and without FS only ..............................91
Appendix 8 matched agencies with FS vs. WS ..............................................92
Appendix 9 matched agencies with mixed FS and WS ..................................93
Appendix 10 fitness and non-fitness related causes of loss ...........................94

A Study on Physical Fitness Policies Among Police Departments in NC 1
CHAPTER 1: INTRODUCTION
Background
The question of physical fitness standards in law enforcement has intrigued me
since completion of law enforcement basic training in 1989. I soon discovered that many
of my more experienced colleagues had not maintained the fitness standards required of
basic recruits and were in declined states of physical fitness. According to Means, Lowry
& Hoffman (2011), in 98 percent of American law enforcement agencies, the only time a
person has to meet physical fitness standards is when he/she is not yet an officer but
trying to become one. After becoming an officer, they are permanently excused from
meeting this requirement. The general public relies on and trusts the abilities of the
police to provide protection and reduce crime. It seems logical that the physical abilities
of the individual police officer could have an effect on overall job performance and
accomplishment of the goal of protecting the public and reducing crime.
The role of a police officer is often sedentary, intermixed with moments of
extreme physical exertion (Lagestad 2011). In a study from the Cooper Group that was
conducted between 1983 and 1993 involving 1700 officers from across the country, it
was surprising to discover that police officers were less fit than at least half of all U.S.
citizens (Quigley, 2008; Kales, Tsismenakis, Zhang & Soteriades, 2009). This problem
with fitness was unexpected because it would seem the physical demands of the
profession would encourage officers to be in better physical condition than the average
person. Physical fitness levels and overall physical appearance may also be a safety factor
that can protect officers from being victims. A study of interviews conducted by the FBI

A Study on Physical Fitness Policies Among Police Departments in NC 2
over a ten year period discussed how offenders tend to “size up” their victims before
deciding what they are going to do (Quigley, 2008; Pinizzzotto & Davis 1999). If an
officer displays a lack of physical ability, then the officer’s chance of being judged an
easy assault by an offender is thereby increased. This information leads to the speculation
that officers who are less physically fit may suffer more injuries or assaults as a result.
The elevated risk factors associated with police work and increases in officer
deaths from heart disease (Wright, Barbosa-Leiker & Hoekstra, 2011; Hartley et al. 2011)
also support the need for increased fitness standards for incumbents. Recent studies
indicate police officers have a greater risk of cardiovascular disease and obesity than the
general public (Wright et al., 2011; Kales et al., 2009; Hartley et al., 2011; Ramey,
Downing & Franke, 2009). A lack of physical exercise combined with the limitations of
healthy food choices during shift work can contribute to this increased risk of
cardiovascular disease (Kales et al., 2009). Elevated rates of heart disease are prevalent
in retired law enforcement officers, suggesting a need for healthy lifestyle and behavioral
changes (Ramey et al., 2009).
This dissertation proposal will discuss the need for an empirical study to identify
associations between mandated physical fitness maintenance policies of police agencies
and reported injuries among their respective police officers. This proposal will also
discuss some of the problems associated with a lack of consistent physical fitness
standards for police officers as well as the results of prior related studies. The following
sections will examine the problem, goal, relevance and significance of this study along
with the proposed research approach and a comprehensive review of prior related
research.

A Study on Physical Fitness Policies Among Police Departments in NC 3
Problem Statement
What the Problem is
The problem is a lack of information on the relationship between police
departments’ policies of physical fitness standards and relevant work-related outcomes of
reported incidents of injury, sickness, and absenteeism among police officers. The study
will use the presence or absence of a mandatory policy of maintaining continuing
physical fitness standards in police departments as a measure of the level of physical
fitness among the police officers of their respective departments. Various independent
variables will be used to control for factors such as length of time that mandatory policies
have been in place, different city characteristics, and various police department variables.
The study will take a longitudinal view over a period of 3 years, 2013 to 2015.
Why this is a problem
The profession of the police officer in America is tough, challenging and requires
many skills to do the job effectively. Most common activities in the physical
requirements section of the average job description include, but are not limited to
standing, running, kneeling, balancing, grasping, sitting, stooping, holding, lifting,
dragging, climbing, and using bodily force to detain suspects (Bonneau & Brown, 1995).
A comprehensive review of cardiovascular disease risk factors among law enforcement
personnel concludes the following:
“Currently employed police personnel have a high prevalence of traditional risk factors,
including hypertension, hyperlipidemia, metabolic syndrome, cigarette smoking, and a
sedentary lifestyle. Obesity may be more common in police officers compared with
civilians, whereas diabetes is present less frequently. Law enforcement personnel are also

A Study on Physical Fitness Policies Among Police Departments in NC 4
exposed to occupation-specific risk factors that include sudden physical exertion, acute
and chronic psychological stress, shift work, and noise.” (Zimmerman, 2012, p.159)
Another recent mixed method study of Norwegian police concluded that physical
skills and physical fitness are important in police work (Lagestad, 2011; Lagestad & van
den Tillaar, 2014). In the 2011study, Police officers reported that “physical skills are a
resource not only ensuring that the police can undertake physically demanding missions
if they must…but also [they] report that having good physical skills gives them
confidence and security in their interactions with the public.” (Lagestad, 2011, p.69).
How the Problem Evolved or Developed
The problem of physical fitness in law enforcement is not something new to the
industry and has been discussed in police literature for many years (Dillern, Jenssen,
Lagestad, Nygaud & Ingebrigtsen, 2014; Boni, 2004, Wilson, 1963). Since the 1950s,
New York City Police recruitment, and training films have emphasized the importance of
physical fitness in law enforcement (Adams, McTernan, and Remsberg, 1980). This trend
has continued today with police training academies across the country placing a great
deal of importance on physical fitness and the need for officers to stay fit in order to do
their job more effectively (Sheets, 2012; Boyce, Jones, Schendt, Lloyd & Boone, 2009;
Bissett, Bissett & Snell, 2012). It is common practice for basic law enforcement schools
across the country to have in place mandatory fitness standards recruits must pass before
graduating from the training program, but there is a concern about the number of police
departments in the United States that do not have physical fitness standards for
incumbent police officers (Means et al. 2011).

A Study on Physical Fitness Policies Among Police Departments in NC 5
In North Carolina and South Carolina, recruits must pass a criterion and construct
validated Police Officers Physical Abilities Test or (POPAT in NC, PAT in SC) before
being granted certification as a police officer. Although this admission standard is in
place, local administrations, along with state and national certifying agencies, often fail to
continue these fitness standards beyond the basic law enforcement entry program. While
voluntary fitness programs are being recommended more often, the North Carolina
Training and Standards Commission for Law Enforcement and the Commission on
Accreditation for Law Enforcement Agencies do not address the issue of mandatory
physical fitness standards for incumbent officers (Ness & Light, 1992;
http://www.calea.org, 2015; http://ncdoj.gov).
Issues and Events Leading to the Problem
Many questions and events have led to a lack consistency of ongoing physical
fitness standards policy for police officers including a possible lack of understanding of
legal decisions rendered. An understanding of the reasons police administrations fail to
mandate physical fitness standards may be beyond the scope of this study, but the courts
have supported valid fitness standards that are shown to be a bona fide occupational
qualification (Means, et al. 2011; Easterling v. State, 2011; Lanning v. SEPTA, 2002).
Mental and physical job-related abilities can be tested by construct or criterion validity
methods that directly compare the essential job functions to the physical or mental task at
hand. To be correlated with a bona fide occupational qualification, the tests must show
by acceptable methods, to be predictive of, or significantly correlated with important
elements or work behavior which is relevant to the job being evaluated (EEOC, 2012).
Gulino v. New York State Education Department (2006) discussed this standard. It was

A Study on Physical Fitness Policies Among Police Departments in NC 6
cited in the case that “to demonstrate content validity, the employer must introduce data
showing the content of the selection procedure is representative of important aspects of
performance on the job for which the candidates are to be evaluated” (Gulino, 2006 p. 1).
According to the Equal Employment Opportunity Commission’s Uniform
Guidelines on Employee Selection Procedures, content and construct valid testing that
shows an adverse impact on any protected group must be documented with empirical
evidence (EEOC, 2012). It is important to note that although a test may have a disparate
impact on a certain group, it can be proven acceptable if it measures a bona fide
occupational qualification and is validated and documented according to standards. This
information clarifies how despite a lacking of police participation, the courts have
supported the mandating of physical fitness standards for law enforcement.
The problems in the profession are inconsistent physical fitness policies for
incumbent police officers and divergent attitudes on the role of officer physical fitness in
the overall goals of law enforcement. There have been some studies that examine the
importance of physical fitness among public safety employees and how fitness relates to
job performance measures including injuries, sickness, and absenteeism from an
individual standpoint (Dillern et al. 2014; Smith, 2011). However, a review of published
literature reveals a lack of research on police agency fitness policies and work-related
incidents regarding injuries, absenteeism and sickness among officers.
Dissertation Goal
The goal of this dissertation was to investigate the relationship between police
departments’ policies on physical fitness standards for their officers and relevant work-
related outcomes, of reported injury. The study looked at two types of physical fitness

A Study on Physical Fitness Policies Among Police Departments in NC 7
policies, i.e., mandatory (usually annual) fitness requirements and no ongoing fitness
requirements, and mandatory wellness requirements or no wellness requirements as the
independent variables of primary interest. Mandatory fitness requirements included
actual physical fitness testing (i.e., Obstacle course or POPAT), while mandated wellness
policies included mandatory blood pressure, cholesterol and other health related testing.
Other independent variables were used to control for differences such as
population served, the number of officers and geographic region of the police agency as
determined by telephone area code. The study used a longitudinal view over a period of 3
years, 2013 to 2015 by examining existing data.
Research Questions and Hypothesis
The research questions that arise in relation to a police department’s level of
program fitness and officer injury are;
1. Is there an association between a police departments’ fitness policies and
measures of officer injuries?
2. Do police departments with mandated physical fitness maintenance policies
tend to experience fewer officer injuries than police departments without
mandated physical fitness maintenance policies?
These are questions for research that could be very beneficial to administrators when
deciding whether to implement or not to implement, mandated physical fitness standards
within their organizations.
The questions sought to be answered by this research are based on the individual
comparison of the independent variable (IV) police departments in North Carolina with
mandated, voluntary or no physical fitness standards and the dependent variables (DV)

A Study on Physical Fitness Policies Among Police Departments in NC 8
output measures of reported injury. The hypothesis for this study is:
𝐻0: There is no significant association between police departments’ physical
fitness maintenance policies and measures of officer injury.
𝐻1: There is a significant association between police departments’ physical
fitness maintenance policies and measures of officer injury.
Relevance and Significance
Explanation of the problem and the groups and individuals affected
There is an assumed problem of police officers not maintaining physical fitness
standards beyond the basic academy. Low fitness levels are reported to be potential
problems for officer safety and officer productivity given that the police profession is
acknowledged to be a very dangerous job. For example, Zimmerman (2012, p.159) points
out the various kinds of occupational hazards faced by police officers including “the
threat of bodily injury or death, intense physical and mental stress, and unpredictable
emergencies.” Other research studies have agreed with these occupational hazards of
policing (Houser, Jackson, Bartis, et al. 2010; LaTourrette, 2011; Mayhew, 2001).
Not only is the police profession considered as being dangerous, but studies have
shown police officers have much higher levels of occupational mortalities than workers
in other occupations (Zimmerman, 2012; Maguire, Hunting, Smith et al., 2002; Tiesman,
Hendricks, Bell et al., 2010). It has been reported that “recent data from 2010 reveals an
occupational mortality rate of 18.0 per 100,000 workers in police and sheriff’s patrol
officers compared with the national average of 3.5” (Zimmerman, 2012, p.159).
Additionally, research studies recommend that police personnel engage in more physical

A Study on Physical Fitness Policies Among Police Departments in NC 9
exercise as one method of reducing risks of heart attacks, hypertension, diabetes, and
obesity (Zimmerman, 2012).
The stakeholders relevant to this study are not only the administrators responsible
for police organizations but the individual practitioners and the general public or
customers served by the profession. Although the administrators are ultimately
responsible for the development of policy and the overall success of the organization, the
officers are the ones who may experience the greatest consequences for not being
physically fit to do the job effectively (Lagestad, 2011; Dillern et al., 2014). The officers
are the ones that may suffer from assaults and illnesses resulting from obesity and a
sedentary lifestyle while using more sick leave than their healthier counterparts (Neovius,
Neovius, Kark & Rasmussen. 2010). The high-stress environment of the job combined
with low fitness levels can prove fatal to the working officer (Quigley, 2008;
Zimmerman, 2012). Other relevant stakeholders that cannot go without mention are the
individuals in the general public who are served by the officers. These customers are the
beneficiaries of police service and desire the highest quality police protection.
The far-ranging effects of the problem, greatness of impact, and the benefits of
solving the problem
An exploratory study on the effects of mandated physical fitness programs on
work-related injury, sickness, and absenteeism will benefit the law enforcement society
by providing empirical information about the programs impact. How a mandated fitness
or wellness program is related to police officer injury and sickness is desirable
information for administrators, officers, and the general public. Studies have
demonstrated the relationship between the physical requirements of police work and the
A Study on Physical Fitness Policies Among Police Departments in NC 10
fitness level of the officer, but there is a lack of actual examination showing the practical
effectiveness of fitness programs (Dillern et al., 2014; Lagesgtad, 2011, Boni, 2004).
The greatest benefit of this study will be to identify if mandated physical fitness programs
for police officers impacts the incidents of officer injury, sickness, and absenteeism in a
positive, negative or neutral manner.
Attempts to correct the situation and the consequences of not solving the problem
Over the years police management experts and professional associations have
recommended and encouraged police departments to improve the physical fitness
condition among their incumbent police officers and to adopt mandatory fitness programs
(Mattos, 2010; Means et al, 2011; Collingwood, Hoffman & Smith, 2004; Moser,1996;
Ness and Light, 1992). However, local administrations, as well as state and national
certifying agencies, continuously fail to regulate these fitness standards beyond the basic
law enforcement program. (Ness & Light, 1992; http://www.calea.org, 2015;
http://ncdoj.gov;).
One possible motivation for the reluctance to implement mandated physical
fitness standards among administrators is a lack of understanding of the related legal
issues. An article by Moser (1996) addressed Title VII of the Civil Rights Act that
prohibits discrimination on the basis of race, color, religion, sex and national origin.
United States Code for unemployment practices, 42 U.S. C. 2000e-2(h) states that it is
not discriminatory employment practice when a professionally developed ability test is
administered, as long as that test does not have an adverse or disparate impact on a
protected class. However, 42 U.S. C. 2000e-2(l) prohibits the use of different cut-off
scores or other adjustments based on race, color, religion, sex or national origin. The

A Study on Physical Fitness Policies Among Police Departments in NC 11
article also discusses how physical fitness tests must be valid and representative of the
significant aspects of performance on the job for which they will be evaluated. These
legal requirements may help explain why there exist confusion and a lack of consistent
physical fitness standards among agencies throughout the industry. The consequences for
not examining the issue is to not fully understand the impact of a mandated physical
fitness policy on a police department's overall efficiency and effectiveness.
How the goal of the study address the research problem, and how the study offers
promise as a resolution to the problem
An essential basis for this study is the concern related to a lack of physical fitness
standards for law enforcement across the United States. The ability to arrest a resisting
suspect has been shown to be dependent on the officer’s level of physical fitness (Dillern
et al. 2014). Making physical arrests, walking beats, and engaging in other physical
activities are part of a police officer’s work day indicating a logical link between
performance and fitness. There is also research available that indicates how regular
exercise is associated with improved overall health, lower rates of absenteeism and lower
health care costs (Boni, 2004; Boyce & Hiatt, 1992; Dillern, et. al. 2014; Wattles &
Harris, 1997). A quantitative study that examines relationships between physical fitness
and officer injuries will supplement the available research in this area.
Prior studies have also shown how an individual’s health can influence the bottom
line in an organization. Harte, Mahieu, Mallett, Norville and VanderWerf (2011) reported
that many employers had seen increased absenteeism as a result of an employee’s
individual health. Absent workers cause a direct strain on resources that reduce
productivity and increase costs. In a police organization, the manpower of field units
must be maintained at a minimum level, and sickness or injury can cause serious cost

A Study on Physical Fitness Policies Among Police Departments in NC 12
overruns in overtime and sick leave reimbursements. Health insurance costs are steadily
rising, and employers are paying averages of up to $13,000 per year per employee to
provide health insurance (Harte et al., 2011). The results of this study will assist in
showing possible relationships between mandated physical fitness programs and the
outcome indicators of injury, sickness and lost work time.
How the research will add to the knowledge base
The outcomes of this comprehensive study on the relationship between police
departments with and without mandatory fitness policies and measures of officer injury
and sickness could impact police policy on a large scale. The International Association of
Chiefs of Police (https://www.iacp.org) is a worldwide organization that shares relevant
information on policy and trends in the profession that could serve as a conduit for the
distribution of this information. Governing bodies that regulate mandated training and
provide funding for police agencies would benefit considerably from practical
information related to operational fitness measures of working officers. The North
Carolina League of Municipalities is an organization that provides insurance services to
municipalities and would also benefit from a study that could provide information that
helps reduce costs from officer injury and sickness.
This study is significant as the results will provide valuable information to
administrators who develop policy and are held accountable for mission success in the
field of criminal justice. Gaining knowledge in this area may provide critical information
and ultimately influence the decision-making process for law enforcement leaders and
policymakers. Many organizations are moving to proactive strategies to improve the
health and fitness of employees in an attempt to drive down the increasing cost of health
A Study on Physical Fitness Policies Among Police Departments in NC 13
coverage (Finkelstein, DiBonaventura, Burgess & Hale, 2010; Leoppke et al., 2007).
However, many agencies still do not address this issue. This study will greatly aid
administrators in decisions related to mandatory physical fitness standards in law
enforcement, corrections, and other associated public or private organizations.
The potential for generalization of the results
The external validity and generalizability to the population of police organizations
as a whole should not be compromised due to the representative sample of police
departments in North Carolina. The similarities between police departments across the
United States can be inferred by adherence to conventional rules of search and seizure
guided by the U.S. Constitution. Although not all agencies have received formal
accreditation, the commonality of rules, regulations, and policy through the Commission
on the Accreditation of Law Enforcement Agencies (https://www.calea.org), and other
associations (i.e. Fraternal order of Police, State, Federal and International Associations
of Chiefs of Police) also serve as a link between police organizations.
The potential for the dissertation to demonstrate original work
There is an evident shortage of research about the relationship between the overall
physical fitness of police officers and work outcomes (Boni, 2004; Tiwana, Bass &
Farrell, 2015). The review of the currently available literature produced studies that
examined individual police officer fitness levels but revealed no studies that examined or
compared a sample of police agencies both with and without mandated fitness standards.
Possible associations between officer injury and physical fitness standards may be
achieved by conducting additional empirical research in this area. A cross-sectional study
of police departments that examine the relationship between physical fitness maintenance

A Study on Physical Fitness Policies Among Police Departments in NC 14
policies and the rates of injury among police officers could make a substantial
contribution to the field of criminal justice.
An extensive search and systematic review of literature pertaining to measures of
police performance indicate that injuries, sickness and absenteeism are strongly
associated with individual levels of physical fitness (Lisman, O,Connor, Deuster &
Knapik, 2013; De Loes & Jansson 2002; Finkelstein et al., 2010). Traditional measures
of performance including, crime rates, arrest rates, and clearance rates were considered
for use in this study. Although advocated by many police professionals, it should be
recognized that these traditional measures are sometimes scrutinized due to the
possibility of manipulation by police to improve perceptions of performance (Maquire,
2003; Davis, 2012; Nicholson-Crotty & O’Toole, 2004).
Other measures of police performance like citizen surveys and personnel
evaluations may provide a better view of police performance but are not widely used due
to being more difficult and time-consuming to obtain (Tiwana et al. 2015). Because they
are not readily available, those types of measures are not feasible or within the
parameters of this study. This review also did not produce any additional recent studies
associating the overall physical fitness of police agencies to output performance measures
of injury, sickness, and absenteeism.
Barriers and Issues
While designing this research process, it is important to identify and minimize
any potential threats or barriers that may lead to internal or external invalidity of the
results thereby decreasing the effectiveness of the study (Bachman & Schutt, 2012). The
design of this research is summative in nature and relies on the compilation and analysis

A Study on Physical Fitness Policies Among Police Departments in NC 15
of secondary data associated with the variables (Bachman & Schutt, 2012). By utilizing
previous data about officers injured and rates of absenteeism among a selected sample of
municipal police departments in North Carolina, the threats to internal validity have been
minimized.
This study explicitly states the purpose is to examine physical fitness in police
departments, and an explanation is needed as to why other law enforcement organizations
were excluded from the process. The similar working environments of municipal police
departments serves to reduce features that may be considered intervening variables
associated with other types of law enforcement organizations. I have personally observed
the differences in urban and rural working environments between Police, County
Sheriffs, Highway Patrol and other state agencies. The congruity between the police
department environment will help to minimize these differences. All police departments
in North Carolina are regulated by the NC Criminal Justice Education, Training and
Standards Commission, which is a separate entity from regulating agencies of other State
and County Law Enforcement (https://www.ncdoj.gov). The consistency of certification
and regulation standards adds to the generalizability for a sample of police departments in
North Carolina used in this study.
Consideration was given to the prospect of utilizing reported rates of crime, arrest
and clearance rates as measures of performance for police departments in this proposed
study. However, the available research clearly identifies how reported crime, arrest, and
clearance rates can be influenced by a multitude of environmental and societal factors,
and how the actual validity of reported rates may be scrutinized (Siegel, 2013: Nicholson-
Crotty & O’Toole Jr., 2004). Although the use of crime, arrest and clearance rates

A Study on Physical Fitness Policies Among Police Departments in NC 16
continues to be utilized by some agencies as an overall performance measure (Maquire,
2003), applying these as an output measure of performance will not be employed in this
study. Controlling for all possible intervening variables related to reported rates of crime,
arrests, and cases cleared in a community is not within the scope of this study.
Limitations and Delimitations
Because this study involves the cross-sectional examination of both published and
non-published data from a sample of police departments, the limitations as to the
accuracy of information regarding the data are noted. It is important to recognize the
existing data on officers injured by agency are subject to collection practices of the North
Carolina League of Municipalities. The League has gathered this data based on reported
workers compensation claims from officers injured by individual police departments.
This database is a very useful for the purpose of this study, and the League has agreed to
provide the information due to a mutual desire for the study’s results. Supplemental data
on officer injury is also available from the North Carolina Department of Justice was
used in this study (http://crimereporting.ncdoj.gov.) While individual agency recording
practices may influence the accuracy of the data, and the process may not be specifically
designed for research, the availability and common use make the information acceptable
for this study. The protocol and record keeping of the North Carolina Department of
Justice according to Uniform Crime Reporting standards produce data that has become a
reliable social indicator of crime that is commonly used for criminal justice research (NC
Department of Justice).
To keep the study manageable and within the scope of this project, the sample of
law enforcement agencies is limited to police departments in North Carolina who are

A Study on Physical Fitness Policies Among Police Departments in NC 17
members of the NC League of Municipalities (n = 253). This number could also be
reduced if other required information from a department is not readily available or the
agency does not participate in the study. Some smaller agencies listed may not keep
records or have data relating to independent or dependent variables and therefore, may
not be of use in this study. The majority of data to be obtained in this study is available
from the North Carolina League of Municipalities and the North Carolina Department of
Justice. Surveys and personal communication either face to face, via e-mail and
telephone will also be used to obtain data related to the independent variable of fitness
standards of each sample police department for the period relative to the study.

A Study on Physical Fitness Policies Among Police Departments in NC 18
Definition of Terms
POPAT - Police Officers Physical Ability Test – Test adopted by the State of
North Carolina to test the physical abilities of police recruits.
PAT - Physical Abilities Test – Test adopted by the State of South Carolina to test the
physical abilities of police recruits.
ADVERSE IMPACT - A substantially different rate of selection in hiring, promotion, or
other employment decision which works to the disadvantage of members of a race, sex,
or ethnic group (EEOC, 2012).
DISPARATE TREATMENT - occurs where members of a race, sex, or ethnic group
have been denied the same employment, promotion, membership, or other employment
opportunities as have been available to other employees or applicants (EEOC, 2012).
BONA FIDE OCCUPATIONAL QUALIFICATION - Employment qualifications that
employers are allowed to consider while making decisions about hiring and retention of
employees. The qualification should relate to an essential job duty and is considered
necessary for the operation of the particular business (US Legal, 2012).
ABILITY - A present competence to perform an observable behavior or a behavior
which results in an observable product (EEOC, 2012).
EMPIRICAL EVIDENCE - evidence relating to or based on experience or observation.
CRITERION VALIDITY - demonstrated by identifying criteria that indicate successful
job performance and then correlating test scores with those identified criteria (Bachman,
2011).
CONSTRUCT VALIDITY – measuring validity by showing that a measure is related to
a variety of other measures as specified in a theory (Bachman, 2011).

A Study on Physical Fitness Policies Among Police Departments in NC 19
Summary
Chapter I discussed the issue of a lack of uniformity of physical fitness standards
among incumbent police officers despite the prodigious agreeance of its benefits. The
goal of the study is to investigate the relationship between the work-related outcomes of
injuries between agencies with and without mandated fitness maintenance standards. The
hypothesis being that there will be an association between police department’s physical
fitness maintenance policies and measures of reported officer injury. This non-
directional hypothesis is appropriate while seeking to identify trends associated with
mandatory physical fitness maintenance policies of police departments. The study will
be highly relevant and provide key information to administrators contemplating the
implementation of a mandated physical fitness program. Barriers and limitations of this
study have been examined but do not diminish the possible overall benefits to the
criminal justice profession.

A Study on Physical Fitness Policies Among Police Departments in NC 20
CHAPTER 2: LITERATURE REVIEW
Introduction
The goal of this review was to uncover all available factual information related to
the research questions in this study. Information from prior research has provided a firm
foundation to investigate links between mandated physical fitness programs, officer
injury, sickness, and lost work time. To further support the need for this study, negative
correlations between individual physical fitness levels and work performance measures of
sick leave and absenteeism have been shown (Neovius et al., 2010; Jacobson & Aldana,
2001; Blair et al., 1986) along with the rising costs associated with obesity in the
workplace (Finkelstein et al., 2010; Leoppke et al., 2007). Means et al, (2011) discussed
the growing concerns over police administrators failure to implement mandated physical
fitness standards for incumbent officers. The article mentioned as many as 98% of U.S.
agencies fit into this category. This review also reinforces the conviction that a police
officer’s job often involves the need for physical skills, and those skills are linked to
essential work performance/productivity indicators (Lagestad, 2011).
To fully explore the relationship between a police officer’s physical fitness and
output measures that reflect officer injury, sickness and absenteeism, an extensive search
for related and quality research studies was undertaken. Research databases from Nova
Southeastern University’s Alvin Sherman and Shepard Broad Libraries were searched
using ProQuest Criminal Justice, Academic Search Premier, Journal Finder and Google
Scholar. Keywords of “police” and “law enforcement,” were paired with terms that
included: motor ability, health, exercise, effectiveness, physical fitness, fitness, studies,
performance, productivity, safety, and crime. The words “physical,” “fitness” and

A Study on Physical Fitness Policies Among Police Departments in NC 21
“health” were also paired with terms: injury, sickness, absenteeism, presenteeism and
attendance to produce significant studies. Snowball techniques were useful in discovering
relevant studies by examining references sections of found articles. Although no
individual studies were located that examined the research questions specific to this
research proposal, the search did reveal a significant number of overall relevant and
recent research. These studies provide a background and support the need for additional
research on the proposed topic. Some older studies were located and were only
mentioned because they serve as seminal work for the more current studies.
After a review of all found literature, the information was divided into three
separate categories relevant to this study and are presented in the following order. (1) The
Associations of Fitness with Injury; (2) Studies Relating Fitness to Sickness; and (3) The
links between Fitness and Absenteeism. Grouping the discussion of the literature in this
manner is better suited for covering the material relevant to dependent variables in this
study.
Associations of Fitness with Injury
There has been substantial research showing significant associations between
individual levels of physical fitness and work related injuries. The International
Association of Chiefs of Police (2014) in cooperation with the Bureau of Justice
Assistance conducted a cross-sectional study from eighteen police agencies tracking
1,295 self-reported injuries over a one year period. The study revealed that officers who
participated in fitness training were less likely to suffer OSHA reportable injuries.
Officers with healthy weights missed almost half as many days of work after an injury
than overweight officers and nearly four times fewer days than officers classified as
A Study on Physical Fitness Policies Among Police Departments in NC 22
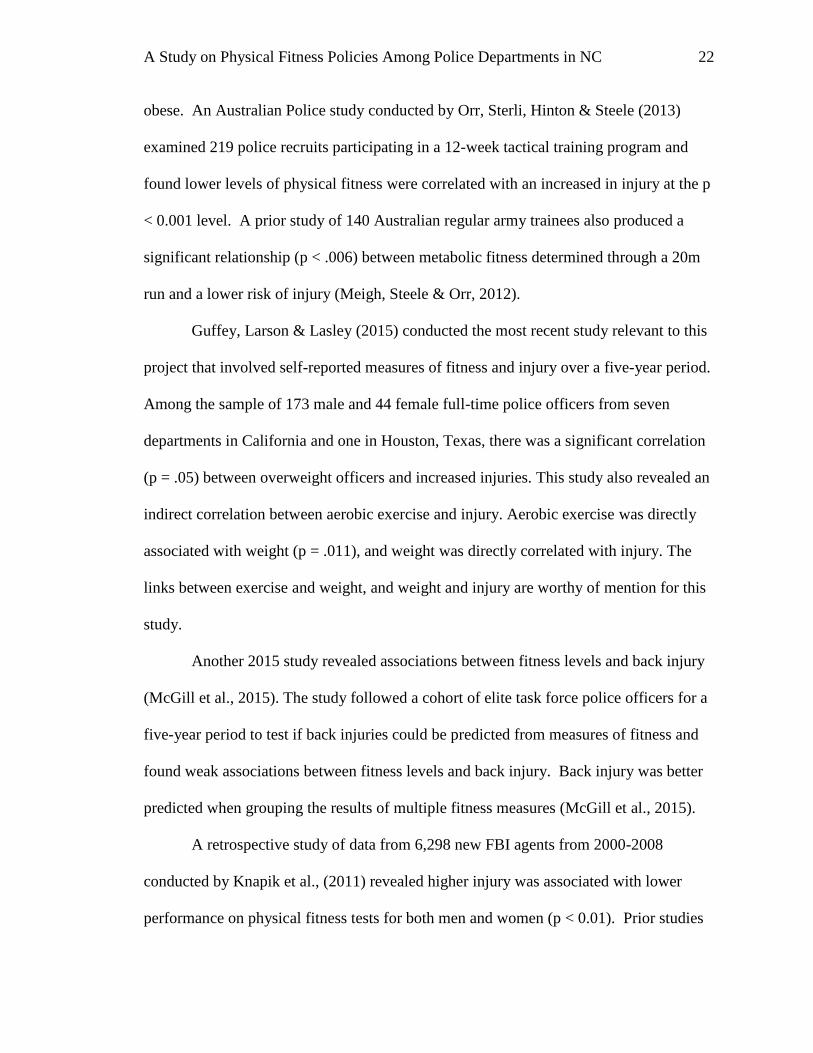
obese. An Australian Police study conducted by Orr, Sterli, Hinton & Steele (2013)
examined 219 police recruits participating in a 12-week tactical training program and
found lower levels of physical fitness were correlated with an increased in injury at the p
< 0.001 level. A prior study of 140 Australian regular army trainees also produced a
significant relationship (p < .006) between metabolic fitness determined through a 20m
run and a lower risk of injury (Meigh, Steele & Orr, 2012).
Guffey, Larson & Lasley (2015) conducted the most recent study relevant to this
project that involved self-reported measures of fitness and injury over a five-year period.
Among the sample of 173 male and 44 female full-time police officers from seven
departments in California and one in Houston, Texas, there was a significant correlation
(p = .05) between overweight officers and increased injuries. This study also revealed an
indirect correlation between aerobic exercise and injury. Aerobic exercise was directly
associated with weight (p = .011), and weight was directly correlated with injury. The
links between exercise and weight, and weight and injury are worthy of mention for this
study.
Another 2015 study revealed associations between fitness levels and back injury
(McGill et al., 2015). The study followed a cohort of elite task force police officers for a
five-year period to test if back injuries could be predicted from measures of fitness and
found weak associations between fitness levels and back injury. Back injury was better
predicted when grouping the results of multiple fitness measures (McGill et al., 2015).
A retrospective study of data from 6,298 new FBI agents from 2000-2008
conducted by Knapik et al., (2011) revealed higher injury was associated with lower
performance on physical fitness tests for both men and women (p < 0.01). Prior studies

A Study on Physical Fitness Policies Among Police Departments in NC 23
conducted by Knapik, Darakjy & Hauret (2006), and Knapik et al., (2001) produced
similar results with military samples. The 2006 group consisted of 1174 men and 898
women in basic training at Ft. Jackson and revealed a significant (P < .01) highest risk of
injury among those with low physical fitness scores before entering basic training. The
2001 study sampled 756 men and 474 women in US Army basic combat training and
showed that fewer push-ups, slower 3.2k runs, and smoking were risk factors for time-
loss injury (p < 0.01 and p < 0.04).
Relationships between fitness and injury have also been tested in the fire service.
Poplin, Roe, Peate, Harris, and Burgess (2014) conducted a cohort study of 799
firefighters in Tucson Arizona from 2005-2009. The study measured aerobic physical
fitness and documented injuries to determine that firefighters in the lowest fitness level
category were 2.2 times more likely to sustain an injury that those in the highest fitness
category with a 95% CI. This study is significant as it supports the fitness/injury
relationship relevant to the profession of public safety.
Other military studies have also revealed significant correlations between physical
fitness levels and injury. A cohort of 874 men in Marine Corps officer candidate training
revealed candidates with slower run times were 1.7 times more likely (p < 0.001) to
experience injury than those with faster run times (Lisman et al., 2013). Another study
utilizing the same cohort of 874 male Marines revealed lower functional movement
screening and lower physical training scores demonstrated higher injury risks (p < 0.01)
across all types of injuries (O’Connor, Deuster, Davis, Pappas, & Knapik, 2011). Similar
results were found in a study of 824 females who participated in Marine Corps training at
Paris Island Depo in 1999. Slower run times were associated (95% CI) with an increase
A Study on Physical Fitness Policies Among Police Departments in NC 24
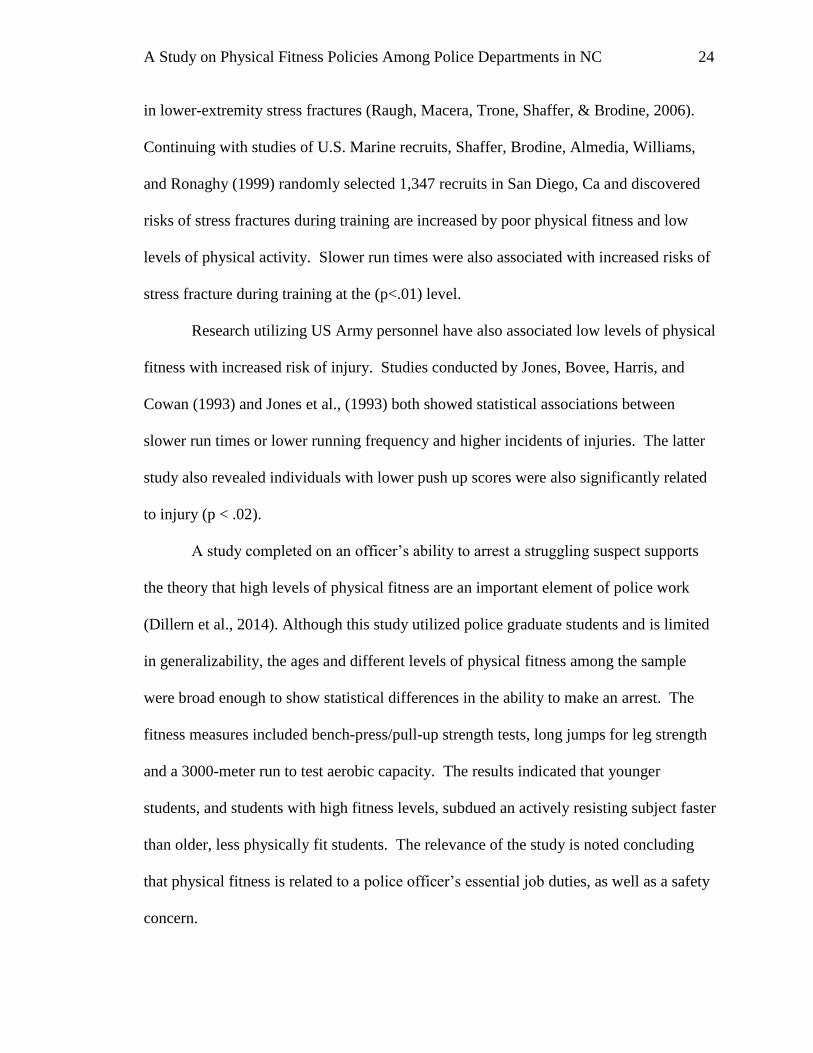
in lower-extremity stress fractures (Raugh, Macera, Trone, Shaffer, & Brodine, 2006).
Continuing with studies of U.S. Marine recruits, Shaffer, Brodine, Almedia, Williams,
and Ronaghy (1999) randomly selected 1,347 recruits in San Diego, Ca and discovered
risks of stress fractures during training are increased by poor physical fitness and low
levels of physical activity. Slower run times were also associated with increased risks of
stress fracture during training at the (p<.01) level.
Research utilizing US Army personnel have also associated low levels of physical
fitness with increased risk of injury. Studies conducted by Jones, Bovee, Harris, and
Cowan (1993) and Jones et al., (1993) both showed statistical associations between
slower run times or lower running frequency and higher incidents of injuries. The latter
study also revealed individuals with lower push up scores were also significantly related
to injury (p < .02).
A study completed on an officer’s ability to arrest a struggling suspect supports
the theory that high levels of physical fitness are an important element of police work
(Dillern et al., 2014). Although this study utilized police graduate students and is limited
in generalizability, the ages and different levels of physical fitness among the sample
were broad enough to show statistical differences in the ability to make an arrest. The
fitness measures included bench-press/pull-up strength tests, long jumps for leg strength
and a 3000-meter run to test aerobic capacity. The results indicated that younger
students, and students with high fitness levels, subdued an actively resisting subject faster
than older, less physically fit students. The relevance of the study is noted concluding
that physical fitness is related to a police officer’s essential job duties, as well as a safety
concern.

A Study on Physical Fitness Policies Among Police Departments in NC 25
Fitness and Sickness
Associations between fitness and sickness can affect a police department’s
performance, and strong associations have been shown in several studies. An interesting
and recent study from Chenoweth, Rager, and Haynes (2015) involved the relationship
between body mass index and workers compensation claims from municipal employees
represented by the North Carolina League of Municipalities. The study examined 3951
workers compensation claims from 2000-2009 that included height and weight required
for determining BMI. The study revealed that obese employees had 50% higher average
indemnity claim costs, 31% higher workers compensation claims and 38% higher
combined costs that those with recommended BMI’s (Chenoweth et al., 2015, p. 934).
Another interesting finding of the study is that 85% of the worker's compensation claims
filed by the male group were considered overweight or obese. The results of the statistical
analysis were at or above the p < .05 level.
In a similar study conducted in 2010, high levels of waist circumference were
associated with twice the risk of mortality in men and women at the p < .05 level. The
study examined waist sizes in 48,500 men, and 56,343 women aged 50 and older in a
cancer prevention study and compared them with mortality rates between the years 1997
and 2006. Men and women in the highest category of waist size were more likely to be
less educated, have high BMI, be physically inactive, be former smokers, and have a
strong history of cardiovascular disease, cancer or respiratory disease. Relative risks
associated with waist size appeared larger in the less physically active (p = .04), (Jacobs
et al., 2010).

A Study on Physical Fitness Policies Among Police Departments in NC 26
Greater risks of cardiovascular disease have been linked to low levels of physical
fitness. A cross-sectional study of 192 former members of the Milwaukee Police
Department using self-reporting measures revealed that physical inactivity was a factor in
the cardio risk factor category. The main findings were that retired LEO’s have a higher
prevalence of cardiovascular disease compared to the general public (p < .05) (Ramey et
al.,, 2009 p. 451). Sassen et al., (2009) conducted a cross-sectional study of 1298 Utrecht
police employees and found physical activity and physical fitness was inversely related to
cardiovascular risk factors (p < .01). Higher intensity of exercise was found to be the
main characteristic of physical activity that produced an effect on cardiovascular risk
factors (Sassen et al., 2009 p. 682). A follow-up study with the same cohort found 40%
of those with cardiovascular risk factors had low intentions to engage in physical activity
(Sassen, Kok, Schaalma, Kiers, & Vanhees, 2010). An older study also concluded with
similar findings. Mittleman et al., (1993) interviewed 1228 heart patients and found that
physical exertion can trigger the onset of myocardial infarction, especially in sedentary
people (95% CI).
Low physical fitness levels have also been associated with back pain. A study
conducted by Heneweer, Picavet, Staes, Kiers, and Vanhees (2012) examined self-
reported data from 1,723 Utrecht police employees in the Netherlands and found that
higher levels of physical fitness were associated with less low back pain (95% CI). On
the contrary, extremes in both directions were related to LBP complaints indicating that
too little or too much physical activity are both linked with LBP (Heneweer et al., 2012 p.
1267). Nabeel, Baker, and McGrail (2007) conducted a study of 332 active members of
the Minneapolis Police Department and found that officers who were the most physically

A Study on Physical Fitness Policies Among Police Departments in NC 27
active were about a third as likely to report back pain and less than half as likely to report
chronic pain (p < .0002). The study also revealed that officers who engage in higher
levels of physical activity and are more physically fit have a lower prevalence of
musculoskeletal injuries and chronic pain (p < .002).
Associations have also been found between physical fitness and other sickness
related physiological and psychological conditions including blood pressure, stress, and
depression. Gerber, Kellman, Hartman and Puhse (2010) conducted a study of 533 police
employees and 460 emergency response workers in Northwestern Switzerland and
discovered statistical interactions of exercise that protect against stress-related health
hazards. Increased stress was associated with poorer health at the p < .05 level. Gerber et
al., (2013) also revealed that police officers with high perceived fitness scores had the
highest mental health scores (p < .01) and BMI was significantly associated with mental
health and perceived physical fitness. Norvell and Belles (1993) conducted a study of 43
male state law enforcement officers who were involved in a supervised circuit weight
training program for six months. Subjects who received four months of circuit weight
training demonstrated significant (p < .01) reductions in psychological symptoms
including depression and anxiety (Norvell & Bells, 1993 p.524).
The links between Fitness and Absenteeism
An extensive search and review of available literature have produced strong
evidence to support the correlation between low levels of physical fitness and increased
rates of absenteeism. Neovius et al., (2010) studied a cohort of 43,939 Swedish men from
prior military service from 1986-2005 and used obesity as a measure of health/fitness.
Obesity was associated with an increased risk of sick-leave absences as compared to

A Study on Physical Fitness Policies Among Police Departments in NC 28
normal weight (95% CI). The study also found disability pensions were higher in the
overweight and obese categories (Neovius et al., 2010 p. 115). A cross-sectional study of
a 2006 Medical Expenditure Survey and 2008 National Health and Wellness Survey by
Finkelstein et al., (2010) revealed medical expenditures, absenteeism and presenteeism
for businesses increased with obesity (95% CI). Kyröläinen et al., (2008) studied 7,179
male military personnel and found those with sickness absence greater than seven days
displayed lower muscle fitness and shorter running distance when compared to the groups
with shorter sickness absence (p < 0.001). BMI was also associated with increased
sickness absence.
Ricci and Chee (2005) utilized existing data from a National Telephone Survey to
conduct a cross-sectional study examining loss productive time associated with excess
weight in the U.S. workforce. The data revealed obese workers were significantly (p <
0.0001) more likely to report loss productive time than normal or overweight workers
(Ricci & Chee, 2005 p. 1227). In another study, one hundred forty-three individuals from
various departments within a city were tested for muscular flexibility and overall fitness
by Wattles and Harris (1997). The researchers found more flexible employees tended to
be absent from their jobs less that non-flexible employees (p < .07) and the more
repetitions the employees performed on the bench press test, the more productive they
felt at work (Wattles & Harris, 1997 p. 29).
Other studies identified have produced similar results. Jacobson and Aldana,
(2001) utilized self-reported measures from a sample of 79,070 men and women and
found a statistically significant relationship (p < .05) between absenteeism and exercise.
Lower weekly exercise frequency was associated with higher absenteeism rates (Jacobsen

A Study on Physical Fitness Policies Among Police Departments in NC 29
& Aldana, 2001, p. 1022). A before and after study of 884 subjects from the police,
chemical and banking industries found that high exercise participation groups, on
average, showed a statistically significant (p < .05) decline of 4.8 sick days when
compared to non-exercise groups (Lechner & de Vries, 1997, p. 2). Boyce, Jones, and
Hiatt (1991) examined 514 police officers from a large southeastern metropolitan police
department to measure fitness levels and sick leave absenteeism. They found men 35 and
older with high scores on cardiovascular fitness had fewer absences than those with lower
scores (p = .01). A sample of sworn officers (n = 765) in Austin Texas were tested for
levels of physical fitness over a three-year period by Steinhardt, Greenhow, and Stewart
(1991). The study collected rates of absenteeism not related to on the job injury or
personal reasons. The results showed physical inactivity or sedentary officers were absent
significantly (p < .05) more than officers who were occasionally active or active three
times per week (Steinhardt et al., 1991, p. 1022).
Two additional older studies were found that revealed significant relationships
between fitness program participation and decreased absenteeism. A study of 152 Bank
of Amsterdam employees indicated taking part in an employee fitness program led to
significant (p = .04) decreases in absenteeism among participants (Kerr & Voss, 1993).
Blair et al., (1986) compared 3,846 fitness program participants to 8,290 non-participants
and found improved physical fitness was associated with less absenteeism (p < 0.0001)
for those who completed the health promotion program.
Summary of Literature
The available research has validated the need for this study and provided support
for the output measures of injury, sickness, and absenteeism being related to the overall
A Study on Physical Fitness Policies Among Police Departments in NC 30
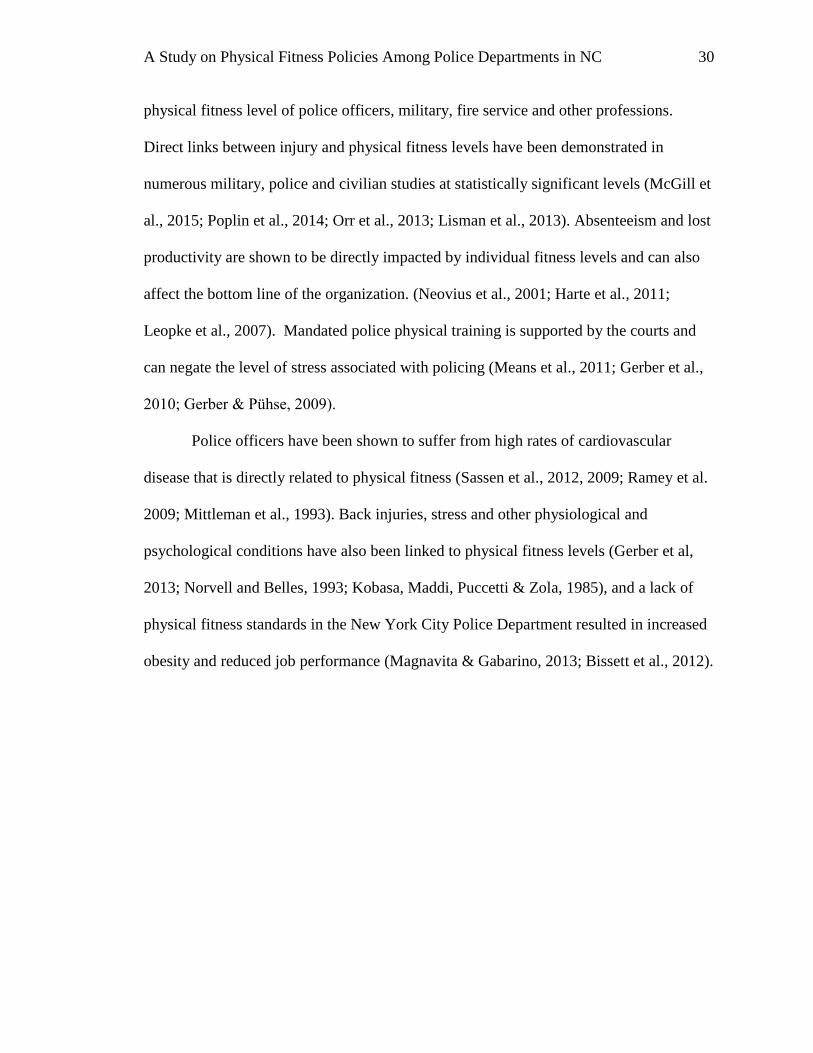
physical fitness level of police officers, military, fire service and other professions.
Direct links between injury and physical fitness levels have been demonstrated in
numerous military, police and civilian studies at statistically significant levels (McGill et
al., 2015; Poplin et al., 2014; Orr et al., 2013; Lisman et al., 2013). Absenteeism and lost
productivity are shown to be directly impacted by individual fitness levels and can also
affect the bottom line of the organization. (Neovius et al., 2001; Harte et al., 2011;
Leopke et al., 2007). Mandated police physical training is supported by the courts and
can negate the level of stress associated with policing (Means et al., 2011; Gerber et al.,
2010; Gerber & Puhse, 2009).
Police officers have been shown to suffer from high rates of cardiovascular
disease that is directly related to physical fitness (Sassen et al., 2012, 2009; Ramey et al.
2009; Mittleman et al., 1993). Back injuries, stress and other physiological and
psychological conditions have also been linked to physical fitness levels (Gerber et al,
2013; Norvell and Belles, 1993; Kobasa, Maddi, Puccetti & Zola, 1985), and a lack of
physical fitness standards in the New York City Police Department resulted in increased
obesity and reduced job performance (Magnavita & Gabarino, 2013; Bissett et al., 2012).

A Study on Physical Fitness Policies Among Police Departments in NC 31
CHAPTER 3: METHODOLOGY
Research Method
The approach for this study utilized a cross-sectional analysis and purposive
matching to examine a sample of municipal police departments in North Carolina (n =
253) to discover any associations mandated physical fitness and wellness programs have
on output measures of reported officer injury. The following sections will outline the
methodology of the study to include the participants examined, the instruments used to
gather data, the procedures used in analyzing the data, and the limitations of this study.
The analysis of information will seek to identify associations or trends between the (IV)
of a police department's level of fitness in operation (policy), and the (DV) output
measures of injury that impacts performance.
As revealed in the review of the literature, a relationship between individual
physical fitness and reduced injury has been shown to exist (IACP, 2014; Orr, et al. 2013;
Knapik et al., 2011; Poplin et al., 2014). This study is unique as it examined possible
associations between police department’s policies of physical fitness maintenance and
reported injuries. The output measures of injury examined in this study include:
1. The rate of workers compensation claims per agency.
2. The average medical cost per agency due to workers compensation claims.
3. The average number of lost work days per agency due to workers
compensation claims.
4. The number of workers compensation claims by males per agency.
5. The number of workers compensation claims by females per agency

A Study on Physical Fitness Policies Among Police Departments in NC 32
The additional information relevant to medical costs, lost work days, and claims by age,
sex provide more insight into possible associations between fitness policies and injury.
The calculations for obtaining each output measure of injury is based on actual data
including the number of sworn officers and populations served per agency.
Calculating Output Measures
Rate of Claims by Department
The output measures associated with injury in this study were also calculated
based on the reported worker's compensation claims and the number of total hours
worked per agency. The Bureau of Labor Statistics under the United States Department
of Labor provides a standardized formula to determine rates of injury (The number of
reported injuries x 200,000) / number of employee hours worked = incident rate (BJS,
2016 at http://www.bls.gov/iif/osheval.htm). Because obtaining the actual hours
worked per officer per agency was not available, the total number of hours worked for
municipal police departments was calculated at 2080 hours per year x the total number of
officers employed. The total hours worked were multiplied by 3 for a total of 6,240 hours
worked during the three-year period of the study. While it is important to recognize that
some officers may work more or less hours depending on individual job assignments and
leave time, this estimation is based on a standard 40 hour work week and recommended
by the Bureau of Justice Statistics (BJS, 2016).
Average Medical Costs per Agency
The average medical costs were calculated for each individual agency by
summing the incurred costs by claim as reported by the NC League of Municipalities
divided by the total number of officers employed during the years of the study. This

A Study on Physical Fitness Policies Among Police Departments in NC 33
calculation provided an average dollar amount that was compared to all agencies as well
as the matched groups associated with the independent variable. Matching departments
in this category based on the number of officers assisted in maximizing the internal
validity of the study (Bachman & Schutt, 2012) and created a consistent measure between
departments on a 1 to 1 basis.
Average Loss Work Days by Agency and Officer
The loss days per claim for each agency was provided from the NCLM data. The
total lost days were averaged by the number of reported claims and then divided by the
number of officers per agency. This provided an average number of the lost work days
by officer for each reporting agency. The totals were then summed by department
according to each department's self-reported level of physical fitness maintenance.
The Rate of Workers Compensation Claims by Sex
Data relevant to the gender of each reported claimant was provided by the NC
League of Municipalities and divided by the total number of officers by sex to give a
number for data analysis. The number of claims according to sex were totaled for each
agency and then summed according to their reported level of physical fitness
maintenance. The individual names of agencies were coded, and individual claimants not
presented to the researcher in the data, thereby minimizing the risk of harm due to the
possible identification of individual claimants in this study.
Participants
This study employed a purposive sampling method to examine data from
municipal police departments in North Carolina over a three (3) year period of 2013 -
2015 (Bachman & Schutt, 2012). Data for this study was made available from the North
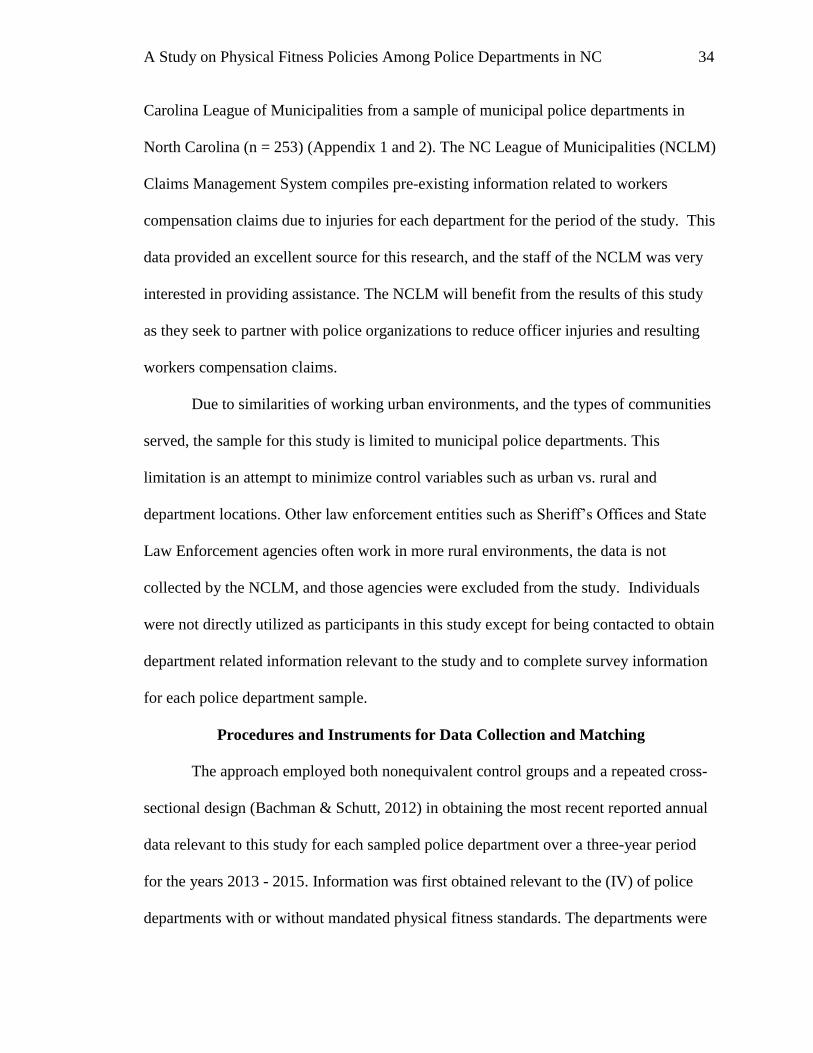
A Study on Physical Fitness Policies Among Police Departments in NC 34
Carolina League of Municipalities from a sample of municipal police departments in
North Carolina (n = 253) (Appendix 1 and 2). The NC League of Municipalities (NCLM)
Claims Management System compiles pre-existing information related to workers
compensation claims due to injuries for each department for the period of the study. This
data provided an excellent source for this research, and the staff of the NCLM was very
interested in providing assistance. The NCLM will benefit from the results of this study
as they seek to partner with police organizations to reduce officer injuries and resulting
workers compensation claims.
Due to similarities of working urban environments, and the types of communities
served, the sample for this study is limited to municipal police departments. This
limitation is an attempt to minimize control variables such as urban vs. rural and
department locations. Other law enforcement entities such as Sheriff’s Offices and State
Law Enforcement agencies often work in more rural environments, the data is not
collected by the NCLM, and those agencies were excluded from the study. Individuals
were not directly utilized as participants in this study except for being contacted to obtain
department related information relevant to the study and to complete survey information
for each police department sample.
Procedures and Instruments for Data Collection and Matching
The approach employed both nonequivalent control groups and a repeated cross-
sectional design (Bachman & Schutt, 2012) in obtaining the most recent reported annual
data relevant to this study for each sampled police department over a three-year period
for the years 2013 - 2015. Information was first obtained relevant to the (IV) of police
departments with or without mandated physical fitness standards. The departments were

A Study on Physical Fitness Policies Among Police Departments in NC 35
then individually and purposively matched (Bachman & Schutt, 2012) and categorized
into either mandatory or non-mandatory physical fitness maintenance policies according
to similarities including population and geographic region of the state. Matching the
experimental group (departments with mandated standards) to the control group
(departments without mandated standards) is an accepted way to achieve causal validity
for this study (Bachman & Schutt, 2012).
Information for the dependent variable pertaining to injury for each of the
identified municipal police departments was obtained from the database of the NCLM.
Alphabetical coding of each agency was used to protect the identity of the individual
agency and the number and type of reported workers compensation claims. Among the
sample of organizations, information was obtained relevant to their individual policy
related to physical fitness maintenance. Specific information about mandatory and no
physical fitness standards for each sample department was then linked up to the
alphabetized data by NCLM personnel thereby protecting the individual police
department from the release of claims information.
Other data relevant to injuries used to supplement this study was available from a
combination of public web sources (https://www.ncdoj.gov) or via direct communication
with research analysts of the North Carolina State Bureau of Investigation NCSBI. This
information consisted of individual department data on the number of officers employed
and the population served. The specific link to this information at the North Carolina
Department of Justice is found at (http://crimereporting.ncdoj.gov/Reports.aspx), and was
used to obtain relevant information on these output measure dependent variables for this
study. Other data was available related to injuries classified as assaults and are broken

A Study on Physical Fitness Policies Among Police Departments in NC 36
down into knife, hands/feet, and other weapons. This information could also be sorted
into serious and non-serious injury categories but was not used in this study. The
information could be utilized for future studies that expand on this topic.
Population, Age, and Gender Data
The amount of population served, and the total number of officers for each police
department was collected and used in the analysis through the data services of the
NCDOJ at (http://crimereporting.ncdoj.gov). Other control variables including the
number of male and female officers and the average age of officers were also collected
and proved relevant in the analysis process. The sources of this pertinent information
were also located with the NCDOJ at (http://crimereporting.ncdoj.gov).
Independent Variable Data
Identified samples of police departments were classified as having either
mandated physical fitness policies, mandated wellness policies or no mandated policy of
physical fitness or wellness program. This information was obtained by distribution of a
survey and personal communications with police department administrators or staff who
routinely share policy information with other agencies. My current position as a Chief of
Police and a member of the North Carolina Association of Chiefs of Police assisted
greatly in this matter. Department policy is also available as a public record under state
and federal law and was obtained from participating agencies without resistance. The
information was also gathered as to how long the physical fitness standards or lack of
physical fitness standards have been in place. The date a department’s fitness policy was
implemented and relevant when applying to the analysis and comparing the output
measures across agencies.

A Study on Physical Fitness Policies Among Police Departments in NC 37
Table 1 shows the independent and dependent variables used in this study.
Table 1
Independent and Dependent Variables for use in the study.
Survey Questions
To obtain information relevant to the independent variables in the most efficient
manner, survey questions were distributed to each sample police organization. Follow up
communications became necessary with samples to determine the length of time fitness
policies have been in place and to obtain information from non-responding agencies. A
statement was included specifying the identification of individual organizations will not
be included in the study and all information relating to the names of organizations will be
kept strictly confidential. An example of the survey questions utilized in obtaining the
independent variable information is as follows:
1. Does your agency have a mandated (all officers annually) physical fitness
maintenance policy and what year was the policy implemented?
Outcomes
(DV)
Mandatory
Fitness/Wellness
Maintenance
Policy (IV)
No
Fitness/Wellness
Maintenance
Policy (IV)
The rate of workers compensation claims per agency.
The average medical cost per agency.
The average number of lost work days per agency.
The rate of claims by males per agency.
The rate of claims by females per agency.
A Study on Physical Fitness Policies Among Police Departments in NC 38
2. Does your agency have a mandated (all officers annually) wellness
program and what year was the program implemented?
Please provide a copy of the policy to [email protected] or fax to 252-482-
4999.
To assist in providing the necessary information for this study, physical fitness, and
wellness programs may be thought of independently and therefore both questions were
asked. A participation letter was included in the survey as required by the IRB of Nova
Southeastern University (Appendix 3).
Data Analysis
The research questions were used to identify if trends or associations exist
between mandated physical fitness maintenance policies and indicators of injury.
1. Is there an association between a police departments’ fitness policies and
measures of officer injuries?
2. Do police departments with mandated physical fitness maintenance policies
tend to experience fewer officer injuries than police departments without
mandated physical fitness maintenance policies?
These questions look at the relationship between police departments in North Carolina
both with and without mandated physical fitness standards and reported officer injuries,
and were examined by using a Pearsons Chi-Square goodness of fit test. The
nonparametric Chi-Square goodness of fit test is an appropriate method to test if the
observed amounts for a nominal variable differ from what is expected
(www.ats.ucla.edu). The Chi-Square test will enable the researcher to either accept or
reject the null hypothesis in a study utilizing nominal independent variables and totaled
or averaged numbers of dependent variables (Salkind, 2011).

A Study on Physical Fitness Policies Among Police Departments in NC 39
To determine if the observed number of reported officer injuries from a sample of
police departments either with or without mandatory physical fitness standards differ
from the expected outcome, a level of significance less than .05 was used as a basis for
rejecting the null hypothesis. The degrees of freedom for the nominal independent
variable was (1) producing a critical value of 3.84 to be used as a cut off comparison for
the Chi-Square value produced. (Salkind, 2011).
To examine if the observed value of police departments with and without
mandated physical fitness maintenance policies differs greater than what is expected by
chance, the Chi-Square formula 𝑋2 = ∑ (0−𝐸)²
𝐸 was utilized. The data was computed
both manually and by using CHITEST formula in Microsoft Excel© to assist in the
process. The CHITEST formula produced the exact level of significance which was of
great value to assess any possible associations. The effect size for each output measure
was calculated using both Phi φ = ( √ 𝑋2
𝑁)and contingency coefficient C =( √
𝑋2
𝑋2+𝑁).
Cohens standard effect size was applied and a (.1) small, (.3) medium, and (.5) large was
used in the analysis.
An example of the data for observed and expected lost work days and the chi-
square goodness of fit test is presented in Table two.
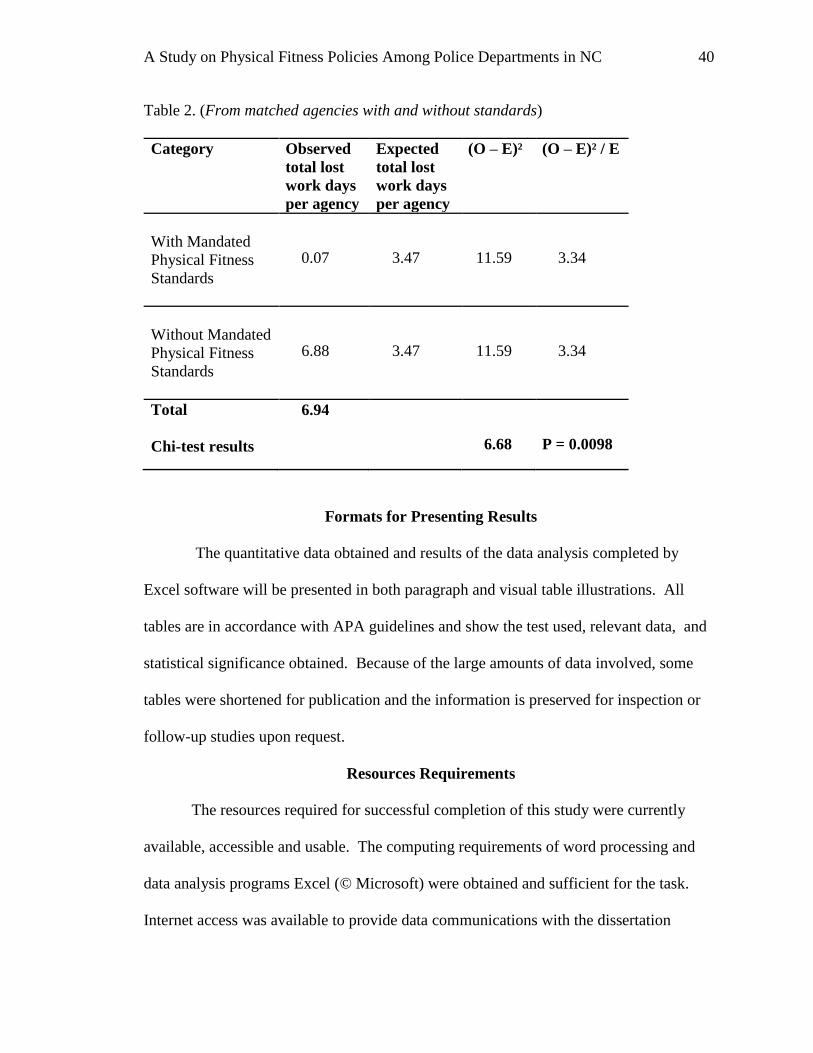
A Study on Physical Fitness Policies Among Police Departments in NC 40
Table 2. (From matched agencies with and without standards)
Category Observed
total lost
work days
per agency
Expected
total lost
work days
per agency
(O – E)² (O – E)² / E
With Mandated
Physical Fitness
Standards
0.07
3.47
11.59
3.34
Without Mandated
Physical Fitness
Standards
6.88
3.47
11.59
3.34
Total
Chi-test results
6.94
6.68
P = 0.0098
Formats for Presenting Results
The quantitative data obtained and results of the data analysis completed by
Excel software will be presented in both paragraph and visual table illustrations. All
tables are in accordance with APA guidelines and show the test used, relevant data, and
statistical significance obtained. Because of the large amounts of data involved, some
tables were shortened for publication and the information is preserved for inspection or
follow-up studies upon request.
Resources Requirements
The resources required for successful completion of this study were currently
available, accessible and usable. The computing requirements of word processing and
data analysis programs Excel (© Microsoft) were obtained and sufficient for the task.
Internet access was available to provide data communications with the dissertation
A Study on Physical Fitness Policies Among Police Departments in NC 41
committee and to obtain information relevant to this study. Other resources used in the
sample selection process included comprehensive police information services provided
by the International Association of Chiefs of Police (IACP) and the National Association
of Chiefs of Police (NACP), both of which this researcher is currently a member.
Membership in these organizations also includes access to peers who provided more
detailed information that assisted in the data collection.
Data from the North Carolina Department of Justice (http://ncdoj.gov) was
available and contained relevant data for output measures related to officers injured,
population, the number of sworn personnel and other police department information that
was used in this study. The North Carolina League of Municipalities provided data on
the sample (n = 253) of police departments and information about injuries related to
workers compensations claims per department. Officials with the NCLM have expressed
an interest in this research project and will benefit from relevant data produced by this
study.
The members of the dissertation committee, research and educational staff of
NOVA Southeastern University, Elizabeth City State University, and Methodist
University were significant assets in providing guidance and recommendations to assist
in this study. Although the discovery of additional data may reveal increased need, there
were no other resources currently anticipated for the successful conclusion of this
dissertation process.

A Study on Physical Fitness Policies Among Police Departments in NC 42
Limitations
Because this study utilized pre-existing data from years 2013 -2015 to search for
trends or associations between police departments both with and without mandated
physical fitness standards, the threats to internal and external validity are low. It should
be recognized the matching of agencies in both groups according to department size,
population and the geographic region was thoroughly documented for follow-up and
examination purposes. While the study is limited to agencies in North Carolina, the
similarities of policing increases the generalizability across state and national boundaries.
Summary
Chapter three describes this dissertation as a repeated cross-sectional quantitative
study utilizing both nonequivalent control groups of pre-existing and self-reported data to
determine statistical associations between a police department’s level of physical fitness
and output measures of injury (Bachman & Schutt, 2012). The study covers a period of
three years, 2013 - 2015 and utilized a purposive sampling method to examine existing
data from a group of municipal police departments in North Carolina (n = 145). The
existing data was collected from the NC League of Municipalities, the NC Department of
Justice, and from individual surveys of police administrators and record keepers. Once
collected, the data was analyzed using Chi-Square nonparametric testing using Excel (©
Microsoft) software and displayed in both paragraph and table forms.

A Study on Physical Fitness Policies Among Police Departments in NC 43
CHAPTER 4: RESULTS
Data Analysis
The data relevant to the independent variable of police departments with or
without fitness standards, and with or without wellness standards, was collected by both
survey and telephone communication. A link to participate in the survey at
(www.surveymonkey.com) was distributed to through e-mail by the North Carolina
Association of Chiefs of Police and the North Carolina League of Municipalities. A
participation letter was included in the study that outlined the purpose, contacts, and risks
involved for participation (Appendix 3).
A total of 67 responses were recorded from the internet survey with 64 listed in
the sample of departments to be used in the study. Telephone and personal
communications were made with administrators of an additional 85 agencies for a total of
149 agencies identified for their level of mandated physical fitness or wellness standards
and the date of implementation. The survey included agencies with reported claims for
the years 2012-2015. Upon eliminating claims from 2012, a total of 4 agencies were
removed due to only having claims in that year leaving the total number at (n = 145). A
form was used to document the information from each department and to inform each
participant of any privacy issues associated with the study (Appendix 4). Table 3
illustrates the breakdown of how the responding agencies reported their level of physical
fitness maintenance.

A Study on Physical Fitness Policies Among Police Departments in NC 44
Table 3
Total of agencies reporting the level of physical fitness maintenance with claims for the
years 2013-2015.
The self-reported data pertaining to all participating police departments (n = 145)
was inserted into an Excel© spreadsheet and contained the following information for
each agency in the following by columns.
A. Name of Agency
B. Physical Fitness Standards (yes or no)
C. Date Implemented
D. Wellness Standards (yes or no)
E. Date Implemented
F. Population Served
G. Total number of officers
H. Number of Male Officers
I. Number of Female Officers
J. Telephone Area Code of agency
The spreadsheet was sent to North Carolina League of Municipalities where the
data was combined with information on reported workers compensation claims for each
agency. The combined spreadsheet was returned to the researcher with the individual
police department names removed and replaced with an alphanumeric code to protect the
With
Fitness
Standards
Without
Fitness
Standards
With
Wellness
Standards
Without
Wellness
Standards
Total
Departments
Reporting
Police Departments 15 130 39 106 145

A Study on Physical Fitness Policies Among Police Departments in NC 45
identity of each agency. Among the 145 police departments, the spreadsheet contained a
total of 2,212 claims for the years 2012-2015. The claims for the year 2012 were
redacted leaving a total of 1,580 reported claims during the years of study (2013-2015).
The following information was included in the combined spreadsheet in the following
columns.
A. Claim Number
B. Loss Description
C. Cause of Loss
D. Nature of Injury
E. Incident Type
F. Department type
G. Incurred Loss
H. Sex
I. Height
J. Weight
K. Incident Date
L. Age
M. Loss Days
N. Agency (alphanumeric coded)
O. Physical Fitness Standards (yes or no)
P. Date Implemented
Q. Wellness Standards (yes or no)
R. Date Implemented

A Study on Physical Fitness Policies Among Police Departments in NC 46
S. Population Served
T. Total number of officers
U. Male Officers
V. Female Officers
W. Area Code of agency
The researcher then added the following columns for computing the totals associated with
each dependent variable per agency or unit of analysis.
Y. Total Claims per Agency
Z. Number of Claims per Officer
AA. Number of Claims per Population
AB. Rate of Claims by Officer and Total Hours Worked*
AC. Average Medical Costs per Agency*
AD. Average Lost Work Days per Officer per agency*
AE. Number of Claims by Male Officers*
AF. Number of Claims by Female Officers*
AG. Average age of Claims
AI. Average BMI per Agency
*Only dependent variables to be used in this study. The remaining dependent
variables are recommended for future studies.
To examine the research questions, the data for each DV was calculated for each
of the 145 police departments and averaged according to the IV of agencies with or
without fitness and wellness standards. The research questions as presented in Chapter I
were; (1) is there an association between a police departments’ fitness policies and

A Study on Physical Fitness Policies Among Police Departments in NC 47
measures of officer injuries? (2) Do police departments with mandated physical fitness
maintenance policies tend to experience fewer officer injuries than police departments
without mandated physical fitness maintenance policies?
Four different analysis were conducted using the data to obtain the most
information to answer the research questions. The various categories are:
1. Departments with mandated fitness policies (including those with
mandated fitness and wellness combined) compared to similar
departments without mandated policies.
2. Departments with mandated fitness policies only compared to similar
departments with no fitness or wellness standards.
3. Departments with mandated fitness standards compared to similar
departments with mandated wellness standards only.
4. Departments with mixed mandated policy (fitness or wellness or both)
compared similar departments with no physical fitness or wellness policy.
For each separate analysis, three individual tests were conducted redacting outlying data
that could influence the overall results. The redacted data consisted of claims in excess of
$100,000.00 and injuries that could be considered to be not directly related to physical
fitness. A breakdown and the results from each category is presented in the following
sections.
Analysis of Police Departments with and without Mandated Fitness Standards
To specifically examine the data from departments both with and without
mandated fitness standards from a 1 to 1 perspective, a purposive sampling method was
used (Bachman & Schutt, 2012). There was a total of 15 agencies that self-reported
A Study on Physical Fitness Policies Among Police Departments in NC 48
mandated physical fitness policies during the years 2012-2015. Because five of the
agencies implemented their fitness standards during or after 2013, they were eliminated
from the sample. The remaining sample of 10 police departments with mandated fitness
policies was purposively matched to 10 agencies without mandated fitness standards. For
this test, police departments with both mandated fitness and mandated wellness were
included in the sample.
The departments matched with agencies that reported not having physical fitness
policies according to similar populations served and geographic region of the state. The
geographic region of the state was determined by the area code of the agencies telephone
number. The entire telephone number was not included in the spreadsheet to avoid
identification of the agency. A map of the North Carolina Area Codes displays how
regions are set across the state, and the list of matched coded agencies displays the
agencies that were purposely selected (Appendix 5 and 6).
The totals and averages in all DV categories were computed using the Excel ©
spreadsheet with both manual calculations and CHITEST functions. The significance
level was set at the .05 level with a critical value of 3.84 and 1 degree of freedom. The
Chi-Square goodness of fit test revealed the average medical costs were significantly
higher in agencies with mandated standards ($279.21) than the matched agencies without
standards ($222.61) (X² (1) = 6.384, p = .011), (C = .112). The remaining DV’s of rate
of claims, lost work days, claims by males and claims by females were all higher among
agencies with mandated standards but not significant. Table 4 illustrates the results of the
tests in each category.

A Study on Physical Fitness Policies Among Police Departments in NC 49
Table 4
Average Totals with Agencies Matched by Population and Area Code (Fitness
Standards). Including agencies with both fitness and wellness combined.
Note: *p < .05. Total agencies with fitness standards (n = 10), without fitness standards (n = 10).
Police departments purposively matched by area code and population. The total claims among
agencies with FS (n = 116), total claims among agencies without FS (n =177).
A further examination of the matched sample of police departments with and
without fitness standards was conducted by redacting claims with medical costs in excess
of $100.000.00. This eliminated seven claims among the sample that could influence the
overall results. The DV of medical costs was very close to a significant finding (p =
.057) and was lower with the IV of departments with mandated standards. Police
departments with mandated standards averaged medical costs at $165.74 while
departments without averaged $202.15 (X² (1) = 3.602, p = .057, C = .098).
The number of lost work days per officer for agencies with standards were also
lower at 1.58 whereas the no FS category was 3.65 but not significant (X² (1) = 0.82, p =
.365, C = .395). The rate of claims, claims by males and claims by females were all
higher from the sample with FS but also not significant. The data is presented in Table 5.
Outcomes
With
Standards
Without
Standards
P
value
Phi φ
C
Rate of Claims
Medical Costs
Lost work days
Claims by Males
Claims by Females
12.53
$279.21
4.52
3.66
5.49
10.33
$222.61
4.01
3.48
4.31
0.645
0.011*
0.861
0.946
0.704
0.096
0.112
0.059
0.025
0.121
0.094
0.112
0.057
0.023
0.117
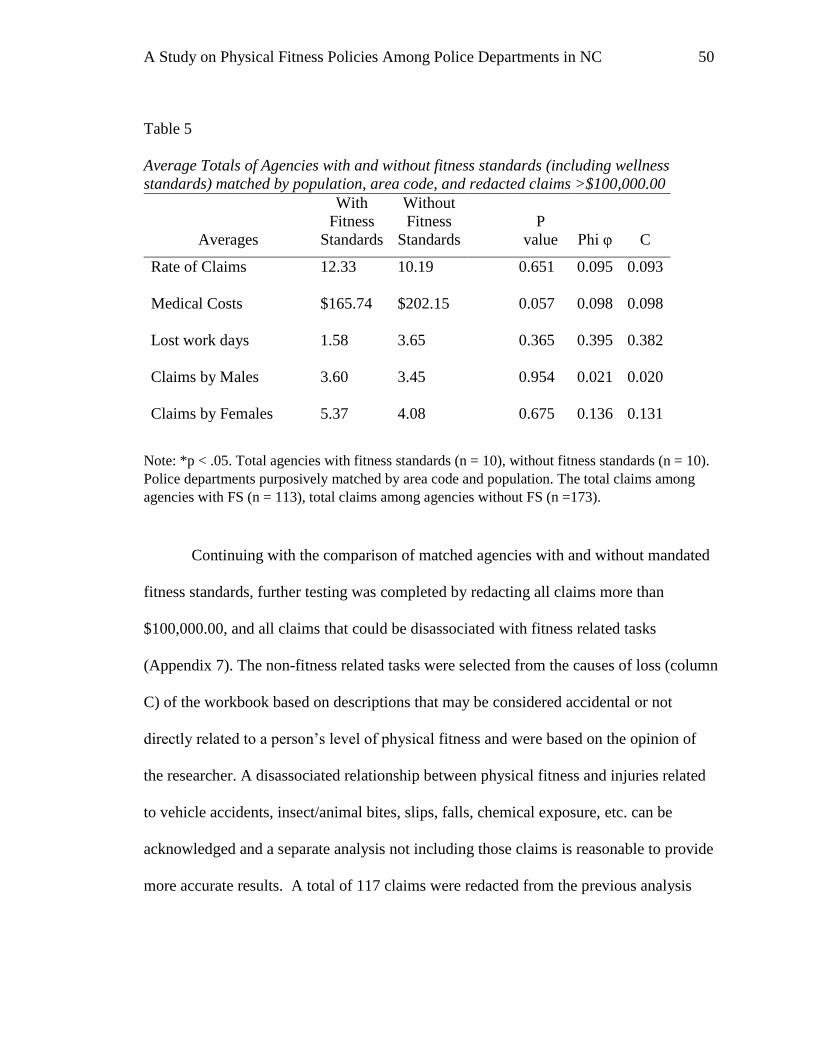
A Study on Physical Fitness Policies Among Police Departments in NC 50
Table 5
Average Totals of Agencies with and without fitness standards (including wellness
standards) matched by population, area code, and redacted claims >$100,000.00
Note: *p < .05. Total agencies with fitness standards (n = 10), without fitness standards (n = 10).
Police departments purposively matched by area code and population. The total claims among
agencies with FS (n = 113), total claims among agencies without FS (n =173).
Continuing with the comparison of matched agencies with and without mandated
fitness standards, further testing was completed by redacting all claims more than
$100,000.00, and all claims that could be disassociated with fitness related tasks
(Appendix 7). The non-fitness related tasks were selected from the causes of loss (column
C) of the workbook based on descriptions that may be considered accidental or not
directly related to a person’s level of physical fitness and were based on the opinion of
the researcher. A disassociated relationship between physical fitness and injuries related
to vehicle accidents, insect/animal bites, slips, falls, chemical exposure, etc. can be
acknowledged and a separate analysis not including those claims is reasonable to provide
more accurate results. A total of 117 claims were redacted from the previous analysis
Averages
With
Fitness
Standards
Without
Fitness
Standards
P
value
Phi φ
C
Rate of Claims
Medical Costs
Lost work days
Claims by Males
Claims by Females
12.33
$165.74
1.58
3.60
5.37
10.19
$202.15
3.65
3.45
4.08
0.651
0.057
0.365
0.954
0.675
0.095
0.098
0.395
0.021
0.136
0.093
0.098
0.382
0.020
0.131

A Study on Physical Fitness Policies Among Police Departments in NC 51
with 61 reported claims from agencies with fitness standards and 108 reported from
agencies without fitness standards.
The averaged medical costs remained significantly lower for agencies with FS in
this analysis (X² (1) = 126.4, p = .001, C = .541). Both Phi φ and Contingency coefficient
tests resulted in small effect levels of .000. The total costs for agencies with fitness
standards was $99.14 as compared to agencies without standards were $332.91. There
were no other significant associations identified in this sample although several are worth
a mention. The DV’s of rate of claims, lost work days, claims by males, and claims by
females were all lower (not significant) in agencies with FS. The findings from all
analysis are supportive of accepting 𝐻1 in this study. Table 6 displays these results.
Table 6
Average Totals of agencies with mandated fitness standards (including wellness) matched
by population, area code, redacted claims >$100,000.00, redacted all other non-fitness
related.
Note: *p < .05, total agencies with fitness standards (n = 10), without fitness standards (n =10).
Police departments purposively matched by area code and population. The total claims among
agencies with FS (n = 61), total claims among agencies without FS (n =108).
Outcomes
With
Fitness
Standards
Without
Fitness
Standards
P
value
Phi φ
C
Rate of Claims
Medical Costs
Lost work days
Claims by Males
Claims by Females
5.78
$99.14
2.48
1.76
2.48
6.23
$332.91
6.72
2.01
3.31
0.895
0.001*
0.161
0.898
0.732
0.037
0.541
0.461
0.065
0.143
0.036
0.541
0.457
0.059
0.135

A Study on Physical Fitness Policies Among Police Departments in NC 52
Analysis of Police Departments with Mandated Fitness Standards only matched
with Departments with No Standards
The survey results produced a small number of police departments (n = 5) that
mandated fitness standards only during the years 2013-2015 used in the study. Further
examination was necessary to determine if a relationship existed between these agencies
and similar agencies without any fitness standards. A purposeful matching strategy was
again employed to pair these agencies with comparable agencies according to population
and geographic location (Bachman & Schutt, 2012). This provided a total of (n = 10)
agencies for comparison. See Appendix 7 for a list of the matched agencies and table 7
displays the results of this analysis.
The data was again analyzed using the Chi-Square goodness of fit test in Excel ©
spreadsheet with both manual and CHITEST functions. Although no significant
associations were found, the DV’s of medical costs, lost work days, and claims by males
were lower among agencies with fitness standards and rate of claims and claims by
females were higher in the same category.

A Study on Physical Fitness Policies Among Police Departments in NC 53
Table 7
Totals of agencies with mandated fitness standards only matched to agencies without any
standards by population and area code.
Note: *p < .05, total agencies with fitness standards (n = 5), without fitness standards (n = 5).
Police departments purposively matched by area code and population. The total claims among
agencies with FS (n = 47), total claims among agencies without FS (n =49).
To remove the threat of limited high costing claims impacting the data, the same
procedures were again used (as in Table 5) to redact claims in excess of $100.000.00.
The identical matched samples of agencies with and without mandated fitness standards
were used in this analysis. There were 2 claims found to be above the $100.000.00
threshold and were removed from the data.
In this examination, the average medical costs were significantly lower in police
departments with mandated fitness standards. The average medical costs in departments
with FS were $222.10 and without FS were $385.97, (X² (1) = 44.16, p = .001). The
effect size according to both Phi φ and Contingency Coefficient tests were close to
medium at (C =.269). The DV of lost work days were lower among the sample of
agencies with FS (0.07) than agencies without FS (3.79) but just below the level of
significance. (X² (1) = 3.58, p = .058). The rate of claims and claims by females were
Outcomes
With
Fitness
Standards
Without
Fitness
Standards
P
value
Phi φ
C
Rate of Claims
Medical Costs
Lost work days
Claims by Males
Claims by Females
10.08
$359.68
2.07
1.47
1.98
8.71
$385.97
3.79
1.62
0.00
0.752
0.335
0.478
0.933
0.159
0.072
0.035
0.292
0.047
1.000
0.071
0.035
0.281
0.041
0.961

A Study on Physical Fitness Policies Among Police Departments in NC 54
higher among the agencies with FS, while the claims among males were lower. These
findings were not significant. Table 8 displays the results.
Table 8
Totals of agencies with mandated fitness standards only matched to agencies without
standards by population and area code, redacted claims > $100,000.00.
Note: *p < .05, total agencies with fitness standards (n = 5), without fitness standards (n =5).
Police departments purposively matched by area code and population. The total claims among
agencies with FS (n = 45), total claims among agencies without FS (n =49).
The third test in this category utilized the same agencies for comparison and again
redacted all claims that could be considered non-fitness related causes of loss (Appendix
10). A total of 35 claims were removed from this sample for analysis. Police
Departments with mandated FS had significantly lower medical costs and lost work days
among the matched samples. The medical costs for agencies with mandated standards
were $42.18 and the costs for agencies without standards $647.68 (X² (1) = 531.45, p =
.001, C = .877). In the lost work day’s category, agencies with fitness standards averaged
.07 and agencies without averaged 6.88 during the years of the study (2013-2015). The
Chi-Square goodness of fit significance level for this category produced a probability
value .009, (X² (1) = 6.68, p = .009, C = .980).
Outcomes
With
Fitness
Standards
Without
Fitness
Standards
P
value
Phi φ
C
Rate of Claims
Medical Costs
Lost work days
Claims by Males
Claims by Females
9.82
$222.10
0.07
1.44
1.85
8.71
$385.97
3.79
1.62
0.00
0.798
0.001*
0.058
0.918
0.173
0.059
0.269
0.963
0.058
1.000
0.058
0.269
0.956
0.051
0.956

A Study on Physical Fitness Policies Among Police Departments in NC 55
The rate of claims and claims by males were also lower in the DV with FS
category but not significant. The claims by females were higher in the agencies with FS
but were due to being non-existent in the without FS group. The results of this analysis
are again supportive of accepting 𝐻1 and are displayed in Table 9.
Table 9
Totals of agencies with mandated fitness standards only matched to agencies without any
standards by population and area code, redacted claims > $100,000.00, redacted all
non-fitness related.
Note: *p < .05, total agencies with fitness standards (n = 5), without fitness standards (n = 5).
Police departments purposively matched by area code and population. The total claims among
agencies with FS (n = 22), total claims among agencies without FS (n =37).
Analysis of Police Departments with Mandated Fitness Standards vs. Police
Departments with Mandated Wellness Standards.
The third category for answering the research questions and testing the hypothesis
of this study is to compare agencies with mandated fitness standards only to agencies
with mandated wellness standards only. A purposive sampling method was again used
by the researcher to match agencies with mandated FS to agencies with mandated WS
only. Population and area code were used to produce the matched samples (Appendix
Outcomes
With
Fitness
Standards
Without
Fitness
Standards
P
value
Phi φ
C
Rate of Claims
Medical Costs
Lost work days
Claims by Males
Claims by Females
3.11
$42.18
0.07
0.44
0.96
5.81
$647.68
6.88
1.06
0.00
0.366
0.001*
0.009*
0.608
0.327
0.302
0.877
0.980
0.417
1.000
0.296
0.877
0.976
0.352
0.863

A Study on Physical Fitness Policies Among Police Departments in NC 56
8). A total of 5 agencies were identified as having mandated FS implemented prior to the
years of 2013-2015 and were then matched to 5 agencies with mandated WS prior to that
same period.
The first analysis (Table 10) revealed significantly higher medical costs in police
departments with mandated fitness standards (X² (1) = 162.26, p = .001, C = .600). The
average claims for the sample with FS were $359.68 while the average for agencies with
WS were $89.65. The rate of claims and claims by males were lower in the agencies with
FS but not significant. The DV’s of lost work days and claims by females were higher in
the FS group but also not significant.
Table 10
Totals of agencies with mandated fitness standards only matched to agencies with
mandated wellness standards only by population and area code.
Note: *p < .05, total agencies with fitness standards (n = 5), with wellness standards (n = 5).
Police departments purposively matched by area code and population. The total claims among
agencies with FS (n = 47), total claims among agencies with WS (n =53).
The same data sample was again examined by redacting all claims exceeding
$100,000.00. This resulted in eliminating 2 claims from the FS category while still
producing similar results. Also supportive of 𝐻1, but in the opposite direction, the
Outcomes
With
Fitness
Standards
With
Wellness
Standards
P
value
Phi φ
C
Rate of Claims
Medical Costs
Lost work days
Claims by Males
Claims by Females
8.40
$359.68
2.07
1.47
1.98
9.86
$89.65
0.36
1.60
0.67
0.733
0.001*
0.270
0.940
0.420
0.079
0.600
0.706
0.042
0.495
0.078
0.600
0.670
0.037
0.460

A Study on Physical Fitness Policies Among Police Departments in NC 57
medical costs remained significantly higher among agencies with mandated FS ($222.10)
than mandated WS ($89.65) (X² (1) = 56.26, p = .000, C = .424). Also not significant, the
rate of claims, lost work days, and claims by males were lower in the FS group and the
claims by females were higher. Table 11 displays the results.
Table 11
Totals of agencies with mandated fitness standards only matched to agencies with
mandated wellness standards only by population and area code, redacted claims
>$100,000.00.
Note: *p < .05, total agencies with fitness standards (n = 5), with wellness standards (n = 5).
Police departments purposively matched by area code and population. The total claims among
agencies with FS (n = 45), total claims among agencies with WS (n = 53).
Following the pattern of prior testing, a data set was prepared for the same
matched agencies by redacting all non-fitness related claims (Appendix 10). A total of 43
claims were removed from the dataset among the sample agencies. This analysis also
produced significant differences in medical costs between agencies with FS and agencies
with WS but in the opposite direction from the previous data. The averaged medical
costs for departments with mandated FS declined to $42.18, and the departments with
mandated WS were $92.49. (X² (1) = 18.79, p = .001, C = .373).
Outcomes
With
Fitness
Standards
With
Wellness
Standards
P
value
Phi φ
C
Rate of Claims
Medical Costs
Lost work days
Claims by Males
Claims by Females
8.18
$222.10
0.07
1.44
1.85
9.86
$89.65
0.36
1.60
0.67
0.693
0.001*
0.661
0.926
0.455
0.092
0.424
0.669
0.053
0.470
0.091
0.424
0.419
0.046
0.432

A Study on Physical Fitness Policies Among Police Departments in NC 58
The rate of claims, lost work days, and claims by males were all lower in the FS
group, and the claims by females were lower in the WS group. However, none of these
findings were significant. The results are displayed in Table 12.
Table 12
Totals of agencies with mandated fitness standards only matched to agencies with
mandated wellness standards only by population and area code, redacted claims
>$100,000.00, redacted all non-fitness related.
Note: *p < .05, total agencies with fitness standards (n = 5), with wellness standards (n = 5).
Police departments purposively matched by area code and population. The total claims among
agencies with FS (n = 22), total claims among agencies with WS (n =33).
Analysis of Police Departments with Mixed Fitness Policies compared to
Departments with No Fitness Policies.
A final purposively matched sample was completed to assist in answering the
research questions in this study. This independent variable sample consisted of police
departments with either mandated fitness standards, mandated wellness standards or both.
A total of 31 agencies were identified in this category and matched with 33 agencies
without any FS or WS by population and area code. One agency with mandated standards
Outcomes
With
Fitness
Standards
With
Wellness
Standards
P
value
Phi φ
C
Rate of Claims
Medical Costs
Lost work days
Claims by Males
Claims by Females
2.60
$42.18
0.07
0.44
0.96
5.45
$92.49
0.42
0.87
0.50
0.314
0.001*
0.615
0.703
0.703
0.354
0.373
0.722
0.332
0.314
0.348
0.373
0.479
0.267
0.258

A Study on Physical Fitness Policies Among Police Departments in NC 59
was matched with three smaller agencies due to being the best possible match within that
area code (Appendix 9).
The rate of claims, medical costs, and claims by females were higher among the
agencies with mixed standards but not significant. Lost work days and claims by males
were lower in the standards group but also not significant. The results of this analysis
supports 𝐻0 for this study and are shown in Table 13.
Table 13
Totals of agencies with mixed fitness and wellness policies matched to agencies without
any fitness or wellness policy.
Note: *p < .05, total agencies with fitness standards or wellness standards (n = 31), without any
standards (n = 33). Police departments purposively matched by area code and population. The
total claims among agencies with standards (n = 329), total claims among agencies without
standards (n =337).
The same data set was analyzed after redacting claims in excess of $100,000.00,
and a total of 10 claims were eliminated from the sample. The Chi-Square goodness of
fit test did not produce any significant results. The total medical costs, lost work days and
claims by males were lower but not significant among the group with standards while rate
Outcomes
With
Standards
Without
Standards
P
value
Phi φ
C
Rate of Claims
Medical Costs
Lost work days
Claims by Males
Claims by Females
13
$244.84
11.55
10.24
12.11
10
$230.76
14.32
11.67
11.07
0.508
0.518
0.585
0.760
0.828
0.139
0.029
0.107
0.065
0.044
0.138
0.029
0.105
0.064
0.044

A Study on Physical Fitness Policies Among Police Departments in NC 60
of claims and claims by females remained higher (not significant). The results are shown
in Table 14.
Table 14
Totals of agencies with mixed fitness and wellness polices matched to agencies without
any fitness or wellness policy, redacted claims > $100,000.00.
Note: *p < .05, total agencies with fitness standards or wellness standards (n = 31), without any
standards (n = 33). Police departments purposively matched by area code and population. The
total claims among agencies with standards (n = 326), total claims among agencies without
standards (n =330).
The final analysis in this group utilized the same matched sample with redacted
claims more than $100,000.00 and also redacted the same all non-fitness related claims as
in the prior analysis (Appendix 10). This test again produced no significant differences
in the agencies and supports 𝐻0 in this study. Table 15 displays the results from this test.
Outcomes
With
Standards
Without
Standards
P
value
Phi φ
C
Rate of Claims
Medical Costs
Lost work days
Claims by Males
Claims by Females
13
$173.58
7.13
10.14
12.11
10
$190.68
10.67
11.58
10.72
0.507
0.370
0.401
0.757
0.771
0.140
0.046
0.198
0.066
0.060
0.138
0.046
0.196
0.065
0.059
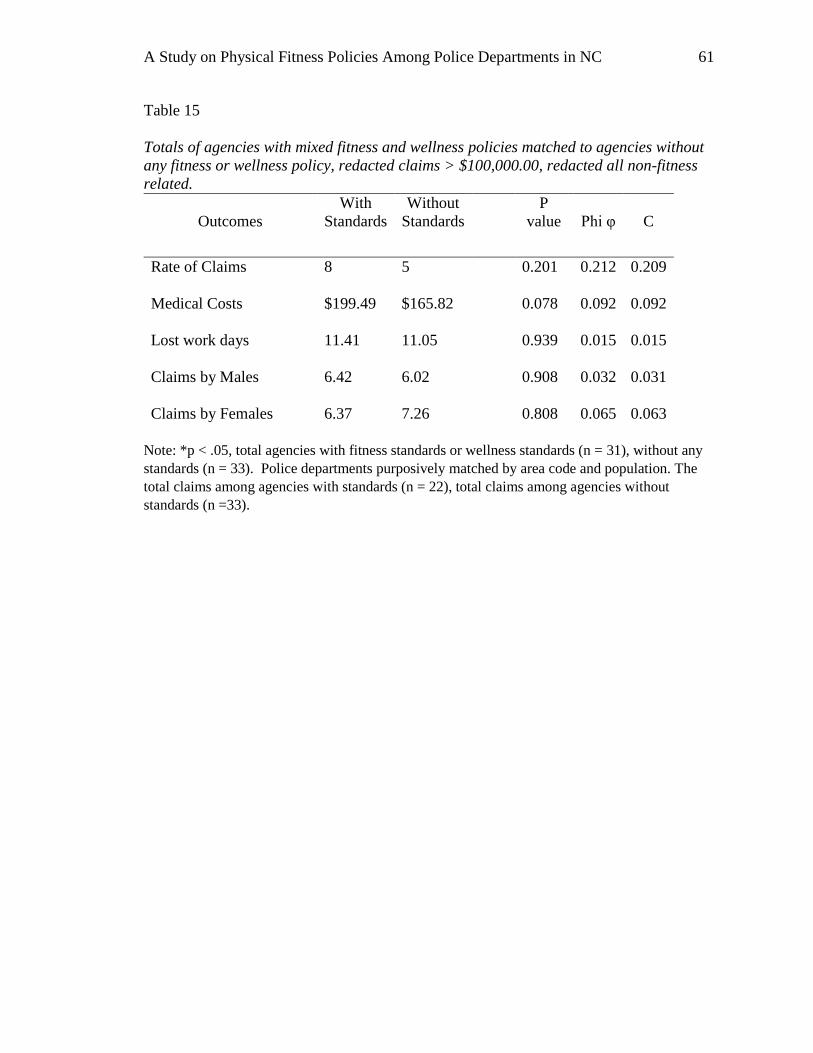
A Study on Physical Fitness Policies Among Police Departments in NC 61
Table 15
Totals of agencies with mixed fitness and wellness policies matched to agencies without
any fitness or wellness policy, redacted claims > $100,000.00, redacted all non-fitness
related.
Note: *p < .05, total agencies with fitness standards or wellness standards (n = 31), without any
standards (n = 33). Police departments purposively matched by area code and population. The
total claims among agencies with standards (n = 22), total claims among agencies without
standards (n =33).
Outcomes
With
Standards
Without
Standards
P
value
Phi φ
C
Rate of Claims
Medical Costs
Lost work days
Claims by Males
Claims by Females
8
$199.49
11.41
6.42
6.37
5
$165.82
11.05
6.02
7.26
0.201
0.078
0.939
0.908
0.808
0.212
0.092
0.015
0.032
0.065
0.209
0.092
0.015
0.031
0.063
A Study on Physical Fitness Policies Among Police Departments in NC 62
CHAPTER 5: CONCLUSIONS, IMPLICATIONS,
RECOMENATIONS and SUMMARY
Conclusions
The results of the data analysis are supportive of accepting 𝐻1with
significant associations found between police departments’ physical fitness maintenance
policies and measures of officer injury in two out of four examinations. Based on the
sample of police departments in North Carolina (n = 145), the outcomes indicate policies
of mandated fitness standards are significantly associated with reduced medical costs and
reduced lost work days when compared to agencies with no standards. The analysis of
agencies with mandated fitness standards (including wellness standards) (n = 10) and the
analysis of agencies with fitness standards only (n = 5), both revealed significant
associations (p < .05) of lower medical costs and reduced lost days for the IV of
mandated standards in the redacted comparisons. The hypothesis for this study were:
𝐻0: There is no significant association between police departments’ physical
fitness maintenance policies and measures of officer injury.
𝐻1: There is a significant association between police departments’ physical
fitness maintenance policies and measures of officer injury.
The first analysis of matched police departments with and without mandated
fitness standards initially revealed higher medical costs among the agencies with
mandated standards (Table 4). The sample size for each group was (n = 10), and the total
number of claims were (n = 293) among both groups. After redacting seven claims in
excess of $100.000.00, the average medical costs was lower in the agencies with fitness
standards and near the significant level (p =.057) (Table 5). The third analysis in this

A Study on Physical Fitness Policies Among Police Departments in NC 63
sample eliminated 117 non-fitness related claims and revealed significantly lower
medical costs for agencies with fitness standards (p = .001) (Table 6). Using Cohen’s
effect size standards, the effect size for the final comparisons was in the large range at (C
= .541).
The second comparison group consisted of police departments with mandated
fitness policies only compared to matched agencies with no standards. The sample size
was again small with only five agencies who self-reported having mandated fitness
standards only before 2013. This test did not include agencies with both mandated
fitness and wellness standards. The first overall comparison of agencies produced no
significant results among the DVs. After redacting two claims in excess of $100,000.00,
the second analysis indicated significantly lower medical costs among the agencies with
mandated fitness standards (p = .001, C = .269) (Table 8). The third analysis redacted 35
non-fitness related claims and revealed significant associations in both medical costs and
lost work days (p = .001, C = .877 and p = .009, C = .980) (Table 9).
The third comparison group compared departments with mandated fitness
standards only to departments with mandated wellness standards only. The sample size
was small with this group as only five police agencies with mandated fitness standards
could be matched and compared to 5 agencies with mandated wellness standards. The
first and second analysis revealed significantly higher medical costs among the police
departments with mandated fitness standards (p = .001) (Table 10 and 11). The third
analysis redacted both claims in excess of $100,000.00 and 43 non-fitness related claims
and revealed significantly lower medical costs among the departments with fitness
standards (p = .001, C = .373).

A Study on Physical Fitness Policies Among Police Departments in NC 64
The fourth comparison group examined a sample of departments with mixed
fitness maintenance policies (fitness or wellness or both) purposely matched to agencies
with no fitness or wellness policy. Although the sample size was larger with 31 agencies
with standards, there were no significant findings in the analysis. The data in this
comparison group is supportive of the null hypothesis in the study.
Implications
This study provides significant data in three out of four analysis that agencies
with mandated fitness standards had lower medical costs than agencies with no standards.
This included lower medical costs than agencies with mandated wellness standards when
non-fitness related injuries were redacted from the data. Significant associations in lost
work days were also found among the sample of agencies with mandated fitness
standards when compared to agencies with no standards. The results are supportive of 𝐻1
in both directions showing significant associations in measures of injuries between
agencies with mandated FS and WS when compared to agencies with no standards.
The data is inverse in several comparisons until claims in excess of $100,000.00
and non-fitness related injuries are redacted from the data. The effect size in all
significant categories was medium to large indicating a strong magnitude of the
association (Salkind, 2011). The breakdowns of the data by purposive matching of
agencies and the redacting of outlying excessive medical claims as well as possible non-
fitness related claims provided the significant data to support the conclusions of this
study.
Based on the results, the statistical associations found in this study are more
related to departments with mandated fitness standards. Three of the four tests that

A Study on Physical Fitness Policies Among Police Departments in NC 65
provided significant associations in lower medical costs involved departments with
mandated fitness standards. Although these tests produced significant results, the small
number of agencies in the sample reduce the generalizability and validity of the results.
The results showing associations with mandated physical fitness standards and
reduced injury costs are consistent with prior studies that link poor physical fitness to
increased risks of injury. Studies conducted by Meigh, et al. (2012), Orr, et al. (2013),
Knapik et al. (2011), and Poplin, et al. (2014) all revealed significant associations
between lower fitness levels and increased risk of injury. Mandatory wellness standards
have become increasingly popular among agencies as a way of reducing health care costs
(Harte et al., 2011; Finkelstein, et. al., 2010; Leoppke et al., 2007), but the data from this
study reveals that wellness standards alone may not be as effective as mandated physical
fitness programs.
Possible explanations for the significant increases in medical costs among
agencies with mandated fitness standards in tables 10 and 11 could be due to several
reasons. The small number of claims (n =47 and n = 53) over the three-year period did
not provide a large enough sample size. The outliers that were related to non-fitness
related injuries were more severe injuries. This is reinforced with the data from Table 12
that reveals significantly lower medical costs after 43 claims were removed from the data.
The final analysis supports 𝐻0 , and that no statistical difference was found among
the agencies with mixed mandatory fitness and wellness policies when compared to
agencies without fitness standards. The sample size was larger for this analysis and the
results more generalizable.

A Study on Physical Fitness Policies Among Police Departments in NC 66
Recommendations
As found in the review of the literature, this is the first known study to utilize
individual police departments and their policy of physical fitness maintenance as an
independent variable for comparison. This research creates opportunities for future
studies that examine police departments across wider areas including other states and
countries. Future replicated studies will assist in determining the overall relevance of this
data and can also improve the generalization across other regions and populations.
This study provided significant data to support 𝐻1 which was designed as a non-
directional hypothesis, but the data in the final analysis also supports 𝐻0. There were no
statistical differences among the sample of agencies with mixed fitness and wellness
standards when compared to agencies with no standards. This data conflicts with prior
studies that revealed lower rates of injury, sickness, and absenteeism among police
officers who participated in programs that focused on improving fitness (Wattles &
Harris, 1997; Steinhardt et al., 1991; Gerber, et. al., (2010).
The significant findings of this study related to medical costs and lost work days
centered on the agencies with mandated fitness standards. The total number of agencies
with mandated fitness standards were lower (n = 10) than the number of agencies with
mandated wellness standards (n = 26), and this could have affected the outcome when
comparing the total number of mixed agencies (n = 31). Future studies should delve
deeper into this data for more comparisons.
Additional analysis using this same data set should be undertaken to look for
other significant associations with alternate testing procedures. The statistical software
available from SPSS © IBM should be utilized to examine other possible independent
A Study on Physical Fitness Policies Among Police Departments in NC 67
samples testing. The Mann-Whitney U Test or configuring the data for independent
samples t- test (Salkind, 2011) may result in additional identified areas of statistical
significance.
The additional DV’s identified but not used in this study could be expanded into
further research. The average total claims per agency should be examined and used with
an accepted formula for comparing among different sized agencies. The average BMI
can be calculated from height and weight information provided in the data and compared
among the agency unit of analysis. Other information provided by the NCLM could be
broken down and compared in more detail to include, loss description, the cause of loss,
incident type, and incident date. Time and day of the week of the incidents may also be
obtained from the league and compared to determine any associations among the injuries.
Another side note found while conducting this study were the number of chiefs of
police who recognized the importance of physical fitness standards but failed to mandate
implementation. During the telephone and personal interviews to determine the level of
physical fitness maintenance among agencies, many chiefs stated they did not currently
have standards but were planning on implementing mandatory fitness standards in the
future. The thoughts of police executives could be the subject of an in-depth future
qualitative study on why departments do not mandate physical fitness policies.
Summary
The importance of good physical fitness and the job of a police officer has been
recognized for years, but administrators consistently fail to mandate fitness standards for
incumbent officers (Ness & Light, 1992; http://www.calea.org, 2015; Sheets, 2012;
Bissett, Bissett & Snell, 2012). Research has been shown that supports how improved

A Study on Physical Fitness Policies Among Police Departments in NC 68
physical fitness can reduce injury, absenteeism, and sickness in police, military, and
civilian studies (McGill et al., 2015; Poplin et al., 2014; Orr et al., 2013; Lisman et al.,
2013). There were no other studies found that compared rates of injury as determined by
workers compensation claims that used individual police departments fitness
maintenance policies as the independent variable.
The goals of this study were to determine; (1) if there was an association between
a police departments ‘fitness policies and measures of reported officer injuries, and (2) do
police departments with mandated physical fitness maintenance policies tend to
experience fewer officer injuries than police departments without mandated physical
fitness policies. An extensive examination of a sample of police departments (n = 145)
with a total of (n = 1,580) workers compensation claims related to injury produced
significant results to reject the null 𝐻0 and support the hypothesis 𝐻1 in 3 out of 4 tests
conducted. The comparison of departments with mixed fitness policies did not produce
significant results and failed to reject 𝐻0.
Police departments that mandated physical fitness policies, including those with
wellness policies, were shown to have significantly lower medical costs than departments
that did not mandate standards (p < .05) when claims in excess of 100,000.00 and non-
fitness related injuries were redacted from the data. After redacting outlying claims
greater than $100,000.00 and non-fitness related claims, police departments with
mandated fitness standards only displayed statistically lower medical costs and lost work
days when compared to departments without standards (p < .05).

A Study on Physical Fitness Policies Among Police Departments in NC 69
This information is valuable for police administrators who are seeking
information and evidence-based solutions to reduce reportable injuries among police
officers. Additional and repeated studies are recommended to increase the
generalizability and effect size of the results produced.

A Study on Physical Fitness Policies Among Police Departments in NC 70
References
Adams, R.J, McTernan, T.M, and Remsberg, C. (1980) Street Survival, Tactics for
Armed Encounters. Northbrook. Il: Calibre Press, Inc.
Bachman, R. & Schutt, R. K. (2012). Fundamentals of Research in Criminology and
Criminal Justice. Los Angeles. CA: SAGE Publications.
Bureau of Justice Statistics, United States Department of labor, (2016) located at
http://www.bls.gov/iif/osheval.htm;
Bissett, D., Bissett, J., &Snell, C. (2012). Physical agility tests and fitness standards:
perceptions of law enforcement officers. Police Practice and Research. Vol. 13,
No. 3. 208-223
Blair, S., Smith, M., Collingwood, T., Reynolds, R., Prentice, M. & Sterling, C. (1986).
Health promotion for educators: impact on absenteeism. Prev Med, 15, 166-175.
Boni, N. (2004). Exercise and physical fitness: The impact on work outcomes, cognition,
and psychological well-being for police. Australasian Centre for Policing
Research, No. 10-2014
Bonneau, J. & Brown. J. (1995). Physical ability, fitness and police work: a Canadian
Perspective. Journal of clinical forensic medicine. 2, 157-164
Boyce, R. W. & Hiatt, Ann R. (1992). Physical fitness of police officers as they progress
from supervised recruit to unsupervised sworn officer fitness programs. Wellness
Perspectives, Summer 92. Vol. 8. Issue 4.
Boyce, R. W., Jones, G. R., & Hiatt, A. R. (1991). Physical fitness capacity and
absenteeism of police officers. Journal of Occupational and Environmental
Medicine, 33(11), 1137-1143.
Chenoweth, D. H., Rager, R. C., & Haynes, R. G. (2015). Relationship Between Body
Mass Index and Workers' Compensation Claims and Costs: Results from the
North Carolina League of Municipalities Database. Journal of occupational and
environmental medicine/American College of Occupational and Environmental
Medicine, 57(9), 931-937.
Collingwood, T., Hoffman, R., & Smith, J., (2004). Underlying Physical Fitness Factors
for Performing Police Officer Physical Tasks. The Police Chief. Retrieved from
http:www.iacpnet.com/iacpnet/ members/ publications/
periodicals/article_print.asp.

A Study on Physical Fitness Policies Among Police Departments in NC 71
Davis, R.C. (2012) Selected International Best Practices in Police Performance
Measurement. Rand Center on Quality Policing, 2012.
De Loes, M. & Jansson, B.(2002). Work-related acute injuries from mandatory fitness
training in the Swedish Police Force. Int J Sports Med, 23, 212-217.
Dillern, T., Jenssen, O.R., Lagestad, P., Nygard, O., & Ingebrigtsen, J. (2014). Arresting
a Struggling Subject; Does the Forthcoming Police Officers Physical Fitness have
an Impact on the Outcome? The Open Sports Sciences Journal, 2014.Suppl-1,
M2.
Easterling, Cherie v. State of Connecticut, Department of Correction., United States
District Court, D, Connecticut N. 3:08-CV-0826 (JHC).
Equal Employment Opportunity Commission (2012). Uniform Guidelines on Employee
Selection Procedures, www.uniformguidelines.com September, 2012.
Finkelstein, E. A., DiBonaventura, M. D., Burness, S. M. & Hale, B. C. (2010). The
Costs of Obesity in the Workplace. Journal of Occupational and Environmental
Medicine. Vol. 52. No. 10.
Gerber, M. & Puhse, U. (2009). Do exercise and fitness protect against stress-induced
health complaints? A review of the literature. Scandinavian Journal of Public
Health. 37: 801-819.
Gerber, M., Kellmann, M., Elliot, C., Hartmann, T., Brand, S., Holsboer-Trachsler, E., &
Puhse. U. (2013). Perceived Fitness Protects against Stress-based Mental Health
Impairments among Police Officers Who Report Good Sleep. Journal of
Occupational Health, 55: 376-384.
Gerber, M., Kellmann, M., Hartmann, T., & Puhse. U. (2010). Do Exercise and Fitness
Buffer Against Stress Among Swiss Police and Emergency Response Service
Officers? Psychology of Sport and Exercise journal 11, 286-294.
Guffey, J. E., Larson, J. G., & Lasley, J. (2015). Police officer fitness, diet, lifestyle and
its relationship to duty performance and injury. Journal of Legal Issues and Cases
in Business, 3, 1.
Gulino v. New York State Education Department. No. 039062CV, 2006. U.S. Court of
Appeals. 2 Cir. Decided August 17, 2006.
Harte, K., Mahieu, K., Mallett, D., Norville, J., & VanderWerf, S. (2011). Improving
Workplace Productivity, it isn’t just about reducing absence. Benefits Quarterly,
Third Quarter, 2011.

A Study on Physical Fitness Policies Among Police Departments in NC 72
Hartley, T. A., Shankar, A., Fekedulegn, D., Violanti, J. M., Andrew. M. E., Knox, S. S.
& Burchfiel, C. M. (2011). Metabolic Syndrome and Cartid Intima Media
Thickness in Urban Police Officers. American College of Occupational and
Environmental Medicine. Vol. 53, No. 5.
Heneweer, H., Picavet, H. S. J., Staes, F., Kiers, H., & Vanhees, L. (2012). Physical
fitness, rather than self-reported physical activities, is more strongly associated
with low back pain: evidence from a working population. European Spine
Journal, 21(7), 1265-1272.
Houser AN, Jackson BA, Bartis JT, et al. Emergency responder injuries and fatalities: an
analysis of surveillance data. RAND corporation technical report, March 2004.
Available at: http://www.rand.org.
Huck, S. W. (2008). Reading Statistics and Research. Fifth Edition. Boston, MA:
Pearson Education Inc.
International Association of Chiefs of Police (2014). Reducing Officer Injuries Final
Report. From the IACP and The Bureau of Justice Assistance.
Jacobs, E. Newton, C. Wang, Y. Patel, A. McCullough, M., Campbell, P., Thun, M., &
Gapstur, S. (2010). Waist Circumference and All-Cause Mortality in a Large US
Cohort. Arch intern Med. 170, 15, 1293-1301
Jacobson, B.H., & Aldana, S.G. (2001). Relationship between frequency of Aerobic
Activity and Illness-Related Absenteeism in a Large Employee Sample. J. Occup.
Envrion Med. 43: 1019-1025
Jones, B. H., Bovee, M. W., Harris, J. M., & Cowan, D. N. (1993). Intrinsic risk factors
for exercise-related injuries among male and female army trainees. The American
Journal of Sports Medicine, 21(5), 705-710.
Jones, B. H., Cowan, D. N., Tomlinson, J. P., Robinson, J. R., Polly, D. W., & Frykman,
P. N. (1993). Epidemiology of injuries associated with physical training among
young men in the army (No. USARIEM-M78-91). ARMY RESEARCH INST OF
ENVIRONMENTAL MEDICINE NATICK MA.
Kales, S. N., Tsismenakis, A. J., Zhang, C. & Soteriades, E. S. (2009). Blood Pressure in
Firefighters, Police Officers, and Other Emergency Responders. American
Journal of Hypertension. Vol, 22, No. 1, 11-20.
Kerr, J. & Vos, M. (1993). Employee fitness programmes, absenteeism and general well-
being. Work Stress, 7, 179-190.

A Study on Physical Fitness Policies Among Police Departments in NC 73
Knapik, J. J., Darakjy, S., & Hauret, K. G. (2006). Increasing the physical fitness of low-
fit recruits before basic combat training: an evaluation of fitness, injuries, and
training outcomes. Military medicine, 171(1), 45.
Knapik, J. J., Sharp, M. A., Canham-Chervak, M., Hauret, K., Patton, J. F., & Jones, B.
H. (2001). Risk factors for training-related injuries among men and women in
basic combat training. Medicine and science in sports and exercise, 33(6), 946-
954.
Knapik, J. J., Spiess, A., Swedler, D., Grier, T., Hauret, K., Yoder, J., & Jones, B. H.
(2011). Retrospective examination of injuries and physical fitness during Federal
Bureau of Investigation new agent training. J Occup Med Toxicol, 6, 26.
Kobasa, S. C. O., Maddi, S. R., Puccetti, M. C., & Zola, M. A. (1985). Effectiveness of
hardiness, exercise and social support as resources against illness. Journal of
psychosomatic research, 29(5), 525-533.
Kyröläinen, H., Häkkinen, K., Kautiainen, H., Santtila, M., Pihlainen, K., & Häkkinen,
A. (2008). Physical fitness, BMI and sickness absence in male military personnel.
Occupational medicine, 58(4), 251-256.
Lagestad, P. (2011). Physical Skills and Work Performance in Policing. International
Journal of Police Science and Management. Vol. 14. No. 1. 2012. 58-70.
Lagestad, P., & van den Tillaar, R. (2014). A Comparison of Training and Physical
Performance of Police Students at the Start and the End of Three-Year Police
Education. Journal of Strength and Conditioning Research, Vol. 28. No. 5. May,
2014.
Lanning, Catherine Natsu; Love, Altovise; Dodsen, Belinda Kelly; Dougherty, Denise;
Zirilli, Lynne v. Southeastern Pennsylvania Transportation Authority. United
States Court of Appeals, Third Circuit No. 01-1040 October 15, 2002.
LaTourrette, T. (2011). Safety and Health Protection Efforts in the Police Service. The
Police Chief. International Association of Chiefs of Police. Vol. 78, 74-78.
Lechner, L., & de Vries, H. (1997). Effects of an employee fitness program on reduced
absenteeism. Journal of occupational and environmental medicine,39(9), 827-
831.
Lisman, P., O’Connor, F. G., Deuster, P. A., & Knapik, J. J. (2013). Functional
movement screen and aerobic fitness predict injuries in military training. Med Sci
Sports Exerc, 45(4), 636-643.
Loeppke. R. MD., Taitel. M. PhD., Richling. D. MD., Parry. T. PhD., Kessler. R. PhD.,
Hymel. P. MD., & Konicki. D. MHS. (2007). Health and Productivity as a
A Study on Physical Fitness Policies Among Police Departments in NC 74
Business Strategy. Journal of Occupational and Environmental Medicine. 2007;
49: 712-721.
Magnavita, N. & Garbarino. S. (2013). Is Absence Related to Work Stress? A Repeated
Cross-Sectional Study on a Special Police Force. American Journal of Industrial
Medicine 56:765-775.
Maguire B.J, Hunting K.L, Smith G.S, et al. (2002). Occupational fatalities in emergency
medical services: a hidden crisis. Ann Emerg Med.;40:625–632.
Maguire, E. (2003). Measuring the Performance of Law Enforcement Agencies: Part 1 of
a Part 2 Article. CALEA Update. Issue 83. Fairfax, VA.
Mattos, Daniel (2010). The Need to Promote Career-Long Vitality and Wellness in the
Police Profession. FBI Law Enforcement Bulletin. Retrieved from
www.iacpnet.com 9-16-2012.
Mayhew, C. (2001). Occupational health and safety risks faced by police officers.
Canberra: Australian Institute of Criminology.
McGill, S., Frost, D., Lam, T., Finlay, T., Darby, K., & Cannon, J. (2015). Can fitness
and movement quality prevent back injury in elite task force police officers? A 5-
year longitudinal study. Ergonomics, (ahead-of-print), 1-8.
Means, Lowry and Hoffman (2011), Physical Fitness Standards, Do your officer’s meet
the physical requirements for your department. Law and Order Magazine, April
2011 issue.
Meigh, N., Steele, M., & Orr, R. (2012). Metabolic fitness as a predictor of injury risk in
conditioned military trainees undertaking an arduous field training exercise.
Faculty of Health Sciences & Medicine Publications, paper 450.
Mittleman, M. A., Maclure, M., Tofler, G. H., Sherwood, J. B., Goldberg, R. J., &
Muller, J. E. (1993). Triggering of acute myocardial infarction by heavy physical
exertion--protection against triggering by regular exertion. New England Journal
of Medicine, 329(23), 1677-1683.
Moser, Carol (1996), Physical Fitness Standards. The Police Chief, retrieved from
www.iacpnet.com, 10-19-2011.
Nabeel, I., Baker, B. A., McGrail Jr, M. P., & Flottemesch, T. J. (2007). Correlation
between physical activity, fitness, and musculoskeletal injuries in police
officers. Minnesota Medicine, 90(9), 40-43.

A Study on Physical Fitness Policies Among Police Departments in NC 75
Neovius, K., Neovius, M., Kark, M. & Rasmussen. F., (2010). Association between
obesity status and sick-leave in Swedish men: Nationwide cohort study. European
Journal of Public Health. Vol. 22, No. 1, 112-116.
Ness, J. J and Light, J. (1992) Mandatory Physical Fitness Standards: Issues and
Concerns, The Police Chief, retrieved from www.iacpnet.com 10-19-2011
Nicholson-Crotty, S. & O’Toole Jr. L. J., (2004). Public Management and Organizational
Performance: The Case of Law Enforcement Agencies. Journal of Public
Administration Research and Theory, Vol. 14, no. 1. pp. 1-18.
North Carolina Crime Statistics at http://crimereporting.ncdoj.gov/.
North Carolina Department of Justice at http://ncdoj.gov
North Carolina Justice Academy at http://ncja.ncdoj.gov/Criminal-Justice-Links/NC-
Police-Departments.aspx
Norvell, N. & Belles, D. (1993). Psychological and Physical Benefits of Circuit Weight
Training in Law Enforcement Personnel. Journal of Consulting and Clinical
Psychology. Vol. 61. No. 3. 520-527.
O’Connor, F. G., Deuster, P. A., Davis, J., Pappas, C. G., & Knapik, J. J. (2011).
Functional movement screening: predicting injuries in officer candidates. Med Sci
Sports Exerc, 43(12), 2224-30
Orr, R., Stierli, M., Hinton, B., & Steele. M. (2013). The 30-15 Intermittent Fitness
Assessment as a Predictor of Injury Risk in Police Recruits. Australian Strength
and Conditioning Melbourne, Australia, Nov. 2013.
Pinizzotto, A. J. & Davis, E. F. (1999). Offenders Perceptual Shorthand: What Messages
are Law Enforcement Sending to Offenders? FBI Law Enforcement Bulletin 68.
No. 6.
Poplin, G. S., Roe, D. J., Peate, W., Harris, R. B., & Burgess, J. L. (2014). The
association of aerobic fitness with injuries in the fire service. American journal of
epidemiology, 179(2), 149-155.
Quigley, Adriennne (2008). Fit for Duty? The Need for Physical Fitness Programs for
Law Enforcement Officers. The Police Chief. Retrieved from www.iacpnet.com
10-19-2011
Ramey, S. L., Downing, N. R. & Franke, W. D. (2009). Milwaukee Police Department
Retirees, Cardiovascular Disease Risk and Morbiity Among Aging Law
Enforcment Officers. American Association of Occupational Health Nurses
Journal. Vol. 57, No. 11.
A Study on Physical Fitness Policies Among Police Departments in NC 76
Rauh, M. J., Macera, C. A., Trone, D. W., Shaffer, R. A., & Brodine, S. K.
(2006). Epidemiology of stress fracture and lower extremity overuse injury in
female recruits (No. NHRC-05-25). NAVAL HEALTH RESEARCH CENTER
SAN DIEGO CA.
Ricci, J. A., & Chee, E. (2005). Lost productive time associated with excess weight in the
US workforce. Journal of Occupational and Environmental Medicine, 47(12),
1227-1234.
Salkind, N. J. (2011). Statistics for People who think they Hate Statistics, fourth edition.
Thousand Oaks CA. Sage Publications.
Sassen, B., Cornelissen, V. A., Kiers, H., Wittink, H., Kok, G., & Vanhees, L. (2009).
Physical fitness matters more than physical activity in controlling cardiovascular
disease risk factors. European Journal of Cardiovascular Prevention &
Rehabilitation, 16(6), 677-683.
Sassen, B., Kok, G., Schaalma, H., Kiers, H., & Vanhees, L. (2010). Cardiovascular Risk
Profile: Cross-Sectional Analysis of Motivational Determinants, Physical Fitness
and Physical Activity. BMC Public Heath, 10:592.
Shaffer, R. A., Brodine, S. K., Almeida, S. A., Williams, K. M., & Ronaghy, S. (1999).
Use of simple measures of physical activity to predict stress fractures in young
men undergoing a rigorous physical training program. American Journal of
Epidemiology, 149(3), 236-242.
Siegel, L. J. (2013). Criminology, Theories, Patterns and Typologies. Eleventh edition,
Belmont, CA. Wadsworth.
Smith, D. L. (2011). Firefighter fitness: improving performance and preventing injuries
and fatalities. Current sports medicine reports, 10(3), 167-172.
Steinhardt, M., Greenhow, L., & Stewart, J. (1991). The relationship of physical activity
and cardiovascular fitness to absenteeism and medical care claims among law
enforcement officers. American journal of health promotion, 5(6), 455-460.
The Commission on Accreditation for Law Enforcement Agencies, Inc. CALEA® at
http://www.calea.org/.
Tiesman H.M, Hendricks S.A, Bell J.L, et al. (2010) Eleven years of occupational
mortality in law enforcement: The census of fatal occupational injuries, 1992–
2002. Am J Ind Med.;53:940–949.
Tiwana, N. Bass, G. & Farrell, G. (2015). Police Performance Measurement: An
Annotated Bibliography. Crime Science, A springer Open Journal. 4:1.
A Study on Physical Fitness Policies Among Police Departments in NC 77
Wattles, M. G., & Harris, C. (1997). The relationship between fitness levels and
employee's perceived productivity, job satisfaction, and absenteeism (Master's
thesis, Boise State University).
Wilson, O.W, (1963). Police Administration, Second Edition, New York. McGraw-Hill
Wright, B. R., Barbosa-Leiker, C. & Hoekstra, T. (2011). Law Enforcement Officer
Versus Non-Law Enforcement Officer Status as a longitudinal Predictor of
Traditional and Emerging Cardiovascular Risk Factors. Journal of Occupational
Medicine, Vol. 53 No. 7.
Zimmerman, F.H. (2012). Cardiovascular Disease and Risk Factors in Law Enforcement
Personnel: A Comprehensive Review. Cardiology in Review. Vol. 20. No. 4.
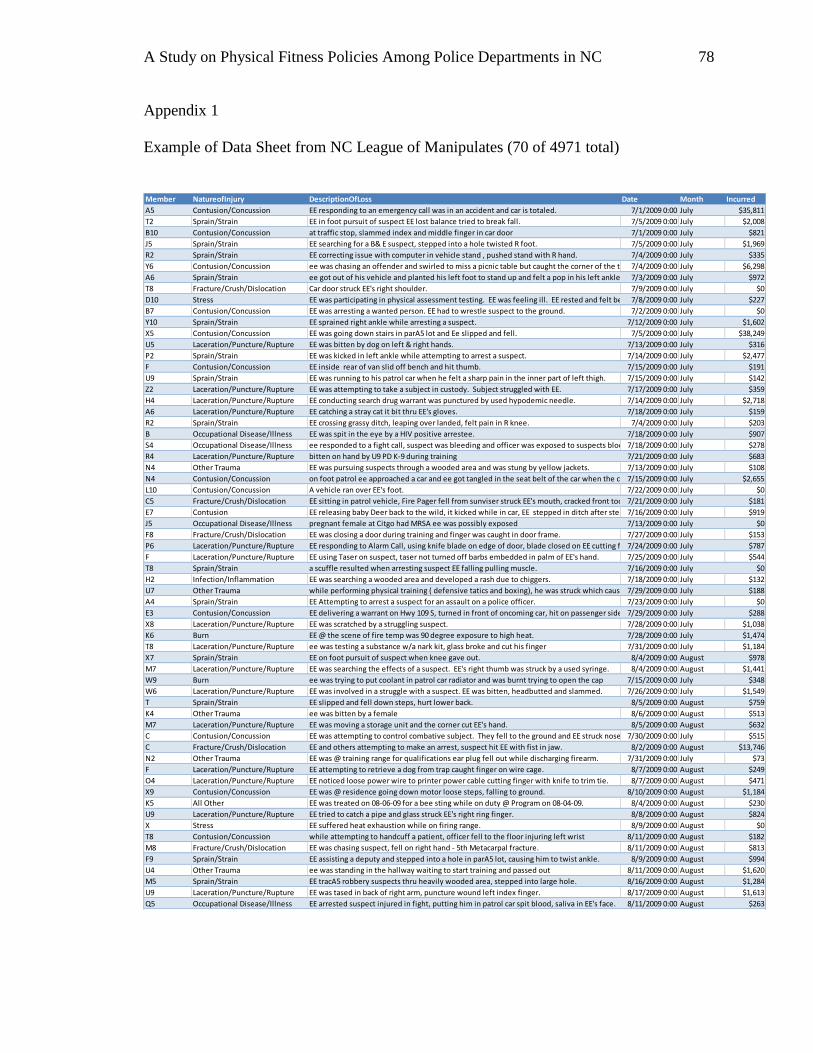
A Study on Physical Fitness Policies Among Police Departments in NC 78
Appendix 1
Example of Data Sheet from NC League of Manipulates (70 of 4971 total)
Member NatureofInjury DescriptionOfLoss Date Month Incurred
A5 Contusion/Concussion EE responding to an emergency call was in an accident and car is totaled. 7/1/2009 0:00 July $35,811
T2 Sprain/Strain EE in foot pursuit of suspect EE lost balance tried to break fall. 7/5/2009 0:00 July $2,008
B10 Contusion/Concussion at traffic stop, slammed index and middle finger in car door 7/1/2009 0:00 July $821
J5 Sprain/Strain EE searching for a B& E suspect, stepped into a hole twisted R foot. 7/5/2009 0:00 July $1,969
R2 Sprain/Strain EE correcting issue with computer in vehicle stand , pushed stand with R hand. 7/4/2009 0:00 July $335
Y6 Contusion/Concussion ee was chasing an offender and swirled to miss a picnic table but caught the corner of the table, ee fell and hurt his back.7/4/2009 0:00 July $6,298
A6 Sprain/Strain ee got out of his vehicle and planted his left foot to stand up and felt a pop in his left ankle 7/3/2009 0:00 July $972
T8 Fracture/Crush/Dislocation Car door struck EE's right shoulder. 7/9/2009 0:00 July $0
D10 Stress EE was participating in physical assessment testing. EE was feeling ill. EE rested and felt better. EE was sent home. On his way home EE began experiencing symptoms.7/8/2009 0:00 July $227
B7 Contusion/Concussion EE was arresting a wanted person. EE had to wrestle suspect to the ground. 7/2/2009 0:00 July $0
Y10 Sprain/Strain EE sprained right ankle while arresting a suspect. 7/12/2009 0:00 July $1,602
X5 Contusion/Concussion EE was going down stairs in parA5 lot and Ee slipped and fell. 7/5/2009 0:00 July $38,249
U5 Laceration/Puncture/Rupture EE was bitten by dog on left & right hands. 7/13/2009 0:00 July $316
P2 Sprain/Strain EE was kicked in left ankle while attempting to arrest a suspect. 7/14/2009 0:00 July $2,477
F Contusion/Concussion EE inside rear of van slid off bench and hit thumb. 7/15/2009 0:00 July $191
U9 Sprain/Strain EE was running to his patrol car when he felt a sharp pain in the inner part of left thigh. 7/15/2009 0:00 July $142
Z2 Laceration/Puncture/Rupture EE was attempting to take a subject in custody. Subject struggled with EE. 7/17/2009 0:00 July $359
H4 Laceration/Puncture/Rupture EE conducting search drug warrant was punctured by used hypodemic needle. 7/14/2009 0:00 July $2,718
A6 Laceration/Puncture/Rupture EE catching a stray cat it bit thru EE's gloves. 7/18/2009 0:00 July $159
R2 Sprain/Strain EE crossing grassy ditch, leaping over landed, felt pain in R knee. 7/4/2009 0:00 July $203
B Occupational Disease/Illness EE was spit in the eye by a HIV positive arrestee. 7/18/2009 0:00 July $907
S4 Occupational Disease/Illness ee responded to a fight call, suspect was bleeding and officer was exposed to suspects blood7/18/2009 0:00 July $278
R4 Laceration/Puncture/Rupture bitten on hand by U9 PD K-9 during training 7/21/2009 0:00 July $683
N4 Other Trauma EE was pursuing suspects through a wooded area and was stung by yellow jackets. 7/13/2009 0:00 July $108
N4 Contusion/Concussion on foot patrol ee approached a car and ee got tangled in the seat belt of the car when the car was trying to flee from the officer7/15/2009 0:00 July $2,655
L10 Contusion/Concussion A vehicle ran over EE's foot. 7/22/2009 0:00 July $0
C5 Fracture/Crush/Dislocation EE sitting in patrol vehicle, Fire Pager fell from sunviser struck EE's mouth, cracked front tooth.7/21/2009 0:00 July $181
E7 Contusion EE releasing baby Deer back to the wild, it kicked while in car, EE stepped in ditch after stepping back.7/16/2009 0:00 July $919
J5 Occupational Disease/Illness pregnant female at Citgo had MRSA ee was possibly exposed 7/13/2009 0:00 July $0
F8 Fracture/Crush/Dislocation EE was closing a door during training and finger was caught in door frame. 7/27/2009 0:00 July $153
P6 Laceration/Puncture/Rupture EE responding to Alarm Call, using knife blade on edge of door, blade closed on EE cutting finger.7/24/2009 0:00 July $787
F Laceration/Puncture/Rupture EE using Taser on suspect, taser not turned off barbs embedded in palm of EE's hand. 7/25/2009 0:00 July $544
T8 Sprain/Strain a scuffle resulted when arresting suspect EE falling pulling muscle. 7/16/2009 0:00 July $0
H2 Infection/Inflammation EE was searching a wooded area and developed a rash due to chiggers. 7/18/2009 0:00 July $132
U7 Other Trauma while performing physical training ( defensive tatics and boxing), he was struck which caused a chip on his tooth7/29/2009 0:00 July $188
A4 Sprain/Strain EE Attempting to arrest a suspect for an assault on a police officer. 7/23/2009 0:00 July $0
E3 Contusion/Concussion EE delivering a warrant on Hwy 109 S, turned in front of oncoming car, hit on passenger side. 7/29/2009 0:00 July $288
X8 Laceration/Puncture/Rupture EE was scratched by a struggling suspect. 7/28/2009 0:00 July $1,038
K6 Burn EE @ the scene of fire temp was 90 degree exposure to high heat. 7/28/2009 0:00 July $1,474
T8 Laceration/Puncture/Rupture ee was testing a substance w/a nark kit, glass broke and cut his finger 7/31/2009 0:00 July $1,184
X7 Sprain/Strain EE on foot pursuit of suspect when knee gave out. 8/4/2009 0:00 August $978
M7 Laceration/Puncture/Rupture EE was searching the effects of a suspect. EE's right thumb was struck by a used syringe. 8/4/2009 0:00 August $1,441
W9 Burn ee was trying to put coolant in patrol car radiator and was burnt trying to open the cap 7/15/2009 0:00 July $348
W6 Laceration/Puncture/Rupture EE was involved in a struggle with a suspect. EE was bitten, headbutted and slammed. 7/26/2009 0:00 July $1,549
T Sprain/Strain EE slipped and fell down steps, hurt lower back. 8/5/2009 0:00 August $759
K4 Other Trauma ee was bitten by a female 8/6/2009 0:00 August $513
M7 Laceration/Puncture/Rupture EE was moving a storage unit and the corner cut EE's hand. 8/5/2009 0:00 August $632
C Contusion/Concussion EE was attempting to control combative subject. They fell to the ground and EE struck nose on subject's back.7/30/2009 0:00 July $515
C Fracture/Crush/Dislocation EE and others attempting to make an arrest, suspect hit EE with fist in jaw. 8/2/2009 0:00 August $13,746
N2 Other Trauma EE was @ training range for qualifications ear plug fell out while discharging firearm. 7/31/2009 0:00 July $73
F Laceration/Puncture/Rupture EE attempting to retrieve a dog from trap caught finger on wire cage. 8/7/2009 0:00 August $249
O4 Laceration/Puncture/Rupture EE noticed loose power wire to printer power cable cutting finger with knife to trim tie. 8/7/2009 0:00 August $471
X9 Contusion/Concussion EE was @ residence going down motor loose steps, falling to ground. 8/10/2009 0:00 August $1,184
K5 All Other EE was treated on 08-06-09 for a bee sting while on duty @ Program on 08-04-09. 8/4/2009 0:00 August $230
U9 Laceration/Puncture/Rupture EE tried to catch a pipe and glass struck EE's right ring finger. 8/8/2009 0:00 August $824
X Stress EE suffered heat exhaustion while on firing range. 8/9/2009 0:00 August $0
T8 Contusion/Concussion while attempting to handcuff a patient, officer fell to the floor injuring left wrist 8/11/2009 0:00 August $182
M8 Fracture/Crush/Dislocation EE was chasing suspect, fell on right hand - 5th Metacarpal fracture. 8/11/2009 0:00 August $813
F9 Sprain/Strain EE assisting a deputy and stepped into a hole in parA5 lot, causing him to twist ankle. 8/9/2009 0:00 August $994
U4 Other Trauma ee was standing in the hallway waiting to start training and passed out 8/11/2009 0:00 August $1,620
M5 Sprain/Strain EE tracA5 robbery suspects thru heavily wooded area, stepped into large hole. 8/16/2009 0:00 August $1,284
U9 Laceration/Puncture/Rupture EE was tased in back of right arm, puncture wound left index finger. 8/17/2009 0:00 August $1,613
Q5 Occupational Disease/Illness EE arrested suspect injured in fight, putting him in patrol car spit blood, saliva in EE's face. 8/11/2009 0:00 August $263
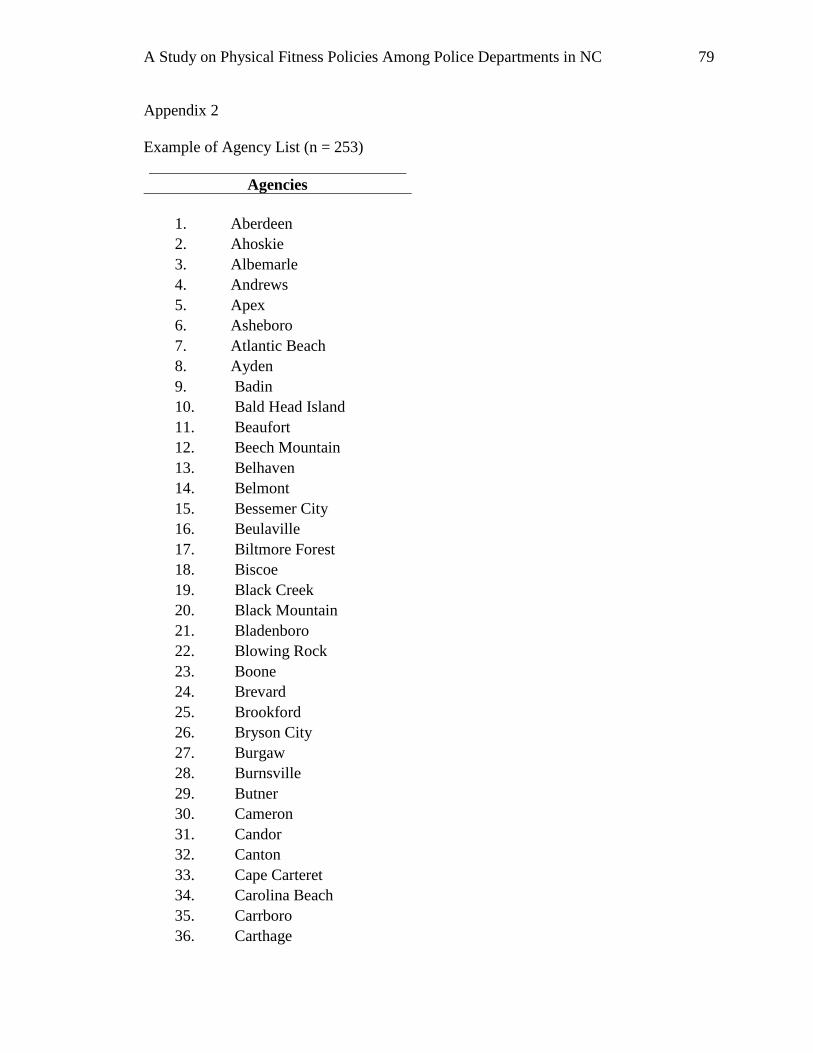
A Study on Physical Fitness Policies Among Police Departments in NC 79
Appendix 2
Example of Agency List (n = 253)
Agencies
1. Aberdeen
2. Ahoskie
3. Albemarle
4. Andrews
5. Apex
6. Asheboro
7. Atlantic Beach
8. Ayden
9. Badin
10. Bald Head Island
11. Beaufort
12. Beech Mountain
13. Belhaven
14. Belmont
15. Bessemer City
16. Beulaville
17. Biltmore Forest
18. Biscoe
19. Black Creek
20. Black Mountain
21. Bladenboro
22. Blowing Rock
23. Boone
24. Brevard
25. Brookford
26. Bryson City
27. Burgaw
28. Burnsville
29. Butner
30. Cameron
31. Candor
32. Canton
33. Cape Carteret
34. Carolina Beach
35. Carrboro
36. Carthage

A Study on Physical Fitness Policies Among Police Departments in NC 80
37. Caswell Beach
38. Catawba
39. Chadbourn
40. Chapel Hill
41. Cherryville
42. China Grove
43. Claremont
44. Clayton
45. Cleveland
46. Clinton
47. Clyde
48. Coats
49. Columbus
50. Conover
51. Conway
52. Cornelius
53. Cramerton
54. Creedmoor
55. Dallas
56. Davidson
57. Denton
58. Dobson
59. Drexel
60. Duck
61. East Spencer
62. Eden
63. Edenton
64. Elizabeth City
65. Elizabethtown
66. Elkin
67. Emerald Isle
68. Enfield
69. Erwin
70. Fairmont
71. Farmville
72. Fayetteville
73. Fletcher
74. Forest City
75. Four Oaks
76. Foxfire Village
77. Franklin
78. Franklinton
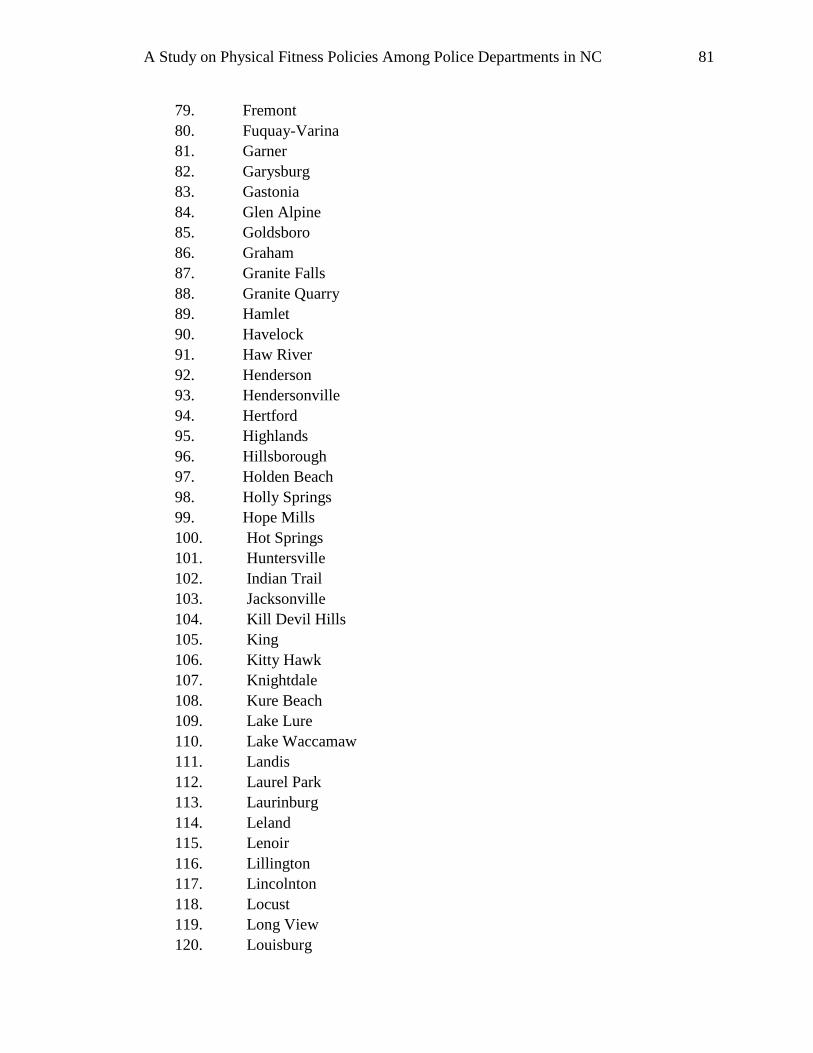
A Study on Physical Fitness Policies Among Police Departments in NC 81
79. Fremont
80. Fuquay-Varina
81. Garner
82. Garysburg
83. Gastonia
84. Glen Alpine
85. Goldsboro
86. Graham
87. Granite Falls
88. Granite Quarry
89. Hamlet
90. Havelock
91. Haw River
92. Henderson
93. Hendersonville
94. Hertford
95. Highlands
96. Hillsborough
97. Holden Beach
98. Holly Springs
99. Hope Mills
100. Hot Springs
101. Huntersville
102. Indian Trail
103. Jacksonville
104. Kill Devil Hills
105. King
106. Kitty Hawk
107. Knightdale
108. Kure Beach
109. Lake Lure
110. Lake Waccamaw
111. Landis
112. Laurel Park
113. Laurinburg
114. Leland
115. Lenoir
116. Lillington
117. Lincolnton
118. Locust
119. Long View
120. Louisburg
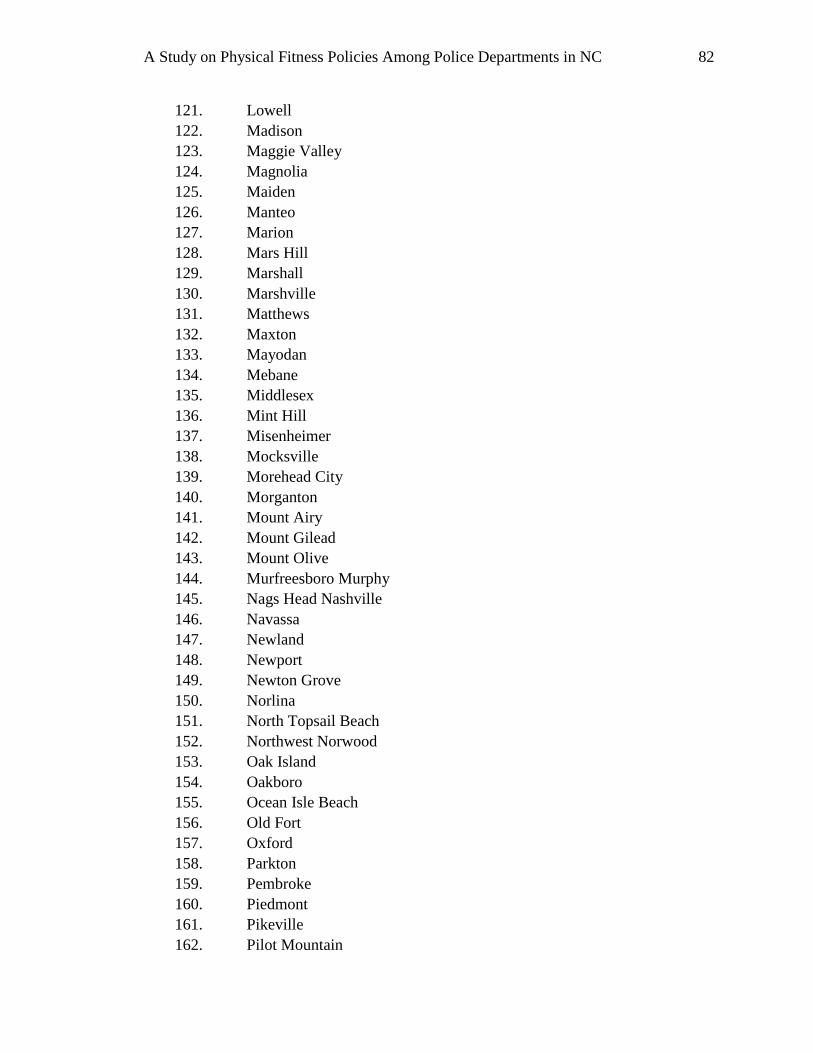
A Study on Physical Fitness Policies Among Police Departments in NC 82
121. Lowell
122. Madison
123. Maggie Valley
124. Magnolia
125. Maiden
126. Manteo
127. Marion
128. Mars Hill
129. Marshall
130. Marshville
131. Matthews
132. Maxton
133. Mayodan
134. Mebane
135. Middlesex
136. Mint Hill
137. Misenheimer
138. Mocksville
139. Morehead City
140. Morganton
141. Mount Airy
142. Mount Gilead
143. Mount Olive
144. Murfreesboro Murphy
145. Nags Head Nashville
146. Navassa
147. Newland
148. Newport
149. Newton Grove
150. Norlina
151. North Topsail Beach
152. Northwest Norwood
153. Oak Island
154. Oakboro
155. Ocean Isle Beach
156. Old Fort
157. Oxford
158. Parkton
159. Pembroke
160. Piedmont
161. Pikeville
162. Pilot Mountain

A Study on Physical Fitness Policies Among Police Departments in NC 83
163. Pine Knoll Shores
164. Pine Level
165. Pinehurst
166. Pinetops
167. Pineville
168. Pittsboro
169. Plymouth
170. Polkton
171. Princeton
172. Princeville
173. Raeford
174. Raleigh
175. Ramseur
176. Randleman
177. Ranlo
178. Red Springs
179. Reidsville
180. Rhodhiss
181. Richlands
182. River Bend
183. Robbins
184. Rockingham
185. Rolesville
186. Rose Hill
187. Rowland
188. Roxboro
189. Rutherfordton
190. Saluda
191. Sanford
192. Scotland Neck
193. Seaboard Selma
194. Seven Devils
195. Shallotte
196. Sharpsburg
197. Shelby
198. Siler City
199. Simpson
200. Smithfield
201. Southern Pines
202. Southern Shores
203. Southport
204. Sparta

A Study on Physical Fitness Policies Among Police Departments in NC 84
205. Spindale
206. Spring Hope
207. Spring Lake
208. Spruce Pine
209. St. Pauls
210. Stallings
211. Stanfield
212. Stanley
213. Stantonsburg
214. Star
215. Stedman
216. Stoneville
217. Sugar Mountain
218. Sunset Beach
219. Surf City
220. Swansboro
221. Sylva
222. Tarboro
223. Taylorsville
224. Thomasville
225. Topsail Beach
226. Trent Woods
227. Triad Airport
228. Troutman
229. Troy
230. Valdese
231. Vass
232. Wadesboro
233. Wagram
234. Wake Forest Wallace
235. Walnut Cove
236. Warrenton Warsaw
237. Waxhaw Waynesville
238. Weaverville
239. Weldon
240. Wendell
241. Whispering Pines
242. Whitakers
243. White Lake
244. Whiteville
245. Williamston
246. Wilson's Mills

A Study on Physical Fitness Policies Among Police Departments in NC 85
247. Winfall
248. Wingate
249. Winterville
250. Woodfin
251. Woodland
252. Wrightsville Beach
253. Youngsville

A Study on Physical Fitness Policies Among Police Departments in NC 86
Appendix 3
Document-Participation Letter
Title of Study: An Exploratory Study on Physical Fitness Policies among Police
Departments in North Carolina.
Principal investigator(s) Co-investigator Jay Fortenbery, MJA Marguerite Bryan. Ph., D. 810 W. Queen Street College of Arts, Humanities and Edenton NC, 27932 Social Sciences 252-337-4533 Nova Southeastern University 3301 College Avenue Ft. Lauderdale, FL 33314 [email protected]
Institutional Review Board Nova Southeastern University Office of Grants and Contracts (954) 262-5369/Toll Free: 866-499-0790 [email protected]
Description of Study: Jay Fortenbery is a doctoral student at Nova Southeastern
University engaged in research for the purpose of satisfying a requirement for a Doctor of
Education degree. The purpose of this study is to examine existing physical fitness
maintenance policies among police departments in North Carolina and determine if there
are any associations or trends in these polices and reported officer injuries.
If you agree to participate, you will be asked to complete the attached questionnaire. This
questionnaire will help the writer identify the existing physical fitness maintenance
policy of your agency. The questionnaire will take approximately five minutes to
complete.
Risks/Benefits to the Participant: There may be minimal risk involved in participating
in this study. There are no direct benefits to for agreeing to be in this study. Please
understand that although you may not benefit directly from participation in this study,
you have the opportunity to enhance knowledge associated with policies on physical
fitness and associated rates of injuries. If you have any concerns about the risks/benefits
of participating in this study, you can contact the investigators and/or the university’s
human research oversight board (the Institutional Review Board or IRB) at the numbers
listed above.
Cost and Payments to the Participant: There is no cost for participation in this
study. Participation is completely voluntary and no payment will be provided.

A Study on Physical Fitness Policies Among Police Departments in NC 87
Confidentiality: Information obtained in this study is strictly confidential unless
disclosure is required by law. All data will be secured in a locked filing cabinet. Your
name will not be used in the reporting of information in publications or conference
presentations.
Participant’s Right to Withdraw from the Study: You have the right to refuse to
participate in this study and the right to withdraw from the study at any time without
penalty.
I have read this letter and I fully understand the contents of this document
and voluntarily consent to participate. All of my questions concerning this
research have been answered. If I have any questions in the future about this
study they will be answered by the investigator listed above or his/her staff.
I understand that the completion of this questionnaire implies my consent to
participate in this study.

A Study on Physical Fitness Policies Among Police Departments in NC 88
Appendix 4
Telephone Survey Form
Explanation of Study
My name is Jay Fortenbery and I am the Chief of Police in Edenton, NC. I am a doctoral
student at NOVA Southeastern University and am conducting a study examining the
existing state of physical fitness standards among police agencies. I would like to ask you
a couple of questions about your existing policy on physical fitness. Your individual
department name will not be mentioned in the study but is needed for data analysis and
comparative purposes. The results of the study will be made available for you upon
completion.
Agency Name ___________________________________ Date _________________
Name of Administrator ____________________________
1. Does your agency have a mandated (all officers annually) physical fitness
maintenance policy and what year was the policy implemented?
________________________________________________________
2. Does your agency have a mandated (all officers annually) wellness
program and what year was the program implemented?
__________________________________________________________
Please provide a copy of the policy to [email protected] or fax to 252-482-
4999.

A Study on Physical Fitness Policies Among Police Departments in NC 89
Appendix 5
Area code map retrieved from,
https://www.nationalnanpa.com/area_code_maps/ac_map_static.html
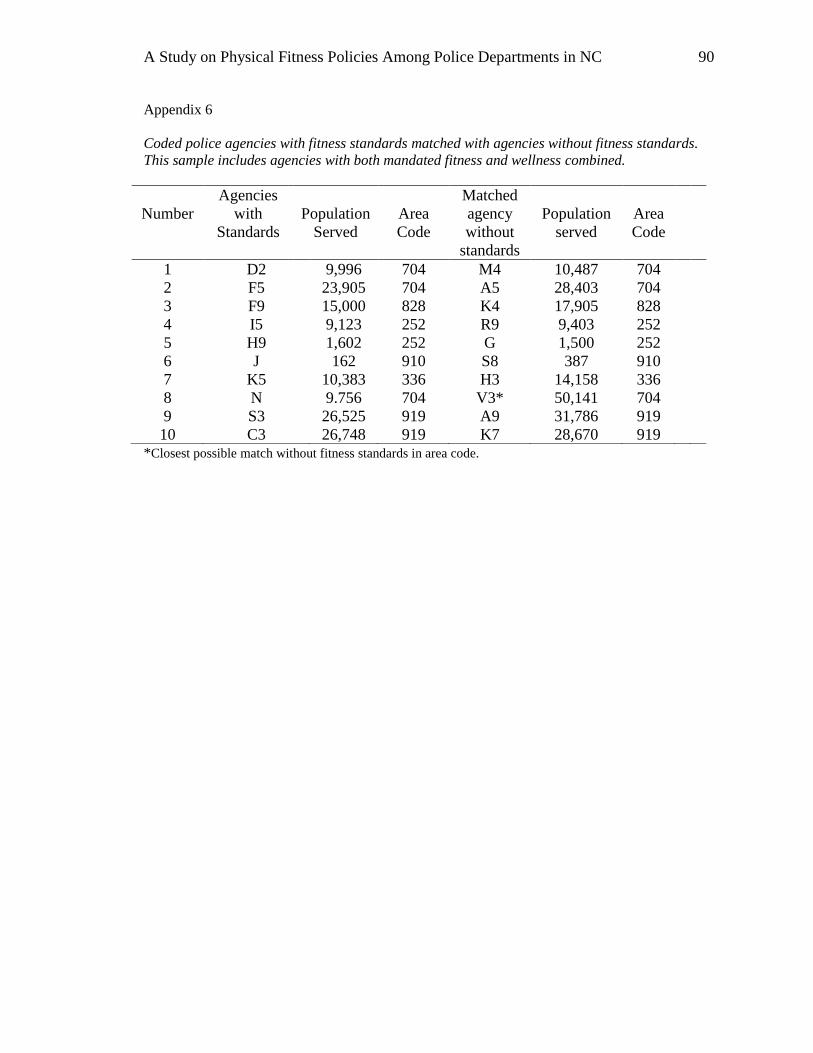
A Study on Physical Fitness Policies Among Police Departments in NC 90
Appendix 6
Coded police agencies with fitness standards matched with agencies without fitness standards.
This sample includes agencies with both mandated fitness and wellness combined.
*Closest possible match without fitness standards in area code.
Number
Agencies
with
Standards
Population
Served
Area
Code
Matched
agency
without
standards
Population
served
Area
Code
1
2
3
4
5
6
7
8
9
10
D2
F5
F9
I5
H9
J
K5
N
S3
C3
9,996
23,905
15,000
9,123
1,602
162
10,383
9.756
26,525
26,748
704
704
828
252
252
910
336
704
919
919
M4
A5
K4
R9
G
S8
H3
V3*
A9
K7
10,487
28,403
17,905
9,403
1,500
387
14,158
50,141
31,786
28,670
704
704
828
252
252
910
336
704
919
919

A Study on Physical Fitness Policies Among Police Departments in NC 91
Appendix 7
Coded police agencies with mandated fitness policy matched to agencies with no fitness policy.
This sample does not include agencies with wellness standards.
Number
Agencies
with
Standards
Population
Served
Area
Code
Matched
agency
without
standards
Population
served
Area
Code
1
2
3
4
5
I5
H9
J
K5
C3
9,123
1,602
162
10,383
26,748
252
252
910
336
919
R9
G
S8
Y6
K7
9,403
1,500
387
14,293
28,670
252
252
910
336
919

A Study on Physical Fitness Policies Among Police Departments in NC 92
Appendix 8
Coded police agencies with mandated fitness policy matched to agencies with mandated wellness
policies. This sample does not include agencies with no standards.
Number
Agencies
with
Standards
Population
Served
Area
Code
Matched
agency
without
standards
Population
served
Area
Code
1
2
3
4
5
I5
H9
J
K5
C3
9,123
1,602
162
10,383
26,748
252
252
910
336
919
Y3
O5
G1
N3
E
6,880
2,791
2,127
13,294
39,768
252
252
252
828
919

A Study on Physical Fitness Policies Among Police Departments in NC 93
Appendix 9
Coded police agencies with mixed mandated fitness or wellness standards matched with agencies
without fitness or wellness standards.
*Closest possible match in area code. **Agencies W6 pop 3,478, X5 pop 2,368 and J3 pop 2,998 were
used together for a closer match with E9. Total population 8,844.
Number
Agencies
with
Standards
Population
Served
Area
Code
Matched
agencies
without
standards
Populatio
n served
Area
Code
1
2
3
4
5
6
7
8
9
10
11
12
13
14
15
16
17
18
19
20
21
22
23
24
25
26
27
28
29
30
31
B4
C
E
G1
K2
N3
O5
O8
Q7
T
Y3
F5
S3
D2
F9
H9
I5
J
K5
N
X
X6
Y8
W4
B
C3
D5
E9
J5
P5
T8
3,345
15,932
39,768
2,127
4,975
13,294
2,791
2,680
20,179
8,011
6,880
23,905
26,525
9,966
1,500
1,602
9,163
162
10,383
9,756
7,769
3,454
5,717
8,181
4,954
26,748
11,970
11,311
16,743
5,373
4,131
252
704
919
252
252
828
252
828
704
828
252
704
919
704
828
252
252
910
336
704
828
910
704
828
252
919
919
704
828
252
252
O2
M4
G3
O3
H
W
V7
U4
A5
U2
P8
V3*
K7
Q1
Q
G
R9
S8
Y6
C2
V2
V8
U8
S9
S2
I1
C6
W6,X5,J3**
K4
N9
O6
3,717
10,487
36,000
2,154
4,992
12,553
2,795
3,350
28,403
7,360
11,255
50,141
27,670
5,782
1,364
1,500
9,403
387
14,293
4,667
7,427
3,294
2,479
6,286
4,695
20,510
8,494
8,844
17,905
5,414
3,777
252
704
919
252
252
828
252
828
704
828
252
704
919
704
828
252
252
910
336
704
704
910
704
828
252
919
919
704
828
252
252

A Study on Physical Fitness Policies Among Police Departments in NC 94
Appendix 10
Possible fitness and non-fitness related causes of loss
Possible Fitness Related
Causes of Loss
Possible Non - Fitness Related
Causes of Loss
Apprehension/Arrest/Struggle
Caught in/Under or Between
Cumulative Trauma
Cut, Punch
Exercise/training
Get in-off
Jumping/lifting
Overexertion
Gunshot
Hand Tool
Holding Carrying
Person Act of Violence
Pushing/Pulling
Reaching
Repetitive Motion
Stooping/Bending
Strain or Injury by
Stress
Striking Against
Twist
Twisting
Absorption/Ingestion/Inhalation
Animal/insect
Broken Glass
Burns or Scalds
Carpel Tunnel
Chemical Exposure
Collision or Sideswipe M/V
Contact with Other Cause
Dust, Gas Fumes or Vapor
Exposure to Temperature Extremes
Fire or Flame
Fall, slip, trip
Foreign Matter/Object in eye/body
Hot Objects or Substances
Infections Disease
Miscellaneous Causes
Mold
Motor Vehicle Collision
On Ice or Snow
On Stairs
Plants, trees, vegetation
Rubbed or Abraded by
Slip, Trip, Fall
Slipped
Stepped into Hole
Stepping in and out
Temperature Extremes
Transfer of Body Fluids
Traumatic Event
Unknown
Using Tools/Machinery