an historical perspective on the response of fertility to
TRANSCRIPT
An historical perspective on the response of fertility to
economic and mortality crisesRonald Lee, University of California Berkeley
United Nations DESA: EXPERT GROUP MEETING ON THE IMPACT OF THE COVID-19 PANDEMIC ON FERTILITY
May 10, 2021
1. Background
• Covid 19 led to sharp declines in fertility and births in many high income countries, with accelerated decline expected in 2021(Kearney and Levine, 2020; Sobotka et al 2021).In January 2021 declines range from 0 to 20%.
Ronald Lee, UC Berkeley, May 10 2021, UNPD Expert Meeting 2
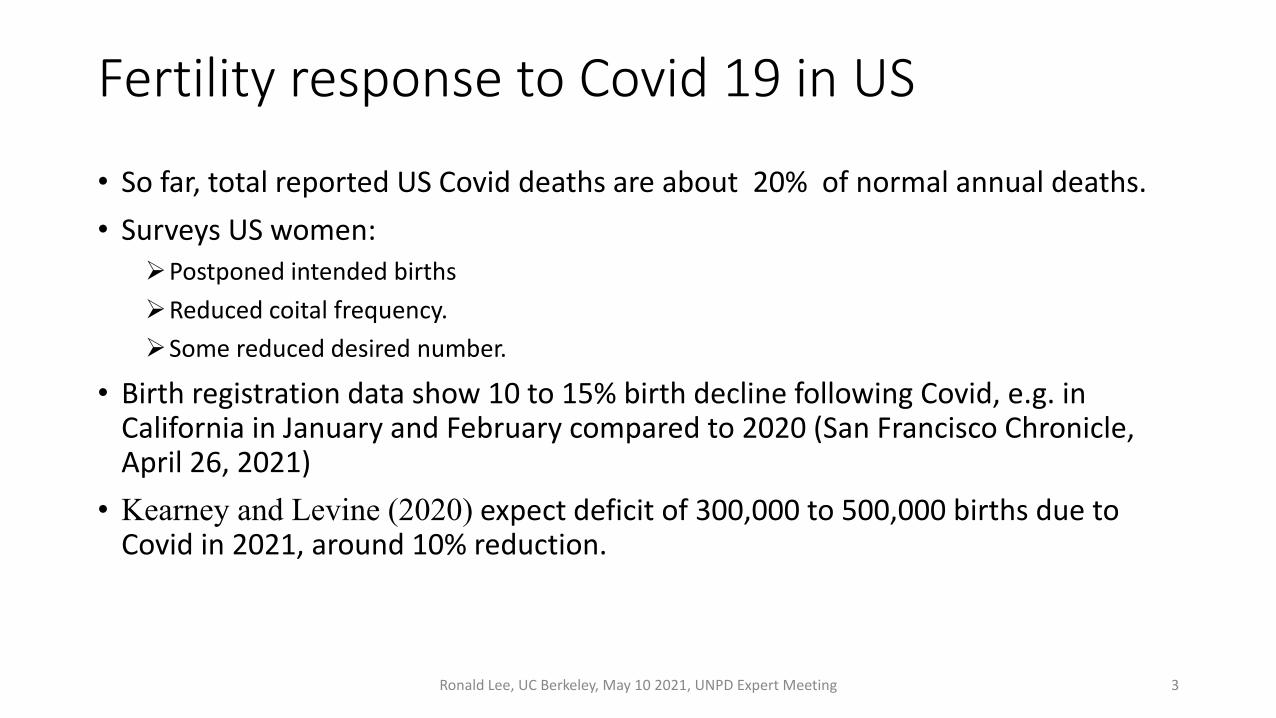
Fertility response to Covid 19 in US
• So far, total reported US Covid deaths are about 20% of normal annual deaths.• Surveys US women:
Postponed intended birthsReduced coital frequency. Some reduced desired number.
• Birth registration data show 10 to 15% birth decline following Covid, e.g. in California in January and February compared to 2020 (San Francisco Chronicle, April 26, 2021)
• Kearney and Levine (2020) expect deficit of 300,000 to 500,000 births due to Covid in 2021, around 10% reduction.
Ronald Lee, UC Berkeley, May 10 2021, UNPD Expert Meeting 3

What should we expect going forward?Lessons from economic and demographic crises in the past.
• Two Covid crises coincide: health/mortality; economy/unemployment.
• Here see historical responses to both mortality and food price variations in the past.
Ronald Lee, UC Berkeley, May 10 2021, UNPD Expert Meeting 4
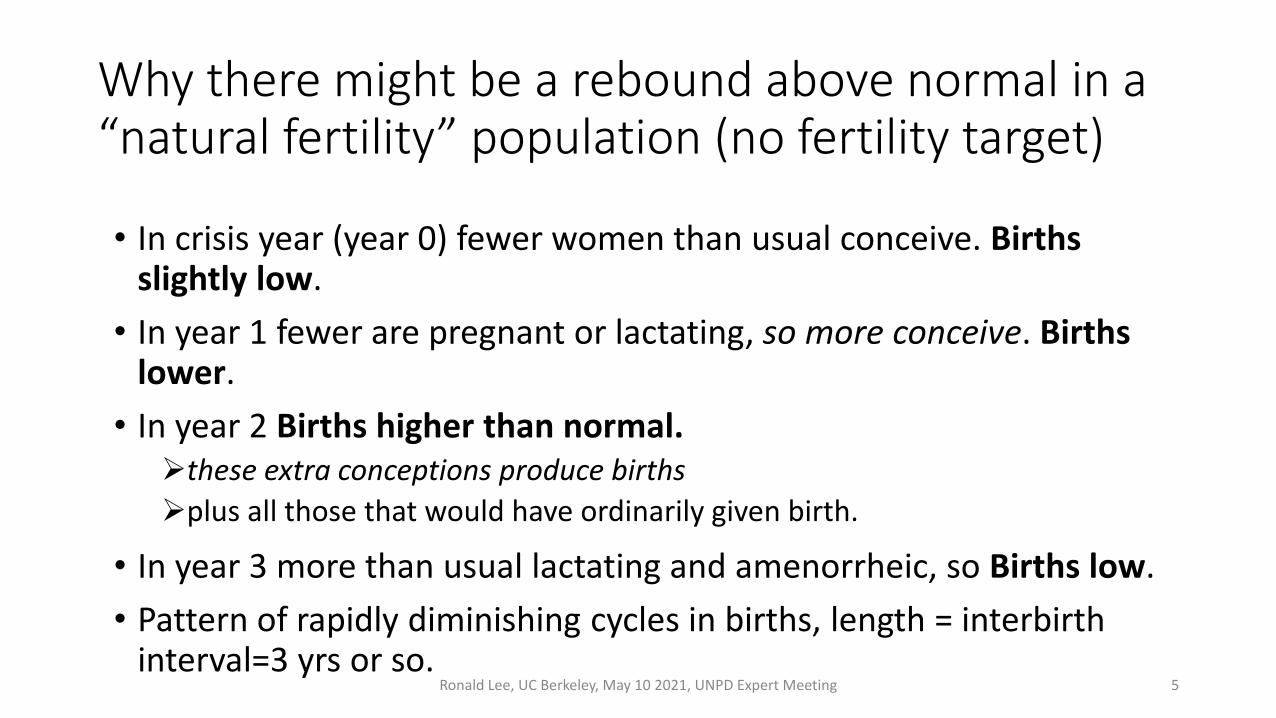
Why there might be a rebound above normal in a “natural fertility” population (no fertility target)
• In crisis year (year 0) fewer women than usual conceive. Births slightly low.
• In year 1 fewer are pregnant or lactating, so more conceive. Births lower.
• In year 2 Births higher than normal.these extra conceptions produce births plus all those that would have ordinarily given birth.
• In year 3 more than usual lactating and amenorrheic, so Births low.• Pattern of rapidly diminishing cycles in births, length = interbirth
interval=3 yrs or so. Ronald Lee, UC Berkeley, May 10 2021, UNPD Expert Meeting 5

And in a contracepting population aiming for target completed fertility• Women may postpone conceiving or abort in year 0, so births a little
low. • In year 1 postponers do not give birth so births low• In year 2 births again above normalpostponers give birthplus all those who planned for this year all along.
• In year 3 more than usual lactating and amenorrheic, so births low.
• Natural fertility and target fertility respond in similarly.
Ronald Lee, UC Berkeley, May 10 2021, UNPD Expert Meeting 6

2. Data and Methods
Ronald Lee, UC Berkeley, May 10 2021, UNPD Expert Meeting 7

Data sources before vital registration
• Most historical studies analyze fluctuations in births and deaths relative to their trends. For short run changes, just as good as TFR or life expectancy.
• Births, deaths and marriages based on European parish register records (Baptisms, Burials and Marriages).Under-reporting etc. generally not a problem for short run fluctuations
• Food prices and real wages come from economic historians.• For developing countriesParish register data (e.g. in Latin America)Vital registrationDHS has been used in sub-Saharan Africa
Ronald Lee, UC Berkeley, May 10 2021, UNPD Expert Meeting 8
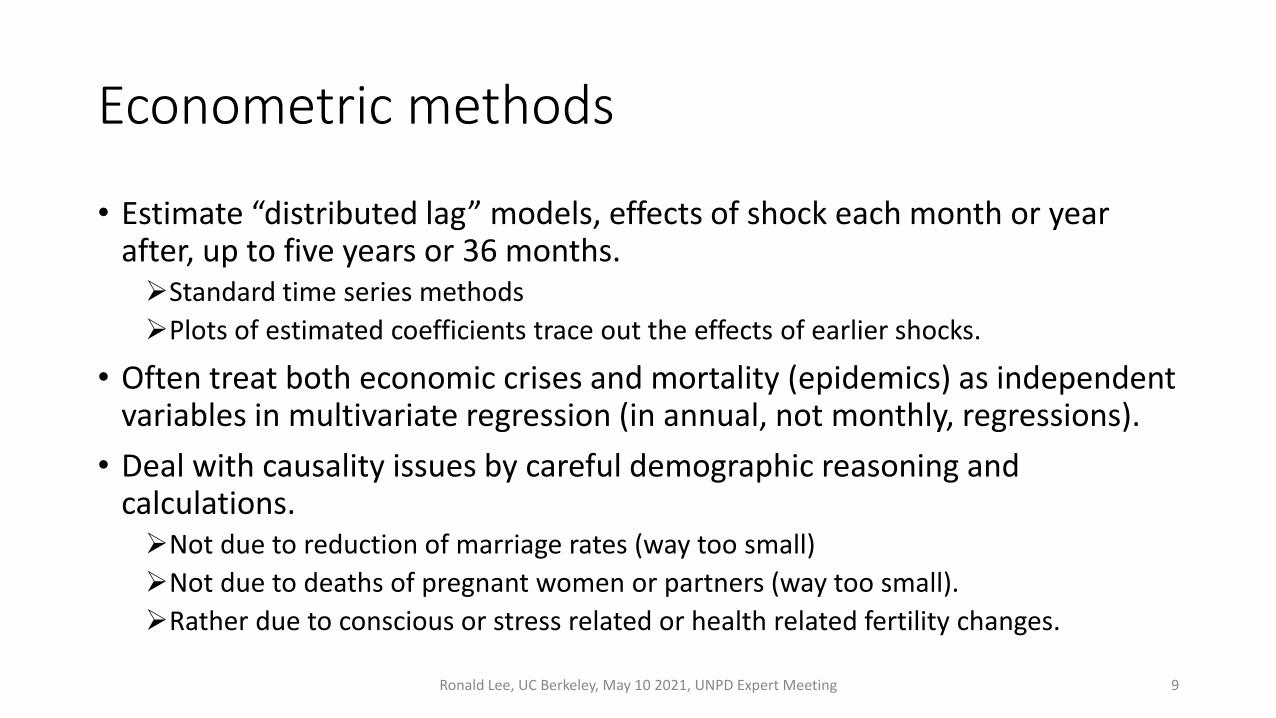
Econometric methods
• Estimate “distributed lag” models, effects of shock each month or year after, up to five years or 36 months.Standard time series methodsPlots of estimated coefficients trace out the effects of earlier shocks.
• Often treat both economic crises and mortality (epidemics) as independent variables in multivariate regression (in annual, not monthly, regressions).
• Deal with causality issues by careful demographic reasoning and calculations.Not due to reduction of marriage rates (way too small)Not due to deaths of pregnant women or partners (way too small).Rather due to conscious or stress related or health related fertility changes.
Ronald Lee, UC Berkeley, May 10 2021, UNPD Expert Meeting 9
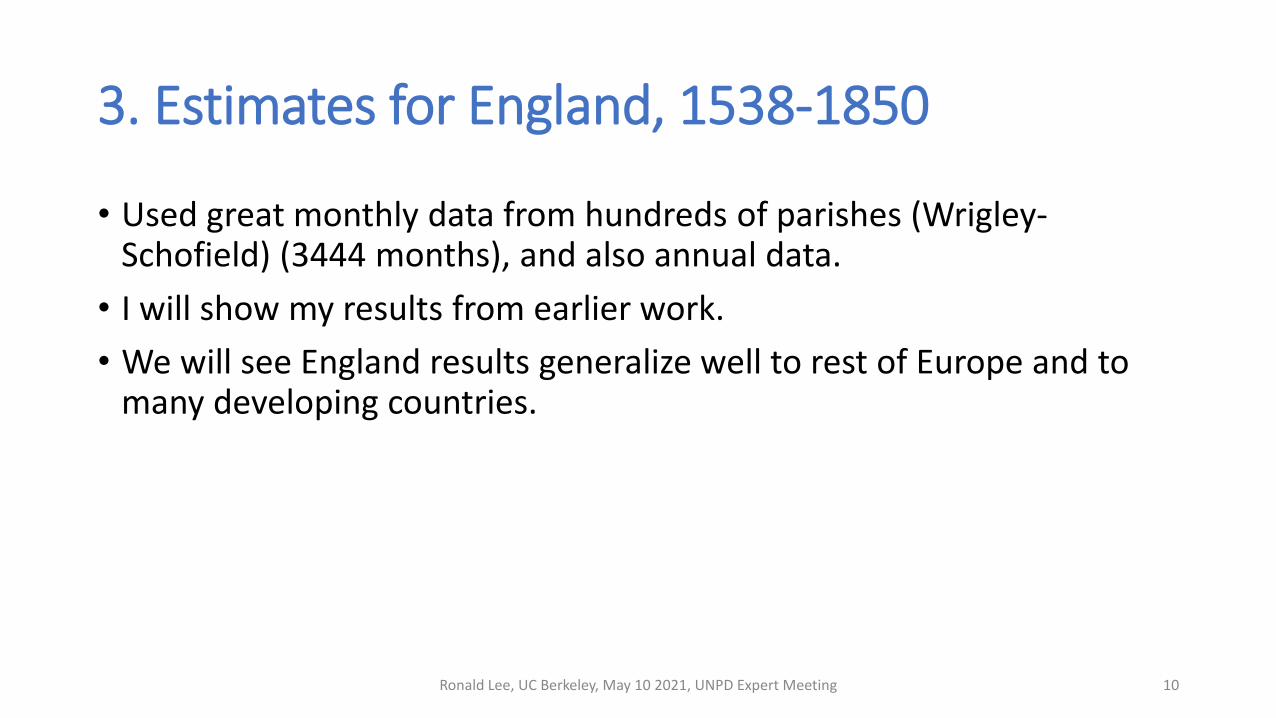
3. Estimates for England, 1538-1850
• Used great monthly data from hundreds of parishes (Wrigley-Schofield) (3444 months), and also annual data.
• I will show my results from earlier work.• We will see England results generalize well to rest of Europe and to
many developing countries.
Ronald Lee, UC Berkeley, May 10 2021, UNPD Expert Meeting 10

Proportional change in fertility each month after change in mortality (controlling for food prices).• P.365, pop hist of Eng
• Positive association at lag 0 is reverse causality: With high neonatal mortality, more births cause more deaths.
• Why do births start declining so soon after mort crisis? Fetal mortality? Abortion? Migration?
• Striking drop at exactly 9 months Reduced coital frequency? Stress induced fetal loss? Calculations show death of pregnant women or
spouse could explain only very small part.
Ronald Lee, UC Berkeley, May 10 2021, UNPD Expert Meeting 11

Annual patterns can look quite different than monthly.
When during calendar year does shock occur?Could be in January at start, could be in December at end.
This annual pattern is completely consistent with the monthly pattern, though looks very different.And still have initial shock and bounce back above normal. Note diminishing cycle.
Ronald Lee, UC Berkeley, May 10 2021, UNPD Expert Meeting 12
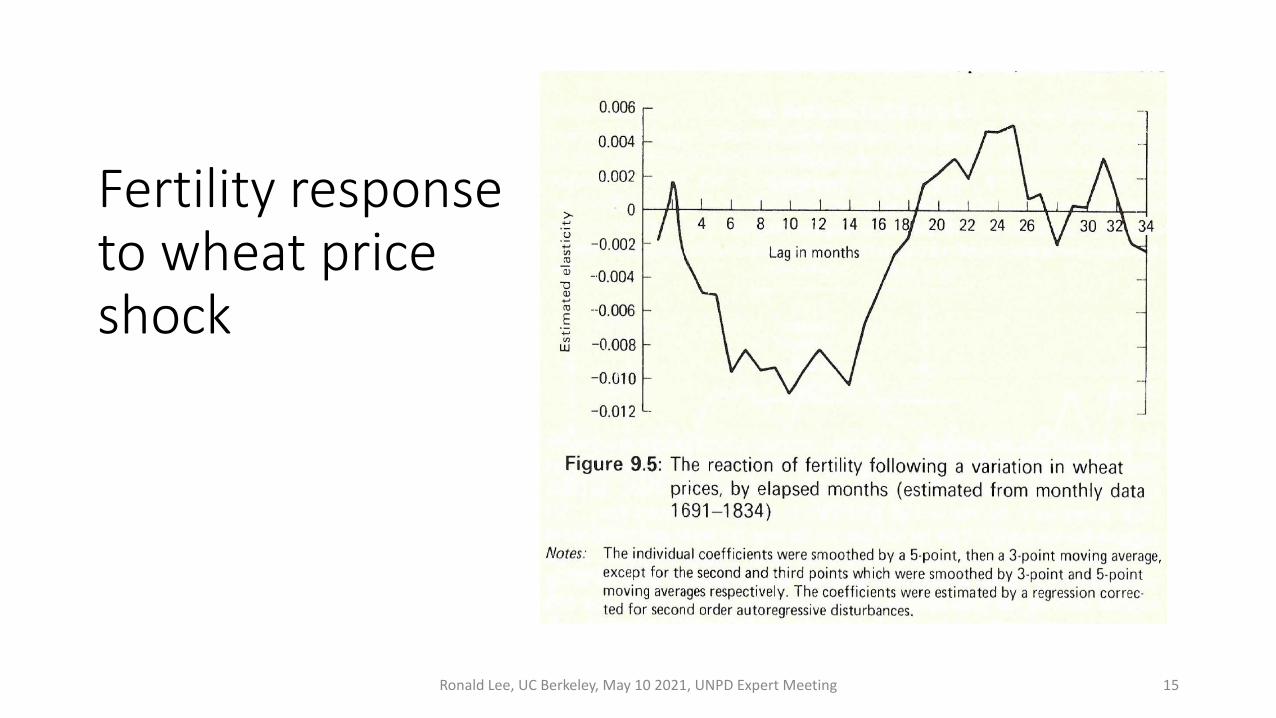
Fertility response to wheat price shock
Ronald Lee, UC Berkeley, May 10 2021, UNPD Expert Meeting 15

Response of fertility to price shock in annual harvest year data
Ronald Lee, UC Berkeley, May 10 2021, UNPD Expert Meeting 16

4. Similar estimates for other countries
Ronald Lee, UC Berkeley, May 10 2021, UNPD Expert Meeting 20

How sensitive was the response in different places? • Sum all the positive and negative coefficients to find the total net
effect.
Ronald Lee, UC Berkeley, May 10 2021, UNPD Expert Meeting 21
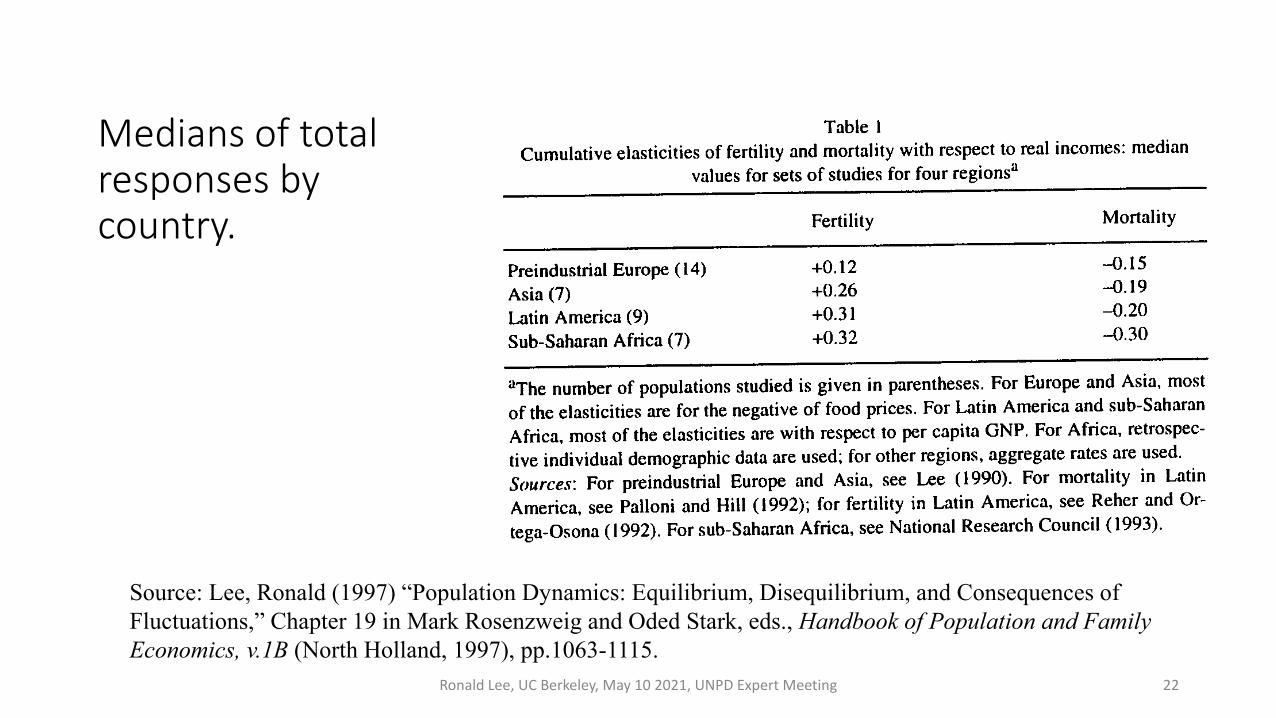
Medians of total responses by country.
Ronald Lee, UC Berkeley, May 10 2021, UNPD Expert Meeting 22
Source: Lee, Ronald (1997) “Population Dynamics: Equilibrium, Disequilibrium, and Consequences of Fluctuations,” Chapter 19 in Mark Rosenzweig and Oded Stark, eds., Handbook of Population and Family Economics, v.1B (North Holland, 1997), pp.1063-1115.

What about the timing of the response?
Median estimates*As estimated
*Divided by total
Ronald Lee, UC Berkeley, May 10 2021, UNPD Expert Meeting 23
Source: Lee, Ronald (1990) “The Demographic Response to Economic Crisis in Historical and Contemporary Populations,” Population Bulletin of the United Nations, n.20, pp. 1-15.

Ronald Lee, UC Berkeley, May 10 2021, UNPD Expert Meeting 24
1918 Influenza pandemic -- Actual series of births and deaths as ratios to average values 1915-25.
English regression coefficients
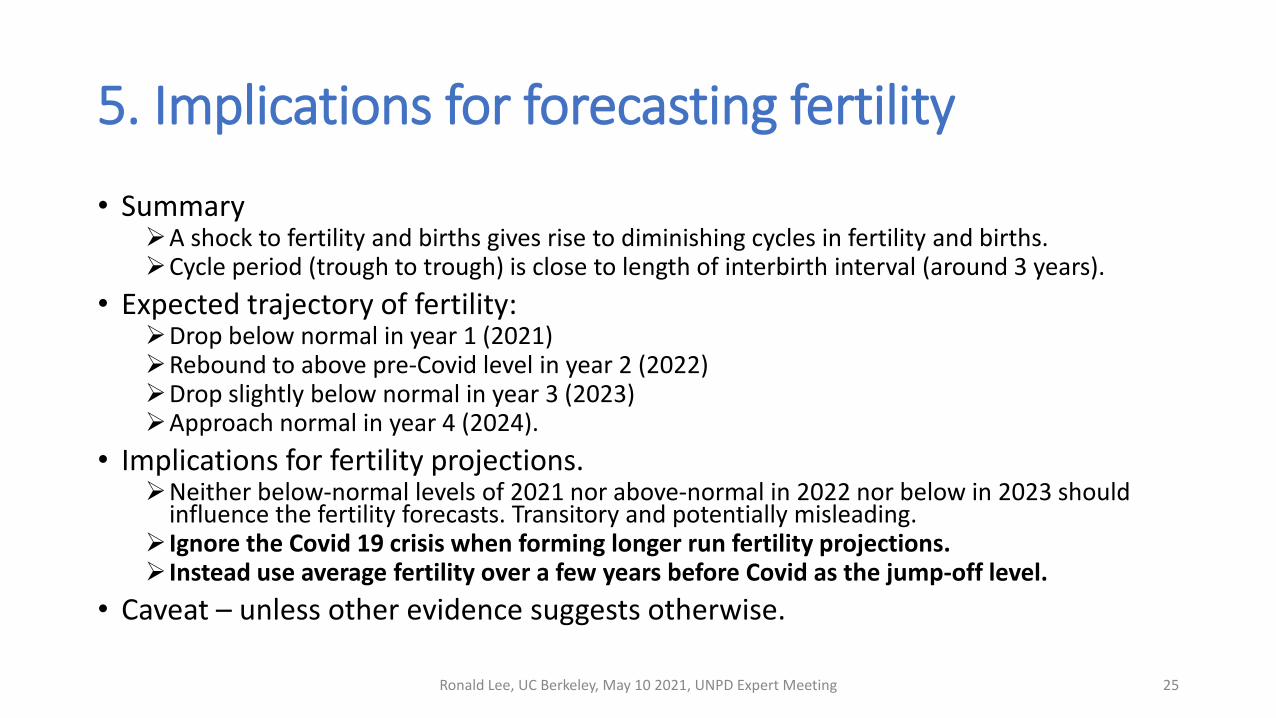
5. Implications for forecasting fertility
• SummaryA shock to fertility and births gives rise to diminishing cycles in fertility and births.Cycle period (trough to trough) is close to length of interbirth interval (around 3 years).
• Expected trajectory of fertility:Drop below normal in year 1 (2021)Rebound to above pre-Covid level in year 2 (2022) Drop slightly below normal in year 3 (2023) Approach normal in year 4 (2024).
• Implications for fertility projections.Neither below-normal levels of 2021 nor above-normal in 2022 nor below in 2023 should
influence the fertility forecasts. Transitory and potentially misleading. Ignore the Covid 19 crisis when forming longer run fertility projections. Instead use average fertility over a few years before Covid as the jump-off level.
• Caveat – unless other evidence suggests otherwise.
Ronald Lee, UC Berkeley, May 10 2021, UNPD Expert Meeting 25

END
Ronald Lee, UC Berkeley, May 10 2021, UNPD Expert Meeting 26

References• Sobotka, Tomáš, Aiva Jasilioniene, Ainhoa Alustiza Galarza, Kryštof Zeman, László Németh, and Dmitri Jdanov
(2021) “Baby bust in the wake of the COVID-19 pandemic? First results from the new STFF data series” (Version 24 March 2021) Preprint March 2021 DOI: 10.31235/osf.io/mvy62.
• Kearney, Melissa S. and Phillip B. Levine (December 17, 2020) “The coming COVID-19 baby bust: Update” Brookings series Middle Class Memos.
• Lee, Ronald (1990) “The Demographic Response to Economic Crisis in Historical and Contemporary Populations,” Population Bulletin of the United Nations, n.20, pp. 1-15.
• Lee, Ronald (1981) “Short-term variation: vital rates, prices, and weather,” Chapter 9 of E.A. Wrigley and Roger Schofield, The Population History of England 1541-1871: A Reconstruction (Edward Arnold and Harvard University, 1981).
• Lee, Ronald (1997) “Population Dynamics: Equilibrium, Disequilibrium, and Consequences of Fluctuations,” Chapter 19 in Mark Rosenzweig and Oded Stark, eds., Handbook of Population and Family Economics, v.1B (North Holland, 1997), pp.1063-1115.
• Galloway Patrick R. (1988) ”Basic Patterns in Annual Variations in Fertility, Nuptiality, Mortality, and Prices in Pre-industrial Europe”, Population Studies, 42:2, 275-303, DOI: 10.1080/0032472031000143366
Books by Sheps and Menken and by Louis Henry model the reproductive cycle and simulate exactly the kinds of diminishing oscillations that these historical studies estimate.
Ronald Lee, UC Berkeley, May 10 2021, UNPD Expert Meeting 27