an iic research report the global telecommunication...
TRANSCRIPT
AN IIC RESEARCH REPORT
THE GLOBAL TELECOMMUNICATION TRAFFIC BOOM:
A QUANTITATIVE BRIEF ON CROSS-BORDER MARKETS
AND REGULATION
AN IIC RESEARCH REPORT
THE GLOBAL TELECOMMUNICATION TRAFFIC BOOM:
A QUANTITATIVE BRIEF ON CROSS-BORDER MARKETS
AND REGULATION
by Gregory C. Staple
© International Institute of Communications and Gregory C. Staple 1990
THIS IS COPY NUMBER
DO NOT REPRODUCE
For additional copies, contact:
International Institute of Communications Tavistock House South
Tavistock Square London WC1H 9LF
Tel: 071-388-0671 Fax: 071-380-0623
Tlx: 24578 IICLDN G
TABLE OF CONTENTS
Executive Summary
I. Introduction
II. The Origin Of Today’s Bull Market
A. The supply side Iegacy of the 1980s
B. Changing sources of demand
1. Networked production
2. New media: the fax boom
III. Business Implications
A. Carriers and Market Shares
B. Cross-Border Markets and Trends
1. North America
2. Europe
3. Asia
IV. Regulatory Implications
A. Traffic Growth And The Pressures on Tariffs
B. A New Deal On International Settlements ?
Page
vi
4
6
7
7
10
13
14
19
43
43
44
47
48
51
C. Regulatory Developments To Watch:
1. The U.S.- Canada Cross-Border Market
2. Private Line Resale on Trans-Atlantic Routes
3. Competitive Carriers and Tariffs
V. Conclusion
Appendix A - Methodology and Sources
Endnotes
Page
53
54
56
59
60
62
63
ii

LIST OF TABLES
General Tables
1 The New Bull Market: Growth Of Public International Telecommunication Traffic For Major Markets (1983 - 1989)
2 The World’s Top 15 Public International Carriers (1988)
3a Growth of the World’s Top 25 Public International Carriers (1986 - 1988)
3b Market Shares of Competing U.K. And U.S. International Carriers (1986-1989)
4 Population, GNP and Telephone Lines: A Statistical Overview of The World’s Major Telecom Powers
North America
Page
5
15
16
17
20
5a The United States And Its Major 21 Telecommunication Correspondents (1988)
5b U.S. Incoming Traffic Trends: Telecom 22 Traffic To U.S. From Top 10 Countries, 1983, 1988 And 1993
5c U.S. Outgoing Traffic Trends: 23 Traffic From U.S. To Top 10 Countries, 1983, 1988 And 1993
5d U.S. Market Shares: Percentage of 24 Incoming And Outgoing Traffic To Top 10 Countries (1988)
Canada And Its Major Telecommunication Correspondents (1988)
25

Page
7
8a
8b
8c
8d
9
10
11
12
13
Mexico And Its Major Telecommunication Correspondents (1988)
Eu rop..~
The United Kingdom And Its Major
Telecommunication Correspondents (1988)
U.K. Incoming Traffic Trends: Incoming Traffic To U.K. From Top 10 Countries, 1983, 1988 And 1993
U.K. Outgoing Traffic Trends: Outgoing Traffic From U.K. To Top 10 Countries 1983, 1988 And 1993
U.K. Market Shares: ’Percentage Of Incoming and Outgoing Traffic To Top 10 Countries (1988)
France And Its Major Telecommunication Correspondents (1988)
West Germany And Its Major Telecommunication Correspondents (1988)
Italy And Its Major Telecommunication Correspondents (1988)
The Netherlands And Its Major Telecommunication Correspondents (1988)
Switzerland And Its Major Telecommunication Correspondents (1988)
26
27
28
33
34
29
30
31
32
35
iv

Asia - Pacific
14 Japan And Its Major Telecommunication Correspondents (1988)
15 Taiwan And Its Major Telecommunication Correspondents (1989)
16 South Korea And Its Major Telecommunication Correspondents (1988)
17 Australia And Its Major Telecommunication Correspondents (1988)
18 Singapore And Its Major Telecommunication Correspondents (1988)
19 Hong Kong And Its Major Telecommunication Correspondents (1988)
20 Thailand And Its Major Telecommunication Correspondents (1988)
21
22
Miscellaneous
National Trade Balances For Telecommunication Traffic (1988)
Public Tariff And Private Leased Line Costs For Trans- Atlantic Telecommunicatiori Services (March 1990)
Page
37
38
39
40
41
42
52
58

EXECUTIVE SUMMARY
The axis of power in the world is shifting from geo-politics to tele-geography. Governments are defined by the boundaries they keep; modern telecom- munication networks are global.
The remarkable growth of cross-border communication in the 1980s has made the power of telecom networks everywhere apparent. This report charts the dimensions of the current bull market for international telecommunication services. It updates the IIC’s 1989 publication: Global Telecommunication Traffic Flows and Market Structures.
At its center are comprehensive statistics on telecommunication traffic to and from 16 countries, including the United States, Canada, Mexico, the United Kingdom, Germany, France, Italy, Japan, Hong Kong, Taiwan and South Korea. Drawing upon this unique factual brief, the report appraises the business and regulatory conditions facing the international telecoms industry in the 1990s.
A principal conclusion is that the market for cross-border telecommunication has reached a crossroads. In 1990, international traffic will exceed 30 billion MiTT (Minutes of Telecommunication Traffic). Assuming only modest growth in the world’s major economies, global traffic is likely to keep on expanding at 15-20% annually.
Telecommunication has the potential, however, to play a far larger international role. In many countries, rising demand and new services are being inhibited by inflexible - regulatory and pricing arrangements. Perhaps the most pressing question facing the industry consequently is how to respond to changing market conditions without impairing the broad connectivity which has served the world so well.
In answering this challenge, the industry must also address the new trade and competition rules which national governments have begun to craft for cross-border telecommunication services. The balance between the weight given to these rules and that given to traditional concerns (universal service, modernization) will have a major impact on industry profits in the 1990s.
vi

Changing Sources Of Demand
As background to these issues, the report looks first at the origin of today’s traffic
boom and the direction of future demands.
Of prime importance is the way in which global structures of production and distribution have begun to change the market for telecommunication. In this new environment, the electronic network plays a crucial role in creating economic value and competitive advantage. This trend cuts across manufacturing and service industries.
The rise of networked relationships and the telecommunication services upon which they rely have been spurred by a new preference for market relationships. This preference, part economic and part political, is ’manifest within the private and public sectors alike, East and West. Every fall in the relative cost of computers and communications (C&C) tends to reinforce it.
The potential for cross-border telecommunication is also enhanced by new media. The telephone is going through a metamorphosis. The black bakelite chrysalis is becoming an electronic butterfly. The fax machine has begun to show us its flight path.
Facsimile, now the preferred medium for trans-Pacific business communication, has let us imagine a world where cross-border communication is not typified by 5 or 10 minutes on the telephone each day, but is part of a much longer series of continuing exchanges between multi-media electronic terminals. We are not there yet, but the market suggests that we may be well on our way by the mid-1990s.
Prospects For Markets And Carriers
The second part of the report examines the status of markets and carriers in North America, Europe and Asia at the end of the 1980s. It finds:
"* Cross-border traffic volumes grew particularly rapidly in the late 1980s, but the market continued to be highly concentrated. AT&T remains the world’s largest carrier followed by DBP Telekom of Germany. Carriers based in the G-7 countries still account for about 60% of the international services market.
** Competition has borne fruit; MCI and Cable & Wireless are now among the world’s top 20 carriers. The impact of competition has been most striking in Japan, however, where new carriers, after operating for 6 months, have a combined 15% market share.
vii

** The North American cross-border market is becoming progressively more liberalized. Of particular note is the provision of newly competitive service to Mexico and the continued expansion of traffic between the U.S. and Canada, the largest bilateral market in the world.
*" The 1988-1989 data confirm the Euro-centric traffic patterns of Germany, France and Italy in contrast to the U.K. The data also underscore the central role of Germany as a junction state for international telecommunication. 1992, German reunification and the rise of market economies in Eastern Europe therefore are likely further to advantage DBP Telekom.
** Asia-Pacific countries have, in large part, been the engine of growth for international telecom services in the late 1980s; annual increases of 30-50% have been common. Japan continues to play a decisive role and the rapid emergence of a competitive Japanese market structure is likely to have a follow-on impact beyond Pacific basin markets.
Regulatory Developments TO Watch
The weight of cross-border telecommunication traffic is driving the industry toward new regulatory arrangements on tariffs, settlements and leased lines. These issues are linked. Monopoly tariffs and rigid accounting rates (the basis upon which international carriers divide revenues), just like unreasonable restrictions on using leased lines, inhibit demand and maintain supra-competitive margins.
The 1980s bull market has placed growing pressure on these conditions. Traffic growth and new technologies (eg, fiber-optic cables) have substantially reduced the cost of cross-border service, and thus the opportunities for competition, tariff discounts and service expansion.
Current regulations, however, penalize competitive carriers which reduce their tariffs by giving their foreign correspondents a larger share of total end-to-end revenues. Trade deficits of carriers serving richer countries, which tend to make more international calls than they receive, also have been exacerbated. In 1989, for example, the United States telecom services deficit was approximately $2.5 billion.
The present situation .is inherently unstable. It invites, on the one hand, abuse of monopoly power, and on the other, price cutting and uneconomic new entry which may impair long-run industry investment. Multilateral reform of the present system of settlements and accounting rates, although preferable, is likely to be drawn-out. In the interim, national pressures for tariff and regulatory reform will increase.
ooo
VIII

The following bear watching:
*" FCC consideration of novel service and settlement arrangements in the U.S. - Canada cross-border market;
Joint Oflel-FCC approval of leased-line resale on the U.K. - U.S. route;
New discount tariff offerings in the North Atlantic and Pacific basin markets.
Conclusion
Cross-border telecommunication facilities are the oil pipelines of the modern economy. Keeping them open, widening them and ensuring broad public access at reasonable prices is essential to international prosperity. And to every country which desires to have a share in it.
The international telecom network now involves the widest spectrum of economic and social interests. That realization may be the most lasting legacy of the bull market chronicled here. It may also be the best hope for progressive stewardship of the network in the futu’re.
THE GLOBAL TELECOMMUNICATION TRAFFIC BOOM: A QUANTITATIVE BRIEF ON
CROSS-BORDER MARKETS AND REGULATION
by Gregory C. Staple1
I. Introduction
We are in the midst of a sustained bull market for international telecommunication. Boosted by 20% annual growth rates, cross-border traffic on public circuits alone will exceed 30 billion minutes in 1990, an increase of over 500% since 1980. In its wake, last decade’s business buzzwords -- globalization, interdependence -- have become this decade’s popular conventions,z
The communications boom is also redrawing the political map. The power of tele- geography is supplanting geo-politics. 1989 dramatized its international dimensions. It was a year when a fax machine could create a liberated zone; when the telephone became the popular tribune of new democracies; when television provided the world with daily reports, live via satellite, on the unfolding drama in Eastern Europe)
A working knowledge about the world’s telecommunication facilities and how they are used is essential to this new environment. The current report, the second in the IIC series on global telecom traffic flows, addresses this need. It quantifies the major streams of cross-border traffic flowing in and out of the global telephone network and discusses their significance.
Among the major questions addressed are:
-- Who are the world’s major internationaI telecommunication carriers and how much traffic do they carry? Between which countries?
-- Which carriers and markets have grown fastest in the 1980s and what are their future prospects?

-- What do telecommunication traffic trends imply about economic and regulatory linkages between nations?
-- How will the very rapid growth of traffic affect the level of international tariffs and the current regulatory regime for the settlement of accounts between interconnecting carriers?
How To Use This Report
The Global Telecommunication Traffic Boom is divided into five main sections as follows:
The next part -- Part II -- explores the sources of the international traffic boom. It discusses (a) the supply side legacy, of the 1980s (the construction of massive new international facilities, market liberalization) and; (b) the impact of new demands (networked production, facsimile) on the market for cross-border-telecom services. This part is intended to provide a historical context for succeeding sections on market trends and regulation.
Part III -- uses the report’s data base of cross-border traffic statistics to highlight business opportunities and consequences arising from the current traffic boom. There are tables on Minutes of Telecommunication Traffic (Mi’IT) to and from 16 major markets: the United States, Canada, Mexico, the United Kingdom, France, West Germany, Italy, the Netherlands, Switzerland, Japan, Hong Kong, Australia, Singapore, Republic of China (Taiwan), South Korea and Thailand.
Part III also looks at the changes among the ranks of the world’s top 25 international carriers; the rising importance of traffic in the Asia-Pacific market; and the likely impact of European integration on traffic patterns.
Part IV -- shows how the bull market for telecommunication services is pushing tariff rebalancing, accounting rate reform and the resale of international leased lines to the top of the regulatory agenda. In addition, Part IV contains a background brief on several regulatory proceedings which are likely to set the tone for further liberalization in the 1990s.
Part V -- offers concluding thoughts about the international telecommunication boom and the impact of the telecom industry’s new prominence in the global economy.
2
A Note On Further Research
The report builds upon the studies of telecommunication traffic pioneered at the IIC in 1988 - 1989.4 By compiling and analyzing standard statistics on telecom traffic, this school of work seeks to fill a gap in industry analysis, now heavily dependent upon revenue and facilities data. The llC’s work ~irgues for giving new attention to "the weight of traffic" in shaping industry and regulatory agendas.
Traffic analysis should not be seen as preclus_ive of other methodologies; data on industry costs, capacity and earnings generally has a greater value when it is paired with data on traffic. That is why such basic consumption data is widely used in other international industries (air travel, financial services, energy). Basic data on the demand for telecommunication traffic promises to be of equal value.
Our message accordingly is: Follow the traffic. Listen to what it is saying about the industry and the economy, or would, if unreasonable supply or price constraints did not exist.
As economies become ever more telecom intensive, the public interest is likely to require a new informational balance regarding the publication of telecom traffic statistics. We, have previously suggested that a priority be given to publication of MiTT statistics on: (1) domestic public voice-grade circuits; (2) international public voice-grade circuits; and (3) international private lines.
Publication of such statistics would have substantial benefits. The business and regulatory briefs contained in Parts III and IV offer some examples. Further, as demonstrated in our earlier work, MiTT statistics have the ability to serve as a new macro-economic indicator and planning tool.s In addition, close analysis of MiTlr patterns can help to make visible the complex ethnic, social and cultural linkages between countries which shape and, in turn, are shaped by today’s global telecommunication order.
The analysis of cross-border telecommunication traffic here is thus but one of many areas in which traffic analysis may bear fruit.6
3

II. The Origins Of Today’s Bull Market
The sustained growth of demand for international telecom services since 1987 is unprecedented, even in an industry which has grown accustomed to double digit growth rates. At least two factors distinguish the current bull market.
First, today’s boom appears to be much broader than the last market expansion (approximately 1976 - 1982). This time the volume of cross-border traffic has been swelled jointly by demand from European, North American and Asian markets.
Indeed, in significant part, the current bull market reflects the sustained rise in international demand in the Asia-Pacific basin throughout the 1980s. This surge of new demand, with year-on-year traffic growth of 30-40%, has primed demand in North American and European markets. International carriers based in these markets saw slackening growth in the mid-1980s but, since at least 1987, have seen annual traffic growth rise to 15-20% or more. See Table 1.
Second, since the early 1980s, the global traffic base has increased 400-500%. Absolute traffic volumes being handled by carriers today are thus very large by historical standards. In the U.S., for example, outbound traffic is expected to continue growing at about 20% in 1990, or over 1,200 million more MiTF annually. In absolute terms, this is equivalent to a doubling of 1980 outbound international traffic every yeart
The vast majority of cross-border traffic is carried on public voice circuits. However, a significant proportion -- perhaps 10 -15% depending upon the route -- transits private or leased lines. Traffic on these circuits is primarily intra-corporate voice and data traffic; a small volume is also generated by Value Added Networks (VANs).
The VAN and International VAN (I-VAN) market has yet to experience a substantial take-off. A recent industry report estimated that 1988 revenues for VAN services (domestic and international) were only $574 million for U.S. based service providers. (U.S. companies probably have 30-40% of global VAN revenues.) Further, the report estimated only 10% annual revenue growth through 1993. These facts suggest both how important future bilateral agreements to facilitate I-VAN services may be to the fortunes of this new industry and the continuing dominance of public voice circuit traffic in the 1990s.7

40-
35-
30-
2
Table 1
THE NEW BULL MARKET: Annual Growth Rates For Outgoing International Mi’I-F*
Avg. Country 1980-86 1987 1988 1989
United States 19.0% 18.1% 20.0% 20.0%,
U.K. 12.3% 14.0% 15.0% 17.0%
Japan 22.8% 31.5% 34,5% 38.0%
W. Germany 11.6% 10.0% 16.6% 18.0%
France - - 19.3% 18.7% 14.5%
United States U.K. Japan W. Germany France
987 ~ 1988 ~ 1989
© International Institute of Communications 1990 All Rights Reserved

A. The supply side legacy of the 1980s
The origins of today’s bull market can be found in the bull market of the late 1970s; it led to a vast expansion of international capacity. Much of the new ~:apacity was (and is) largely invisible, involving the addition of incremental cross-border terrestrial links, regional undersea cable and international switching facilities. But, on the inter- continental scale, there were two signal developments.
The first was the launch of the Intelsat V (1980) and V-A (1985) satellite series (with capacities of 12,000 and 15,000 voice circuits respectively.) Intelsat also committed itself to build and launch the Intelsat VI series, beginning in 1989, with a nominal capacity of 24,000 voice circuits or up to 120,000 voice paths using voice multiplexing equipment.
Second, the 1980s saw the authorization of two competing sets of trans-oceanic cables. One set was owned largely by established carriers, primarily AT&T and national Post, Telephone and Telegraph (PTT) authorities (TAT-8 for the Atlantic; TPC-3 for the Pacific). The other set was owned privately, although common carriers and PTTs also have ownership interests in these cables (P-TAT for the Atlantic; North Pacific Cable (NPC) for the Pacific).
These new cables, all employing fibre optic technologies, added enormous new capacity to the market (TAT - 8, operational in 1988, has a capacity of about 37,000 voice paths; P-TAT, operational in 1989, provides over 60,000 voice paths).
The unprecedented capacity of these new systems reordered carrier and user priorities. Supply concerns receded from view; the busi:ness and regulatory agenda became demand-driven. The principle issues accordingly came to revolve around matters of network access.
Questions of circuit liberalization, interconnection, and facilities resale began to gain regulatory attention as the market sought to make effective use of burgeoning capacity. The new lobby of value-added service providers, for whom telecom circuits are an essential means of market access, also pushed these issues forward on the regulatory agenda.
Industry debates in the 1990 - 1995 period thus are, with some notable exceptions, likely to move beyond the questions of liberalization that preoccupied the 1980s. There is now substantial agreement that liberal interconnection to the network by value-added service providers is in the public interest. Future objections are more likely to focus on procedure (place, time) rather than substance.

In view of these developments, in the 1990s the international regulatory agenda may begin to focus on the pr!ce of network access. And on competition for basic services. This is especially true, as discussed below (See Section IV.), so long as the gap between service costs and tariffs remains substantially above the norm for domestic services.
This issue is discussed further in Part IV.
B. Changing Sources Of Demand
Rising demand for international telecom services is chiefly driven by basic economic factors. Of key importance are continuing rises in: per capita income; the installed base of telephones; the volume of trade and investment flows between countries; growth in international tourism and (slowly) declining tariff levels.
These fundamental factors -- economic growth and the addition of new access lines -- will continue to boost the demand for cross-border telecom traffic in the 1990s. (One need only look to the new markets in the Asia-Pacific to see what a difference one decade can make.) For these reasons, fluctuations in the general business cycle in countries which originate significant traffic streams will also have a decided effect upon future demand.
Most traffic forecasting models already take into account the foregoing factors, and we do not seek to fine-tune them here.8 Rather our interest is in speculating briefly about emerging influences on the demand for international telecommunication services in the 1990s.
Were there factors that led the market to become substantially more bullish during the last few years? If so, what are they? And what are the implications of these new demands for the future? We concentrate here on: (a) networked production; and (b) new media (eg, facsimile).
1. Networked Production
During the 1980s, as national economies become more telecom intensive, the organization of production and markets began to change. These changes, in turn, tended to build up new demands for telecommunication services.
Networked relationships typify the emerging structure of economic organization. In this new environment, it is the network, rather than particular capital or labor inputs, which is crucial in creating economic value and competitive advantage. This trend -- part reflection, part driver of globalization -- can be observed in both service

and manufacturing industries.
In the networked economy (a concept developed most fully by Albert Bressand and colleagues at Promethde in_Paris), factory and market are no longer primarily physical locales, but a set of electronic networks? Witness the financial sector. The 24-hour global market for foreign exchange (FX) and government securities is now an inescapable fact for every central banker and corporate treasurer. The trading of securities has likewise moved from the floor of a handful of city-specific stock exchanges to tens of thousands of dispersed brokerage screens which, in turn, are linked by telephone to millions of retail clients.
Less well understood, perhaps because less visible, is the role which networked intelligence is having on other businesses. It can be seen, however, in the new ubiquity of on-line computer and communication services in the chain of production and distribution. A purchase may involve a new car or a concert ticket; ordering clothes from a mail-order catalog or arranging over-night delivery of a package; choosing a health insurance policy or an air ticket. But, the electronic linkage of widely separated sales offices, order processors, data-bases, product designers, assembly sites, sub- contractors, shippers, finance agencies, professional advisers and company executives may be strikingly similar.1°
Ne~;works And Markets
The new information technologies, computers and communications (C&C), which have fostered the rise of the networked economy also favor market forms of economic organization in place of hierarchies for managing production and distribution)1 There are several reasons why C&C makes markets comparatively more efficient.
First, the planned introduction of C&C generally reduces the transactions costs of coordination in information intensive areas (eg, contracting, budgeting, accounting). Second, as the costs of coordination decrease, the economic advantages of markets or quasi-markets (over bureaucratic or command forms of resource allocation) tend to increase.
For example, so long as the search and contracting costs are relatively low, it is generally advantageous for a company to seek a competitive bid for a loan or for sub- contracting work or an insurance policy. Computer-based markets for these services, linking potential buyers and sellers via telephone lines and desk-top terminals, can in many cases keep the search and contracting costs competitive. This is especially so if the buyer’s alternative is to make a sufficient investment of staff time and company resources to ensure that like services are available in-house or from "captive" suppliers.

As C&C costs fall, therefore, various kinds of electronic markets and networks for Electronic Data Interchange (EDI) have begun to proliferate. A widening number of firms have also begun to use their core business (banking, air travel, insurance) to become electronic market makers for other industry participants; other firms have seen the advantages from providing interconnections to these new electronic nets. In each case, telecommunication circuits provide the umbilical cords to tie the networks together.
Networked Traffic
The rise of the networked economy and the attractiveness of market forms of coordination to industry is not easy to quantify at the international level. But, the size and scope of the demand for cross-border telecommunication services in the late 1980s tends to support the observations of the business analysts discussed above.
First, in the late 1980s, most large carriers experienced a demand for cross-border private lines, the medium of choice for business networks, which was equal to or greater than the growth rate for basic international voice service. Further, in most industrialized countries, the growth of domestic private lines was substantially higher than average growth rates for domestic voice traffic as a whole.
Second, as documented below, the late 1980s saw exceptional growth in bilateral flows to and from the G-7 countries which in 1985 already accounted for approximately 60% of cross-border telecommunication traffic. This pattern is consistent with the economic trends described above; new electronic networks have developed first primarily in the wealthiest countries which have invested most heavily in C&C facilities. The continuing growth in the demand for public cross-border telecommunications services in the G-7 also confirms one of the key findings of our earlier work; rapid market growth is possible even from a high base.
In sum, the growth of cross-border electronic networks is likely to broaden and deepen the international telecoms market as a whole, even as its various parts become more specialized.

2. New Media: The Fax Boom
Today’s international telecoms boom is also being stimulated by new media, of which facsimile or "fax" is by far the most important. Electronic mail has also played a role and is likely to become more significant by mid-decade as standard protocols are adopted for interconnecting different systems across national borders.
Fax traffic is of special interest, however. Its impact on the international services market has been dramatic. In 1990, fax messages will probably account for the majority of new cross-border traffic on many routes. This is especially so on trans- Pacific routes where differences in language and the limited overlap of working hours give this medium distinct advantages over Plain Old Telephone Service (POTS). As such, the current fax boom may be a valuable talisman of future media trends.
The Electronic Butterfly
The telephone is going through a metamorphosis. The black bakelite chrysalis is becoming an electronic butterfly. But What kind of a butterfly will it be? Where will it fly? And how will it affect network traffic patterns? Could it be that fax has given us a glimpse of what lies ahead?
If so, current traffic volumes, large as they are by comparison with the early 1980s, may quickly be eclipsed by the day-to-day cross-border traffic from networks of multi- media terminals. Just over the horizon may be a world where millions of people routinely pass photos, drawings, work-station displays and other kinds of electronically stored documents through cross-border telecom circuits -- all with no more effort than dropping a letter into a mail box.
We are not there yet, and won’t be until the mid-1990s (the advertised presence of ISDN (Integrated Services Digital Network) capabilities notwithstanding). But, from a traffic standpoint, the fax is almost certainly pointing the way. That way lies somewhere along a path in which the "telephone" terminal is used, on average, 10 to 20 minutes a day, to a world more like that of the television, which is "on" 4 or more hours a day in many countries.
In this context, the biggest question which the telecoms industry faces is how long the average "telephone" terminal will be "on" in the year 2000. And how many terminals will there be? If we are right in suggesting that fax is really only an evolutionary technology then the impact on future international traffic volumes may be far larger than commonly forecast.
10

We offer the following anecdotal evidence for the rather bullish view presented above.
It’s A F, ax World
The current and projected base of fax machines (in millions) in selected countries is as follows:
United States
1987 1988 1989 1993
.7 1.4 2.5 8.5
European Community .5 .9 1.7 7.0
Japan .8 1.9 3.1 9.5
Sources: Fax Focus, Tsushin Kikai Kogyoukai, Dataquest, Industry interviews
The data in the foregoing table is approximate and is probably conservative. Data on equipment sales vary significantly and are hard to reconcile with manufacturing output (eg, Japanese manufacturers report production of 4.7 million fax terminals in the fiscal year to March 1989, a 26% increase on the prior year’s output). Growing sales of "fax boards" for personal computers further complicates the calculation of aggregate figures. The advent of multi-task ISDN terminals with fax capabilities will only add to the problem.
What is important for the present report is the rough order of magnitude of the installed base of fax machines in each country in relation to (a) the installed base of telephones; and (b) traffic volumes. Making these comparisons suggests the following.
At the end of 1989 the base of fax machines was less than 5% of the telephone base in most countries and perhaps 6-7% in Japan. (See Table 4). On average, industry surveys suggest that fax machines send about 10-15 pages a day; transmission time, about 2.5 - 4 minutes. On these figures, the total traffic volume generated by fax is quite small in comparison to the traffic generated by the installed base of telephones which, in most industrialized countries are used, on average, at least 15 minutes a day.
In view of the foregoing, the fact that KDD and other major trans-Pacific carriers report that 50.-6t3% of their international traffic is now fax traffic is truly striking. suggests that fax is increasingly preferred to the telephone (and telex) for inter-
It

continental communication. In fact, if the present evidence is substantiated over time, it would probably pay international carriers to underwrite the sale of fax machines in large volumes (eg, with cheap credit or service rebates) to prime international customers.
In Japan’s case, for example, it appears that in 1989, about 3 million fax machines generated as much international traffic as 49 million telephones. Partial evidence from other countries in the region suggests Japan’s experience is not unique.
The number of fax machines in Singapore doubled in the year to March, 1989; total outbound traffic increased 42%. In Hong Kong, outgoing traffic on dedicated fax lines alone doubled from March, 1987 to March, 1988 and grew by 50% again to March, 1989; total outbound traffic from Hong Kong in this period grew by 39%. Unfortunately, the overall mix of outgoing fax and voice traffic for these locations is unavailable.
It may be too early to draw conclusions. But, the trend seems clear; fax machines and their progeny may be the most exciting prospect for the international telecommunication industry since satellites. This augurs well for international revenues and, as a result, is likely to further fuel the present debate about regulatory boundaries and competition.
Is international facsimile service a basic (reserved) service or a value added service (subject to competition)? What about a service (facility) which stores and forwards faxes? What about a service which carries the traffic from multi-function terminals with voice and fax capabilities?
12

III. Business Implications
The previous section looked at the origins of today’s international traffic boom and the new potential for cross-border telecommunication in the 1990s. This section draws upon a unique 16 country survey of cross-border traffic statistics to examine which carriers and markets are likely to lead the way forward in the next five years.
The analysis builds upon the 1986-1987 traffic data in the IIC’s 1989 report.~2 Those statistics showed, among other things, that:
** The market for international telecommunication is highly concentrated; 5 carriers -- AT&T, Deutsche Bundespost, British Telecom, France Telecom, and Telecom Canada -- account for approximately 50% of outgoing traffic; 10 carriers account for almost 70% of outgoing traffic.
** North America is a primary target for telecom service providers because it has by far the largest base of telephones (approximately 135 million access lines, excluding Mexico) and these telephones are used more, on average, than telephones in most other countries (the volume of MiTT per access line is 2 or 3 times European and Japanese norms);
** U.S. international markets are moving West. And South. In the 1990s, we advised that Taiwan, South Korea and the Dominican Republic, for example, would be more important than France and Italy for some U.S. based service providers.
** The U.K. international market also looks West (in 1986, 25% of outbound traffic went to the U.S.) and to the Far East (Hong Kong and Japan). By contrast, the international markets of Germany, France and Italy are Euro-centric (in 1986 outbound traffic to the U.S. averaged only about 7%). As yet, the impact of 1992 on these traffic patterns remains unclear.
** Japan’s international telecom providers look first to the Asian market (principally the "Four Tigers": Hong Kong, Singapore, South Korea, Taiwan) and then to the U.S. (accounting for about 25% of Japanese outbound traffic in 1986). We therefore advised that Japan’s overseas carriers were likely to focus their attention on Asia’s fast-growing economies and on Europe which, as a result of growing tourism and inward investment, seems likely to experience more rapid growth in the 1990s.
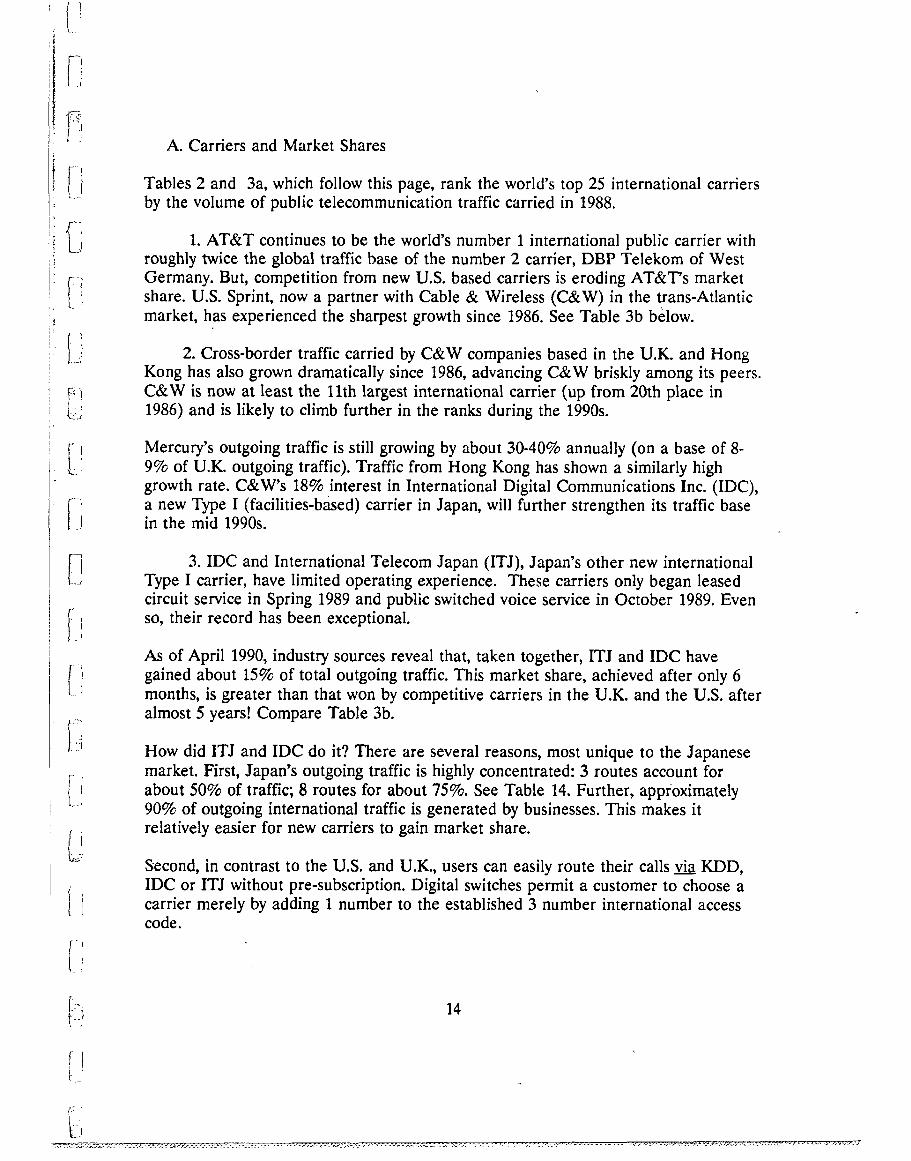
A. Carriers and Market Shares
Tables 2 and 3a, which follow this page, rank the world’s top 25 international carriers by the volume of public telecommunication traffic carried in 1988.
1. AT&T continues to be the world’s number 1 international public carrier with roughly twice the global traffic base of the number 2 carrier, DBP Telekom of West Germany. But, competition from new U.S. based carriers is eroding AT&T’s market share. U.S. Sprint, now a partner with Cable & Wireless (C&W) in the trans-Atlantic market, has experienced the sharpest growth since 1986. See Table 3b b~low.
2. Cross-border traffic carried by C&W companies based in the U.K. and Hong Kong has also grown dramatically since 1986, advancing C&W briskly among its peers. C&W is now at least the 11th largest international carrier (up from 20th place in 1986) and is likely to climb further in the ranks during the 1990s.
Mercury’s outgoing traffic is still growing by about 30-40% annually (on a base of 8- 9% of U.K. outgoing traffic). Traffic from Hong Kong has shown a similarly high growth rate. C&W’s 18% interest in International Digital Communications Inc. (IDC), a new Type I (facilities-based) carrier in Japan, will further strengthen its traffic base in the mid 1990s.
3. IDC and International Telecom Japan (ITJ), Japan’s other new international Type I carrier, have limited operating experience. These carriers only began leased circuit service in Spring 1989 and public switched voice service in October 1989. Even so, their record has been exceptional.
As of April 1990, industry sources reveal that, taken together, ITJ and IDC have gained about 15% of total outgoing traffic. This market share, achieved after only 6 months, is greater than that won by competitive carriers in the U.K. and the U.S. after almost 5 years! Compare Table 3b.
How did ITJ and IDC do it? There are several reasons, most unique to the Japanese market. First, Japan’s outgoing traffic is highly concentrated: 3 routes account for about 50% of traffic; 8 routes for about 75%. See Table 14. Further, appioximately 90% of outgoing international traffic is generated by businesses. This makes it relatively easier for new carriers to gain market share.
Second, in contrast to the U.S. and U.K., users can easily route their calls via KDD, IDC or ITJ without pre-subscription. Digital switches permit a customer to choose a carrier merely by adding 1 number to the established 3 number international access code.

Table 2
THE WORLD’S TOP 15 PUBLIC INTERNATIONAL CARRIERS
AT&T"
DBP Telekom"
British Telecom"
France Telecom"
Telecom Canada"
Swiss
Italcable/ASST"
Netherlands PTT"
Belgian PTT"
KDD"
Cable & Wireless"
Saudi Com. Min.-
PTT.t ~, ,, 0 500 1000 1500 2000 2500 3000 3500 4000 4500 5000
Outgoing M~TT (in Millions)
Note: MiT-I’is l~/P/u/es of Telecommun/catk~n Tratfic. Data are for ~ten~at/onalpubl/~ voice circuits on/y for 1988 except for BT, C&l~, KDD, and OTC,, where data am for I.<~&8~ Gsca] yoar.
© International Institute of Communications 1990 All Rights Reserved

Table 3a
GROWTH OF THE WORLD’S TOP 25 PUBLIC
INTERNATIONAL CARRIERS (1986 - 1989)
Rank Carrier Country
1988 1986 Outgoing Outgoing Growth MFI’F in MFI-I" in 1986- Millions Millions 1988
1 AT&T United States 4778 3833 24.7% 2 DBP Telekom W. Germany 2479 1977 25.4% 3 British Telecom United Kingdom 1654 1310 26.3% 4 France Telecom France 1570 1095 43.4% 5 Telecom Canada* Canada 1054 941 12.0%
6 Swiss PTI" Switzerland 1014 802 26.4% 7 Italcable/ASST Italy 785 609 28.9% 8 Netherlands P’I-~" Netherlands 706 575 22.8% 9 Belgian P’l-r" Belgium 561 452 24.1% 10 KDD Japan 529 319 65.8%
11 Cable & Wireless* United Kingdom 516 204 152.9% 12 Saudi Com. Min. Saudi Arabia 510 .... 13 Televerket Sweden 485 381 27, 3% 14 OTC Australia 415 239 73.6% 15 Austrian P’l-r Austria 401 321 24.9%
16 Teleglobe Canada Canada 358 223 60.5% 17 Telefonica Spain 330 .... 18 Danis[n P’I-I" Denmark 296 241 22.8% 19 MCI United States 262 163 60,7% 20 Nor. Telecom Auth. Norway 246 204 20.6%
21 DGT, Mexico Mexico 211 .... 22 China, PR - PI-I" PRC 190 .... 23 Hellenic Telecom Greece 179 152 17.8% 24 DGT Taiwan (R.O.C,) 162 .... 25 UAE Com. Ministry United Arab Emir, 155 120 29.2%
© International Institute of Communications 1990 All Rights Reserved

Table 3b
Market Share of Competing U.K. and U.S. International Carriers: Percent of Outgoing Voice Circuit Mi’l-I" (1986-1989)
Urlited_States AT&T MCI US Sprint
1986 94.3 4.0 1.6 1987 93.0 4,7 2,3 1988 89.1 7.0 3,5 1989* 85.5 9.0 5.0
BT Mercury
1986/87 (FY) 99.8 0.2 1987/88 (FY) 98.5 1.5 1988/89 (FY) 95.5 4.5 1989/90 (FY)* 91.0 9.0
~ources: US: 1986-1988 FCC; 1989 Industry Sources.
UK: Oftel and Industry Sources. *E~>~n~t~d market
© International Institute of Communications 1990 AI] Rights Reserved

Third, ITJ and IDC are, in large measure, user-owned companies. The numerous corporate investors in these companies provided IDC and ITJ with a substantial customer base, in effect giving them a jump-start in the market. This advantage, coupled with the aggressive use of commission agents, allowed the companies to rapidly win a solid base of big and small-business customers alike.
What will happen next? The international telecom market in Japan is now the most competitive in the world. And it ig likely to remain so. Japan’s international carriers are all stand-alone companies; their pricing strategies are not constrained by domestic service costs.
KDD’s market share may well fall to 65% or below before it stabilizes, despite the fact that KDD has begun to match its competitors’ prices. (Since 1988, KDD has lowered its voice tariffs three times (21.8% in September 1988; 16% in November 1989; and 7% in April 1990)). This has made public telephone tariffs from Japan to many points in Europe and to the United States equal to or lower than the in-bound tariffs.
The unexpectedly strong price competition among Japanese carriers is likely to have significant spill-over effects on traffic and tariffs in other markets. Could Japan’s carriers become the driving wedge of global competition in the 1990s? We comment further on this in Part IV’. C.
4. Carriers to watch: Just below the top 25 carriers in Table 3a are those from Singapore, Brazil, South Korea, Indonesia and the Philippines. (Note: Singapore does not appear in Table 3a because official statistics do not include cross-border traffic to Malaysia. See Table 18.) These carriers are all growing rapidly and in the 1990s are likely-to have traffic bases in excess of the smaller European states now in the top 25.
And what of the U.S.S.R.? It has approximately 35 million telephone exchange lines, but generates less international traffic than many carriers with less than 3 million lines. A major reason is the very limited number of dedicated international circuits. New international exchanges proposed for the early 1990s will help to ease this bottleneck. So may two major cross-border fibre-optic cables: the proposed Trans- Soviet Line (TSL) to Japan and the Central Strecke to Germany. Hence, as the Soviet Union becomes integrated with market economies East and West, the growth in cross- border traffic volumes for the USSR will bear close watching.

B. Cross-Border Markets And Trends
Table 4 provides a statistical overview (population, GNP, telephone lines.p~ capita) of the world’s major telecom powers. Tables 5 - 20 summarize the Volume of incoming and outgoing voice circuit traffic for 16 countries in three major regions: North America, Europe and Asia.
To facilitate review, the tables are presented together, beginning on the following page. Our analysis begins again on page 43 with the North American market.
19

Table 4
The Economies of the World’s Major Telecom Powers: A Statistical Overview
Country
(1) (2) (3) (4) Estimated 1987 1987
1988 1987 $ Main Main Pop. GNP per Lines Lines (Mill.) Capita (Mill.) Per 1000
(s) (6) 1988
Outgoing Outgoing MITT’* M~-i-T’* Per (Mill.) 1000 Pop.
Unffed St=es 246.3 18560 126.7 520 5379 21839 Canada 26.0 15160 13.4 524 1414 52923 Mexico 82.7 1820 4.1 50 2]] 2938
We~ Germany 61.2 14480 27.6 451 2479 40507 France 55.9 12790 24.5 440 1570 28086 Italy 57.4 10360 19.1 333 785 13676 United Kingdom 57.1 10430 23.3 409 1778 31138 N~herlands 14.8 13350 6.2 425 706 47703
Japan 122.4 ] 5760 49,2 403 529 4332 Taiwan 20.3 5075 5.1 262 123 6059 South Korea 42.0 2690 8.8 209 118 2810 Singapore 2,7 7940 0.9 340 152 56296 Hong Kong 5.6 8260 2.0 360 441 78750 Thailand 54.5 840 0.9 17 43 780 Australia 16.5 ] 1 ] 50 7.1 436 415 25152
© International Institute of Communications 1990 All Rights Reserved
2O
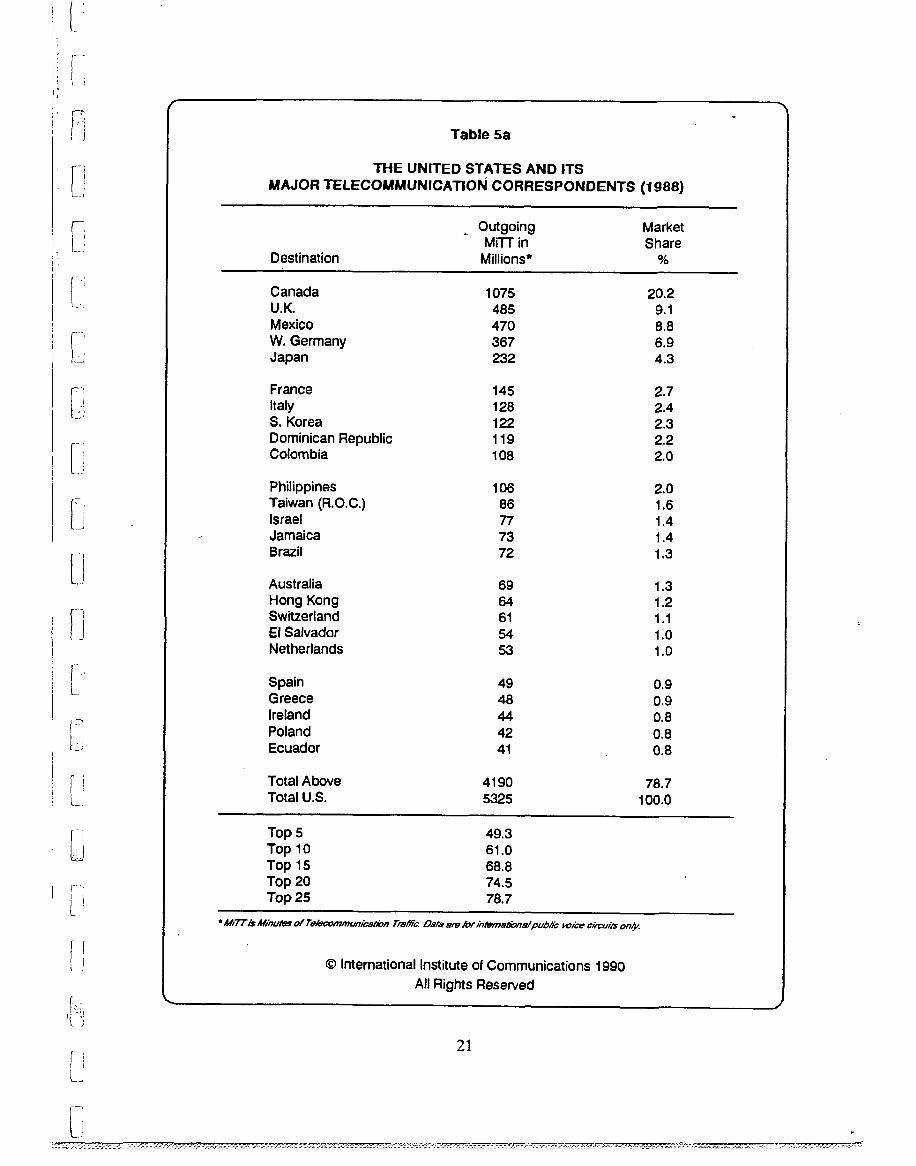
Table 5a
THE UNITED STATES AND ITS
MAJOR TELECOMMUNICATION CORRESPONDENTS (1988)
Destination
Outgoing Market M~-I-I" in Share
Millions* %
Canada 1075 20.2 U.K. 485 9.1 Mexico 470 8.8 W. Germany 367 6.9 Japan 232 4.3
France 145 2.7 Italy 128 2.4 S. Korea 122 2.3 Dominican Republic 119 2.2 Colombia 108 2.0
Philippines 106 2.0 Taiwan (R.O.C.) 86 1.6 Israel 77 1.4 Jamaica 73 1.4 Brazil 72 1.3
Australia 69 1.3 Hong Kong 64 1.2 Switzerland 61 1.1 El Salvador 54 1.0 Netherlands 53 1.0
Spain 49 0.9 Greece 48 0.9 Ireland 44 0.8 Poland 42 0.8. Ecuador 41 0.8
Total Above 4190 78.7 Total U.S. 5325 100.0
Top 5 49.3 Top 10 61.0 Top 15 68.8 Top 20 74.5 Top 25 78.7
* t1,,//77"i$ tl~/huta$ of TR/ec~:~nmun/P.a~n Traffic. Data Rr~ lot/’r//~r/a~:~nalpubh’c vo/~’e circuits
© International Institute of Communications 1990 All Rights Reserved

800-
700 -
600-
500-
400-
300-
200-
100-
Table 5b
U.S. INCOMING TRAFFIC TRENDS: Incoming traffic from the top ten countries (excluding Canada and Mexico)
UK GE JA FR IT AU HK SZ NE BR
L~ 1983~ 1988~-~ 1993
The Country Code:
UK = United Kingdom
FR = France
HK = Hong Kong
BR = Brazil
GE = West Germany
IT = Italy
SZ = Switzerland
JA = Japan
AU = Australia
NE = Netherlands
for in/en~onalpubli¢ voice circuits only for ~II
© International Institute of Communications 1990 All Rights Reserved
22
1200-
1000-
600-
400-
200-
0
Table 5c
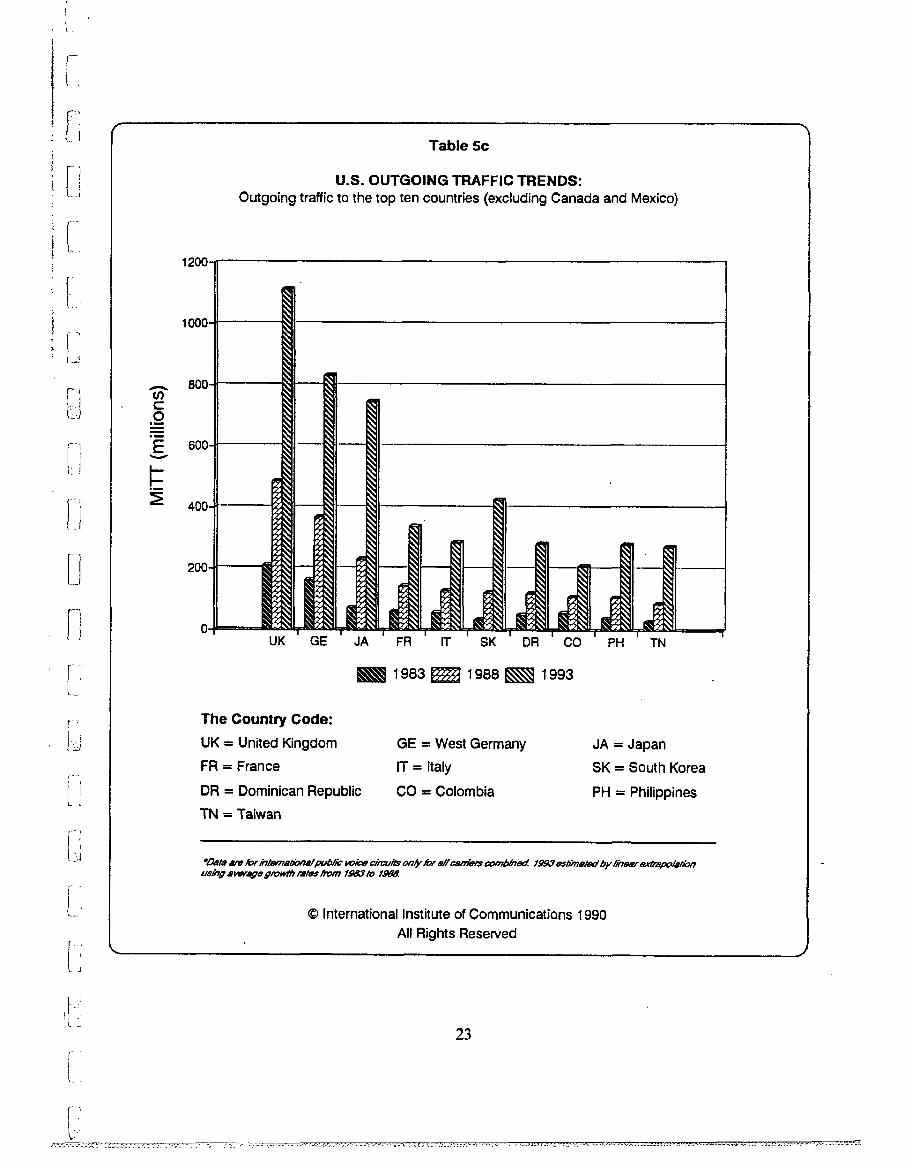
U.S. OUTGOING TRAFFIC TRENDS: Outgoing traffic to the top ten countries (excluding Canada and Mexico)
UK GE JA FR IT SK DR CO PH TN
983~ 1988~ 1993
The Country Code:
UK = United Kingdom
FR = France
DR = Dominican Republic
TN = Taiwan
GE = West Germany
IT = Italy
CO = Colombia
JA = Japan
SK = South Korea
PH -- Philippines
*Z2a~ are for/n/enz~#ona/publ/c vo/~e circuits on/y us~n~ ~vorage ~rowlh tales/rom 1~ /o
© International Institute of Communications 1990 All Rights Reserved
23

Table 5d
U.S. MARKET SHARES: Percentage of Incoming and Outgoing Traffic to the Top 10 Countries (1988)
United Kingdom (12.6%
Canada (35.2%)-
,y (6.4%)
(4.3%) (3,4%)
(2.0%) lia (2.0%) Kong (1.6%)
(1.4%)
-Other (26,0%)
Incoming MR’i"
United Kingdom
Mexico (8.8%
Germany (6.9%) (4.4%)
(2~7%)
Rep. (2.2%) a (2.0%)
Canada
Outgoing M =-i’1"
Other (38.9%)
NOTE." Data based on M/hutas of Teleoomrnunication Traffic (M/T0 for inlemafonalpublic voice circuits on~.
© International Institute of Communications 1990
All Rights Reserved
24
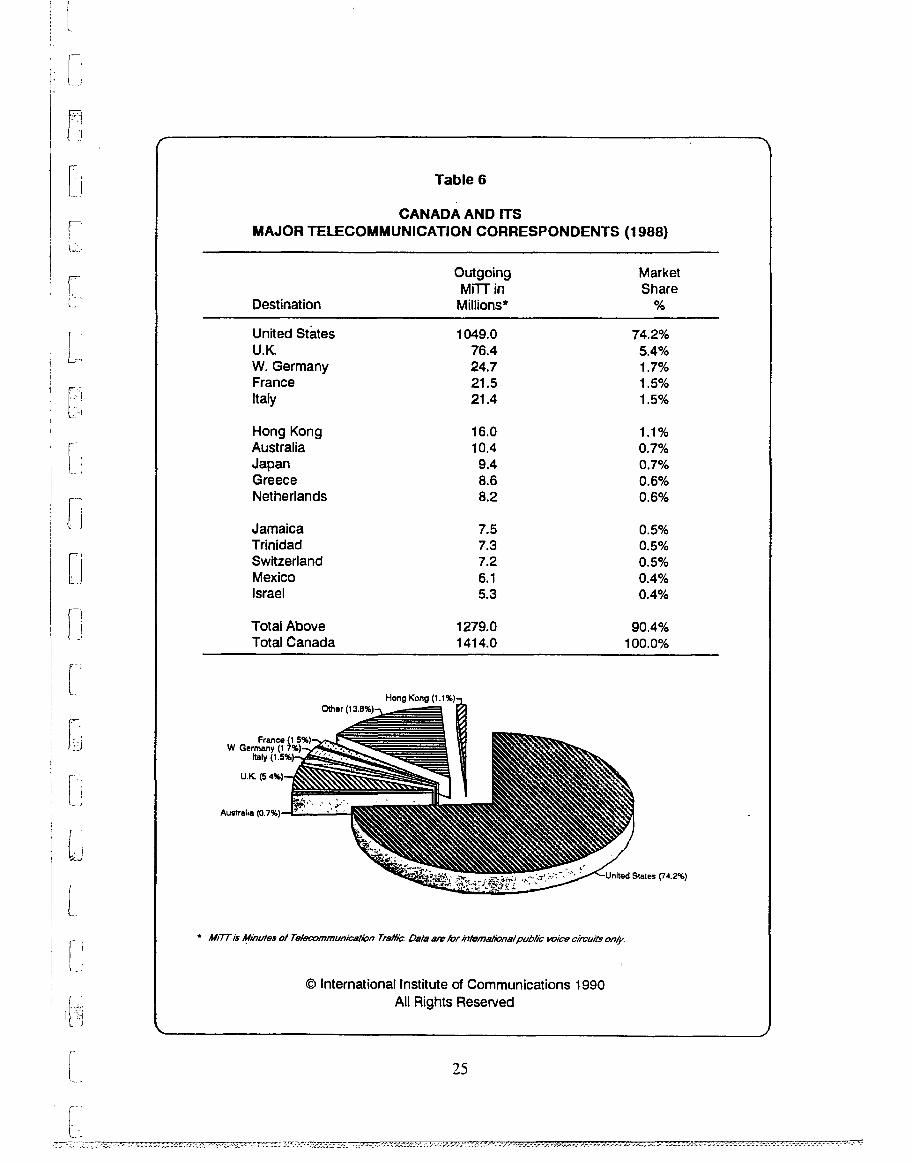
Table 6
CANADA AND ITS MAJOR TELECOMMUNICATION CORRESPONDENTS (1988)
Destination
Outgoing Market MFrT in Share
Millions* %
United states 1049.0 74.2% U.K. 76.4 5.4% W. Germany 24.7 1.7% France 21.5 1.5% Italy 21.4 1.5%
Hong Kong 16.0 1.1% Australia 10.4 0.7% Japan 9.4 0.7% Greece 8.6 0.6% Netherlands 8.2 0.6%
Jamaica 7.5 0.5% Trinidad 7.3 0.5% Switzerland 7.2 0,5% Mexico 6,1 0.4% Israel 5.3 0.4%
Total Above 1279.0 90.4% Total Canada 1414.0 100.0%
W Germar~y (1 Italy
(3ther (1
Hong Kong (1.1%)-
~Unitad States (’/4.2%)
* M/7-ris M/’nute$ o! Tete~ornrnunicetion Tr~t~. Data a~e for/n/emalionalpub#c voice c/rcu#s only.
© International Institute of Communications 1990 All Rights Reserved

Table 7
MEXICO AND ITS MAJOR TELECOMMUNICATION CORRESPONDENTS (1988)
Destination
Outgoing Market M~TI" in Share
Millions*
United States 192.4 91.3% Canada 3.1 1.5% Spain 2.3 1,1% U.K. 1.2 O.6% Colombia 1.1 0.5%
France 1.1 0.5% W. Germany 1.0 0.5% Italy .9 0.4% Japan .8 0.4% Argentina .7 0.3%
Brazil .7 0.3% Venezuela .7 0.3% Panama .5 0.2% Guatemala .5 0.2% Switzerland .4 0.2%
Total Above 207.4 98.4% Total Mexico 210.7 100.0%
* ~f/77"/$ Minutes o/Te/e~omntunication Tra#T¢. Data =r~/or in/e/nalYonalpubli~
© International Institute of Communications 1990 All Rights Reserved
26

Table 8a
THE UNITED KINGDOM AND ITS
MAJOR TELECOMMUNICATION CORRESPONDENTS (1988)
Destination
Market Share
%
United States 21.9% W. Germany 10.4% France 9.3% Netherlands 4.8% Italy 4.4%
Canada 3.8% Spain 3.6% Australia 3.5% Switzerland 3.5% Belgium 2.7%
Sweden 2.1% Japan 1.9% Denmark 1.7% Norway 1.5% South Africa 1.4%
Hong Kong 1.3% Greece 1.2% India 1.0% Portugal 1.0% Turkey 0.8%
Total Above 81.8%
Top 5 50.8% TOp 10 67.9% Top 15 76.5% Top 20 81.8%
© International Institute of Communications 1990 All Rights Reserved
2"7

¯ x
Table 8b
U.K. INCOMING TRAFFIC TRENDS: Incoming traffic from the top ten countries (Fiscal Years)
10-
9-
8-
7-
6-
5-
4-
3-
2-
1-
US NE SP IT CA AU SZ BE
L~ 1983 ~ 1988 ~ 1993
The Country Code:
US = United States
NE = Netherlands
CA = Canada
BE = Belgium
GE = West Germany
SP = Spain
AU = Australia
FR = France
IT = Italy
SZ = Switzerland
*Data are for in~rnaffonal public voice circu#s one, for all c~rrie/s combine~. 19~33 ~s#mal~d by lineR/" ex/rmpolation using average grow~ rate~ from 1983 to
© International Institute of Communications 1990 All Rights Reserved
28

Table 8c
U.K. OUTGOING TRAFFIC TRENDS: Outgoing traffic to the top ten countries (Fiscal Years)
US GE FR NE IT CA SP AU SZ
~ 1983~ 1988~ 1993
BE
The Country Code:
US = United States
NE = Netherlands
SP = Spain
BE = Belgium
GE = West Germany
IT = Italy
AU = Australia
FR = France
CA = Canada
SZ = Switzerland
*O~t~ ~r~ lot intemaliona/pub//c mice ¢imuils only/or al/ carrie/s ~nbine~. 19~3 es~Pn#led b¥ /in##f extrapolation u~ing average g~ow~ /~les fron~ I~8~ ~o I~
© International Institute of Communications 1990
All Rights Reserved
29
I j
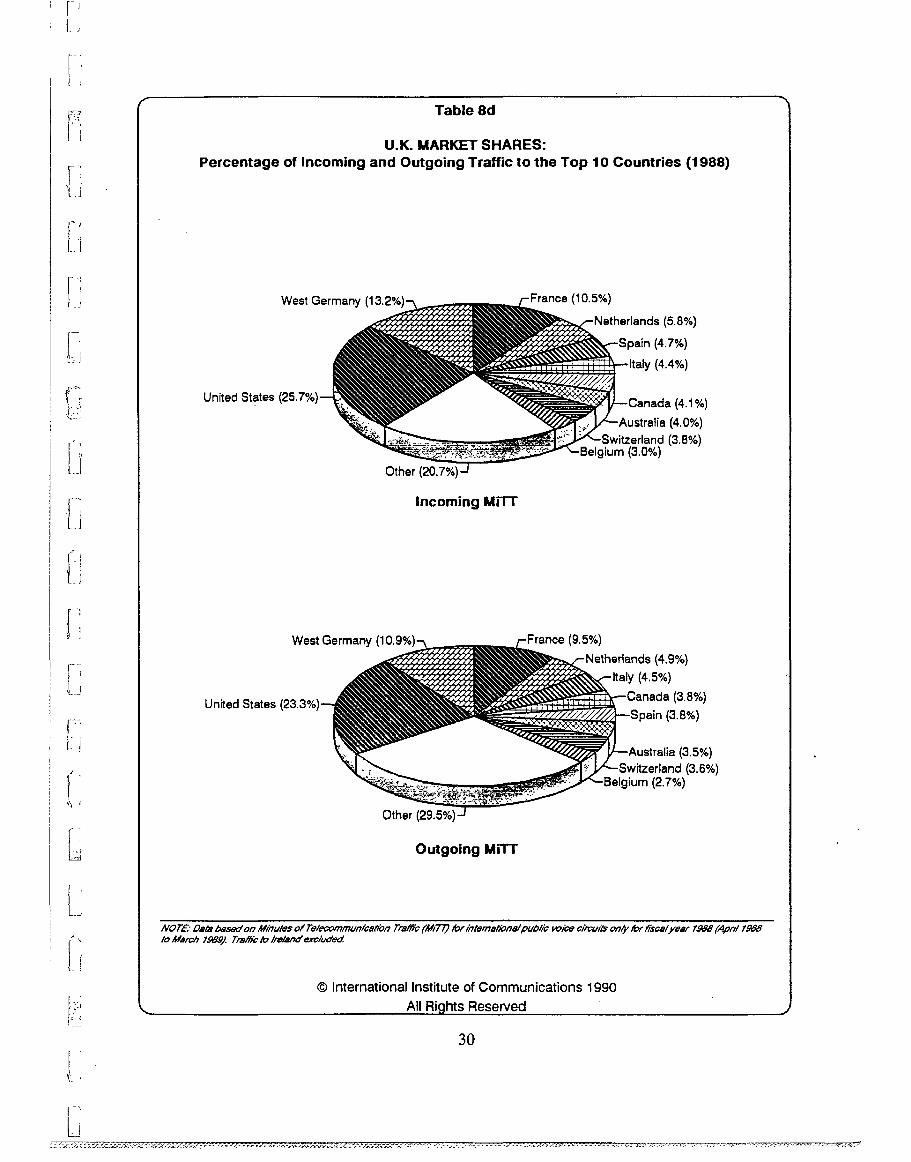
Table 8d
U.K. MARKET SHARES: Percentage of Incoming and Outgoing Traffic to the Top 10 Countries (1988)
United States
West Germany (10.5%)
Other (20.7%)
Incoming Mi’r-r
(4.7%)
(4.4%)
~ (4.1%)
(4.0%) (3.8%)
glum (3.0%)
United States
West Germany
Other (29.5%)
Outgoing MiT’i"
(4.9%) (4.5%)
(3.8%) (3.8%)
(3.5%) and (3.6%)
(2.7%)
NOTE." Data ba~ed on Minutes of Tele~ommunicahbn TmftF¢ (44/77") for intama#ona/publ/b voi~e circuits only for fiscal year 1.~6 (Apnl 1988 /o March lg~g). Tra/f~ 1o IrR/Rndexcluded..
© International Institute of Communications 1990
All Rights Reserved
3O

Table 9
FRANCE AND ITS
MAJOR TELECOMMUNICATION CORRESPONDENTS (1988)
Destination
Outgoing Market M Fi-I" in Share Millions* %
W. Germany 198 12.6% United Kingdom 170 10.8% Italy 155 9.9% Belgium 129 8.2% Spain 107 6.8%
United States 105 6.7% Switzerland 101 6.4% Portugal 77 4,9% Netherlands 54 3.4% Algeria 44 2.8%
Morocco Tunisia Canada Turkey Israel
38 2.4% 32 2.0% 19 1.2% 16 1.0% 10 0.6%
Japan Ivory Coast Brazil Egypt Lebanon
9 8 6 5 5
0.6% 0.5% 0.4% 0.3% 0.3%
Total Above Total France
1288 1570
82.0% 100.0%
Other
Germany (12.6%)
Kingdom (10.8%)
Algeria Netherlands
Portugal
Switzerland (6.7%) -Spain (6.8%)
(9.9%)
Igium (8.2%)
Minutes of Telecommunica~bn Traffic. Data are [or interna~onal pub/ic voice circui/~ on~.
© International Instituie of Communications 1990 All Rights Reserved
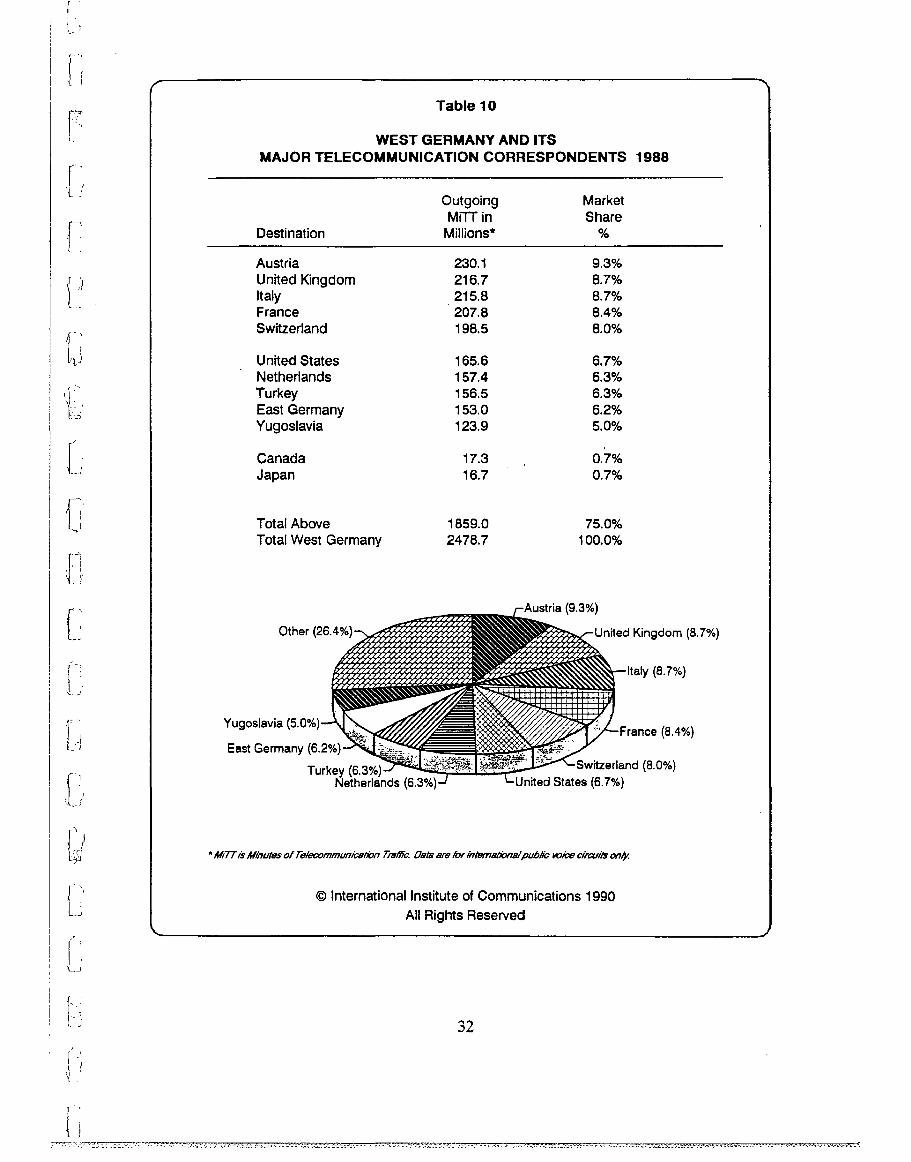
Table 10
WEST GERMANY AND ITS MAJOR TELECOMMUNICATION CORRESPONDENTS
Destination
Outgoing Market M ~TI" in Share
Millions* %
Austria 230,1 9.3% United Kingdom 216.7 8.7% Italy 215.8 8.7% France 207.8 8.4% Switzerland 198.5 8.0%
United States 165.6 6.7% Netherlands 157.4 6.3% Turkey 156.5 6.3% East Germany 153.0 6.2% Yugoslavia 123.9 5.0%
Canada Japan
17.3 0.7% 16.7 0.7%
Total Above 1859.0 75.0% Total West Germany 2478.7 100.0%
Other
Yugoslavia (5.0%
East Germany
Turkey (6.3%) Netherlands (6.3%) United States (6.7%)
=/~/77"/~ Minuta$ of Te/c,~ornmunication Tin/fie. Data ,~re /o~" inl~naz~b~/~/ publi~ mice ¢/fcuil~ on~
© International Institute of Communications 1990 All Rights Reserved
1988
Kingdom (8.7%)
(8.7%)
(8.o%)
32
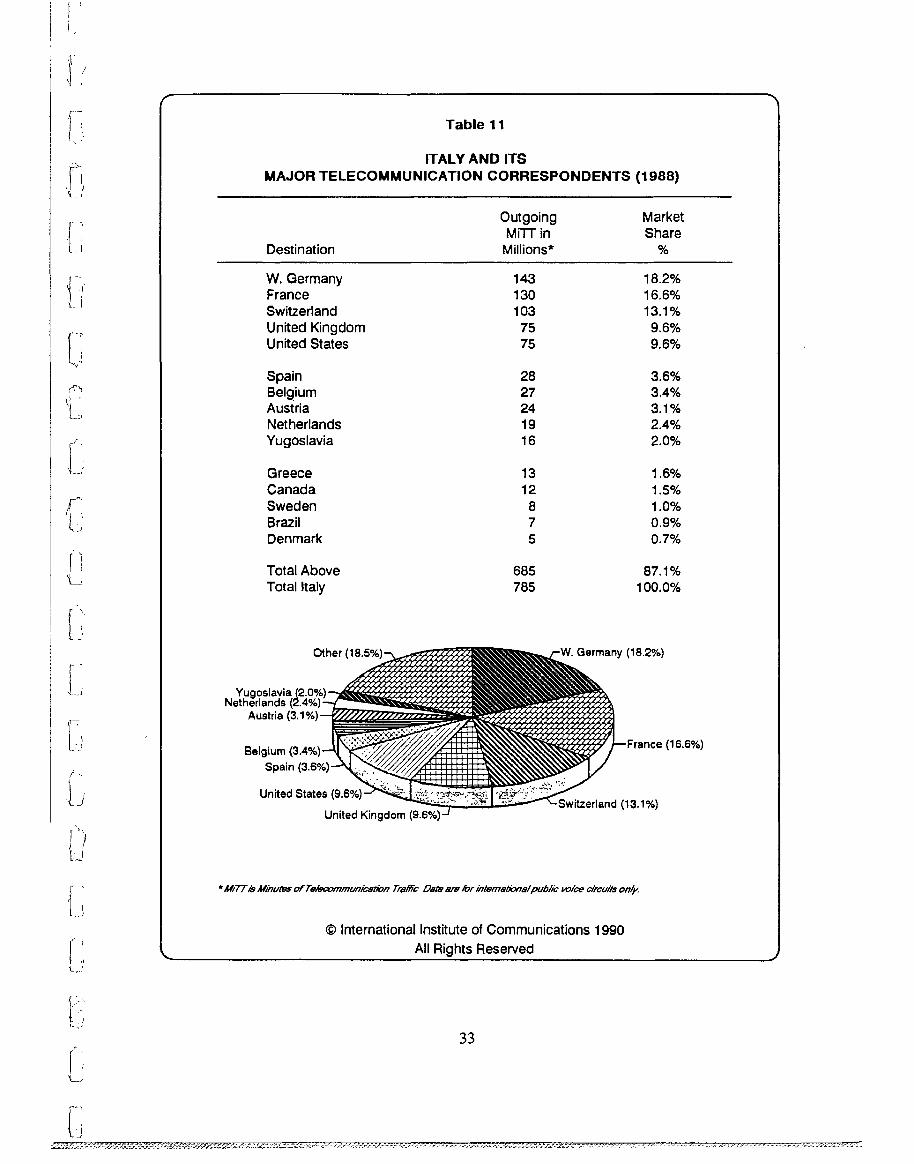
Table 11
ITALY AND ITS
MAJOR TELECOMMUNICATION CORRESPONDENTS (1988)
Destination
Outgoing Market M~TT in Share
Millions* %
W. Germany 143 18.2% France 130 16,6% Switzerland 103 13.1% United Kingdom 75 9.6% United States 75 9.6%
Spain Belgium Austria Netherlands Yugoslavia
Greece Canada Sweden Brazil Denmark
Total Above Total Italy
28 3.6% 27 3.4% 24 3.1% 19 2.4% 16 2.0%
13 1.6% 12 1.5%
8 1.0% 7 0.9% 5 0.7%
685 87.1% 785 100,0%
Germany (18.2%)
Yu
Austria
Belgium
S
United States,
United Kingdom (9.6%) Switzerland (13.1%)
* M/77"is Minutes of Telecommunication TraflFc Data au~ ~or internaliona/~ub//~ voice circui/s on/~
© International Institute of Communications 1990
All Rights Reserved
(18.8%)
33

Table 12
THE NETHERLANDS AND ITS MAJOR TELECOMMUNICATION CORRESPONDENTS (1988)
Destination
Outgoing Market M FI-I" in Share
Millions* %
West Germany Belgium United Kingdom France United States
179.4 25.4% 120.6 17.1%
98.1 13.9% 55.0 7.8% 43.3 6.1%
Switzerland Italy Spain Turkey Sweden
25.4 3.6% 21.7 3.1% 17.6 2.5% 14.0 2.0% 11.6 1.7%
Austria Denmark Canada Norway Greece
11.3 1.6% 10.7 1.5% 7.9 1.1% 6.8 1.0% 4.9 0.7%
Surinam Yugoslavia Ireland Portugal Neth. Antilles
4.9 0.7% 4.3 0.6% 4.3 0.6% 4.1 0.6% 3.9 0.6%
Luxembourg Japan Morocco Finland Australia
3.8 0.5% 3.5 0.5% 3.4 0.5% 3.2 0.5% 3.2 0.5%
Total Above Total Netherlands
667,2 94.5% 706.0 100.0%
Top 5 70.3% Top 10 83.1% Top 15 89.0% Top 20 92.. 1% Top 25 94.5%
* M/’TTis Minules of Te/~ommunication Traffic. Dam are for intemadonalpublic voice ¢ircuika on~
© International Institute of Communications 1990
All Rights Reserved
34

Table 13
SWI’I-ZERLAND AND ITS
MAJOR TELECOMMUNICATION CORRESPONDENTS (1988)
Destination
Outgoing Market M~’1"I" in Share
Millions* %
W. Germany 248 24.5% France 173 17.1% Italy 169 16.7% United Kingdom 63 6.2% Austria 49 4.8%
United States 44 4.3% Spain 39 3.8% Yugoslavia 30 3.0% Belgium 28 2.8% Netherlands 18 1.8%
Total Above 864 85.2% Total Switzerland 1014 100.0%
* M/7-1"/s Minutes of Te/e~ommun/c~t/on Traffic. Data are for in/emationa/public voice ¢ircu#s onl~.
© International Institute of Communications 1990 All Rights Reserved

Table 14
JAPAN AND ITS MAJOR TELECOMMUNICATION CORRESPONDENTS (1988)
Destination
United States South Korea Taiwan Hong Kong United Kingdom
Outgoing Market Mt-l-r in Share Millions* %
144, 8 27.4% 72.4 13.7% 55.5 10.5% 42.3 8.0% 32.7 6.2%
West Germany Australia Singapore France Thailand
17.4 3.3% 15.9 3.0% 15.5 2.9% 10.0 1.9%
8.0 1.5%
Canada Italy
7.3 1.4% 6,3 1.2%
Total Above Total Japan
428,1 80.1% 528.6 100.0%
Other
Thailand
(27.4%)
France
Singapore Australia
W. Germany
United Kingdom (6.2%
Hong Kong (8.0%) -Taiwan (10.5%)
Korea (13,7%)
* M/77is Minutes of Te/eGommunic~t~n Tr~flY~. D4tl~ are for intemaNonalpub/ic voice circuits on~ B~dcover KDD lr~/F~ for l~ F~o~l y~ (~offl l~ /o March
© International Institute of Communications 1990
All Rights Reserved
36

Table 15
TAIWAN (R.O.C.) AND ITS MAJOR TELECOMMUNICATION CORRESPONDENTS (1989)
Destination
1989 Outgoing Market MFI’r in Share Millions* %
United States 44.0 27.1% Japan 38.7 23.8% Hong Kong 31.2 19.2% Singapore 6.3 3.9% Thailand 3.5 2.2%
Malaysia 3.4 2.1% W. Germany 3.4 2.1% Philippines 3.2 2.0% Australia 3.1 1.9% South Korea 3.0 1.8%
Canada " 3.0 1.8% Indonesia 2.6 1.6% U.K. 2.6 1.6% France 1.6 1.0% Italy 1.1 0.7%
Total Above 150.7 92.9% Total Taiwan 162.3 100.0%
* M/77"i~ Minuto~ of Telecommunication Tralfi~. Data are for intorna/ionalpubli¢ voice circuits on~ and~over h2cal .V~f 1989 (Ju~y 1988to June 19~9).
© International Institute of Communications 1990 All Rights Reserved
3?
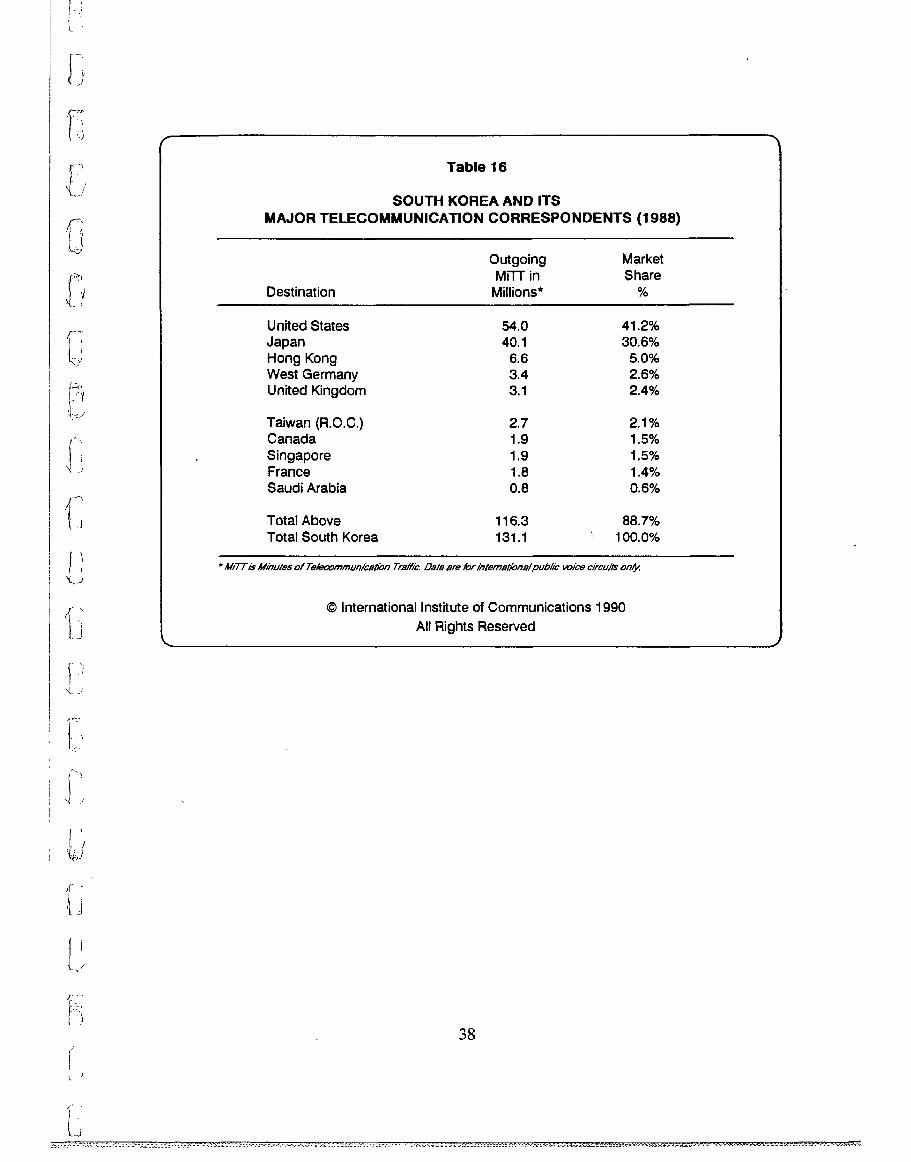
Table 16
SOUTH KOREA AND ITS
MAJOR TELECOMMUNICATION CORRESPONDENTS (1988)
Destination
Outgoing Market M FI-I" in Share
Millions* %
United States 54.0 41.2% Japan 40.1 30.6% Hong Kong 6.6 5.0% West Germany 3.4 2.6% United Kingdom 3.1 2.4%
Taiwan (R.O.C.) 2.7 2.1% Canada 1,9 1.5% Singapore 1.9 1.5% France 1.8 1.4% Saudi Arabia 0.8 0.6%
Total Above 116.3 88.7% Total South Korea 131.1 ~ 100.0%
"M/Tris Minutes of Tele~mmunic~/ion Tf~’c. Da/~ ~re for in/em~tion~I public voice circuits on~.
© International Institute of Communications 1990
All Rights Reserved
38

Table 17
AUSTRALIA AND AND ITS
MAJOR TELECOMMUNICATION CORRESPONDENTS (1988)
Destination
Outgoing Market M~TT in Share
Millions* %
United Kingdom 72.7 17.5% United States 64.4 15.5% New Zealand 64.1 15.5% Japan 18.9 4.5% Hong Kong 16.7 4.0%
Italy 11.5 2.8% West Germany 11.1 2.7% Singapore 10.9 2.6% Canada 10..2 2.5% PNG 6.4 1.6%
Total Above 286.9 69.2% Total Australia 414.6 100.0%
© International Institute of Communications 1990
All Rights Reserved
39

Table 18
SINGAPORE AND ITS
MAJOR TELECOMMUNICATION CORRESPONDENTS (1988)
Destination
Outgoing Market M~-I-I" in Share
Millions* %
Indonesia 20.5 13.5% Japan 19.7 13.0% United States 19.7 13.0% Hong Kong 19.4 12.8% Taiwan (R.O.C.) 10.6 7.0%
United Kingdom 10.3 6.8% Australia 10.2 6.7% Thailand 7.1 4.7% India 6.9 4.5% Philippines 4.1 2.7%
Total Above 128.5 84.7% Total Singapore 151.8 100.0%
* M/7-[/~ Minutes of Te/ecommunicet/on Traffic. Data are/or/nte/T/at~walpub/i~ voice circu/’/s on~ Excludes traffic Io Malaysia.
© International Institute of Communications 1990 All Rights Reserved
4O

Table 19
HONG KONG AND AND ITS
MAJOR TELECOMMUNICATION CORRESPONDENTS (I 988)
Destination
Outgoing Market M~TI" in Share
Millions* %
China (P.R.) 141 32% United States 44 10% Taiwan (R.O.C.) 40 9% Japan 35 8% United Kingdom 26 6%
Canada 22 5% Macao 22 5% Australia 18 4%
Total Above 348 79% Total Hong Kong 441 100.0%
© International Institute of Communications 1990 All Rights Reserved
41

Table 20
THAILAND AND ITS MAJOR TELECOMMUNICATION CORRESPONDENTS (1988)
Destination
Outgoing Market M~’I-F in Share
Millions*
Japan 6.4 15.0% Singapore 6.0 14.1% United States 5.7 13.4% Hong Kong 5.6 13.2% Malaysia 4.9 11.5%
Taiwan (R.O.C) 2.6 6.1% United Kingdom 2.4 5.6% West Germany 1.3 3.0% Italy 1.1 2, 5% Australia 1.1 ~ 2.5%
Total Above 37.1 87.3% Total Thailand 42.5 100.0%
* M/77is &/~ttutes of Te/ecommun/ca/~on Tra#Tc Data are Yor intematYonal~ub/~ voJ’~ circuits only. ~cludes traY/Tc to
© International Institute of Communications 1990
All Rights Reserved
42
1. North America
(a) Two-way traffic between Canada, the United States and Mexico accounts for over 2.9 billion Mi’FF annually, approximately 10% of the world’s total international traffic. The size of the market and the long borders which the United States shares with its neighbors have prompted repeated calls for competitive cross- border access by new service providers and users. Movement in this direction was gradual in the 1980s. But, there are now signs that a North American common market for telecommunications is developing through regulatory convergence -- a process which is likely to accelerate in the 1990s.
The Mexican carrier, Telefonos de Mexico, has recently agreed to interconnect with MCI and US Sprint (AT&T previously was the sole correspondent). Long-~distance rates in Mexico (the major cost-component of most calls between the U.S. and Mexico) have also been reduced by about 40% in 1990.
The pressures for deregulation of the U.S.-Canada cross-border market are discussed in Part IV.C. below.
(b) Telecom markets for North -American carriers continue to grow most rapidly West and South. Since 1986 traffic to the following markets has increased by at least 200-300%: South Korea, the Dominican Republic, the Philippines, Taiwan (Republic of China) and El Salvador. These patterns reflect the origins of America’s new immigrants and work force as much as trade. A similar pattern is evident in Canada’s small but growing traffic to Jamaica and Trinidad.
(c) The U.S. aside, Mexico’s traffic base is quite broad. See Table 7. The U.K. and Colombia have roughly equal weight; so do Guatemala and Switzerland. Japan’s growing weight is perhaps most striking; it is now a more important correspondent for Mexico than Argentina, Brazil or Venezuela. Mexico accordingly appears to be well placed to participate in the expansion of global traffic during the 1990s, even as the trade benefits of its large bilateral traffic surplus with the U.S. (worth over $500 million in 1989!) begin to level off.
2. Europe
(a) West Germany is the junction state for international telecommunication in Europe; it is the most frequently called country for almost all other states in the region. The Federal Republic’s central role in East-West telecommunication has made the Deutsche Bundespost, now DBP Telekom, the largest international telecom power on the Continent. The reunification of Germany, integrating DBP Telekom with the
43
GDR’s PTT, and the rise of market economies in Eastern Europe will enhance Telekom’s role in the 1990s.
(b) The 1988-1989 data confirm the Euro-centric traffic patterns of Germany, France, Italy and the Netherlands. These countries, on average, send only about 8-9% of their traffic to North America; 55-60% is delivered to their EC partners. This contrasts with the U.K.. Approximately 26% of U.K. outgoing traffic is directed to the U.S. and Canada; about 40% to its partners in the EC.
(c) The U.K.’s duopoly policy has now borne fruit. In roughly five years, Mercury will have won approximately 10% of the U.K. outbound market. And, Mercury’s market share on some key routes (ie, to the U.S.) is 15% or more. The big question is how long Mercury and BT can continue to have the market to themselves. The U.K. government will review its duopoly policy in 1991. And, as discussed in Part IV.C., the resale of international leased lines on the U.S.-U.K. route is likely by 1992.
(d) The European cross-border telecoms market is the largest in the world. It provides the core traffic for 7 of the world’s top 10 carriers and accounts for approximately 20-25% of total global cross-border traffic. As services liberalization proceeds in the 1990s, new pressures for competitive provision of basic services seems inevitable.
This will probably occur in stages. The first stage will see the development of pan- European Value Added Networks (VANs) and mobile radio services. Once these networks begin to carry a substantial volume of cross-border traffic (perhaps by mid- decade), a second stage, which expands the service opportunities of these new networks (and invites others), may follow.
3. Asia
(a) Current telecom traffic patterns in this region suggest the importance of the triangular relationship between Japan, HongKong/China and the Newly Industrialized Countries (NICs).
Japan is a junction state for traffic from Asia’s NICs (South Korea, Taiwan, Thailand, Singapore, Hong Kong). In turn, Hong Kong is the telecommunication entrepot for the Peoples Republic. During the mid-1980s, China’s modernization program stimulated international traffic growth of 40-50% annually and boosted the Chinese PTT into the ranks of the world’s top 25 international carriers (see Table 3a). A substantial part of this new international traffic is directed toward Hong Kong which correspondingly sends over 30% of its outbound traffic to China.
44

Direct telecommunication traffic between Japan and China is .now quite small; less than 1% of outbound Japanese traffic goes to China but approximately 8% is directed to Hong Kong. Will 1997 lead to a restructuring of China’s international communication gateways? It is probably too early to say, but the total volume of outbound traffic involved by the mid-1990s could rapidly make China a major international telecommunications power.
In 1990, outgoing traffic from Hong Kong and China (excluding cross-border traffic) will total over 500 million MiTT (approximately 60% of Japan’s outgoing market). That is why the competitive stakes for China and the other international carriers based in the region are now of real consequence.
(b) Carriers based in the Asia-Pacific have, as a group, experienced the highest growth rates in international traffic during the 1980s. Annual growth of 30- 50% has been common. Japan, the most mature market, has experienced a growth in outbound traffic of over 30% since 1987. Likewise, OTC Australia has seen growth in excess of 30% on bilateral routes in the Pacific as compared to 20% plus on traffic to and from European markets. These growth rates have been fueled primarily by rapid economic expansion in the region and, more recently, by facsimile traffic.
The substantial international traffic volumes now generated by many states in the Asia-Pacific and the significant percentage of traffic which most of these countries exchange with competitive markets (the U.S., Japan and the U.K.) will make pressure for competitive access to home markets of continuing concern in the 1990s. This pressure is likely to be most acute for Taiwan, South Korea, and Australia, whose telecom service markets are most closely tied to Japan, the U.S. and the U.K. Recent proposals for comprehensive telecom sector reforms by both South Korea and Taiwan are, in part, a reflection of these linkages.
(c) The 1990s is also likely to see more rapid growth of traffic between Western Europe and Japan. Europe now accounts for about 15% of outgoing Japanese traffic but European countries, excepting the U.K., send less than 1% of their outbound traffic to Japan. The rising facsimile base in Europe; the steady growth of inward Japanese investment and tourism; and competitive service offerings of Japan’s overseas carriers all suggest that the growth of traffic on the Europe-Japan route will accelerate.
(d) The potential growth of the market for international traffic to and from Japan is also underscored by the relatively low per capita flow of outbound Japanese traffic in 1988-89. In the U.S. about 1% of total telephone calls is international; in U.K about 2%; in Japan about .15%.
Similarly, although Japan is often viewed as comparatively advanced in its use of electronic information systems, written media are still of singular importance for
45

international communications. For example, in FY 1988, the Ministry of Posts and Telecommunications (MPT) reported that the i’atio of outgoing international letters to international telephone calls (including fax transmissions) was about 2 to 1. By comparison, in the United States, in 1988, government statistics show that outbound international telephone calls exceeded outbound mail for the first time.
This post/telecommunication ratio may provide a useful indicator of the ability of Japan and its major correspondents to adapt the electronic technologies now available for routine cross-border contact.
IV. Regulatory Implications
The next section of this report examines some of the regulatory implications of the bull market reviewed in Part III and the changing structure of telecoms demand discussed in Part II. The focus is on (1) tariff and accounting rates for switched telephone services and (2) the terms governing the provision of private or leased lines,a3
These two matters often have been addressed separately by industry and government. However, the growing demand for cross-border services has begun to disclose the economic linkages between them. These linkages are complex. But, in the "main, monopoly tariffs and rigid accounting rates (the basis for settling accounts between connecting carriers), just like unreasonable restrictions upon leased lines, inhibit demand and help to maintain supra-competitive margins.
The bull market of the 1980s accordingly has placed pressure on these arrangements. Rising demand and new technologies (eg, fibre-optic cables) have driven down industry costs and provided new opportunities for competition, discount prices and service expansion. Cross-border tariff levels and leased line regulations have thus become a joint subject of debate by telecom executives as well as government officials concerned with trade and economic policy.
A brief digression on the current structure of cross-border tariffs may be helpful at this point.
The Two-Tiered Structure
Let us first consider the matter of tariffs for public international telephone service. The vast majority of residential and small business customers use this service. It is generally tariffed on a volume sensitive or pay-as-you-go basis.
The tariff or collection charge received by the telephone company where the call originates is split with the foreign telephone company which completes the call, typically on a 50/50 basis. The split is not based upon the public tariff in either country but on the basis of an accounting rate negotiated by the connecting carriers for a given route.
For example, if the accounting rate for the international call is $2.00 a minute, the originating and terminating company would each be entitled to $1.00. This accounting rate may or may not reflect current public tariffs (eg. in the foregoing example, the tariff may be $3.00 or $4.00 or more). Indeed, as discussed below, because a carrier
has no obligation to reduce the bilateral accounting rate in response to cost reductions or to a tariff reduction made by a carrier with whom it interconnects, accounting rates in many countries now diverge sharply from both costs and tariffs.
We turn next to international private lines. These facilities are generally leased by large business customers on an end-to-end basis for a fiat monthly charge, although some usage sensitive surcharges do exist. The telephone companies likewise compensate each other for connecting leased line facilities at a fixed monthly or annual rate. The traditional settlement practices (ie, 50/50 division of accounting rates) do not apply.
One consequence of these two different tariffing regimes is that the per minute (or call) cost of international private line service has become, on average, far cheaper than publicly tariffed service for residential users. This is not wholly the result of the different tariff regimes; the per unit cost of carrying large traffic volumes on a point- to-point basis is also lower. Nevertheless, the difference in settlement practices is a contributing factor because flat-rate circuit charges tend to encourage traffic growth by users and facilities innovation by carriers.
The greater the gap between cross-border public tariffs, on the one hand, and leased line tariffs, on the other, the greater is the pressure for liberal access to leased lines. (See Table 22 below with regard to the gap for trans-Atlantic services.) A wide gap also provides a continuing incentive to resell leased lines to the public. Conversely, the more that public tariffs for cross-border service begin to fall into line with private line tariffs, the less compelling is the economic rationale for liberalization and, correspondingly, for resale.
(This is not to suggest that user objections to restrictions on the use of leased lines is solely economic; freedom-of-action is of equal concern, cost notwithstanding.)
We discuss these issues further below.
A. Traffic Growth and the Pressures On Tariffs
The regulatory reforms of the 1980s typically sought to bring telecommunication tariffs more closely into line with costs. Adoption of cost-based tariffs was considered to be essential to efficient utilization of national telephone networks and the introduction of competitive and value-added service offerings. At the beginning of the 1990s, however, there is strong evidence that, even where competition exists, movement toward cost- based tariffs for international services has lagged behind rebalancing of local and domestic long-distance rates.

Generalizations in this area are difficult. But, rates on trans-continental routes, particularly for calls originating in North America, currently appear to be more cost- based than many cross-border tariffs, especially within Europe and Asia. Even so, the published reports of major carriers confirm that international tariffs still generate profits well in excess of those earned on domestic ones.~4
Overall, we estimate that industry profits constitute one-third to one-half of total industry revenues for international telecommunication services. The market for public international telecommunication services in 1990 will total about 30 billion MITT.15 Data gathered by the FCC and the European Commission suggest that average revenues are on the order of $1.00 per minute.16 On these figures, 1990 industry profits will approximate $10- $15 billion.
The bull market of the late 1980s accordingly has made the gap between carrier tariffs and costs a source of mounting regulatory concern and market instability. There are several reasons.
Unit Costs
First, annual growth in international traffic significantly reduces unit costs. Assuming a 20% annual growth rate, the cost reduction is probably at least 5 - 10% a year (after inflation) on major routes.17 The foregoing likely underestimates the impact of traffic growth on unit costs for the most heavily trafficked trans-oceanic routes. On these routes, order of magnitude cost reductions may occur when new facilities become operational. (eg, on quite conservative assumptions, the per minute cost of a voice path on TAT-9, operational in 1992, will be US$.02; on TAT-8, opened in 1989, it is $.04; on TAT-7, opened in 1983, about $.11)~s
Price Elasticity of Demand
Second, although rapid traffic growth exerts a downward pressure on unit costs, it also provides a growing incentive for carriers to maintain existing tariff levels. The profit maximizing behavior for a particular carrier cannot be determined without a careful analysis of the price elasticity of demand.
If demand is elastic (ie, the absolute value is greater than 1) then, holding other factors constant, any given price decrease should generate a disproportionate increase in consumption, making a bigger international telecom "pie" to be shared. But, if demand is inelastic (the absolute value is less than 1), then a price decrease will stimulate consumption, but not enough to prevent a decline in total international revenues.
Agreement on the price elasticity of demand for international telecom services over time has proven to be elusive. A recent survey of the literature in North America concluded that the price elasticity is between -.6 and -1.2. A U.K. economist recently stated that the evidence showed price elasticity to be between -0.1 to -0.9. However, a comprehensive review of the North Atlantic market by two economists working in the U.S. found that the demand for U.S. calls had an elasticity of about 1 from 1983-1986; demand elasticities of greater than 1 have been assumed in recent work by two Australian economists in their own industry models.19
In sum, so long as this area remains uncertain, absent competitive necessity, most carriers will be reluctant to take the initiative on price reform.
Accountin~ Rates
Third, the current structure of settlements between interconnecting carriers tends to penalize carriers which reduce their collection rates to reflect falling real costs. For many carriers, accounting rates have accordingly moved far out of line with costs. Carriers which have sought to reduce their prices in line with costs have seen a progressive rise in their payment of accounting rates as a proportion of tariff charges.
The reason, as discussed above, is that a carrier’s total revenues for a given cross- border call is equal to its own tariff (collection rate) minus one-half of the accounting rate agreed between it and the carrier terminating the call. Not all international calls lead to settlements between carriers. Payments are made only when the traffic is not balanced, eg., when one carrier has a net traffic deficit with a correspondent carrier, that is, the foreign carrier terminated more calls.
In that case, the deficit country (the country originating the most calls and terminating the least) makes a settlement to the surplus country equal to one-half the accounting rate times the surplus number of call minutes.
Thus, just as rapid traffic growth accentuates the benefits of above-cost tariffs, it also inflates the value of maintaining above-cost accounting rates for countries with net traffic surpluses and no competitive suppliers. For any given surplus (additional calls terminated), the higher the accounting rate for that route, the higher is the surplus country’s share of the total bilateral traffic revenues.
The financial impact of these settlements or out-payments for a country with a major traffic deficit, such as the United States or Australia, can be quite substantial. In 1989, for example, the U.S. deficit for telecom services rose to approximately $2.5 billion.

New Service Providers
Fourth, current industry tariffing practices and high traffic growth rates have attracted new service providers into the international market. So long as new entrants face a set of artificially high price signals, however, there is a significant risk of uneconomic new entry. Major facilities based entrants will have the market base and financial resources to survive the tariff realignments that will come by the mid-1990s. But, the longer that reform is delayed, the more likely it is that the market will see a new round of would- be competitors who, once in business, will seek to exploit the shortcomings of the present regulatory regime to stay profitable.
The current situation is thus inherently unstable. Every day’s growth in traffic invites, on the one hand, abuse of monopoly power, and on the other hand, uneconomic new entrants and predatory price cuts which may threaten long-run industry investment.
B. A New Deal On International Settlements?
The causes of tariff rigidity and its consequences are being discussed in several arenas. The D Series recommendations regarding the use of cross-border leased lines are under review by Study Group 3 of the ITU International Telephone and Telegraph Consultative Committee (CCIT-I’) in Geneva; international tariffs and costs are being examined by the Working Party On Telecommunication and Information Service Policies of the OECD in Paris. Unrestricted access to cross-border telecommunication services and publicly accountable tariff procedures have also been addressed in the General Agreement on Tariff and Trade (GATT) negotiations on services.2°
The purpose of this section is to show briefly how traffic statistics may contribute to discussions in these and other venues and to monitoring the impact of industry changes in the 1990s.
Measuring Trade Balances
As discussed above, financial settlements between interconnecting carriers are based upon net traffic balances. Annual statistics on incoming and outgoing traffic volumes, by service, thus provide an essential starting point for evaluating the financial balance of trade for any carrier/administration vis-a-vis its main correspondents.21 Traffic statistics do not tell the whole story, of course. Data on tariffs, accounting rates and exchange rates generally are required to calculate the financial surplus or deficit of a particular entity. But, other things being equal, the direction of traffic balances between one carrier and its chief correspondents will generally accord with the balance of trade.
The balance of traffic in 1988 for the world’s leading telecom powers is shown in Table 21 below.
51
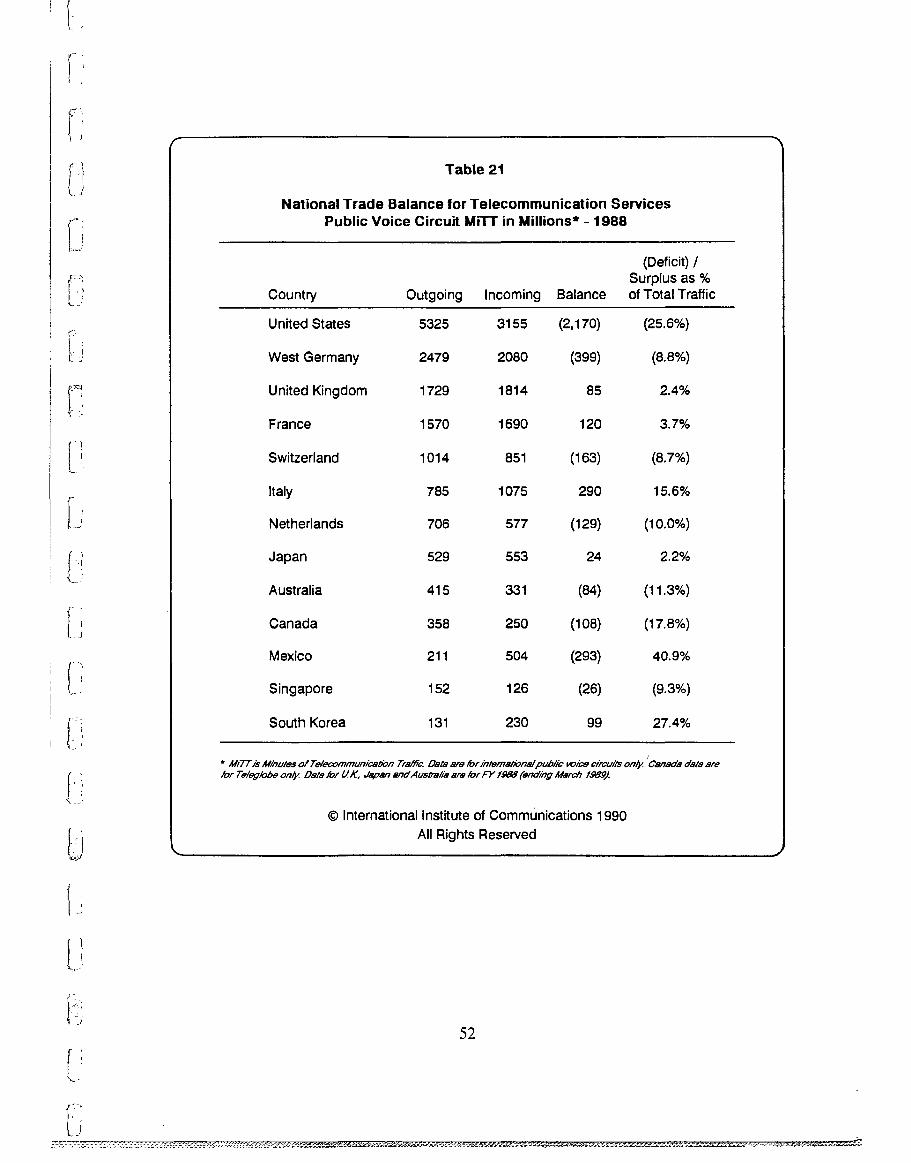
Table 21
National Trade Balance for Telecommunication Services Public Voice Circuit MFI-r in Millions* - 1988
(Deficit) / Surplus as %
Country Outgoing Incoming Balance of Total Traffic
United States 5325 3155 (2,170) (25.6%)
West Germany 2479 2080 (399) (8,8%)
United Kingdom 1729 1814 85 2.4%
France 1570 1690 120 3.7%
Switzerland 1014 851 (163) (8.7%)
Italy 785 1075 290 15.6%
Netherlands 706 577 (129) (10.0%)
Japan 529 553 24 2.2%
Australia 415 331 (84) (11,3%)
Canada 358 250 (108) (17.8%)
Mexico 211 504 (293) 40.9%
Singapore 152 126 (26) (9.3%)
South Korea 131 230 99 27.4%
* M/7-ris M/nutas of Telecommun/c~n Traffic. Data ~ for/ntema~onalpubl/’c voice circu/t~ one. "Canada data are for Tele~lobe one. Data lof U.K, J~pan ~ndAustralia are for FY l~&~ (end/n# March
© International Institute of Communications 1990
All Rights Reserved
52

(b) Reform: A Multi-Dimensional Puzzle
The foregoing table suggests that the coalition for reform may be broadening. A majority of G-7 countries probably now have a traffic deficit with the rest of the world; they originate more cross-border traffic than they receive. (Japan’s small surplus in FY 1988 will almost certainly become a deficit by FY 1990).
Tl~is does not mean that the particulars of reform will be easier to agree. Most countries with traffic deficits (excepting largely the U.S. and Canada) do have traffic surpluses (and balance of payments surpluses) on some routes, without which their net position would be even worse.
For example, West Germany’s surplus with the United States now helps to offset deficits with Turkey and Yugoslavia; the U.K.’s surpluses with the U.S., West Germany and Nigeria help to offset deficits with Pakistan, Israel, Japan, India and Egypt; likewise Japan’s surplus with the U.S almost exactly offsets deficits with other Asia-Pacific countries; Australia’s surplus to the U.S. is used to offset deficits to most other destinations.
The foregoing facts and the multiplicity of actors involved leads us to be sanguine about the near-term prospects for multilateral reform of accounting rates. As discussed below (See Section IV. C.), reforms are most likely to occur on a more ad hoc basis, largely as a result of bilateral initiatives and through competitive service offerings.
The desire for countries to seek a positive balance for trade in telecommunication services is also likely to be tempered by the knowledge that a balance of trade in this sector alone may or may not enhance a country’s overall trading position. That ultimately depends upon whether more outgoing calls (and a rising traffic deficit) tend to generate off-setting earnings in other sectors of the economy (eg, the foreign calls arise from servicing inward investment or lodging more foreign tourists). That calculation cannot be made from traffic statistics alone, nor from considering the telecom service sector in isolation from the rest of the economy.
C. Regulatory Developments To Watch
We have contended above that the bull market for international telecom services will push international tariffs, settlement arrangements and leased line policies to the top of the regulatory agenda in the 1990s. In this concluding section, we wish to offer some observations about the road ahead. How is the "weight of traffic" likely to change the regulatory status quo in the 1990 - 1995 period?

The following areas bear watching.
Caveat: The developments included here draw largely on international markets served by U.S. and U.K. based carriers. Events in these markets strongly influence business conditions for other major markets. But, within the last 6 months, it appears that competition between Japan’s new Type I international carriers may prove to be a major new engine of price reform, not only on Trans-Pacific routes but on routes between Europe and Asia as well.
1. The U.S.-Canada Cross-Border Market: Accounting Rate Bypass?
The very large volume of cross-border traffic between the U.S. and Canada (over 2 billion MiTT in 1990; See Tables 5 and 6) provides a continuing incentive for competitive carriers on both sides of the border to try and provide low cost telecom bridges. Most recently, certain U.S. carriers (MCI, US Sprint) have begun offering their Canadian customers direct access to their U.S. networks via cross-border private lines.
Under this arrangement, the Canadian customer of the U.S. carrier only pays the U.S. carrier’s domestic rate for calling to America plus the cost of the international private line. Because private line services are not subject to traditional settlement practices, the Canadian customer and the carrier providing the service need not pay accounting rates in connection with the inbound traffic which is involved.
In 1987, the Canadian Radio and Television Commission (CRTC) declined to interfere with these arrangements, finding that any decrease in revenue to Canadian carriers would be insignificant. However, the FCC has now been asked to rule that such cross-border telecom bridges (ie., "private line + domestic service") unlawfully bypass traditional international settlement arrangements.22
A principal concern of AT&T, which sought the ruling, is that this kind of "accounting rate by-pass" is one-way. American customers allegedly cannot access the Canadian market on similar terms. Moreover, if the formula of "private line + domestic service" is found to be acceptable here, AT&T suggests that competitive carriers may apply these arrangements to other inbound streams of U.S. traffic. The U.S. share of inbound accounting rate revenues will decline accordingly, while U.S. carriers (and users) continue to pay accounting rate charges in connection with outbound traffic.
AT&T’s major competitors are equally concerned about the potential for one-way "accounting-rate bypass." They too depend upon current international settlement arrangements, especially for inbound U.S. traffic, and might be seriously hurt if the FCC signalled its willingness to allow an unlimited number of private line bridges to the U.S. for incoming voice traffic without reciprocity.
54
At the same time, the U.S.-Canada bor~ler is seen to be unique. The market for cross- border private lines is competitive and U.S. users already have several means of direct-access to the Canadian market which bypass traditional settlement arrangements. These include so-called FX lines and Software Defined Networks(SDN) which span the border. Moreover, resale of domestic private lines will soon be legal on both sides of the border and the CRTC is likely to permit inter-exchange competition for basic telephone service within two years.
In short, the competitive carriers argue, the U.S.-Canadian market is unique; reciprocal cross-border arrangements do exist now and more will follow. Cross-border private lines are not illegal per se and provide real benefits to users. The question of accounting rate bypass should not be at issue here.
The U.S. Dilemma
The "private line + domestic service" case presents the FCC with something of a dilemma. The U.S. has long championed the deregulation of international private lines; it favors international resale, both for the benefits it may offer users and for the price discipline it provides to the market.23
Concurrently, U.S. national interests have’Ied the FCC to adopt a Uniform Settlements Policy(USP). The USP requires all carriers to settle their accounts for international traffic on like terms. It aims to prevent multiple carriers in a competitive market,such as the U.S., from being "whipsawed" by a foreign monopoly carrier seeking a progressively more favorable share of accounting rates and/or traffic in exchange for interconnecting. The USP thus also ensures that U.S. receives its fair share of accounting revenues for inbound traffic.
Against this background, the FCC cannot afford to permit inbound international private lines to effect an ad hoc repeal of the USP. It must work for reciprocal arrangements, without ignoring the cost burdens which significantly above-cost accounting rates place upon international telephone users.
The current dispute regarding the Canada-U.S. private line offerings consequently is probably the first of several cases in the 1990s which will evolve a new set of cross- border settlement arrangements. These arrangements are likely to leave the USP in place in principle, but permit flexibility where that is of reciprocal benefit to users in both countries.
The impact of this evolutionary approach will almost-surely be felt in Europe. Whether or not the U.S.- Canada market provides a model for new arrangements within the Community, as the liberalization of leased lines proceeds within the EC, the dilemmas faced by American regulators are likely to face their European counterparts with equal force.
55

Which brings us to the next issue.
2. Resale and Shared Use of International Private Lines
As noted above, since at least 1985,the United States has favored the resale of international facilities, including private lines, for the provision of enhanced and basic switched voice services. This policy extended U.S. domestic policy, which relied upon resale, as much as facilities competition, to bring long-distance tariffs more into line with costs,
To date, U.S. policy on international resale has had a limited impact. Several countries have liberalized the provision of cross-border private lines so long as these lines are used only for (a) intra-corporate networks (ie, closed user groups) and (b) for value-added services. But, in keeping with the CCITT’s existing D Series recommendations, no major U.S. correspondent has permitted international leased lines to be freely shared by multiple users or to be resold to provide low-cost switched voice services.
There are now signs that market pressures may break down this barrier on the key U.S.- U.K. route (and perhaps elsewhere) within 2 years. If so, and depending upon the regulatory conditions applied, a variety of new competitors may begin to service the North Atlantic market. Downward pressure on tariffs would almost certainly follow.
What are the reasons for change?
First, in 1989 the U.K. agreed to permit domestic leased lines to be freely resold for the provision of switched voice services. At the same time the government said that it would look at requests for international resale on a case-by-case basis. Following these announcements by the Department of Trade and Industry (DTI), the U.K. Office of Telecommunications (Oftel) announced a wider review of the potential benefits of international resale; it also hinted that, in the interim, some individual applications might be approved.
Second, it appears that a number of companies are quietly moving to take advantage of a relaxed U.K. policy on international resale. The first step for new (and old) competitors is likely to be shared use of trans-Atlantic leased lines for voice and data traffic. (For example, one company, the Financial Services Network, has announced plans for a new leased-line network to meet the needs of large’ trans-Atlantic financial service organizations.) The next step is likely to be a form of limited resale, with direct connection to the public switched voice service, at least for a pre-subscribing group of users.

The third reason why private-line resale is now more likely on the U.K.oU.S. route is that the gap between leased line and common carrier tariffs is beginning to close. As this happens, resale becomes more politically viable because liberalization would be unlikely to trigger wholesale migration of customers from the public network. Thus, within the context of the 1990 -1991 review of the BT/C&W duopoly, international voice resale may come to be seen as a satisfactory competitive alternative to licensing a third (partly foreign owned) facilities-based carrier.
At this writing, however, the gap between private line rates and common carrier tariffs for switched telephone services remains significant. International resale on trans- Atlantic routes might, at least in the short run, prove to be a profitable business. See Table 22.
57
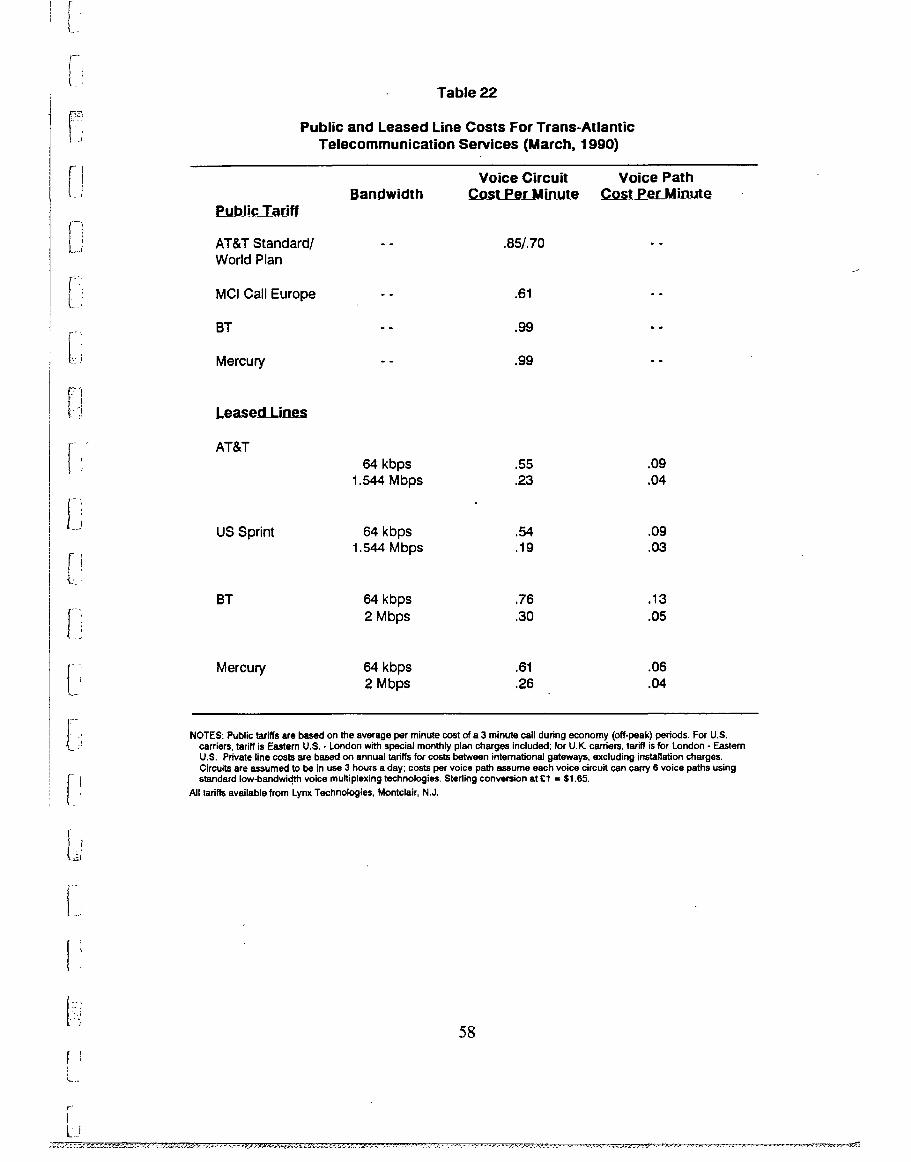
AT&T Standard/ World Plan
MCI Call Europe
BT
Mercury
Table 22
Public and Leased Line Costs For Trans-Atlantic
Telecommunication Services (March, 1990)
Bandwidth Voice Circuit
CO_St Pet_Min.ute
.85/.7o
.61
.99
.99
Voice Path C o st _P_ez_Mi~_ut e
AT&T 64 kbps .55 .09
1.544 Mbps .23 .04
US Sprint 64 kbps .54 .09 1.544 Mbps .19 .03
BT 64 kbps .76 .13
2 Mbps .30 .O5
Mercury 64 kbps .61 .06 2 Mbps .26 .04
NOTES: Public tariffs are based on the average per minute cost of a 3 minute call during economy (off-peak) periods. For U.S. carriers, tariff is Eastern U.S. o London with special monthly plan charges included; for U.K. carders, tariff is for London - Eastern U.S. Private line costs are based on annual tadffs for costs between international gateways, excluding installation charges. Circuits are assumed to be in use 3 hours a day; costs Per voice path ~ssume each voice circuit can carry 6 voice paths using standard low-bandwidth voice multiplexing technologies. Steding conversion at £1 = $1.65.
All tadffz available from Lynx Technologies, Montclair, N.J,

3. Competitive Carriers and Tariffs
Pending the resale of international leased lines, MCI’s Call Europe plan, launched in January 1990, may provide an example of what lies ahead for residential and small business consumers. The plan offers MCI customers a flat rate of $.59 per minute for calls between the U.S. and Western Europe (including Scandinavia) during off-peak periods (3pm to 8am Mon.-Fri. and at any time on weekends). Customers are also required to pay a $3.00 monthly administration charge.
This discount calling plan -- at collection charges below existing accounting rates for some countries -- places downward pressure on current settlement arrangements. Further, because MCI is likely to make money on the Call Europe plan chiefly by attracting a larger share of return traffic, the plan puts new pressure on European correspondents to support the proportional traffic return policies now enforced by regulators on both sides of the Atlantic. This policy limits the negotiating flexibility of carriers, but tends to encourage competitive players like MCI (and Mercury) who in theory must be routed a share of return traffic proportionate to that which they deliver to a foreign carrier. Discount tariffs therefore may be used to build market share and, as market share grows, as a base for further tariff cuts.
Of course, discounts may also trigger a competitive response. Japan provides a dramatic example. There, as described in Part III. A., the established carrier, KDD, has thrice cut its rates to meet competition. This has brought out-bound tariffs in Japan below that for inbound tariffs for many inter-continental calls.
In the 1990s, therefore, discount tariff offerings in the Atlantic and Pacific may have a self reinforcing impact. The greater the number of countries to which competitive carriers provide service, the greater is likely to be the pressure for reciprocal adjustment of accounting rates. This in turn may provide the basis for further tariff reductions. And, as tariffs and accounting rates fall in countries which originate the bulk of the world’s traffic, trade pressures will begin to bite on countries to which this traffic is delivered but which persist in maintaining substantially above-cost accounting rates.
Competition, as much as accounting rate negotiations, thus is likely to be an important engine of regulatory change in the international arena in the 1990s, just as it has been domestically during the 1980s.
Traffic Wants TO Connect
The example provided above are but three signs that the weight of traffic is driving the international regulatory agenda toward a new deal on tariffs, settlements and leased lines. Traffic wants to connect as inexpensively as possible.
The strategies are many: competitive tariffs, cross-border leased lines plus, shared use of private circuits, outright resale, enhanced services, IVAN agreements, software defined networks, "leaky" PBXs. The rationale driving most of these service strategies is the margin between tariffs and costs; so long as this margin remains exceptional, tariffs and settlement practices will remain at the forefront of the international regulatory agenda.
V. CONCLUSION
As telecommunication services move from the periphery to the center of the global economy, the need for baseline statistics on the industry’s major product o- network traffic or connectivity -- will continue to grow. This is only natural. The industry’s new importance can not help but attract scrutiny by both investors and regulators alike.
"It is not hard to make policy based on old numbers," advises FCC Chairman Alfred Sikes. "But it is very difficult to make good policy."
The statistics compiled here show just how fast and how deep the world telenet has brought economies together and linked their common development. Yet one of the major messages of these statistics is that international traffic today is but a fraction of the volumes we might expect over the next decade. As the telephone and its electronic siblings are plugged into the global network for longer and longer each day, international demand will remain robust.
That is why the prospects for further liberalization, tariff realignment and new service options deserve our attention. The great majority of users still pay a significant price penalty for buying cross-border telecom services. The burden which this penalty places on business and society will almost certainly be unacceptable when traffic volumes double or triple in the mid-1990s.
The time to prepare for that day is now.
Institutional reform is necessary not only to take advantage of further opportunities for traffic growth and service expansion. As Henry Ergas and Paul Paterson have stated, absent concerted action, there is a real risk that "the present global network
60
will fragment into two." One part will be "an efficiently priced, high quality and capacity system serving those countries which have accepted the change process." Countries unwilling to accept reforms will "progressively find that their access to networks and usage [is] constrained.’’24
The consequences of the issues discussed here thus extend far beyond the telecom sector. Cross-border telecommunication channels are the oil pipelines of the modern economy. Keeping them open, widening them and ensuring broad public access to the connectivity they provide at reasonable prices is essential to international prosperity. And to every country which desires to have a share in it.
Moreover, international telecommunication is now much more than business and trade. It is equally about preserving the bonds between families and friends; about access to international health care and research organizations; about contact with public officials and aid groups; about the search for political harmony and scientific cooperation.
The realization that the international telecom network now implicates such a broad spectrum of human interests may be the most lasting legacy of today’s bull market. It may also be our best hope for releasing t~he network’s full potential in the years ahead.
--END--
61

Appendix A
METHODOLOGY AND SOURCES
The telecommunication traffic statistics in this report are primarily dcrived from traffic data furnished to the International Institute of Communications (IIC) by service providers.
In a few cases, the data have been estimated based upon annual reports, government publications and industry interviews. The following publications were also consulted: the Yearbook of Statistics (ITU, Geneva, 1989); International Fernsprechstatistik (Siemens, Munich, 1989) and; The World’s Telephones January 1087 - 88, (AT&T, Indianapolis, IN., 1989).
A common accounting unit known as MFffl" -- Minutes of Telecommunication Traffic -- has been used throughout the report. Unless otherwise stated, MiTT refers to paid minutes of public voice circuit traffic. Depending upon national conditions, therefore, MiTI" may include voice and non-voice (eg., facsimile, slow speed data) traffic.
Unless otherwise stated, carrier traffic statistics do not include traffic from foreign subsidiaries or investments. Calendar year data have been used wherever possible; fiscal year data are used elsewhere (cg., the U.K., Japan, Taiwan, Australia).
Traffic data compiled in calls or pulses for certain countries and service providers have been converted to Mi’l"r based upon average pulse and call lengths, exchange lines in service and national calling patterns. For a further discussion of the basis for deriving MiTT from call data, see Appendix A to Global Tclccommunication Traffic Flows And Market Structures (IIC, London, 1989).
The following additional matters may be of interest to readers who wish to use the current report in connection with the aforementioned 1989 IIC report:
Mexico -- The Mexican data in Tables 3a, 5a and 6 reflect official statistics of Telefonos de Mexico (TelMcx). This data differs from traffic data furnished to the United States Federal Communication Commission (FCC) by U.S. based international carriers. For example, unpublished FCC data show that in 1988, cross-border Mi’l"r from Mexico to the United States was 239 million; traffic to Mexico from the U.S. was 562 million Mi’VI’. We do not know the reason for these discrepancies and, pending clarification, have used the more conservative Mexican figures. FCC data were used in the 1989 report.
Saudi Arabia -- The data reported in Tables 2 and 3a reflect revised estimates; the Saudia Arabia data reported in the llC’s 1989 report is incorrect.
Spain -- The data reported for Telefonica in Table 3a reflect re~’ised estimates; the Spanish data reported in the llC’s 1989 report is incorrect.
South Korea -- The Korean data in Table 16 reflect official statistics of the Korean Telecommunication Authority (KTA). The data differ, with respect to the United States, from traffic data furnished by U.S. carriers to the FCC. In 1988, the FCC reported that U.S. carriers terminated about 31.9 million Mi’l"F. We do not know the reason for this discrepancy. FCC data for Korea were used in the
1989 report.
United States -- Table 5b of the current report, showing trends in incoming traffic to the U.S., is not directly comparable with Table 5b of the 1989 report. The 1989 table focussed on the fastest growing streams of incoming traffic; the 1990 table is based upon the absolute size of the incoming traffic stream.
62

ENDNOTES
1. Gregory C. Staple is a Washington D.C. communications lawyer and consultant in private practice. He was formerly Director of Projects at the IIC in London and has served as Director of the Iit2 Telecommunications Forum since 1987. Mr. Staple’s work has appeared in various publications, including the American Journal 9f International Law, Telecommonications Policy, Communications Week International and Japan’s Overseas Communications Journal.
The author wishes to acknowledge the thoughtful comments of Mark Mullins who reviewed a draft of this report. Gregory Hystad contributed his desk-top publishing skills to the preparation of the tables.
2. See eg., John Naisbitt and Patrlcla Aburdene, Megatrends 2000 Ten New Directions For The 1990s (William Morris & Co., New York, 1990) p.12.
3. See "Glued To The Tube," Time, January 8, 1990, p.46; "Mandela, ’Faceless Man With a Fax,’ Negotiates His and Country’s Future," The New York Times, January 30, 1990, pA3. See also "Piercing the Chinese Wall: All The News That’s Fit To Fax," Business Week, December 4, 1989, p.l14.
4. Gregory C. Staple and Mark Mullins, "Global Telecommunication Traffic Flows and Market Structures," (IIC, London, 1989); G. Staple and M. Mullins, "Telecom Traffic Statistics - MiTT Matter," Telecommunications Polic.v, Vol. 14, No. 2, June 1989, pp. 105 - 128. See also "Economic Growth: Please Try Later," Financial Times, July 6, 1989, p.27.
5. G. Staple and M. Mullins, "Telecom Traffic Statistics-MiTT Matter," su_.qp.~, note 4.
6. Telecommunication traffic may also have the potential to provide a common analytic framework for studying both the macrocosm of the economy and the microcosm of the integrated circuit. The term ~microcosm" is borrowed from George Gilder’s provocative new history of the micro-electronics industry: Microcosm The Quantum Revolution in Economics and Technolo~ (Simon & Schuster, New York, 1989).
Macrocosm and microcosm are often thought of separately. But, each world faces similar challenges in transporting vast amounts of electronic information; both share a concern with traffic.
In the macrocosm, engineers commonly measure throughput as Bits Per Second (BPS) or, at the service level, as Minutes of Telecommunlcation Traffic (MITT). In the microcosm, where information flows are several orders of magnitude greater, traffic flows are typically measured in MIPS (Millions of Instructions Per Second).
MIPS and MiTT meet in the marketplace; in the world of new technologies and products. The enormous traffic volumes transiting the public international system would not be possible but for the advances of digital switching
63

technologies. Nor would private networks have their appeal, but for the instantaneous protocol conversion and data processing capabilities made possible through microelectronics. Similarly, the availability of cheap and powerful chips has transformed the traffic generating capacity of customer premises equipment (CPE); the facsimile machine is but one example.
Telecom traffic volumes will continue to be affected by advances in the information storage and processing capabilities of integrated circuits. The development of a general theory of telecom traffic -- bridging microcosm and macrocosm, and of utility to economists as well as engineers -- is thus of growing importance.
7. Sara Spengler, "Network Switching Systems Quantitative Analysis of the Value-Added Network Market," International Data Corporation (Framingham Ma. 1989).
8. Readers interested in traffic forecasting models might consult Lester D.Taylor, Telecommunication Demand: A Survey and Critique, (Ballinger, Cambridge, 1989). See also the references in Jan Paul Acton and Ingo Vogelsang, "Telephone Demand Over The Atlantic Evidence From Country-Pair Data," (RAND, Santa Monica, CA. 1990).
9. See eg., Albert Bressand, Catherine Distler and Kalypso Nicolaidis, "Networks at the Heart of The Service Economy" in Bressand and Nicolaidis ed., Strategic Trends in Services An Inquiry Into The Global Services Economy, (Harper & Row, New York, 1989).
10. This point is brought home in the 1990 biannual survey of telecommunication markets by The Economist: See "Netting The Future," The Economist, March 10, 1990. See also Robert R. Bruce, Jeffrey P. Cunard and Mark D. Director, The Telecom Mosaic Assembling The New International Structu..re, (Butterworth Scientific, London, 1988) pp. 183 - 269.
11. See Thomas W. Malone, Joanne Yates and Robert I. Benjamin "Electronic Markets and Electronic Hierarchies," Communications of the ACM, Vol. 30, No.6 (June 1987) pp. 484 - 497. See also Charles P. Jonscher, "Information Resources and Productivity," Information Economics and Policy, Vol.1, No.l, pp.13-35.
12. G. Staple and M. Mullins, "Global Telecommunication Traffic Flows and Market Structures," supra, note 2.
13. These concerns have been highlighted in a series of articles by Hugo Dixon in the Financial Times, beginning in April, 1990. See "Telephone users overcharged by world cartel operation," Financial Times, April 3, 1990, p.1 and "Reconnecting charges with costs" at p.18. Succeeding articles appeared on April 4 (at p.4); April 5 (at p.4; also Letters to the Editor at p.17); April 17 (Editorial at p.17); April 23 (pp. 1 and 7); April 30 (p.1) and May 1 (at p.1). All page references are to the U.S. edition of the Financial Times.
14. See eg., "British Telecom profits likely to spark prices row," Financial Times, April 23, 1990, p.1.; "International Accounting Rates and The Balance of Payments Deficit in Telecommunications Services," Common Carrier Bureau, Federal Communications Commission, December 12, 1988.
64
15. The llC’s 1989 report (see note 2,..supra) estimated global cross-border traffic in 1986 at approximately 17.5 billion Mi’I’r. The 1990 estimate updates this figure based upon an analysis of annual traffic growth in the intervening years.
16. See eg, "International Message Telephone Service Between The United States And Selected Countries, 1975- 1989, "Industry Analysis Division, Common Carrier Bureau, Federal Comm unieations Commission, Washington D.C., November 1989.
17. This estimate assumes a 5% (after inflation) across-the-board productivity gain for carrier facilities plus an additional 5 - 8% gain from unit cost reductions on the international portion (gateway switches plus cable or satellite channels plus direct overheads). The latter figure obviously depends, inter alia, on the proportion of end- to-end costs attributable to international facilities.
18. See "International Accounting Rates and The Balance of Payments Deficit in Telecommunications Services," supra, note 14.
19. See "Competition In Public Long-Distance Telephone Service in Canada [The Sherman Report]," (Minister of Supply and Services, Canada, 1988) pp. 112 -114; K. Cheong, -Telephone tariff cuts and traffic volumes," Financial Times, April 24, 1990, p.23; Acton and Vogelsang, "Telephone Demand Over The Atlantic," supra, note 8; Henry Ergas and Paul Paterson, "The Joint Provision of International Telecommunication Services: An Economic Analysis Of Alternative Settlement Arrangements" ITS International Conference, Venice, March 1990.
20. CCITT Study Group 3 is charged with reviewing the D Series recomr~endations which were last revised at the CCIq"T IXth Plenary Assembly in Melbourne in November 1988. See CCIT’r Blue Book, Volume II - Fascicle II.I (ITU, Geneva, 1989). The OECD’s draft report, -Trade In Telecommunication Network-Based Services: International Charging Practices And Procedures’, was released in June, 1989.
A new draft treaty (known as a framework agreement) for trade in sex-vices, including telecommunication services, was adopted by GATT negotiators in December, 1989. "Elements For A Draft Which Would Permit Negotiations To Take Place For The Completion Of All Parts Of The Multilateral Framework" MTN.GNS/28 (18 December 1989). In March, 1990 a more detailed draft agreement covering market access to cross-border telecommunication services (known as a sectoral annex) was circulated to GATT members by the United States. "Annex: Access To And Use Of Services of Pubfic Telecommunications Transport Services," MTN.GNS/w/97 (23 March 1990).
21. See Ken Cheong and Mark Mulllns, "International Telephone Service Imbalances, Accounting Rates And Regulatory Policy," I’4EtLA Working Paper, London, 1990.
22. See "Petition For Expedited Declaratory Ruling," filed by AT&T in FCC Common Carrier Docket No. 86- 494, February 5, 1990.
23. For enhanced services, see Computer II International, 91 FCC 2d 232 (1982); on reconsideration, 100 FCC 2d 776 (1985); for switched voice services, see International Competitive Carrier Policies, 100 FCC 2d 812 (1985).
24. Henry Ergas and Paul Paterson, "International Telecommunication Accounting Arrangements: An
Unsustainable Inheritance?’, France Telecom Conference, Villefranche-sur-Mer, France, June 1989.
65