an in vivo study of electrical charge distribution on the
TRANSCRIPT
Nanoscale
PAPER
Cite this: Nanoscale, 2015, 7, 8843
Received 10th February 2015,Accepted 9th April 2015
DOI: 10.1039/c5nr00968e
www.rsc.org/nanoscale
An in vivo study of electrical charge distributionon the bacterial cell wall by atomic forcemicroscopy in vibrating force mode†
Christian Marlière*a and Samia Dhahrib
We report an in vivo electromechanical atomic force microscopy (AFM) study of charge distribution on
the cell wall of Gram+ Rhodococcus wratislaviensis bacteria, naturally adherent to a glass substrate, under
physiological conditions. The method presented in this paper relies on a detailed study of AFM approach/
retract curves giving the variation of the interaction force versus distance between the tip and the sample.
In addition to classical height and mechanical (as stiffness) data, mapping of local electrical properties,
such as bacterial surface charge, was proved to be feasible at a spatial resolution better than a few tens of
nanometers. This innovative method relies on the measurement of the cantilever’s surface stress through
its deflection far from (>10 nm) the repulsive contact zone: the variations of surface stress come from the
modification of electrical surface charge of the cantilever (as in classical electrocapillary measurements)
likely stemming from its charging during contact of both the tip and the sample electrical double layers.
This method offers an important improvement in local electrical and electrochemical measurements at
the solid/liquid interface, particularly in high-molarity electrolytes when compared to techniques focused
on the direct use of electrostatic force. It thus opens a new way to directly investigate in situ biological
electrical surface processes involved in numerous practical applications and fundamental problems such
as bacterial adhesion, biofilm formation, microbial fuel cells, etc.
Introduction
Solid/liquid interfaces may be subject to bacterial adhesionand biofilm formation. If the microbial consortia are patho-genic these surfaces will be a starting point for nosocomialand food borne infections. It is well known that bacterialadhesion on inert surfaces is mainly steered by non-covalentmolecular interactions with long-range interactions such asvan der Waals, electrostatic (mainly resulting from the over-lapping of electrical double layers) or short-range ones such asLewis acid–base and hydration interactions.1 However gainingknowledge of the basic processes governing bacterial adhesionto abiotic surfaces still remains an important task. Electrostaticinteractions are one of the key factors as the bacterial cellsurface is known to carry a net negative charge under mostphysiological conditions.2 The problem is intricate, as bac-terial surfaces are chemically and structurally heterogeneous.3
As an example, the bacterial membrane contains pore-forming
integral membrane proteins constituting channels of conduc-tion for charged particles. Ions, typically, will thus flowthrough the cellular membrane, provided that a driving forceexists for ionic movement such as, for instance, an electro-chemical gradient.4 Studies of these local electrophysiologicalproperties of bacteria have been mainly performed by thepatch-clamp technique. For it, a small patch of membranecontaining one or a few channels (several tenths of nan-ometers in diameter) needs to be isolated and placed at the tipof a micropipette (tip opening ∼1 μm), filled with an ionicsolution. The conditioning of the membrane’s sample forpatch-clamp experiments resorts to aggressive techniques suchas lysozyme digestion, a mandatory step for the completionof the needed spheroplasts. Thanks to this technique,important results on gating kinetics and ion permeabilityof membrane channels sensitive to osmotic pressure havebeen obtained.5,6
However little is known about the electrical properties ofthe bacterial cell surface at the nanometer level and under lowperturbative conditions, as valuable methods for investigatinglocal surface charge or potential distribution are still missing,especially in aqueous solutions with high ionic strength.Atomic force microscopy (AFM) may be a valuable choice forlocal investigation of dielectric properties in physiologicalenvironments as nanometric spatial resolution is easily
†Electronic supplementary information (ESI) available. See DOI: 10.1039/c5nr00968e
aInstitut des Sciences Moléculaires d’Orsay, ISMO, University Paris-Sud, CNRS,
Orsay, France. E-mail: [email protected]; Tel: (+33) 169 157 511bUniversity of Carthage, High Institute of Environmental Science and Technology of
Borj Cedria, Ben Arous, Tunisia
This journal is © The Royal Society of Chemistry 2015 Nanoscale, 2015, 7, 8843–8857 | 8843
Ope
n A
cces
s A
rtic
le. P
ublis
hed
on 1
3 A
pril
2015
. Dow
nloa
ded
on 3
/1/2
022
4:14
:26
AM
. T
his
artic
le is
lice
nsed
und
er a
Cre
ativ
e C
omm
ons
Attr
ibut
ion-
Non
Com
mer
cial
3.0
Unp
orte
d L
icen
ce.
View Article OnlineView Journal | View Issue
reached and AFM can be used in various electrical or electro-chemical modes. Significant progress has been made withAFM operating in liquid environments when focusing ontopographic7–9 or mechanical10 aspects. In ambient andvacuum environments, the electrostatic properties of surfacescan be easily mapped by Kelvin probe force microscopy.11 Thepresence of mobile ions in the liquid environment complicatesthe implementation of such techniques so that it was mainlyapplied to non-polar liquids (i.e. containing a few mobileions)12 or low-molarity electrolytes (<10 mM).13,14 The presenceof mobile ions and bias voltage applied between the tip andthe sample led to induced charge dynamics, ion diffusion anda capacitive coupling between them depending on the electro-chemical properties of the solution (ionic strength, etc.).15 Insearch of a quantitative imaging of local dielectric propertiesin electrolyte solutions with nanoscale spatial resolution, mostof the studies have been done by applying high frequency vol-tages16 between the cantilever and the sample. By working atfrequencies greater than the dielectric relaxation frequency ofthe medium (in the MHz range for 1 mM KCl17) and by scan-ning the probe at distances much larger than the Debye length(typically 10 nm in 1 mM monovalent electrolytes), spatiallyresolved mapping of the dielectric properties of patternedsamples is feasible.18 Working at a high frequency is anefficient way to actuate the cantilever solely by electrostaticforce and not by surface stress forces that contribute signifi-cantly to the cantilever vibration in the low frequencyregime.17,19 Derived methods based on a similar concept wereused to characterize samples with charged domains in liquidmedia at low ionic strength.13,14,20 As the voltage varies at timescales much lower than the typical time related to bulkdiffusion of ions (a few microseconds for a distance of100 nm21) these techniques avoid the formation of the electri-cal double layer (EDL) and hence hinder its use for the studyof the EDL itself and consequently of the underlying surfacerepartition of charges on the sample.
In this paper we present a new experimental method forthe investigation of local electrical surface charges. It isbased on the original combination of two complementaryphysical processes already largely documented in theliterature.
The first one is based on the study of the electrical doublelayer (EDL) by the use of immersion and emersion of a met-allic electrode. From a pioneering idea of Kenrick,22 thismethod was used to study different properties of the EDL:potential of zero charge,23,24 ion absorption25 etc. It was shownthat the electrode can be removed from an electrolyte to air26
or vacuum25 as well. It was shown that the electric double layeris then intact, provided that there is no faradic current at theused voltage. It was thus proved that both the charge on theelectrode and the potential across the emerging double layerremain fixed as this electrode is removed.27 The proposedmodel25 was based on the hypothesis that the “unzipping”of the EDL during the electrode’s emersion takes placejust outside the outer Helmholtz plane as defined inclassical theory of EDL.28,29 Probing the EDL by a metallic
probe was recently revisited at the nanometer scale by Yoonet al.30
The second physical process involved in the therein pre-sented method is based on the so-called electrocapillaryequation (numbered 13.1.31 in ref. 28), relating changes in (i)the surface (or interfacial) tension, (ii) the electrode potential,(iii) its surface charge density, (iv) the electrolytic solutioncomposition (by means of the electrochemical potentials) andfinally (v) relative surface excess of ions. This equation theor-etically stemmed from the thermodynamic development of theGibbs adsorption isotherm. It permitted the interpretation ofsurface tension measurements at mercury–electrolyte inter-faces in the dropping mercury electrode (DME) method andconsequently a substantial improvement in knowledge of EDLstructure. An elegant way of measuring, at a sub-micrometricscale, the surface tension is to study variations of the surfacestress of AFM cantilevers as these two quantities are linkedthanks to the Shuttleworth equation.31 Variations in thesurface stress indeed cause the bending of the AFM cantileverthe amplitude of which can be measured thanks to the reflec-tion of the laser beam as currently used in AFM experiments.32
Several authors took advantage of that concept to measureadsorbate-induced surface stress changes in a vacuum,33
electrocapillary-like curves of noble metals,34 changes of thesurface stress of silicon nitride upon varying the pH,35 bindingof proteins in aqueous electrolyte36 or pH-induced protein con-formation changes.37 As the variation of electrical properties(charge, potential) of the thin plate generates changes in thesurface tension28,38 via the electrocapillary equation, wedecided to investigate local electrical properties of substratesof biological interest by AFM in an approach/retract mode athigh frequency (≈ 0.1 kHz). These experiments were performedin aqueous liquid phase with a “high” (≈ 0.15 M) ionic force(Debye length, λD, in the range of tenths of nanometers), i.e.under physiological conditions. The approach/retract move-ment of the AFM tip at every pixel could be split in two mainsegments: the first one corresponds to a zone of “high” dis-tance from the substrate (it means larger than several λD)where the electrical state of the cantilever’s EDL is constantand a second one where the two EDL are in contact. In thislast one the AFM tip’s EDL reaches a new state of equilibriumleading to a change in surface stress: this is detected by thechange of flexion of the cantilever as measured by the “force”signal far away (≫λD) from the substrate.
We studied living bacteria under their standard physiologi-cal conditions and naturally adherent (i.e. without any forcedimmobilization) to the glass substrate. We proved that, pro-vided the adequate choice of experimental parameters (mainlytime constants), imaging of local bacterial surface density ofcharge in its steady state is feasible at a spatial resolutionbetter than a few tens of nanometers. Furthermore, a dynamiceffect of electrical charging was detected both by the newelectro-mechanical method we present in this paper and bydirect current measurement. This last effect was tentativelyattributed to the detection of ionic current stemming frombacterial membrane pores.
Paper Nanoscale
8844 | Nanoscale, 2015, 7, 8843–8857 This journal is © The Royal Society of Chemistry 2015
Ope
n A
cces
s A
rtic
le. P
ublis
hed
on 1
3 A
pril
2015
. Dow
nloa
ded
on 3
/1/2
022
4:14
:26
AM
. T
his
artic
le is
lice
nsed
und
er a
Cre
ativ
e C
omm
ons
Attr
ibut
ion-
Non
Com
mer
cial
3.0
Unp
orte
d L
icen
ce.
View Article Online

Material and methodsBacterial preparation
This study was done with Rhodococcus wratislaviensis (Rhodo.w.) bacterial strain known for its ability to degrade hydro-carbon compounds in aqueous effluents. This strain isregistered at the Collection Nationale de Cultures deMicroorganismes (CNCM), Paris, France under number CNCMI-4088 and was provided to us by IFPEN. Stock cultures werekept frozen at −80 °C in 20% glycerol (v/v). The culturemedium used was a vitamin-supplemented mineral medium(MM). This medium contained KH2PO4, 1.40 g l−1; K2HPO4,1.70 g l−1; MgSO4·7H2O, 0.5 g l−1; NH4NO3, 1.5 g l−1;CaCl2·2H2O, 0.04 g l−1. A vitamin solution and an oligo-element solution were added as previously described.39,40 ThepH of this medium is equal to 6.9.40 After inoculation (10%),the adequate carbon source (in the present case toluene) wasadded, and the cultures were incubated at 30 °C with constantagitation. Cultures were grown in flasks closed with a capequipped with an internal Teflon septum to avoid any loss ofsubstrate either by volatilization or by adsorption. The head-space volume was sufficient to prevent any O2 limitationduring growth. Growth was followed by measuring the opticaldensity at a wavelength of 660 nm. Bacteria were transplantedin fresh medium once a week. 500 μL of this culture mediumwas pipetted when the strain was in its exponential growthphase and introduced into the AFM liquid cell. It must beemphasized that we proved10 that bacteria studied under theseconditions are alive.
AFM sample preparation
The samples we used for the AFM experiments were borosili-cate glass substrates recovered by an indium-tin-oxide (ITO)layer (purchased from Neyco, Paris, France). These sampleswere then cleaned by sonication in a diluted solution of deter-gent (pH around 9) for 15 minutes before being carefullyrinsed with high purity water (Milli-Q). Drying was done belowthe flux of a pure inert gas.
The sample preparation method was derived from thatextensively described in ref. 10. To summarize: the bacterialsuspension in its culture medium was gently vortexed duringthree minutes. Forty microliters (μL) were then deposited andremained on the glass slide during 10 min. Excess solutionwas thereafter removed and the substrate was further leftunder ambient atmosphere (22 °C and around 60% of relativehumidity) till the dehydration front started moving throughoutthe sample (around 5 minutes). The sample was then rinsedtwice with the culture medium under gentle conditions beforebeing placed at the bottom of the liquid cell, ECCell® fromJPK.41 Finally 500 μL of the MM medium were promptlypoured into the liquid cell. The final bacterial surface concen-tration on the glass substrate for the AFM experiments wasaround 2 × 10⁵ units per mm2, as checked by opticalmicroscopy. No spontaneous detachment of bacteria from thesample towards the planktonic phase was evidenced by opticalor AFM microscopy. This method was proved10 to be very
efficient for AFM imaging of alive bacteria under their genuinephysiological conditions. No aggressive external immobiliz-ation protocol, neither chemical nor mechanical, was needed:Rhodo. w. self-immobilized on the ITO/glass substrate. Underidentical conditions gliding movements of cyanobacteria werestudied in real time by the AFM tip,10 directly proving itsminute level of disturbances and of course its non-lethalcharacteristics. These Rhodo. w. bacteria, in the initial stage ofbiofilm forming, are then studied by AFM under their genuinephysiological conditions. As no chemical templates for im-mobilization (such as gelatin, polylysine etc.) are used, the bac-terial membrane is not recovered by any polymeric exogeniccompounds: the present electrical measurements are directlyrelated to phenomena inherent to the bacterial membraneeventually through a self-secreted extra polymeric substance(EPS).
AFM data acquisition
Atomic force microscopy studies were carried out using aNanowizard III (JPK Instruments AG, Berlin, Germany) and itselectrochemical cell (ECCell® from JPK41). The AFM head isworking on a commercial inverted microscope (Axio Observer.Z1, Carl Zeiss, Göttingen, Germany). This combined AFM/optical microscope was placed on an isolation vibration table.All the experiments were performed with Rhodo. w. in theirliquid culture medium at a temperature of 24.0 ± 0.2 °C. Itmust be emphasized that special care was taken regardingthermal stability in order to minimize temperature fluctuation:particularly the experimental setup was placed in a tempera-ture-controlled room located in the basement floor to mini-mize both building vibrations and thermal drift. As detailed inthe Results section, residual thermal drift was measured andcorrected as it was found to be linear with time.
AFM measurements were performed using a fast-speedapproach/retract mode (Quantitative Imaging® (QI) mode). Ateach pixel of the image, a complete force–distance curve, at adefined constant velocity, is acquired. In all the presentedresults, the pixel-by-pixel extend/retract curves were recordedat a constant speed of 125 μm s−1 on a total extension of600 nm (data were stored for the first 500 nm from the sub-strate during both approach and retract movements of the canti-lever). Thus the cantilever oscillating frequency is close to 85Hz. Two hundred points were acquired during each approachor retract curves. Typical images were obtained on the basis ofa surface scanning with 64 by 64 or 128 by 128 pixels. We usedstandard beam AFM probes (PPP-CONTPt, Nanosensors, Neu-chatel, Switzerland) with a nominal value of stiffness around0.30 N m−1. Their values were precisely measured by thermalnoise.42 The sensitivity of detection of the vertical deflectionthanks to the photodiode system was measured during theapproach to a clean glass substrate. The typical tip height isabout 15 microns. These commercial cantilevers are coated bya 25 nm thick double layer of chromium and platinum–
iridium alloy on both sides. The maximum applied force wasset at 6 nN. No major changes in the quality of AFM data aspresented here were observed with time. No contamination of
Nanoscale Paper
This journal is © The Royal Society of Chemistry 2015 Nanoscale, 2015, 7, 8843–8857 | 8845
Ope
n A
cces
s A
rtic
le. P
ublis
hed
on 1
3 A
pril
2015
. Dow
nloa
ded
on 3
/1/2
022
4:14
:26
AM
. T
his
artic
le is
lice
nsed
und
er a
Cre
ativ
e C
omm
ons
Attr
ibut
ion-
Non
Com
mer
cial
3.0
Unp
orte
d L
icen
ce.
View Article Online
the apex of the tip was detectable during experiments. EachAFM image is scanned line by line, starting from the bottomof the image to its top. For each of these lines pixels are suc-cessively scanned from the left side to the right one.
All the presented height AFM images and approach/retractcurves are raw data (without any post-treatment such as flat-tening, filtering, smoothing, etc.). Mathematical treatments,such as calculation of the so-called Basic_Line Force signal(BL_Force; see below) or stiffness data, were done by customMatlab (from MathWorks, Natick, USA) programs. Thestiffness data were calculated from the slope of the approach(i.e. extend) curves (force versus scanner elongation) at thepoint of maximum force as averaged on a distance interval of10 nm. Other numerical treatments of AFM data weredone using OriginPro software (from OriginLab Corporation,Northampton, USA).
Electrical/electro-mechanical measurements
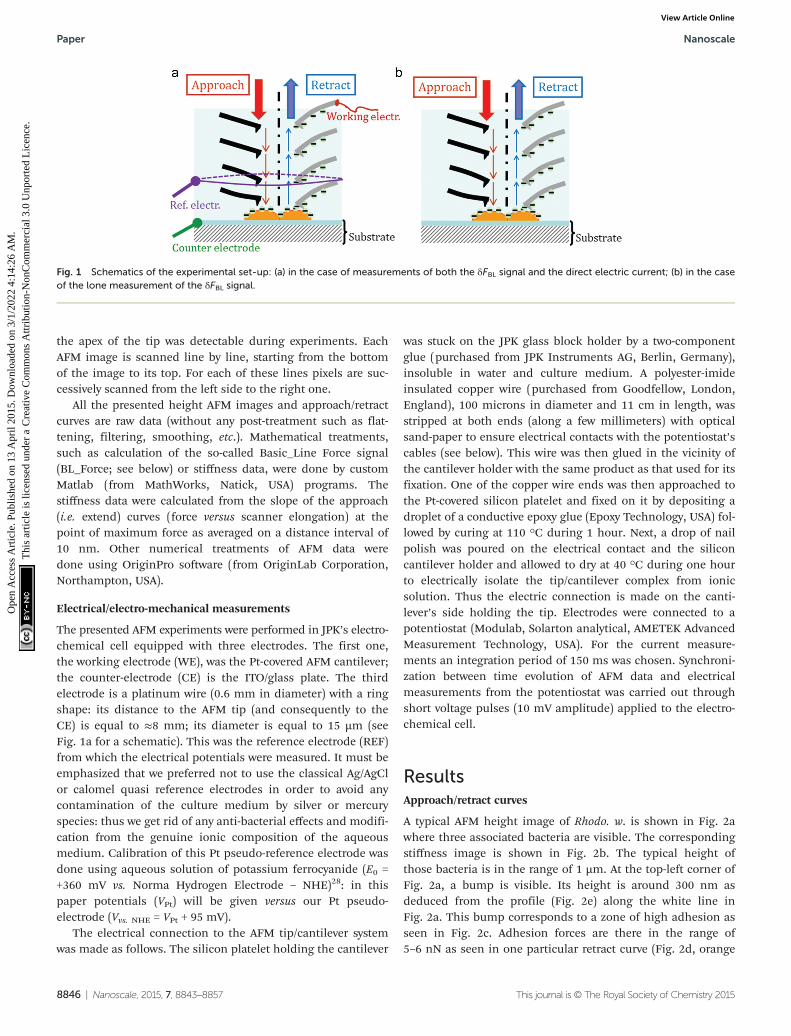
The presented AFM experiments were performed in JPK’s electro-chemical cell equipped with three electrodes. The first one,the working electrode (WE), was the Pt-covered AFM cantilever;the counter-electrode (CE) is the ITO/glass plate. The thirdelectrode is a platinum wire (0.6 mm in diameter) with a ringshape: its distance to the AFM tip (and consequently to theCE) is equal to ≈8 mm; its diameter is equal to 15 µm (seeFig. 1a for a schematic). This was the reference electrode (REF)from which the electrical potentials were measured. It must beemphasized that we preferred not to use the classical Ag/AgClor calomel quasi reference electrodes in order to avoid anycontamination of the culture medium by silver or mercuryspecies: thus we get rid of any anti-bacterial effects and modifi-cation from the genuine ionic composition of the aqueousmedium. Calibration of this Pt pseudo-reference electrode wasdone using aqueous solution of potassium ferrocyanide (E0 =+360 mV vs. Norma Hydrogen Electrode – NHE)28: in thispaper potentials (VPt) will be given versus our Pt pseudo-electrode (Vvs. NHE = VPt + 95 mV).
The electrical connection to the AFM tip/cantilever systemwas made as follows. The silicon platelet holding the cantilever
was stuck on the JPK glass block holder by a two-componentglue (purchased from JPK Instruments AG, Berlin, Germany),insoluble in water and culture medium. A polyester-imideinsulated copper wire (purchased from Goodfellow, London,England), 100 microns in diameter and 11 cm in length, wasstripped at both ends (along a few millimeters) with opticalsand-paper to ensure electrical contacts with the potentiostat’scables (see below). This wire was then glued in the vicinity ofthe cantilever holder with the same product as that used for itsfixation. One of the copper wire ends was then approached tothe Pt-covered silicon platelet and fixed on it by depositing adroplet of a conductive epoxy glue (Epoxy Technology, USA) fol-lowed by curing at 110 °C during 1 hour. Next, a drop of nailpolish was poured on the electrical contact and the siliconcantilever holder and allowed to dry at 40 °C during one hourto electrically isolate the tip/cantilever complex from ionicsolution. Thus the electric connection is made on the canti-lever’s side holding the tip. Electrodes were connected to apotentiostat (Modulab, Solarton analytical, AMETEK AdvancedMeasurement Technology, USA). For the current measure-ments an integration period of 150 ms was chosen. Synchroni-zation between time evolution of AFM data and electricalmeasurements from the potentiostat was carried out throughshort voltage pulses (10 mV amplitude) applied to the electro-chemical cell.
ResultsApproach/retract curves
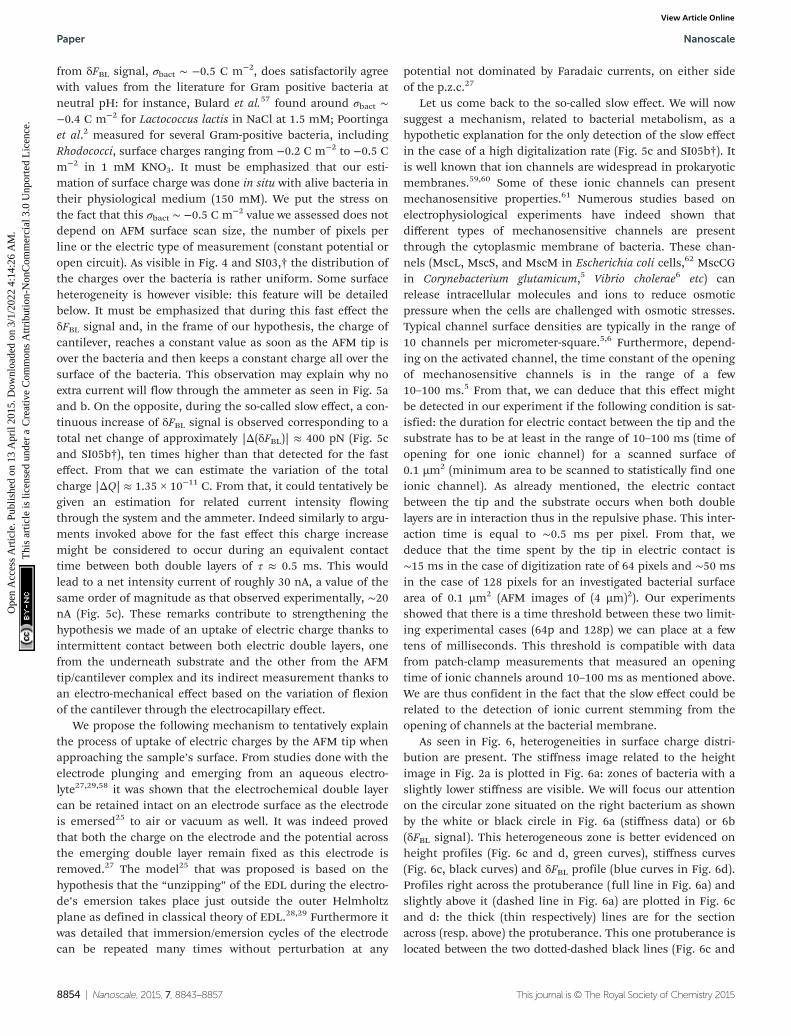
A typical AFM height image of Rhodo. w. is shown in Fig. 2awhere three associated bacteria are visible. The correspondingstiffness image is shown in Fig. 2b. The typical height ofthose bacteria is in the range of 1 µm. At the top-left corner ofFig. 2a, a bump is visible. Its height is around 300 nm asdeduced from the profile (Fig. 2e) along the white line inFig. 2a. This bump corresponds to a zone of high adhesion asseen in Fig. 2c. Adhesion forces are there in the range of5–6 nN as seen in one particular retract curve (Fig. 2d, orange
Fig. 1 Schematics of the experimental set-up: (a) in the case of measurements of both the δFBL signal and the direct electric current; (b) in the caseof the lone measurement of the δFBL signal.
Paper Nanoscale
8846 | Nanoscale, 2015, 7, 8843–8857 This journal is © The Royal Society of Chemistry 2015
Ope
n A
cces
s A
rtic
le. P
ublis
hed
on 1
3 A
pril
2015
. Dow
nloa
ded
on 3
/1/2
022
4:14
:26
AM
. T
his
artic
le is
lice
nsed
und
er a
Cre
ativ
e C
omm
ons
Attr
ibut
ion-
Non
Com
mer
cial
3.0
Unp
orte
d L
icen
ce.
View Article Online

curve) as measured at the red dot in Fig. 2c. As explained indetail in ref. 10, this high adhesion zone corresponds to thepresence of a polymeric substance likely secreted by the bacter-ium itself: this ensures its self-adhesion on the ITO/glass sub-strate. It must be noted that, in this particular medium (MM
medium) with a high ionic strength (0.15 M) no jump-to-contact is observed in the approach curve (Fig. 2d, red curve),nor attractive long-distance interaction as expected whenworking in high salinity media as electrostatic forces areshielded.43 Typical approach/retract curves from the region of
Fig. 2 AFM images (128 pixels × 128 pixels), height data in (a), stiffness in (b) and adhesion in (c), of a consortium of two Gram+ Rhodococcus wrati-slaviensis bacteria in their physiological medium. The height profile along the white line in (a) is plotted in (e): the bump at the left side is due to anEPS layer ensuring the adhesion of the bacterium on the substrate. Approach/retract curves at the EPS zone (red point in (c)) and upon the bacteria(blue point in (c)) are respectively shown in (d) and (f ). In this last case curves are shown for two adjacent pixels (full lines or dotted lines). In (g, h)another consortium of two bacteria is depicted in height (g) and in stiffness (h) in (128 pixels × 128 pixels) images. The scale bar represents 1 µm.
Nanoscale Paper
This journal is © The Royal Society of Chemistry 2015 Nanoscale, 2015, 7, 8843–8857 | 8847
Ope
n A
cces
s A
rtic
le. P
ublis
hed
on 1
3 A
pril
2015
. Dow
nloa
ded
on 3
/1/2
022
4:14
:26
AM
. T
his
artic
le is
lice
nsed
und
er a
Cre
ativ
e C
omm
ons
Attr
ibut
ion-
Non
Com
mer
cial
3.0
Unp
orte
d L
icen
ce.
View Article Online

low adhesion zone (around 96% of the whole image) – seeFig. 2c, blue dot – are plotted in Fig. 2f: these curves are dis-played for two adjacent pixels (full and dotted lines; these twopixels are at a distance of 31 nm and the time interval betweenthem is 12 ms). Approach curves (in blue) reveal only twozones: the “long distance” zone (what we will call the “basisline”, shortly named as BL) where the force is constant at anaccuracy of 15 pN (see below) and the repulsive regime up tothe set-up force at which retract of the cantilever begins. Forthe retract curve the repulsive regime is followed again by analmost constant force regime with superimposed oscillations:they are due to free oscillations of the cantilever as it abruptlygoes off the adhesive contact. As seen in Fig. 2d and f, a shiftalong the force axis between approach and retract curves isclearly evidenced. This is explained by hydrodynamic dragforces (viscous forces) due to the movement of the cantileverthrough the liquid medium. We indeed checked that this dragforce, as characterized by the difference between extend andretract curves, (i) varies linearly with the pulling speed of thecantilever, (ii) has a constant value whatever the pixel’snumber, (iii) is proportional to the effective area of the canti-lever (we checked it with various cantilevers as PPP-CONTPt,Nanosensors, Neuchatel, Switzerland and CSC37, MikroMasch,Wetzlar, Germany) and (iv) the measured values for this hydro-dynamic drag force are in the same range of values as thosereported in the literature.44 Due to that hydrodynamic effect,all retract curves are thus shifted from their correspondingapproach curve, along the force axis, by the same quantity forthe constant conditions we imposed for AFM imaging. Thisfact combined with the lack of quasi-free oscillations in extendcurves far away from the repulsive regime justifies why onlythe approach curves were analyzed.
Definition of the so-called “basis-line force” (BL_force) signal
As already mentioned, the value of the interaction forcebetween the AFM tip and the substrate, during the approachphase, is constant for distances higher than those corres-ponding to the repulsive regime. Its mean value is called theBL_Force signal and will be denoted as FBL. Its exact determi-nation is explained in detail in ESI† and Fig. SI01. The stan-dard deviation for FBL was proved to be lower than or equal to15 pN for all pixels of all AFM data presented in this paper andquantifies the accuracy of the so-called BL_Force measure-ment. The laser beam reflected by the AFM cantilever wasaligned with the center of the four-quadrant photodiode at thebeginning of each experimental session (corresponding toevery studied set of bacteria) and thus the FBL signal is equalto zero at this time t = 0. As shortly explained in the Introduc-tion part, the variation of FBL is sensitive to the variation ofcurvature of the cantilever as caused by changes, for example,in the electrical state of the cantilever and its ionic environ-ment as will be detailed below.
Two classes of electrical status for AFM experiments
AFM experiments we will now discuss were performed undertwo different electrical conditions: The first one was done
when no voltage was applied to the sample, nor currentmeasurement was performed: we called this regime the “OpenCircuit” (O.C.). The typical example we studied is that of a con-sortium of three bacteria we have already shortly described(Fig. 2a–f ). The second one was for AFM experiments wherethe voltage was kept constant and equal to 0 mV versus thereference electrode and the intensity of the current wasmeasured using the ammeter/potentiostat simultaneously withAFM acquisition. One typical example is that reported for thecase of a consortium of two bacteria as shown in Fig. 2f and g.It must be emphasized that the standard way of plotting AFMdata by commercial software to obtain height images rubs outany effect of possible variations of what we called BL_Forceeffects as data are shifted to a constant level of “BL_Force”. Wealso verified that AFM data – in height, stiffness and adhesionmodes – are independent of the electrical status we workedwith, consequently proving that no perturbation in (i) AFMacquisition and imaging and (ii) in bacterial metabolism isengendered, at least at first order.
In order to check the electrochemical status in our exper-iments, we performed cyclic voltammogram in a narrowwindow of potentials. One example is shown in Fig. SI02.† Itmust be pointed out that such similar curves were measuredwhatever the point of observation (above or beside the bac-teria) either with the AFM cantilever oscillating in QI mode orstatic at a constant distance (500 µm) from the substrate. Nodifference was observed when the digitization rate waschanged. The main conclusion is that we do not observe anyfaradic current for this range of voltages: only a quasi-linearbehavior is observed. As explained in ref. 28 its slope(estimated from Fig. S102† to be 1.5 MΩ−1) corresponds to anequivalent resistance between CE and REF electrodes. Thisresistance is due to two series connected resistances: one dueto the contact resistance between the conductive electrodesand solution and the other to the own conduction of theaqueous medium. This last one can be estimated to be 1.1 kΩ(conductivity of culture medium equal to 14 mS cm−1). Thefirst one is mainly due to polymeric substances constitutingthe bacterial membrane and extra-cellular substances partlyinvolved in self-adhesion on the substrate.
Results in the so-called “fast” regime
The first case we will present is that of a constant voltage(0 mV) relative to the REF electrode. It is illustrated with theconsortium of two bacteria (Fig. 2g and h). As detailed above,FBL was measured during the AFM scanning of this bacterialconsortium. Raw variations of FBL along the fast axis (horizon-tal in the shown AFM images) are plotted in Fig. 3 at fourlocations as indicated by the red lines in the simultaneouslyacquired stiffness image (see inserts in gray levels): the posi-tions numbered 1 (4 respectively) in Fig. 3a (3d resp.) corres-pond to the bare substrate. The positions numbered 2 and 3(see Fig. 3b and c) are related to scan lines upon bacteria. Thegreen and blue curves correspond to two adjacent (successive)fast scan lines. Out of the bacteria (Fig. 3a and d) these greenand blue curves are superimposed at an accuracy of 15 pN, the
Paper Nanoscale
8848 | Nanoscale, 2015, 7, 8843–8857 This journal is © The Royal Society of Chemistry 2015
Ope
n A
cces
s A
rtic
le. P
ublis
hed
on 1
3 A
pril
2015
. Dow
nloa
ded
on 3
/1/2
022
4:14
:26
AM
. T
his
artic
le is
lice
nsed
und
er a
Cre
ativ
e C
omm
ons
Attr
ibut
ion-
Non
Com
mer
cial
3.0
Unp
orte
d L
icen
ce.
View Article Online

estimated error for FBL. These experimental data are slightlydispersed along a linear fit of FBL (dashed black lines) for thewhole scan line. On the opposite, Fig. 3b and c reveal animportant original feature: a lower FBL signal is measured forpixels upon the bacterial complex when compared to thelinear approximation as calculated from both sides of the scanline out of bacteria. The mean value of that slope when aver-aged on all scan lines as acquired during the whole set ofexperiments on a bacterial consortium (see for instanceFig. SI04†) is equal to ≈−7 ± 1 pN µm−1 corresponding to arate in time space of around −10 ± 2 pN s−1. This is attributedto an un-compensated thermal drift as will be seen in moredetail in the following. It must be noted that the signals ofhigh intensity at the edges of the bacteria are related to a com-puting effect as explained in more detail in ESI† (see thecaption of Fig. SI01). To further explain this new feature, thelower FBL signal upon bacteria, we define the δFBL signal, ascalculated, at each pixel, by the difference between values of
the FBL signal and of the corresponding linear fit (blackdashed line in Fig. 3), as taken at each pixel (see Fig. 3b). ThatδFBL signal is plotted in Fig. 4. A net variation of the δFBLsignal is clearly visible upon bacteria as is shown in Fig. 4a(three bacteria consortium) and 4c (two bacteria). For thecomplex of two bacteria as studied at 0 mV relative to the REFelectrode, the mean value of δFBL over the bacteria is equal toδFBL = −40 ± 12 pN. Such a behavior was equally observed in aquite different electrical state. The three bacteria consortiumwas studied while no voltage was applied and no currentmeasurement was performed. However similar features in theδFBL signal were detected (Fig. 4c). The amplitude of thissignal is similar to that measured in the case of constantvoltage (0 mV): δFBL = −50 ± 15 pN. Furthermore we checkedthat this δFBL signal is not directly linked to a spurious AFMeffect where local variations of height would induce parasiticvariations of δFBL. We indeed plot in Fig. 4b the δFBL signalcorresponding to that in Fig. 4a for only points higher than
Fig. 3 Spatial variations of the raw BL_Force (FBL) along two successive horizontal scan lines at four different positions over the two-bacterium con-sortium as indexed in inserts. The first acquired line is plotted in blue and the second in green. The AFM data correspond to the image shown ininserts and the acquisition conditions are: scanned area (4 µm)2; digitization rate: (64 pixels)2. The black dashed lines are the best linear fits ofprofiles as determined in the portions without bacteria (left and right sides). The definition of δFBL is schematized in (b).
Nanoscale Paper
This journal is © The Royal Society of Chemistry 2015 Nanoscale, 2015, 7, 8843–8857 | 8849
Ope
n A
cces
s A
rtic
le. P
ublis
hed
on 1
3 A
pril
2015
. Dow
nloa
ded
on 3
/1/2
022
4:14
:26
AM
. T
his
artic
le is
lice
nsed
und
er a
Cre
ativ
e C
omm
ons
Attr
ibut
ion-
Non
Com
mer
cial
3.0
Unp
orte
d L
icen
ce.
View Article Online

100 nm above the substrate’s level: we can see that the thickexopolymeric substance with high adhesion properties (seeFig. 2c) gives no δFBL signal (δFBL ≈ 0), which is quitedifferent from that detected over bacteria (∼−50 pN). The samekind of observation was made in the case of two bacteria (seeFig. 4d).
It is worth noting that this observation of a negative δFBLsignal above the bacteria was observed whatever the AFM scan-ning conditions: this is detailed in ESI† Fig. SI03. Upon bac-teria, δFBL signal is almost constant even if heterogeneities arevisible in Fig. 4: they will be addressed below. Typical time ofvariation of the δFBL signal between zero level on the substrateand that on bacteria is in the range of 30 ms. This is shorterthan the characteristic time of the second phenomenon wewill discuss in the next paragraph. Thus this first effect will becalled “fast effect”.
Results in the so-called “slow” regime
In this sub-section the evolution of the raw BL_Force signalversus time is detailed. When FBL(t ) is plotted for a completesequence of successive AFM data acquisitions (Fig. SI04†) acontinuous linear drift is clearly observed whatever the scan-ning conditions. It is attributed to an un-compensatedthermal drift. Its mean that the slope equals −8 ± 2 pN s−1 inthe case of a constant voltage (two bacteria; see Fig. SI04b†)
and is very close to the value obtained from study in Fig. 3. Inanother set of experiments where no electrical measurementwas done (in the case of the consortium of three bacteria) thisslope is equal to −1.5 pN s−1. In the following this thermaldrift was systematically removed from the raw BL_Force signal:as for data in Fig. 4 (and SI03†) we will now plot δFBL signals.In order to get rid of the previously described fast effect, asmoothening of δFBL signal was systematically done: it corre-sponds to a temporal filter with a time constant of 150 ms,equivalent to a scanning time of twelve successive pixels. Asmentioned in the Material and methods section, the analogictime constant for current measurements was set at a similarvalue (150 ms).
In the case of AFM study at constant voltage (0 mV), timevariations of height (raw data), δFBL (smoothened as describedabove) and current intensity signals are plotted in Fig. 5a–c. Asheight data are not temporally filtered the saw teeth corres-ponding to the AFM fast axis scan are clearly visible. The envel-ope of these height data gives the rough shape of bacteria andallows us to situate the point of AFM scanning in the timediagram we will now describe in more detail: as an examplethe numbered markers correspond to the four scanning linesstudied in Fig. 3a–d: on the glass substrate before scanningthe bacteria, on the bottom bacterium and then the topbacterium and finally the glass substrate after the AFM scan-
Fig. 4 Images calculated from the δFBL signal are plotted in (a) and (c) for the three bacteria and two bacteria consortia respectively. The scale barrepresents 1 µm. The digitization rate was (128 pixels)2. (b) and (d) are portions of (a) and (c), respectively, corresponding to height data higher than100 nm above the substrate’s level.
Paper Nanoscale
8850 | Nanoscale, 2015, 7, 8843–8857 This journal is © The Royal Society of Chemistry 2015
Ope
n A
cces
s A
rtic
le. P
ublis
hed
on 1
3 A
pril
2015
. Dow
nloa
ded
on 3
/1/2
022
4:14
:26
AM
. T
his
artic
le is
lice
nsed
und
er a
Cre
ativ
e C
omm
ons
Attr
ibut
ion-
Non
Com
mer
cial
3.0
Unp
orte
d L
icen
ce.
View Article Online

ning of bacteria. We will now show that a supplementarysignal can be measured with both δFBL signal and currentintensity, provided that the AFM scan speed is below a charac-teristics time. Indeed for AFM data (in the case of two bacteria)taken at a digitization rate of 64 pixels per line (Fig. 5a and b)we observe that both δFBL and intensity signals are constant, atthe accuracy of our measurements, during the whole AFMscanning. This was observed independently of surface scansize, (5 µm)2 for Fig. 5a and (4 µm)2 for Fig. 5b. Surprisingly,when the digitization rate reaches 128 pixels (Fig. 5c, scan size:(4 µm)2) it is worth noting that both signals are no more con-stant. These two signals noticeably increase in a very similarway. We found that a total variation of δFBL signal, Δ(δFBL) (asdefined in Fig. 5c), is of the order of 400 pN while currentintensity increases by roughly 20 nA starting for a constantlevel of 172 ± 2 nA before bacteria scanning. This last valuecorresponds to current intensity as measured at 0 V duringvoltage cycling (see voltammogram in Fig. SI02†). This neweffect will be called a “slow” effect as it is clearly evidenced byapplying a high-pass time filter, the cut-off time of which isabout 150 ms (integration time for current measurement andtemporal smoothening for δFBL signal as well). The fast effectdescribed above is thus not observable in the data presentedin Fig. 5 as its characteristic time (30 ms) is lower than theapplied time filtering.
Remarkably we observed that this slow effect is observableby the lone measurement of the δFBL signal. Indeed whenworking in the so-called open circuit (O.C.) configuration,identical observations (see Fig. SI05†) to these detailedabove can be made. The slow effect is again revealed onlyfor the 128 pixels per line digitization rate (Fig. SI05b†)and not at 64 pixels per line (Fig. SI05a†). This slow effect ischaracterized (Fig. SI05b†) by the same type of variationof δFBL versus time within the same range of magnitude,Δ(δFBL) ≈ 400 pN, when the AFM tip scans the bacterialconsortium.
When no time filtering is applied the fast effect is observedas superimposed on the slow effect (see Fig. 4). In order tofigure out in a better manner what is occurring during thatAFM scan at a digitization rate of 128 pixels per line, the onlycondition when the slow effect is evidenced under our experi-mental conditions, we performed a similar treatment to thatshown in Fig. 3. Detailed comments are available in ESI† (seealso Fig. SI06).
The previously described experiments were performed withalive bacteria in their physiological medium. We also studiedthese R. wratisl. bacteria after they were starved to death: theywere put in the electro-chemical cell filled with a pure NaClsolution (0.15 M) – i.e. without any nutriment – during aminimum of 5 hours before AFM imaging. Under these con-ditions, neither slow nor fast effects on δFBL signal wereobserved whatever the digitization rate (Fig. SI07†). It must benoted too that the related voltammogram, taken under identi-cal conditions to those described in the Material and methodssection, is quite similar to that shown for alive bacteria(Fig. SI02†).
From the simultaneous observation of this so-called sloweffect on both BL_Force signal and current intensity the follow-ing remarks can be made:
Fig. 5 Variations of the δFBL signal (black lines), current intensity(orange curves) and height (the same color code as in Fig. SI04a, b†)signals versus time for three AFM scanning conditions: (a) scanned area(5 µm)2; digitization rate (64 pixels); (b) scanned area (4 µm)2; digitizationrate (64 pixels)2; (c) scanned area (4 µm)2; digitization rate (128 pixels)2.The potential was kept constant and equal to 0 mV versus the pseudo-reference electrode. Spatial variations of δFBL along horizontal scan linesstarting at times noted by numbered markers in (b) and (c) are shown inFig. 3 and SI06† respectively.
Nanoscale Paper
This journal is © The Royal Society of Chemistry 2015 Nanoscale, 2015, 7, 8843–8857 | 8851
Ope
n A
cces
s A
rtic
le. P
ublis
hed
on 1
3 A
pril
2015
. Dow
nloa
ded
on 3
/1/2
022
4:14
:26
AM
. T
his
artic
le is
lice
nsed
und
er a
Cre
ativ
e C
omm
ons
Attr
ibut
ion-
Non
Com
mer
cial
3.0
Unp
orte
d L
icen
ce.
View Article Online

(i) the observed signals in FBL (or δFBL) are not due to arti-facts due to signal processing and computing of AFM data asit is observed by two independent measurements, one basedon direct measurement of the electric current, and the otherby the detection of a mechanical effect (the flexion of the AFMcantilever);
(ii) as shown in Fig. 5c, in the case of the slow effect, vari-ation of δFBL signal is associated with the appearance of anover-current when compared to the base current stemmingfrom the equivalent circuit of the electrochemical cell (asexplained in more detail in the Material and methods section;see also Fig. SI02†). The δFBL signal is shown to be pro-portional to this over-current as clearly shown in Fig. 5c. Thusthe physical origin of variations of the δFBL signal is very likelydue to the change of state of electrical charging of the cantile-ver electrode, generating a current detectable by the ammeterwhen the electric circuit constituted by the ionic solution, con-ductive electrodes and wires is closed.
(iii) in the frame of this hypothesis it is possible to writethat:
ΔI � ΔQΔt
� βΔδFBLΔt
ð1Þ
where ΔI is the over-current due to charging of ΔQ chargesduring time Δt, and Δ(δFBL) is the related change in δFBLsignal. The β ratio can be estimated from experiments reveal-ing the “slow” effect (Fig. 5c). We will now show that from ourhypothesis it is possible to justify that the fast effect cannot bedetected by direct intensity measurements. The error bars forcurrent and δFBL were indeed estimated to be 2 nA (Fig. 5c,orange curve) and 40 pN (Fig. 5c, black curve) respectively. Thecharacteristic time above which current variation is measur-able was 150 ms (see the Materials and methods section): Δt ≈150 ms. From these data the β ratio can be calculated. The so-called fast effect (effect no. 1) is characterized by an amplitudeof |∂FBL1 ≈ 15 pN| (Fig. 3b) for a typical time of variation of ∂t1≈ 70 ms leading, by using eqn (1), to an equivalent current of∂I1 ≅ 2 nA. This is the order of magnitude of the error bar forthe experimental determination of current intensity error(Fig. 5c); thus the fast effect cannot be detected by our directintensity measurements.
We thus suggest that the BL_Force signal is related to theelectric charging of the AFM tip/cantilever complex when con-tacting bacteria. We will develop this hypothesis and argue inthis direction in the next section. The consequences on localmeasurements of electrophysiological properties of bacteriawill then be presented.
Discussion
AFM is a powerful way to image in real space various sub-strates in various media with a sub-nanometric resolution.This method basically relies on the measurement of the smalldeflections of a microcantilever. That deflection is mainly dueto two factors: the first one is the presence of an interaction
(a force in the pico- or nano-newton ranges) between the apexof the tip and the underlying sample. The second one comesfrom the variation of the difference of the surface stressbetween the two main surfaces of the cantilever. This secondeffect may come from specific adhesion on one side of the can-tilever37 or have a pure electrical origin as detailed below.Various kinds of interactions, such as electrostatic, van derWaals, magnetic, etc. with different distance dependencies,contribute to the total force between the probing tipand the sample. The electrostatic force between twoelectrodes (the tip/cantilever system and the sample) can beexpressed17 as
FEl ¼ � 12@C@z
V2 ð2Þ
where C is the capacitance of the system and V is the voltagedifference. The capacitance depends on the geometry, dis-tance, z, between the electrodes and dielectric properties ofthe medium. Under gaseous conditions (under ultra-highvacuum, nitrogen or air atmosphere) AFM scanning of varioussamples in electrical modes at a nanometric (or better) spatialresolution is currently reached in contact mode and non-contact mode as well.45,46 In liquid, the application of voltagebetween the tip and the sample induces redistribution of ionsand water molecules so that a screening of electrodes masteredby diffusion processes (with a typical diffusion rate, D, of ∼4 ×10⁻⁹ m2 s−1) occurs. The vicinity of the cantilever electrode inthe electrolyte solution can be modeled in the frame of theGouy–Chapman theory,47–49 as modified by Stern50 to takeinto account the fact that ions have a finite size: the metal elec-trode is surrounded by a so-called diffuse layer stemming fromthe attraction or repelling of mobile ions in solution by themetallic electrode according to its polarity and the oppositetendency due to thermal processes. This double layer (thediffuse layer and an inner layer – the Stern layer – of specifi-cally adsorbed ions) screened the electrode potential on acharacteristic distance named λD, the Debye length. In the caseof the MM medium (ionic strength of 0.15 M) we used in theseexperiments, λD is small: λD ∼ 0.8 nm. As a consequence theresulting electrostatic force as expressed by15
FEl ¼ 4πσtσSRλDεrε0
e�zλD ð3Þ
vanishes for very short distances and is only active in the strictvicinity of the repulsive regime. This explain that the value ofthe force we measured in the approach/retract curves is con-stant in the non-contact zone allowing us to define the so-called BL_Force signal for each pixel at an accuracy of 15 pN.Such a screening effect is currently used to increase AFMspatial resolution for samples imaged in ionic aqueous solu-tions43 by adjusting the global interaction length. Thus directelectrostatic interaction is thus unable to explain the variationsof the BL_Force signal we observed in both regimes.
The second origin for a modification of the flexion of thecantilever is, as said above, surface stress effects. Surface stressat the interface between the two phases, A and B, ΓAB, is
Paper Nanoscale
8852 | Nanoscale, 2015, 7, 8843–8857 This journal is © The Royal Society of Chemistry 2015
Ope
n A
cces
s A
rtic
le. P
ublis
hed
on 1
3 A
pril
2015
. Dow
nloa
ded
on 3
/1/2
022
4:14
:26
AM
. T
his
artic
le is
lice
nsed
und
er a
Cre
ativ
e C
omm
ons
Attr
ibut
ion-
Non
Com
mer
cial
3.0
Unp
orte
d L
icen
ce.
View Article Online

related to surface tension (surface free energy), γAB, by theShuttleworth relation,31
ΓAB ¼ dγABdεk
þ γAB ð4Þ
with εk the elastic strain parallel to the interface. In the case ofa liquid/liquid interface, there is a strict equality betweensurface energy and surface stress51 as the Poisson ratio isequal to 1
2, meaning that the surface layer is incompressible.This is no longer the case when one of the phases is elastic.
As shown in ref. 51, compressibility of the interfacial region,through the Poisson ratio near the interface, determines thedifference between surface stress and surface energy. Howeverwe will suppose in the following, as frequently done,52 that thefollowing equation
ΓSL � γSL ð5Þis valid in the present experiments.
One way to change surface stress is to vary the electricalpotential of the solid or, more generally, the electrical state ofthe interface between a solid electrode and the surroundingionic liquid (aqueous in the present case). By thermodynami-cal considerations28,38 it is possible to derive the so-called elec-trocapillary equation:38
dγ ¼ �σdV þX
i
Λidμi ð6Þ
where µi and Λi are the chemical potential and the absolutesurface excess (as defined in ref. 28) of species (labelled i) insolution. σ is the excess surface charge density on the metallicside of the interface and V the electrode potential.
In case of no variation of these chemical potentials, eqn (6)leads to Lippmann’s equation:
dγ ¼ �σdV ð7ÞThe property of varying surface stress by changes in the
electric state of the solid/liquid interface was already drawn onwith asymmetric AFM cantilevers19,52,53 (a metallic layer onone side), standard commercial levers coated on both sides17
and highly doped silicon cantilevers.53 One important pointrevealed by papers by Umeda et al.17,19 is that the cantileverbehavior is dominated by surface-stress effects when the fre-quency of the excitation signal is much lower than a character-istics frequency fc_SS.
17
In our case (ionic force of 0.15 M and an AFM tip and bac-terium heights around a few microns,) fc_SS is close to 35 kHz.That value is thus much higher than the typical frequency rele-vant for the experiments described in this paper: fV = 83 Hz forthe forced oscillations related to the approach/retract curves.Thus surface stress effects are dominant. Furthermore the factthat the magnitude of the surface stress only depends on thedifference in the surface properties of both surfaces (tip sideand backside) of the cantilever – and not on the distancebetween the cantilever and the counter electrode as with elec-trostatic force – well explains our observation of a tip–sample
interaction force constant during the most of each approachcurve. This feature further proves that the experimental resultswe described above are related to the surface stress effect.
As mentioned in the Material and methods section, theelectrical connection with the cantilever is directly made on itsside holding the AFM tip, the electro-active part of the canti-lever. So an increase in stress of this surface due to a changeof surface electrical properties of the AFM cantilever will bedetected by photodiodes as a more attractive force and thuscauses a decrease of the δFBL signal. The relationship betweenthe (absolute) value of δFBL signal and the surface stress canbe deduced from Stoney’s equation.54,55 We chose a Young’smodulus and a Poisson’s ratio of 150 GPa and 0.3 respectively,typical values for standard silicon cantilevers.37 The length,width and thickness of the cantilever have been taken to be450 µm, 50 µm and 2 µm respectively. Surface stress and δFBLvariations are then related through ΔΓ (in mN m−1) = −1.5 ±0.5 × 10⁻³Δ(δFBL) (in pN). Thus the module of variation ofsurface stress for the fast effect (|Δ(δFBL)| ≈ 40 pN) is in therange of 56 µN m−1.
As mentioned earlier we hypothesize that the variation ofδFBL signal is related to an uptake of electric charges by theAFM tip when contacting the bacteria. We will show now thatthis hypothesis is fully compatible in sign and magnitude withdata currently available about electric charge surface densityfor standard bacteria. In the case of the experiments (Fig. 4c–dand SI03a–c†) performed at a constant potential, 0 mV versusour REF electrode(i.e. Vvs. NHE = +95 mV), this potential ishigher than the potential of zero charge, VPZC. Raiteri et al.
52
indeed found negative values for VPZC for the AFM cantilevers,similarly to ours, they used: between −500 mV/NHE for a goldelectrode in 0.1 M KCl and slightly below 0 V for a Pt electrodein NaClO4/HClO2 solution. It means that,28 in experiments pre-sented in this paper, there is thus a net positive surface chargeon the cantilever. When referring to the fast effect (Fig. 4 andSI03†) we observe a decrease in δFBL signal upon bacteria.According to preceding remarks, this corresponds to a decreaseof the σV|VPZC
term in Lippmann’s equation (eqn (7)). As voltagemay be considered constant, this is related to an uptake ofnegative charge by the AFM tip when upon the bacteria. FromΔ(δFBL) variation (∼−40 pN upon bacteria for the fast effect,see Fig. 3 and 4) a rough estimation of the uptake charge canbe proposed. We suppose that the charge uptake occurs whenthe two double layers are in contact; it means mainly duringthe repulsive phase of the approach/retract curves (Fig. 2d andf). This lasts τ ≈ 0.5 ms as deduced from extend/retract curves.During that time lapse, ions are supposed to stem from aninterfacial area corresponding to a surface limited bydiffusion, ∼Dτ ≅ 2 μm2, and to charge the surface of the canti-lever (area Lℓ, with L = 450 μm and ℓ = 50 μm). By usingStoney54,55 and Lippmann’s equations successively we obtain arough value of σbact ∼ −0.5 C m−2 for bacterial surface density.For this surface density determination we supposed that theelectric potential is of the order of magnitude of the standardelectrode potential in aqueous solution for platinum at 25 °C,∼1 V versus NHE.56 The value for surface charge we obtained
Nanoscale Paper
This journal is © The Royal Society of Chemistry 2015 Nanoscale, 2015, 7, 8843–8857 | 8853
Ope
n A
cces
s A
rtic
le. P
ublis
hed
on 1
3 A
pril
2015
. Dow
nloa
ded
on 3
/1/2
022
4:14
:26
AM
. T
his
artic
le is
lice
nsed
und
er a
Cre
ativ
e C
omm
ons
Attr
ibut
ion-
Non
Com
mer
cial
3.0
Unp
orte
d L
icen
ce.
View Article Online
from δFBL signal, σbact ∼ −0.5 C m−2, does satisfactorily agreewith values from the literature for Gram positive bacteria atneutral pH: for instance, Bulard et al.57 found around σbact ∼−0.4 C m−2 for Lactococcus lactis in NaCl at 1.5 mM; Poortingaet al.2 measured for several Gram-positive bacteria, includingRhodococci, surface charges ranging from −0.2 C m−2 to −0.5 Cm−2 in 1 mM KNO3. It must be emphasized that our esti-mation of surface charge was done in situ with alive bacteria intheir physiological medium (150 mM). We put the stress onthe fact that this σbact ∼ −0.5 C m−2 value we assessed does notdepend on AFM surface scan size, the number of pixels perline or the electric type of measurement (constant potential oropen circuit). As visible in Fig. 4 and SI03,† the distribution ofthe charges over the bacteria is rather uniform. Some surfaceheterogeneity is however visible: this feature will be detailedbelow. It must be emphasized that during this fast effect theδFBL signal and, in the frame of our hypothesis, the charge ofcantilever, reaches a constant value as soon as the AFM tip isover the bacteria and then keeps a constant charge all over thesurface of the bacteria. This observation may explain why noextra current will flow through the ammeter as seen in Fig. 5aand b. On the opposite, during the so-called slow effect, a con-tinuous increase of δFBL signal is observed corresponding to atotal net change of approximately |Δ(δFBL)| ≈ 400 pN (Fig. 5cand SI05b†), ten times higher than that detected for the fasteffect. From that we can estimate the variation of the totalcharge |ΔQ| ≈ 1.35 × 10⁻¹¹ C. From that, it could tentatively begiven an estimation for related current intensity flowingthrough the system and the ammeter. Indeed similarly to argu-ments invoked above for the fast effect this charge increasemight be considered to occur during an equivalent contacttime between both double layers of τ ≈ 0.5 ms. This wouldlead to a net intensity current of roughly 30 nA, a value of thesame order of magnitude as that observed experimentally, ∼20nA (Fig. 5c). These remarks contribute to strengthening thehypothesis we made of an uptake of electric charge thanks tointermittent contact between both electric double layers, onefrom the underneath substrate and the other from the AFMtip/cantilever complex and its indirect measurement thanks toan electro-mechanical effect based on the variation of flexionof the cantilever through the electrocapillary effect.
We propose the following mechanism to tentatively explainthe process of uptake of electric charges by the AFM tip whenapproaching the sample’s surface. From studies done with theelectrode plunging and emerging from an aqueous electro-lyte27,29,58 it was shown that the electrochemical double layercan be retained intact on an electrode surface as the electrodeis emersed25 to air or vacuum as well. It was indeed provedthat both the charge on the electrode and the potential acrossthe emerging double layer remain fixed as this electrode isremoved.27 The model25 that was proposed is based on thehypothesis that the “unzipping” of the EDL during the electro-de’s emersion takes place just outside the outer Helmholtzplane as defined in classical theory of EDL.28,29 Furthermore itwas detailed that immersion/emersion cycles of the electrodecan be repeated many times without perturbation at any
potential not dominated by Faradaic currents, on either sideof the p.z.c.27
Let us come back to the so-called slow effect. We will nowsuggest a mechanism, related to bacterial metabolism, as ahypothetic explanation for the only detection of the slow effectin the case of a high digitalization rate (Fig. 5c and SI05b†). Itis well known that ion channels are widespread in prokaryoticmembranes.59,60 Some of these ionic channels can presentmechanosensitive properties.61 Numerous studies based onelectrophysiological experiments have indeed shown thatdifferent types of mechanosensitive channels are presentthrough the cytoplasmic membrane of bacteria. These chan-nels (MscL, MscS, and MscM in Escherichia coli cells,62 MscCGin Corynebacterium glutamicum,5 Vibrio cholerae6 etc) canrelease intracellular molecules and ions to reduce osmoticpressure when the cells are challenged with osmotic stresses.Typical channel surface densities are typically in the range of10 channels per micrometer-square.5,6 Furthermore, depend-ing on the activated channel, the time constant of the openingof mechanosensitive channels is in the range of a few10–100 ms.5 From that, we can deduce that this effect mightbe detected in our experiment if the following condition is sat-isfied: the duration for electric contact between the tip and thesubstrate has to be at least in the range of 10–100 ms (time ofopening for one ionic channel) for a scanned surface of0.1 µm2 (minimum area to be scanned to statistically find oneionic channel). As already mentioned, the electric contactbetween the tip and the substrate occurs when both doublelayers are in interaction thus in the repulsive phase. This inter-action time is equal to ∼0.5 ms per pixel. From that, wededuce that the time spent by the tip in electric contact is∼15 ms in the case of digitization rate of 64 pixels and ∼50 msin the case of 128 pixels for an investigated bacterial surfacearea of 0.1 µm2 (AFM images of (4 µm)2). Our experimentsshowed that there is a time threshold between these two limit-ing experimental cases (64p and 128p) we can place at a fewtens of milliseconds. This threshold is compatible with datafrom patch-clamp measurements that measured an openingtime of ionic channels around 10–100 ms as mentioned above.We are thus confident in the fact that the slow effect could berelated to the detection of ionic current stemming from theopening of channels at the bacterial membrane.
As seen in Fig. 6, heterogeneities in surface charge distri-bution are present. The stiffness image related to the heightimage in Fig. 2a is plotted in Fig. 6a: zones of bacteria with aslightly lower stiffness are visible. We will focus our attentionon the circular zone situated on the right bacterium as shownby the white or black circle in Fig. 6a (stiffness data) or 6b(δFBL signal). This heterogeneous zone is better evidenced onheight profiles (Fig. 6c and d, green curves), stiffness curves(Fig. 6c, black curves) and δFBL profile (blue curves in Fig. 6d).Profiles right across the protuberance (full line in Fig. 6a) andslightly above it (dashed line in Fig. 6a) are plotted in Fig. 6cand d: the thick (thin respectively) lines are for the sectionacross (resp. above) the protuberance. This one protuberance islocated between the two dotted-dashed black lines (Fig. 6c and
Paper Nanoscale
8854 | Nanoscale, 2015, 7, 8843–8857 This journal is © The Royal Society of Chemistry 2015
Ope
n A
cces
s A
rtic
le. P
ublis
hed
on 1
3 A
pril
2015
. Dow
nloa
ded
on 3
/1/2
022
4:14
:26
AM
. T
his
artic
le is
lice
nsed
und
er a
Cre
ativ
e C
omm
ons
Attr
ibut
ion-
Non
Com
mer
cial
3.0
Unp
orte
d L
icen
ce.
View Article Online
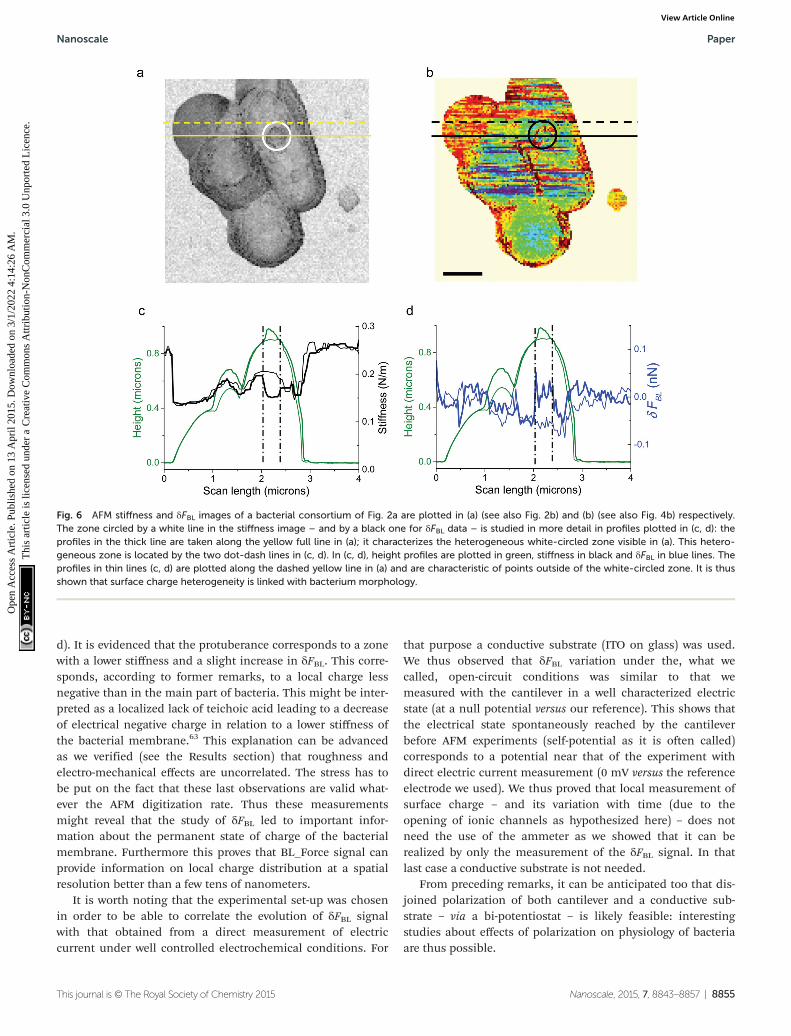
d). It is evidenced that the protuberance corresponds to a zonewith a lower stiffness and a slight increase in δFBL. This corre-sponds, according to former remarks, to a local charge lessnegative than in the main part of bacteria. This might be inter-preted as a localized lack of teichoic acid leading to a decreaseof electrical negative charge in relation to a lower stiffness ofthe bacterial membrane.63 This explanation can be advancedas we verified (see the Results section) that roughness andelectro-mechanical effects are uncorrelated. The stress has tobe put on the fact that these last observations are valid what-ever the AFM digitization rate. Thus these measurementsmight reveal that the study of δFBL led to important infor-mation about the permanent state of charge of the bacterialmembrane. Furthermore this proves that BL_Force signal canprovide information on local charge distribution at a spatialresolution better than a few tens of nanometers.
It is worth noting that the experimental set-up was chosenin order to be able to correlate the evolution of δFBL signalwith that obtained from a direct measurement of electriccurrent under well controlled electrochemical conditions. For
that purpose a conductive substrate (ITO on glass) was used.We thus observed that δFBL variation under the, what wecalled, open-circuit conditions was similar to that wemeasured with the cantilever in a well characterized electricstate (at a null potential versus our reference). This shows thatthe electrical state spontaneously reached by the cantileverbefore AFM experiments (self-potential as it is often called)corresponds to a potential near that of the experiment withdirect electric current measurement (0 mV versus the referenceelectrode we used). We thus proved that local measurement ofsurface charge – and its variation with time (due to theopening of ionic channels as hypothesized here) – does notneed the use of the ammeter as we showed that it can berealized by only the measurement of the δFBL signal. In thatlast case a conductive substrate is not needed.
From preceding remarks, it can be anticipated too that dis-joined polarization of both cantilever and a conductive sub-strate – via a bi-potentiostat – is likely feasible: interestingstudies about effects of polarization on physiology of bacteriaare thus possible.
Fig. 6 AFM stiffness and δFBL images of a bacterial consortium of Fig. 2a are plotted in (a) (see also Fig. 2b) and (b) (see also Fig. 4b) respectively.The zone circled by a white line in the stiffness image – and by a black one for δFBL data – is studied in more detail in profiles plotted in (c, d): theprofiles in the thick line are taken along the yellow full line in (a); it characterizes the heterogeneous white-circled zone visible in (a). This hetero-geneous zone is located by the two dot-dash lines in (c, d). In (c, d), height profiles are plotted in green, stiffness in black and δFBL in blue lines. Theprofiles in thin lines (c, d) are plotted along the dashed yellow line in (a) and are characteristic of points outside of the white-circled zone. It is thusshown that surface charge heterogeneity is linked with bacterium morphology.
Nanoscale Paper
This journal is © The Royal Society of Chemistry 2015 Nanoscale, 2015, 7, 8843–8857 | 8855
Ope
n A
cces
s A
rtic
le. P
ublis
hed
on 1
3 A
pril
2015
. Dow
nloa
ded
on 3
/1/2
022
4:14
:26
AM
. T
his
artic
le is
lice
nsed
und
er a
Cre
ativ
e C
omm
ons
Attr
ibut
ion-
Non
Com
mer
cial
3.0
Unp
orte
d L
icen
ce.
View Article Online

In the experiments presented here, the applied potential(when electric circuitry was used) and the self-potential (in theopposite case) were higher than the potential of zero charge.The same kind of results can be obtained for potentials lowerthan VPZC: indeed in the experiment described in this paper,according to Lippmann’s equation (eqn (6)) a decrease of δFBLis related to an uptake of negative charge whatever the relativepotential of working potential versus VPZC provided that theresulting potential due to the charging does not change inrelative position versus VPZC (as the electrocapillary curve ismaximum at VPZC).
It must be mentioned that typical times for extend andretract ramps of the cantilever have to be chosen in a narrowwindow: larger than that related to reach the charging equili-brium between the two facing double layers (estimated to be ofthe order of ≈10 µs) and lower than those related to relaxationprocesses. As mentioned in the paper by Raiteri et al.52 wherekinetic measurements were performed, these latter processesmay be related to (i) a first effect with an intermediate timeconstant of the order of a few tens of milliseconds andhypothetically attributed to a residual electrochemical effectand (ii) a slower component (around a few tenths of seconds)tentatively related to a “diffusion controlled process”. As men-tioned above, in our experiments, a new charging equilibriumis reached every ∼15 ms at every ramping down of the cantile-ver, therefore minimizing the role of these relaxation processeswith longer time scales. Further studies to study in detail thesetime effects are under way.
Conclusion
We reported an in vivo electromechanical AFM study of chargedistribution on the cell wall of Gram+ Rhodococcus wratislavien-sis bacteria, naturally adherent to a glass substrate, underphysiological conditions. The new method presented in thispaper relies on a detailed study of AFM approach/retract curvesgiving the variation of the interaction force versus distancebetween the tip and the sample. In addition to classical heightand mechanical (as stiffness) data, mapping of local electricalproperties, such as bacterial surface charge, was proved to befeasible at a spatial resolution better than a few tens of nano-meters. This was done by studying the constant level of thecantilever’s bending far away (>10 nm) from the contact zonebetween the AFM tip and the sample during the approach ofthe tip to the sample, the so-called BL_Force signal. The result-ing deflection of the cantilever, due to surface stress variations,comes, as in classical electrocapillary experiments, from thevariation of its surface charge density. The electrical chargingis supposed to occur during the contact of the two electricaldouble layers the typical thickness of which is below 1 nm asthese AFM experiments are performed in a high ionic strengthliquid medium (0.15 M). Estimation of electrical surfacecharge was done and proved to be compatible with resultsfrom standard macroscopic electrophoretic mobility measure-ments. Furthermore, an additional electrical signal detected
by both the deflection of the AFM cantilever and simultaneousdirect current measurements was detected at low scanningrates. It was tentatively attributed to the detection of the currentstemming from ionic channels the opening of which might betriggered by local mechanical overpressure generated by AFMcontact. More work is now needed in order to better understandthe mechanisms for local charging of the cantilever.
This method offers an important improvement in local elec-trical and electrochemical measurements at the solid/liquidinterface, particularly in high-molarity electrolytes when com-pared to techniques focused on the direct use of electrostaticforce. The experimental results presented in this paper tendindeed to prove that the careful study of the BL_Force signal isan elegant way of performing patch-clamp-like experiments onalive bacteria in their physiological medium without the needfor an indirect method such as the preparation of giantspheroplasts by lysozyme digestion of the native bacteria. Thecounterpart is the temporal restriction to variations of electro-mechanical signal slower than a few tens of milliseconds.However it could be overcome soon as further studies aimed toprogress in this direction are under way. The method wedetailed here thus opens a new way to directly investigate“in vivo” biological electrical surface processes involved innumerous practical applications and fundamental problemssuch as bacterial adhesion, biofilm formation, microbial fuelcells, etc.
Acknowledgements
This work was supported by Agence Nationale de la Recherche,Paris, France within the framework of the ECOTECH pro-gramme “BIOPHY”. The authors are grateful to IFP EnergiesNouvelles, Rueil-Malmaison, France (Dr Françoise Fayolle-Gui-chard and Yves Benoit) for the free disposal of Rhodococcuswratislaviensis, IFP 2016 strain, through Dr Fabienne Battaglia,Marie-Christine Dictor, Jean-Christophe Gourry and CarolineMichel, BRGM, Orléans, France. This work was launched atthe Geosciences Montpellier laboratory thanks to the supportof Dr S. Lallemand, J.-L. Bodinier and P. Pezard. S.D. acknowl-edges support from Région Languedoc-Roussillon, France.
References
1 Y. H. An and R. J. Friedman, J. Biomed. Mater. Res., 1998,43, 338–348.
2 A. T. Poortinga, R. Bos, W. Norde and H. J. Busscher, Surf.Sci. Rep., 2002, 47, 1–32.
3 E. M. Sonnenfeld, T. J. Beveridge and R. J. Doyle,Can. J. Microbiol., 1985, 31, 875–877.
4 A. H. Delcour, Annu. Rev. Microbiol., 2013, 67, 179–197.5 Y. Nakayama, K. Yoshimura and H. Iida, Biophys. J., 2013,
105, 1366–1375.6 I. Rowe, M. Elahi, A. Huq and S. Sukharev, J. Gen. Physiol.,
2013, 142, 75–85.
Paper Nanoscale
8856 | Nanoscale, 2015, 7, 8843–8857 This journal is © The Royal Society of Chemistry 2015
Ope
n A
cces
s A
rtic
le. P
ublis
hed
on 1
3 A
pril
2015
. Dow
nloa
ded
on 3
/1/2
022
4:14
:26
AM
. T
his
artic
le is
lice
nsed
und
er a
Cre
ativ
e C
omm
ons
Attr
ibut
ion-
Non
Com
mer
cial
3.0
Unp
orte
d L
icen
ce.
View Article Online
7 S. Dhahri, M. Ramonda and C. Marlière, PLoS One, 2013, 8,e61663.
8 B. W. Hoogenboom, H. J. Hug, Y. Pellmont, S. Martin,P. L. T. M. Frederix, D. Fotiadis and A. Engel, Appl. Phys.Lett., 2006, 88, 193109.
9 M. Pfreundschuh, D. Alsteens, M. Hilbert, M. O. Steinmetzand D. J. Müller, Nano Lett., 2014, 14, 2957–2964.
10 M. Pfreundschuh, U. Hensen and D. J. Müller, Nano Lett.,2013, 13, 5585–5593.
11 M. Nonnenmacher, M. P. O’Boyle andH. K. Wickramasinghe, Appl. Phys. Lett., 1991, 58, 2921–2923.
12 A. L. Domanski, E. Sengupta, K. Bley, M. B. Untch,S. A. L. Weber, K. Landfester, C. K. Weiss, H.-J. Butt andR. Berger, Langmuir, 2012, 28, 13892–13899.
13 N. Kobayashi, H. Asakawa and T. Fukuma, Rev. Sci.Instrum., 2010, 81, 123705.
14 N. Kobayashi, H. Asakawa and T. Fukuma, J. Appl. Phys.,2011, 110, 044315.
15 Intermolecular and Surface Forces, ed. J. N. Israelachvili,Academic Press, San Diego, 3rd edn, 2011, p. iii.
16 T. L. Sounart, H. V. Panchawagh and R. L. Mahajan, Appl.Phys. Lett., 2010, 96, 203505.
17 K. Umeda, K. Kobayashi, N. Oyabu, Y. Hirata,K. Matsushige and H. Yamada, J. Appl. Phys., 2013, 113,154311.
18 G. Gramse, M. A. Edwards, L. Fumagalli and G. Gomila,Appl. Phys. Lett., 2012, 101, 213108.
19 K. Umeda, N. Oyabu, K. Kobayashi, Y. Hirata,K. Matsushige and H. Yamada, Appl. Phys. Express, 2010, 3,065205.
20 D. J. Marchand, E. Hsiao and S. H. Kim, Langmuir, 2013,29, 6762–6769.
21 L. Collins, S. Jesse, J. I. Kilpatrick, A. Tselev, O. Varenyk,M. B. Okatan, S. A. L. Weber, A. Kumar, N. Balke,S. V. Kalinin and B. J. Rodriguez, Nat. Commun., 2014, 5,3871.
22 B. Kenrick, Z. Phys. Chem., 1896, 19, 229.23 B. Jakuszewski and H. Scholl, Electrochim. Acta, 1972, 17,
1105–1111.24 J. Jakuszewski, M. Przasnyski, H. Scholl and A. Siekowska,
Electrochim. Acta, 1975, 20, 119–123.25 W. N. Hansen, Surf. Sci., 1980, 101, 109–122.26 D. M. Kolb and W. N. Hansen, Surf. Sci., 1979, 79, 205–211.27 W. N. Hansen, C. L. Wang and T. W. Humpherys, J. Electro-
anal. Chem. Interfacial Electrochem., 1978, 93, 87–98.28 A. J. Bard and L. R. Faulkner, Electrochemical methods: fun-
damentals and applications, ed. A. J. Bard andL. R. Faulkner, Wiley, New York, 2nd edn, 2001, New York:Wiley, c1980.
29 W. N. Hansen, J. Electroanal. Chem. Interfacial Electrochem.,1983, 150, 133–140.
30 Y.-H. Yoon, D.-H. Woo, T. Shin, T. D. Chung and H. Kang,J. Phys. Chem. C, 2011, 115, 17384–17391.
31 R. Shuttleworth, Proc. Phys. Soc. Sect. A, 1950, 63, 444.32 R. Raiteri, H.-J. Butt and M. Grattarola, Electrochim. Acta,
2000, 46, 157–163.
33 D. Sander, U. Linke and H. Ibach, Surf. Sci., 1992, 272, 318–325.
34 H. Ibach, C. E. Bach, M. Giesen and A. Grossmann, Surf.Sci., 1997, 375, 107–119.
35 H.-J. Butt, J. Colloid Interface Sci., 1996, 180, 251–260.36 R. Raiteri, M. Grattarola, H.-J. Butt and P. Skládal, Sens.
Actuators, B, 2001, 79, 115–126.37 G. Thakur, K. Jiang, D. Lee, K. Prashanthi, S. Kim and
T. Thundat, Langmuir, 2014, 30, 2109–2116.38 D. M. Mohilner and N. Hackerman, Electrochim. Acta, 1966,
11, 1669–1684.39 F. Fayolle, G. Hernandez, F. L. Roux and
J.-P. Vandecasteele, Biotechnol. Lett., 1998, 20, 283–286.40 P. Piveteau, F. Fayolle, J. P. Vandecasteele and F. Monot,
Appl. Microbiol. Biotechnol., 2001, 55, 369–373.41 JPK Instruments, Nanowizard 3.42 R. Levy and M. Maaloum, Nanotechnology, 2002, 13, 33–37.43 D. J. Muller, D. Fotiadis, S. Scheuring, S. A. Muller and
A. Engel, Biophys. J., 1999, 76, 1101–1111.44 H. Janovjak, J. Struckmeier and D. J. Müller, Eur. Biophys.
J., 2005, 34, 91–96.45 M. Guggisberg, M. Bammerlin, C. Loppacher, O. Pfeiffer,
A. Abdurixit, V. Barwich, R. Bennewitz, A. Baratoff, E. Meyerand H.-J. Güntherodt, Phys. Rev. B, 2000, 61, 11151–11155.
46 L. Fumagalli, G. Ferrari, M. Sampietro, I. Casuso,E. Martínez, J. Samitier and G. Gomila, Nanotechnology,2006, 17, 4581.
47 G. Gouy, J. Phys. Radium, 1910, 9, 457.48 G. Gouy, Compt. Rend., 1910, 149, 654.49 D. L. Chapman, Philos. Mag., 1913, 25, 475.50 O. Stern, Z. Elektrochem., 1924, 30, 508.51 J. H. Weijs, J. H. Snoeijer and B. Andreotti, Phys. Rev. E,
2014, 89, 042408.52 R. Raiteri and H.-J. Butt, J. Phys. Chem., 1995, 99, 15728–
15732.53 K. Umeda, K. Kobayashi, K. Matsushige and H. Yamada,
Appl. Phys. Lett., 2012, 101, 123112.54 G. G. Stoney, Proc. R. Soc. London, Ser. A, 1909, 82, 172–175.55 J. E. Sader and L. White, J. Appl. Phys., 1993, 74, 1–9.56 A. J. Bard, R. Parsons and J. Jordan, Standard Potentials in
Aqueous Solution, CRC Press, New York, 1st edn, 1985.57 E. Bulard, M.-P. Fontaine-Aupart, H. Dubost, W. Zheng,
M.-N. Bellon-Fontaine, J.-M. Herry and B. Bourguignon,Langmuir, 2012, 28, 17001–17010.
58 W. N. Hansen, C. L. Wang and T. W. Humphryes, J. Electro-anal. Chem. Interfacial Electrochem., 1978, 90, 137–141.
59 D. Ren, B. Navarro, H. Xu, L. Yue, Q. Shi andD. E. Clapham, Science, 2001, 294, 2372–2375.
60 B. Martinac, Y. Saimi and C. Kung, Physiol. Rev., 2008, 88,1449–1490.
61 B. Martinac, M. Buechner, A. H. Delcour, J. Adler andC. Kung, Proc. Natl. Acad. Sci. U. S. A., 1987, 84, 2297–2301.
62 N. Levina, S. Totemeyer, N. R. Stokes, P. Louis, M. A. Jonesand I. R. Booth, EMBO J., 1999, 18, 1730–1737.
63 E. M. Sonnenfeld, T. J. Beveridge, A. L. Koch andR. J. Doyle, J. Bacteriol., 1985, 163, 1167–1171.
Nanoscale Paper
This journal is © The Royal Society of Chemistry 2015 Nanoscale, 2015, 7, 8843–8857 | 8857
Ope
n A
cces
s A
rtic
le. P
ublis
hed
on 1
3 A
pril
2015
. Dow
nloa
ded
on 3
/1/2
022
4:14
:26
AM
. T
his
artic
le is
lice
nsed
und
er a
Cre
ativ
e C
omm
ons
Attr
ibut
ion-
Non
Com
mer
cial
3.0
Unp
orte
d L
icen
ce.
View Article Online