an index measuring adherence to new zealand infant feeding
TRANSCRIPT

An index measuring adherence to New Zealand Infant Feeding Guidelineshas convergent validity with maternal socio-demographic and healthbehaviours and with children’s body size
Teresa G. Castro1,2*, Sarah Gerritsen2,4, Juliana A. Teixeira3, Avinesh Pillai4, Dirce Maria L. Marchioni3,Cameron C. Grant5, Susan M. B. Morton4 and Clare R. Wall11Nutrition Section, Faculty of Medical Sciences, University of Auckland, Auckland, New Zealand2Department of Epidemiology and Biostatistics, School of Population Health, University of Auckland, Auckland, New Zealand3Department of Nutrition, School of Public Health, University of Sao Paulo, Sao Paulo, Brazil4Centre for Longitudinal Research, School of Population Health, University of Auckland, Auckland, New Zealand5Department of Paediatrics: Child and Youth Health, School of Medicine, University of Auckland, Auckland, New Zealand
(Submitted 28 September 2020 – Final revision received 10 May 2021 – Accepted 16 May 2021)
AbstractUsing data from a nationally generalisable birth cohort, we aimed to: (i) describe the cohort’s adherence to national evidence-based dietaryguidelines using an Infant Feeding Index (IFI) and (ii) assess the IFI’s convergent construct validity, by exploring associations with antenatalmaternal socio-demographic and health behaviours and with child overweight/obesity and central adiposity at age 54 months. Data werefrom theGrowing Up in New Zealand cohort (n 6343). The IFI scores ranged from zero to twelve points, with twelve representing full adherenceto the guidelines. Overweight/obesity was defined by BMI-for-age (based on the WHO Growth Standards). Central adiposity was defined aswaist-to-height ratio> 90th percentile. Associations were tested using multiple linear regression and Poisson regression with robust variance(risk ratios, 95 % CI). Mean IFI score was 8·2 (SD 2·1). Maternal characteristics explained 29·1 % of variation in the IFI score. Maternal age, edu-cation and smoking had the strongest independent relationships with IFI scores. Compared with children in the highest IFI tertile, girls in thelowest and middle tertiles were more likely to be overweight/obese (1·46, 1·03, 2·06 and 1·56, 1·09, 2·23, respectively) and boys in the lowesttertile were more likely to have central adiposity (1·53, 1·02, 2·30) at age 54 months. Most infants fell short of meeting national Infant FeedingGuidelines. The associations between IFI score and maternal characteristics, and children’s overweight/obesity/central adiposity, were in theexpected directions and confirm the IFI’s convergent construct validity.
Keywords: Infant feeding: Dietary index: Dietary guidelines: Child obesity: Waist circumference
Dietary practices in early life represent a unique opportunity totackle all forms of malnutrition. Promotion of breast-feeding andtimely introduction, at around age 6 months, of nutritious,diverse foods in sufficient quantity and quality not only fosterschildren’s growth and cognitive development but can also pre-vent overweight and obesity during early childhood, and obesityand diet-related diseases at adulthood(1,2). In addition, the expo-sure of infants in the first months of life to varied tastes throughbreast milk and diverse and adequate foods facilitates the accep-tance of nutritious food both at the time and in later life(1).
Holistic assessment of infant feeding practices via diet qualityindices (scores), rather than the assessment of individualnutrients or feeding practices, enables evaluation of how closely
eating patterns align with evidence-based dietary guidelines(3).This a priori approach allows analyses of the cumulative impactover time of thewhole diet on health outcomes(5). Consequently,there is interest in the use and assessment of dietary scores/indices, as childhood food habits and behaviours can trackovertime and predict diet-related diseases later in life(4).
However, in high-income countries, the use and applicationof diet indices in early life have not been fully explored. Reviewsin this space indicate that further research is needed to betterunderstand diet quality throughout early childhood and relation-ships with health-related outcomes(3). There is also a lack ofinformation on the validity of the developed indices, an aspectwhich is crucial for assessing the impact of adherence to dietary
* Corresponding author: Teresa Gontijo de Castro, email [email protected]
Abbreviations: CAPI, computer-assisted personal interview; IFI, Infant Feeding Index; NZ, New Zealand; PA, physical activity; WC, waist circumference; WtHR,waist-to-height ratio.
British Journal of Nutrition, page 1 of 13 doi:10.1017/S0007114521001720© The Author(s), 2021. Published by Cambridge University Press on behalf of The Nutrition Society. This is an Open Access article, distributedunder the terms of the Creative Commons Attribution licence (http://creativecommons.org/licenses/by/4.0/), which permits unrestricted re-use,distribution, and reproduction in any medium, provided the original work is properly cited.
Dow
nloaded from https://w
ww
.cambridge.org/core . IP address: 65.21.228.167 , on 28 N
ov 2021 at 11:11:09 , subject to the Cambridge Core term
s of use, available at https://ww
w.cam
bridge.org/core/terms . https://doi.org/10.1017/S0007114521001720

guidelines in early life on health outcomes through the lifecourse(5).
Ruel and Menon(6) developed an Infant Feeding Index (IFI)for use in developing countries that has been used in a numberof studies to describe adherence with international InfantFeeding Guidelines and to investigate the relationship of adher-ence with child anthropometric indicators(6–9). However, this IFIdid not adequately describe aspects of diet necessary to deter-mine the relationship of infant feeding practices with the riskof obesity and non-communicable diseases in childhood(10).A recent publication highlighted the need to redesign guidancefor complementary feeding practices as one of the ten prioritycandidates for double-duty actions aimed at reducing the doubleburden ofmalnutrition globally(1). In particular, there should be agreater emphasis on guidelineswhich specifically recommend tonot feed young children foods, snacks and beverages high inenergy, sugar, fat and salt(1). In fact, the WHO and the UnitedNation Children’s Fund have recently launched the revisedindicators of infant and young child feeding practices, whichadvise against providing to this age group sweet drinks andunhealthy foods, characterised by being energy-dense, nutrientpoor and high in salt, sugar, saturated and/or trans-fatty acids(11).
To our knowledge, only oneprevious study, using data from theAvon Longitudinal Study of Parents and Children, has created andvalidated an IFI that has broad application to high-income coun-tries, based on guidelines from Australia, New Zealand (NZ),North America and the UK(12,13). However, part of the indicatorcomponents that constitute this index(12,13) is not recommendedpractice inNZ(2), such as feedingondemand, timingof lumpy foodsintroduction and exposure to commercial infant foods.
Recently an IFI(14)based on the NZ Food and NutritionGuidelines for Healthy Infants and Toddlers(2), referred fromhere as the Infant Feeding Guidelines, was developed using datafrom the Growing Up in New Zealand study, a contemporarynationally generalisable birth cohort(15). Face and content valid-ity of the IFI were assumed, as it was developed based on theacademic and policymaker’s expertise and practice(14,16). Fulland complete assessment of criterion validity of diet qualityindices is not possible as there are currently no gold standardsfor diet quality(17). In paediatric populations, the assessment ofthe convergent construct validity of a diet quality index repre-sents an important method for examining the usefulness ofthe index for a particular setting(3).
In the present study, we aimed to: (i) describe the adherenceof the Growing Up in New Zealand cohort to the nationallyrecommended infant feeding practices using the IFI and(ii) assess the IFI’s convergent validity, by exploring its associa-tions with antenatal maternal socio-demographic and healthbehaviours and with child overweight/obesity and centraladiposity at age 54 months.
Methods
Study population, data collection waves andethical approval
This investigation was conducted within the contemporary NZbirth cohort study, Growing Up in New Zealand, which enrolled
6822 pregnant women and their 6853 children who survived toage 6weeks(15). Eligibilitywas definedby residencywithin a regionof NZ chosen for its ethnic and socio-economic diversity and hav-ing an estimated delivery date between 25April 2009 and 25March2010. The cohort at birth was broadly generalisable by ethnicityand socio-economic position to all NZ births from 2007 to 2010.This study was conducted according to the guidelines laid downin theDeclaration of Helsinki, and all procedures involving humansubjects were approved by the the Ministry of Health Northern YRegional Ethics Committee (NTY/08/06/055). Written informedconsent was obtained from all mothers/caregivers(15).
We used information from five data collection waves,completed antenatally and when the cohort children wereapproximately 6 weeks, 9, 31 and 54 months old. The antenatalinterview was completed by all 6822 enrolled women. Of the6853 children enrolled in the cohort, the respective proportionsof children for whom the 6-week, 9-, 31- and 54-month inter-views were completed were 99·9, 94·5, 92·3 and 89·8 %(18).
Data on maternal socio-demographic and health behaviourcharacteristics were obtained from the antenatal face-to-facecomputer-assisted personal interview (CAPI), collected in2008/2009. Infants’ perinatal information (sex, fetal count, birthand gestational age) and infants’ feeding status in the first fewweeks of life were obtained from the 6-week computer-assistedtelephone interview. Information on infant dietary intake andage of food introduction were obtained from the 9-month CAPI.Variables describing initiation and duration of any and exclusivebreast-feeding were derived from the 6-week computer-assistedtelephone interview, 9-month CAPI and the 31-month com-puter-assisted telephone interview. The 54-month CAPI providedinformation on children’s screen use and anthropometricmeasure-ments of weight (W), height (H) and waist circumference (WC).
The sample for this study was limited to cohort children aged6–12 months, when the 9-month CAPI took place (n 6343);97·9 %of the infants for whom the 9-month CAPIwas completed.Analyses examining the associations between the infants’scoring in the IFI and antenatal maternal characteristics andbetween the IFI scoring and the child’s anthropometricoutcomes at 54-month CAPI excluded twins/triplets, children witha birthweight less than 2500 g or gestational age less than 37weeksage. Twins/triplets were excluded so that only independentobservations were included. Children with a birth weight less than2500 g or gestational age less than 37 weeks age were excludedbecause the Infant Feeding Guidelines(2) may not be appropriatefor preterm or low-birth weight babies, many of whom would befollowing tailored clinical nutrition guidelines.
The analyses examining associations of the infants’ IFI scorewith child BMI-for-age and waist-to-height ratio (WtHR) wererestricted to children for whom both the 9- and 54-monthCAPI were completed, and for whom information on W and H(for BMI-for-age) and on WC and H (for WtHR) was collectedat the 54-month CAPI (online Supplementary Fig. S1).
Adherence to national recommended infant feedingpractices
The IFI was previously developed(14) based on the Infant FeedingGuidelines(2) thatwere currentwhen the 9-month CAPI tookplace.
2 T. G. Castro et al.
Dow
nloaded from https://w
ww
.cambridge.org/core . IP address: 65.21.228.167 , on 28 N
ov 2021 at 11:11:09 , subject to the Cambridge Core term
s of use, available at https://ww
w.cam
bridge.org/core/terms . https://doi.org/10.1017/S0007114521001720

The guidelineswere based on the international evidence about thetypes of food and nutrition that supports health and developmentfor this age group, interpreted for the NZ population(2). The indica-tors that compose the IFI were created using statements inthe Infant Feeding Guidelines(2) that were applicable to infants< 12-months-old and able to be measured with the GrowingUp in New Zealand data. The IFI contains indicators of breast-feeding, dietary intake and age of food introduction(14). At the9-month CAPI, information on dietary intake and age of foodintroduction were collected using a semi-quantitative FFQ. TheFFQ was adapted from the tool used by the SouthamptonWomen’s Survey study(19) with mothers asked to report theage of introduction and baby’s current frequency of intake oftwenty-five food items, including infant milk formula or milk otherthan breast milk(20). Mothers were also asked if their infants evertried any infant formula ormilkother thanbreastmilk and the typesof milk and infant formula. The FFQ’s food list was designed by anexperienced academic paediatric dietitian, who selected itemsbasedon the Infant FeedingGuidelines(2) and foods andbeveragescommonly fed to NZ infants(21). The selection and scoring of theindicators to compose the IFI were determined by consensusagreement between five academics with nutritional expertise,one academic general paediatrician and the Nutrition Policy teamat the NZ Ministry of Health.
The IFI was further refined with developers. The IFIscore represents the sum of the twelve infant feeding indicators(with maximum score of one point each, twelve in total), wherehigher score indicates greater adherence to the Infant FeedingGuidelines. Details on the indicators’ link to the statementsof the Infant Feeding Guidelines(2) and on their scoring areprovided in Table 1.
Antenatal maternal socio-demographic and healthbehaviour characteristics
Antenatal maternal socio-demographic and health behaviourvariables that could potentially affect adherence with recom-mended infant feeding practices were examined. The socio-demographic variables assessed were parity; pregnancyplanning; level of education completed; age; length of migrationto NZ; maternal self-prioritised ethnicity level 1 and theNZDep2006 Index of Deprivation, which is a well-validatedsmall area measure of neighbourhood deprivation(22). In NZ,ethnicity is self-identified, and individuals can identify withmultiple ethnicities. Based on this identification, the self-prioritised ethnicity level 1 is an ethnic group classification basedon the Statistics NZ(23) prioritisation of the allocation of individ-uals to one ethnic group. Thus, the ethnic grouping used in thisstudy was as follows: (1) European, (2) Māori, (3) Pacific People,(4) Asian, (5) Middle Eastern, Latin American and African and(6) other. The categories Middle Eastern, Latin American andAfrican and other were combined for analysis purposes. TheNZDep06 combines nine socio-economic characteristics fromthe 2006 census data collected at aggregations of approximately100 people and assigned to individual households based ongeo-coded address data(22).
The antenatal maternal health behaviour variablesexamined were adherence to nutrition guidelines in pregnancy;
pre-pregnancy BMI; smoking patterns before/during pregnancyand physical activity (PA) before/during pregnancy. The assess-ment of daily intakes during pregnancy of: vegetables and fruit;breads and cereals; milk and milk products; and lean meat, meatand alternatives and eggs was based in the number of servingsconsumed and comparing to the national recommendations forpregnant women when the antenatal interview took place(24).Pre-pregnancy BMI was calculated based on self-reportedweight and height and was classified according to the WHOcut-offs(25). Smoking patterns pre/during pregnancy werecategorised as continued smoking, stopped smoking andnon-smokers. PA during pregnancy was estimated using theInternational Physical Activity Questionnaire. Participants wereasked about intensity (moderate or vigorous), duration (< 30,30–60,> 60 min) and frequency (days per week) of activity(26).Women who engaged in moderate PA for at least 30 min forat least 5 out of 7 d, or vigorous PA for at least 30 min on at least2 out of 7 d were classified as participating in moderate/vigorousactivity. The PA categories examined were no moderate/vigorous PA before or during pregnancy, moderate/vigorousPA before and during pregnancy, and moderate/vigorous PAonly before or during pregnancy.
Children’s BMI-for-age, waist-to-height ratio andscreen use at the 54-month interview
Each child’s exact age (in months) at the 54-month CAPI wascalculated by the difference from the date of the interviewand the child’s date of birth. Measurements of each child’s W,H and WC were collected by trained interviewers according tothe international protocols (for W and H)(25) and national proto-cols (forWC)(27). Wmeasurements in kg were taken using TanitaDigital scale (Model HD-351), with a capacity of 200 kg and pre-cision of 0·1 kg. H measurements in cm were taken using a laserstadiometer (Precaster CA600), with capacity of 50 m and preci-sion of 0·2 cm. WC measurements were taken, using a standardflexible plastic measuring tape that is used for dressmaking. Formeasuring, W and H children wore light clothes, had shoes offand no hair ornaments. WC was measured over light clothing atthe midpoint between the lower margin of the least palpable riband the top of the iliac crest. Measurements ofW,H andWCweretaken in duplicate and if the differences between measurementswere greater than 0·5 kg, 1 cm and 1 cm forW,H andWC, respec-tively, a third measurement was collected. The final measure-ments of W, H and WC were defined as the average value oftwo measurements or the average of the two closest values.
Children’s BMI-for-age values were calculated accordingto the WHO 2006 Growth Standards(28). Children withBMI-for-age greater than þ2 z-scores were classified as beingoverweight/obese. Children with BMI-for-age values greaterthan þ5 z-scores were considered as BMI-for-age outliervalues(28). The WtHR was calculated by dividing the WC (cm)by the H (cm). The cut-off of the 90th percentile was used todefine central adiposity.
Mothers or caregivers reported the average minutes on ausual weekday their child watched television (including free-to-air, online and pay television or DVD either on televisionor other media) and used electronic media (e.g. computer or
Infant Feeding Index construct validity 3
Dow
nloaded from https://w
ww
.cambridge.org/core . IP address: 65.21.228.167 , on 28 N
ov 2021 at 11:11:09 , subject to the Cambridge Core term
s of use, available at https://ww
w.cam
bridge.org/core/terms . https://doi.org/10.1017/S0007114521001720

Table 1. Indicators included in and the scoring of the infant feeding index and links of each indicator with the NZ Infant Feeding Guidelines
Indicator Categories/scoringMaximumscore Linking statement in the NZ Infant Feeding Guidelines(12)
Duration of any breast-feedingDose–response score: gradual increase to
12 months or beyond of duration
None 0 1·0 Statement 3: When your baby is ready, introduce him or herto appropriate complementary foods and continue tobreastfeed until they are at least one year of age, orbeyond
≤1 month* 0·0832 months 0·1663 months 0·2494 months 0·3325 months 0·4156 months 0·4987 months 0·5818 months 0·6649 months 0·74710 months 0·83011 months 0·913≥ 12 months 1·0
Duration of exclusive breast-feedingDose–response score with U-shape:
gradual increase to 6 months anddecrease from 7 months of duration
None 0 1·0 Statement 2: Exclusively breastfeed your baby until yourbaby is ready for and needs extra food – this will be ataround 6 months of age
≤ 1 month* 0·22 months 0·43 months 0·64 months 0·85–6 months 1·07 months 0·88 months 0·69 months 0·4
Age of introduction of solids ≤ 4 months 0 1·0 Statement 3: When your baby is ready, introduce him or herto appropriate complementary foods and continue tobreastfeed until they are at least one year of age,or beyond
5–6 months 1·0≥ 7 months 0
Eating across the four food groups daily No 0 1·0 Statement 4: Increase the texture, variety, flavour and amountof food offered so that your baby receives a complementaryintake of nutrients, especially Fe and vitamin C, and iseating more family foods by 1 year of age
Yes 1·0
Vegetable intake frequency None or less thandaily
0 1·0 Statement 4: Increase the texture, variety, flavour and amountof food offered so that your baby receives a complementaryintake of nutrients, especially Fe and vitamin C, and iseating more family foods by 1 year of age
≥ 1 and< 2 times/daily
0·5
≥ 2 times/daily 1·0Fruit intake frequency None or less than
daily0 1·0 Statement 4: Increase the texture, variety, flavour and amount
of food offered so that your baby receives a complementaryintake of nutrients, especially Fe and vitamin C, and iseating more family foods by 1 year of age
≥ 1 and< 2 times/daily
0·5
≥ 2 times/daily 1·0Fe-rich foods intake frequency None or less than
daily0 1·0 Statement 4: Increase the texture, variety, flavour and amount
of food offered so that your baby receives a complementaryintake of nutrients, especially Fe and vitamin C, and iseating more family foods by 1 year of age
≥ 1 time/daily 1·0
Inappropriate milk drinks tried prior tothe 9-month interview
No 1·0 1·0 Statement 3: When your baby is ready, introduce him or herto appropriate complementary foods and continue tobreastfeed until they are at least one year of age,or beyond
Statement 6: If your baby is not fed breast milk, then use aninfant formula as the milk source until your baby is 1 yearof age
Yes 0
Inappropriate other drinks tried prior to the9-month interview
No 1·0 1·0 Statement 10: Do not give your infant or toddler alcohol,coffee, cordials, juice, soft drink, tea (including herbaldrinks) and drinks containing caffeine
Yes 0
Inappropriate foods tried prior to the9-month interview
No 1·0 1·0 Statement 5: For your baby, prepare or choose pre-preparedcomplementary foods with no added fat, salt, sugar, honeyor other sweeteners
Yes 0
Addition of salt to baby’s meals Yes (or sometimes) 0 1·0 Statement 5: For your baby, prepare or choose pre-preparedcomplementary foods with no added fat, salt, sugar, honeyor other sweeteners
No 1·0
Addition of sugar to baby’s meals Yes (or sometimes) 0 1·0 Statement 5: For your baby, prepare or choose pre-preparedcomplementary foods with no added fat, salt, sugar, honeyor other sweeteners
No 1·0
Total points in the Infant Feeding Index 12·0
* Category includes infants who were breastfed for 14 d or less.
4 T. G. Castro et al.
Dow
nloaded from https://w
ww
.cambridge.org/core . IP address: 65.21.228.167 , on 28 N
ov 2021 at 11:11:09 , subject to the Cambridge Core term
s of use, available at https://ww
w.cam
bridge.org/core/terms . https://doi.org/10.1017/S0007114521001720
laptop, including children’s computer systems such as Leapfrog,iPads, tablets, smart phones and any electronic gaming devices).Children’s total screen use (min/d) was calculated by summingthe average time spent in these activities. Recommended aver-age screen use was defined by the international screen useguidelines(30) as< 60 min/d.
Statistical analysis
Descriptive statistics were reported using means and standarddeviations, medians and value range for continuous variablesand proportions for categorical variables. Proportions andmeans were compared, respectively, using the χ2 test andStudent t tests for independent samples.
Associations between the IFI score (dependent variable) andantenatal maternal socio-demographic and health behaviourcharacteristics (independent variables) were examined in unad-justed and adjusted linear regression models with associationsdescribed using β-coefficients and 95 % confidence intervals(95 % CI). Univariate associations with P< 0·15 were used toidentify variables to be tested in the multiple variable linearregression model, following a forward stepwise approach.Covariates were retained in the adjusted models if associationswith the outcome had P< 0·05 or changed the magnitude ofthe β-coefficient by 10 % or more.
Associations between the children overweight/obesity andcentral obesity at 54 months (dependent variables) and the IFIscore (independent variable) were examined in unadjustedand adjusted Poisson regression models with robust variancewith associations described using risk ratios and 95 % CI. Forthese analyses, infants were categorised into IFI score tertiles,according to their ranking within the complete sample andaccording to their ranking within sexes (for sex-specific analy-ses). In this study, we opted for using Poisson regression withrobust variance as an alternative to the odds ratio (OR), as ORcan overestimate prevalence ratios and this overestimationincreases as the prevalence of the outcome increases(30,31). Toselect the independent variables to be tested in these models,an a priori causal model was used based on the published liter-ature(12,13,32–38). This a priori model assumes that antenatalmaternal socio-demographic and health behaviour variables in-fluence both the IFI score and childhood adiposity and, there-fore, need to be adjusted for in the models. In addition, theanthropometric outcomes measured at the 54-month CAPI werealso adjusted for child sex, exact age and screen time use at thattime point. Univariate associations with P< 0·15 were used toidentify the independent variables to be tested in the multipleregression models, following a forward stepwise approach.Covariates were retained in the final models if associations withthe outcomes had P< 0·05 or changed the magnitude of riskratios by 10 % or more. Models with BMI-for-age as outcomeexcluded the children with BMI-for-age outliers(28). Then, sensi-tivity analyses were performed to check whether the associa-tions between the IFI score and children’s BMI-for-age alteredif the children with BMI-for-age outlier values were includedin the model. Where relevant, analyses were also stratified bysex. All analyses were performed using SPSS software (version25, IBM SPSS Statistics).
Results
Study population
Table 2 shows the distribution of the infants according totheir perinatal characteristics, demographics, screen time useand anthropometric outcomes and their mothers’ socio-demographic and health behaviour characteristics. Except forlow-birth weight and BMI-for-age, there were no statisticallysignificant differences in the distribution of the variables bysex. The majority of the infants (n 6120, 96·5 %) were agedbetween 8 and 12 months when the 9-month CAPI wascompleted. Approximately half of the children were48·0–53·9 months-old when the 54-month CAPI was completed.In relation to girls, a larger proportion of boys were classifiedas overweight/obese (15·7 % v. 12·0 %, P< 0·001) (Table 2).The mean of WtHR in the population was 0·509 (SD 0·038), withno significant statistical differences in means between boys andgirls (t= 0·226; P= 0·821) (data not shown).
Adherence to the Infant Feeding Guidelines
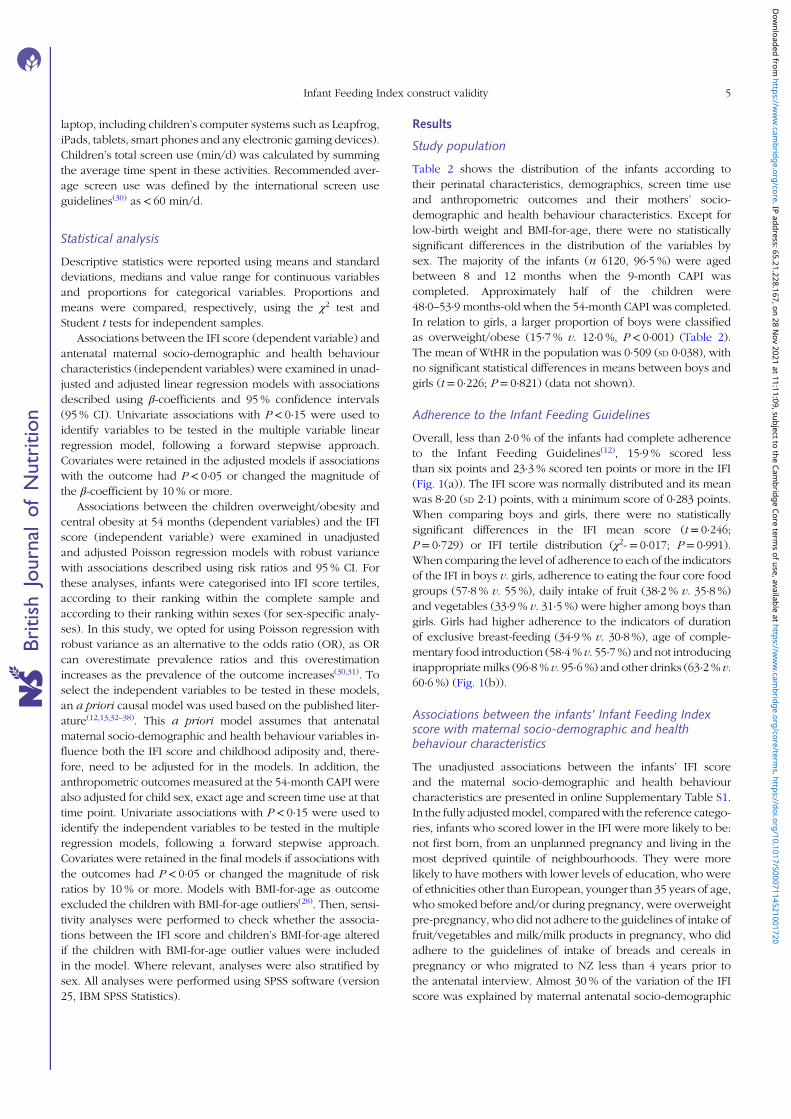
Overall, less than 2·0 % of the infants had complete adherenceto the Infant Feeding Guidelines(12), 15·9 % scored lessthan six points and 23·3 % scored ten points or more in the IFI(Fig. 1(a)). The IFI score was normally distributed and its meanwas 8·20 (SD 2·1) points, with a minimum score of 0·283 points.When comparing boys and girls, there were no statisticallysignificant differences in the IFI mean score (t= 0·246;P= 0·729) or IFI tertile distribution (χ2-= 0·017; P= 0·991).When comparing the level of adherence to each of the indicatorsof the IFI in boys v. girls, adherence to eating the four core foodgroups (57·8 % v. 55 %), daily intake of fruit (38·2 % v. 35·8 %)and vegetables (33·9 % v. 31·5 %) were higher among boys thangirls. Girls had higher adherence to the indicators of durationof exclusive breast-feeding (34·9 % v. 30·8 %), age of comple-mentary food introduction (58·4 % v. 55·7 %) and not introducinginappropriate milks (96·8 % v. 95·6 %) and other drinks (63·2 % v.60·6 %) (Fig. 1(b)).
Associations between the infants’ Infant Feeding Indexscore with maternal socio-demographic and healthbehaviour characteristics
The unadjusted associations between the infants’ IFI scoreand the maternal socio-demographic and health behaviourcharacteristics are presented in online Supplementary Table S1.In the fully adjustedmodel, comparedwith the reference catego-ries, infants who scored lower in the IFI were more likely to be:not first born, from an unplanned pregnancy and living in themost deprived quintile of neighbourhoods. They were morelikely to have mothers with lower levels of education, who wereof ethnicities other than European, younger than 35 years of age,who smoked before and/or during pregnancy, were overweightpre-pregnancy, who did not adhere to the guidelines of intake offruit/vegetables and milk/milk products in pregnancy, who didadhere to the guidelines of intake of breads and cereals inpregnancy or who migrated to NZ less than 4 years prior tothe antenatal interview. Almost 30 % of the variation of the IFIscore was explained by maternal antenatal socio-demographic
Infant Feeding Index construct validity 5
Dow
nloaded from https://w
ww
.cambridge.org/core . IP address: 65.21.228.167 , on 28 N
ov 2021 at 11:11:09 , subject to the Cambridge Core term
s of use, available at https://ww
w.cam
bridge.org/core/terms . https://doi.org/10.1017/S0007114521001720

Table 2. Antenatal maternal socio-demographic and health behaviour characteristics; perinatal characteristics and age of the cohort when the 9-monthinterview was completed; and BMI-for-age, waist-circumference-to-height ratio, screen time usage and demographics of the cohort as measured at the54-month interview (all cohort and by sex)(Numbers and percentages)
VariablesAll cohort
n (column %)Girls
n (column %)Boys
n (column %) P*
Mothers antenatal socio-demographic and health behaviour characteristics (n 6343)†Pregnancy planningYes 3897 61·8 1907 62·6 1990 61·0 0·19No 2407 38·2 1137 37·4 1270 39·0
Highest level of educationHigher than bachelor’s degree 1021 16·1 488 16·0 533 16·3Bachelor’s degree 1478 23·4 705 23·1 773 23·7 0·59Diploma/trade cert/NCEA 5–6 1939 30·7 937 30·7 1002 30·7Secondary school/NCEA 1–4 1471 23·3 734 24·1 737 22·6No secondary school qualification 408 6·5 187 6·1 221 6·8
Self-prioritised ethnicityEuropean 3511 55·6 1720 56·3 1791 54·9Māori 838 13·3 395 12·9 443 13·6 0·84Pacific 855 13·5 407 13·3 448 13·7Asian 904 14·3 434 14·2 470 14·4MELAA and other 212 3·4 100 3·3 112 3·4
Neighbourhood deprivation (NZDep2006 quintiles)‡1–2 least deprived 1044 16·5 525 17·2 519 15·93–4 1199 18·9 581 19·0 618 18·9 0·645–6 1103 17·4 519 17·0 584 17·97–8 1334 21·1 637 20·8 697 21·39–10 most deprived 1651 26·1 798 26·1 853 26·1
Age group (years)≥ 35 years 1637 25·8 772 25·2 865 26·420–34 years 4419 69·8 2154 70·4 2265 69·2 0·55< 20 years 277 4·4 134 4·4 143 4·4
ParityFirst born 2659 42·0 1280 41·9 1379 42·2 0·79Subsequent 3668 58·0 1778 58·1 1890 57·8
Length of time living in NZ (years)Born in NZ 4141 65·3 2012 65·7 2129 64·9 0·81Living in NZ for> 4 years 1445 22·8 688 22·5 757 23·1Living in NZ for≤ 4 years 757 11·9 364 11·9 393 12·0
Pre-pregnancy BMI (kg/m2)< 25·0 3363 58·9 1597 58·8 1715 59·425–29·99 1299 22·8 642 23·6 627 21·7 0·18≥ 30·0 1045 18·3 479 17·6 544 18·8
Adherence to nutrition guidelines in pregnancy met forFruit and vegetables 1442 24·9 683 24·2 759 25·5 0·27Breads and cereals 1547 26·7 744 26·4 803 26·9 0·62Milk and milk products 3376 58·2 1650 58·5 1726 57·9 0·66Meats and alternatives and eggs 1265 21·8 601 21·3 664 22·3 0·37
Smoking before and during pregnancyNon-smokers before and during pregnancy 4658 80·5 2291 81·6 2367 79·6 0·15Stopped smoking during pregnancy 560 9·7 254 9·0 306 10·3Smokers before and during pregnancy 565 9·8 264 9·4 301 10·1
Physical activity before and during pregnancy§Moderate/vigorous physical activity before and during pregnancy 1951 33·6 945 33·5 1006 33·8 0·97Moderate/vigorous physical activity only before or during pregnancy 1536 26·5 747 26·5 789 26·5No moderate/vigorous physical activity before and during pregnancy 2314 39·9 1129 40·0 1185 39·8
Cohort children’s perinatal characteristics and demographics at the 9-month interview (n 6343)†Singleton/twins/tripletsSingletons 6179 97·4 2973 97·0 3206 97·8 0·09Twins/triplets 164 2·6 89 2·9 69 2·1
Premature gestation (< 37 weeks)Yes 405 6·4 196 6·4 209 6·4 0·97No 5931 93·5 2885 93·6 3066 93·6
Low-birth weight (< 2500 g)Yes 307 4·1 170 5·6 137 4·2 0·01No 6035 95·2 2893 94·4 3142 95·8
Exact age at the 9-month interview (months)6·0–7·9 223 3·5 109 3·6 114 3·5 0·838·0–9·9 5717 90·1 2766 90·3 2951 90·010·0–12·0 403 6·4 189 6·2 214 6·5
6 T. G. Castro et al.
Dow
nloaded from https://w
ww
.cambridge.org/core . IP address: 65.21.228.167 , on 28 N
ov 2021 at 11:11:09 , subject to the Cambridge Core term
s of use, available at https://ww
w.cam
bridge.org/core/terms . https://doi.org/10.1017/S0007114521001720

and health behaviour characteristics (R2 of the final model= 0·291). The three maternal characteristics that had the strong-est independent relationship with the IFI score, in the descend-ing order of magnitude of associations, were: maternal age, levelof education and smoking before and/or during pregnancy(Table 3).
Associations between the infants’ Infant Feeding Indexscores with anthropometric indicators at the 54-monthinterview
The proportion of children with overweight/obesity at the54-month CAPI and the unadjusted associations between child-ren’s overweight/obesity and the covariates under study are pre-sented in online Supplementary Tables S2 and S3. In the fullyadjusted model including all children, the association betweenthe IFI tertile and overweight/obesity was not statistically signifi-cant when compared with children who scored in the lowest ter-tile of the IFI with those who scored in the middle or highesttertiles. In the analysis stratified by sex, girls who scored inthe lowest and middle tertiles were 56 and 46 % more likely tobe overweight/obese at the 54-month CAPI, respectively, com-pared with girls in the highest tertile. There was also a significanttrend effect of lower adherence to the IFI and higher prevalence
of overweight/obesity among girls (Table 4). Sensitivity analysesincluding girls with BMI-for-age outliers also identifiedsimilar statistically significant associations between over-weight/obesity and the lowest IFI tertile compared with thehighest IFI tertile (risk ratios= 1·48, 95 % CI 1·06, 2·08,P= 0·03). This association was not statistically significant forthe middle v. highest tertile of the IFI but approached statisticalsignificance (risk ratios= 1·37, 95 % CI 0·98, 1·90, P= 0·06).There was no significant association between the IFI scoreand overweight/obesity among boys in the main analysis andin the sensitivity analysis (data not shown).
The proportion of children with WtHR greater than 90th cen-tile at the 54-month CAPI and the unadjusted associationsbetween children’s WtHR and the covariates under study arepresented in online Supplementary Tables S4 and S5. Therewere statistically significant associations between the IFI scoreand WtHR> 90th centile in the models including all the childrenand separately for boys. There was no significant associationbetween the IFI score and WtHR> 90th centile for girls. Boyswho scored in the first tertile of the IFI (compared with the thirdtertile) were 53 % more likely to have central adiposity at the54-month CAPI. A significant trend effect of lower adherenceto the IFI and higher prevalence of central adiposity was also evi-dent among boys (Table 4).
Table 2. (Continued )
VariablesAll cohort
n (column %)Girls
n (column %)Boys
n (column %) P*
SexGirls 3064 48·3 – – –Boys 3279 51·7
Cohort children’s weight status, screen time usage and demographics at the 54-month interview (n 5596)||Screen time usage (average min/weekday)< 60 1070 19·1 543 20·0 527 18·3 0·11≥ 60 4525 80·9 2172 80·0 2352 81·7
BMI/age (WHO growth standard cut points)(26)
Underweight 17 0·3 < 10¶ 10 0·4Normal 4745 85·8 2359 87·8 2386 84·0 < 0·001Overweight 519 9·4 229 8·5 290 10·2Obesity 249 4·5 93 3·5 156 5·5
Waist circumference-to-height ratio (percentiles)≤ 90th 4953 90·2 2394 89·4 2559 90·9 0·07> 90th 540 9·6 283 10·6 257 9·1
Exact age at the 54-month interview (months)48·0–53·9 2563 45·8 1260 46·4 1303 45·2 0·5354·00–59·9 2971 53·1 1428 52·6 1543 53·660·0–68·0 62 1·1 27 1·0 35 1·2
SexGirls 2715 48·5Boys 2881 51·5
NCEA, National Certificate of Educational Achievement; NZDep2006, neighbourhood deprivation index 2006; NZ, New Zealand.Missing for variables listed in the table (n): pregnancy planning (39); maternal education (26); maternal ethnicity (23); neighbourhood deprivation index (12); maternal age (10);parity (16); maternal length of time living in New Zealand (0); maternal BMI (739); maternal adherence to recommended intake of fruit and vegetables in pregnancy (542); maternaladherence to recommended intake of breads and cereals in pregnancy (542); maternal adherence to recommended intake of milk and milk products in pregnancy (542); maternaladherence to recommended intake of meats and alternatives and eggs in pregnancy (544); maternal smoking patterns (560); physical activity before/during pregnancy (542);age at the 9-month interview (0); sex (0); fetal count (0); gestational age (< 10¶); birth weight (< 10¶); age at the 54-month interview ((< 10¶); screen time usage (< 10¶); BMI/age (66); waist to height ratio (103).* χ2 tests for comparisons of proportions between girls and boys.† Infants aged 6–12 months at the 9-month interview.‡ Derived from the 2006 national census according to the methodology described in Salmond et al.(22)
§ Moderate/vigorous physical activity defined as engagement inmoderate physical activity for at least 30min for at least 5 out of 7 d, or vigorous physical activity for at least 30min on atleast 2 out of 7 d.
|| Infants aged 6–12 months at the nine interview and who took part of the 54-month interview.¶ As per Growing up in New Zealand study anonymity requirement, ‘< 10’ represents greater than zero and less than ten children in the cell.
Infant Feeding Index construct validity 7
Dow
nloaded from https://w
ww
.cambridge.org/core . IP address: 65.21.228.167 , on 28 N
ov 2021 at 11:11:09 , subject to the Cambridge Core term
s of use, available at https://ww
w.cam
bridge.org/core/terms . https://doi.org/10.1017/S0007114521001720

Discussion
Statement of principal findings
In this nationally generalisable cohort of children living inNZ, there was poor adherence to national Infant FeedingGuidelines(2), with 15·9 % of the cohort scoring less than sixpoints in the IFI (which has a maximum score of twelve points).Adherence to the national Infant Feeding Guidelines(2) hadstrong associations with maternal socio-demographic inequal-ities and health behaviours, which explained 30 % of the varia-tion in the IFI score. Lower IFI scores were associated with anincreased likelihood of early childhood overweight/obesityand central adiposity, with sex differences evident. Comparedwith girls in the highest IFI tertile, girls in the lowest and middle
tertiles were 46 and 56 %, respectively, more likely to be over-weight/obese at the 54-month CAPI. Compared with boys inthe highest IFI tertile, boys in the lowest tertile of the IFI were53 % more likely to have central adiposity at the 54-monthCAPI. The associations between the IFI gradient score withmaternal characteristics and with children’s overweight/obesityand central adiposity were in the expected directions andconfirm the IFI’s convergent construct validity.
Study findings in relation to other studies
The poor adherence to Infant Feeding Guidelines verified in thisstudy has been identified in many areas around the globe(39).Data assessing individual infant feeding practices across eighty
(a)
(b)
Fig. 1. Distribution of infants (n 6343) according to IFI score (a) and proportion of infants, by sex, who adhered to individual infant feeding indicators (b). Note: 6343infants aged 6–12 months at the nine-month interview. IFI, Infant Feeding Index. Missing (n): infant feeding index (193); duration of any breast-feeding (112); duration ofexclusive breast-feeding (76); age of introduction to solids (31); eating across the four food groups daily (38); vegetables frequency of intake (28); fruit frequency of intake(30); Fe-rich foods frequency of intake (32); inappropriate milks (25); inappropriate other drinks (24); inappropriate foods (24); addition of salt to meals (25); addition ofsugar to meals (25). *Pearson χ2 test (P-values). , girls; , boys
8 T. G. Castro et al.
Dow
nloaded from https://w
ww
.cambridge.org/core . IP address: 65.21.228.167 , on 28 N
ov 2021 at 11:11:09 , subject to the Cambridge Core term
s of use, available at https://ww
w.cam
bridge.org/core/terms . https://doi.org/10.1017/S0007114521001720

countries indicated that less than half of 0–5-month-olds (42 %)were exclusively breastfed and that 43 % of newborns weregiven liquids or foods other than breast milk within the first3 d of life(39). Our finding that less than 2 % of the infants fullyadhered to the overall Infant Feeding Guidelines are consistentwith findings from the Avon Longitudinal Study of Parents andChildren cohort (UK) study in which none of the infants werefully adherent to the overall guidelines (measured by theComplementary Feeding Utility Index)(12).
In this study, approximately 30% of the variation in the IFI scor-ing was explained by antenatal maternal socio-demographic andhealth behaviour characteristics. The few studies that haveassessed infant feeding practices using dietary indices have notinvestigated the contribution that maternal socio-demographicand health behaviours make to the whole infant feeding scorevariation(5–9,12). However, for comparison, the dietary indexmeasuring adherence to Canadian dietary recommendations for3-year-old children found that socio-demographic characteristicsexplained approximately 6% of the index score variation(40).
The associations of maternal socio-demographics and healthbehaviour characteristics with the IFI score were in the expecteddirections and corroborate findings of previous studies thatsocial inequalities are an important influence on the overallfeeding practices of young children(3,5,12,32). Similar to ourfindings, older maternal age and high levels of education werethe main predictors of a high score in the ComplementaryFeeding Utility Index among infants in the Avon LongitudinalStudy of Parents and Children cohort(12), and lower scores inthe Complementary Feeding Utility Index were found amonginfants of mothers with pre-pregnancy BMI greater than25 kg/m2 or who smoked either before or during pregnancy.To date, there has been limited literature providing strongevidence of an association between the dietary quality of parentsand their children(41,42). Authors of a systematic review andmeta-analysis concluded that there was weak resemblance betweenparents and children’s diets, but acknowledged that amongthe twenty-four studies examined, most of them were basedon small samples, about half were conducted in the USA andonly two were based on national data(41). A recent cross-sectional study conducted in seventeen primary schools inDunedin (NZ) found that parents scoring lower in a diet qualityindex score weremore likely to have childrenwith frequent con-sumption of confectionery, chocolate, cakes, biscuits andsavoury snacks, but there was no association between parentand child fruit and vegetable intake(42). Our study found thatpoor adherence to fruit, vegetable and dairy dietary guidelinesduring pregnancy was associated with low adherence toInfant Feeding Guidelines overall (after adjustment for con-founders). The seemingly anomalous finding in our study thatinfants of mothers who adhered to the guideline of daily intakeof breads and cereals had a lower IFI score could potentially beexplained by the fact that the NZ dietary recommendations forpregnant women provide only minimum number of servingsizes for the four core food groups/daily(24). Consequently,women consuming large quantities of breads and cereals (withpotentially excessive energetic intake) would be classified asadhering to the guidelines along with women that have just
Table 3. Adjusted associations between the infant feeding index scoreand maternal socio-demographic and health behaviour characteristics(all cohort, n 5146*)(β-coefficients and 95 % confidence intervals)
Antenatal maternal characteristics Adj. β† 95% CI P
Pregnancy planningYes 1·00No –0·40 –0·51, −0·28 < 0·001
Highest level of educationHigher than bachelor’s degree 1·00 0·42Bachelor’s degree –0·06 –0·22, 0·090Diploma/trade cert/NCEA 5–6 –0·78 –0·93, −0·62 < 0·001Secondary school/NCEA 1–4 –0·64 –0·81, −0·48 < 0·001No secondary school qualification –1·19 –1·45, −0·93 < 0·001
Self-prioritised ethnicityEuropean 1·00Māori –0·91 –1·08, −0·74 < 0·001Pacific –0·62 –0·80, −0·44 < 0·001Asian –0·89 –1·07, −0·71 < 0·001MELAA and others –0·46 –0·73, −0·18 0·001
Neighbourhood deprivation(NZDep2006 quintiles)‡1–2 least deprived 1·003–4 0·02 0·15, 0·18 0·845–6 –0·16 –0·33, 0·01 0·067–8 –0·24 –0·41, −0·08 0·0049–10 most deprived –0·46 –0·63, −0·29 < 0·001
Age group (years)≥ 35 years 1·0020–34 years –0·44 –0·55, −0·32 < 0·001< 20 years –1·39 –1·66, −1·11 < 0·001
ParitySubsequent 1·00First born 0·20 0·09, 0·30 < 0·001
Length of time living in NZ (years)Born in NZ 1·00Living in NZ for> 4 years 0·01 –0·13, 0·15) 0·85Living in NZ for≤ 4 years –0·37 –0·55, −0·19 < 0·001
BMI (kg/m2)< 25·0 1·0025–29·99 –0·19 –0·32, −0·07 0·003≥ 30·0 –0·20 –0·34, −0·06 0·005
Adherence to food and nutritionguidelines in pregnancy – fruitsand vegetablesYes 1·00No –0·26 –0·37, −0·15 < 0·001
Adherence to food and nutritionguidelines in pregnancy – breadsand cerealsYes 1·00No 0·20 0·09, 0·32 0·001
Adherence to food and nutritionguidelines in pregnancy – milkand milk productsYes 1·00No –0·20 –0·30, −0·10 < 0·001
Smoking before and during pregnancyNon-smokers before and duringpregnancy
1·00
Stopped smoking during pregnancy –0·38 –0·55, −0·21 < 0·001Smokers before and during pregnancy –1·03 –1·22, −0·84 < 0·001
Adj. β, adjusted β-coefficient; NCEA, National Certificate of Educational Achievement;NZDep2006, neighbourhood deprivation index 2006; NZ, New Zealand.* Infants aged 6–12 months at the nine-month interview (excluded twins/triplets;babies born premature or with low-birth weight). Adjusted R2 of multiple variablemodel= 0·291.
† Average increase or decrease in the infant feeding index score in relation to thecategories of reference.
‡ Derived from the 2006 national census according to the methodology described inSalmond et al.(22)
Infant Feeding Index construct validity 9
Dow
nloaded from https://w
ww
.cambridge.org/core . IP address: 65.21.228.167 , on 28 N
ov 2021 at 11:11:09 , subject to the Cambridge Core term
s of use, available at https://ww
w.cam
bridge.org/core/terms . https://doi.org/10.1017/S0007114521001720

met the minimum cut-off for number of serves of breads andcereals daily.
Published evidence shows that childhood obesity isinfluenced by early life events and environmental factors,including diet(1,32,43,44). However, despite this recognition associ-ation, the contribution of diet during infancy to the developmentof overweight/obesity remains relatively under explored(3,5).Most of the previous studies that have investigated the effect ofinfant feeding on overweight/obesity later in life have focusedon discrete infant feeding practices, for example, the effectof any/exclusive breast-feeding duration and age of foodintroduction(37,38,45–47). To date, the only other cohort study thathas assessed the relationship of overall adherence to contempo-rary Infant Feeding Guidelines, using an index, with the develop-ment of childhood obesity, found no significant association withBMI and a weak association with WC at age 7 years, after adjust-ment for relevant socio-demographic confounders(13). Systematicreviews show that, despite reported significant associationsbetween early childhood dietary quality with later lean bodymass,cognition and behaviour, the relationships reported with BMI andoverweight/obesity have been null or weak(3,5). Researchers arguethat this may be due to the fact that the indices based on dietaryguidelinesmay not adequately describe consumption patterns thatare associated with chronic diseases/mortality, as well as the factthat the use of index scores may not reflect the risk gradients formajor diet-related diseases(4).
In NZ, the prevalence of childhood obesity among childrenaged 2–14 years increased from 8 % in 2006/2007 to 12 % in2017/2018(48). In 2016, NZ had the second highest prevalenceof overweight in 5–19-year-old children (39·5 %) among thecountries of the European Union and Organization forEconomic Co-operation and Development(39). We identifiedan independent association between the degree of adherenceto national Infant Feeding Guidelines and early childhoodoverweight/obesity and central obesity. The sex differences inthe magnitude of associations between the score in theIFI and childhood overweight/obesity and central adipositycorroborate previously reported findings(49–51). Studies have
reported sex differences in the patterns of childhood adiposityand weight gain as well as in the patterns of factors associatedwith childhood obesity (including family environments, healthbehaviours, physiological markers and genetics)(49–51). Anotheraspect to consider in our study is that, despite no statisticallysignificant differences in the mean IFI score and IFI tertiledistributions between girls and boys, there were sex differencesin the adherence to some individual Infant Feeding Guidelinecomponents. Infant Feeding Guidelines represent a number ofrecommendations and some components may be more likelyto influence child outcomes. However, currently, there is noevidence that allows us to measure the relative impact of eachrecommendation on child health outcomes to weight the indica-tors differently within the overall measurement of infant feedingpractices(12).
Strengths and weaknesses of the study
NZ has little published information, nationally representative orgeneralisable, about infant feeding practices(14,20). The routinedata on breast-feeding and infant feeding collected by LeadMaternity Carers and Well Child Tamariki Ora providers in NZare under-reported for the most disadvantaged groups ofMāori and Pacific children(52). There have been no previousstudies in NZ on the determinants of whole-of-diet in the firstyear of life and the association of adherence to Infant FeedingGuidelines with the development of overweight/obesity duringchildhood. This investigation also adds to the internationalliterature, as there are limited studies, especially in high-incomecountries, that have described dietary intakes of under5-year-old children using a whole-of-diet measure(3,5,13).To the best of our knowledge, this is the second longitudinalstudy to examine the influence that infant whole-of diet quality,based on contemporary guidelines, on later weight and WCduring childhood, taking into account the influence ofrelevant maternal socio-demographic and health behaviourscharacteristics. In addition, by excluding preterm infants andthose with low-birth weight from the analyses examining the
Table 4. Adjusted associations between the infant feeding index score and the anthropometric outcomes at the 54-month interview (all cohort and by sex)(Risk ratios and 95 % confidence intervals)
Infant Feeding Indexscore (tertiles)
Anthropometric outcomes at the 54-month interview
BMI-for-age > þ2 z(26) WtHR> p 90th
Adjusted RR 95% CI) P* Adjusted RR 95% CI P* Adjusted RR 95% CI P* Adjusted RR 95% CI P*
All cohort†(n 4021) Girls‡(n 1973) All cohort§(n 4020) Boys||(n 2530)High 1 (Ref) – 1 (Ref) – 1 (Ref) – 1 (Ref) –Medium 1·06 0·85, 1·32 0·61 1·46 1·03, 2·06 0·03 1·26 0·97, 1·63 0·08 1·27 0·86, 1·86 0·23Low 1·24 0·99, 1·55 0·06 1·56 1·09, 2·23 0·02 1·49 1·13, 1·95 0·04 1·53 1·02, 2·30 0·04P-trend 0·06 0·02 0·04 0·03
RR, risk ratio; WtHR, waist-to-height ratio; p 90th, ninetieth percentile; Ref, reference category.* Wald test (P-values).† Excluded children with BMI-for-age > þ5 z. Associations adjusted for child’s sex, child’s exact age and child’s screen time usage at the 54-month interview, pregnancy planning;maternal self-prioritised ethnicity, antenatal maternal BMI, maternal adherence to recommended intake of breads and cereals in pregnancy and maternal smoking patterns.
‡ Excluded girls with BMI-for-age>þ5 z. Associations adjusted by child’s exact age at the 54-month interview, pregnancy planning, maternal self-prioritised ethnicity, maternal lengthof time living in New Zealand, antenatal maternal BMI, maternal adherence to recommended intake of breads and cereals in pregnancy and maternal smoking patterns.
§ Associations adjusted for child’s sex, maternal self-prioritised ethnicity, neighbourhood deprivation index, antenatal maternal BMI, maternal adherence to recommended intake ofbreads and cereals in pregnancy and maternal smoking patterns.
|| Associations adjusted for maternal self-prioritised ethnicity, antenatal maternal BMI, maternal adherence to recommended intake of breads and cereals in pregnancy, maternaladherence to recommended intake of milk and milk products in pregnancy and maternal smoking patterns.
10 T. G. Castro et al.
Dow
nloaded from https://w
ww
.cambridge.org/core . IP address: 65.21.228.167 , on 28 N
ov 2021 at 11:11:09 , subject to the Cambridge Core term
s of use, available at https://ww
w.cam
bridge.org/core/terms . https://doi.org/10.1017/S0007114521001720

association between the IFI and obesity, we removed circum-stances where the Infant Feeding Guidelines and expectedgrowth and development trajectories may not be applicable.
The main limitation of this study is that potentially importantcovariates associatedwith the development of childhood obesitymay have not been included in the final multivariatemodels and,thus, the magnitude of the association between the IFI andobesity may be overestimated. Examples of covariates includeobjective infant PA and sleep measures which were not mea-sured in the preschool years in this cohort, mode of deliveryand antibiotic use, both recently reported as associated withchild body size in this cohort(53,54). The exclusion of childrenborn with low-birth weight and preterm aimed to accounr forchildren more likely to have medical and developmental issuesthat may impcat feeding and growth. However, we have notaccounted for other potential medical and developmental issuesthat may have affected infants’ adherence to feeding guidelinesand their body shape and composition through the first 5 years oflife. Another notable limitation is that the IFI could only measureadherence to Ministry of Health guidelines that were able to bemeasured using the Growing Up in New Zealand data available,and therefore excluded indicators of increasing texture, varietyand flavour of infant foods.
Conclusions
This research confirms the IFI’s construct validity for futurestudies that will examine the influence of infant feeding practiceson other subsequent dietary, health, behaviour and cognitiveoutcomes within the Growing Up in New Zealand cohort.
This study’s findings provide useful and nationally generalis-able information that can be used to guide food and nutritionpolicies and interventions aiming at improving infant feedingpractices. Appropriate nutrition in the first year of life is oneof the internationally recommended approaches to reduce thedouble burden of malnutrition(1). This study quantified relevantinequalities in infant feeding practices in NZ, many of whichmaybe modifiable through improved maternal education, familyincome support, culturally relevant health promotion and accessto prenatal health care which addresses health behaviours.The significant associations identified between adherence tonational Infant Feeding Guidelines and childhood obesity/central adiposity suggest that promoting adequate infant feedingpractices in NZ constitutes a potential strategy to reduce child-hood obesity.
Acknowledgements
The authors thank the participating families of theGrowing Up inNew Zealand cohort studywho have given their time and sharedthe information that allowed us to conduct this research. Theauthors also thank the interviewers and researchers whodesigned, collected, cleaned and prepared the data foruse. The Growing Up in New Zealand study has been designedand conducted by the Growing Up in New Zealand team, led bythe University of Auckland. The authors would like to acknowl-edge the contributions of the original study investigators:Susan M. B. Morton, Polly E. Atatoa Carr, Cameron C. Grant,
Arier C. Lee, Dinusha K. Bandara, Jatender Mohal, Jennifer M.Kinloch, Johanna M. Schmidt, Mary R. Hedges, Vivienne C.Ivory, Te Kani R. Kingi, Renee Liang, Lana M. Perese,Elizabeth Peterson, Jan E. Pryor, Elaine Reese, Elizabeth M.Robinson, Karen E. Waldie, Clare R. Wall. The Growing Up inNew Zealand study has been funded by the New ZealandMinistries of Social Development, Health, Education andJustice; the former Ministry of Science Innovation and the formerDepartment of Labour (nowboth part of theMinistry of Business,Innovation and Employment); the former Ministry of PacificIsland Affairs (now the Ministry for Pacific Peoples); the formerMinistry of Women’s Affairs (now the Ministry for Women); theDepartment of Corrections; the Families Commission (nowknown as the Social Policy Evaluation and Research Unit);Te Puni Kokiri; New Zealand Police; Sport New Zealand;Housing New Zealand Corporation; and the former MentalHealth Commission (now part of the Office of the Health andDisability Commissioner); The University of Auckland andAuckland UniServices Limited. Other support for the study hasbeen provided by the Health Research Council of NewZealand, Statistics New Zealand, the Office of the Children’sCommissioner and the Office of Ethnic Affairs (now the Officeof Ethnic Communities). The authors would also like to thankthe Ministry of Health nutrition policy team, particularlyLouise McIntyre, Anna Jackson and Elizabeth Aitken forproviding advice on the selection of the indicators for the infantfeeding index.
The Discipline of Nutrition and Dietetics (Faculty of MedicalSciences, University of Auckland, New Zealand) providedfunding for analyses presented in this study.
T. G. C., S. G. and C. R. W. designed the objectives of thestudy. T. G. C. cleaned, merged and prepared the datasets.T. G. C. conducted the analysis, consulting with A. P. T. G. C.,S. G., C. R. W., C. C. G., J. A. T., D. M. M. and S. M. B. M. contrib-uted to the data interpretation. T. G. C., S. G. and C. R. W. draftedthe manuscript. J. A. T., A. P., D. M. M., C. C. G. and S. M. B. M.revised themanuscript draft critically. All listed authors reviewedand approved the final version of the manuscript.
There are no conflicts of interest.
Supplementary material
For supplementarymaterials referred to in this article, please visithttps://doi.org/10.1017/S0007114521001720
References
1. Hawkes C, Ruel M, Salm P, et al. (2020) Double-duty actions:seizing programme and policy opportunities to address malnu-trition in all its forms. Lancet 395, 142–155.
2. Ministry of Health (2008) Food and Nutrition Guidelines forHealthy Infants and Toddlers (Aged 0–2): a BackgroundPaper, 4th ed. Wellington: Ministry of Health.
3. Marshall S, Burrows T & Collins CE (2014) Systematic review ofdiet quality indices and their associations with health-relatedoutcomes in children and adolescents. J Hum Nutr Diet 27,577–598.
4. Wajers PMCM, Feskens EJM&OckeMC (2007) A critical reviewof predefined diet quality scores. Br J Nutr 97, 219–231.
Infant Feeding Index construct validity 11
Dow
nloaded from https://w
ww
.cambridge.org/core . IP address: 65.21.228.167 , on 28 N
ov 2021 at 11:11:09 , subject to the Cambridge Core term
s of use, available at https://ww
w.cam
bridge.org/core/terms . https://doi.org/10.1017/S0007114521001720

5. Smithers LG, Gollwey RK, Brazionis L, et al. (2011)Characterizing whole diets of young children from developedcountries and the association between diet and health:a systematic review. Nutr Rev 69, 449–467.
6. Ruel MT & Menon P (2002) Child feeding practices are associ-ated with child nutritional status in Latin America: innovativeuses of the demographic and health surveys. J Nutr 132,1180–1187.
7. Moursi MM, Martin-Prével Y, Eymard-Duvernay S, et al. (2008)Assessment of child feeding practices using a summary index:stability over time and association with child growth in urbanMadagascar. Am J Clin Nutr 87, 1472.
8. Lohia N & Udipi SA (2014) Infant and child feedingindex reflects feeding practices, nutritional status of urban slumchildren. BMC Pediatr 14, 290.
9. Ma J-Q, Zhou L-L, Hu Y-Q, et al. (2012) A summary index ofinfant and child feeding practices is associated with childgrowth in urban Shanghai. BMC Public Health 12, 568.
10. Global Nutrition Report (2018) 2018 Global NutritionReport. https://globalnutritionreport.org/reports/global-nutrition-report-2018/ (accessed August 2020).
11. World Health Organization & the United Nations Children’sFund (2021) Indicators for Assessing Infant and Young ChildFeeding Practices: definitions and Measurement Methods.Geneva: World Health Organization & the United NationsChildren’s Fund.
12. Golley RK, Smithers LG, Mittinty MN, et al. (2012) An indexmeasuring adherence to complementary feeding guidelineshas convergent validity as a measure of infant diet quality.J Nutr 142, 901–908.
13. Golley RK, Smithers LG,MittintyMN, et al. (2013)Diet quality ofUK infants is associated with dietary, adiposity, cardiovascular,and cognitive outcomes measured at 7–8 years of age. J Nutr143, 1611–1617.
14. Castro TG, Gerritsen S, Wall C, et al. (2018) Infant Feeding inNew Zealand: adherence to Food and Nutrition Guidelinesamong the Growing up in New Zealand Cohort. Wellington:Ministry of Social Development.
15. Morton SMB, Ramke J, Kinloch J, et al. (2015) Growing up inNew Zealand cohort alignment with all New Zealand births.Aust N Z J Public Health 39, 82–87.
16. Bland JM & Altman DG (2002) Validating scales and indexes(short note). BMJ 324, 606–607.
17. Chaltiel D, Adjibade M, Deschamps V, et al. (2019) ProgrammeNational Nutrition Sante- guidelines score 2 (PNNS-GS2):development and validation of a diet quality scores reflectingthe 2017 French dietary guidelines. BJN 122, 331–342.
18. Morton SMB, Grant CC, Berry SD, et al. (2017) Growing Up inNew Zealand: a Longitudinal Study of New Zealand Childrenand their Families. NowWe Are Four: describing the PreschoolYears. Auckland: Growing Up in New Zealand.
19. Marriott LD, Inskip HM, Borland SE, et al. (2009) What dobabies eat? Evaluation of a food frequency questionnaire toassess the diets of infants aged 12 months. Public HealthNutr 12, 967–972.
20. Castro TG, Grant C, Wall C, et al. (2017) Breastfeeding indica-tors among a nationally representative multi-ethnic sample ofNew Zealand children. NZMJ 130, 34–44.
21. Wall CR, Brunt DR & Grant CC (2009) Ethnic variance in ironstatus: is it related to dietary intake? Public Health Nutr 12,1413–1421.
22. Salmond C, Crampton P & Atkinson J (2007) NZDep2006 Indexof Deprivation. Wellington: University of Otago.
23. Statistics New Zealand (2005) Statistic Standard for EthnicityClassification. Stats New Zealand. https://www.stats.govt.nz/
consultations/ethnicity-standard-classification-consultation(accessed August 2020).
24. Morton SMB, Grant CC, Wall CR, et al. (2014) Adherence tonutritional guidelines in pregnancy: evidence from theGrowing Up in New Zealand birth cohort study. PublicHealth Nutr 17, 1919–1929.
25. World Health Organization (1995) Physical Status: the Use andInterpretation of Anthropometry. WHO Technical Report Seriesno 854. Geneva: WHO.
26. Craig CL, Marshall AL, Sjostrom M, et al. (2003) Internationalphysical activity questionnaire: 12-country reliability andvalidity. Med Sci Sports Exerc 35, 1381–1395.
27. Ministry of Health (2008) Protocol for Collecting Height, Weightand Waist Measurements in New Zealand Health Monitor(NZHM) Surveys. Wellington: Ministry of Health.
28. World Health Organization (2006) WHO Child GrowthStandards: Length/Height-for-Age, Weight-for-Age, Weight-for-Length, Weight-for-Height and Body Mass Index-for-Age:Methods and Development. Geneva: WHO.
29. World Health Organization (2019) Guidelines on PhysicalActivity, Sedentary Behaviour and Sleep for Children under5 Years of Age. Geneva: WHO.
30. Barros AJ & Hirakata VN (2003) Alternatives for logisticregression in cross-sectional studies: an empirical comparisonof models that directly estimate the prevalence ratio. BMC MedRes Methodol 3, 21.
31. Zou GA (2004) Modified Poisson regression approach toprospective studies with binary data. Am J Epidemiol 159,702–706.
32. Baidal JAW, Locks LM, Cheng ER, et al (2016) Risk factors forchildhood obesity in the first 1000 d. Am J Prev Med 50,761–799.
33. Magalhaes EIS, Sousa BA, Lima NP, et al. (2019) Maternalsmoking during pregnancy and offspring body mass indexand overweight: a systematic review and meta-analysis. CadSaude Publica 35, e00176118.
34. ShackletonN, Derraik JGB, Audas R, et al. (2019)Decomposingethnic differences in body mass index and obesity rates amongNew Zealand pre-schoolers. Int J Obes 43, 1951–1960.
35. Agsbota G, Fievet N, Heude B, et al. (2019) Poor maternalanthropometric status before conception is associated with adeleterious infant growth during the first year of life: a longi-tudinal pre-conceptional cohort. Pediatr Obes 15, e12573.
36. Stiglic N & Viner RM (2019) Effects of screen time on the healthandwell-being of children and adolescents: a systematic reviewof reviews. BMJ Open 9, e023191.
37. Meyerkort CE, OddyWH, O’Sullivan TA, et al. (2011) Early dietquality in a longitudinal study of Australian children: associa-tions with nutrition and body mass index later in childhoodand adolescence. J Develop Origins Health Dis 3, 21–31.
38. Robinson SM, Marriott LD, Crozier SR, et al. (2009) Variations ininfant feeding practice is associated with body composition inchildhood: a prospective cohort study. J Clin Endocrinol Metab94, 2799–2805.
39. United Nation Children’s Fund (2019) The State of the World’sChildren 2019. Children, Food and Nutrition: growing well ina Changing World. New York: UNICEF.
40. JarmanM, Vashi N, Angus A, et al. (2020)Development of a dietquality index to assess adherence to Canadian dietary recom-mendations in 3-year-old children. Public Health Nutr 23,385–393.
41. Wang Y, Beydoun MA, Li J, et al. (2011) Do children andtheir parents eat a similar diet? Resemblance in child andparental dietary intake: systematic review and meta-analysis.J Epidemiol Community Health 65, 177–189.
12 T. G. Castro et al.
Dow
nloaded from https://w
ww
.cambridge.org/core . IP address: 65.21.228.167 , on 28 N
ov 2021 at 11:11:09 , subject to the Cambridge Core term
s of use, available at https://ww
w.cam
bridge.org/core/terms . https://doi.org/10.1017/S0007114521001720

42. Davison B, Saeedi P, Black K, et al. (2017) The associationbetween parent diet quality and child dietary patterns innine- to eleven-year-old children from Dunedin, NewZealand. Nutrients 9, 483.
43. World Health Organization (2016) Report of the Commission onEnding Childhood Obesity. Geneva: WHO.
44. Mikkelsen B, Williams J, Rakovac I, et al. (2019) Life-courseapproach to prevention and control of non-communicablediseases. Br Med J 364, l257.
45. English LK, Obbagy JE, Wong YP, et al. (2019) Timing of intro-duction of complementary foods and beverages and growth,size, and body composition: a systematic review. Am J ClinNutr 109, 935S–955S.
46. Gibson LA, Alava MH, Kelly MP, et al. (2017) The effects ofbreastfeeding on childhood BMI: a propensity score matchingapproach. J Public Health 39, e152–e160.
47. Sirkka O, Vrijkotte T, Halberstadt J, et al. (2018) Prospectiveassociations of age at complementary feeding and exclusivebreastfeeding duration with body mass index at 5–6 yearswithin different risk groups. Pediatr Obes 13, 522–529.
48. Ministry of Health (2019) 2019 New Zealand health statistics.https://www.health.govt.nz/nz-health-statistics/health-statistics-and-data-sets/obesity-statistics (accessed August 2020).
49. Anderson SE & Whitaker RC (2018) Association of self-regulation with obesity in boys vs girls in a US national sample.JAMA Pediatr 172, 842–850.
50. Govindan M, Gurm R, Mohan S, et al. (2013) Genderdifferences in physiologic markers and health behaviorsassociated with childhood obesity. Pediatrics 132, 468–474.
51. Sweeting HN (2008) Gendered dimensions of obesity inchildhood and adolescence. Nutr J 7, 1.
52. Ministry of Health (2013) The Health Status of Children andYoung People in New Zealand. Dunedin: New ZealandMinistry of Health.
53. Makasume G, Mccarthy FP, Russell J, et al. (2019) Caesareansection delivery and childhood obesity: evidence from theGrowing up in New Zealand cohort. J Epidemiol 73, 1063–1070.
54. Chelimo C, Camargo CA, Morton SMB, et al. (2020) Associationof repeated exposure up to age 4 years with bodymass and age4.5 years. JAMA Netw Open 3, e1917577.
Infant Feeding Index construct validity 13
Dow
nloaded from https://w
ww
.cambridge.org/core . IP address: 65.21.228.167 , on 28 N
ov 2021 at 11:11:09 , subject to the Cambridge Core term
s of use, available at https://ww
w.cam
bridge.org/core/terms . https://doi.org/10.1017/S0007114521001720