an innocuous bias in whisker use in adult rats modifies receptive
TRANSCRIPT

The Journal of Neuroscience, November 1994, 14(11): 6976-6991
An Innocuous Bias in Whisker Use in Adult Rats Modifies Receptive Fields of Barrel Cortex Neurons
Michael Armstrong-James,’ Mathew E. Diamond,*va and Ford F. Ebner*
‘Department of Physiology, Queen Mary Westfield College, London University, London El 4NS, United Kingdom, and *Institute for Developmental Neuroscience, Vanderbilt University, Nashville, Tennessee 37203
The effect of innocuously biasing the flow of sensory activity from the whiskers for periods of 3-30 d in awake, behaving adult rats on the receptive field organization of rat SI barrel cortex neurons was studied. One pair of adjacent whiskers, D2 and either Dl or D3, remained intact unilaterally (whisker pairing), all others being trimmed throughout the period of altered sensation. Receptive fields of single ceils in the con- tralateral D2 barrel were analyzed under urethane anesthe- sia by peristimulus time histogram (PSTH) and latency his- togram analysis after 3, 7-10, and 30 d of pairing and compared with controls, testing all whiskers cut to the same length. Response magnitudes to surround receptive field in- row whiskers Dl and D3 were not significantly different for control animals. The same was found for surround in-arc whiskers C2 and E2. However, after 3 d of whisker pairing a profound bias occurred in response to the paired D-row surround whisker relative to the opposite trimmed surround D-row whisker and to the C2 and E2 whiskers. This bias increased with the duration of pairing, regardless of which surround whisker (Dl or D3) was paired with D2. For all three periods of pairing the mean response to the paired surround whisker was increased relative to controls, but peaked at 7- 10 d. Response to the principal center-receptive (D2) whisk- er was increased for the 3 and 7-10 d groups and then decreased at 30 d. Responses to trimmed arc surround whiskers (C2 and E2) were decreased in proportion to the duration of changed experience. Analysis of PSTH data showed that earliest discharges (5-10 msec poststimulus) to the D2 whisker increased progressively in magnitude with duration of pairing. For the paired surround whisker similar early discharges newly appeared after 30 d of pairing. At 3 and 7-l 0 d of pairing, increases in response to paired whisk- ers and decreases to cut surround whiskers were confined to late portions of the PSTH (lo-100 msec poststimulus). Changes at 3-10 d can be attributed to alterations in intra- cortical synaptic relay between barrels. Longer-term changes in response to both paired whisker inputs (30 d) largely ap- pear to reflect increases in thalamocortical synaptic effi- cacy.
Received Oct. 25, 1993; revised Mar. 30, 1994; accepted May 12, 1994. We thank Debbie Brown for histological processing. This work was supported
by the Wellcome Trust (M.A.-J.), National Institutes of Health NS-25907, P30- HD15052, and the Kennedy Center (M.E.D., F.F.E.).
Correspondence should be. addressed to Dr. M. Armstrong-James, Department of Physiology, Queen Mary Westfield College, Mile End Road, London El 4NS, England.
aPresent address: Dipartimento di Scienze e Tecnologie Biomediche, Instituto di Biologia, Universim degli Studi di Udine, I-33 100 Udine, Italy. Copyright 0 1994 Society for Neuroscience 0270-6474/94/146978-14$05.00/O
Our findings suggest that novel innocuous somatosensory experiences produce changes in the receptive field config- uration of cortical cells that are consistent with Hebbian the- ories of experience-dependent potentiation and weakening of synaptic efficacy within SI neocortical circuitry, for cor- related and uncorrelated sensory inputs, respectively.
[Key words: somatosensory cortex, barrel cortex, corre- lated discharge, receptive fields, learning, corticalplasticity, Hebbian mechanisms, cortical maps]
In recent years, alterations in SI cortical maps, following pe- ripheral denervation or limb amputation in adult animals, have been documented for a variety of mammals (for reviews, see Van der Loos and Woolsey, 1973; Merzenich et al., 1988; Wall, 1988; Kaas, 1991). Damage to the periphery, however, also causes substantial functional reorganization in the thalamic and spinal relay nuclei (Land and Achtar, 1987; Jacquin, 1989; Ni- colelis et al., 199 1). Nonetheless, immediate changes in recep- tive fields are also seen in neocortex and spinal cord after pe- ripheral nerve damage and/or interference with nociceptor function (Wall and Eggar, 197 1; Dostrovsky et al., 1976; Millar et al., 1976; Calford and Tweedale, 1988; Byrne and Calford, 199 1). Relating functional changes strictly to changes in sensory experience has been difficult in such experiments. Simple changes in use, without peripheral nerve damage, have rarely been en- gineered to investigate changes in maps within somatosensory cortex, although recently two studies in adult primates have shown changes in SI cortical maps following long-term changes in use of the hand (Clark et al., 1988; Jenkins et al., 1990).
Unlike primate SI cortex, within rodent SI cortex specific neuronal groups can be identified histologically (Woolsey and van der Loos, 1970; Killackey, 1973). Rodent SI barrel cortex contains barrel-shaped neuronal aggregates (“barrels”) in layer IV that form a pattern replicating the whisker distribution on the snout (Woolsey and van der Loos, 1970; Welker and Wool- sey, 1974). In addition, there is now convincing evidence that most neurons within a barrel receive monosynaptic innervation by cells in the ventral posterior medial nucleus (T-C cells), which are dedicated to generating the “principal” whisker center-re- ceptive field information in a single barrel (Armstrong-James and Callahan, 1991; Armstrong-James et al., 1991). Although this is so, barrel cells also respond to neighboring whiskers con- stituting the excitatory surround receptive field. These weaker responses to surround whiskers are entirely dependent upon intracortical barrel-to-barrel relay (Armstrong-James et al., 199 1). In essence, this allows a functional separation of the “strong” and “weak” inputs to a single barrel to be realized at the cortical level by principal and surround whiskers, respec- tively.

The Journal of Neuroscience, November 1994, 74(11) 6979
The large mvstacial whiskers on the face ofthe rat are arranged gm/kg i.p., 30% aqueous solution). Body temperature was maintained in an equally spaced array over the length of the snout. This arrangement allows the adult rat to activate whiskers sequen- tially in normal behavior while producing forward and back- ward whisking movements (Vincent, 19 12; Carve11 and Simons, 1991). The precise ordering of barrels and separation of their sensory inputs therefore allow ideal conditions for manipulating use-dependent associative interactions between “strong” prin- cipal and “weak” surround inputs within a given cortical col- umn. In the present study, two primary questions were posed in reference to associative interactions in neocortex. First, does a preferred use of one pair of sensory inputs increase the synaptic weight for the paired inputs as predicted by Hebb (1949)? Sec- ond, as predicted by Stent (1973) does a simultaneous innoc- uous reduction in sensory experience from other “unpaired” surround inputs result in downgrading of their synaptic weights on the same neuronal group?
Specifically, we have engineered an appropriate innocuous change in tactile use, the preferred use of a single pair of adjacent whiskers over a period of 3-30 d in adult rats, to test whether associative potentiation of synaptic transmission between bar- rels arises. By cutting all save the two whiskers unilaterally for 3-30 d, in addition we have tested whether a concomitant fall in transmission to the preferred barrels occurs for the trimmed whiskers. The results support both predictions and suggest that modification of sensory circuitry at the cortical level arises with “whisker pairing,” which follows Hebbian rules for experience- dependent modification. The findings also imply that receptive fields of cortical neurons may be continuously modified at the cortical level by both short- and longer-term changes in innoc- uous experience at the adult stage.
The results include in part some findings from an earlier pub- lication on short-term modifications in receptive fields to whisk- er pairing (Diamond et al., 1993).
Materials and Methods Whisker trimming. For these experiments, 22 adult male Long-Evans rats weighing 250-3 10 gm were used. The experimental design required comparison of receptive fields of cells in the D2 barrel in normal rats and rats with modified surround whisker inputs to that barrel. In ex- perimental animals, whiskers on the left side of the face were left intact whereas all but two whiskers on the right side of the face were clipped to the level of the fur, for periods of 3-30 d. For all animals the principal whisker for the D2 barrel. the D2 whisker. was left intact. For the main body of results the “paired” whisker left’intact was either Dl or D3, allowing pairing of two adjacent whiskers in the same row. Such animals were defined as “whisker-paired” animals.
Four whisker-paired animals in each group were prepared. For the 3 d experimental group whiskers were cut once, with the recording session beginning 64-66 hr later. At the start of all recording sessions all whisk- ers were trimmed to the same length (3-5 mm), which was the normal level of regrowth during this period. For the 7-10 and 30 d groups, whiskers were cut every 2 d up to 3 d prior to experimentation. Two further groups of experimental animals were produced to test pairing of whiskers in the arc with 7 d of pairing. For these, the two whiskers left intact unilaterally were either D2 and C2 (two animals) or D2 and E2 (four animals). The remaining whiskers on the same side of the face were trimmed as for D-row-paired animals.
All experimental animals were caged in normal housing with at least one normal littermate during intervals between whisker clipping and up to the start of the experimental recording session. They appeared to use the intact, paired whiskers to palpate, explore, and “whisk” in the normal manner. Control experiments were carried out on four adult male rats, for which all whiskers were left intact prior to the recording session. These were housed normally with one other rat prior to ex- perimentation.
Preparation and histology. Rats were anesthetized with urethane (1.5
at 36137°C using a heating blanket controlled-by an intrarectal therm- istor (Harvard Inc.). A 4 x 3 mm opening was made in the skull to expose the mystacial whisker projection area of SI neocortex of the left hemisphere. Small incisions were made in the dura for microelectrode recording of cells in radial penetrations within the barrel-column D2 in the posteromedial barrel subfield of SI neocortex.
During the recording session the depth ofanesthesia was held constant by maintaining the rate of bursting of layer V neocortical neurons at 2- 4 Hz, simulating a condition of slow-wave sleep (Armstrong-James and Fox, 1988). This condition was achieved either by injecting supple- mentary urethane (10% of the original dose) when the burst rate ex- ceeded 4 Hz, or waiting until anesthesia achieved the set level ifbursting rate was ~2 Hz. On termination of the experiment, rats were admin- istered a supplementary dose of Nembutal intraperitoneally and per- fused through the left ventricle with 200 ml of 0.1 M phosphate-buffered saline (PBS) followed by 150 ml of 4% buffered paraformaldehyde. Postfixing overnight in buffered paraformaldehyde was followed by 30% sucrose in PBS for 1 d, allowing sinking of brains. The neocortex then was separated from underlying white matter and flattened between glass slides. Tangential sections were cut at 50 pm on a freezing microtome and processed for cytochrome oxidase activity (Wong-Riley and Welt, 1980).
Whisker stimulation. For deflection of individual whiskers on the right side of the face, a wire hook cemented to a piezoelectric “bimorph” ceramic wafer was positioned just below the whisker, 24 mm from the skin. The wafer was deflected by a computer-gated trapezoidal pulse of 3 msec duration, generating a 300 pm up-down movement of the wire tip with rise and fall times of 0.5 msec. Fifty stimuli were delivered to each whisker at one stimulus per second for each block of trials. One block of stimulus trials was presented to whisker D2 and to each of its adjacent neighbors (Dl, D3, C2, and E2) for each cell recorded.
Recording and data analysis. Carbon fiber microelectrodes (Arm- strong-James and Millar, 1979; Armstrong-James et al., 1980) were used to record action potentials. Ingress and egress of the black electrode tip through the pia was monitored under a dissecting microscope; mon- itoring was aided by audiomonitoring for neuronal noise. Single-cell isolation was achieved by a time-amplitude window discriminator (Bak Electronics), which allowed discrimination of spike shape in addition to spike amplitude. No cell was accepted unless it exhibited a signal- to-noise ratio in excess of 6. Accepted action potential waveforms were monitored on a 12-bit digital storage oscilloscope (Nicolet) to ensure further the proper isolation of single neurons.
Peristimulus time histograms (PSTHs), raster plots, and latency his- tograms (LHs) at 1 msec bin resolution (Fig. 1) were generated on line using a CED 140 1 processor (Cambridge Electronic Design 140 1) and 486 PC computer (Biomedical Engineering, Vanderbilt University). All raw data on timing of action potentials and stimuli were stored on a hard disk for further analvsis. For all forms of PSTH analvsis. counts in each time bin were adjusted for spontaneous activity by-subtracting the mean bin count for spontaneous activity 50 msec prior to the stim- ulus for each block of trials. LHs were constructed in a similar way to PSTHs with the exception that only qe first spike occurring >3 msec poststimulus was used to construct the histogram (Armstrong-James and Fox, 1987). The bin with the peak value was registered as the modal latency. Responses to cells failing to generate a definitive latency group- ing were logged as nil responses where analysis of modal latency data was carried out. Examples of PSTHs and LHs after 7 d of whisker cutting are shown in Figure 1.
Nonparametric statistical analyses of data were carried out applying the Mann-Whitney U test (MWU) and Wilcoxon matched pair sign rank test (WMPSR).
Identification ofrecordingsites. The experimental design dictated that all cells studied must be located within the cortical D2 barrel, as defined by cytochrome oxidase staining. Cortical recording sites were marked by passing a DC current of 0.5-2 PA for 5-10 set (electrode tip positive), which produced a spherical lesion of about 50 pm diameter that was easily seen in histological sections (Armstrong-James and Fox, 1987). Alternate penetrations were marked with a lesion where penetrations were close together, and this enabled locations ofunmarked penetrations to be determined by geometric reconstruction (Fig. 2). Where penetra- tions were >200 ym apart, each penetration was marked. A neuron was considered to be within barrel D2 if the recording site was later localized within the vertical and horizontal bounds of barrel D2 in cytochrome oxidase-stained tangential sections. Only cells located within the D2
6999 ArmstrongJames et al. l Plasticity of Barrel Cortex
POST-STIMULUS HISTOGRAMS LATENCY HISTOGRAMS
20 20
IS
D2
(Principal) 1.
5
5 D3 5
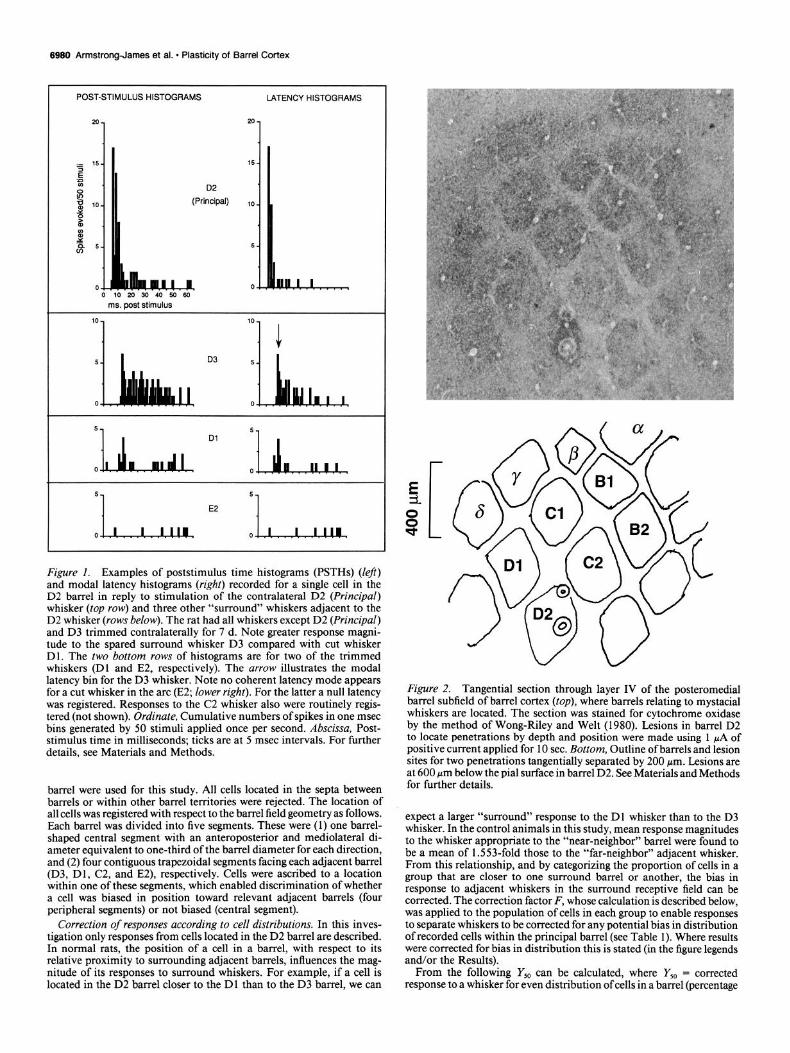
Figure 1. Examples of poststimulus time histograms (PSTHs) (left) and modal latency histograms (right) recorded for a single cell in the D2 barrel in reply to stimulation of the contralateral D2 (Principal) whisker (top row) and three other “surround” whiskers adjacent to the D2 whisker (rows below). The rat had all whiskers except D2 (Principal) and D3 trimmed contralaterally for 7 d. Note greater response magni- tude to the spared surround whisker D3 compared with cut whisker Dl. The two bottom rows of histograms are for two of the trimmed whiskers (Dl and E2, respectively). The arrow illustrates the modal latency bin for the D3 whisker. Note no coherent latency mode appears for a cut whisker in the arc (E2; lower right). For the latter a null latency was registered. Responses to the C2 whisker also were routinely regis- tered (not shown). Ordinate, Cumulative numbers of spikes in one msec bins generated by 50 stimuli applied once per second. Abscissa, Post- stimulus time in milliseconds; ticks are at 5 msec intervals. For further details, see Materials and Methods.
barrel were used for this study. All cells located in the septa between barrels or within other barrel territories were rejected. The location of all cells was registered with respect to the barrel field geometry as follows. Each barrel was divided into five segments. These were (1) one barrel- shaped central segment with an anteroposterior and mediolateral di- ameter equivalent to one-third of the barrel diameter for each direction, and (2) four contiguous trapezoidal segments facing each adjacent barrel (D3, Dl, C2, and E2), respectively. Cells were ascribed to a location within one of these segments, which enabled discrimination of whether a cell was biased in position toward relevant adjacent barrels (four peripheral segments) or not biased (central segment).
Correction of responses according to cell distributions. In this inves- tigation only responses from cells located in the D2 barrel are described. In normal rats, the position of a cell in a barrel, with respect to its relative proximity to surrounding adjacent barrels, influences the mag- nitude of its responses to surround whiskers. For example, if a cell is located in the D2 barrel closer to the Dl than to the D3 barrel, we can
Figure 2. Tangential section through layer IV of the posteromedial barrel subfield of barrel cortex (top), where barrels relating to mystacial whiskers are located. The section was stained for cytochrome oxidase by the method of Wong-Riley and Welt (1980). Lesions in barrel D2 to locate penetrations by depth and position were made using 1 pA of positive current applied for 10 sec. Bottom, Outline of barrels and lesion sites for two penetrations tangentially separated by 200 pm. Lesions are at 600 pm below the pial surface in barrel D2. See Materials and Methods for further details.
expect a larger “surround” response to the Dl whisker than to the D3 whisker. In the control animals in this study, mean response magnitudes to the whisker appropriate to the “near-neighbor” barrel were found to be a mean of 1.553-fold those to the “far-neighbor” adjacent whisker. From this relationship, and by categorizing the proportion of cells in a group that are closer to one surround barrel or another, the bias in response to adjacent whiskers in the surround receptive field can be corrected. The correction factor F, whose calculation is described below, was applied to the population of cells in each group to enable responses to separate whiskers to be corrected for any potential bias in distribution of recorded cells within the principal barrel (see Table 1). Where results were corrected for bias in distribution this is stated (in the figure legends and/or the Results).
From the following Y,, can be calculated, where YS,, = corrected response to a whisker for even distribution of cells in a barrel (percentage

The Journal of Neuroscience, November 1994, 14(11) 8991
Table 1. Biases and corrections for biases in distributions of cells in the D2 barrel
Barrel of stimulated whisker
Groun Dnaired Dcut E2 c2
3 day
I day
30 day
Controls
% bias 54.4 45.6 45.8 54.2 F (correction factor) 0.98 1.02 1.02 0.98 % bias 37 63 47 53 F (correction factor) 1.06 0.94 1.01 0.99 % bias 33 67 69 31 F (correction factor) 1.08 0.92 0.91 1.09 % bias 49.6 (Dl) 50.4 (D3) 45.9 54.1 F (correction factor) 1.01 0.99 1.02 0.98
96 bias documents the observed bias in distribution of cells sampled within the D2 barrel towards the barns1 appropriate to the named whisker, where 100% = all cells biased in location toward the barrel of the whisker nominated and 0% = all cells biased in location toward the opposite adjacent surround whisker (e.g., Dpaired and Dcut are opposite, as are E2 and C2). Where % bias = 50%, cells are evenly distributed toward each adjacent barrel. Dpaired and Dcut are the spared and cut D-row whiskers adjacent to D2, respectively, each being either Dl or D3 in various experiments (see Materials and Methods). Biases are shown for each experimental group (3, 7-10, and 30 d of changed experience) and for controls. The method for calculation of bias is given in Materials and Methods. F (correction factor) is the factor by which the observed response magnitude to the nominated whisker needs to be multiplied to compute the response magnitude corrected for, as if there were no bias in cell distribution (% bias = 50). The derivation of F is described in Materials and Methods. Computed mean values for Fare shown for each whisker in each group and were used for those figures where it is stated in their legends that response magnitudes were corrected for uneaual 1~11 distrihutinn
bias = 50; see Table 1):
Y,, = Y, x [l + [1.5553 - 110.51,
Y, = Y, x [l + [1.5553 - l]r],
y 50
= y.l + [1.5553 - 110.5 = y r 1 + [1.5553 - l]r
1.27765 = Y,F ‘1 + 0.5553r ’ ’
F= 1.27765
1 + 0.5553r’
where Y0 = mean response magnitude where percentage bias = O%, Y, = mean response magnitude observed, Y,, = mean response magnitude corrected for even cell distribution in the barrel, r = percentage bias observed/100 (see Table I), and F = correction factor (see Table 1).
Thus, the mean observed response magnitude Y, is multiplied by F to achieve the corrected response.
Table 1 shows the actual distribution of cells in the D2 barrel for each group and the correction factors calculated to allow for bias in cell distribution. Correction factors (F; Table 1) ranged from 0.9 1 to 1.09. For example, for animals in which a D2 and D-row whisker were paired for 3 d, locations of cells studied were slightly biased in position toward the paired D-row whisker (Dpaired) rather than Dcut, the cut D-row whisker (54.4% closer to Dpaired, 45.6% closer to Dcut). Calculation of the expected bias of response to the paired whisker (Dpaired) leads to a correction factor (F) of 0.98 for mean response to Dpaired, and 1.02-fold to Dcut. In practice, the application of correction factors had minor effects upon the results.
Results Control and experimental groups Four rats were used for each experimental (“whisker-paired”) group, where all whiskers except D2 and either D3 or Dl were cut on the right side of the face. After 3,7-10, or 30 d of normal cage experience (see Materials and Methods), recordings were made from cells in the left barrel cortex under urethane anes- thesia. The control group consisted of four rats with their normal whiskers intact. Recordings were further analyzed only for cells located within the D2 barrel (layer IV) as verified histologically (Fig. 2). For the control animals, complete data on latency and peristimulus time histograms were generated for 52 cells in the D2 barrel in reply to stimulation of the principal D2 whisker and surround receptive field Dl , D3, E2, and C2 whiskers. For the D-row whisker-paired animals, similar data for the D2 barrel
were gathered for 74 cells for the 3 d group, for 48 cells for the 7-10 d group, and for 36 cells for the 30 d group. Care was taken to collect data at the same depth of anesthesia for each animal (see Materials and Methods). Similar experiments were carried out on D2 barrel cells for a further six animals where D2 was paired with either C2 or E2 whiskers (arc pairing), except that these were for 7 d of pairing only. The findings for those animals are presented separately, after those for D-row-paired animals which follow.
Receptive field changes with biased D-row inputs For the population of cells in the D2 barrel, Figure 3 shows the mean response magnitudes to stimulation of the contralateral principal whisker, D2, and its immediately adjacent four sur- round whiskers for the three periods of pairing D2 with Dl or D3. Statistical validation for differences in magnitudes of re- sponse are given in the legends to Figures 4 and 5.
In Figure 3, the uppermost set of histograms shows the mean response magnitudes to 50 stimuli applied to each of the five whiskers for cells in the D2 barrel of control animals, where all whiskers were intact. The mean response magnitudes generated by adjacent surround whiskers in the row (Dl and D3) were symmetrical. Responses to the population of inputs from in-arc surround whiskers (C2 and E2) were also symmetrical, but of slightly lower mean magnitude than responses to the in-row surround whiskers.
The left column in Figure 3 shows the mean values of re- sponses for cells in the D2 barrel for cases where all whiskers except Dl and D2 were cut (dark histograms) for periods of 3, 7-10, or 30 d. The right column shows analogous data for cases where D2 and D3 whiskers were spared and all other whiskers cut. The most evident finding is that a substantial bias in the geometry of the receptive field develops after each period of modified experience, whereby mean response magnitudes to the spared surround whisker in the D row greatly exceed those to the cut surround whisker in the D row. This bias in the surround receptive field occurred regardless ofwhether the spared whisker in the D row was Dl or D3.
Figure 4 shows the pooled results for individual whiskers

6962 ArmstrongJames et al. - Plasticity of Barrel Cortex
Controls SPARED WHISKERS CUT WHISKERS
23 $j .@
60 N= 52
3: 40
j$ 20
C2 Dl D2 D3 E2 WHISKER
Dl /D2 spared D2/D3 spared
80
60
40
20
0 C2 Dl D2 D3 E2
801 7-10 days
60
40
20
0 C2 Dl D2 D3 E2 C2 Dl D2 D3 E2
8. 30 days
60
40
20
0 C2 Dl D2 D3 E2 C2 Dl D2 D3 E2
C2 Dl D2 D3 E2
Figure 3. Response magnitudes to center and surround whiskers- individual groups. Top histogram, Mean magnitude of responses for cells within the D2 cortical barrel to 50 stimuli applied to the D2 whisker or one of its immediate surround whiskers in control animals. Whiskers Dl, D3, C2, and E2 are immediately adjacent (surround RF) whiskers surrounding the D2 whisker. Other histograms. Similar data for animals in which all whiskers save two were cut for 3-30 d as indicated above each histogram set (see Materials and Methods). Dark shading indicates responses to the two spared whiskers. Left column, Results for animals in which whiskers Dl and D2 were spared. Right column, Results for animals in which whiskers D3 and D2 were spared. Abscissa denotes whisker name. Ordinate denotes spikes evoked per 50 stimuli applied at one stimulus per second, responses being assessed for 100 msec period poststimulus. Note asymmetry of receptive fields toward responses to the spared whiskers at each duration of whisker pairing by comparison with controls. White bars are standard errors of the mean (S.E.). N =
Dpaired *...
Con 3 7-10 30
4o - Arc (C2+E2)
30 - 0 SE. ia count
40' DCut
30-
Con 3 7-10 30
Figure 4. Relative changes in response magnitudes with pairing: cu- mulative results. Ordinate, Mean magnitude of responses for D2 barrel cells to 50 stimuli applied to D2 and different whiskers in its immediate surround, arranged for the individual whiskers. Histogram sets are la- beled for each whisker. Dpaired represents pooled results for the spared adjacent surround whisker in the D row, that is, Dl or D3 for different experiments. Analogously, Dcut represents pooled results for the adja- cent whisker in the D row that was cut, that is, D3 or Dl in different experiments. Abscissa in each histogram denotes various durations of pairing in days, with controls (no whiskers cut) being the leftmost his- togram for each whisker. The response magnitudes are corrected for bias in cell distributions in the D2 barrel for each population of cells in each group (see Table 1 and Materials and Methods). Values denoted by asterisks are significantly different from controls for individual whisk- ers (MWU test) at the following levels: *, p < 0.05; **, p < 0.01; ***, p < 0.005; *** *, p < 0.000 1. For other details and definition ofwhiskers see Figure 3.
where the spared surround whisker is designated Dpaired (whether Dl or D3), and the clipped whisker Dcut (whether D3 or Dl). The data are derived from that used for Figure 3 but have been corrected for the distribution of cells within the D2 barrel at each stage (see Materials and Methods). Data for Dl and D3 surround whiskers in controls also were pooled for comparison with Dpaired or Dcut.
The increase in response to the spared D-row whiskers (Dpaired and D2), relative to controls, was highly significant for each whisker after 3 and 7-10 d of pairing (p = co.00 1 for each period for each whisker, MWU test), reaching maximal mag- nitudes for the 7-10 d period (Fig. 4). At 30 d ofwhisker pairing, magnitudes of responses to D2 declined, being just significantly
c
number of cells used to construct each histogram set. Data for controls and the 3 d group are derived from a preliminary study (Diamond et al., 1993).

The Journal of Neuroscience, November 1994, 14(11) 6983
greater than control responses to D2 (p = 0.05, MWU test). Response magnitudes to Dpaired also declined in the 30 d group after peaking at 7-10 d of pairing, but remained significantly larger than Dl and D3 controls (p < 0.0 1). Responses to Dpaired at this stage declined less than did responses to D2. Responses to the cut whiskers in the arc (C2 and E2) and to the cut whisker in the row (Dcut) declined progressively with increase in the duration of modified experience over 3-30 d. The decrease in response to cut arc whiskers compared with controls was sta- tistically significant by the 3 d period, whereas the fall in re- sponse to Dcut reached significance only for the 30 d group (p < 0.002).
Changes in dominance to surround whisker inputs
For controls, analysis on a cell-by-cell basis showed no signif- icant bias in response to Dl or D3 (p > 0.2, WMPSR). Biases in response magnitude to Dpaired relative to Dcut on a cell-by- cell basis (Fig. 5) were highly significant for 3, 7-10, and 30 d groups (p < 0.001, WMPSR in all cases).
Figure 5 shows the distributions of bias in responses to Dpaired and Dcut whiskers that developed for cell populations in each period of modified experience. The figure indexes by percentage incidence the ratios of response magnitude to Dpaired relative to the sum of response magnitudes to Dpaired and Dcut for each cell studied. For the 52 cells recorded from barrel D2 in control animals, no significant bias to Dl or D3 whiskers oc- curred; 27 cells (52%) had a greater response to the D3 whisker than to the Dl whisker, whereas 24 cells (46%) had a greater response to Dl than to D3, and one (2%) had an equal response. With 3 d of changed experience, 53 of 75 cells (70.7%) were biased in response toward Dpaired, with the remainder (19.7%) biased toward Dcut. Slightly higher biases were achieved at 7- 10 and 30 d of modified experience where 36 of 48 cells (75%) and 26 of 36 cells (72.2%) had larger responses to Dpaired than to Dcut, respectively.
Changes in latency to D-row surround whiskers
Modal latencies for responses to stimulation of all whisker in- puts were collected, in parallel with all response magnitude data. Responses failing to generate latency histograms with a valid, model latency peak (see Materials and Methods) were registered as null responses for the purposes of this section. From the pooled data for each whisker, cumulative frequency plots for latencies were constructed (see legend of Fig. 6). In Figure 6 cumulative latencies to stimulation of Dpaired and Dcut are compared with controls (Dl and D3). With all periods of mod- ified experience broadly similar patterns emerge for differences in latencies to Dpaired or Dcut, which in each set of graphs are compared with controls.
The features in common for each period of altered experience (Fig. 6) are as follows. (1) The total percentage of cells generating coherent modal latencies to Dpaired exceed those responding to Dl or D3 in controls. (2) For experimental groups, the in- cidence of latencies that are 520 msec for responses to Dpaired are close to twofold those to Dcut. This finding parallels the differences in response magnitude to these whiskers. (3) For all periods of modified experience there is a higher incidence of shorter-latency responses (I 15 msec) to both Dpaired and Dcut compared with control whiskers (Dl and D3). To stimulation of Dpaired, approximately one-half of the cells in whisker-spared animals exhibited latencies of 5 15 msec (49% at 3 d, 42.7% at 7-10 d, and 52.7% at 30 d), compared with 11.7% to Dl and
20 1 CONTROLS
D3/D1 +D3 Dpaired/Dpaired+Dcut
20 1 7-10 DAYS
10
0 0.2 0.4 0.6 0.8 1
Dpaired/Dpaired+Dcut
32
Dpaired/Dpaired+Dcut
Dcut - Dpaired
Figure 5. Surround dominance for D row. Distributions of biases in response magnitude to either Dpaired or Dcut are shown for individual cells in the D2 barrel. For definition of Dpaired and Dcut see Figure 4. The effect of cutting all whiskers save D2 and Dpaired for 3, 7-10, and 30 d (upper right, lower left. and lower right, respectively) are compared with controls (upper left). For controls, relative biases in response to analogous Dl or D3 whiskers are shown. Abscissa, For controls, re- sponse magnitudes to D3 are divided by the sum of responses to Dl and D3. For experimentals, response magnitudes to Dpaired are divided by the sum of responses to Dpaired and Dcut. Response magnitude is defined as the number of spikes generated 100 msec poststimulus in 50 presentations of stimuli to a whisker. Ordinate, Percentage of cells. For further details, see Results.
D3 in controls. The latter compared with 21.3%, 20.8%, and 22% of cells for the 3, 7-10, and 30 d periods, respectively, to Dcut.
For controls, virtually no cells (0.98%) exhibited latencies of 5 10 msec in reply to stimulation of D 1 and D3, which conforms with an earlier finding for surround inputs to barrels in normal rats (Armstrong-James and Fox, 1987). With modified experi- ence there was a novel appearance of responses at these very short latencies (5 10 msec) to Dpaired and to a lesser extent to Dcut. This phenomenon was maximal in the 30 d group. For responses to Dpaired, 10.7%, 8.3%, and 33.3% of cells respond- ed at latencies of < 10 msec in the 3, 7-10, and 30 d groups, respectively. Responses to Dcut at 5 10 msec poststimulus in the 3 d group were virtually absent (1.3%), in common with controls, whereas for the 7-10 and 30 d groups cells responding within these latencies to Dcut increased to 8.3% and 1 l.l%, respectively.

6984 Armstrong-James et al. - Plasticity of Barrel Cortex
100 -
80 -
60 -
3 Days
w+- Dl/D3 Controls -o- Dpaired --o- Dcut
O- 0 10 20 30 40 50 60
100
1 7 Days
& Dl/D3 Controls
& Dcut
0 10 20 30 40 50 60
100
1 30 Days
80
60
DUD3 Controls
-o- Dcut
lb 26 36 46 56 60
Modal Latency (ms)
After 30 d of pairing, there is a higher incidence of cells firing at very short latencies to both Dpaired and Dcut accompanied by a decline in longer-latency responses to both whiskers. The maximal incidence for responses to Dcut has declined further compared with shorter periods of pairing. The maximal inci- dence for responses to Dpaired is similar to controls.
Changes in latency to 02, the principal whisker
In Figure 7 (top), cumulative latencies to the D2 whisker in experimental animals are compared with controls. The plot for 30 d of pairing is shifted by approximately I msec to the left compared with controls, suggesting that some 90% of cells have exhibited a decrease in latency to D2 by this amount. The plots for 3 and 7-10 d of pairing show an opposing trend: for some 60% of responses, latencies to D2 are increased, compared with controls, by just under 1 msec.
Changes in latency to C2 and E2, the arc surround whiskers
Cumulative latencies to the cut arc whiskers (C2 and E2) in D-row-paired experimental animals are compared with controls in Figure 7 (bottom). Very-short-latency responses (< 10 msec latency) to the cut arc whiskers failed to appear at any stage, in common with controls, but differing in this respect from Dcut and Dpaired whiskers (see above). The principal effect at all stages was to reduce the incidence of cells firing at all latencies fairly uniformly, although for the 3 day group the effect was to reduce the incidence of cells firing at latencies > 15 msec more selectively. For the 3 and 7-10 d groups, the total proportion of cells showing coherent latencies was similar (34.7% and 34.4%, respectively), and was reduced compared to controls (58%). For the 30 d group there was a further reduction to 22% for this index.
Modljication of early and later responses
The data given above represent changes in the latency for the first spike generated poststimulus for each whisker. They do not show modifications in magnitude of earlier and later compo- nents of whole responses. To allow temporal analysis of com- plete responses, poststimulus histograms (PSTHs) generated by each whisker were condensed into three sequential poststimulus epochs of 5-10, 10-20, and 20-100 msec poststimulus (spikes evoked prior to 5 msec poststimulus were exceedingly rare). Data for individual epochs were summed for all cells at each period of altered experience. The data for responses to whiskers in the D row are shown in Figure 8, where they are compared for each period of pairing.
Figure 8A shows that the response to D2 was increased relative to controls following pairing of D-row whiskers for 3 and 7-l 0 d. These increases in the D2 response in each group were at- tributable almost entirely to intermediate- and long-latency dis-
c
Figure 6. Cumulative latency plots for responses to D-row surround whiskers. Plots show cumulative frequency for numbers of D2 barrel cells (ordinate) achieving modal latency values (abscissa) at 1 msec incremental latencies up to 50 msec, in reply to stimulation of D-row whiskers adjacent to D2. All cells were in barrel D2. Plots for responses to Dcut and Dpaired are shown for the experimental stages of pairing and for responses in controls to analogous Dl and D3 whiskers, the latter being pooled. For definition of Dpaired and Dcut, see Figure 3. Top, Plots for cells at 3 d; middle, for cells at 7-10 d, and bottom, for cells at 30 d of cutting all whiskers save Dpaired and D2. For further description, see Results.

charges (1 O-20 and 20-l 00 msec poststimulus epoch). By 7-10 d of pairing, the earliest responses to D2 (5-10 msec poststim- ulus) had increased only conservatively. By contrast, at 30 d of pairing, the intermediate and late discharges evoked by D2 were diminished relative to controls; conversely, the response in the earliest epoch peaked at this stage.
The pattern of changes in response to the spared D-row whisk- er (Dpaired) was very similar to that of the paired D2 whisker (Fig. 8B; compare with Fig. 8A). For 3 and 7-10 d of pairing, increases in intermediate and late discharges to Dpaired were substantial, relative to controls. With 30 d of pairing, there was a pronounced shift in latency to responses appearing in earlier epochs (5-10 msec and 10-20 msec), at the expense of late discharges (20-100 msec). Shortest-latency discharges to Dpaired (5-10 msec epoch) became substantial only at 30 d of pairing, paralleling the increase for the D2 whisker.
By contrast with changes for paired whiskers, discharges at long latencies (20-100 msec) for the cut whisker in the D row (Dcut) progressively decreased with longer periods of depriva- tion (Fig. 8C). On the other hand, short-latency responses to Dcut (5-10 msec) were generally absent, becoming evident at only a low level after 30 d of pairing. Discharges at intermediate latencies (1 O-20 msec) to Dcut whiskers changed little with pairing.
The main changes can be summarized as follows. (1) With 3 and 7-10 d of pairing, increases in responses to spared D-row whiskers (D2 and Dpaired), relative to controls, were achieved largely by increases in magnitude of intermediate- and long- latency components of the response (1 O-20 and 20-100 msec). (2) With 30 d of pairing, increase in response to paired whiskers was restricted largely to discharges at 5-10 msec poststimulus (D2) or at 5-10 and 10-20 msec poststimulus (Dpaired). (3) For Dcut the decrease in response with pairing arose largely from a progressive decrease in late (20-100 msec poststimulus) dis- charges, in proportion to the duration of pairing.
Changes in spontaneous activity Spontaneous firing rates of cells were averaged for each cell prior to stimulation of each whisker. The mean firing rates for control cells and for cells in the three experimental groups are illustrated in Figure 9. Mean spontaneous firing rates fell from 1.54 spikes/ set in controls to approximately 1 spike/set at 3, 7-10, and 30 d of modified experience. Differences from controls were not significant for the 3 d period of pairing, but were highly signif- icant for 7-10 and 30 d periods of changed experience (p < 0.001 for each period, MWU test).
Arc pairing: the 02 whisker paired with C2 or E2 whiskers
Six additional rats were examined after 7 d of pairing of whisker D2 with either C2 or E2 (arc pairing). In common with the previous experiments, data were gathered only for cells located in the D2 barrel (N = 58 cells). Findings for these cells were qualitatively similar to those for animals where D-row whiskers were paired for 3-10 d, with the exception that changes were more erratic and less robust.
The overall results are illustrated in Figure 1OA. A bias in response toward the spared whisker in the arc is evident, whether C2 or E2 was paired with the principal whisker, D2. When C2 was paired with D2 the response to C2 was increased relative to controls. Response to the cut E2 whisker declined well below control levels, more so than with broadly equivalent periods (3- 10 d) of pairing of D-row whiskers. The difference in response
The Journal of Neuroscience, November 1994, f4(11) 6985
D2 Whisker
80 -
80 -
40 1
Controls - 3 days - 7-10 days
30 days
0
60-
50 -
40 -
30 -
20 -
lo-
10 20 30
Arc Whiskers
F==+=
---I
0 10 20 30 40 50 60
Modal Latency (ms)
Figure 7. Cumulative latency plots for responses to D2 (top) and sur- round arc whiskers (bottom). The arc whiskers are immediately adjacent to the D2 whisker (C2 and E2). Plots show cumulative frequency of numbers of D2 barrel cells (ordinate) achieving modal latency values, at 1 msec incremental latencies up to 50 msec (abscissa), to whisker stimulation. Note that ranges for axes differ. Individual plots for control animals and for the three periods of whisker cutting (3, 7-10, and 30 d) are shown. For the latter, D2 and Dl or D3 whiskers were left intact, whereas adjacent arc whiskers and D3 or Dl were cut for the periods shown, in all experiments except controls. In controls no whiskers were cut (data for Dl and D3 pooled). Note that latencies to 02 in the 30 d group shift to earlier modal latencies of about 1 msec. Changes for arc whiskers are more dramatic and are described in Results.
to C2 and E2 was highly significant (p < 0.000 1, WMPSR test), and bias toward the paired C2 arc whisker relative to the de- prived E2 whisker was consequently severe. When D2 and E2 whiskers were paired, mean response magnitudes to the E2 whisker increased substantially above control levels. However, unlike pairing with D-row whiskers, the cut whisker in the arc,

6966 Armstrong-James et al. l Plasticity of Barrel Cortex
A 02
CONTROL
B Dpaired
Figure 8. Poststimulus epochs for re- sponses of cells in the D2 barrel to whiskers D2 (A), Dpaired (B), and Dcut (C). Epochs are condensed portions of the PSTHs, these encompassing dis- charges at 5-10 (black), 10-20 (gray), and 20-100 (hatched) msec poststim- ulus. For each poststimulus epoch, re-
Dl D3
I CONTROLS I sponses for celis were pooled and di- vided bv the number of cells used, p Dcut yielding ihe mean number of spikes per ” 50 stimuli. A, Results for controls (left) compared with those for 3, 7-10, and 30 d of changed experience for re- sponses to the D2 whisker. B, Equiv- alent histograms for responses to Dpaired and D-row control SRFs (Dl and D3). C, Equivalent data for re-
d B
:::.;q .:.:.:.:... $g$ ;.+ g& sponses to Dcut and D-row control SRFs. For further details on whisker terminology, see Figure 3. Further de- scription is given in Results.
:m .w
Dl D3
I CONTROLS I
3 DAYS 7-10 DAYS
3 DAYS 7-10 DAYS
3 DAYS 7-10 DAYS
40-
30- 2
5
i3 3j
20- $! E cl3
El
lo- g z
07
15 -
lo-
5.
0-I
15 -
IO-
5-
O-
C2, paradoxically generated a larger mean response magnitude than in controls. Discussion
Modal latencies also shifted with pairing of whiskers across the D2-centered arc (Fig. 10B). In common with D-row pairing for 3-10 d, the principal change for the paired whisker in the arc was an increase in the incidence of intermediate latencies (1 O-20 msec) compared with controls. For the cut whisker in the arc the incidence of these latencies did not change, but in common with Dcut with D-row pairing there was a minor in- crease in incidence of shortest-latency responses (< 10 msec). Also, in common with Dcut (with D-row pairing), there was a decrease in incidence of cells responding late to the cut arc whisker compared with controls.
The main finding of this study is that an innocuous sensory bias in the adult rat, generated by trimming some whiskers and leav- ing others intact, is sufficient to produce changes in bias of receptive fields of barrel cortex cells that reflect the changes in sensory use. Bias in the receptive field to paired surround inputs increased in proportion to the duration of the modified expe- rience. Potentiation and weakening of synaptic weights of the spared and cut whisker, respectively, were consistent with the general principles of Hebb’s and Stent’s hypotheses. The findings suggest that in the mature animal the RF organizations of SI neocortical cells are continuously modified as a result of recent

The Journal of Neuroscience, November 1994, 14(11) 6987
Spontaneous firing rates 88 MEAN
I I 0 S.E.
CONTROL 3 DAYS 7 DAYS 30 DAYS
Figure 9. Changes in mean spontaneous activity of D2 barrel cells with D-row pairing. Data are derived for all cells tested in control animals and those for the three periods of pairing (abscissa). White bars indicate standard error of the mean (S.E.). Differences from controls were not significant with 3 d of pairing. At 7-10 and 30 d of pairing, differences from controls were highly significant (p < 0.00 1, MWU test). For further description, see Results.
experience. The finding that neocortical responses to whisker inputs may be modified without peripheral damage, and the wealth of knowledge on their central connections, makes the barrel cortex a useful system for experiments on sensory neo- cortical plasticity.
After 3 and 7-10 d of pairing, most of the potentiation of response to each of the paired whiskers was generated by longer- latency discharges, whereas after 30 d of pairing, potentiation was confined to the shortest-latency discharges for paired whisk- ers (< 10 msec poststimulus). With 30 d of pairing the poten- tiation of the “paired” input was less than with the shorter periods of pairing. However, weakening of unpaired inputs con- tinued, resulting in greater overall bias of the RF toward paired inputs. Two phases of modification are suggested: “acute,” dur- ing the first 10 d of pairing, and “chronic,” after 30 d of pairing.
Origins of modified responses to acute (3-10 d) whisker pairing
Responses to the paired surround whisker inputs (D2 and Dpaired) in the acute stage exhibited major increases in mag- nitude at 10-100 msec poststimulus compared with controls, but only minor increases for the earliest (S-10 msec poststim- ulus), which encompasses the monosynaptic responses to direct thalamocortical relay in the normal adult barrel cortex (Arm- strong-James and Callahan, 199 1; Armstrong-James et al., 199 1; Agmon and Connors, 1992). Conversely, under similar exper- imental conditions in normal rats, discharges of barrel cells at latencies > 10 msec poststimulus to surround whisker inputs have been shown to be entirely dependent upon intracortical relay between columns (Armstrong-James and Callahan, 199 1; Armstrong-James et al., 199 1). Similarly, discharges at latencies > 10 msec poststimulus to the principal input (here D2) have been inferred to arise by further intracortical relay of the principal input between cells within the targeted barrel (Armstrong-James and Callahan, 199 1; Agmon and Connors, 1992; Armstrong- James et al., 1992). This evidence supports the conclusion that the observed potentiation of the response to acutely paired whiskers is largely attributable to corticocortical potentiation. However, for the paired surround whisker (Dpaired), one pos- sibility is that potentiation of thalamocortical synapses already present on cells of the Dpaired barrel may account for all of the strengthened barrel-to-barrel drive for the potentiated surround
A D2K2 paired D2/E2 paired
C2 Di D2 D3 E2
Whisker Whisker
B 80
- Arc Controls
-- Arc Cut 7 days
“0 10 20 30 40 50 Modal Latency (ms)
Figure 10. Response magnitudes and cumulative latencies for arc- paired animals. A, Mean magnitude of responses of cells in the D2 barrel to 50 stimuli applied to the D2 whisker or one ofits immediate surround whiskers in animals in which all whiskers were cut except D2 and adjacent surround whiskers in the same arc, C2 (left) or E2 (right). Cells were tested for responses after 7 d of whisker pairing (see Materials and Methods). Abscissa denotes whisker name, and ordinate denotes spikes evoked per 50 stimuli applied at one stimulus per second, responses being assessed for 100 msec period poststimulus. Note asymmetry of surround receptive fields toward responses to the spared surround whiskers (C2 or E2; dark shading). White bars are standard errors (S.E.). N = number of cells used to construct each histogram set. B, Cumulative frequency plots of percentage of D2 barrel ceils (ordinate) achieving modal latency values at 1 msec incremental latencies up to 50 msec (abscissa) in reply to stimulation of arc whiskers adjacent to D2 (E2 or C2). All cells were in barrel D2 of animals deprived of all whiskers except arc-paired whiskers (D2 and E2 intact in some experiments or D2 and C2 in others) for a period of 7 d. Results for responses to cut whisker in the arc (Arc cut) and paired whisker in the arc (Arc paired) are shown; these are compared with responses in controls to analogous arc (C2 and E2) whiskers, for which results were pooled (Arc controls). Data are from the same cells used for in A.
response. Examination of Figure 8 shows that this is unlikely. With 3 d of pairing the shortest-latency (thalamocortical) re- sponses to a principal whisker show very little change (Fig. 84, whereas the latest responses (20-100 msec poststimulus) ac- count for most of the increase. However, after only 3 d of bias the greatest increase in response to the paired surround whisker is generated at 10-20 msec poststimulus (Fig. 8B), and cannot be initiated by the later potentiated responses generated by the principal whisker.
Another possibility is that D2 cells in the thalamus developed novel potent responses to the surround paired whisker, which

6988 Am-strong-James et al. l Plasticity of Barrel Cortex
were then relayed to the D2 barrel. Again, this explanation is unlikely for the acute stages, since the early discharge of barrel cells (< 10 msec) to potentiated surround inputs was still trivial compared with the longer-latency intracortical discharges that constituted virtually all oftheir potentiated response. Since even in normal animals the small surround responses of relay neurons in VPM occur within l-2 msec of responses to the principal whisker, at latencies of 5-7 msec, any increase in response of barrel cells to their discharge should have occurred within 10 msec poststimulus (Armstrong-James and Callahan, 199 1).
Potentiation after any period of whisker pairing is highly un- likely to be explained simply by a general increase in neocortical excitability, since spontaneous activity levels fell by some 25% for all stages of pairing. Furthermore, responses to deprived surround inputs progressively decreased with the duration of the modified experience. However, alterations in inhibitory in- teractions in barrels do occur with modified whisker inputs in rodents. When the infraorbital nerve is sectioned in adult mice, a decrease in GAD immunoreactivity in cell bodies and puncta for deprived barrels is found within 3 d, reaching maximal levels at 14-30 d (Welker et al., 1989). Similar findings are reported for GABA immunoreactivity where follicles are ablated at 8 weeks postnatal (Kossut et al., 1991). Significantly, in neither study did changes in GABAergic immunoreactivity appear in barrels related to a spared whisker. Hence, a putative fall in GABAergic transmission (in surround barrels) with whisker ab- lation fails to explain the fall in response to deprived (cut) sur- round whiskers found in our study, since the reverse would be expected.
One day after selective plucking of whiskers, higher 2-deoxyglucose (2-DG) activity occurs in barrels corresponding to intact whiskers than in those of removed whiskers (Durham and Woolsey, 1978). Where the C3 whisker is spared and all other whiskers are cut, the C3 barrel shows a twofold increase in the number of cells labeled by 2-DG some 16 hr later com- pared with controls (McCasland and Woolsey, 1988). Also, 2-DG labeling spreads beyond the confines of a barrel within 1 hr of stimulation of its principal whisker (Chmielowska et al., 1986), which suggests potentiation of uptake within intracortical net- works linking barrels rather than thalamocortical elements that are confined to barrels. These short-term changes parallel the increases in longer-latency discharges to the principal and paired whisker inputs, which developed with acute pairing in the pres- ent study.
The most convincing explanation for enhancement of the paired surround input in acute stages, therefore, is potentiation of the excitatory circuitry that normally generates the surround receptive field, which is by relay of barrel-neighbor activity through the corticocortical network connecting barrels (Arm- strong-James and Callahan, 199 1; Armstrong-James et al., 199 1; see also introductory remarks). Similar arguments relate to the converse progressive decrease in response to deprived surround receptive field whiskers, which we interpret as a progressive decrease in efficacy of corticocortical transmission (from barrels with deprived inputs to barrels with paired inputs).
Modified responses to chronic (30 d) whisker pairing
After 1 month of whisker pairing responses to the paired sur- round whiskers declined, although they still remained poten- tiated compared with controls; responses to cut surround whisk- ers continued to decline further below control levels. Recently, sectioning of the infraorbital nerve in mice on postnatal day 7
has been shown to produce a profound decrease in intracortical axonal projections between barrels, when examined at maturity (McCasland et al., 1992). Whether in our studies a simple de- crease in sensory drive from cut whiskers in the adult is adequate to reduce intracortical collaterals coupling deprived and active barrels remains to be seen. At present it is unknown whether axon collaterals of neocortical cells retract with simple sensory disuse in adult mammals.
There was a progressive increase with duration of pairing in short-latency responses (5-10 msec poststimulus) to the paired principal whisker, D2, although the major increase occurred at 30 d. Since discharges at < 10 msec poststimulus are largely evoked by monosynaptic thalamocortical relay (Armstrong- James and Callahan, 1991; Armstrong-James et al., 1991), a potentiation of monosynaptic thalamocortical relay by the prin- cipal whisker, D2, is suggested. A similar but smaller potentia- tion of thalamocortical relay was also reflected in responses to paired surround D-row whiskers with 30 d of pairing. Thus, as hypothesized by Merzenich and his coworkers (Merzenich et al., 1988), potentiation ofthalamocortical inputs may occur with chronic use, in our case both for the appropriate principal D2 input to the D2 barrel and to a lesser extent to the inappropriate paired input (Dpaired). Further experiments are required to establish whether these short-latency responses for Dpaired are attributable to a morphological expansion or potentiation of input at the cortical level of thalamic terminals. The latter may arise by potentiation of the small proportion of thalamocortical afferents from the thalamic relay, the ventral posterior medial nucleus (VPM), which are reported to diverge to surrounding barrels (Jensen and Killackey, 1987).
Despite potentiation of short-latency responses for the paired D-row whiskers with chronic pairing, later discharges declined relative to acute pairing, suggesting a switch from a transient corticocortical to a stable thalamocortical potentiation. A be- havioral origin for the resulting overall lower level of potentiated responses with chronic as apposed to acute pairing is possible. With chronic pairing, strategies for investigation of the envi- ronment might have changed, and perhaps the other side of the face was used preferentially, where whiskers were intact. A de- cline in use of the modified side at 30 d of pairing relative to acute pairing may explain the overall fall in response magnitudes for paired whiskers. Clearly, detailed behavioral studies are re- quired.
When a single row of whiskers is trimmed from birth to maturity, barrel morphology remains unaltered, as shown by cytochrome oxidase (CO) staining (Land and Simons, 1985; Lee et al., 1992). Conversely, when all whiskers but one are plucked from birth to maturity, the barrel of the intact whisker signifi- cantly increases in size, as shown by CO staining (Fox, 1992). The question remains whether plucking causes significant re- ceptor damage since whisker removal is often accompanied by bleeding from the follicles. Simons and Land (1987) using trim- ming from birth, found that responses to the principal whisker for deprived barrels increased at maturity, which we have not yet examined in adult rats. However, Fox (1992) found little if any change in response magnitude for barrel cells to their de- prived principal whisker, plucked since birth, or for the intact principal whisker. His main finding for barrel cells at maturity was that the territory over which a single spared Dl whisker yielded very-short-latency (< 10 msec) first discharges expanded to parts of neighboring barrels. This finding complements our own for the paired surround D-row whisker (Dpaired) input to

The Journal of Neuroscience, November 1994. 74(11) 6989
the D2 barrel with chronic pairing in adults. An important operational difference, however, is decreased latency to an intact surround input to a barrel with an intact principal whisker input in our case, as apposed to an intact surround whisker input to a deprived barrel in his study. Deprived barrels were not ex- amined in our study.
Although similarities exist, cellular mechanisms may be ex- pected to differ for changes resulting from neonatal and adult deprivation. Where removal of input is sustained throughout the entire postnatal period (Simons and Land, 1987; Fox, 1992) one is dealing with a period of substantial functional modifi- cation of the cortical map that occurs during normal develop- ment. In rats on postnatal day 6, receptive fields of barrel cortex cells are extremely large compared with adults, in that cells often respond to all of the contralateral mystacial vibrissae (Arm- strong-James, 1975) although the morphology of barrels is in- distinguishable from that found in adult rats. Removal of all whiskers save one from birth may lead to some extension of the neonatal condition where a larger cortical territory remains functionally innervated by the intact whisker.
Immediate RF changes following peripheral damage
Cortical RFs have been shown to change rapidly following se- lective removal of peripheral inputs. When a single digit is am- putated in flying foxes, adult monkeys, or rats, an immediate expansion of receptive fields occurs for cells adjacent to the lesioned site (Calford and Tweedale, 1988, 1991a; Byrne and Calford, 199 1). With local amputation the expansion declined over a period of 7-10 d. An entirely similar effect was seen in flying foxes where capsaicin, a C-fiber neurotoxin, was injected subcutaneously (Calford and Tweedale, 199 1 b). The authors interpreted the changes as arising from “unmasking” of existing excitatory synaptic actions as proposed by Millar and his co- workers for subcortical relay nuclei immediately following pe- ripheral denervation of the hindlimb in cats (Dostrovsy et al., 1976; Millar et al., 1976).
From their experiments using capsaicin, Calford and his co- workers interpreted their findings as arising from removal of C-fiber afferent drive, which they hypothesized to maintain cen- tral inhibition. Their interpretation would seem untenable for our findings, since there is no reason to suppose C-fiber activity could be influenced by an innocuous trimming of whiskers, whereas in experiments involving amputation, local anesthesia, or capsaicin, alterations in nociceptor activity clearly may be involved. Second, the fall in spontaneous activity in the “ex- perienced” barrel in our study is not commensurate with de- creased cortical inhibition. The findings above do, however, require further experiments to establish if changes occur within minutes of whisker trimming.
Repetitive application of trains of conditioning-testing (C-T) stimuli to paired clusters of whiskers have been shown to gen- erate rapid increases in response magnitude of rat SI cortical neurons to either the conditioning or testing stimuli in unanes- thetized rats. Effects were registered within minutes of com- mencing stimulation for a minority of cells and changes lasting for up to 20 min postconditioning were shown for one cell (Delacour et al., 1987). However, in most instances there were very substantial increases in the spontaneous firing rate of the cell studied (up to 1 O-fold). Interestingly, the authors did mon- itor the EEG, which progressively changed as stimulation pro- ceeded for all cells studied. By contrast with both of the above studies, in our studies EEG changes, which relate to changes in
the conscious state and influence receptive field size (Armstrong- James and Fox, 1983, 1988; Armstrong-James and George, 1988; Diamond et al., 1992) were monitored and avoided by con- trolled anesthesia.
Use-dependent changes in adults
Two other studies in adult mammals on SI cortical plasticity are highly relevant to our findings. In the first, two adjacent digits on the hand of the adult owl monkey were surgically fused (syndactyly) for several months with the limb encased in a cast for a short period (Clark et al., 1988). RFs for cell clusters in area 3b involving both digits were found commonly, whereas for control animals cell clusters responded to only one digit. Presumably in this experiment cell clusters achieving dual rep- resentation of digits were interpreted as such by being equally responsive to the two digits, since qualitative assessment of responses was used. Conceptually this would be interpreted in our analysis as the upgrading of a surround RF input to equal the magnitude of response to the prior principal input, and is qualitatively analogous to our findings for the paired whisker inputs.
In another study, monkeys were trained to engage a rotating grooved disc with the extremity of one or two digits and tested after 3-9 months of daily training (Jenkins et al., 1990). This procedure resulted in a reduction of receptive field sizes of cell clusters in the region of SI cortex normally maximally respon- sive to that digit when tested after several months of training, together with an expansion of the area of cortex preferentially activated by the stimulus site. Interestingly, the expansion was into area 3A, which is normally receptive to muscle and some joint and Pacinian inputs that might have been activated by training. In those experiments the observed changes in maps refer to changes in the dominant (principal) input site for cell clusters, the surround receptive field distinction not being used. These changes are further discussed in relation to our findings below.
Hypotheses and models for use-dependent plasticity
In the three mapping studies on use-dependent changes in adult SI cortex, alterations in RFs occurred (Clark et al., 1988; Jenkins et al., 1990; present results). However, only in one study (Jenkins et al., 1990) were reductions in RF size documented, and these were accompanied by an increase in cortical territory serving a constant peripheral area. Some columns in the trained cutaneous area that responded to the “experienced” peripheral input must have shifted their response to different inputs and got function- ally disconnected from their original inputs. In addition, other inputs from the experienced skin must shift their allegiance away from their original cortical columns to territory normally dom- inated by other inputs (in their case, to area 3A). Only in this way can receptive field size decrease with an increase in cortical area per unit area of the periphery. Such radical alterations in cortical columnar organization are not implicated from our ex- periments or for syndactyly (Clark et al., 1988). For the latter the principal finding is an increase in overlap of adjacent pe- ripheral sites relaying paired information to the same barrel column or presumably to the same cortical neuronal group.
The concepts of increase in associative interaction between columns (our study) and increases in peripheral acuity implied from a decrease in RF size (Jenkins et al. 1990) need reconcil- iation, since both apply to selective use of extremities, and op- posing changes in central representation may at first sight appear

6990 Armstrong-James et al. - Plasticity of Barrel Cortex
to be involved. However, increased overlap and decrease in RF size are not necessarily incompatible for the same cells. Our findings, best illustrated with chronic pairing, were an increase in overlap for the paired inputs, accompanied by a decrease in response to unpaired inputs. Such changes may produce a net gain in discrimination, in theory, by producing a net reduction in RF size, while retaining a potentiated paired surround input and preserving the original somatotopic organization for prin- cipal inputs.
The origins for the changes we have observed are not readily explained by an unmodified Hebb-Stent rule, which would pre- dict that the degree of paired usage and potentiation were di- rectly proportional. Our findings indicate three processes op- erating within the duration of changed experience. The first, for the paired whiskers, is an initial increase in long-latency re- sponses during the acute stages, followed by a decrease that was evident at 30 d. The second is a progressive increase in short- latency responses from 3 to 30 d of pairing, particularly for paired whiskers and most for the principal whisker. The third is a monotonic decrease, with duration of pairing, in response to cut whiskers.
The mechanisms of the three types of plasticity reported here have been addressed by a mathematical-computer model of barrel cortex (Benuskova et al., 1993). The model simulates the activity of a barrel D2 neuron with input from the thalamic relay (VPM barreloid D2), from within barrel-column D2, and from surrounding barrels. Synaptic modification is described by the Bienenstock, Cooper, and Munro (BCM) rules, according to which a neuron’s threshold for synaptic modification is a dy- namic function of its average firing rate (Bienenstock et al., 1982). In computer simulations all synapses reach a stable level under conditions where each input is active, representing the rat with all whiskers intact. To simulate whisker pairing, all inputs except two (representing the paired whiskers) are set to a “noise” level. The threshold for synaptic modification rapidly decreases, reaching a minimum after about 10 d. The decreased threshold allows intracortical and thalamocortical inputs related to the paired whiskers to potentiate; however, the threshold remains sufficiently high that purely noisy inputs from the bar- rels of cut whiskers become depressed. After 10 d of simulated whisker pairing, the thalamocortical input continues to poten- tiate. As a result, the modification threshold now begins to in- crease, causing the intracortical inputs from both paired and unpaired whiskers to decrease in efficacy. The sequential de- crease and increase in the BCM synaptic modification threshold provides a possible mechanism for the experimental observa- tions presented here on experience-dependent cortical plasticity.
References Armstrong-James M (1975) The functional status and columnar or-
ganization of single cells responding to cutaneous stimulation in neo- natal rat somatosensory cortex, SI. J Physiol (Lond) 246:501-638.
Armstrong-James M, Callahan C (199 1) Thalamocortical mechanisms in the formation of receptive fields of rat barrel cortex neurones. II. The contribution of ventroposterior medial thalamic (VPm) neu- rones. J Comp Neurol 303:21 l-224.
Armstrong-James M, Fox K (1987) Spatio-temporal divergence and convergence in rat SI “barrel” cortex. J Comp Neurol 263:265-28 1.
Armstrong-James M, Fox K (1988) A role for NMDA receptors in slow-wave sleep. Brain Res 45 1: 189-l 96.
Armstrong-James M, George MJ (1988) The influence of anaesthesia on spontaneous activity and receptive field size of single units in rat Sml neocortex. Exp Neurol99:369-387.
Armstrong-James M, Millar JM (1979) Carbon fibre microelectrodes. J Neurosci Methods 1:279-287.
Armstrong-James M, Fox K, Millar JM (1980) A method for etching the tips of carbon fibre microelectrodes. J Neurosci Methods 2:43 l- 432.
Armstrong-James M, Callahan CA, Friedman M (1991) Thalamo- cortical mechanisms in the formation of receptive fields of rat barrel cortex neurones. I. Intracortical mechanisms. J Comp Neurol 303: 193-210.
Armstrong-James M, Fox K, Das-Gupta A (1992) Flow of excitation within barrel cortex on striking a single vibrissa. J Neurophysiol68: 1345-1358.
Benuskova L, Diamond ME, Armstrong-James M, Ebert M, Ebner FF (1993) BCM model of experience-dependent plasticity in rat barrel cortex. Sot Neurosci Abstr 19: 1570.
Bienenstock EL, Cooper LN, Munro PW (1982) Theory for the de- velopment of neuron selectivity: orientation specificity and binocular interaction in visual cortex. J Neurosci 2:32-48.
Byrne JA, Calford MB (199 1) Short-term expansion of receptive fields in rat primary somatosensory cortex after hindpaw digit denervation. Brain Res 565:218-224.
Calford MB, Tweedale R (1988) Immediate and chronic changes in responses of somatosensory cortex in adult flying-fox after digit am- putation. Nature 332:446448.
Calford MB, Tweedale R (1990) Interhemispheric transfer of plasticity in the cerebral cortex. Science 249:805-807.
Calford MB, Tweedale R (199 la) Acute changes in cutaneous receptive fields in primary somatosensory cortex after digit denervation in adult flying fox. J Neurophysiol 65: 178-l 87.
Calford MB, Tweedale R (199 1 b) C-fibres provide a source of masking inhibition to primary somatosensorv cortex. Proc R Sot Lond IBioll 2431269-275: -
_ _
Carve11 GE, Simons DJ (1990) Biometric analyses of vibrissae tactile discrimination in the rat. J Neurosci 10:2638-2648.
Chiaia NL, Bauer WR, Zhang S, King TA, Wright PC, Hobler SC, Freeman KA (1992) Effects of neonatal transection of the infraor- bital nerve upon the structural and functional organization of the ventral posteromedial nucleus in the rat. J Comp Neurol 326:56 l- 579.
Chmielowska J, Kossut M, Chmielowska M (1986) Single vibrissal cortical column in the mouse labeled with 2-deoxyglucose. Exp Brain Res 63:606-6 19.
Clark SA, Allard T, Jenkins WM, Merzenich MM (1988) Receptive fields in the body-surface map in adult cortex defined by temporally correlated inputs. Nature 332:444-445.
Delacour J, Houcine 0, Talbi B (1987) “Learned” changes in the responses of the rat barrel field neurons. Neuroscience 23:63-72.
Diamond ME, Armstrong-James M, Budway MJ, Ebner FF (1992) Somatic sensory responses in the rostra1 sector of the Posterior Group (Porn) and in the ventral posterior medial nucleus (VPM) of the rat thalamus. J Comp Neurol 3 18:462-476.
Diamond ME, Armstrong-James M, Ebner FF (1993) Experience de- pendent plasticity in adult rat barrel cortex. Proc Nat1 Acad Sci USA 90:2082-2085.
Dostrovsky JO, Millar J, Wall PD (1976) The immediate shift of afferent drive of dorsal column nucleus cells following deafferentation: comparison of acute and chronic deafferentation in gracile nucleus and spinal cord. Exp Neurol 52:480-495.
Durham D, Woolsey TA (1977) Barrels and columnar cortical orga- nization: evidence from 2-deoxy-glucose experiments. Brain Res 137: 169-174.
Erzurumlu RS, Jhaveri S (1990) Thalamic axons confer a blueprint of the sensory periphery onto the developing rat somatosensory cor- tex. Dev Brain Res 56:229-234.
Fox K (1992) A critical period for experience-dependent synaptic nlasticitv in rat barrel cortex. J Neurosci 12:1826-1838.
Fox K, Armstrong-James M (1986) The role of the anterior intralam- inar nuclei and N-methyl-D-aspartate receptors in the generation of spontaneous bursts in rat neocortical neurones. Exp Brain Res 63: 505-5 18.
Hebb DO (1949) The organization of behaviour. New York: Wiley. Jacquin MF (1989) Structure-function relationship in rat trigeminal
brainstem subnucleus interpolaris. V. Functional consequences of neonatal infraorbital nerve section. J Comp Neurol 282:63-79.
Jeannmonod D, Rice FL, Van der Loos H (198 1) Mouse somatosen-

The Journal of Neuroscience, November 1994, 14(11) 6991
sory cortex: alterations in the barrelfields following receptor injury at different early postnatal ages. Neuroscience 6: 1503-l 535.
Jenkins WM, Merzenich MM, Ochs MT, Allard T, Guic-Robles E (1990) Functional reorganization of primary somatosensory cortex in adult owl monkeys after behaviourally controlled tactile stimulation. J Neu- rophysiol 63:82-104.
Jensen KF, Killackey HP (1987) Terminal arbors of axons projecting to the somatosensory cortex of adult rats. 1. The normal morphology of specific thalamocortical afferents. J Neurosci 7:3529-3543.
Kaas JH (199 1) Plasticity of sensory and motor maps in adult animals. Annu Rev Neurosci 14:137-168.
Killackey HP, Belford G, Ryugo RG, Ryugo DK (1976) Anomalous organization of thalamocortical projections consequent to vibrissae removal in newborn rat and mouse. Brain Res 104:309-3 15.
Kossut M, Hand PJ, Greenberg J, Hand CL (1988) Single vibrissal cortical column in SI cortex of rat and its alterations in neonatal and adult vibrissa-deafferented animals: a quantitative 2DG study. J Neu- rophysiol 60:829-852.
Kossut M, Stewart MG, Siucinska E, Boume RC, Gabbot PLA (199 1) Loss of gamma-aminobutyric acid (GABA) immunoreactivity from mouse first somatosensory (SI) cortex following neonatal, but not adult, denervation. Brain Res 538: 165-170.
Land PW, Akhtar ND (1987) Chronic sensory deprivation affects cytochrome oxidase staining and glutamic acid decarboxylase im- munoreactivity in adult rat ventrobasal thalamus. Brain Res 425: 178-181.
Land PW, Simons DJ (1985) Metabolic activity in SmI cortical barrels of adult rats is dependent on patterned sensory stimulation of the mystacial vibrissae. Brain Res 34 1: 189-l 94.
Lee PH, Henderson TA, Weaver WR, Connors NA, Woolsey TA, Jac- quin MF (1992) Does activity-based competition play a role in barrel development in hamster? Sot Neurosci Abstr 18: 1098.
McCasland JS, Woolsey TA (1988) High resolution 2-deoxyglucose mapping of functional cortical columns in mouse barrel cortex. J Comp Neurol278:555-569.
McCasland JS, Bernard0 KL, Probst KL, Woolsey TA (1992) Cortical local circuit axons do not mature after early deafferentation. Proc Nat1 Acad Sci USA 89:1832-1836.
Merzenich MM, Kaas JH, Wall JT, Sur M, Nelson RJ, Felleman DJ (1983) Progression of change following median nerve section in the cortical representation of the hand in areas 3b and 1 in adult owl and squirrel monkeys, Neuroscience 10:639-665.
Merzenich MM, Recanzone G, Jenkins WM, Allard T, Nudo RJ (1988) Cortical representational plasticity. In: Neurobiology of neocortex (Rakic P, Singer W, eds), pp 41-67. New York Wiley.
Millar J, Basbaum AI, Wall PD (1976) Restructuring of the somato- topic map and appearance of abnormal neuronal activity in the gracile nucleus after partial deafferentation. Exp Neurol 50:658672.
Nicolelis MAL, Chapin JK, Lin CS (199 1) Thalamic plasticity induced by early whisker removal in rats. Brain Res 561:344-349.
Simons DJ, Land PW (1987) Early experience of tactile stimulation influences organisation of somatosensory cortex. Nature 326:694- 697.
Stent GS (1973) A physiological mechanism for Hebb’s postulate of learning. Proc Nat1 Acad Sci USA 70:997-l 00 1.
Van der Loos H, Woolsey TA (1973) Somatosensory cortex: structural alterations following early injury to sense organs. Science 179:395- 398.
Waite PME (1984) Rearrangement of neuronal responses in the tri- geminal system of the rat following peripheral nerve section. J Physiol (Lond) 3521425-445.
Wall JT (1988) Variable organization in cortical maps of the skin as an indication of the lifelong adaptive capacities of circuits in the mammalian brain. Trends Neurosci 11:549-557.
Wall JT, Cusick CG (1984) Cutaneous responsiveness in primary somatosensory (S-I) hindpaw cortex before and after partial hindpaw deafferentation in adult rats. J Neurosci 4: 1499-15 15.
Wall PD, Eggar MD (1971) Formation of new connections in adult rat brains after partial deafferentation. Nature 232:542-545.
Welker C (197 1) Microelectrode delineation of fine grain somatotopic organization of SmI cerebral neocortex in albino rat. Brain Res 26: 259-275.
Welker C, Woolsey TA (1974) Structure of layer IV in the somato- sensory neocortex of the rat: description and comparison with the mouse. J Comp Neurol 158:437453.
Welker E, Hoogland PV, Van der Loos H (1988) Organization of feedback and feedforward projections of the barrel cortex: a PHA-L study in the mouse. Exp Brain Res 73:41 l-435.
Welker E, Soriano E, Van der Loos H (1989) Plasticity in the barrel cortex of adult mouse: effects of peripheral deprivation on GAD- immunoreactivity. Exp Brain Res 74:412452.
Wong-Riley MTT, Welt C (1980) Histochemical changes in cvto- chrome dxidase of cortical barrels after vibrissal removaiin neonatal and adult mice. Proc Nat1 Acad Sci USA 77:2333-2337.
Woolsey TA, Van der Loos H (1970) The structural organization of layer IV in the somatosensory region (SI) of mouse cerebral cortex: the description of a cortical field composed of discrete cytoarchitec- tonic units. Brain Res 17:205-242.