an innovative thermal management solution for cooling of chips
TRANSCRIPT

ABSTRACT
Title of Document: An Innovative Thermal Management
Solution for Cooling of Chips with
Various Heights and Power Densities
Timothy Walter McMillin, Master of Science,
2007 Directed By: Professor Michael Ohadi, Ph.D.
Department of Mechanical Engineering
The challenges and benefits of using a liquid-cooled cold plate
to cool a multi-processor circuit board with complex geometry were
explored. Two cold plates were designed, fabricated, and tested
experimentally. Thermal interface resistance was experimentally
discovered and confirmed with numerical simulations.
A circuit board simulator was constructed. This simulator was
meant to mimic a multi-processor circuit board with heat sources of
different surface areas, heights, and heat dissipations. Results and
discussions are presented in this thesis.

THERMAL MANAGEMENT SOLUTIONS FOR LOW VOLUME COMPLEX
ELECTRONIC SYSTEMS
By
Timothy Walter McMillin
Thesis submitted to the Faculty of the Graduate School of the University of Maryland, College Park, in partial fulfillment
of the requirements for the degree of Master of Science
2007
Advisory Committee: Professor Michael Ohadi, Chair Associate Professor Tien-Mo Shih Assistant Professor Bao Yang

© Copyright by Timothy Walter McMillin
2007

ii
Dedication
To my family, thank you all for your support.

iii
Acknowledgements
First I would like to thank Dr. Michael Ohadi for giving me the
opportunity to work for my master’s degree at the University of
Maryland. I would like to thank Dr. Michael Ohadi, Dr. Serguei
Dessiatoun, and Dr. Amir Shooshtari for their help and guidance with the
research.
I would like to thank all the faculty, students and staff of the
Center for Environmental Energy Engineering for the help and support. I
would especially like to thank the members of the Smart and Small
Thermal Systems lab, the CEEE Experimental group and Howard
Grossenbacher for all their help technical or otherwise.
Finally I would like to thank my family and friends for their love
and support.

iv
Table of Contents Dedication.................................................................................................. ii
Acknowledgements................................................................................... iii
Table of Contents...................................................................................... iv
List of Figures.......................................................................................... vii
Chapter 1: Introduction.............................................................................. 1
Air-Cooled Systems .................................................................................................. 1 Current Applications of Air-Cooled Systems ....................................................... 1 Benefits of Air Cooling......................................................................................... 2 Limits of Air Cooling............................................................................................ 3
Liquid-Cooled Systems............................................................................................. 5 Current Applications of Liquid-Cooled Systems.................................................. 5 Overview of typical liquid-cooled cold plate designs........................................... 6 Benefits of Liquid Cooling ................................................................................... 9
Chapter 2: Project Description ................................................................ 11
Project Objectives ................................................................................................... 11 Anticipated Challenges ........................................................................................... 13
Standard Goal Challenges................................................................................... 13 Stretch Goal Challenges...................................................................................... 14
Chapter 3: Experimental Apparatuses and Procedure ............................. 15
Test Section Requirements ..................................................................................... 15 Test Section Description ......................................................................................... 17
Dimensions ......................................................................................................... 17 Methods................................................................................................................... 17
Fabrication .......................................................................................................... 17 Attachment.......................................................................................................... 18
Test Section Drawings and Pictures ....................................................................... 20 Experimental Procedure.......................................................................................... 21
Interface Preparation........................................................................................... 21 Chiller Preparation .............................................................................................. 22
Chapter 4: First-Generation Cold Plate ................................................... 24
Description.............................................................................................................. 24
v
Geometry............................................................................................................. 24 Channels.............................................................................................................. 25 Materials ............................................................................................................. 27
Manufacturing......................................................................................................... 27 Methods............................................................................................................... 27 Joining................................................................................................................. 33
Chapter 5: Second-Generation Cold Plate.............................................. 36
Modifications based on First Generation Cold Plate Results ................................. 36 The Channels ...................................................................................................... 38 Materials ............................................................................................................. 40
Manufacturing......................................................................................................... 40 Headers ............................................................................................................... 40 Channel Joining .................................................................................................. 45
Chapter 6: Thermal Interface Resistance ............................................... 49
Introduction to Thermal Interface Resistance......................................................... 49 Methods of Minimizing Thermal Interface Resistance .......................................... 51
Mechanical Deformation .................................................................................... 51 Deformable Materials ......................................................................................... 51
Thermal Interface Resistance Experiments ............................................................ 56 Experimental Setup............................................................................................. 59 Experimental Procedure...................................................................................... 61
Results..................................................................................................................... 62 Arctic Silver 5 ..................................................................................................... 62 Carbon Fiber pads ............................................................................................... 64
Thermal Interface Conclusions ............................................................................... 64 Chapter 7: Results and Discussions........................................................ 66
First-Generation Cold Plate Results........................................................................ 66 First-Generation Heat Transfer ........................................................................... 66 First-Generation Pressure Drop .......................................................................... 68
Second-Generation Cold Plate................................................................................ 69 Second-Generation Heat Transfer Results.......................................................... 70 Second-Generation Pressure Drop...................................................................... 71
Comparison of the Results ...................................................................................... 72 Differences in Heat Transfer............................................................................... 72 Comparison of Pressure Drops ........................................................................... 77
Chapter 8: Conclusions and Suggested Future Work............................. 78
Explanation of the differences in the performance ................................................. 78 Pressure drop performance ................................................................................. 78 Heat transfer performance................................................................................... 79
Proposed Future work............................................................................................. 82 Explore differences in Heat Transfer and Pressure Drop ................................... 82

vi
Bibliography ............................................................................................ 83
vii
List of Figures
Figure 1: Air-cooled heat sink (a) without fan and (b) with fan [1] ............................. 2 Figure 2: Heat Sink Geometry Used for Case Study .................................................... 3 Figure 3: A conduction cold plate................................................................................. 7 Figure 4: A convection cold plate................................................................................. 7 Figure 5: A tubed cold plate [5].................................................................................... 8 Figure 6: A flat tube cold plate with both Z and U type configurations [6] ................. 8 Figure 7: Geometry of previous-generation circuit board .......................................... 12 Figure 8: Circuit board geometry................................................................................ 15 Figure 9: Test section schematic................................................................................. 20 Figure 10: Test section used for data collection ......................................................... 21 Figure 11: Cold Plate External Details ....................................................................... 24 Figure 12: Extruded aluminum section of cold plate.................................................. 25 Figure 13: Cross-sectional view of the cold plate showing channel geometry.......... 25 Figure 14: The bend of the channel walls after compression .................................... 26 Figure 15: The first step in header fabrication: cutting an aluminum bar to size and squaring off the faces .................................................................................................. 29 Figure 16: The second step in header fabrication: fluid inlet and outlet holes ........... 30 Figure 17: The third step in header fabrication: cutting a slot to insert the extruded aluminum section into................................................................................................. 30 Figure 18: The fourth step in the header fabrication process: cutting slots for the fluid paths ............................................................................................................................ 31 Figure 19: Cross section of the extruded aluminum section showing channel geometry..................................................................................................................................... 32 Figure 20: Complete first-generation cold plate ........................................................ 34 Figure 21: First-generation cold plate side view......................................................... 35 Figure 22: Fluid flow path .......................................................................................... 36 Figure 23: Second-generation cold plate .................................................................... 37 Figure 24: Second-generation cold plate channel dimensions in millimeters ............ 39 Figure 25: Second-generation header ......................................................................... 43 Figure 26: Second-generation header with fluid inlet and outlet holes ...................... 43 Figure 27: Second-generation header with connecting slot. ....................................... 44 Figure 28: Second-generation header ......................................................................... 44 Figure 29: Second generation cold plate extruded aluminum channels ..................... 45 Figure 30: Two sections of extruded aluminum channels glued together for the second-generation cold plate....................................................................................... 46 Figure 31: Second-generation cold plate .................................................................... 47 Figure 32: Second-generation cold plate side view .................................................... 47 Figure 33: Second-generation cold plate channel offset to accommodate taller chip simulator ..................................................................................................................... 48 Figure 34: Interface between two solid materials ....................................................... 49 Figure 35: Thermal grease with particles larger than the surface roughness features increases thermal interface resistance......................................................................... 54
viii
Figure 36: Thermal grease with particles smaller than the surface roughness features decreases thermal interface resistance ........................................................................ 55 Figure 37: Arctic Silver 5 [10].................................................................................... 57 Figure 38: Carbon Fiber Thermal Interface Material [8]............................................ 58 Figure 39: Thermal interface resistance experimental setup ...................................... 59 Figure 40: Thermal interface resistance results for Arctic Silver 5 ........................... 63 Figure 41: First-generation cold plate thermal resistance........................................... 67 Figure 42: Test section schematic............................................................................... 68 Figure 43: First-generation cold plate pressure drop ................................................. 69 Figure 44: Second-generation cold plate .................................................................... 70 Figure 45: Second-generation cold plate thermal resistance ...................................... 70 Figure 46: Second-generation cold plate pressure drop.............................................. 72 Figure 47: Thermal resistance comparison for first and second generation cold plates (Chip 1) ....................................................................................................................... 75 Figure 48: Thermal resistance comparison for first and second generation cold plates (Chip 2) ....................................................................................................................... 75 Figure 49: Thermal resistance comparison for first and second generation cold plates (Chip 3) ....................................................................................................................... 76 Figure 50: Thermal resistance comparison for first and second generation cold plates (Chip 4) ....................................................................................................................... 76

1
Chapter 1: Introduction
Broadly speaking, electronic cooling systems can be
classified into Air-cooled and Liquid cooled systems. In the
following a brief description and advantages/disadvantages of each
category are provided.
Air-Cooled Systems
Current Applications of Air-Cooled Systems
Air cooling is still the most common method of heat
dissipation for thermal management of electronics. In an air
cooling set-up, a heat sink is the only heat exchanger and transfers
heat directly from the heat source to the surrounding air. Heat
sinks are the most commonly employed, cost effective electronics
thermal management hardware in air cooling. Heat sinks come in
several shapes and varieties. The main parameters of interest in
heat sink design are convection type (forced or natural), heat sink
geometry, and heat sink material. These three parameters serve to
determine the maximum rate of heat rejection achieved by the heat
sink.
2
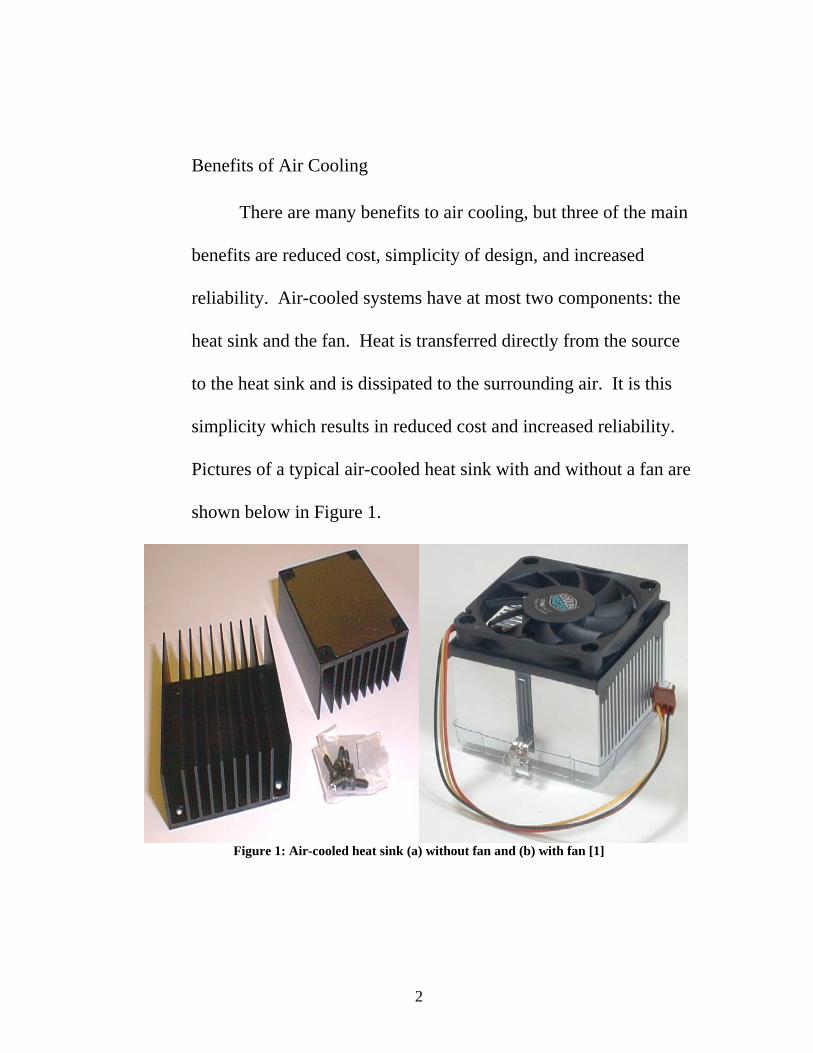
Benefits of Air Cooling
There are many benefits to air cooling, but three of the main
benefits are reduced cost, simplicity of design, and increased
reliability. Air-cooled systems have at most two components: the
heat sink and the fan. Heat is transferred directly from the source
to the heat sink and is dissipated to the surrounding air. It is this
simplicity which results in reduced cost and increased reliability.
Pictures of a typical air-cooled heat sink with and without a fan are
shown below in Figure 1.
Figure 1: Air-cooled heat sink (a) without fan and (b) with fan [1]

3
Limits of Air Cooling
As microprocessors increase in speed, their heat dissipation
also increases. An Intel Pentium 4 2.40 GHz processor dissipates
58 Watts of heat. Using this power dissipation, a simple case study
is performed below to estimate the heat sink temperature necessary
to dissipate 58 Watts of heat to air at standard temperature and
pressure [2]. The geometry is shown first, followed by the
assumptions used in the calculations. Finally the results will be
presented. The heat sink geometry is shown below in Figure 2.
Figure 2: Heat Sink Geometry Used for Case Study
The dimensions are similar to the dimensions of a typical Pentium
4 air-cooled heat sink. For simplicity a uniform heat flux condition
is imposed over the entire surface of the heat sink. This neglects
4
the temperature variation in space due to conduction thermal
resistance. The flow in each unit cell is modeled as flow over three
flat plates—two vertical and one horizontal—and the flow is
assumed to move parallel to the fins and base plate. A correlation
for calculating the Nusselt number for flow over a flat plate of
length x, Nux, was obtained from Incropera’s Heat and Mass
Transfer, 6th Edition [3]:
Equation 1: 3/12/1 PrRe453.0 xxNu =
The Nusselt Number, Nux, is defined below in Equation 2:
Equation 2: khxNux =
A typical computer fan is capable of providing a flow rate of
89.39 CFM at a velocity of 0.042m/s, a power consumption of 6W,
and a noise level of 32dB [4]. Air properties were evaluated at
room temperature, 25oC. The Reynolds (Re) number for this case
is 12117 and Nux was calculated to be 44, leading to a heat transfer

5
coefficientKm
Whx 219= . Assuming a heat dissipation of 58W and
an ambient air temperature CT o25=∞ , the heat sink surface
temperature would have to be 44oC to dissipate the required heat.
Using air cooling, as the heat dissipation increases either the
temperature or the fan speed must also increase. Increasing the
temperature is undesirable, however, because it will reduce the
reliability of the microprocessor and lead to earlier chip failure.
Increasing the fan speed is also undesirable because the reliability
of the fan will decrease and the noise will quickly reach
unacceptable levels, especially for the home consumer. While a
44oC chip surface temperature is feasible, a 32dB noise level is
unacceptable for some markets and air cooled systems are reaching
the heat dissipation limit as a thermal management solution for
electronics cooling.
Liquid-Cooled Systems
Current Applications of Liquid-Cooled Systems
Liquid cooling has entered the market as a viable thermal
management option. In a liquid-cooled system a secondary fluid
acts as a heat spreader to more efficiently remove heat from the
6
source before it is dissipated to the air. Heat generated by
electronic components is transferred first to the secondary fluid
and then to the air via a heat exchanger. In all cooling methods the
final heat rejection will be to the surrounding air. Liquid cooling
use began with high power microprocessors and power electronics.
As home computers become more powerful, liquid cooling has
begun to penetrate that market as well. Liquid cooling provides a
quiet, efficient, low-energy method of heat dissipation.
Overview of typical liquid-cooled cold plate designs
The most basic definition of a cold plate is a thermally
conductive metal shell with liquid flowing inside it. One side of
the conductive metal shell is placed in contact with the heat source.
Heat is conducted through the metal shell and removed through
convection by the fluid flowing on the other side of the shell.
Variation in cold plate designs occurs mainly in the shape of the
conducting shell and the fluid path.
The most basic cold plate is a conduction cold plate. In a
conduction cold plate, the entire cold plate is a solid piece of metal.
Heat is conducted to the edge of the cold plate, where it is removed
by convection. In a conduction cold plate no fluid flows through

7
the cold plate. Figure 3 and Figure 4 below are examples of a
conduction cold plate and a convection cold plate.
Figure 3: A conduction cold plate
Figure 4: A convection cold plate
The second type of cold plate design consists of a tube
which winds back and forth through a metal block. Fluid is
pumped through the tube, and heat is removed from the block
which conducts heat away from the source. This type of cold plate
is referred to as a tubed cold plate. A picture of a tubed cold plate
is shown below in Figure 5.

8
Figure 5: A tubed cold plate [5]
Another type of cold plate is called a flat tube cold plate.
The tubes from the tubed cold plate are removed, and smaller
channels are cut directly into the metal block or shell, which is in
contact with the heat source. Flat tube cold plates offer lower
thermal resistance in a more compact design. A picture of a flat
tube cold plate is shown below in Figure 6.
Figure 6: A flat tube cold plate with both Z and U type configurations [6]

9
Benefits of Liquid Cooling
The main benefit of liquid cooling is the ability to dissipate
higher heat fluxes at lower temperature differences. Returning to
the case study done for air cooling, but changing the fluid to water
while keeping the geometry and free stream velocity the same,
results in Km
Whx 284= , or a nearly five-fold increase in heat
transfer. Slowing the water velocity to 0.02 m/s would result in a
convection coefficient of Km
Whx 219= . The result is the same heat
dissipation, less power input, and quieter operation.
This thesis covers the challenges and benefits of adapting
the liquid cooling method to create a cold plate for use in multi-
heat source cooling. Challenges include accommodating complex
geometries, minimizing costs, and minimizing thermal interface
resistance.
Chapter 2 of this thesis will introduce and describe the
project including circuit board geometry, and project goals for heat
dissipation, pressure drop, and cold plate thickness.
Chapter 3 will discuss the experimental apparatus and data
collection system and how it was manufactured.

10
Chapter 4 is a description of the first generation cold plate
and the method used in its manufacture.
Chapter 5 is a description of the second generation cold
plate and the method used in its manufacture.
Chapter 6 is a discussion of the origins of thermal interface
resistance and the methods and experiments used to minimize the
thermal interface resistance in this project.
The results and a discussion of the results will be presented
in Chapter 7.
Chapter 8 will summarize the conclusions and suggest future
work in this field.
11
Chapter 2: Project Description
Project Objectives
The objective of this project is to design and fabricate a
highly effective, liquid-cooled cold plate for high heat flux
cooling. This project is unique in that the main objective was to
accommodate chips of different heights and power densities.
Much work has been done on cooling one hot spot with one heat
sink but there has not been as much investigation into cooling
multiple hot spots with a single heat sink. A circuit board with a
specific geometry and chip arrangement will be cooled using the
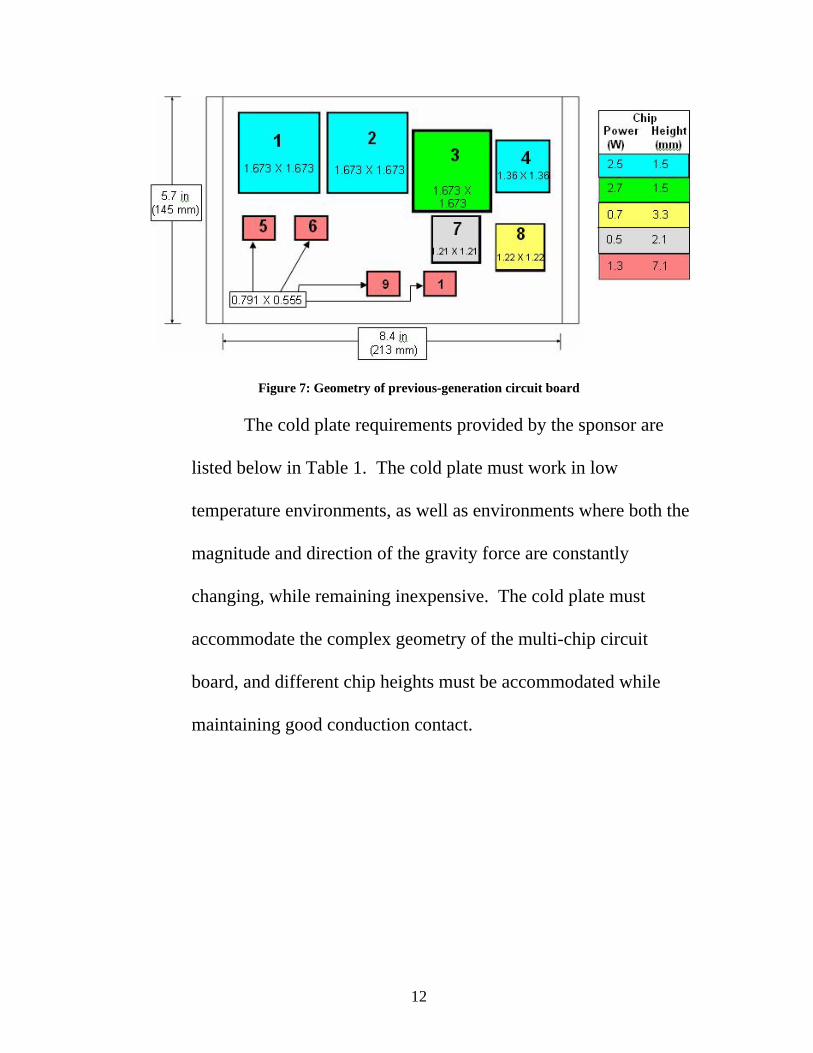
liquid-cooled cold plate. Figure 7 below shows the geometry and
heat dissipation of the first-generation circuit board. The cold
plate is being designed to cool the second-generation circuit board.
The geometry will remain the same but the heat dissipation will
increase with the second-generation circuit board.
12
Figure 7: Geometry of previous-generation circuit board
The cold plate requirements provided by the sponsor are
listed below in Table 1. The cold plate must work in low
temperature environments, as well as environments where both the
magnitude and direction of the gravity force are constantly
changing, while remaining inexpensive. The cold plate must
accommodate the complex geometry of the multi-chip circuit
board, and different chip heights must be accommodated while
maintaining good conduction contact.
13
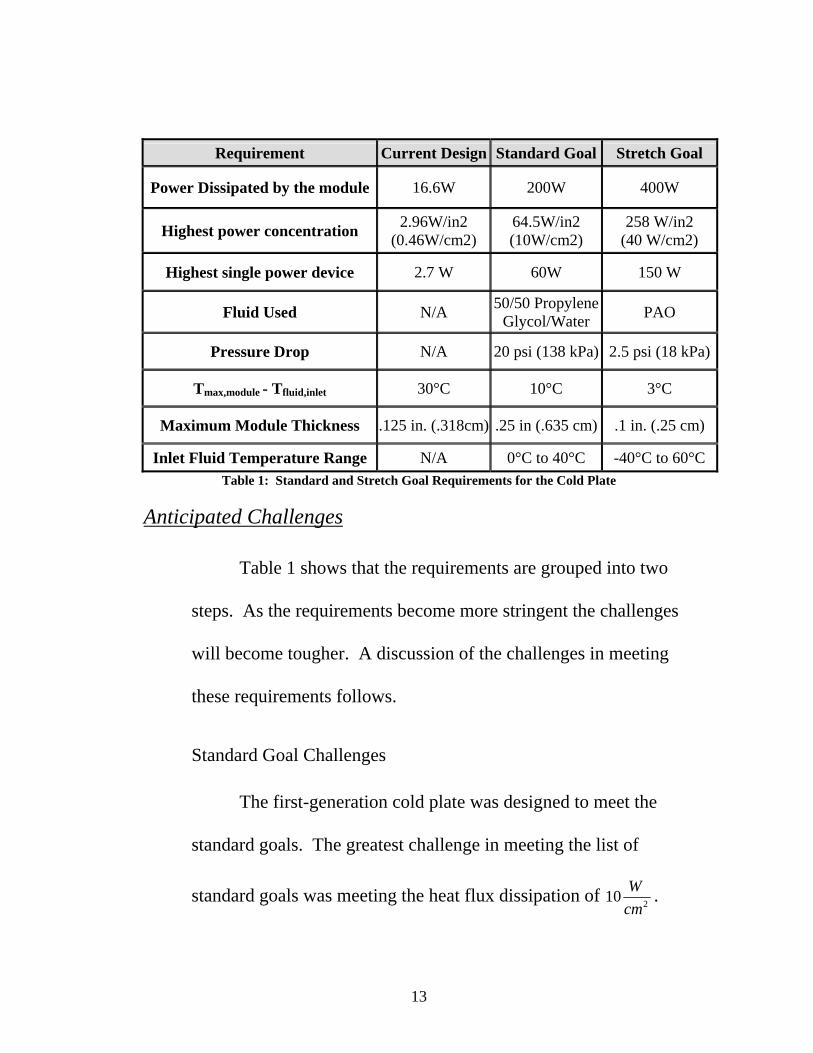
Requirement Current Design Standard Goal Stretch Goal
Power Dissipated by the module 16.6W 200W 400W
Highest power concentration 2.96W/in2 (0.46W/cm2)
64.5W/in2 (10W/cm2)
258 W/in2 (40 W/cm2)
Highest single power device 2.7 W 60W 150 W
Fluid Used N/A 50/50 Propylene Glycol/Water PAO
Pressure Drop N/A 20 psi (138 kPa) 2.5 psi (18 kPa)
Tmax,module - Tfluid,inlet 30°C 10°C 3°C
Maximum Module Thickness .125 in. (.318cm) .25 in (.635 cm) .1 in. (.25 cm)
Inlet Fluid Temperature Range N/A 0°C to 40°C -40°C to 60°C Table 1: Standard and Stretch Goal Requirements for the Cold Plate
Anticipated Challenges
Table 1 shows that the requirements are grouped into two
steps. As the requirements become more stringent the challenges
will become tougher. A discussion of the challenges in meeting
these requirements follows.
Standard Goal Challenges
The first-generation cold plate was designed to meet the
standard goals. The greatest challenge in meeting the list of
standard goals was meeting the heat flux dissipation of 210cmW .

14
The maximum module thickness required attention in design but
posed no real challenge, and neither did the 20 psi pressure drop.
The first-generation cold plate met or exceeded all standard goal
requirements.
Stretch Goal Challenges
The biggest challenge in meeting the stretch goals was the
heat flux requirement, 240cmW coupled with the temperature
difference, Co3 . The thermal resistance of most interface materials
exceeds the total allowable thermal resistance, 2075.0cmWCo
, of the
stretch goal. The second-generation cold plate was designed to
meet all the stretch goal requirements, but it did not.

15
Chapter 3: Experimental Apparatuses and Procedure
Test Section Requirements
A test section was designed and constructed to evaluate the
capabilities of the cold plate. The test section was designed to
emulate the geometry and thermal characteristics of the circuit
board provided by the sponsor. The circuit board geometry is
shown again in Figure 8. From Figure 8 it can be seen that chips
1-4 have the highest heat flux. Attention in this project focused on
finding a thermal solution capable of cooling those chips.
Anything with a smaller heat flux should be cooled just as
effectively by the same cold plate.
Figure 8: Circuit board geometry
16
The test section was designed to simulate real world conditions as
closely as possible. The test section is made of 4 heat sources of
the same size and shape as chips 1-4 attached to a fiberglass board.
A fiberglass board was used because it has mechanical and thermal
characteristics similar to that of the circuit board provided by the
sponsors. Similar thermal characteristics are important because
heat spreading by conduction will occur. Some of the heat will be
dissipated on the back side of the circuit board. It is important that
this spreading and conduction be present in the experiment as well.
Mechanical characteristics are important because the cold plate is
mounted to the fiberglass board, not the chips themselves. The
thermal interface resistance between the chips and the cold plate is
heavily dependent on the force pushing the two together. As more
pressure is applied the board will flex and bend. This flexing and
bending will also affect the thermal interface resistance and it is
important that this effect be included in the experiment.

17
Test Section Description
Dimensions
The test section consists of a rectangular G10 fiber glass
composite board 88mm wide, 225mm long, and 2.50mm thick.
G10 is a fiberglass which is often used in low temperature
applications. Four copper squares were made. Three of the
squares are 42.5mm on a side and 2mm thick. The fourth square is
34.5mm on a side and 3.5mm thick. These copper squares are the
same size and shape as chips 1-4 in Figure 8. Each copper square
has a heater attached to the back of it for heat generation.
Methods
The following section will discuss the methods of
fabrication and instrumentation for the test section.
Fabrication
The test section is made up of five main parts all of which
were hand made. The four copper squares were cut from oxygen
18
free copper plates. An end mill was used to make sure all 4 sides
were flat, smooth, and parallel. The two large flat surfaces were
ground down on a milling machine as well.
After each square was cut, a 0.75mm slitting saw was used
to make 0.75mm wide and 0.75mm deep slits in the sides which
would be in contact with the cold plate. The constantine wire from
a T type thermocouple was then soldered into each slit. The
thermocouples were used to measure the temperature of the surface
of the copper chip simulators that were in contact with the cold
plate. This is analogous to measuring the temperature at the
outside of the package of a semiconductor. The slits were cut as
small as possible so as not to impede the heat transfer from the
chip to the cold plate as well as to make sure that the
thermocouples were measuring the temperature as closely as
possible to the chip simulator surface.
Attachment
Once the chip simulators were machined the thermocouples
were attached. A 0.5mm hole was drilled in each slit where the
thermocouple tip was placed. The tip of each thermocouple was
19
placed into the hole and the wire was held in place with Kapton
tape. The chip simulators were then placed on a hot plate and
heated to 240oC. A lead based solder with a melting temperature
of 220oC was used to attach the thermocouples. An acid based
soldering flux was placed in the slit and the melted solder then
flowed into the slit filling in the space around the wire and bonding
it to the chip simulator. The chip simulators were made out of
copper and the junction of a T-type thermocouple is a copper-
constantine junction. The copper-constantine junction was created
between the constantine wire and the copper chip simulator in the
slit.
Omegatherm thin film heaters were then attached to the back
of the copper chip simulator. The heaters came with adhesive
already applied by Omegatherm. After the heaters were attached
they were bonded to the G10 fiberglass composite board using
RTV silicone glue. A silicone based glue was used to minimize
the heat transfer from the back (the side not in contact with the
cold plate) in order to reduce the uncertainty in the energy balance.
20
Test Section Drawings and Pictures
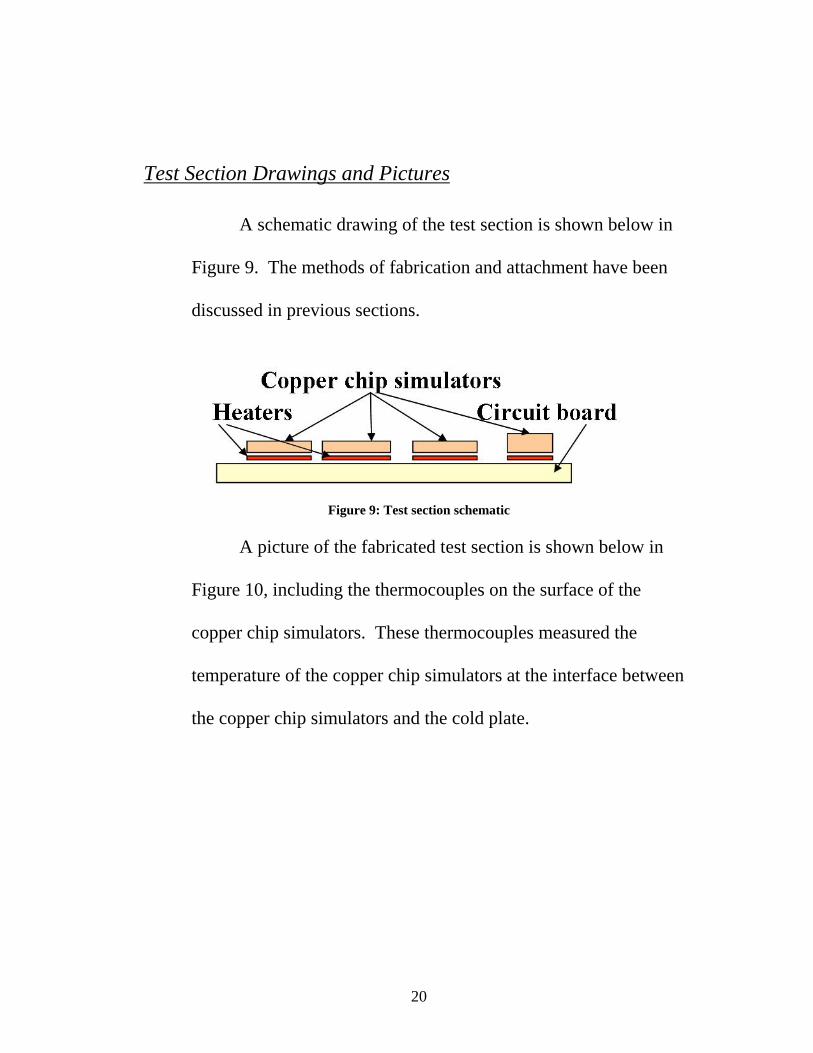
A schematic drawing of the test section is shown below in
Figure 9. The methods of fabrication and attachment have been
discussed in previous sections.
Figure 9: Test section schematic
A picture of the fabricated test section is shown below in
Figure 10, including the thermocouples on the surface of the
copper chip simulators. These thermocouples measured the
temperature of the copper chip simulators at the interface between
the copper chip simulators and the cold plate.

21
Figure 10: Test section used for data collection
Experimental Procedure
The experimental procedure for the two cold plates is
discussed in this section. The procedures do not vary much
because most of the data, except for the pressure drop, was taken
from the test section. The same test section was used for each
experiment.
Interface Preparation
As discussed in the previous chapter, interface resistance can
have a huge effect on cold plate performance. As a result
consistent preparation of the two thermal interfaces is essential to
obtaining reliable and repeatable data. Before the test section and
cold plate were joined each surface was cleaned with isopropyl
alcohol and wiped clean with a paper towel.

22
Arctic Silver 5 thermal grease was then applied to the test
section copper chip simulators. A razor blade was use to ensure
the layer of thermal grease was smooth and uniform on each chip.
The layer of thermal grease was approximately 1mm thick.
The test section and cold plate were then placed in contact, and the
screws were tightened to hold the two together. The screws in the
middle of the cold plate were tightened first, and the screws at the
corners were tightened last to help squeeze out any excess thermal
grease from the interface.
Chiller Preparation
The chiller was then turned on, and water was circulated
through the cold plate at 5oC for fifteen minutes. Once the chiller
water reached steady state and flow rate, power was applied to the
heaters. Once the setup reached steady state, the pressure drop
across the cold plate and the temperatures of each thermocouple
were recorded both by computer and by hand. The three
temperatures recorded for each chip were then averaged to get an
average chip temperature. Each steady state reading produced one
data point for each copper chip simulator.

23
24
Chapter 4: First-Generation Cold Plate
Description
Geometry
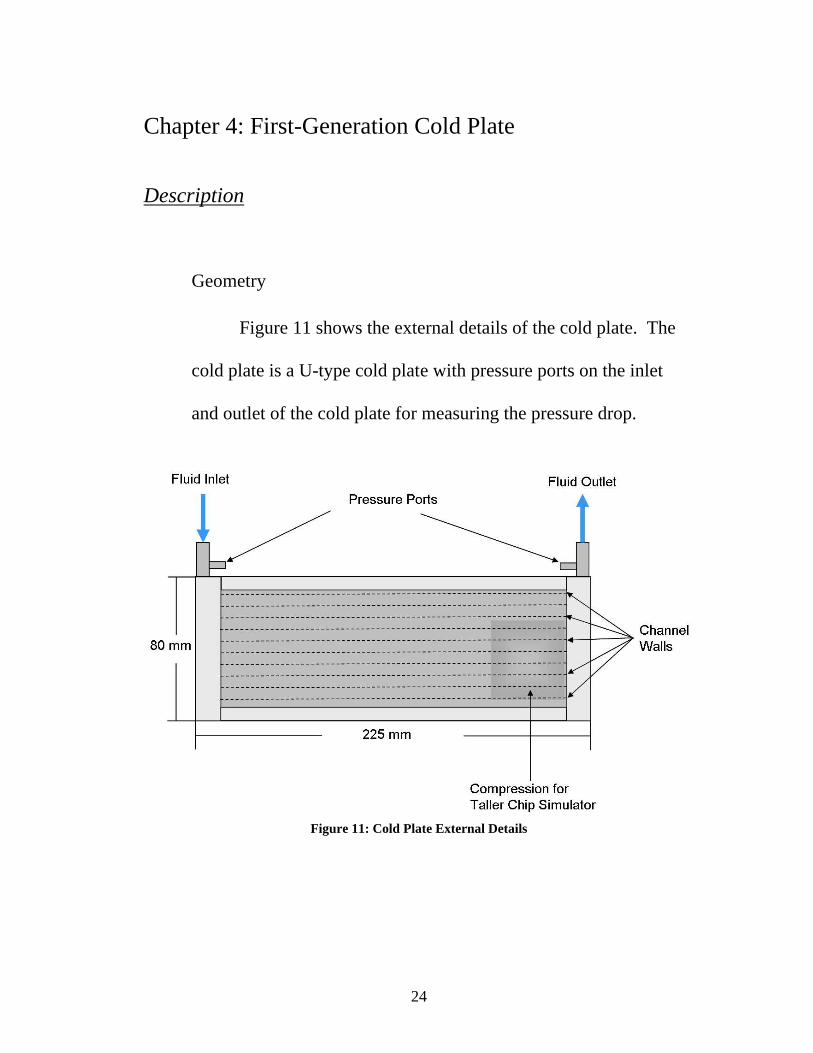
Figure 11 shows the external details of the cold plate. The
cold plate is a U-type cold plate with pressure ports on the inlet
and outlet of the cold plate for measuring the pressure drop.
Figure 11: Cold Plate External Details
25
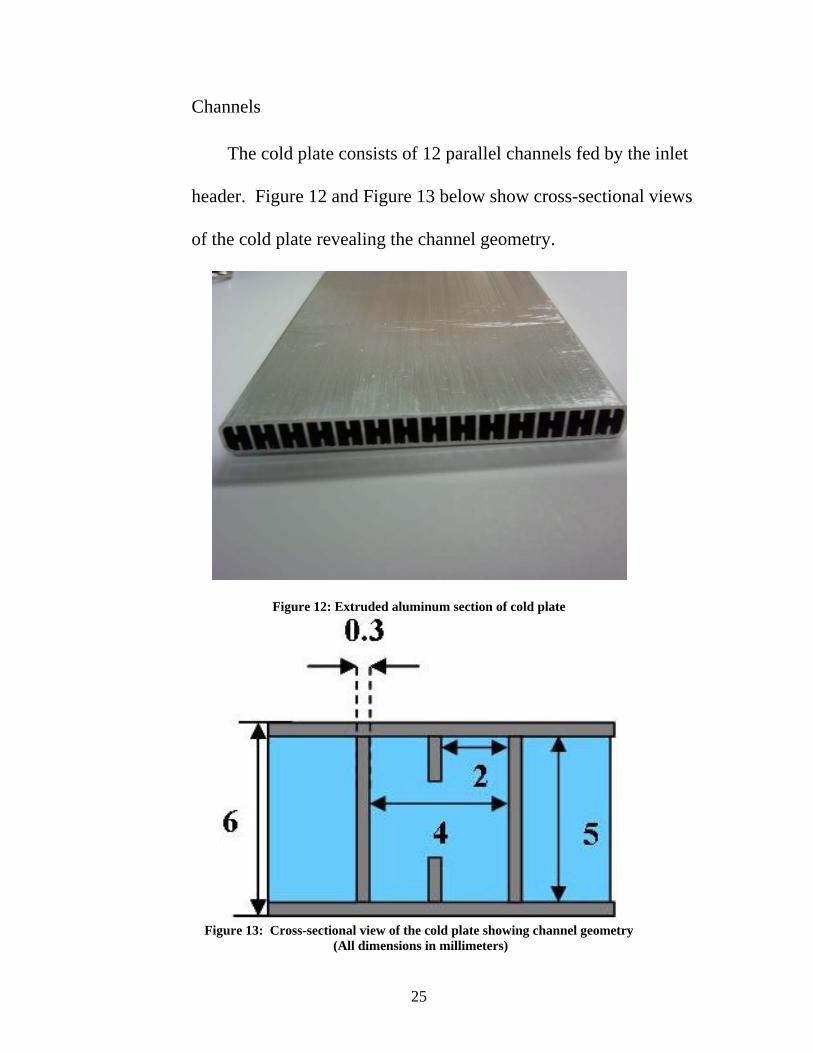
Channels
The cold plate consists of 12 parallel channels fed by the inlet
header. Figure 12 and Figure 13 below show cross-sectional views
of the cold plate revealing the channel geometry.
Figure 12: Extruded aluminum section of cold plate
Figure 13: Cross-sectional view of the cold plate showing channel geometry
(All dimensions in millimeters)
26
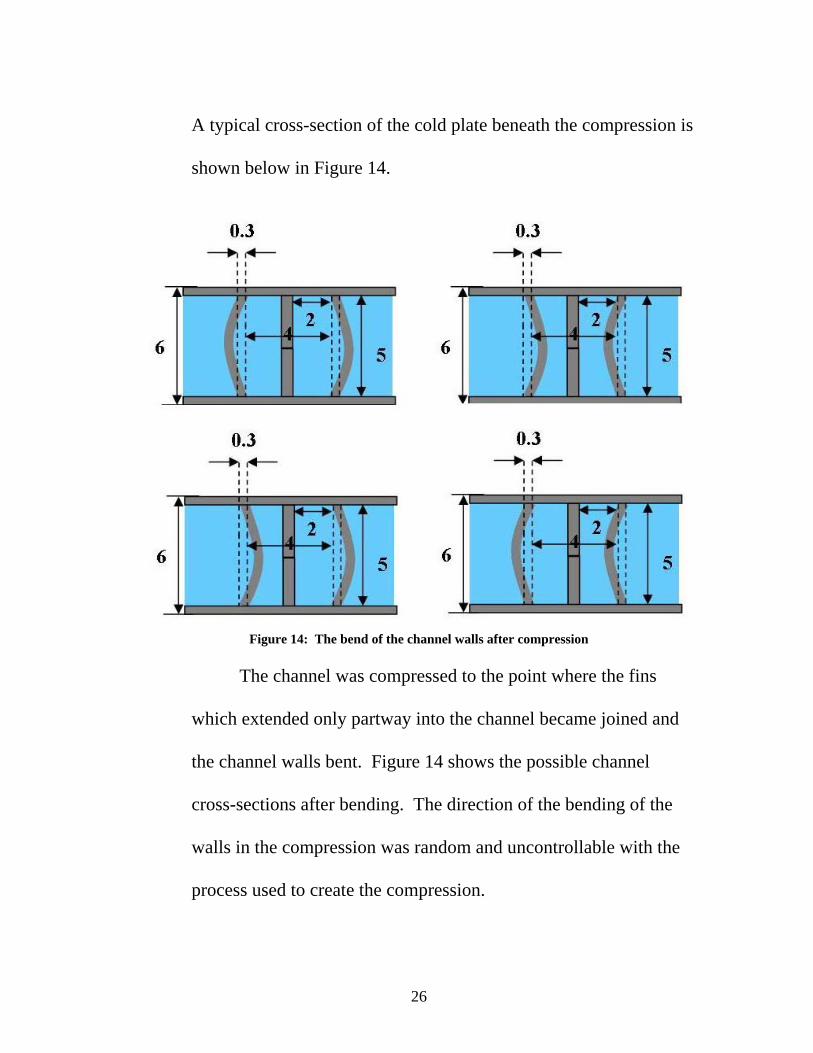
A typical cross-section of the cold plate beneath the compression is
shown below in Figure 14.
Figure 14: The bend of the channel walls after compression
The channel was compressed to the point where the fins
which extended only partway into the channel became joined and
the channel walls bent. Figure 14 shows the possible channel
cross-sections after bending. The direction of the bending of the
walls in the compression was random and uncontrollable with the
process used to create the compression.
27
Materials
The channels of the cold plate were made from extruded
aluminum. The headers and frame were machined from solid
aluminum blocks. The inlet, outlet tubes, and the pressure port
outlet tubes are stainless steel. Aluminum was chosen because of
its high thermal conductivity, machinability, and low cost.
Manufacturing
Methods
The headers for the cold plate were cut from solid aluminum
bars. First, rectangular header bars 80mm long, 15mm wide, and
10mm thick were cut using a band saw. All six sides were then
made flat, parallel, and perpendicular to each other by placing the
cut bars in a vise and running an end mill over each side. Each
rectangular bar was cut oversize on the band saw by 1mm to leave
enough extra material for the end mill operation.

28
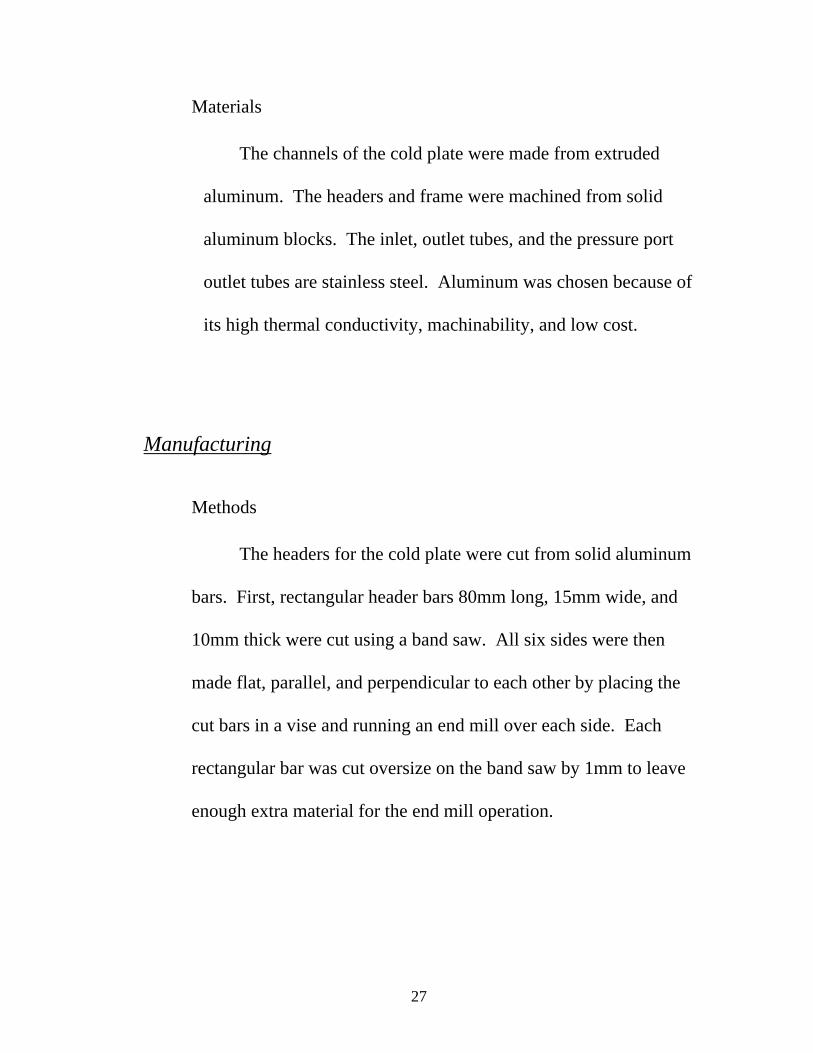
Once all the faces of the header were square and flat, a
7.50mm-diameter hole 7.5cm long was drilled into the rectangular
pieces. These holes served as the fluid inlet and outlet paths of the
headers. A picture of the header is shown below in Figure 16.
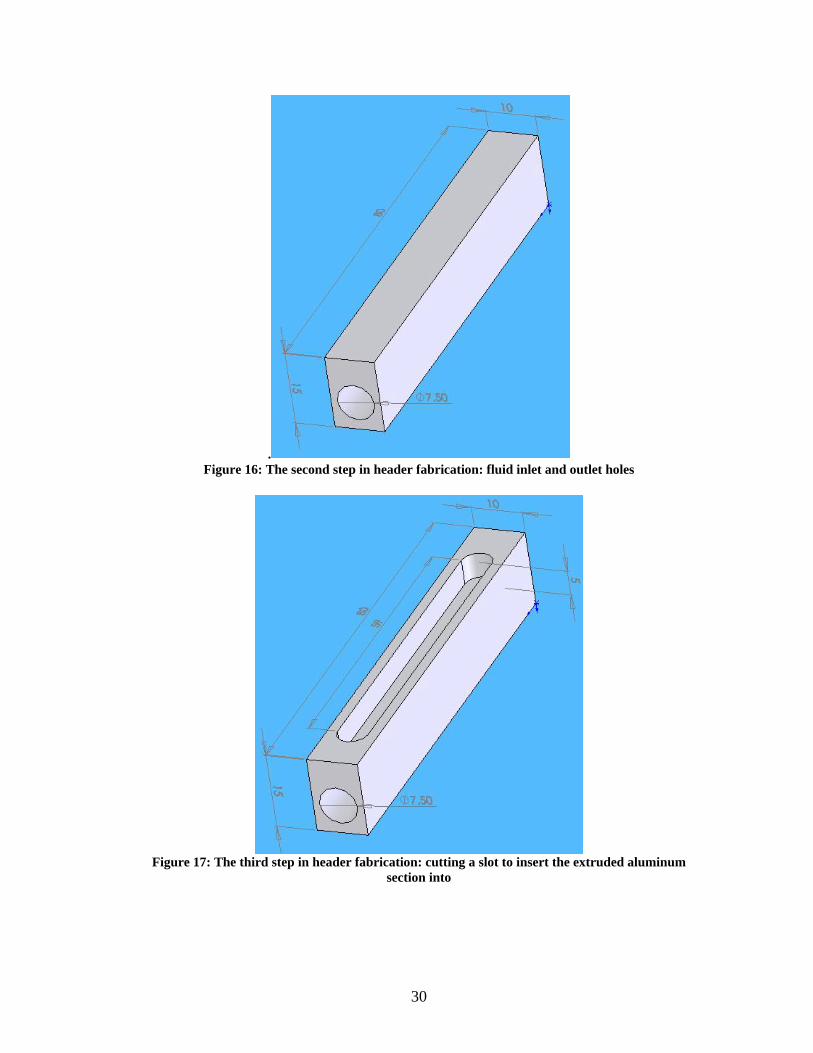
Finally, an end mill was used to cut slots in the face of the header
to distribute the fluid and allow it to enter the channels of the
extruded aluminum section. Two types of slots were cut into the
header. First, a larger slot was cut so that the extruded aluminum
section could be inserted into the headers. This slot was designed
to support and join the headers to the extruded aluminum section.
This slot was shallow and was not deep enough to connect with the
hole drilled in the header in the previous step. The internal
dimensions of this slot were cut slightly smaller than the external
dimensions of the aluminum extrusion that was joined with the
header in this slot. The idea was to create a press fit to help seal
the cold plate. The third step in the header fabrication process is
shown below in Figure 17. Within the large shallow slot, smaller
deeper slots were cut which connect with the hole drilled in the
previous step. The purpose of these smaller, deeper slots was to
create a path for the fluid to flow from the inlet holes of the header,

29
through the header, and into the aluminum extrusion. The inlet
header and outlet header were cut identically to simplify the
manufacturing process. Figure 15 through 18 illustrate the steps in
the header manufacturing process.
Figure 15: The first step in header fabrication: cutting an aluminum bar to size and squaring off the faces
30
. Figure 16: The second step in header fabrication: fluid inlet and outlet holes
Figure 17: The third step in header fabrication: cutting a slot to insert the extruded aluminum
section into

31
Figure 18: The fourth step in the header fabrication process: cutting slots for the fluid paths
32
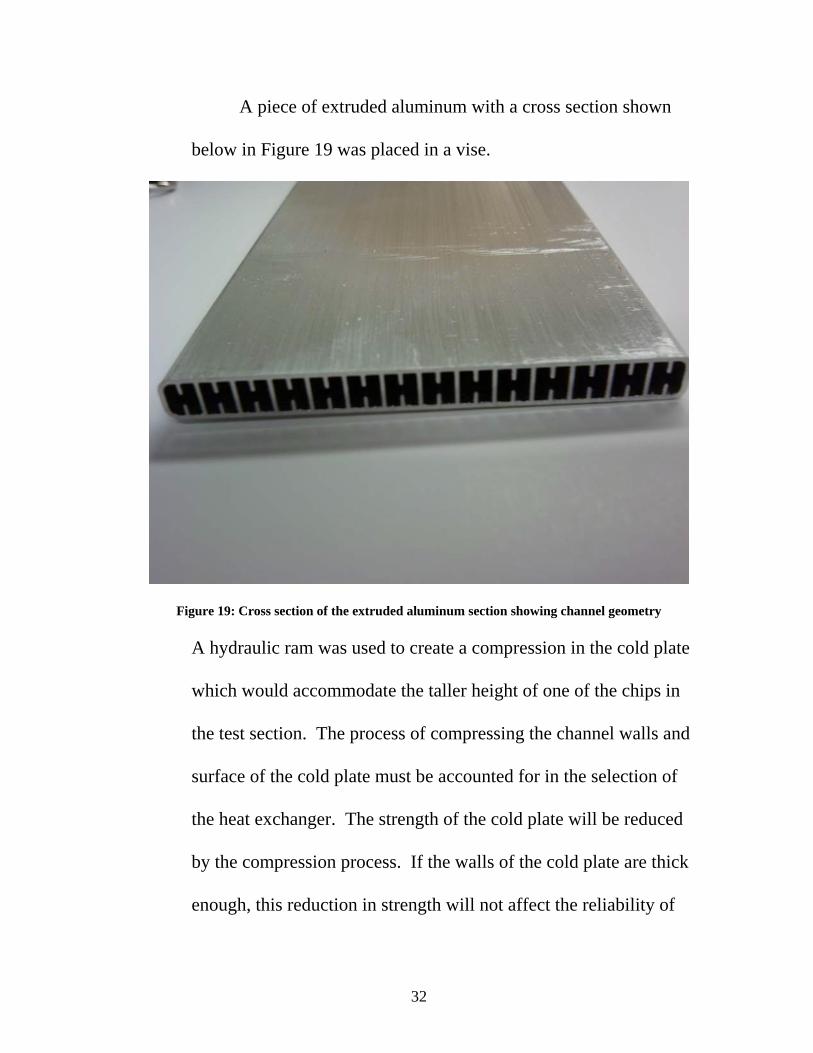
A piece of extruded aluminum with a cross section shown
below in Figure 19 was placed in a vise.
Figure 19: Cross section of the extruded aluminum section showing channel geometry
A hydraulic ram was used to create a compression in the cold plate
which would accommodate the taller height of one of the chips in
the test section. The process of compressing the channel walls and
surface of the cold plate must be accounted for in the selection of
the heat exchanger. The strength of the cold plate will be reduced
by the compression process. If the walls of the cold plate are thick
enough, this reduction in strength will not affect the reliability of

33
the cold plate. The cold plate must be chosen with thick enough
walls if this compression method is to be used. The cost will be a
slight increase in the conduction resistance through the cold plate
but the benefit is that the strength and reliability of the cold plate
will be negligibly affected.
After the compression was made, the extruded aluminum
section which formed the body of the cold plate was cut on a band
saw. The ends of the extrusion were also squared off using an end
mill. The final cut was very slow and shallow to remove any
damage caused by the band saw to the ends of the extrusion.
Joining
Once the aluminum extrusion and the headers were cut, the
aluminum extrusion was inserted into the slots in the header. A
two-part epoxy was used to attach the aluminum extrusion to the
headers and seal the cold plate. First, the headers and the
aluminum extrusion were cleaned using isopropyl alcohol to
remove any dirt or grease, which would prevent the epoxy from
bonding to the aluminum. Then the two part epoxy was mixed and
applied around the seams where the aluminum extrusion and the
headers were joined.
34
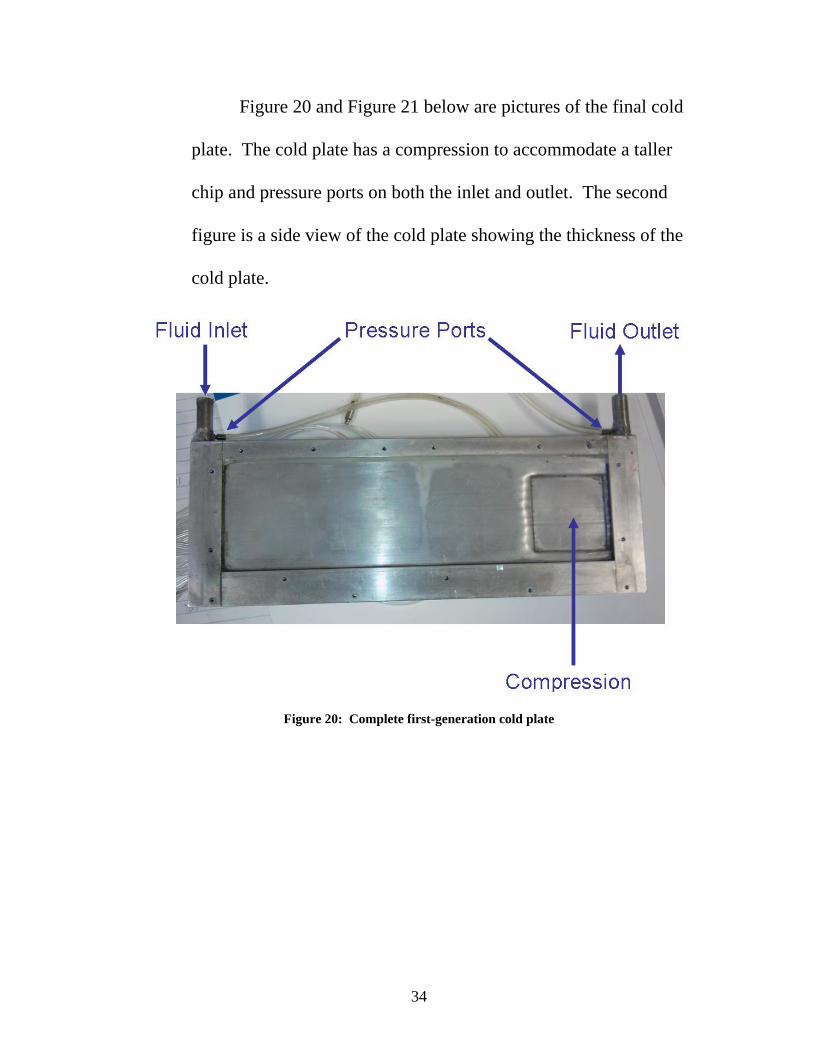
Figure 20 and Figure 21 below are pictures of the final cold
plate. The cold plate has a compression to accommodate a taller
chip and pressure ports on both the inlet and outlet. The second
figure is a side view of the cold plate showing the thickness of the
cold plate.
Figure 20: Complete first-generation cold plate

35
Figure 21: First-generation cold plate side view
36
Chapter 5: Second-Generation Cold Plate
Modifications based on First Generation Cold Plate Results
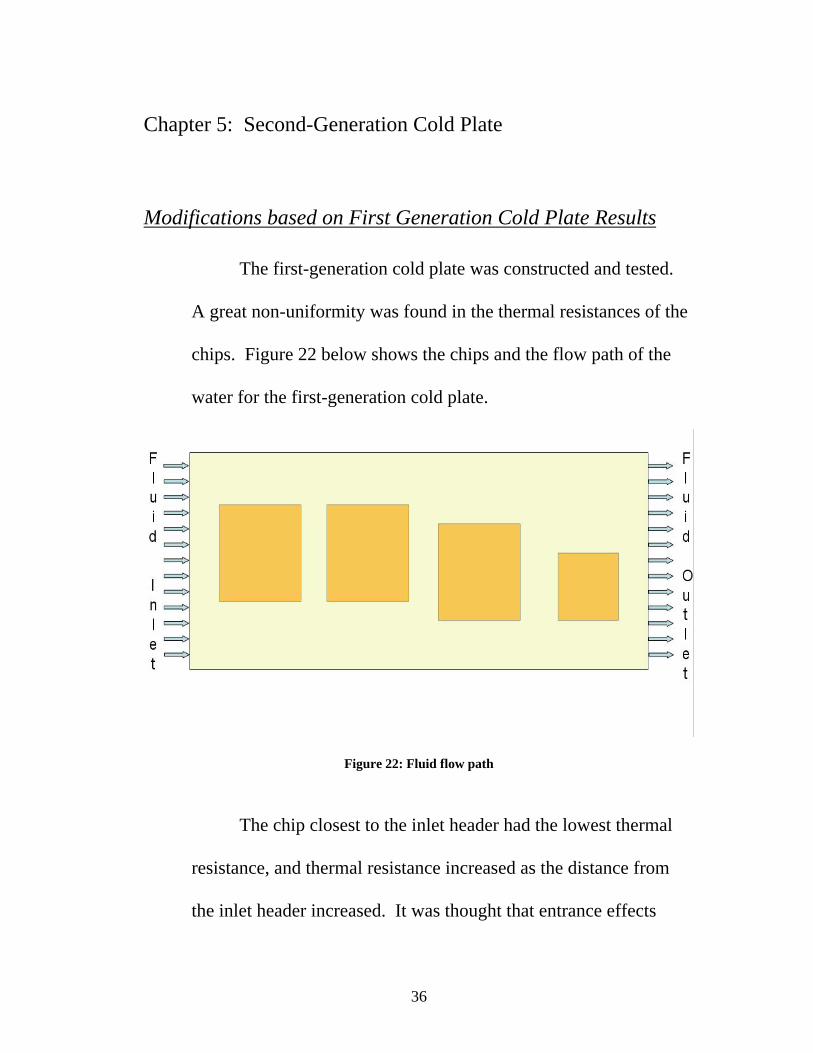
The first-generation cold plate was constructed and tested.
A great non-uniformity was found in the thermal resistances of the
chips. Figure 22 below shows the chips and the flow path of the
water for the first-generation cold plate.
Figure 22: Fluid flow path
The chip closest to the inlet header had the lowest thermal
resistance, and thermal resistance increased as the distance from
the inlet header increased. It was thought that entrance effects

37
were affecting the convective heat transfer. The second-generation
cold plate was designed with long headers and short channels, both
to take advantage of the entrance effect while also decreasing the
pressure drop. The channels of the second generation cold plate
had to be smaller in order to satisfy the thermal resistance stretch
goal. Since the pressure drop through a closed channel increases as
the hydraulic diameter decreases, the pressure drop through the
second generation cold plate channels was expected to increase.
The modified design reduced the flow length through the channels,
and thus lowered the pressure drop. Figure 23 below is an
illustration of the second-generation cold plate.
Figure 23: Second-generation cold plate
38
The Channels
The channels used in the second-generation had a smaller
hydraulic diameter than the channels of the first-generation cold
plate. Smaller channels were chosen for several reasons. The first
reason is that the Nusselt number based on the channel hydraulic
diameter,
Equation 3: k
hdNu hd =
converges to a constant value, 4.36, in fully developed, laminar,
closed channel flows exposed to a constant heat flux. This means
that channels with a smaller hydraulic diameter have larger
convection coefficients. The equation for convection thermal
resistance is:
Equation 4: h
R cth1" , =
It can be seen from Equation 4 that larger convection coefficients
lead to lower convection thermal resistances. Figure 24 is a picture
showing the dimensions of the channels used in the second-
generation cold plate.

39
Figure 24: Second-generation cold plate channel dimensions in millimeters
The second reason the channels were smaller in the second-
generation cold plate was to meet the stretch goal for maximum
allowed cold plate thickness. The first-generation cold plate met
the standard goal for cold plate thickness but did not satisfy the
stretch goal. As the channel dimension shrinks the pressure drop
in the channels increases. The channel flow length also had to be
shortened to help meet the stretch goal for pressure drop.
Since the channels were smaller than the previous cold plate, a new
technique was used to accommodate the taller chip height.
Compressing the channels would not have been possible because
the channels were not thick enough to accommodate the required
depth of the compression. Instead, a common header and fluid

40
inlet and outlet paths were used, but to accommodate the taller chip
height the connecting slot and the slots for fluid distribution were
offset within the header. This eliminated the need to compress the
channels while still accommodating the taller chip height and
remaining easy to design and manufacture.
Materials
Like the first-generation cold plate, the second-generation
cold plate uses aluminum headers and aluminum extruded channels
as well. Again aluminum was chosen because of its low cost, good
machinability, and high thermal conductivity.
Manufacturing
Headers
The goal of the second-generation cold plate was to create a
cold plate with long headers and short channels. Creating long
headers presented several difficulties in the manufacturing process.
Two of the biggest difficulties in manufacturing came from the fact

41
that holes with extremely high aspect ratios had to be cut in the
header.
For a hole of length L and diameter D, the aspect ratio of the hole
is defined as
Equation 5: DL
Holes with high aspect ratios are hard to drill or cut because the
cutting occurs at the very end of the tool. This means the cutting
force is applied to the end of the tool and the magnitude of the
force is proportional to the diameter, D, of the hole. A high aspect
ratio hole dictates that a large force be applied to the end of a long,
narrow lever. The result of this is that cutting must be done slowly
and carefully, or cutting tools will be broken. Both the fluid inlet
and outlet paths of the headers as well as the slots for connecting
the fluid inlet and outlet paths to the channels had high aspect
ratios (42 and 10).
Figure 25 below shows the rectangular bars that were used
to make the second-generation headers. The bars were cut from a
sheet of aluminum, and all the sides were first made flat and
parallel.

42
After the rectangular bars were prepared, the fluid inlet and
outlet paths were cut into the headers. The fluid paths are circular
holes 210mm long and 5.0 mm in diameter. The mill did not have
the required vertical travel length to accommodate both the header
and the drill bit. A right-angle transfer case had to be attached so
the holes could be cut using the longer travel of the X axis of the
mill. Figure 26 shows the headers after the holes had been cut.
After the holes were cut, the slot for connecting the channels
to the header and holding the channels in place was cut using a
2.50mm diameter end mill. Figure 27 shows the headers with the
connecting slot cut.
The final step in the header manufacturing was to cut the
slots for distributing the fluid into the channels. These slots were
cut inside the connecting slot and made using the same 2.50mm
diameter end mill. Figure 28 shows the headers after these slots
were cut.
Figure 25 through 28 illustrate the manufacturing process
for the second-generation cold plate headers.

43
Figure 25: Second-generation header
Figure 26: Second-generation header with fluid inlet and outlet holes

44
Figure 27: Second-generation header with connecting slot.
Figure 28: Second-generation header

45
Channel Joining
The extruded channels used in the second-generation cold
plate were only available in 27.5mm wide extrusions. As a result,
nine sections had to be joined together to create the cold plate.
Figure 29 below is a picture of one of these strips.
Figure 29: Second generation cold plate extruded aluminum channels
The rounded outside channels were removed and the edges were
squared off. Sections were then glued together on the flat,
squared-off edges using the same two-part epoxy that was used in
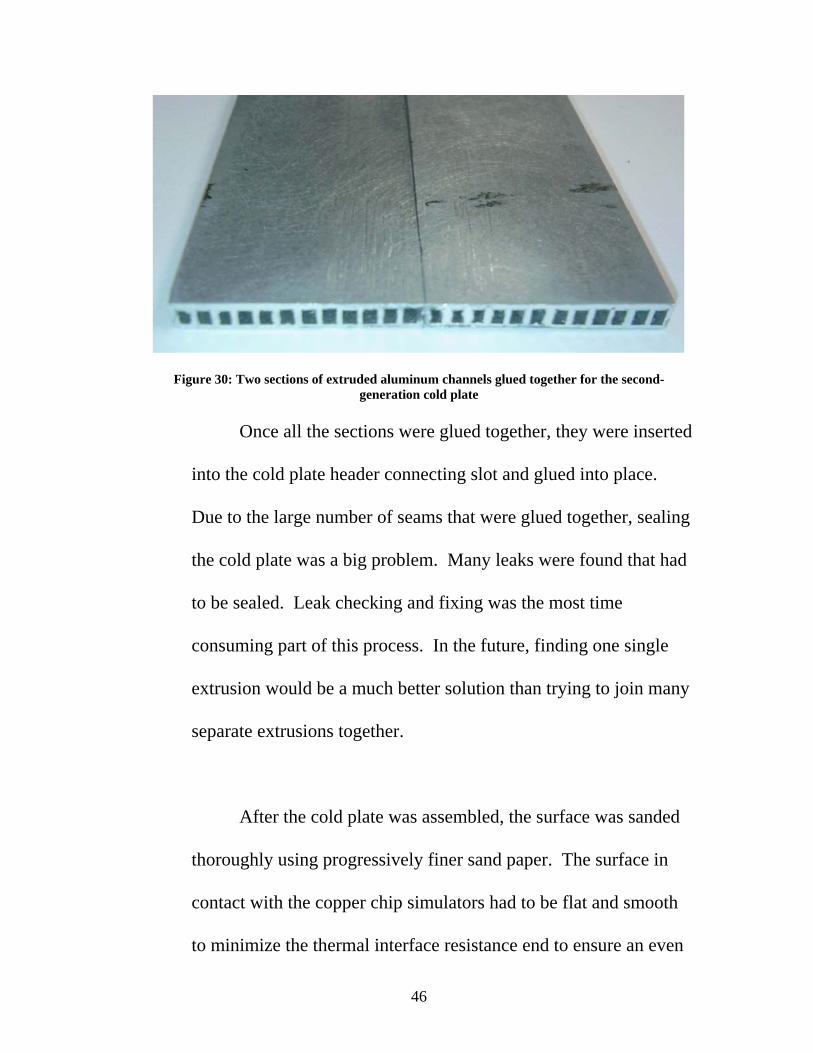
the first-generation cold plate. Figure 30 below shows two
sections of channels glued together.
46
Figure 30: Two sections of extruded aluminum channels glued together for the second-generation cold plate
Once all the sections were glued together, they were inserted
into the cold plate header connecting slot and glued into place.
Due to the large number of seams that were glued together, sealing
the cold plate was a big problem. Many leaks were found that had
to be sealed. Leak checking and fixing was the most time
consuming part of this process. In the future, finding one single
extrusion would be a much better solution than trying to join many
separate extrusions together.
After the cold plate was assembled, the surface was sanded
thoroughly using progressively finer sand paper. The surface in
contact with the copper chip simulators had to be flat and smooth
to minimize the thermal interface resistance end to ensure an even
47
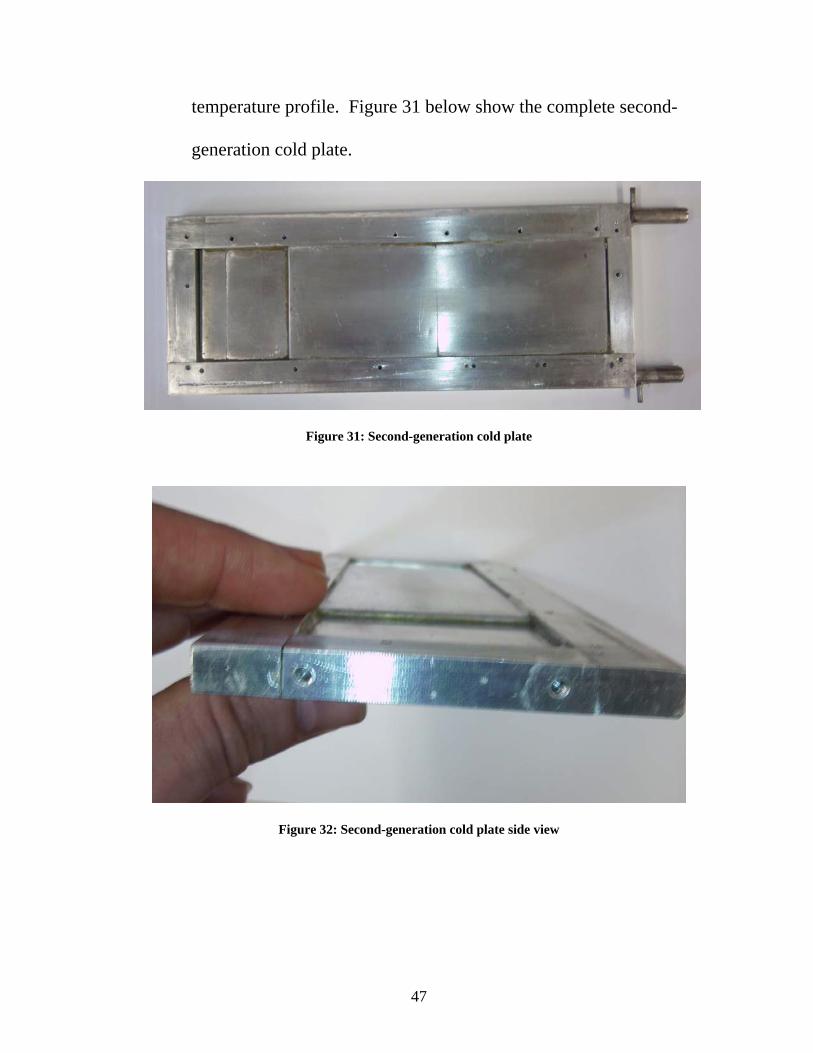
temperature profile. Figure 31 below show the complete second-
generation cold plate.
Figure 31: Second-generation cold plate
Figure 32: Second-generation cold plate side view

48
Figure 33: Second-generation cold plate channel offset to accommodate taller chip simulator
49
Chapter 6: Thermal Interface Resistance
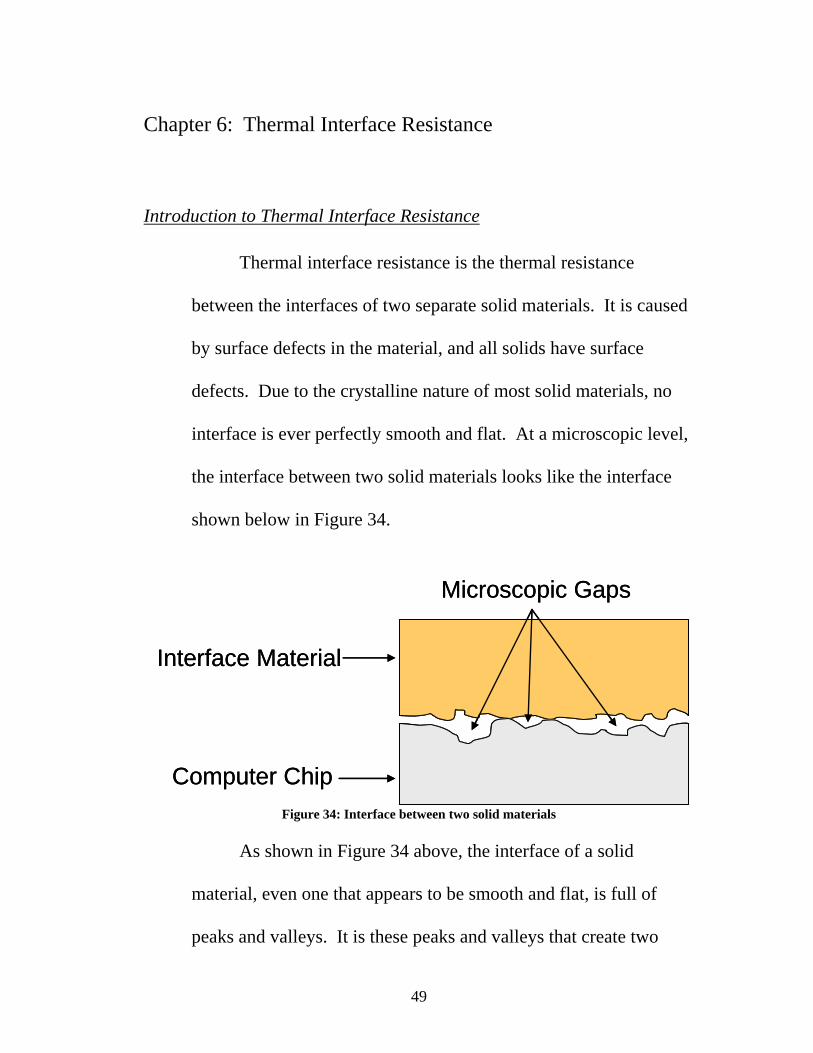
Introduction to Thermal Interface Resistance
Thermal interface resistance is the thermal resistance
between the interfaces of two separate solid materials. It is caused
by surface defects in the material, and all solids have surface
defects. Due to the crystalline nature of most solid materials, no
interface is ever perfectly smooth and flat. At a microscopic level,
the interface between two solid materials looks like the interface
shown below in Figure 34.
Microscopic Gaps
Interface Material
Computer Chip
Microscopic Gaps
Interface Material
Computer Chip
Figure 34: Interface between two solid materials
As shown in Figure 34 above, the interface of a solid
material, even one that appears to be smooth and flat, is full of
peaks and valleys. It is these peaks and valleys that create two
50
different coefficients of friction: kinetic and static. When two
solid materials are placed in contact with each other some of the
peaks and valleys contact each other. Heat is transferred across the
interface from one material to another by conduction, only through
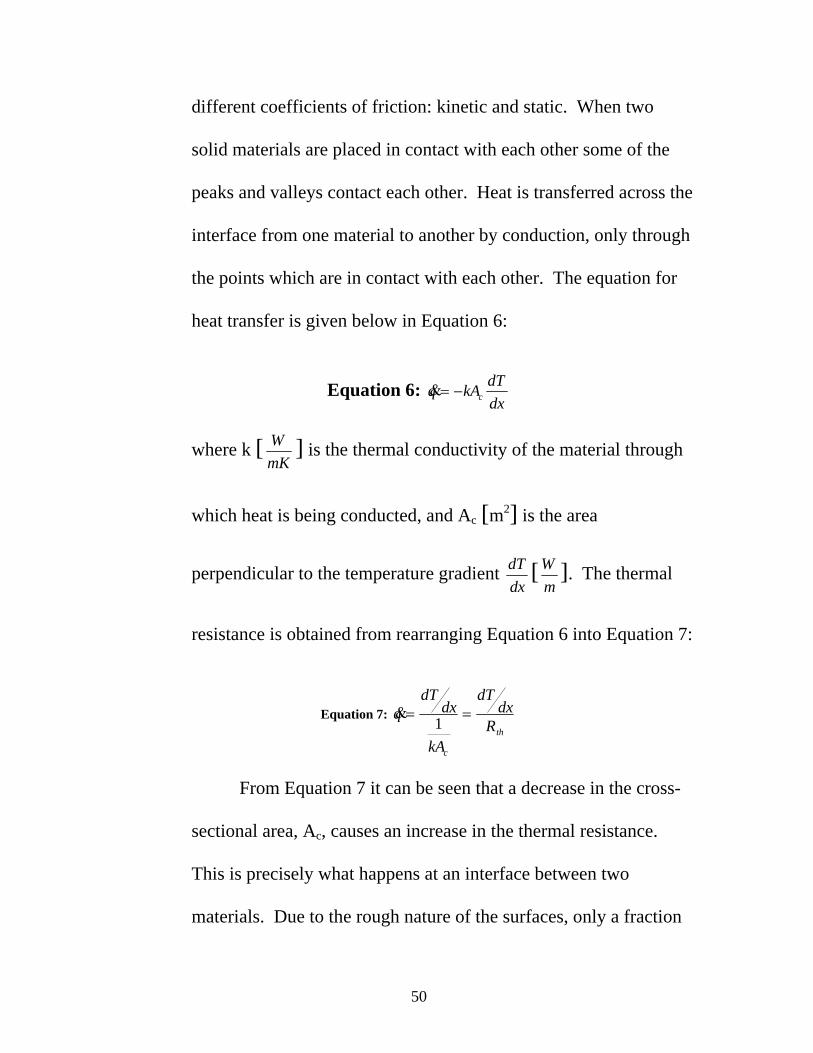
the points which are in contact with each other. The equation for
heat transfer is given below in Equation 6:
Equation 6: dxdTkAq c−=&
where k [mKW ] is the thermal conductivity of the material through
which heat is being conducted, and Ac [m2] is the area
perpendicular to the temperature gradient dxdT [
mW ]. The thermal
resistance is obtained from rearranging Equation 6 into Equation 7:
Equation 7: th
c
Rdx
dT
kA
dxdT
q == 1&
From Equation 7 it can be seen that a decrease in the cross-
sectional area, Ac, causes an increase in the thermal resistance.
This is precisely what happens at an interface between two
materials. Due to the rough nature of the surfaces, only a fraction
51
of the actual surface area of the materials is in contact, meaning Ac
decreases, Rth increases, and the total heat transfer, q&[W] decreases
for a given temperature gradient, dxdT .
Methods of Minimizing Thermal Interface Resistance
There are numerous methods for minimizing thermal
interface resistance, but they generally fall into two categories.
Mechanical Deformation
The first category for minimizing thermal interface
resistance involves mechanically deforming the interface itself.
This is done by applying a high pressure to the interface. This high
pressure causes the two interfaces to smooth out by forcing them to
deform each other. The result is a much higher contact area, Ac. A
higher contact area leads to a lower thermal interface resistance
and a higher rate of heat transfer for a given temperature gradient.
Deformable Materials
The second method for reducing thermal interface resistance
involves adding a deformable material to the interface. In a rough
52
interface like the one shown in Figure 34 above, heat transfer
occurs only where the two materials are in contact with each other.
The rest of the space is filled with air. These spaces are too
small for natural convection cells to occur, so the heat transfer
across these spaces is conduction through air. The thermal
conductivity of air is 0.03mKW , or 0.0075% of the thermal
conductivity of copper (400 mKW ). This means that for a given
cross-section and temperature gradient, less than 1% of the heat
will be transferred through the air via conduction.
A deformable material is added to the interface to displace
the air. With a deformable material added to the interface, heat
transfer across the gaps in the interface occurs by conduction
through the material. Any material that has a higher thermal
conductivity than air will increase the heat transfer across the
interface. There are several different types of deformable materials
used to achieve this purpose.
The first type of deformable material is a polymer pad.
These pads are made of solid elastic polymers. They generally
have adhesives on their surfaces and deform easily. They are good

53
for situations where the distance between the two interfaces is
large and the two interfaces cannot be pressed against each other.
The polymer pad serves to bridge the gap between the two
interfaces. Polymer pads usually have the lowest thermal
conductivity of any interface material (2mKW to 5
mKW ) [7].
The second type of deformable material is thermal grease.
Thermal grease transitions between a solid and a liquid at room
temperature. It behaves as a very viscous liquid. At the elevated
temperatures caused by microprocessor heat dissipation the grease
becomes a liquid. Silicone-based thermal greases have thermal
conductivities around 2-3mKW [8]. The thermal conductivity of
thermal grease can be increased by adding metal particles to the
grease. Thermal greases with metal particles can have thermal
conductivities as high as 8mKW . When metal particles are added
to thermal grease it is important that the metal particles be
extremely small. If the particles are on the same order of
magnitude or larger than the surface roughness features, they will
cause the interfaces to be further apart and increase the thermal
interface resistance. When particles are smaller than the surface

54
roughness features they are able to fill the gaps created by the
surface roughness. In this situation the interfaces will not be
pushed apart, and conduction will be enhanced across the gaps in
the interface. As a result, thermal interface resistance will
decrease. These situations are illustrated below in Figure 35 and
Figure 36.
Figure 35: Thermal grease with particles larger than the surface roughness features increases thermal interface resistance

55
Figure 36: Thermal grease with particles smaller than the surface roughness features decreases thermal interface resistance
Thermal greases are most effective when used in situations where
the interfacial separation distance is small and two interfaces are in
contact with one another. The grease works best when it is applied
to the two interfaces and then the two interfaces are squeezed
together. The excess grease will be pushed out by squeezing the
two interfaces together, leaving grease only in the places where
two interfaces would not have made contact. The biggest
disadvantage of this method is that the thermal cycling creates
thermal stress between the interfaces and these stresses will push

56
the thermal grease out of the interface, causing the thermal
interface resistance to increase.
The third type of deformable material is applied as a liquid
at elevated temperatures but remains a solid at room and operating
temperatures, like a solder. Soldering or brazing two interfaces
together is the most effective way of reducing thermal interface
resistance. The metal in the solder or braze compound acts
similarly to the thermal grease described previously; however, it
has a higher thermal conductivity 25mKW [9], resulting in a lower
thermal interface resistance.
Thermal Interface Resistance Experiments
Experiments were performed to determine the thermal
interface resistance of two different interface materials: a thermal
grease and a thermal pad. These experiments were done because
the stretch goal for the total thermal resistance of the cold plate is
0.075 oC-cm2/W. Any thermal interface material used with the
cold plate must result in a thermal interface resistance lower than
0.075 oC-cm2/W or it cannot be used to reach the stretch goal for
thermal resistance. Two materials were tested to determine if they

57
created a low enough thermal resistance to meet the stretch goal
for total thermal resistance for this experiment. The thermal grease
used in this experiment was Arctic Silver 5 [10]. Arctic Silver 5 is
a thermal grease containing small silver particles in it to increase
the overall thermal conductivity of the grease. It has thermal
conductivity of 8.89mKW . A picture of the thermal grease is shown
below in Figure 37.
Figure 37: Arctic Silver 5 [10]
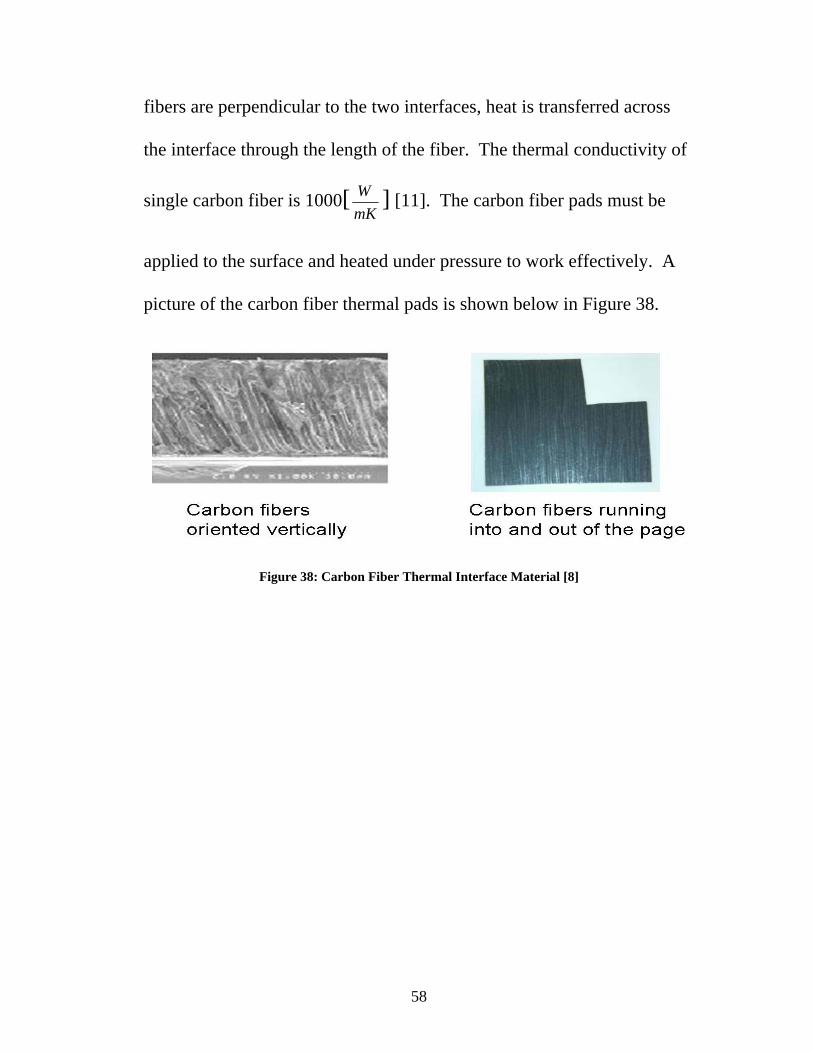
The thermal pad is a carbon fiber thermal pad. In this pad carbon
fibers are suspended in a polymer matrix. The matrix is used to line up
the fibers so they are perpendicular to the two interfaces. When the
58
fibers are perpendicular to the two interfaces, heat is transferred across
the interface through the length of the fiber. The thermal conductivity of
single carbon fiber is 1000[mKW ] [11]. The carbon fiber pads must be
applied to the surface and heated under pressure to work effectively. A
picture of the carbon fiber thermal pads is shown below in Figure 38.
Figure 38: Carbon Fiber Thermal Interface Material [8]
59
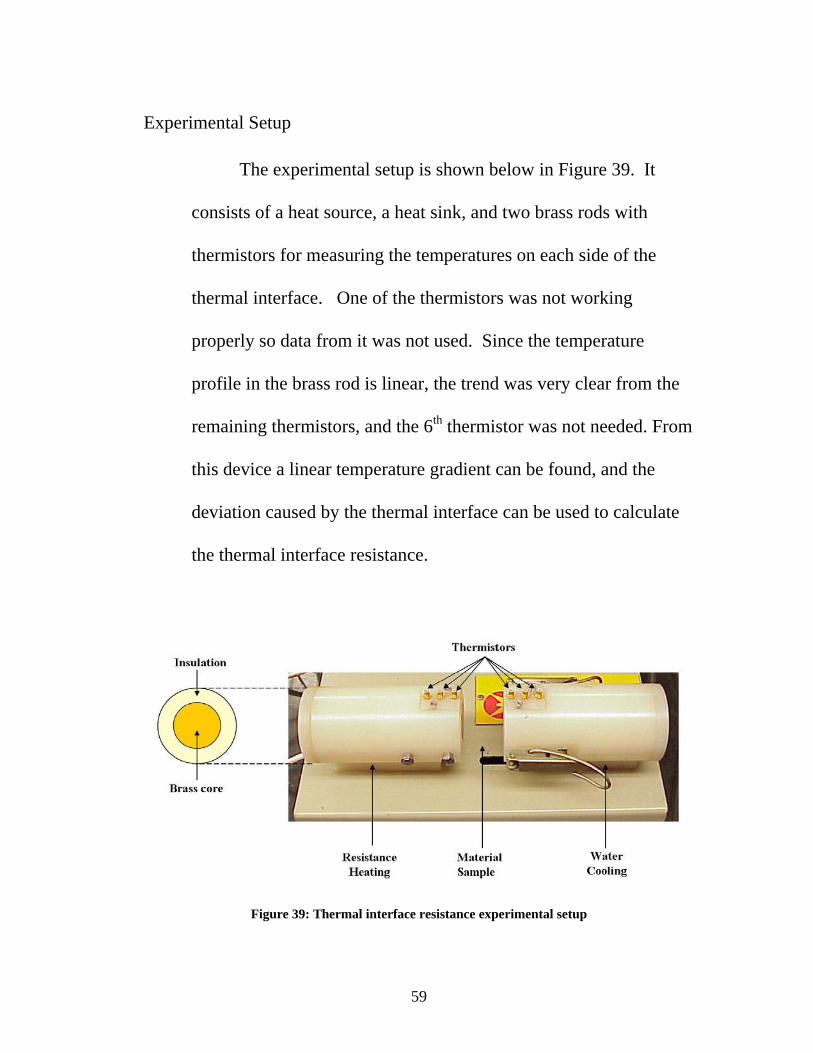
Experimental Setup
The experimental setup is shown below in Figure 39. It
consists of a heat source, a heat sink, and two brass rods with
thermistors for measuring the temperatures on each side of the
thermal interface. One of the thermistors was not working
properly so data from it was not used. Since the temperature
profile in the brass rod is linear, the trend was very clear from the
remaining thermistors, and the 6th thermistor was not needed. From
this device a linear temperature gradient can be found, and the
deviation caused by the thermal interface can be used to calculate
the thermal interface resistance.
Figure 39: Thermal interface resistance experimental setup

60

61
Experimental Procedure
The experimental procedure for the thermal grease and the
carbon fiber pad varies slightly because each material requires a
different preparation method before it is applied to the brass rod
interface.
In order to calculate the thermal interface resistance, the
interfacial separation distance must be known. To create a
constant and predictable interfacial separation distance with the
thermal grease, small pieces of 0.2mm diameter copper wire were
cut and laid flat between the two rods. The number of pieces and
their size was kept very small so that the effect of conduction
through the wire pieces could be neglected. Thermal grease was
applied to the interface, and the wires were then carefully placed
and evenly distributed to create the gap. The two brass rods were
squeezed together using the clamps supplied by the device. Power
was supplied to the heat source with a constant input of 9.5W.
Cold water was supplied to the heat sink from a chiller at a
temperature of 10oC.
To test the carbon fiber thermal pads, the two brass surfaces
were first cleaned with alcohol. A 0.1778mm thick carbon fiber

62
pad was placed between the two brass rods. The brass rods were
stacked on top of each other, but the clamp was not attached.
Weights were stacked on top of the brass rod to apply pressure to
the carbon fiber thermal pads. A pressure of 20psi was applied to
the carbon fiber thermal pads while the interface was maintained at
a temperature of 60oC for 20 minutes, as described in the
instructions that came with the thermal pads.
Results
Arctic Silver 5
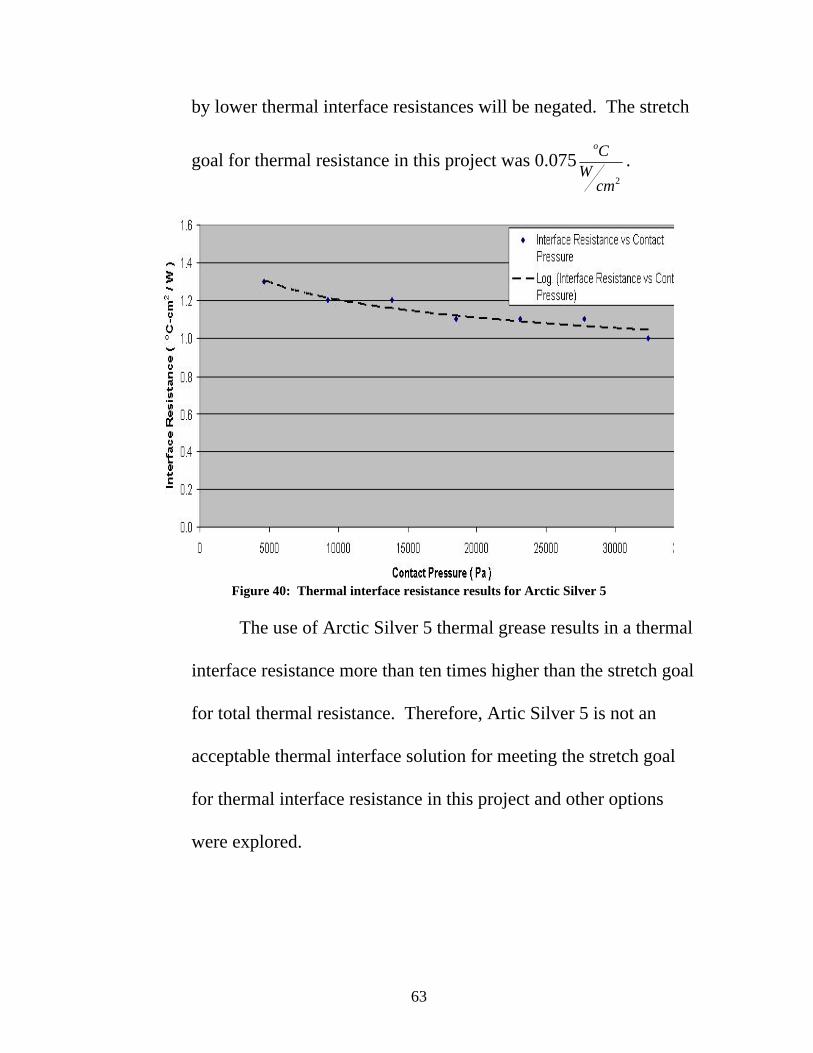
The results for the Arctic Silver 5 thermal grease
experiments are shown below in Figure 40. Figure 40 shows that
the interface resistance decreases as the contact pressure increases,
but the decrease in thermal interface resistance lessens as the
contact pressure is increased. It means that increasing the contact
pressure between two thermal interfaces is a viable means of
decreasing the thermal interface resistance, but only to a certain
point. Eventually the reliability of other components will begin to
decrease as a result of the increased pressure, and any gains made
63
by lower thermal interface resistances will be negated. The stretch
goal for thermal resistance in this project was 0.0752cm
WCo
.
Figure 40: Thermal interface resistance results for Arctic Silver 5
The use of Arctic Silver 5 thermal grease results in a thermal
interface resistance more than ten times higher than the stretch goal
for total thermal resistance. Therefore, Artic Silver 5 is not an
acceptable thermal interface solution for meeting the stretch goal
for thermal interface resistance in this project and other options
were explored.
64
Carbon Fiber pads
Carbon fiber thermal pads were tested with the same
experimental setup. A carbon fiber thermal pad 0.1778mm thick
was used in the experiment. The carbon fiber thermal pads had
considerably better performance than the thermal grease. No
detectable temperature difference could be found across the
thermal interface for all contact pressures. The maximum power
was applied to the heater, and water was supplied to the heat sink
at 5oC. When significant figures are ignored, the carbon fiber
thermal pads have an estimated thermal resistance of
0.00982cm
WCo
, or less than a tenth of the stretch goal requirements.
Better data for this experiment is not available due to equipment
limitations.
Thermal Interface Conclusions
Numerical simulations were also performed by a colleague
which did not take the thermal resistance into account [12]. When
experiments with the cold plate were run with the Arctic Silver
thermal grease, the difference between the simulated thermal
resistance and the actual thermal resistance in the cold plate

65
experiment matched the values found in the thermal interface
resistance experiments.
Finding the correct thermal interface material is essential to
meeting total package thermal resistance goals. Interface thermal
resistance can account for a significant portion of the total thermal
interface resistance with current micro channel cold plates.
66
Chapter 7: Results and Discussions
This chapter will discuss the experimental procedure and
results for the two cold plates.
First-Generation Cold Plate Results
First-Generation Heat Transfer
Below is a graph showing the first-generation cold plate
thermal resistance as a function of the flow rate through the cold
plate. The thermal resistance, Rth is defined below in Equation 8.
Equation 8: qTT
R inwaterchipth ′′
−=
&,

67
where Tchip is the temperature of the copper chip simulator
measured by the thermocouple, Twater, in is the temperature of the
water coming from the chiller, and q ′′&is the heat flux.
Figure 41: First-generation cold plate thermal resistance
The graph above shows that the first-generation cold plate
meets the standard goals for thermal resistance while adhering to
the pressure drop restriction. The most important feature of the
graph is the uneven distribution of the thermal resistances of each
of the copper chip simulators. Figure 42 below shows the test
section with chips 1-4 marked so that meaning can be given to the
data presented above.
68
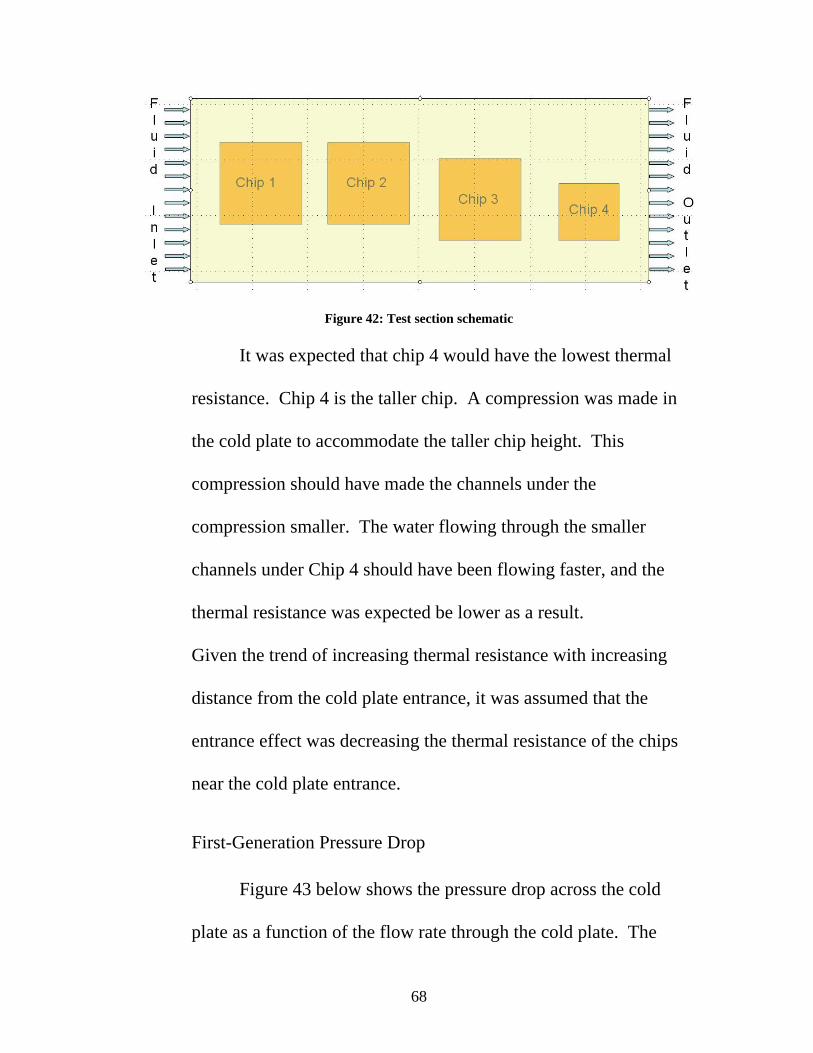
Figure 42: Test section schematic
It was expected that chip 4 would have the lowest thermal
resistance. Chip 4 is the taller chip. A compression was made in
the cold plate to accommodate the taller chip height. This
compression should have made the channels under the
compression smaller. The water flowing through the smaller
channels under Chip 4 should have been flowing faster, and the
thermal resistance was expected be lower as a result.
Given the trend of increasing thermal resistance with increasing
distance from the cold plate entrance, it was assumed that the
entrance effect was decreasing the thermal resistance of the chips
near the cold plate entrance.
First-Generation Pressure Drop
Figure 43 below shows the pressure drop across the cold
plate as a function of the flow rate through the cold plate. The

69
maximum pressure drop allowed by the standard goal is shown
along with the corresponding flow rate. The thermal resistance
goal was satisfied while also satisfying the pressure drop standard
goal.
Figure 43: First-generation cold plate pressure drop
Second-Generation Cold Plate
The design features for the second-generation cold plate are
shown below. The second-generation cold plate used long headers
and short channels in an attempt to reduce the pressure drop.
Figure 44 below is an illustration showing the second-generation
cold plate design details.
70
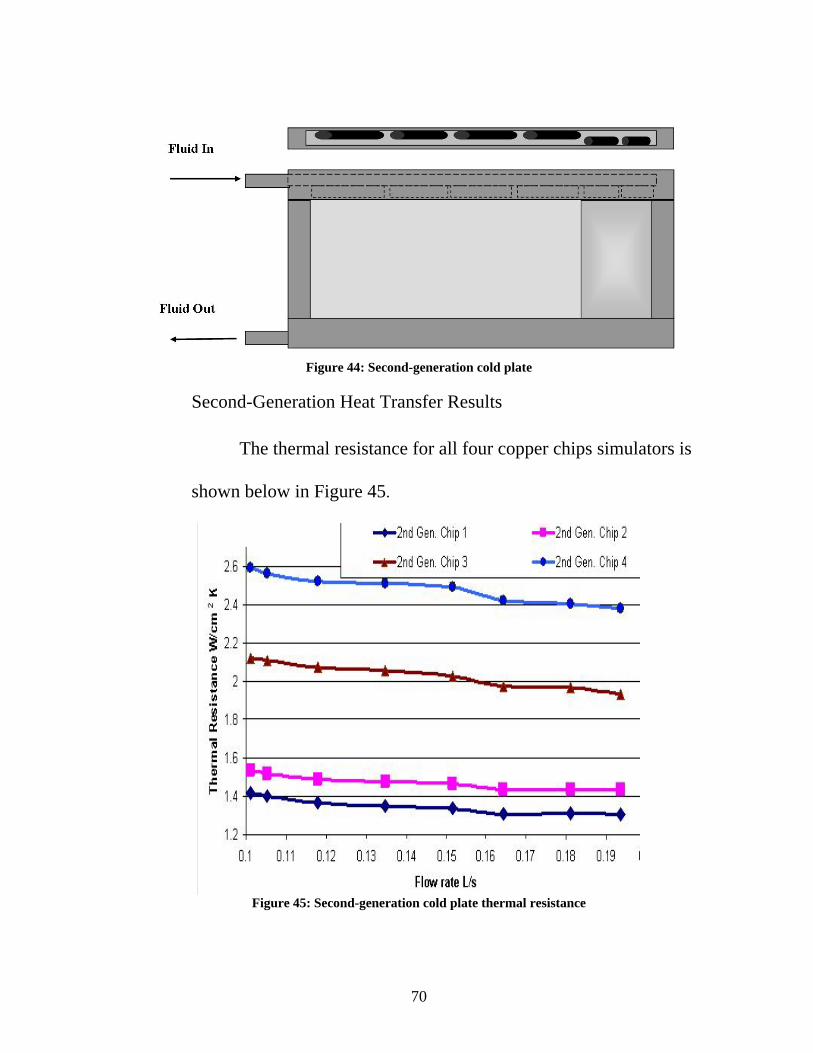
Figure 44: Second-generation cold plate
Second-Generation Heat Transfer Results
The thermal resistance for all four copper chips simulators is
shown below in Figure 45.
Figure 45: Second-generation cold plate thermal resistance
71
When compared to the first-generation results several differences
present themselves. The first difference is that the thermal
resistance non-uniformity has become greater. Some thermal
resistances have increased (Chip 1 and Chip 3), some have
decreased (Chip 2), and the thermal resistance for Chip 4 has not
changed. An explanation of these results will be discussed in the
next chapter of this thesis.
Second-Generation Pressure Drop
The pressure drop across the cold plate was measured. It is shown
below in Figure 46. The pressure drop from the first-generation
cold plate is shown for comparison.

72
Figure 46: Second-generation cold plate pressure drop
Figure 46 shows that the pressure drop for the second-generation
cold plate is greater than the pressure drop for the first-generation
cold plate as a result of the second generation cold plate having
smaller channels than the first generation cold plate.
Comparison of the Results
Differences in Heat Transfer
There are two important differences in heat transfer between
the first- and second-generation cold plates. The first difference is

73
that the two cold plates cooled different chips differently.
Switching from one generation of cold plate to another caused the
thermal resistances of some chips to increase while causing the
thermal resistances of other chips to decrease. The second
important difference is that while the range of thermal resistances
was about the same for the two cold plates, the range of the
second-generation cold plate had higher average temperatures than
the first generation cold plate. Overall, the second-generation cold
plate was less effective at cooling the entire test section. The
second generation cold plate caused higher chip surface
temperatures due to a combination of flow mal-distribution, which
reduced the convection heat transfer effectiveness, and increased
thermal interface resistance as a result of the differences in
manufacturing.
Figure 47, Figure 48, Figure 49, and Figure 50 are
comparisons of the thermal resistances for each chip. From these
figures the trend is clear that at a given flow rate the first
generation cold plate is a better heat exchanger than the second
generation cold plate. The only deviation from this trend appears
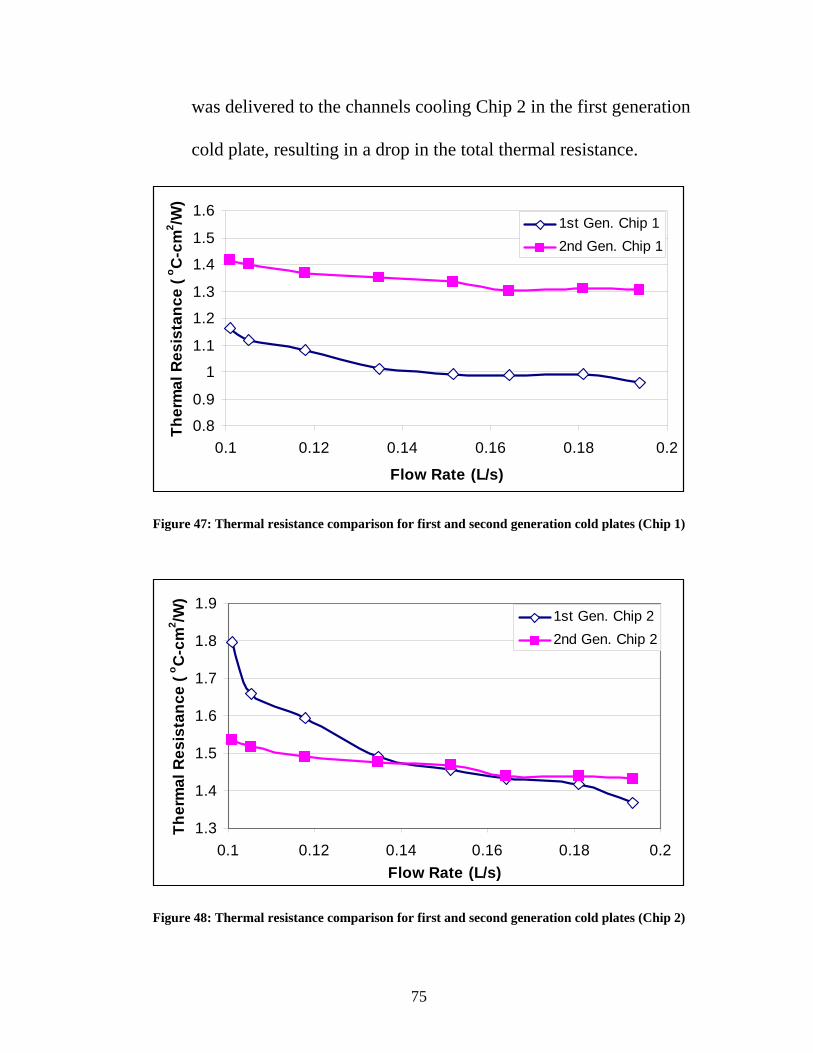
in the results from Chip 2. The results for Chip 2 show that the
74
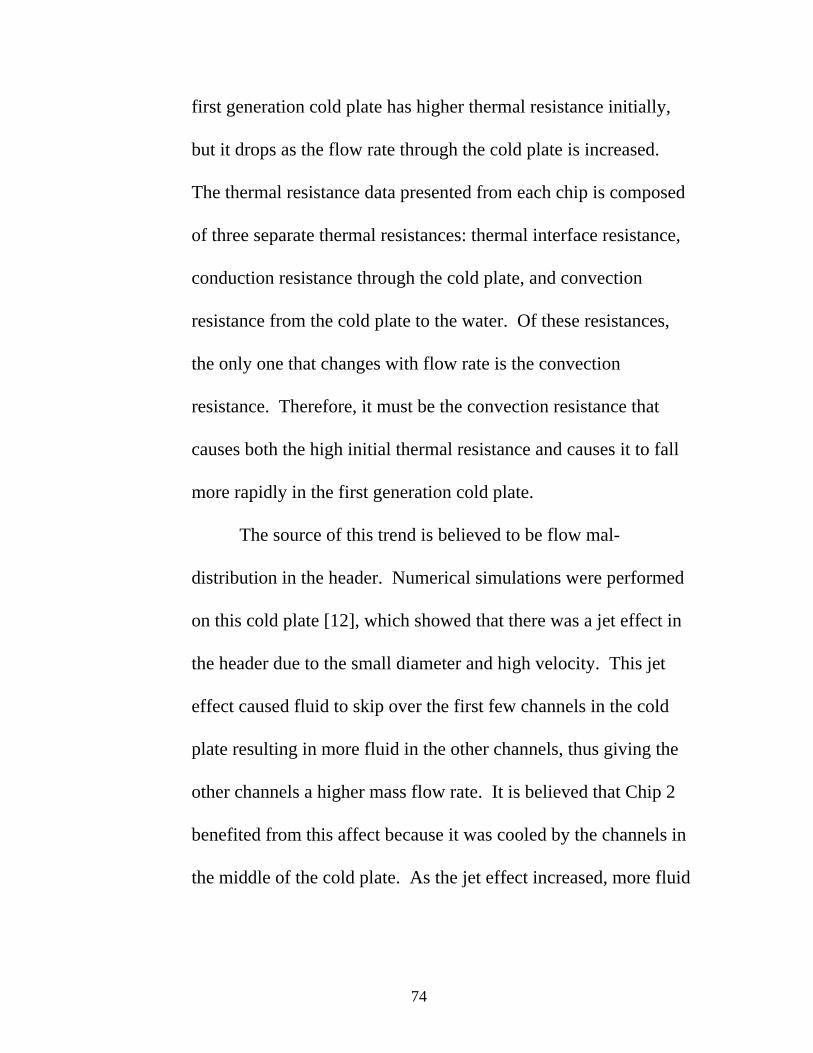
first generation cold plate has higher thermal resistance initially,
but it drops as the flow rate through the cold plate is increased.
The thermal resistance data presented from each chip is composed
of three separate thermal resistances: thermal interface resistance,
conduction resistance through the cold plate, and convection
resistance from the cold plate to the water. Of these resistances,
the only one that changes with flow rate is the convection
resistance. Therefore, it must be the convection resistance that
causes both the high initial thermal resistance and causes it to fall
more rapidly in the first generation cold plate.
The source of this trend is believed to be flow mal-
distribution in the header. Numerical simulations were performed
on this cold plate [12], which showed that there was a jet effect in
the header due to the small diameter and high velocity. This jet
effect caused fluid to skip over the first few channels in the cold
plate resulting in more fluid in the other channels, thus giving the
other channels a higher mass flow rate. It is believed that Chip 2
benefited from this affect because it was cooled by the channels in
the middle of the cold plate. As the jet effect increased, more fluid
75
was delivered to the channels cooling Chip 2 in the first generation
cold plate, resulting in a drop in the total thermal resistance.
0.8
0.9
1
1.1
1.2
1.3
1.4
1.5
1.6
0.1 0.12 0.14 0.16 0.18 0.2
Flow Rate (L/s)
Ther
mal
Res
ista
nce
(o C-c
m2 /W
)
1st Gen. Chip 12nd Gen. Chip 1
Figure 47: Thermal resistance comparison for first and second generation cold plates (Chip 1)
1.3
1.4
1.5
1.6
1.7
1.8
1.9
0.1 0.12 0.14 0.16 0.18 0.2Flow Rate (L/s)
Ther
mal
Res
ista
nce
(o C-c
m2 /W
)
1st Gen. Chip 22nd Gen. Chip 2
Figure 48: Thermal resistance comparison for first and second generation cold plates (Chip 2)

76
1.31.41.5
1.61.71.81.9
22.12.2
0.1 0.12 0.14 0.16 0.18 0.2Flow Rate (L/s)
Ther
mal
Res
ista
nce
(o C-c
m2 /W
)
1st Gen. Chip 32nd Gen. Chip 3
Figure 49: Thermal resistance comparison for first and second generation cold plates (Chip 3)
1.81.9
22.12.22.32.42.52.62.7
0.1 0.12 0.14 0.16 0.18 0.2Flow Rate (L/s)
Ther
mal
Res
ista
nce
(o C-c
m2 /W
)
1st Gen. Chip 42nd Gen. Chip 4
Figure 50: Thermal resistance comparison for first and second generation cold plates (Chip 4)

77
Comparison of Pressure Drops
Figure 46 shows that the pressure drop in the second-
generation cold plate is significantly higher than the pressure drop
in the first-generation cold plate. This is predominantly because
the second-generation cold plate has longer headers, and smaller
but shorter channels.

78
Chapter 8: Conclusions and Suggested Future Work
This chapter will discuss the conclusions drawn from the results of
the previous chapter as well as offer suggestions for possible future
research work in this area.
Explanation of the differences in the performance
Most of the differences in performance can be attributed to
the flow distribution within the headers and the cold plate.
Pressure drop performance
The difference in pressure drop between the two cold plates
has to do with both the header design and the channels. The
header of the second generation is an elongated version of the first-
generation cold plate header. The fluid inlet and outlet paths are
the same diameter; however, the paths in the second-generation
header are longer. The second-generation cold plate was designed
so that most of the pressure drop would take place in the channels.

79
It was thought that this would reduce the flow mal-distribution.
Due to the high flow rate and the design of the fluid distribution
slots, the flow through the channels was not even, and a large
amount of the pressure drop is believed to have occurred due to the
high velocity in the fluid inlet and outlet paths. This increased the
flow mal-distribution in the cold plate. Making the fluid inlet and
outlet holes larger would have helped, but the thickness limitation
prevented that. Changing the size and length of the connecting
channels which distributed the fluid from the inlet channel to the
outlet channel would have decreased the mal-distribution as well.
Heat transfer performance
The heat transfer differences are also believed to be strongly
dependent on the flow distribution in the header and the channels.
The entrance effect alone could not explain the difference in
thermal resistance for the first-generation cold plate. This was
further proven by the second-generation cold plate. If the entrance
effect were the cause of the improved heat transfer, all the chips in
the second-generation cold plate would have benefited from it.
Uneven flow rate in the channels would account for the uneven

80
cooling performance. Channels receiving little or no flow would
not cool the chip as effectively. The average temperature for each
chip was not very far from the individual thermocouple readings.
This suggests that it is a flow problem and that many channels are
affected by it, not just one or two scattered channels.
If liquid cooling is to be used, circuit boards must be
designed to accommodate the cold plate. Extra room must be
made around hot components to accommodate the cold plate and
allow it to fit well to the hot components. This will reduce thermal
interface resistance. Circuit board components that do not need to
be cooled should be placed and designed so that they do not
interfere with the cold plate. Finally, hot components must be
placed on the board in a way that will simplify the flow
distribution and cold plate design.
In order to achieve these goals, thermal management must
be taken into account early in the design process, not after the
circuit board has been made. Room must be made for the cold
plate to fit the electronics, and components that do not need to be
cooled should not interfere with the cold plate. The biggest gain in
heat transfer performance that can be made by considering the

81
thermal management solution in the design process lies in the
reduction of thermal interface resistance. Designs must allow for
precise mating of the cold plate to the chip to minimize thermal
resistance. . Making the semiconductors flat, parallel, and not
surrounded by obstructions will greatly aid in reducing thermal
interface resistance. Since thermal interface resistance is a
function of the contact pressure, designing circuit boards to
withstand a higher contact pressure would further reduce the
thermal interface resistance.
Heat exchangers should also be designed to minimize
thermal interface resistance. Heat exchangers should be smooth,
flat, and rigid. This will reduce the thermal interface resistance in
two ways. Making the surface as smooth as possible will reduce
the interface resistance. If the heat exchanger is flat and rigid
higher contact pressures can be used which will further reduce
thermal interface resistance. A lot of work has been done on these
issues with air-cooled heat exchangers and many of the techniques
used to reduce the thermal interface resistance of air-cooled heat
exchangers can be used reduce the thermal interface resistance of
liquid cooled heat exchangers. Finally, because flow distribution

82
is a problem, designing the circuit board layout with liquid cooling
in mind will make it easier to get an even and uniform flow
distribution. Component placement should be decided both by
electric signal concerns and thermal management concerns.
Proposed Future work
Explore differences in Heat Transfer and Pressure Drop
Most of the future work in this field lies in exploring the
cause behind the difference in heat transfer and pressure drop
between the two generations, namely quantifying the effect of any
flow mal-distribution. The flow distribution must be better
understood and controlled to maximize the heat transfer and reduce
the pressure drop. In this project, work could be done looking at
the effects of enlarging the fluid inlet and outlet paths as well as
examining the effect of changing the cold plate from a u-type flow
cold plate to a z-type flow cold plate.

83
Bibliography [1] Figure 1 (a&b): http://www.salvagetech.com/images/heat_sinks/heat_sink_thermalloy.jpg http://www.3cvillage.com/cayman/images/heatsink-cm-sock-a-a.jpg [2] Pentium 4 Heat Dissipation: http://www.hardwareanalysis.com/content/reviews/article/1499.3/ [3] Incropera, and DeWitt, 2007, “Fundamentals of Heat and Mass
Transfer”, 6th Edition [4] Fan Information http://www.heatsinkfactory.com/Aerocool-Xtreme-Turbine-1000-Silver-120mm-LED-Fan-p-16485.html [5] Wound coil cold plate: http://www.lytron.com/img/cp_custom14.jpg [6] Flat tube cold plate http://www.lytron.com/standard/cp_extended.htm [7] Thermal Interface Pad Information http://solutions.3m.com/wps/portal/!ut/p/kcxml/04_Sj9SPykssy0xPLMnMz0vM0Q9KzYsPDdaP0I8yizeIN_QI0S_IcFQEABHW1xY! [8] Thermal grease information http://www.heatsink-guide.com/content.php?content=compound.shtml [9]Solder Thermal Conductivity http://www.engineersedge.com/properties_of_metals.htm [10] Arctic Silver Properties http://www.arcticsilver.com/ [11] Carbon Fiber Thermal Interface Pad Supplier http://www.btechcorp.com/

84
[12] Cetegen, Edvin; personal communication; 08/2006 [13] Bar-Cohen, A, Mehmet Arik, Michael Ohadi, Direct Liquid Cooling
of High Flux Micro and Nano Electronic Components, IEEE
Proceedings, August 2006, Volume 94, No. 8, pp 1549-1570.
[14] Agostini, Bruno, Matteo Fabbri, et al., State of the Art of High Heat
Flux Cooling Technologies, Heat Transfer Engineering, Volume 29,
No. 4, pp 259-291.
[15] Dogan, A., M. Sivrioglu, S. Baskaya, Experimental investigation of
mixed convection heat transfer in a rectangular channel with discrete
heat sources at the top and at the bottom, International
Communications in Heat and Mass Transfer, Volume 32 (2005), pp
1244-1252.
[16] Koh, J.H, Hai-Kyung Seo, Choong Gon Lee, Young-Sung Yoo, Hee
Chun Lim, Pressure and flow distribution in internal gas manifolds
of a fuel cell stack, Journal of Power Sources, Volume 115(2003),
pp54-65.
[17] Kim, S., Eunsoo Choi, Young Cho, The effect of header shapes on
the flow distribution in a manifold for electronic packaging
applications, International Communications in Heat and Mass

85
Transfer, Volume 22, No. 3, pp 329-341
[18] Dumont, G., Ph. Fontaine Vive Roux, B. Righini, Water cooled
electronics, Nuclear Instruments and Methods in Physics Research,
Volume A 440 (2000), pp 213-223

86

87